Embed Size (px)
Citation preview
DOI: http://dx.doi.org/10.18180/tecciencia.2017.22.4
*Corresponding Author.
E-mail: [email protected]
How to cite: Muñoz, Y., Vargas, O., Pinilla, G., Vásquez, J., Sizing
and study of the energy production of a grid-tied photovoltaic system
using PVsyst software, TECCIENCIA, Vol. 12 No. 22, 27-32, 2017
DOI: http://dx.doi.org/10.18180/tecciencia.2017.22.4
Sizing and Study of the Energy Production of a Grid-Tied Photovoltaic
System Using PVsyst Software
Dimensionado y Estudio de la Producción Energética de un Sistema Fotovoltaico Grid-Tied
Utilizando Software PVsyst
Yecid Muñoz1*, Orlando Vargas1, Gustavo Pinilla1, Jairo Vásquez1
1Universidad Antonio Nariño, Bucaramanga, Colombia
Received: 1 Dec 2015 Accepted: 30 Sep 2016 Available Online: 7 Dec 2016
Abstract
This paper describes analyses carried out on the sizing and simulation of a grid-tied photovoltaic system in Bucaramanga,
Colombia with the virtual tool PVsyst. The simulation was primarily performed in order to understand the behavior of grid-
tied photovoltaic installations at a specific location, while avoiding the oversizing or undersizing of the systems, thus
projecting installations which better approximate real conditions. Theoretical calculations were performed conventionally in
order to make comparisons of calculated data with simulation results. We highlight the good potential of the studied area,
with 1882 kWh/m2 at optimal orientation, which would generate 1375 kWh/year for a 1 kW PV system, with a yield factor of
72.7%. Losses are disaggregated in this paper, including a study of the behavior associated with the tilt and orientation of the
system. Such information on potential and performance is a valuable reference for any possible sizing of photovoltaic projects
at similar latitudes
Keywords: Performance Ratio, PVsyst, Photovoltaic Production, System Performance, System Losses.
Resumen
Este artículo describe los análisis efectuados mediante el dimensionamiento y simulación de un sistema fotovoltaico conectado
a red ubicado en Bucaramanga Colombia., a través de la herramienta virtual PVsyst. La simulación se realiza
fundamentalmente para conocer el comportamiento de las instalaciones fotovoltaicas conectadas a red, en una ubicación
específica, evitando sobredimensionar o subdimensionar los sistemas, proyectando así instalaciones con una gran
aproximación a condiciones reales. Se realizaron cálculos teóricos de forma convencional con el objeto de efectuar
comparaciones de datos calculados con resultados de la simulación. Dentro de los resultados obtenidos se destaca el buen
potencial de la zona estudiada, con 1882 hWh/m2 en orientación óptima, que para una instalación fotovoltaica de 1 kW,
generaría unos 1375 kWh/año, con un factor de rendimiento del 72,7%, cuyas pérdidas son desagregadas en el desarrollo del
documento, incluyendo, un estudio del comportamiento asociado a la inclinación y orientación del sistema. Este tipo de
información, sobre potencial y desempeño, es una valiosa referencia, para el dimensionado de proyectos fotovoltaicos que se
deseen realizar en latitudes cercanas a la del presente estudio.
Palabras clave: Performance Ratio, PVsyst, Producción Fotovoltaica, Rendimiento del Sistema, Pérdidas.
28
1. Introduction
Photovoltaic solar energy is the direct conversion of solar
radiation into electricity through photovoltaic cells. These
are manufactured with crystalline semiconductor materials
which, due to the photovoltaic effect, generate electric
current when exposed to solar radiation. Photovoltaic panels
are composed of a grouping of cells [1]. This type of energy,
like other renewable energies, is inexhaustible, clean,
respects the environment, and establishes a basis for self-
supply.
The study and optimization of the performance of this
renewable source has the great potential to reduce
greenhouse gases emissions, especially CO2, thus helping to
fulfill the commitments assumed in the Kyoto Protocol,
which aims to reduce greenhouse gas emissions and protect
the planet from climate change.
The electric current generated from solar photovoltaic
energy currently has a variety of applications, primarily in
isolated systems [2] and systems connected to the grid,
called grid-tied systems [3]. The focus of this study is grid-
tied systems for a nominal 1 kW installation.
The PVsyst software application allows for the design,
simulation, and data analysis of a photovoltaic system. It
includes meteorological data from the most-used
international databases, such as NASA, SSE RETScreen,
and Meteonorm. This is essential for the calculation of an
installation at our location, because in many cases the
PVsyst program will not have data about the location where
the photovoltaic generator is to be installed.
2. Grid-Tied PV System Sizing
Generally speaking, a photovoltaic system connected to a
SFCR network can capture solar energy, convert it into
electricity, and transform it into alternating current with the
same characteristics as the AC grid [4]. To do this, optimum
sizing is necessary for its elements to achieve synergy in
their operation. Thus, the elements have to adapt to
objectives of power, space, the climatic conditions of the
area, and the objectives of produced energy (to either be
completely consumed or delivered to the grid). In this
context, a generator, consisting of a set of photovoltaic
panels, is used, in addition to a grid inverter, which converts
the DC power from the PV array to AC power to be
transformed to allow correct grid coupling, as shown in
Figure 1 [5].
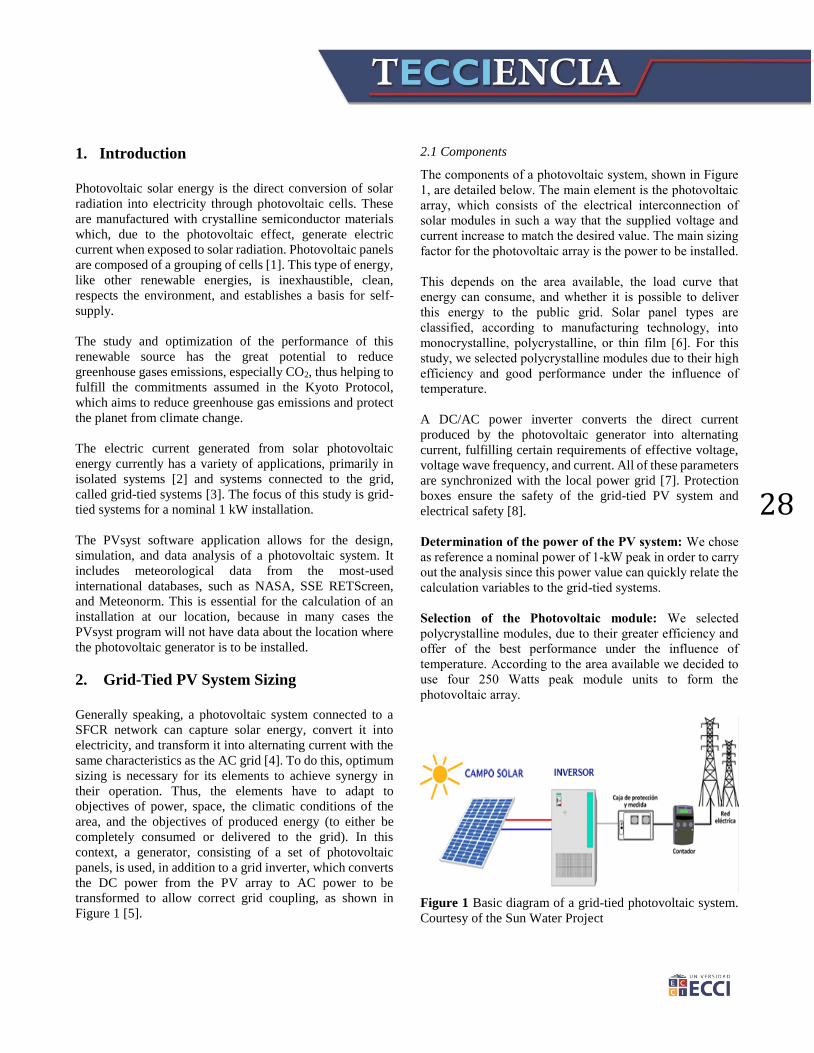
2.1 Components
The components of a photovoltaic system, shown in Figure
1, are detailed below. The main element is the photovoltaic
array, which consists of the electrical interconnection of
solar modules in such a way that the supplied voltage and
current increase to match the desired value. The main sizing
factor for the photovoltaic array is the power to be installed.
This depends on the area available, the load curve that
energy can consume, and whether it is possible to deliver
this energy to the public grid. Solar panel types are
classified, according to manufacturing technology, into
monocrystalline, polycrystalline, or thin film [6]. For this
study, we selected polycrystalline modules due to their high
efficiency and good performance under the influence of
temperature.
A DC/AC power inverter converts the direct current
produced by the photovoltaic generator into alternating
current, fulfilling certain requirements of effective voltage,
voltage wave frequency, and current. All of these parameters
are synchronized with the local power grid [7]. Protection
boxes ensure the safety of the grid-tied PV system and
electrical safety [8].
Determination of the power of the PV system: We chose
as reference a nominal power of 1-kW peak in order to carry
out the analysis since this power value can quickly relate the
calculation variables to the grid-tied systems.
Selection of the Photovoltaic module: We selected
polycrystalline modules, due to their greater efficiency and
offer of the best performance under the influence of
temperature. According to the area available we decided to
use four 250 Watts peak module units to form the
photovoltaic array.
Figure 1 Basic diagram of a grid-tied photovoltaic system.
Courtesy of the Sun Water Project
29
Inverter selection: According to the electrical
characteristics determined by the photovoltaic array, there
are requirements for an inverter of 1-kW nominal power,
69.8V, 14.36A in DC and 120V in AC, 60Hz single phase,
and a network connection.
Installation location: The geographical location for the site
of the grid-tied solar photovoltaic installation is in the
metropolitan area of Bucaramanga, Colombia, whose
geographical coordinates are:
Latitude: 7.035258 Longitude: -73.109584 Altitude: 907
amsl.
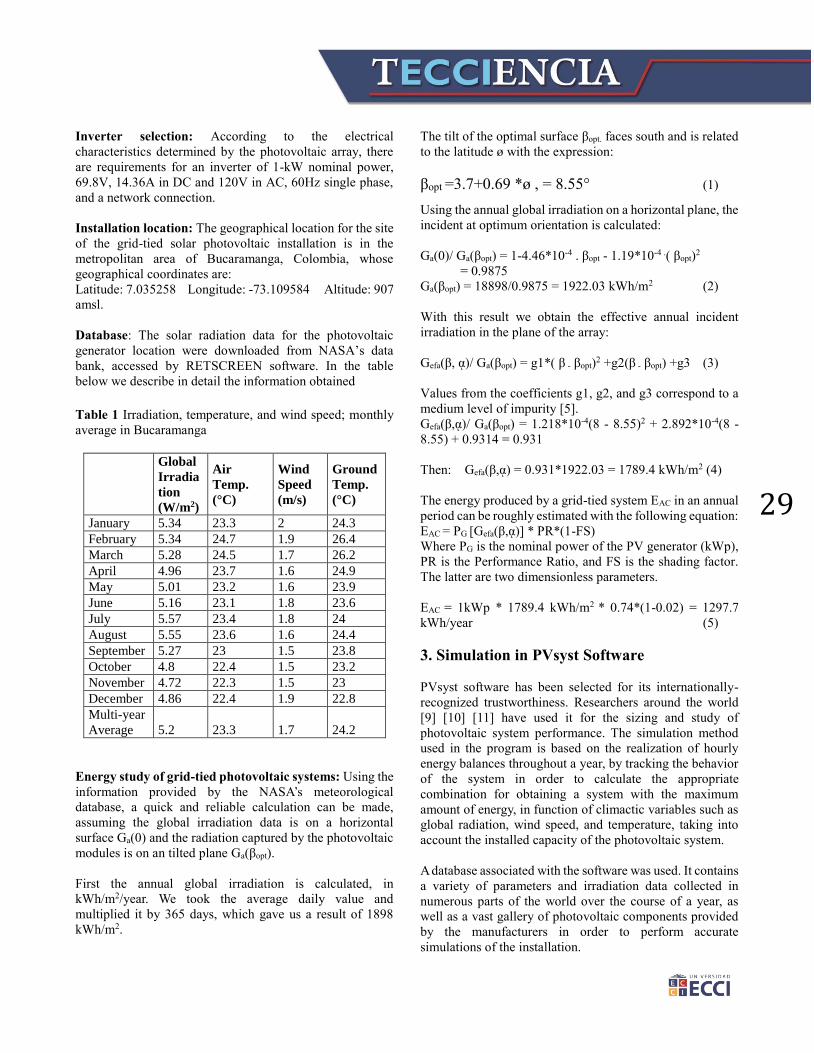
Database: The solar radiation data for the photovoltaic
generator location were downloaded from NASA’s data
bank, accessed by RETSCREEN software. In the table
below we describe in detail the information obtained
Table 1 Irradiation, temperature, and wind speed; monthly
average in Bucaramanga
Global
Irradia
tion
(W/m2)
Air
Temp.
(°C)
Wind
Speed
(m/s)
Ground
Temp.
(°C)
January 5.34 23.3 2 24.3
February 5.34 24.7 1.9 26.4
March 5.28 24.5 1.7 26.2
April 4.96 23.7 1.6 24.9
May 5.01 23.2 1.6 23.9
June 5.16 23.1 1.8 23.6
July 5.57 23.4 1.8 24
August 5.55 23.6 1.6 24.4
September 5.27 23 1.5 23.8
October 4.8 22.4 1.5 23.2
November 4.72 22.3 1.5 23
December 4.86 22.4 1.9 22.8
Multi-year
Average 5.2 23.3 1.7 24.2
Energy study of grid-tied photovoltaic systems: Using the
information provided by the NASA’s meteorological
database, a quick and reliable calculation can be made,
assuming the global irradiation data is on a horizontal
surface Ga(0) and the radiation captured by the photovoltaic
modules is on an tilted plane Ga(βopt).
First the annual global irradiation is calculated, in
kWh/m2/year. We took the average daily value and
multiplied it by 365 days, which gave us a result of 1898
kWh/m2.
The tilt of the optimal surface βopt. faces south and is related
to the latitude ø with the expression:
βopt =3.7+0.69 *ø , = 8.55° (1)
Using the annual global irradiation on a horizontal plane, the
incident at optimum orientation is calculated:
Ga(0)/ Ga(βopt) = 1-4.46*10-4 . βopt - 1.19*10-4 .( βopt)2
= 0.9875
Ga(βopt) = 18898/0.9875 = 1922.03 kWh/m2 (2)
With this result we obtain the effective annual incident
irradiation in the plane of the array:
Gefa(β, ᾳ)/ Ga(βopt) = g1*( β - βopt)2 +g2(β - βopt) +g3 (3)
Values from the coefficients g1, g2, and g3 correspond to a
medium level of impurity [5].
Gefa(β,ᾳ)/ Ga(βopt) = 1.218*10-4(8 - 8.55)2 + 2.892*10-4(8 -
8.55) + 0.9314 = 0.931
Then: Gefa(β,ᾳ) = 0.931*1922.03 = 1789.4 kWh/m2 (4)
The energy produced by a grid-tied system EAC in an annual
period can be roughly estimated with the following equation:
EAC = PG [Gefa(β,ᾳ)] * PR*(1-FS)
Where PG is the nominal power of the PV generator (kWp),
PR is the Performance Ratio, and FS is the shading factor.
The latter are two dimensionless parameters.
EAC = 1kWp * 1789.4 kWh/m2 * 0.74*(1-0.02) = 1297.7
kWh/year (5)
3. Simulation in PVsyst Software
PVsyst software has been selected for its internationally-
recognized trustworthiness. Researchers around the world
[9] [10] [11] have used it for the sizing and study of
photovoltaic system performance. The simulation method
used in the program is based on the realization of hourly
energy balances throughout a year, by tracking the behavior
of the system in order to calculate the appropriate
combination for obtaining a system with the maximum
amount of energy, in function of climactic variables such as
global radiation, wind speed, and temperature, taking into
account the installed capacity of the photovoltaic system.
A database associated with the software was used. It contains
a variety of parameters and irradiation data collected in
numerous parts of the world over the course of a year, as
well as a vast gallery of photovoltaic components provided
by the manufacturers in order to perform accurate
simulations of the installation.
30
PVsyst allows designs at different levels.
The Pre-sized level makes a quick assessment of the
dimensions of the system and its components. It likewise
evaluates system production.
The Design level of the project makes a detailed simulation
with hourly values, permitting the definition of the
photovoltaic field and the correct selection of components.
At the Database level, PVsyst has radiation data from a large
number of cities. We have the option to enter this
information in from any external database, either manually
or automatically. The radiation data for this specific location
was imported from the NASA SSE RETScreen database. It
only requires entering in the geographical coordinates and it
automatically imports the meteorological information
required for the photovoltaic project. In addition, the
database has an extensive library of photovoltaic
components with general characteristics and technical
information supplied by the manufacturers.
The Tools level presents a wide range of digital aids for the
climate database, components database, and data measured
in order to facilitate the analysis and behavior of
photovoltaic systems. Below, the main aspects considered
when performing the PVsyst simulation are presented.
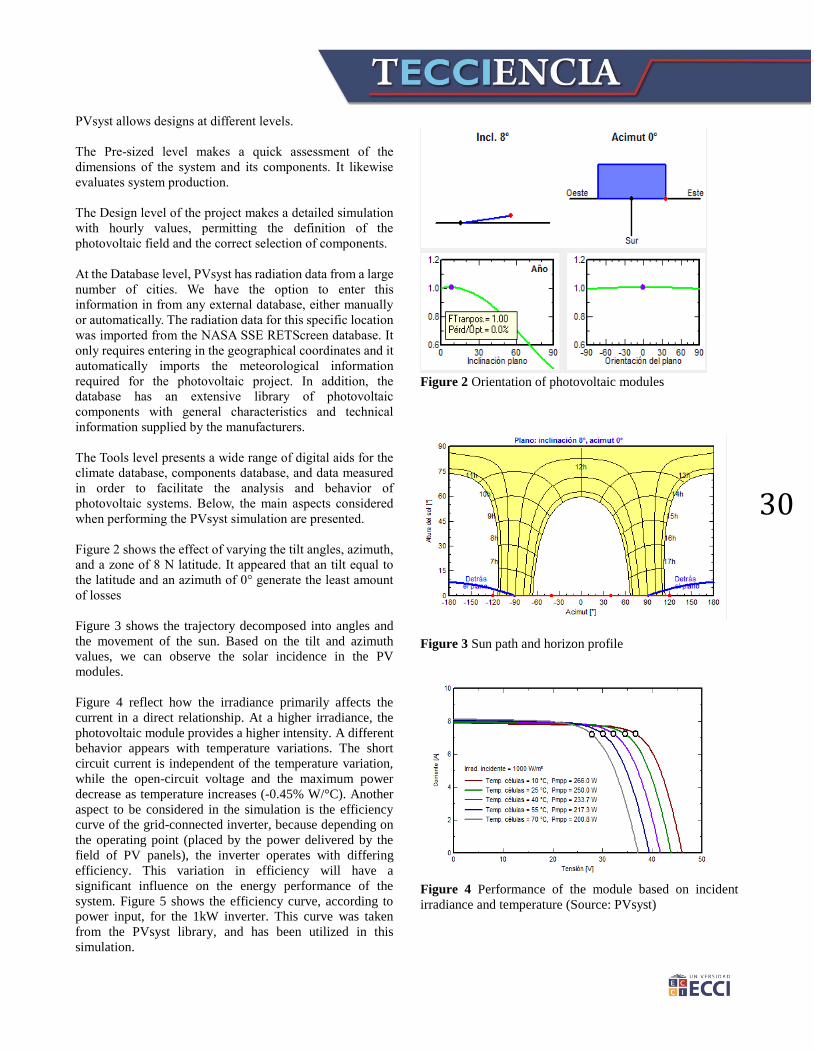
Figure 2 shows the effect of varying the tilt angles, azimuth,
and a zone of 8 N latitude. It appeared that an tilt equal to
the latitude and an azimuth of 0° generate the least amount
of losses
Figure 3 shows the trajectory decomposed into angles and
the movement of the sun. Based on the tilt and azimuth
values, we can observe the solar incidence in the PV
modules.
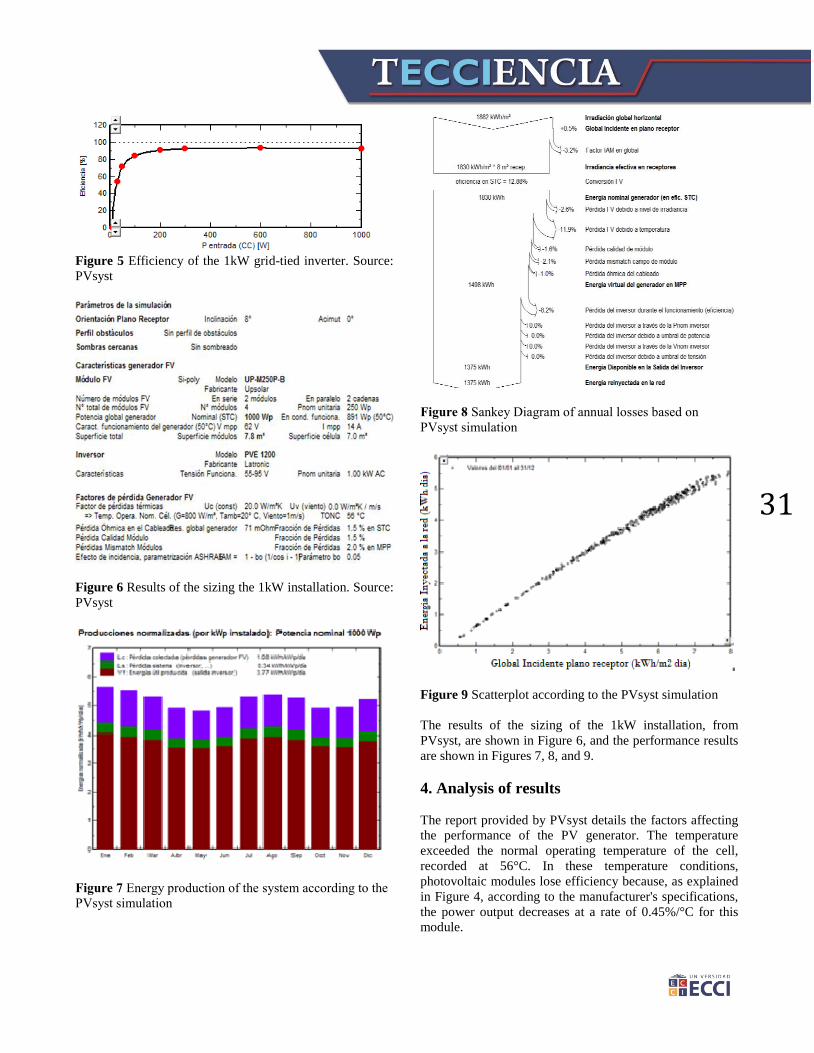
Figure 4 reflect how the irradiance primarily affects the
current in a direct relationship. At a higher irradiance, the
photovoltaic module provides a higher intensity. A different
behavior appears with temperature variations. The short
circuit current is independent of the temperature variation,
while the open-circuit voltage and the maximum power
decrease as temperature increases (-0.45% W/°C). Another
aspect to be considered in the simulation is the efficiency
curve of the grid-connected inverter, because depending on
the operating point (placed by the power delivered by the
field of PV panels), the inverter operates with differing
efficiency. This variation in efficiency will have a
significant influence on the energy performance of the
system. Figure 5 shows the efficiency curve, according to
power input, for the 1kW inverter. This curve was taken
from the PVsyst library, and has been utilized in this
simulation.
Figure 2 Orientation of photovoltaic modules
Figure 3 Sun path and horizon profile
Figure 4 Performance of the module based on incident
irradiance and temperature (Source: PVsyst)
31
Figure 5 Efficiency of the 1kW grid-tied inverter. Source:
PVsyst
Figure 6 Results of the sizing the 1kW installation. Source:
PVsyst
Figure 7 Energy production of the system according to the
PVsyst simulation
Figure 8 Sankey Diagram of annual losses based on
PVsyst simulation
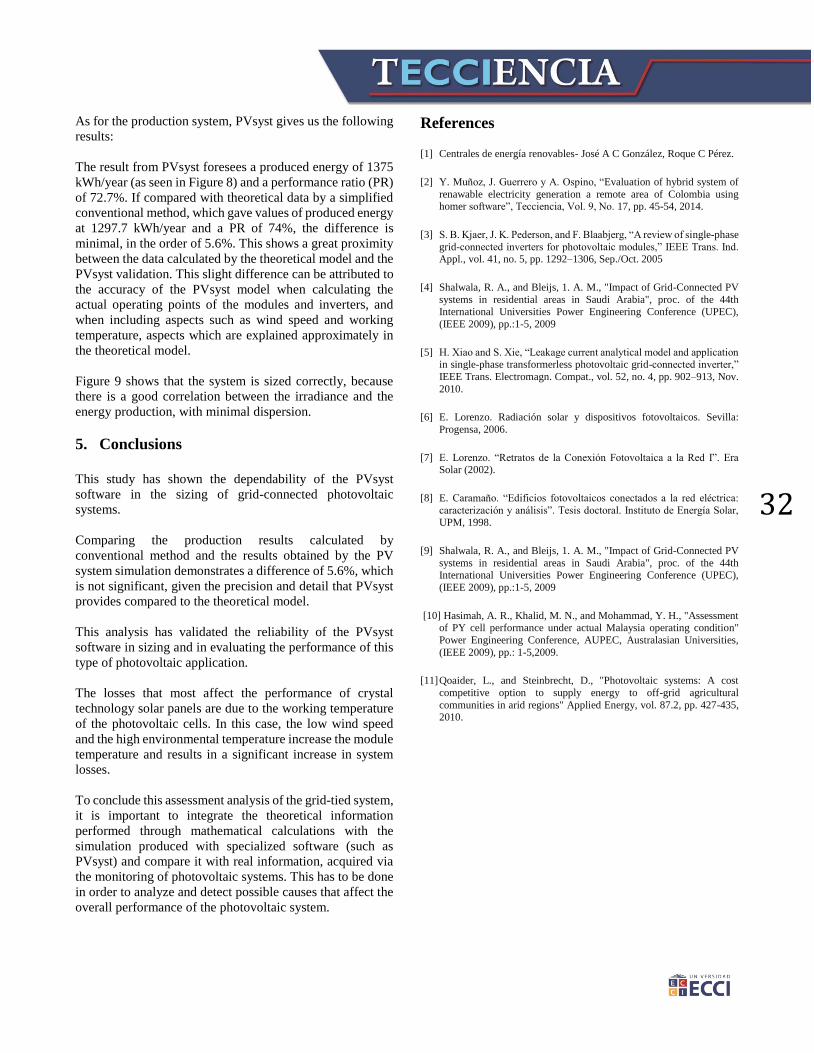
Figure 9 Scatterplot according to the PVsyst simulation
The results of the sizing of the 1kW installation, from
PVsyst, are shown in Figure 6, and the performance results
are shown in Figures 7, 8, and 9.
4. Analysis of results
The report provided by PVsyst details the factors affecting
the performance of the PV generator. The temperature
exceeded the normal operating temperature of the cell,
recorded at 56°C. In these temperature conditions,
photovoltaic modules lose efficiency because, as explained
in Figure 4, according to the manufacturer's specifications,
the power output decreases at a rate of 0.45%/°C for this
module.
32
As for the production system, PVsyst gives us the following
results:
The result from PVsyst foresees a produced energy of 1375
kWh/year (as seen in Figure 8) and a performance ratio (PR)
of 72.7%. If compared with theoretical data by a simplified
conventional method, which gave values of produced energy
at 1297.7 kWh/year and a PR of 74%, the difference is
minimal, in the order of 5.6%. This shows a great proximity
between the data calculated by the theoretical model and the
PVsyst validation. This slight difference can be attributed to
the accuracy of the PVsyst model when calculating the
actual operating points of the modules and inverters, and
when including aspects such as wind speed and working
temperature, aspects which are explained approximately in
the theoretical model.
Figure 9 shows that the system is sized correctly, because
there is a good correlation between the irradiance and the
energy production, with minimal dispersion.
5. Conclusions
This study has shown the dependability of the PVsyst
software in the sizing of grid-connected photovoltaic
systems.
Comparing the production results calculated by
conventional method and the results obtained by the PV
system simulation demonstrates a difference of 5.6%, which
is not significant, given the precision and detail that PVsyst
provides compared to the theoretical model.
This analysis has validated the reliability of the PVsyst
software in sizing and in evaluating the performance of this
type of photovoltaic application.
The losses that most affect the performance of crystal
technology solar panels are due to the working temperature
of the photovoltaic cells. In this case, the low wind speed
and the high environmental temperature increase the module
temperature and results in a significant increase in system
losses.
To conclude this assessment analysis of the grid-tied system,
it is important to integrate the theoretical information
performed through mathematical calculations with the
simulation produced with specialized software (such as
PVsyst) and compare it with real information, acquired via
the monitoring of photovoltaic systems. This has to be done
in order to analyze and detect possible causes that affect the
overall performance of the photovoltaic system.
References
[1] Centrales de energía renovables- José A C González, Roque C Pérez.
[2] Y. Muñoz, J. Guerrero y A. Ospino, “Evaluation of hybrid system of
renawable electricity generation a remote area of Colombia using homer software”, Tecciencia, Vol. 9, No. 17, pp. 45-54, 2014.
[3] S. B. Kjaer, J. K. Pederson, and F. Blaabjerg, “A review of single-phase
grid-connected inverters for photovoltaic modules,” IEEE Trans. Ind. Appl., vol. 41, no. 5, pp. 1292–1306, Sep./Oct. 2005
[4] Shalwala, R. A., and Bleijs, 1. A. M., "Impact of Grid-Connected PV
systems in residential areas in Saudi Arabia", proc. of the 44th
International Universities Power Engineering Conference (UPEC),
(IEEE 2009), pp.:1-5, 2009
[5] H. Xiao and S. Xie, “Leakage current analytical model and application in single-phase transformerless photovoltaic grid-connected inverter,”
IEEE Trans. Electromagn. Compat., vol. 52, no. 4, pp. 902–913, Nov.
2010.
[6] E. Lorenzo. Radiación solar y dispositivos fotovoltaicos. Sevilla:
Progensa, 2006.
[7] E. Lorenzo. “Retratos de la Conexión Fotovoltaica a la Red I”. Era Solar (2002).
[8] E. Caramaño. “Edificios fotovoltaicos conectados a la red eléctrica:
caracterización y análisis”. Tesis doctoral. Instituto de Energía Solar,
UPM, 1998.
[9] Shalwala, R. A., and Bleijs, 1. A. M., "Impact of Grid-Connected PV
systems in residential areas in Saudi Arabia", proc. of the 44th International Universities Power Engineering Conference (UPEC),
(IEEE 2009), pp.:1-5, 2009
[10] Hasimah, A. R., Khalid, M. N., and Mohammad, Y. H., "Assessment of PY cell performance under actual Malaysia operating condition"
Power Engineering Conference, AUPEC, Australasian Universities,
(IEEE 2009), pp.: 1-5,2009.
[11] Qoaider, L., and Steinbrecht, D., "Photovoltaic systems: A cost
competitive option to supply energy to off-grid agricultural
communities in arid regions" Applied Energy, vol. 87.2, pp. 427-435, 2010.