Embed Size (px)
Citation preview
SO2 and O2 separation by using ionic liquid
absorption
S.L. Rabie
BEng (Chem. Eng.) (North-West University)
Dissertation submitted for the degree of Master in
Chemical Engineering
North-West University Potchefstroom Campus
Supervisor: Dr. M. Le Roux
November 2012

SO2 and O2 separation by using ionic liquid absorption
i
Declaration
I, S.L. Rabie, hereby declare that the dissertation entitled: “SO2 and O2 separation by
using ionic liquid absorption”, submitted in fulfilment of the requirements for the degree
M.Eng is my own work, except where acknowledged in the text, and has not been submitted
to any other tertiary institution in whole or in part.
Signed at Potchefstroom.
_____________________ _________________
S.L. Rabie Date

SO2 and O2 separation by using ionic liquid absorption
ii
Acknowledgements
The author would hereby wish to acknowledge and thank everyone who played a major part
in the completion of this project, and in particular:
- Dr. Marco le Roux for his guidance and suggestions during the course of the project.
- Mr. Jan Kroeze and Mr. Adrian Brock for helping with the design, building and repair
of the equipment.
- Miss Eleanor de Koker for placing all the orders.
- HySA for providing the funding for the project.
- Mr. Max Tietz for his help with the experiments and analysis of the data.
- Prof. Hein Neomagus for giving advice on the thermodynamics of the process.
- Prof. Schalk Vorster for proof reading the report.
- My friend Jean du Toit for his support during the three years of this project.
SO2 and O2 separation by using ionic liquid absorption
iii
Abstract
In order to reduce the amount of pollution that is generated by burning fossil fuels alternative
energy sources should be explored. Hydrogen has been identified as the most promising
replacement for fossil fuels and can be produced by using the Hybrid Sulphur (HyS) cycle.
Currently the SO2/O2 separation step in the HyS process has a large amount of knock out
drums. The aim of this study was to investigate new technology to separate the SO2 and O2.
The technology that was identified and investigated was to separate the SO2 and O2 by
absorbing the SO2 into an ionic liquid.
In this study the maximum absorption, absorption rate and desorption rate of SO2 from the
ionic liquid [BMIm][MeSO4] with purities of 95% and 98% was investigated. These ionic liquid
properties were investigated for pure O2 at pressures ranging from 1.5 to 9 bar(a) and for
pure SO2 at pressures from 1.5 to 3 bar(a) at ambient temperature. Experiments were also
carried out where the composition of the feed-stream to the ionic liquid was varied with
compositions of 0, 25, 50, 75 and 100 mol% SO2 with O2 as the balance. For each of these
compositions the temperature of the ionic liquid was changed from 30oC to 60oC, in
increments of 10oC.
The absorption rate of SO2 in the ionic liquid increased when the mole percentage SO2 in the
feed stream was increased. When the temperature of the ionic liquid was decreased the
maximum amount of SO2 that the ionic liquid absorbed increased dramatically. However, the
absorption rate was not influenced by a change in the absorption temperature.
The experimental results for the maximum SO2 absorption were modelled with the Langmuir
absorption model. The model fitted the data well, with an average standard deviation of
17.07% over all the experiments. In order to determine if the absorption reaction was
endothermic or exothermic the Clausius-Clapeyron equation was used to calculate the heat
of desorption for the desorption step. The heat of desorption data indicated that the
desorption of SO2 from this ionic liquid was an endothermic reaction because the heat of
desorption values was positive. Therefore the absorption reaction was exothermic.
From the pressure-change experiments the results showed that the mole percentage of O2
gas that was absorbed into the ionic liquid was independent of the pressure of the O2 feed.
SO2 and O2 separation by using ionic liquid absorption
iv
On the other hand, there was a clear correlation between the mole percentage SO2 that was
absorbed into the ionic liquid and the feed pressure of the SO2. When the feed pressure of
the SO2 was increased the amount of SO2 absorbed also increased, this trend was
explained with Fick’s law.
In the study the effect of the ionic liquid purity on the SO2 absorption capacity was
investigated. The experimental results for the pressure experiments showed that the 95%
and 98% pure ionic liquid absorbed about the same amount of SO2. During the temperature
experiments the 95% pure ionic liquid absorbed more SO2 than the 98% pure ionic liquid for
all but two of the experiments. However the 95% pure ionic liquid also absorbed small
amounts of O2 at 30 and 40oC which indicated that the 95% pure ionic liquid had a lower
selectivity than the 98% pure ionic liquid. Therefore, the 95% pure ionic liquid had better SO2
absorption capabilities than the 98% pure ionic liquid.
These result showed that the 98% pure ionic liquid did not absorb more SO2 than the 95%
pure ionic liquid, but it did, however, show that the 98% pure ionic liquid had a better
selectivity towards the SO2. Hence, it can be concluded that even with the O2 that is
absorbed it would be economically more advantageous to use the less expensive 95% pure
ionic liquid rather than the expensive 98% pure ionic liquid, because the O2 would not
influence the performance of the process negatively in such low quantities.
Keywords: Sulphur dioxide (SO2), Oxygen (O2), Separation, Ionic Liquid, Absorption
SO2 and O2 separation by using ionic liquid absorption
v
Opsomming
Om die hoeveelheid besoedeling wat veroorsaak word deur die verbranding van
fossielbrandstof te verminder, moet alternatiewe bronne van energie ondersoek word.
Waterstof is geïdentifiseer as die belowendste alternatief vir fossiel brandstowe en kan
vervaardig word met die “Hybrid Sulphur” (HyS)-siklus. Huidig het SO2/O2-skeidingsprosesse
in die HyS-siklus ’n groot aantal proses eenhede. Vir hierdie studie was die doel om nuwe
tegnologie wat gebruik kan word om die SO2 en die O2 te skei, te ondersoek. Die tegnologie
wat geïdentifiseer is om SO2 en die O2 te skei, is die absorpsie van die SO2 in ioniese
vloeistowwe.
Gedurende hierdie studie is die maksimum absorpsie, absorpsietempo en die
desorpsietempo van die ioniese vloeistowwe [BMIm][MeSO4] met suiwerhede van 95% en
98% ondersoek. Hierdie eienskappe van die ioniese vloeistowwe is ondersoek vir suiwer O2
by drukke wat gewissel het van 1,5 tot 9 bar(a) en vir suiwer SO2 by drukke van 1,5 tot 3
bar(a) by kamertemperatuur. Eksperimente is ook uitgevoer waar die samestelling van die
voerstroom verander is na 0, 25, 50, 75 en 100 mol% SO2 met O2 as die balans. Vir elkeen
van hierdie samestellings is die temperatuur van die ioniese vloeistowwe na 30, 40, 50 en
60oC verander.
Die absorpsietempo in die ioniese vloeistowwe het toegeneem met verhoging van die mol%
SO2 in die voerstroom. Die maksimum hoeveelheid SO2 wat die ioniese vloeistowwe
geabsorbeer het, het dramaties toegeneem as die temperatuur van die ioniese vloeistowwe
verlaag is. Daarenteen was die absorpsietempo nie beïnvloed deur die verandering in
temperatuur nie.
Die resultate van die maksimum SO2-absorpsie is gemodelleer met die Langmuir-
absorpsiemodel. Die model het die eksperimentele data goed gepas en daar was 'n
gemiddelde standaardafwyking tussen die model en die data van 17.07% vir al die
eksperimente. Om te bepaal of die absorpsie reaksie endotermies of eksotermies is, was die
Clausius-Clapeyron vergelyking gebruik om die desorbsie hitte te bepaal. Hierdie data het
aangedui dat die desorbsie van SO2 in hierdie ioniese vloeistof ‘n endotermiese reaksie was
SO2 and O2 separation by using ionic liquid absorption
vi
aangesien die desorpsie hitte waardes positief was. Dus was die absorpsie reaksie dan
eksotermies.
Vir die druk-eksperimente het die resultate getoon dat die mol% O2 wat in die ioniese
vloeistowwe geabsorbeer is, onafhanklik is van die O2-voerdruk. Daarteenoor was daar 'n
duidelike korrelasie tussen die mol% SO2 wat in die ioniese vloeistowwe geabsorbeer is en
die voerdruk van die SO2. Met die verhoging van die voerdruk van die SO2, het die
hoeveelheid SO2 wat geabsorbeer is ook toegeneem. Hierdie tendens kon met behulp van
Fick se wet verduidelik word.
In die projek is die effek van die ioniese vloeistowwe se suiwerheid op die SO2-
absorpsievermoë ondersoek. Die resultate vir die druk-eksperimente het getoon dat die 95%
en 98%-suiwer ioniese vloeistowwe omtrent dieselfde hoeveelhede SO2 geabsorbeer het. In
die temperatuur-eksperimente het die 95%-suiwer ioniese vloeistowwe meer SO2
geabsorbeer as die 98%-suiwer ioniese vloeistowwe in veertien van die sestien gevalle. Die
95%-suiwer ioniese vloeistowwe het egter ook klein hoeveelhede O2 geabsorbeer by 30 en
40oC, wat toon dat die 95%-suiwer ioniese vloeistowwe 'n laer selektiwiteit het as die 98%-
suiwer ioniese vloeistowwe. Dit dui daarop dat die 95%-suiwer ioniese vloeistowwe ‘n beter
SO2-absorpsievermoë het as die 98%-suiwer ioniese vloeistowwe.
Hierdie resultate het gewys dat die 98%-suiwer ioniese vloeistowwe nie meer SO2 absorbeer
as die 95%-suiwer ioniese vloeistowwe nie. Dit het egter bewys dat die 98%-suiwer ioniese
vloeistowwe 'n beter selektiwiteit vir SO2 het. Dus, sal dit ekonomies baie meer voordelig
wees om die 95%-suiwer ioniese vloeistowwe eerder as die 98%-suiwer ioniese vloeistowwe
te gebruik, want die O2 wat geabsorbeer word sal nie die proses negatief beïnvloed teen
sulke lae hoeveelhede nie.
Sleutelwoorde: Swaweldioksied (SO2), Suurstof (O2), Skeiding, Ioniese Vloeistowwe,
Absorpsie
SO2 and O2 separation by using ionic liquid absorption
vii
Table of contents
Declaration .............................................................................................................................. i
Acknowledgements ................................................................................................................ ii
Abstract ................................................................................................................................. iii
Opsomming ............................................................................................................................ v
Table of contents .................................................................................................................. vii
List of figures ......................................................................................................................... xi
List of tables ........................................................................................................................ xiv
List of symbols .................................................................................................................... xvi
Abbreviations ..................................................................................................................... xvii
Chapter 1 Introduction ............................................................................................................1
1.1 Background ..............................................................................................................1
1.2 HyS cycle .................................................................................................................2
1.2.1 Background and history .....................................................................................2
1.2.2 Process description ...........................................................................................3
1.3 Problem statement ...................................................................................................6
1.4 Objectives ................................................................................................................6
1.5 Outline......................................................................................................................7
Chapter 2 Literature study ......................................................................................................9
2.1 SO2/O2 Separation ...................................................................................................9
2.1.1 Distillation ........................................................................................................ 10
2.1.2 Membrane separation ..................................................................................... 11
2.1.3 Gas absorption ................................................................................................ 13
2.1.3.3 Absorption modelling ....................................................................................... 21
2.2 Ionic liquid .............................................................................................................. 24
2.2.1 Ionic liquid properties ...................................................................................... 25
SO2 and O2 separation by using ionic liquid absorption
viii
2.3 Industrial application of ionic liquids ....................................................................... 29
2.4 Future of ionic liquids ............................................................................................. 31
2.5 Hypothesis ............................................................................................................. 33
Chapter 3 Experimental ........................................................................................................ 35
3.1 Introduction ............................................................................................................ 35
3.2 Materials used ........................................................................................................ 35
3.2.1 Gases ............................................................................................................. 35
3.2.2 Ionic liquids ..................................................................................................... 35
3.3 Temperature experiments ...................................................................................... 37
3.3.1 Process flow diagram ...................................................................................... 37
3.3.2 Equipment list ................................................................................................. 38
3.3.3 Experimental setup ......................................................................................... 40
3.3.4 Experimental procedure .................................................................................. 45
3.3.5 Experimental planning ..................................................................................... 46
3.4 Pressure experiments ............................................................................................ 47
3.4.1 Process flow diagram ...................................................................................... 47
3.4.2 Equipment list ................................................................................................. 48
3.4.3 Experimental setup ......................................................................................... 49
3.4.4 Experimental procedure .................................................................................. 50
3.4.5 Experimental planning ..................................................................................... 53
Chapter 4 Temperature experiments – Results and discussion ............................................ 55
4.1 Experimental data .................................................................................................. 55
4.2 Data analysis.......................................................................................................... 58
4.2.1 Maximum Absorption....................................................................................... 58
4.2.2 Initial absorption rate ....................................................................................... 63
4.2.3 Desorption rate................................................................................................ 66
4.3 Data modelling ....................................................................................................... 70
4.3.1 Fitted model .................................................................................................... 72
4.3.2 Model evaluation ............................................................................................. 74
SO2 and O2 separation by using ionic liquid absorption
ix
4.3.3 Clausius-Clapeyron ......................................................................................... 76
Chapter 5 Pressure experiments – Results, discussion and observations ............................ 81
5.1 Experimental results ............................................................................................... 81
5.2 Analysed data ........................................................................................................ 81
5.3 Additional results and observations ........................................................................ 86
5.3.1 Physical changes to the ionic liquid ................................................................. 86
5.3.2 Changes in ionic liquid volume ........................................................................ 86
5.4 Summary ................................................................................................................ 88
Chapter 6 Conclusions and recommendations ..................................................................... 89
6.1 Introduction ............................................................................................................ 89
6.2 Conclusions ........................................................................................................... 89
6.2.1 Temperature ................................................................................................... 89
6.2.2 Feed stream composition ................................................................................ 89
6.2.3 Absorption of O2 .............................................................................................. 90
6.2.4 Feed pressure ................................................................................................. 90
6.2.5 Desorption ....................................................................................................... 91
6.2.6 Ionic liquid purity ............................................................................................. 91
6.2.7 Data modelling ................................................................................................ 92
6.3 Recommendations ................................................................................................. 92
6.3.1 Future research ............................................................................................... 92
6.3.2 Implementation in the HyS process ................................................................. 93
References ........................................................................................................................... 95
Appendix A Calibration data ............................................................................................... 99
Appendix B Additional data for temperature experiments ................................................. 101
Appendix C Additional data for pressure experiments ...................................................... 105
C.1 Raw Experimental Data ........................................................................................ 105
C.2 Processed Data .................................................................................................... 110
Appendix D Reproducibility data ....................................................................................... 113
Appendix E Sample calculations ...................................................................................... 121
SO2 and O2 separation by using ionic liquid absorption
x
E.1 Calculations for temperature experiments ............................................................ 121
E.2 Calculations for pressure experiments ................................................................. 123
Appendix F CD ................................................................................................................. 127
Appendix G Article ............................................................................................................ 129
SO2 and O2 separation by using ionic liquid absorption
xi
List of figures
Figure 1.1: HyS Cycle ............................................................................................................4
Figure 1.2: Proposed HyS flow sheet .....................................................................................5
Figure 2.1: Schematic representation of a distillation column ............................................... 10
Figure 2.2: Representation of a simple membrane process .................................................. 12
Figure 2.3: Proposed SO2/O2 separation by means of a water scrubber ............................... 15
Figure 2.4: Chemical structure of [BMIm][MeSO4] ................................................................ 17
Figure 2.5: SO2 absorption and desorption cycles using [BMIm][MeSO4] .............................. 18
Figure 2.6: Ionic liquid absorption and desorption ................................................................. 18
Figure 2.7: SO2 solubility at various temperatures and SO2 partial pressures ....................... 20
Figure 2.8: CO2 dissolution into ionic liquid [BMIm][BF4] with fitted Langmuir model ............. 22
Figure 2.9: C2H4 solubility in [BMIm][PF6] at 10, 25 and 50oC ............................................... 23
Figure 2.10: Adsorption isotherms of 2,2,4-trimethylpentane on a hydrocarbon adsorber ..... 24
Figure 2.11: Common cations used in ionic liquids ............................................................... 26
Figure 2.12: Volume expansion upon absorption of ionic liquids and two organic solvents ... 28
Figure 2.13: A spay nozzle after 10 hours of operation. Nozzle for aqueous sodium chloride
solutions (left) and ionic liquid (right) .................................................................................... 31
Figure 2.14: Future applications of ionic liquids .................................................................... 32
Figure 3.1: Process flow diagram for temperature experiments ............................................ 37
Figure 3.2: Top view of the heater with the absorption chamber inside. ................................ 41
Figure 3.3: Temperature calibration ...................................................................................... 42
Figure 3.4: Mass flow controller calibration curve for SO2 ..................................................... 43
Figure 3.5: Mass flow controller calibration curve for O2 ....................................................... 43
Figure 3.6: GC calibration curve ........................................................................................... 45
Figure 3.7: Process flow diagram for the pressure experiments ........................................... 47
Figure 4.1: Mass SO2 absorbed in 95% IL with 100 mol% SO2 at 30oC and mass SO2 during
desorption after 2000 seconds ............................................................................................. 55
Figure 4.2: Mass SO2 absorbed in 95% IL with 100 mol% SO2 at 30oC and mass SO2 during
desorption after 2000 seconds ............................................................................................. 56
Figure 4.3: Mass SO2 absorbed in 95% IL with 100 mol% SO2 at 30oC to 60oC and mass SO2
during desorption after 2000 seconds ................................................................................... 56
Figure 4.4: Mass SO2 absorbed in 98% IL with 100 mol% SO2 at 30oC to 60oC and mass SO2
during desorption after 2000 seconds ................................................................................... 57
SO2 and O2 separation by using ionic liquid absorption
xii
Figure 4.5: Mol O2/mol IL with 0 mol% SO2 .......................................................................... 59
Figure 4.6: Mol SO2/mol IL with 25 mol% SO2 ...................................................................... 60
Figure 4.7: Mol SO2/mol IL with 50 mol% SO2 ...................................................................... 60
Figure 4.8: Mol SO2/mol IL with 75 mol% SO2 ...................................................................... 61
Figure 4.9: Mol SO2/mol IL with 100 mol% SO2 .................................................................... 61
Figure 4.10: Initial absorption rate with 25 mol% SO2 ........................................................... 64
Figure 4.11: Initial absorption rate with 50 mol% SO2 ........................................................... 64
Figure 4.12: Initial absorption rate with 75 mol% SO2 ........................................................... 65
Figure 4.13: Initial absorption rate with 100 mol% SO2 ......................................................... 65
Figure 4.14: Initial desorption rate versus composition at 30oC............................................. 67
Figure 4.15: Initial desorption rate versus composition at 40oC............................................. 67
Figure 4.16: Initial desorption rate versus composition at 50oC............................................. 68
Figure 4.17: Initial desorption rate versus composition at 60oC............................................. 68
Figure 4.18: Absorption data for the 95% pure ionic liquid .................................................... 71
Figure 4.19: Absorption data for the 95% pure ionic liquid .................................................... 71
Figure 4.20: Experimental data and model data for the 95% pure ionic liquid ....................... 73
Figure 4.21: Experimental data and model data for the 98% pure ionic liquid ....................... 74
Figure 4.22: Experimental data versus the calculated data from the model for the 95% pure
ionic liquid ............................................................................................................................ 75
Figure 4.23: Plot of mol SO2 absorbed versus the partial pressure of SO2 at 30oC, 40oC, 50oC
and 60oC for 95% pure ionic liquid ........................................................................................ 77
Figure 4.24: Plot of mol SO2 absorbed versus the partial pressure of SO2 at 30oC, 40oC, 50oC
and 60oC for 98% pure ionic liquid ........................................................................................ 77
Figure 4.25: Plot of ln(PSO2) versus 1/T for 95% pure ionic liquid .......................................... 78
Figure 4.26: Plot of ln(PSO2) versus 1/T for 98% pure ionic liquid .......................................... 79
Figure 5.1: Mole gas absorbed per mole of ionic liquid at different initial feed pressures for
SO2 and O2 in 95% and 98% pure ionic liquid....................................................................... 82
Figure 5.2: Mole% gas fed to the system absorbed by the ionic liquid for SO2 and O2 at
different feed pressures for 95 and 98% pure ionic liquid. .................................................... 83
Figure B.1: Plot of the flow data .......................................................................................... 102
Figure D.1: Reproducibility data for the 95% pure IL at 60oC with 0 mol% SO2 .................. 114
Figure D.2: Reproducibility data for the 95% pure IL at 40oC with 25 mol% SO2................. 115
Figure D.3: Reproducibility data for the 95% pure IL at 30oC with 50 mol% SO2................. 115
Figure D.4: Reproducibility data for the 95% pure IL at 50oC with 75 mol% SO2................. 116
Figure D.5: Reproducibility data for the 95% pure IL at 40oC with 100 mol% SO2 ............... 116
Figure D.6: Reproducibility data for the 98% pure IL at 60oC with 0 mol% SO2 .................. 117
Figure D.7: Reproducibility data for the 98% pure IL at 40oC with 25 mol% SO2................. 117
SO2 and O2 separation by using ionic liquid absorption
xiii
Figure D.8: Reproducibility data for the 98% pure IL at 30oC with 50 mol% SO2................. 118
Figure D.9: Reproducibility data for the 98% pure IL at 50oC with 75 mol% SO2................. 118
Figure D.10: Reproducibility data for the 98% pure IL at 40oC with 100 mol% SO2 ............. 119
Figure E.1: Experimental data at 40oC with 100 mol% SO2 and the 98% pure ionic liquid .. 121
SO2 and O2 separation by using ionic liquid absorption
xiv
List of tables
Table 2.1: Advantages and disadvantages of distillation....................................................... 11
Table 2.2: Advantages and disadvantages of membrane separation .................................... 13
Table 2.3: Advantages and disadvantages of SO2 absorption into water .............................. 15
Table 2.4: Advantages and disadvantages of SO2 absorption into ionic liquids .................... 20
Table 2.5: Companies and processes that use ionic liquids in the industry ........................... 30
Table 3.1: Density (ρ) and Viscosity (η) of [BMIm][MeSO4] as a function of temperature ..... 36
Table 3.2: List of equipment for the temperature experiments .............................................. 38
Table 3.3: Temperature chart for temperature controller ....................................................... 42
Table 3.4: Balance specifications ......................................................................................... 44
Table 3.5: Experimental planning for temperature experiments ............................................ 46
Table 3.6: List of equipment for the pressure experiments ................................................... 48
Table 3.7: Experimental planning for the pressure experiments ........................................... 53
Table 4.1: Percentage difference in absorption between 95% and 98% pure ionic liquid ...... 62
Table 4.2: Desorption times of the 95% and 98% pure ionic liquids ...................................... 69
Table 4.3: Mole SO2 absorbed per mole ionic liquid ............................................................. 72
Table 4.4: Values calculated for k and xmax at each temperature .......................................... 73
Table 4.5: Standard deviation in percentages ....................................................................... 75
Table 4.6: SO2 partial pressure............................................................................................. 78
Table 4.7: Heat of desorption ............................................................................................... 79
Table A.1: Calibration data for O2 ......................................................................................... 99
Table A.2: Calibration data for SO2 ..................................................................................... 100
Table A.3: Calibration data for GC ...................................................................................... 100
Table B.1: Flow data .......................................................................................................... 101
Table B.2: GC data ............................................................................................................. 102
Table B.3: Analysed data for temperature experiments ...................................................... 104
Table C.1: Volume and Constants Table ............................................................................ 105
Table C.2: Pressure readings for 95% IL (SO2) .................................................................. 106
Table C.3: Pressure readings for 98% IL (SO2) .................................................................. 107
Table C.4: Pressure readings for 95% IL (O2) ..................................................................... 108
Table C.5 Pressure readings for 98% IL (O2) ...................................................................... 109
SO2 and O2 separation by using ionic liquid absorption
xv
Table C.6 Experimental results for O2 absorption into both ionic liquids with the variances for
each experimental set ........................................................................................................ 110
Table C.7 Experimental results for SO2 absorption into both ionic liquids with the variances
for each experimental set ................................................................................................... 111
Table C.8: % mole of O2 absorbed by the ionic liquid ......................................................... 111
Table C.9: % mole of SO2 absorbed by the ionic liquid ....................................................... 112
Table D.1: Confidence interval calculations ........................................................................ 114
Table E.1: Example of raw data for pressure experiment ................................................... 124
SO2 and O2 separation by using ionic liquid absorption
xvi
List of symbols
Symbol Unit Description
CA Mol/m3 Molar concentration of A
DAB m2/s Diffusion coefficient
H bar Henry’s constant
ΔHdes kJ/mol Heat of desorption
JAz kg/s·m2 Molar flux of A in z direction
k 1/bar The dissolution constant
kb m2 kg s-2K-1 Boltzmann constant
kF - Freundlich constant
MW g/mol Molecular weight
m g Mass
NA mol−1 Avogadro’s number
N - Number of data points
n mol Amount of mole
nF - Freundlich exponent
P bar Pressure
p - Number of fitted parameters
q mol SO2/mol IL Amount of SO2 absorbed into the ionic liquid
qmax mol SO2/mol IL Maximum amount of SO2 absorbed into the ionic liquid
R J/mol·K Gas constant
r Å Radius of a diffusing particle
T oC Temperature
V m3 Volume
x - Mole fraction
yexp - Experimental value
ycalc - Value predicted by the model
ρ g/cm3 Density
η mPa·s Viscosity
SO2 and O2 separation by using ionic liquid absorption
xvii
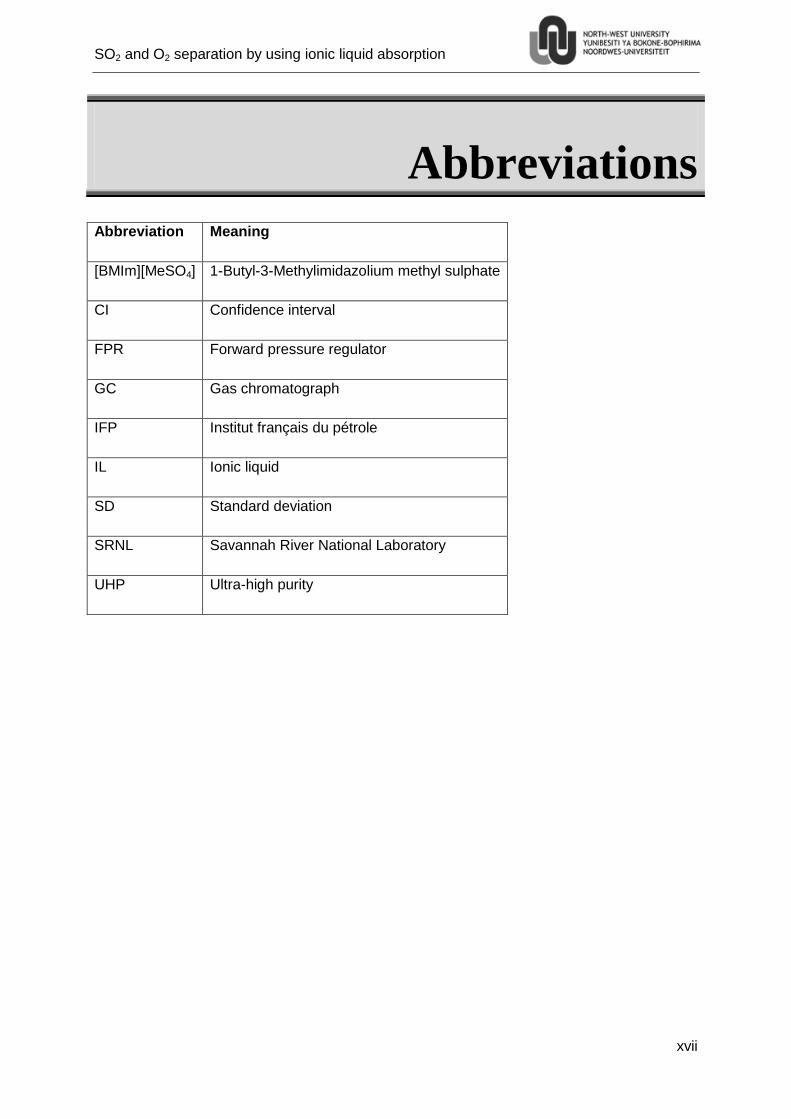
Abbreviations
Abbreviation Meaning
[BMIm][MeSO4] 1-Butyl-3-Methylimidazolium methyl sulphate
CI Confidence interval
FPR Forward pressure regulator
GC Gas chromatograph
IFP Institut français du pétrole
IL Ionic liquid
SD Standard deviation
SRNL Savannah River National Laboratory
UHP Ultra-high purity

SO2 and O2 separation by using ionic liquid absorption
xviii
SO2 and O2 separation by using ionic liquid absorption
1
1. Chapter 1
Introduction
1.1 Background
Fossil fuels currently meet most of the world’s energy requirements; for example by burning
coal to generate electricity, using oil to manufacture petrol to power cars and using gas to
heat homes. According to Shafiee & Topal (2009:186) there are enough coal reserves
remaining worldwide for the next 107 years and enough natural gas reserves left for the next
37 years. The US geological survey estimates that there is a total of 2.6 trillion barrels of oil
left in the world, whilst at present about 30.6 billion barrels of oil is used per year around the
world. When the annual growth rate and the population increase is taken into account, the oil
reserves may last for only 25 more years; although oil shale and tar sands could add another
30 years to that estimation (Lattin & Utgikar, 2007:3230). These facts, as well as the fact
that the burning of fossil fuels pollutes the atmosphere, suggest that it is very important to
explore alternative energy sources as soon as possible.
Currently the automotive sector consumes the bulk of available oil. In 2004, the US utilized
20 million barrels of oil per day with 13 million of the total being used by the transportation
sector (Lattin & Utgikar, 2007:3230). Biodiesel, electricity, ethanol, hydrogen, methanol,
natural gas, propane and solar energy are all examples of alternative fuels that have been
applied commercially as a replacement for petroleum. Of all these alternatives, hydrogen
has one of the best chances of being implemented on a commercial scale. The main
reasons why hydrogen is one of the most likely alternative fuels to be used on a large scale
are energy security and low levels of pollution. Hydrogen is one of the most abundant
elements in the universe and it is a clean fuel (when hydrogen is combusted the only by-
product is water vapour). Therefore, hydrogen is a very attractive alternative to petroleum as
a fuel source for the future. It is very important to keep in mind that hydrogen is not an
energy source but rather an energy carrier; thus it has to be manufactured just like electricity
(Johnston et al., 2005:571).
SO2 and O2 separation by using ionic liquid absorption
2
1.2 HyS cycle
1.2.1 Background and history
In Section 1.1 it was stated that the world has to minimize its dependence on fossil fuel to
reduce pollution. Hydrogen was identified as the most promising replacement. Currently
hydrogen is produced by reacting natural gas, naphtha or coal with steam to form hydrogen.
This process, however, produces carbon dioxide. New processes are being developed to
produce hydrogen from water by only using heat or a combination of heat and electricity.
These new developments are known as thermochemical water-splitting cycles (Gorensek et
al., 2009:2).
Thermochemical cycles are made up of a series of connected chemical reactions. These
reactions result in the dissociation of water into hydrogen and oxygen. In these
thermochemical cycles the only consumable is water; all other reagents are recycled in the
cycle and reused, bar minor losses. There are two types of thermochemical cycles: Pure
thermochemical cycles and hybrid thermochemical cycles. The difference between the two is
that the pure thermochemical cycle only requires heat to drive the reactions. On the other
hand, a hybrid cycle has at least one electrochemical step. The Hybrid Sulphur (HyS) cycle
is a hybrid thermochemical cycle because of the electrolysis step in the process (Gorensek
et al., 2009:2).
The HyS Cycle, also known as the Westinghouse Sulphur Cycle or the Ispra Mark 11 Cycle,
was developed in the early 1970s by Westinghouse Electric Corporation. By 1978, all the
basic chemistry steps for the HyS cycle were successfully demonstrated. A closed-loop
integrated laboratory bench scale model was successfully operated and produced 120 litres
of hydrogen per hour. Research continued on equipment design and optimization, materials
of construction, integration with a nuclear/solar heat source, process optimization, and
economics, until 1983. However, due to the fact that hydrogen could be produced from
steam reforming of natural gas at low prices, as well as the lack of interest in developing
advanced nuclear reactors and high temperature solar receivers at that time, the program
was stopped (Summers et al., 2005:2).
SO2 and O2 separation by using ionic liquid absorption
3
In 2002, a study was carried out to review all thermochemical hydrogen production cycles
and find the leading contenders. The cycles were reviewed and ranked according to (Brown
et al., 2003:2-3):
- Minimum number of chemical reactions.
- Minimum number of separation steps.
- Minimum number of elements in the cycle.
- Using abundant elements in the earth’s crust, oceans and atmosphere.
- Minimum number of expensive materials of construction by avoiding corrosive
chemical systems
- Minimum flow of solids.
- Maximum heat input temperature
- High number of papers from many authors and institutions.
- Tests at moderate or large scale.
- High efficiency and the availability of cost data.
In the study 115 cycles were identified and evaluated, and the HyS cycle was ranked as
number one (Summers et al., 2005:2). Currently the HyS process is being developed by the
Savannah River National Laboratory (SRNL) in the USA and forms part of the Nuclear
Hydrogen Initiative (NHI) (Gorensek et al., 2009:2). It was also identified by the North-West
University, which form part of the HySA initiative, as the thermochemical cycle of choice.
1.2.2 Process description
The HyS cycle is one of the simplest thermochemical cycles because it only has liquid
reagents and consists of just two reaction steps. These steps are the decomposition of
sulphuric acid and the SO2-depolarised electrolysis of water. Figure 1.1 shows a schematic
representation of the HyS cycle.
SO2 and O2 separation by using ionic liquid absorption
4
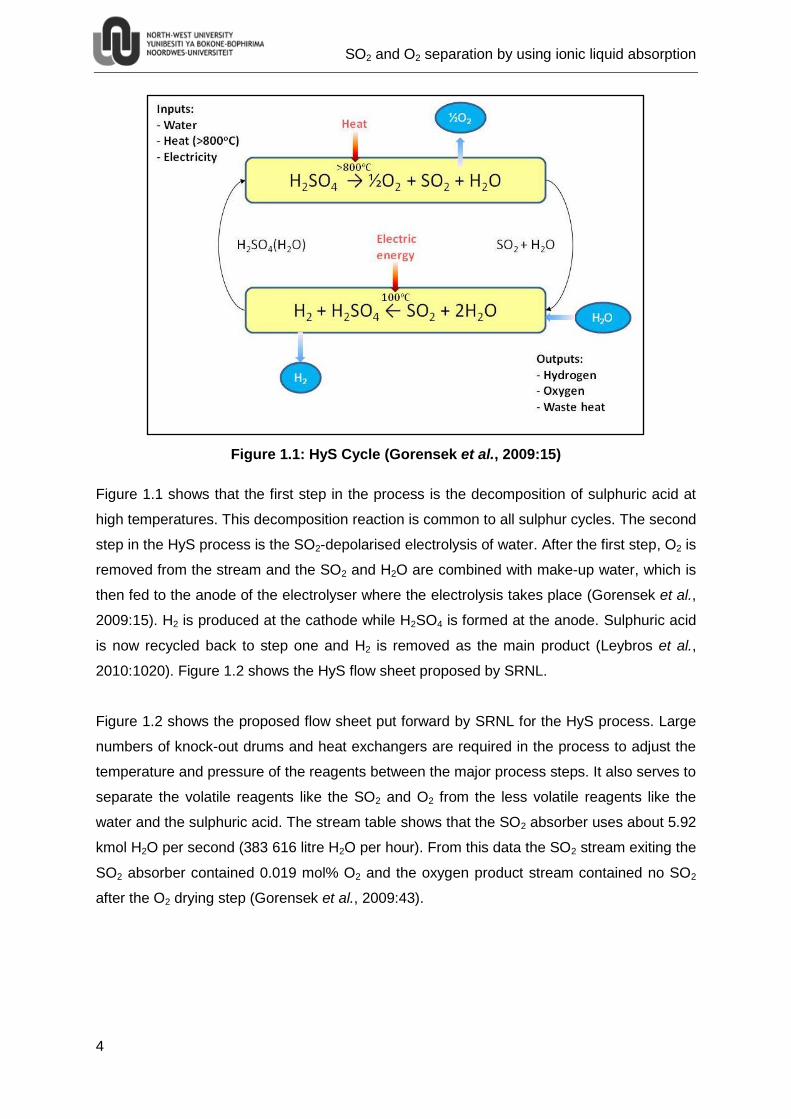
Figure 1.1: HyS Cycle (Gorensek et al., 2009:15)
Figure 1.1 shows that the first step in the process is the decomposition of sulphuric acid at
high temperatures. This decomposition reaction is common to all sulphur cycles. The second
step in the HyS process is the SO2-depolarised electrolysis of water. After the first step, O2 is
removed from the stream and the SO2 and H2O are combined with make-up water, which is
then fed to the anode of the electrolyser where the electrolysis takes place (Gorensek et al.,
2009:15). H2 is produced at the cathode while H2SO4 is formed at the anode. Sulphuric acid
is now recycled back to step one and H2 is removed as the main product (Leybros et al.,
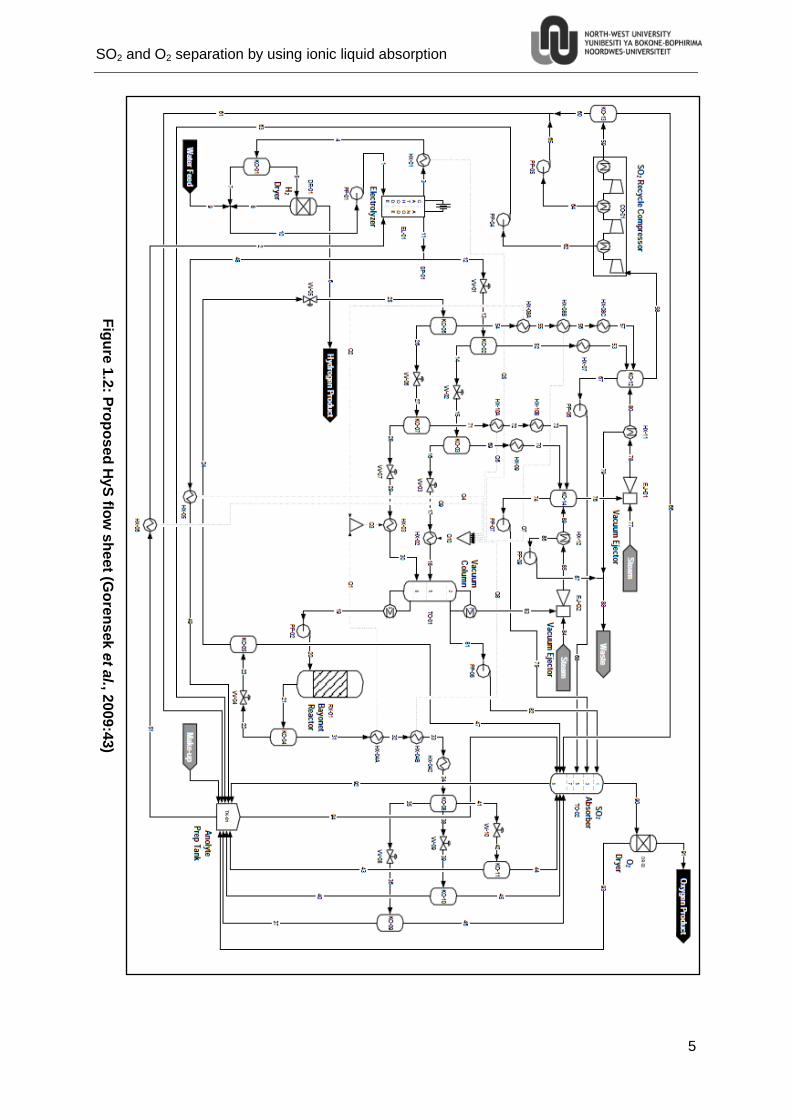
2010:1020). Figure 1.2 shows the HyS flow sheet proposed by SRNL.
Figure 1.2 shows the proposed flow sheet put forward by SRNL for the HyS process. Large
numbers of knock-out drums and heat exchangers are required in the process to adjust the
temperature and pressure of the reagents between the major process steps. It also serves to
separate the volatile reagents like the SO2 and O2 from the less volatile reagents like the
water and the sulphuric acid. The stream table shows that the SO2 absorber uses about 5.92
kmol H2O per second (383 616 litre H2O per hour). From this data the SO2 stream exiting the
SO2 absorber contained 0.019 mol% O2 and the oxygen product stream contained no SO2
after the O2 drying step (Gorensek et al., 2009:43).
SO2 and O2 separation by using ionic liquid absorption
5
Fig
ure
1.2
: Pro
po
sed
Hy
S flo
w s
he
et (G
ore
ns
ek
et a
l., 200
9:4
3)
SO2 and O2 separation by using ionic liquid absorption
6
For this study only the part where the O2 is separated from the SO2 before the SO2 is sent to
the second reaction will be considered. During the start-up phase of the Hydrogen research
initiative at the NWU, Le Roux and Hattingh (2010:8) studied alternative separating methods
for separating SO2 and O2 in the HyS process. The aim of this investigation was to identify
different separation methods that could be introduced to the HyS process in an attempt to
eliminate the large amount of knock out drums and columns. Four alternative methods were
identified by which the O2 and SO2 can be separated. These methods are distillation, gas
scrubbing, gas absorption into ionic liquids and membrane separation. After careful
consideration, the method chosen for further study in this project was gas absorption into
ionic liquids. Each of these methods will be discussed in more detail in Section 2.1 and some
advantages and disadvantages will be given for each. An in-depth study will be performed to
determine the influence of changing process conditions on the separation of SO2 and O2.
1.3 Problem statement
The problem statement for this study entails an investigation into the possibility of using ionic
liquids of different purities to separate mixtures of SO2 and O2. Part of the study will include
the influence of different process conditions like temperature, pressure and feed
concentration on the separability of the gas mixtures.
1.4 Objectives
The separation of O2 and SO2 is an important part of the HyS process and was discussed in
Section 1.2.2 above. It takes place between the decomposition of sulphuric acid and the
SO2-depolarised electrolysis of water (see Figure 1.2) and removes the SO2 from the co-
product, O2. Hereafter, the purified SO2 is send to the second reaction. In this study, ionic
liquids will be used to absorb the SO2 and then separate it from the O2. Thereafter, the SO2
is desorbed from the ionic liquid by temperature swing desorption.
The following conditions will be changed during the experimentation phase:
- Pressure of the SO2 and O2 fed to the system
- Absorption temperature of the ionic liquid
- Feed composition of the SO2 and O2
- Purity of the ionic liquid
SO2 and O2 separation by using ionic liquid absorption
7
During the course of this study the following questions will be answered:
- How will the absorption temperature influence the maximum absorption and
absorption rates of SO2 and O2 into the ionic liquids?
- Will the feed composition of SO2 and O2 have an influence on the maximum
absorption and the absorption rate of SO2 and O2 into the ionic liquids?
- What will the effect of the feed pressure of both the SO2 and O2 have on the
absorption capabilities of the ionic liquid?
- Does the SO2 absorbed into the ionic liquid desorb at a temperature higher than
120oC?
- Will a more pure ionic liquid have a higher maximum absorption and absorption rate?
In other words, is a more pure ionic liquid better at separating SO2 and O2 than a less
pure, but more cost friendly, ionic liquid?
1.5 Outline
In this report a literature study will be conducted in Chapter 2, in which more information will
be given on SO2/O2 separation, ionic liquids, industrial applications of ionic liquids and future
applications of ionic liquids.
In Chapter 3 the materials, equipment and the experimental procedure as well as the
expected results of the experiments will be discussed.
Chapter 4 contains the results and discussion of the experiments performed to study the
effect of temperature on the SO2 absorption, as well as the modelling of the experimental
data.
In Chapter 5 the results obtained from the experiments on the effect of pressure on the SO2
absorption into ionic liquid will be examined and the data discussed.
Finally, in Chapter 6 the final conclusions about the study and recommendations for future
research will be made.

SO2 and O2 separation by using ionic liquid absorption
8
SO2 and O2 separation by using ionic liquid absorption
9
2. Chapter 2
Literature study
From Figure 1.2 in Chapter 1 it was concluded that the process to separate the SO2 and the
O2 proposed by Gorensek et al. (2009:43) requires a large number of process units. It was
decided to investigate the possibility of using a new technology to do the separation. The
method that was decided upon was to use ionic liquids to separate the SO2 and the O2. This
chapter will consider:
Different methods of SO2/O2 separation (including ionic liquid absorption).
Ionic liquids.
Some industrial applications for ionic liquids.
Future applications of ionic liquids.
2.1 SO2/O2 Separation
When SO2 and O2 were compared with one another, it was found that the largest differences
in properties are their phase-change temperatures and the solubility of the components. For
these property differences, the most applicable separation methods are:
Distillation
Membrane separation
Gas absorption
Gas absorption will be divided into two processes for this study, namely gas absorption into
water and gas absorption into ionic liquids. These two processes are both good separation
methods for SO2 and O2 in the HyS process. This section will describe these four separation
methods and give a process description, attention to the applicability of each method in the
HyS process and list some advantages and disadvantages.
SO2 and O2 separation by using ionic liquid absorption
10
2.1.1 Distillation
Process description
Distillation is the most widely used separation technique in industry. Distillation consists of
multiple contacts between liquid and vapour phases flowing counter-currently. At each
contact the two phases are mixed to promote rapid partitioning of species by mass transfer.
Thereafter, the phases are separated again. At each of these contact points, the lighter
(more volatile) component will enter the vapour phase while the heavier (less volatile)
component will enter the liquid phase. Thus the vapour flowing up the column is increasingly
enriched with the lighter component, while the liquid flowing down is enriched with the
heavier component (Seader & Henley, 2006:8).
Figure 2.1 shows a schematic representation of a distillation column with all the major
accessories included. The feed is introduced at a certain point on the column (often near the
middle), depending on the components in the feed. (Seader & Henley, 2006:8).
Figure 2.1: Schematic representation of a distillation column (Le Roux and Hattingh, 2010:10)
SO2 and O2 separation by using ionic liquid absorption
11
Applicability
In 1977, with the original design of the HyS process, Brecher et al. (1977:3) suggested that
the SO2 and O2 should be separated by low temperature (cryogenic) distillation. The boiling
points for SO2 and O2 are -10oC and -183oC, respectively (Perry & Green, 1997:2-25).
Because of the large difference in boiling points these gases can be flashed into two
streams. When the temperature is above the dew point of O2 and below the dew point of
SO2, an O2-rich top stream and a SO2-rich bottom stream will be produced.
Advantages and disadvantages
Distillation is a well-known separation technique in the chemical industry. Table 2.1 gives
some of the advantages and disadvantages of using distillation to separate SO2 and O2 (Le
Roux and Hattingh, 2010:12).
Table 2.1: Advantages and disadvantages of distillation
Advantages Disadvantages
Known technology Expensive
Easy to design Hard to operate
Large operating window Best operation at cryogenic conditions
Can theoretically be separated in one stage Not all VLE data are available
2.1.2 Membrane separation
Process description
Membranes act as selective barriers between two components or phases. A gas mixture is
separated with a membrane due to the differences in the rates of permeation through the
membrane. In other words, some of the gases pass through the membrane quickly while
others move more slowly (Mulder, 1998:309). As can be seen from Figure 2.2, the feed
stream is split into a permeate stream that passes through the membrane and a retentate
stream that does not pass through. The characteristics of the membrane and the properties
of the components will determine how fast the rate of separation is.
SO2 and O2 separation by using ionic liquid absorption
12
Feed
Permeate
RetentateModule
Figure 2.2: Representation of a simple membrane process
For a pair of gases like O2/N2, there are two parameters that characterise the membrane
separation performance. These are the permeability coefficient and the selectivity of the
gases. There exists a trade-off between these two parameters, for example a more
permeable membrane will be less selective and vice versa. Because of this trade-off an
upper limit for the performance of the system exists (Seo et al., 2006:4501).
Applicability
Not much work has been done on the separation of SO2 and O2 with membranes. Most of
the published results do not show much promise. The reason for the difficulty in separation is
the similarity in the kinetic diameter of the two gases (Dong & Long, 2004:13). Polymer
membranes have not developed to such an extent that it can aid in this separation, because
many polymers will decompose at temperatures higher than 150oC (Orme et al., 2009:4089).
Dong & Long (2004:9) developed a membrane that gives a favourable ideal selectivity of 491
for O2 over SO2. These results were obtained at 20oC and 10 bar. The membrane was
reported to be a calcined B-AI-ZSM-5 zeolite made by using porous glass disks as a base.
Advantages and disadvantages
There are several advantages that membrane separation provides over conventional
separation techniques like distillation. Some of the most important advantages and
disadvantages of membrane separation are listed in Table 2.2 (Dong & Long, 2004:10, Perry
& Green, 1997:22-38, Seader & Henley, 2006:713).
SO2 and O2 separation by using ionic liquid absorption
13
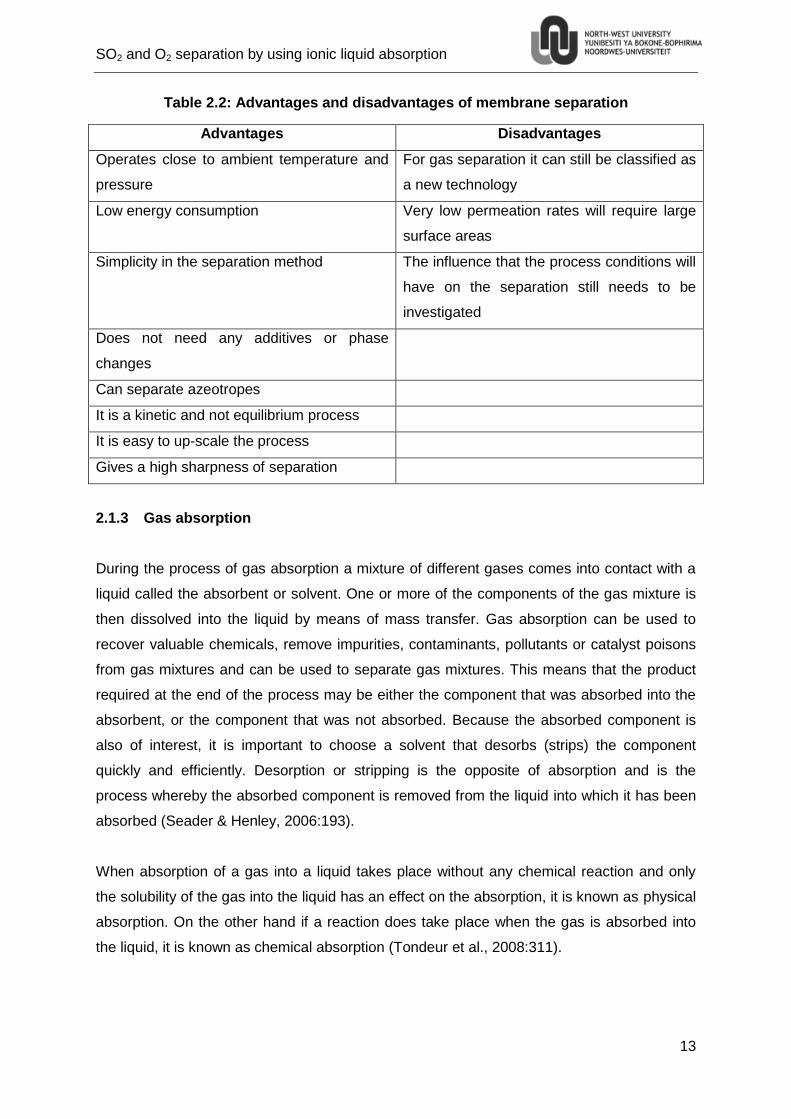
Table 2.2: Advantages and disadvantages of membrane separation
Advantages Disadvantages
Operates close to ambient temperature and
pressure
For gas separation it can still be classified as
a new technology
Low energy consumption Very low permeation rates will require large
surface areas
Simplicity in the separation method The influence that the process conditions will
have on the separation still needs to be
investigated
Does not need any additives or phase
changes
Can separate azeotropes
It is a kinetic and not equilibrium process
It is easy to up-scale the process
Gives a high sharpness of separation
2.1.3 Gas absorption
During the process of gas absorption a mixture of different gases comes into contact with a
liquid called the absorbent or solvent. One or more of the components of the gas mixture is
then dissolved into the liquid by means of mass transfer. Gas absorption can be used to
recover valuable chemicals, remove impurities, contaminants, pollutants or catalyst poisons
from gas mixtures and can be used to separate gas mixtures. This means that the product
required at the end of the process may be either the component that was absorbed into the
absorbent, or the component that was not absorbed. Because the absorbed component is
also of interest, it is important to choose a solvent that desorbs (strips) the component
quickly and efficiently. Desorption or stripping is the opposite of absorption and is the
process whereby the absorbed component is removed from the liquid into which it has been
absorbed (Seader & Henley, 2006:193).
When absorption of a gas into a liquid takes place without any chemical reaction and only
the solubility of the gas into the liquid has an effect on the absorption, it is known as physical
absorption. On the other hand if a reaction does take place when the gas is absorbed into
the liquid, it is known as chemical absorption (Tondeur et al., 2008:311).
SO2 and O2 separation by using ionic liquid absorption
14
Choosing the correct solvent for use in a specific process is very important. A good solvent
must have the following properties to ensure a good separation (Seader & Henley,
2006:201):
High solubility for the solute
Low volatility
Low viscosity
Stable
Non-corrosive
Non-foaming when in contact with the solute
Non-toxic
Not flammable
Easy availability
2.1.3.1 Gas absorption into water
Process description
The process description for the absorption into water is similar to the process description of
absorption in general. This was discussed in Section 2.1.3, where a general overview of
absorption was given.
Form literature the absorption of gas into water utilizes a physical absorption process
(Seader & Henley, 2006:195).
Applicability
The solubility of SO2 in water is 1 500 times more than the solubility of O2 in water (Le Roux
and Hattingh, 2010:13). SO2 has a solubility in water of 0.078 mol SO2/mol H2O at 30oC
(Perry & Green, 1997:2-124). Gorensek et al. (2009:43) also incorporated this into the
concept design of the HyS process, as can be seen in Figure 1.2. Jonker (2009:54)
investigated the possibility of scrubbing the stream from the decomposition reactor in the
HyS process with water. The assumption was made that only SO2, O2 and H2O were present
in the feed to the scrubber, which meant that the remaining acid in the stream from the
reactor had to be removed before the scrubber. The acid can be removed by a single knock-
out drum directly after the reactor. After this, the stream is cooled and decompressed to 21
bar and 40oC. At these conditions the stream would consist of a SO2-rich liquid and a
saturated vapour mixture. Therefore, a second knock-out drum is needed to separate the
SO2 and O2 separation by using ionic liquid absorption
15
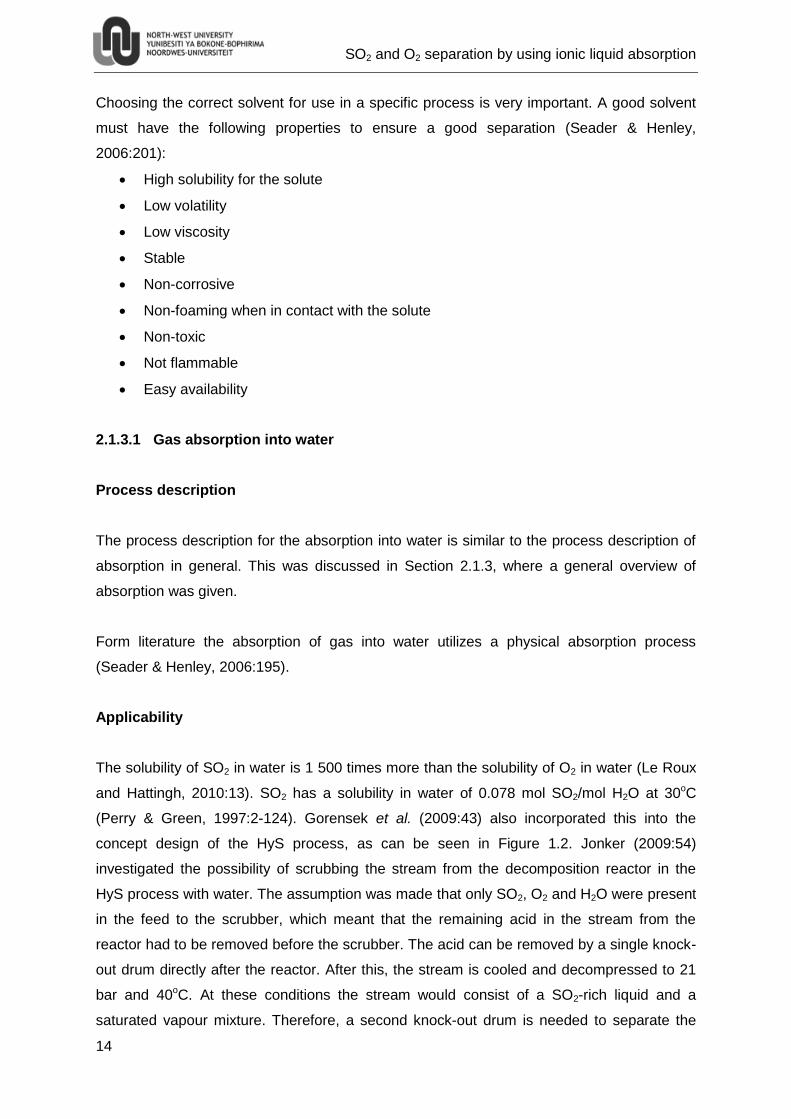
two phases before feeding to the scrubber. The knock-out drum is FL-01 in Figure 2.3.
Figure 2.3 shows the proposed flow diagram for the separation of SO2 and O2 by absorbing
the SO2 into water (Jonker, 2009:55). Jonker (2009:43) found that feed composition,
temperature and pressure have notable influences on the efficiency of the separation.
Feed
COM-01HX-01 HX-02
HX-05 HX-04
HX-03
AB-01
FL -01
SO
2
Wa
ter
an
d
SO
2
Wa
ter
O2
VV-01
VV-02
1
2 3 4 5
10
11
12
15 8
16 9
1314
67
Figure 2.3: Proposed SO2/O2 separation by means of a water scrubber (Jonker,
2009:55)
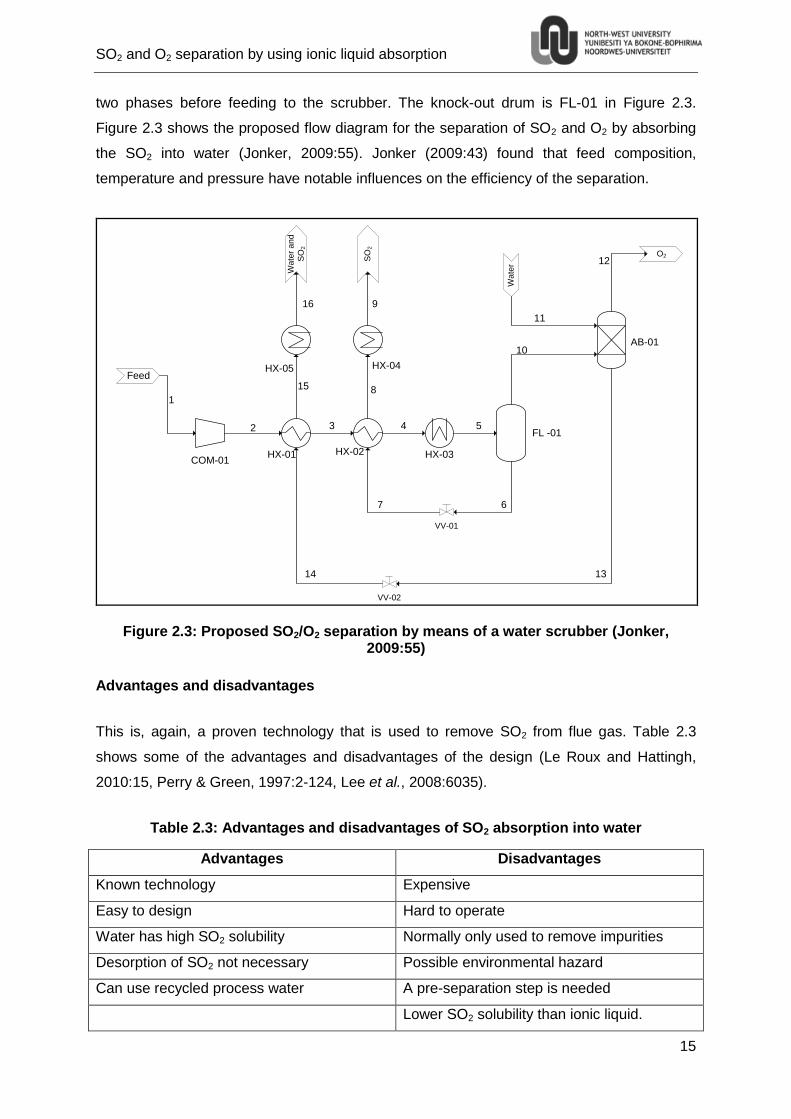
Advantages and disadvantages
This is, again, a proven technology that is used to remove SO2 from flue gas. Table 2.3
shows some of the advantages and disadvantages of the design (Le Roux and Hattingh,
2010:15, Perry & Green, 1997:2-124, Lee et al., 2008:6035).
Table 2.3: Advantages and disadvantages of SO2 absorption into water
Advantages Disadvantages
Known technology Expensive
Easy to design Hard to operate
Water has high SO2 solubility Normally only used to remove impurities
Desorption of SO2 not necessary Possible environmental hazard
Can use recycled process water A pre-separation step is needed
Lower SO2 solubility than ionic liquid.
SO2 and O2 separation by using ionic liquid absorption
16
2.1.3.2 Gas absorption into an ionic liquid
Process description
The process description and equipment used in the process of gas absorption into an ionic
liquid, and for the absorption into water, are similar. A detailed description of these points
was given in Section 2.1.3.
From literature there are three different opinions as to what type of process the absorption of
SO2 into an ionic liquid are. These opinions are that the absorption is a:
- Physical process (Huang et al., 2006a:4029, Ren et al., 2010:2179).
- Combination of a physical and chemical process (Ren et al., 2010:2179)
- Chemical process (Shiflett & Yokozeki, 2010:1375).
Huang et al. (2006b:4028) used H NMR spectra together with FT-IR spectra to show that no
new chemical bonds formed and only molecular SO2 were observed after the absorption into
the ionic liquids, which indicates that the SO2 is physically absorbed into the ionic liquids.
Ren et al. (2010:2179) compared the viscosity, conductivity and density of two groups of
ionic liquids (normal ionic liquids and task-specific ionic liquids) and concluded that the way
normal ionic liquids absorb SO2 is purely physical, but the task-specific ionic liquids uses a
combination of both chemical and physical absorption. Finally, Shiflett & Yokozeki,
(2010:1370) used an equation of state model to calculate excess (Gibbs, enthalpy and
entropy) functions as well as Henry’s law constants, which indicated that the ionic liquids
used chemical absorption to absorb the SO2 into the ionic liquid. This shows that it is not that
easy to determine with absolute certainty which absorption process is always applicable.
Applicability
Ionic liquids are made up of cations and anions. It is regarded as solvents of the future due
to its ability to absorb large amounts of certain gases and its regeneration ability. It is also
considered to be “green” solvents because it has very low volatility, which means that almost
no solvent will be lost due to evaporation (Wong et al., 2002:1089). Ionic liquids will be
discussed in more detail in Section 2.1.3.3 of this chapter.
In 2008, Lee et al. (2008:6034) suggested that the ionic liquid 1-Butyl-3-Methylimidazolium
methyl sulphate [BMIm][MeSO4] should be used as an absorbent for SO2 in the production of
hydrogen via thermochemical cycles. [BMIm][MeSO4] was selected as the most appropriate
SO2 and O2 separation by using ionic liquid absorption
17
absorbent for thermochemical cycles from a number of tested ionic liquids, because of its
thermal stability, high SO2 absorption and high initial absorption rate (Lee et al., 2008:6035).
Figure 2.4 shows the chemical structure of [BMIm][MeSO4].
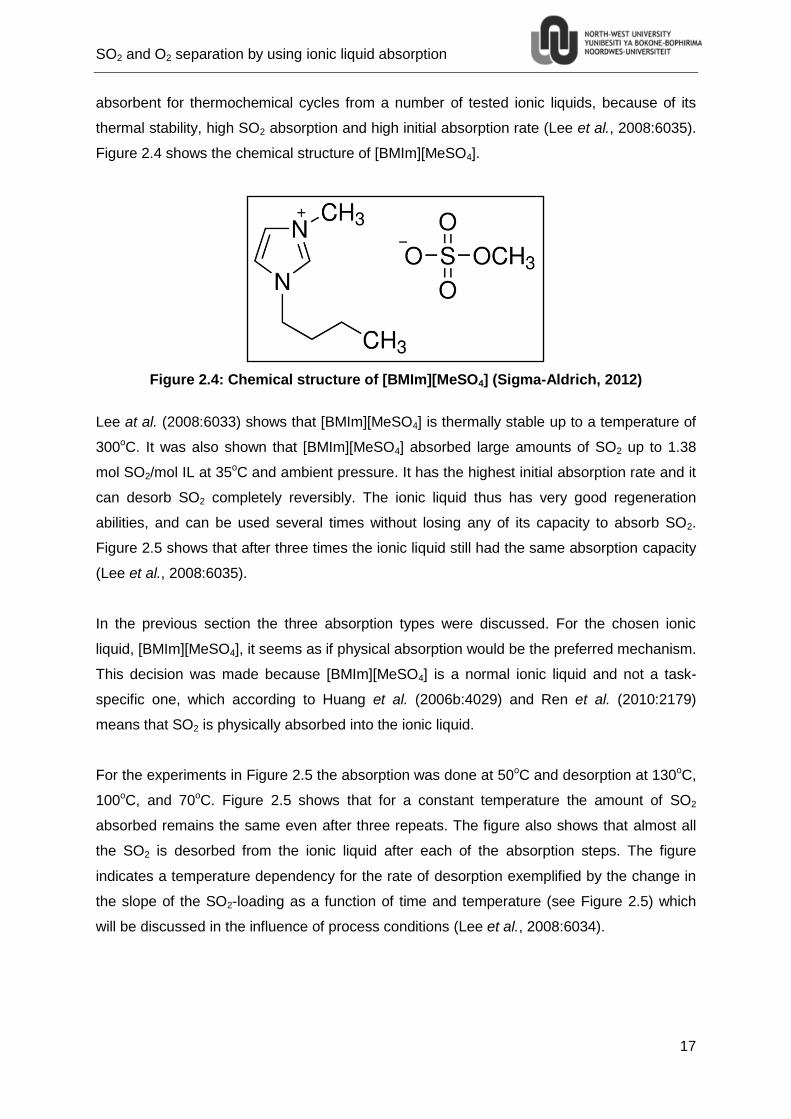
Figure 2.4: Chemical structure of [BMIm][MeSO4] (Sigma-Aldrich, 2012)
Lee at al. (2008:6033) shows that [BMIm][MeSO4] is thermally stable up to a temperature of
300oC. It was also shown that [BMIm][MeSO4] absorbed large amounts of SO2 up to 1.38
mol SO2/mol IL at 35oC and ambient pressure. It has the highest initial absorption rate and it
can desorb SO2 completely reversibly. The ionic liquid thus has very good regeneration
abilities, and can be used several times without losing any of its capacity to absorb SO2.
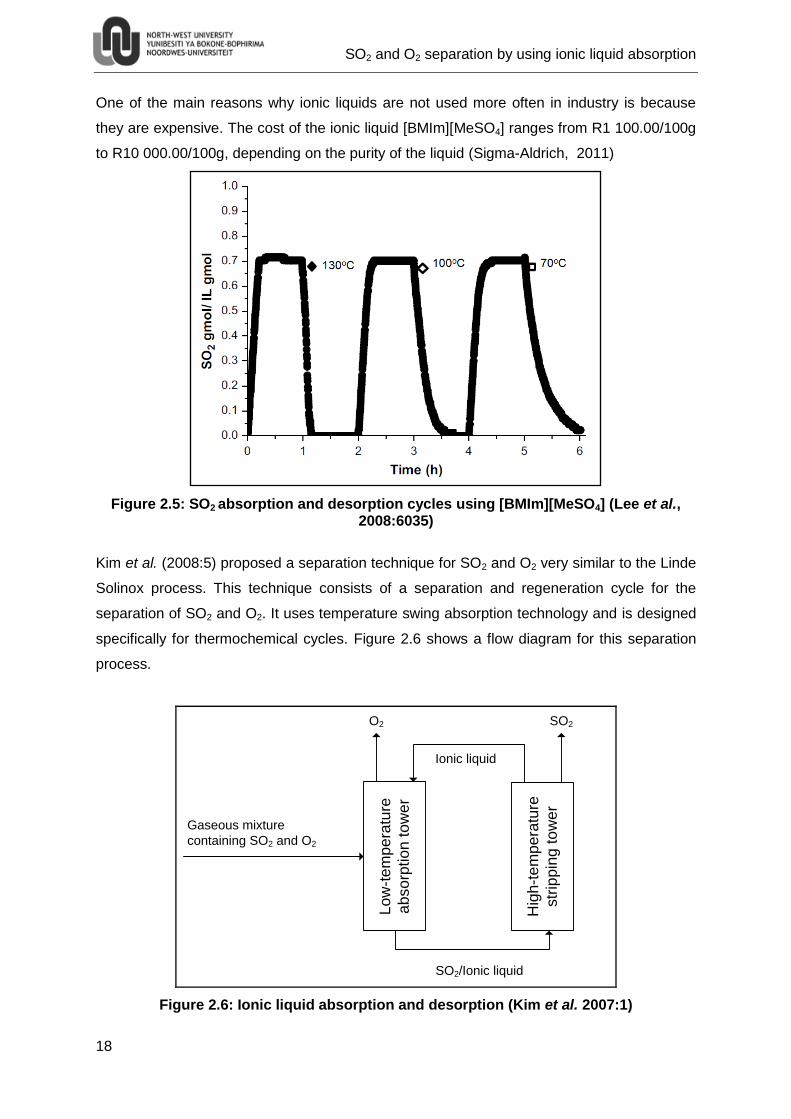
Figure 2.5 shows that after three times the ionic liquid still had the same absorption capacity
(Lee et al., 2008:6035).
In the previous section the three absorption types were discussed. For the chosen ionic
liquid, [BMIm][MeSO4], it seems as if physical absorption would be the preferred mechanism.
This decision was made because [BMIm][MeSO4] is a normal ionic liquid and not a task-
specific one, which according to Huang et al. (2006b:4029) and Ren et al. (2010:2179)
means that SO2 is physically absorbed into the ionic liquid.
For the experiments in Figure 2.5 the absorption was done at 50oC and desorption at 130oC,
100oC, and 70oC. Figure 2.5 shows that for a constant temperature the amount of SO2
absorbed remains the same even after three repeats. The figure also shows that almost all
the SO2 is desorbed from the ionic liquid after each of the absorption steps. The figure
indicates a temperature dependency for the rate of desorption exemplified by the change in
the slope of the SO2-loading as a function of time and temperature (see Figure 2.5) which
will be discussed in the influence of process conditions (Lee et al., 2008:6034).
SO2 and O2 separation by using ionic liquid absorption
18
One of the main reasons why ionic liquids are not used more often in industry is because
they are expensive. The cost of the ionic liquid [BMIm][MeSO4] ranges from R1 100.00/100g
to R10 000.00/100g, depending on the purity of the liquid (Sigma-Aldrich, 2011)
Figure 2.5: SO2 absorption and desorption cycles using [BMIm][MeSO4] (Lee et al., 2008:6035)
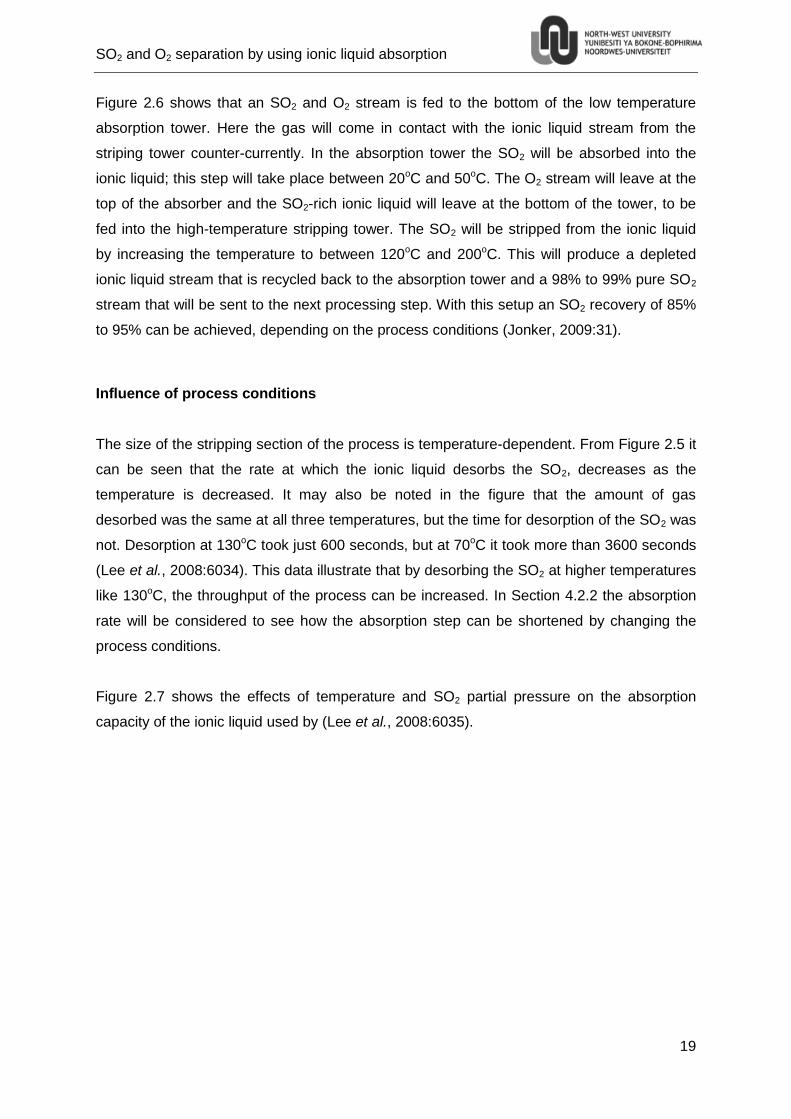
Kim et al. (2008:5) proposed a separation technique for SO2 and O2 very similar to the Linde
Solinox process. This technique consists of a separation and regeneration cycle for the
separation of SO2 and O2. It uses temperature swing absorption technology and is designed
specifically for thermochemical cycles. Figure 2.6 shows a flow diagram for this separation
process.
Lo
w-t
em
pe
ratu
re
ab
so
rptio
n to
we
r
Hig
h-t
em
pe
ratu
re
str
ipp
ing
to
we
r
Gaseous mixture
containing SO2 and O2
O2
SO2/Ionic liquid
SO2
Ionic liquid
Figure 2.6: Ionic liquid absorption and desorption (Kim et al. 2007:1)
SO2 and O2 separation by using ionic liquid absorption
19
Figure 2.6 shows that an SO2 and O2 stream is fed to the bottom of the low temperature
absorption tower. Here the gas will come in contact with the ionic liquid stream from the
striping tower counter-currently. In the absorption tower the SO2 will be absorbed into the
ionic liquid; this step will take place between 20oC and 50oC. The O2 stream will leave at the
top of the absorber and the SO2-rich ionic liquid will leave at the bottom of the tower, to be
fed into the high-temperature stripping tower. The SO2 will be stripped from the ionic liquid
by increasing the temperature to between 120oC and 200oC. This will produce a depleted
ionic liquid stream that is recycled back to the absorption tower and a 98% to 99% pure SO2
stream that will be sent to the next processing step. With this setup an SO2 recovery of 85%
to 95% can be achieved, depending on the process conditions (Jonker, 2009:31).
Influence of process conditions
The size of the stripping section of the process is temperature-dependent. From Figure 2.5 it
can be seen that the rate at which the ionic liquid desorbs the SO2, decreases as the
temperature is decreased. It may also be noted in the figure that the amount of gas
desorbed was the same at all three temperatures, but the time for desorption of the SO2 was
not. Desorption at 130oC took just 600 seconds, but at 70oC it took more than 3600 seconds
(Lee et al., 2008:6034). This data illustrate that by desorbing the SO2 at higher temperatures
like 130oC, the throughput of the process can be increased. In Section 4.2.2 the absorption
rate will be considered to see how the absorption step can be shortened by changing the
process conditions.
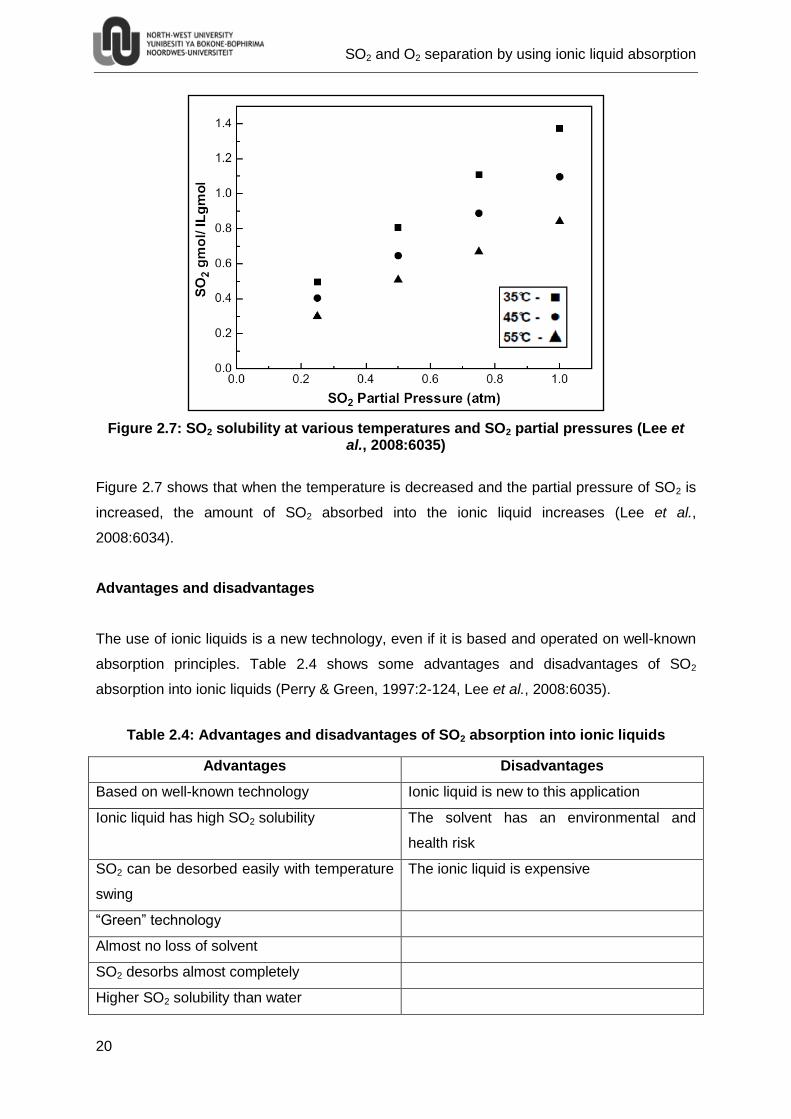
Figure 2.7 shows the effects of temperature and SO2 partial pressure on the absorption
capacity of the ionic liquid used by (Lee et al., 2008:6035).
SO2 and O2 separation by using ionic liquid absorption
20
Figure 2.7: SO2 solubility at various temperatures and SO2 partial pressures (Lee et al., 2008:6035)
Figure 2.7 shows that when the temperature is decreased and the partial pressure of SO2 is
increased, the amount of SO2 absorbed into the ionic liquid increases (Lee et al.,
2008:6034).
Advantages and disadvantages
The use of ionic liquids is a new technology, even if it is based and operated on well-known
absorption principles. Table 2.4 shows some advantages and disadvantages of SO2
absorption into ionic liquids (Perry & Green, 1997:2-124, Lee et al., 2008:6035).
Table 2.4: Advantages and disadvantages of SO2 absorption into ionic liquids
Advantages Disadvantages
Based on well-known technology Ionic liquid is new to this application
Ionic liquid has high SO2 solubility The solvent has an environmental and
health risk
SO2 can be desorbed easily with temperature
swing
The ionic liquid is expensive
“Green” technology
Almost no loss of solvent
SO2 desorbs almost completely
Higher SO2 solubility than water
SO2 and O2 separation by using ionic liquid absorption
21
2.1.3.3 Absorption modelling
It is very important to be able to predict what the absorption capabilities of the solvent will be
under conditions that are outside the range used in the study. To do this the results obtained
from the experiments will be modelled using one of the isotherms discussed below. The
fitting of the model will be discussed in Section 4.3.
Langmuir isotherm
The Langmuir equation was derived from simple mass-action kinetics, assuming
chemisorption. This equation also assumes that the surface of the pores of the adsorbent is
homogeneous and that the forces acting between the adsorbed molecules are negligible. It
is restricted to type I isotherms which corresponds to unimolecular adsorption and has a
maximum limit in the amount adsorbed. Although the equation was originally devised for only
chemisorptions, it has been widely applied to physical adsorption as well (Seader & Henley,
2006:559).
The Langmuir equation can be expressed as follows for an absorption system (Locati et al.,
2009:456):
Equation 2.1
Where:
q – Amount of SO2 absorbed into the ionic liquid (mol SO2/mol IL).
qmax – Maximum amount of SO2 absorbed into the ionic liquid (mol SO2/mol IL).
k – The dissolution constant.
P – The partial pressure of SO2 in the feed gas stream
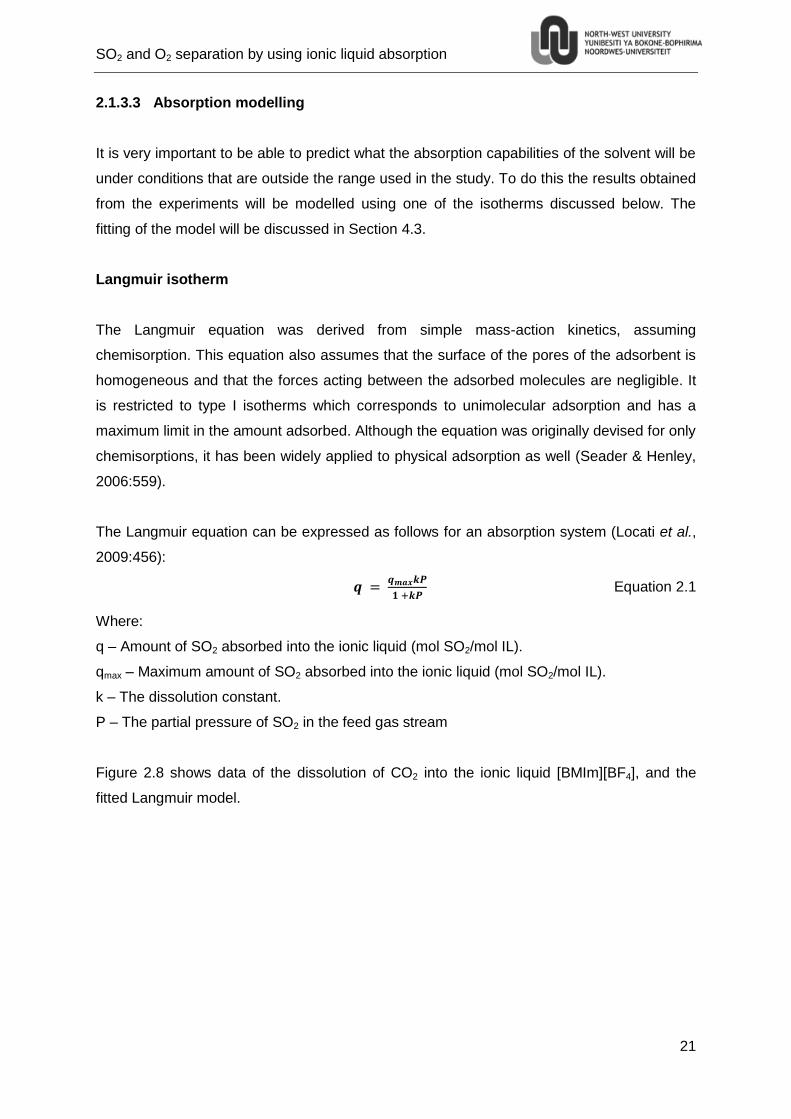
Figure 2.8 shows data of the dissolution of CO2 into the ionic liquid [BMIm][BF4], and the
fitted Langmuir model.
SO2 and O2 separation by using ionic liquid absorption
22
Figure 2.8: CO2 dissolution into ionic liquid [BMIm][BF4] with fitted Langmuir model (Locati et al., 2009:455)
Locati et al. (2009:456) observed that the solvation energy does not change much when the
molar fraction of the CO2 is chanced from zero to 0.2. Locati et al. (2009:456) then
anticipated that the solvation mechanism would not change in this range, which can be
described by a Langmuir type dissolution mechanism. Hence the data in Figure 2.8 is fitted
with the Langmuir model. Figure 2.8 show that the Langmuir model fits the above data well,
although no reference to the error of the fitted model was given in the paper. However, it
can visually be concluded that this model is valid to describe gas absorption into ionic
liquids.
Henry’s law
The solubility of a gas into a liquid is normally described in terms of Henry’s law, provided
that the solubility of the gas into the liquid is low and no chemical absorption takes place
(Anthony et al., 2002:7317). For gases with a high solubility into the liquid, Henry’s law may
not be applicable, even if the partial pressure of the gas is low (Seader & Henley, 2006:145).
Equation 2.2 shows Henry’s law (Anthony et al., 2002:7317):
Equation 2.2
Where:
H – Henry’s constant
P – Pressure of the gas
x – Mole fraction of the gas dissolved in the ionic liquid phase.
SO2 and O2 separation by using ionic liquid absorption
23
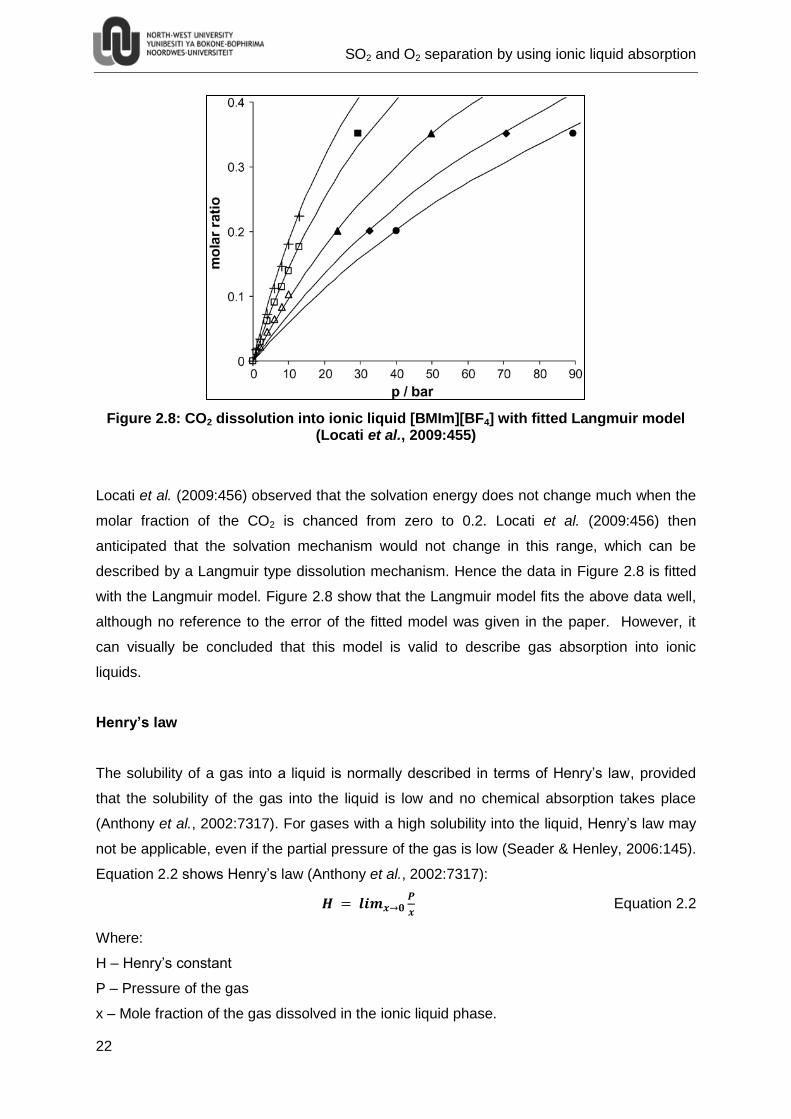
Thus if a graph of pressure versus mole fraction forms a straight line, Henry’s law is
applicable for that system. Figure 2.9 shows data of the solubility of C2H4 in the ionic liquid
[bmim][PF6] at three temperatures.
Figure 2.9: C2H4 solubility in [BMIm][PF6] at 10, 25 and 50oC (Anthony et al., 2002:7317)
From Figure 2.9 it may be seen that the data forms a straight line on the mole fraction versus
pressure graph, therefore Henry’s law is applicable for this data. A plot of the Henry’s law
model is represented by the three solids lines in the above figure.
Freundlich isotherm
The Freundlich isotherm is derived by assuming a heterogeneous sorbent with a nonuniform
distribution of the heat of adsorption (Seader & Henley, 2006:561). This isotherm also
assumes that there are many types of sites that act simultaneously, each site with a different
free energy of sorption and that there is a large amount of sites available for adsorption
(García-Zubiri et al., 2009:11). Equation 2.3 shows the Freundlich equation:
Equation 2.3
Where:
q – Amount of SO2 absorbed into the ionic liquid (mol SO2/mol IL).
P – The partial pressure of SO2 in the feed gas stream.
kF – Freundlich constant
nF – Freundlich exponent
SO2 and O2 separation by using ionic liquid absorption
24
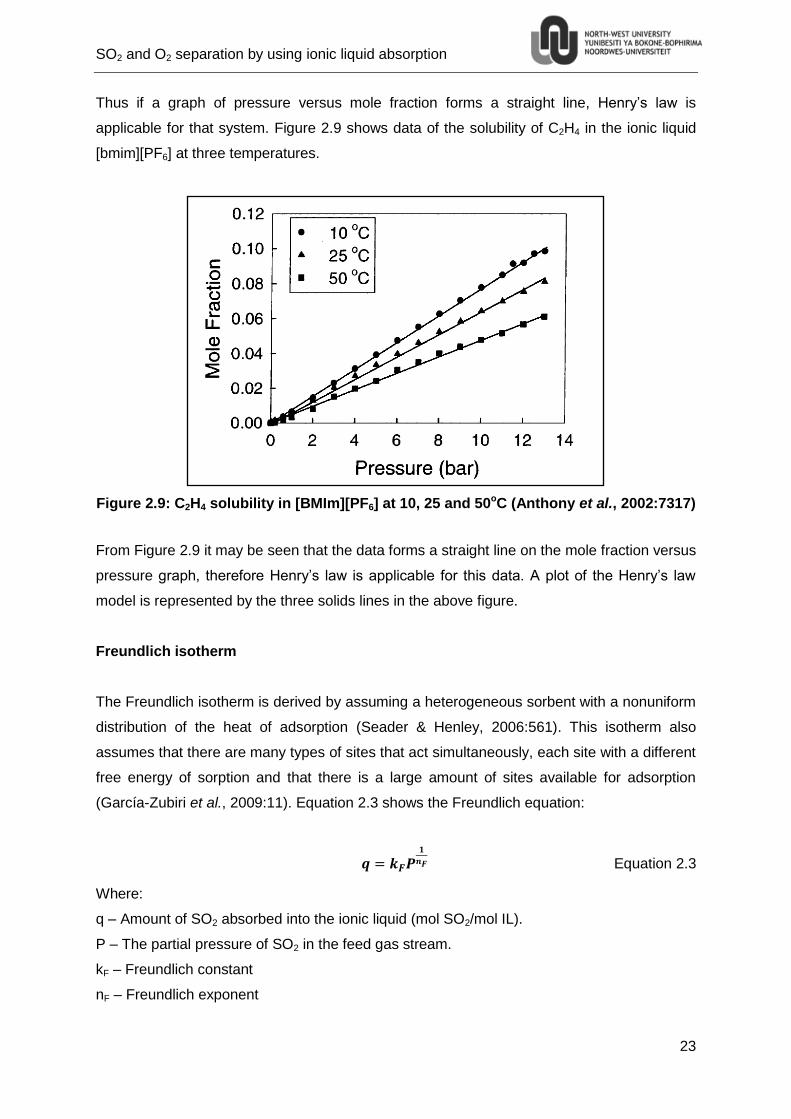
Figure Figure 2.10 shows data of the adsorption of 2,2,4-trimethylpentane on a hydrocarbon
adsorber at three different temperatures. The figure also shows the fitting of the Freundlich
as well as the Langmuir isotherms to the data.
Figure 2.10: Adsorption isotherms of 2,2,4-trimethylpentane on a hydrocarbon adsorber (Kim, 2004:292)
Figure 2.10 shows the diference between the Freundlich and the Langmuir isotherms for one
set of data. The reason that the Freundlich isotherm fits the data better than the Langmuir
isotherm can be attributed to the heterogeneity of the adsorber. One of the limitations of the
Freundlich isotherm is that it assumes there is no adsorption limit (García-Zubiri et al.,
2009:11).
2.2 Ionic liquid
Ionic liquids have been around for over a century. In 1888 ethanol ammonium nitrate, with a
melting point of 52-55oC, was reported. In 1914 the room-temperature ionic liquid ethyl
ammonium nitrate was first synthesized. During the rest of the century the progress was
slow, but recently the interest in ionic liquids has increased dramatically to a point where the
SO2 and O2 separation by using ionic liquid absorption
25
number of publications on ionic liquids has increased from below 50 in 1995 to just over
1 600 in 2008. In 2004 the first publicly announced industrial application of ionic liquids the
Biphasic Acid Scavenging utilizing Ionic Liquids (BASIL) process was used by BASF. Ionic
liquids also have a large number of other potential industrial applications, such as: catalytic
reactions, gas separations, liquid-liquid extractions, electrochemistry, fuel cells,
biotechnology especially for biocatalysts, synthesis of RNA and DNA oligomers and have
been used to synthesize novel polymers and nanomaterials (Ren, 2009).
The general definition of ionic liquids is that they are a special class of molten salts existing
in the liquid state below 100oC, and have a large temperature range within which they are
stable liquids (Pereiro et al., 2007:377). Ionic liquids consist of anions and cations and are
named as [cation][anion] (Ren, 2009:3). One of the most important features of ionic liquids is
the fact that, by changing the cation and anion on the molecule, the properties of the liquid
can be changed to suit certain conditions and criteria. It has been estimated that there are
up to 1014 different combinations of ionic liquids (Ren, 2009:7). The properties of the ionic
liquids are determined by the anion and cation functional groups used on the ionic liquid.
Thus, an ionic liquid having specific properties can be constructed. Some of the properties
important for this study are the solubility of SO2, viscosity of the ionic liquid, stable
temperature range, purity of ionic liquid and its volumetric properties (Ren, 2009:8). Ionic
liquids also have negligible vapour pressures, which means that they do not evaporate at
room temperature making them potential “green” solvents (Manan et al., 2009:2005).
2.2.1 Ionic liquid properties
The interaction between the structure and properties of ionic liquids must be known before
ionic liquids can be selected for certain processes. Prior research shows that the anion of
the ionic liquid has an influence on most of its properties. For the cation, the alkyl chain
length and functional alkyl chain added are also of some importance to the properties of the
ionic liquid. In this section, some of the different types of ionic liquids, the melting points and
thermal stabilities, volumetric properties and viscosities of ionic liquids will be discussed
(Ren, 2009:7).
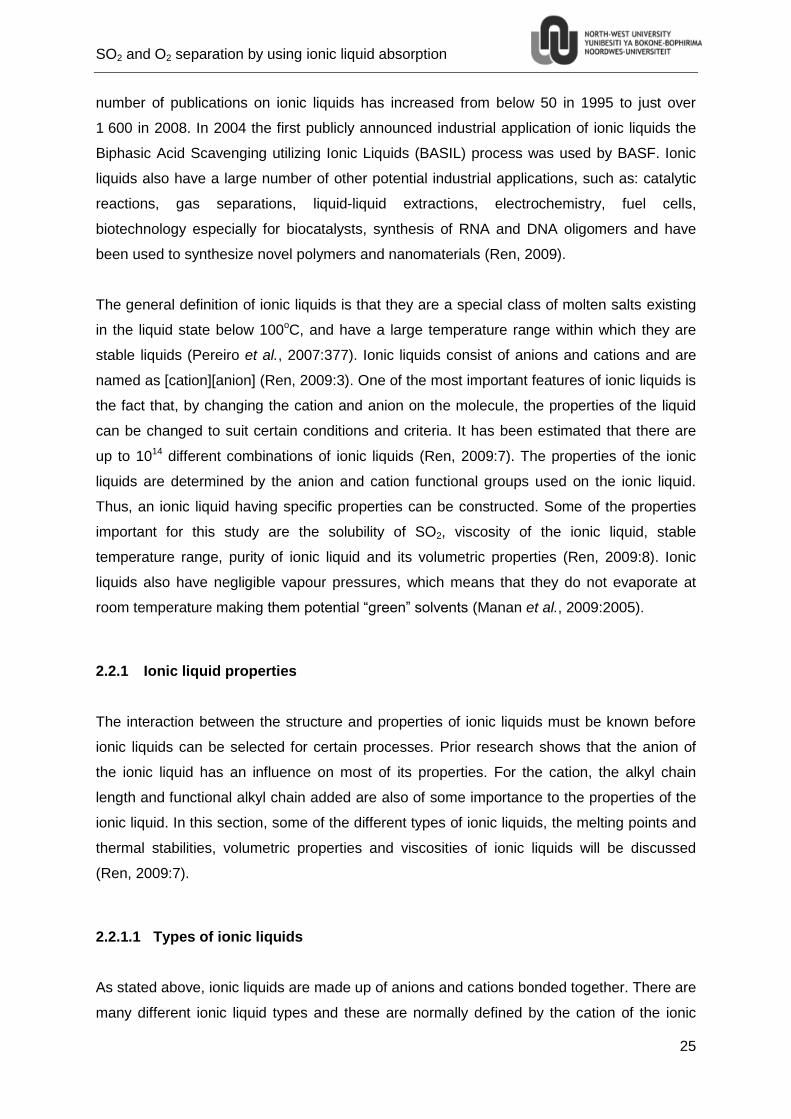
2.2.1.1 Types of ionic liquids
As stated above, ionic liquids are made up of anions and cations bonded together. There are
many different ionic liquid types and these are normally defined by the cation of the ionic
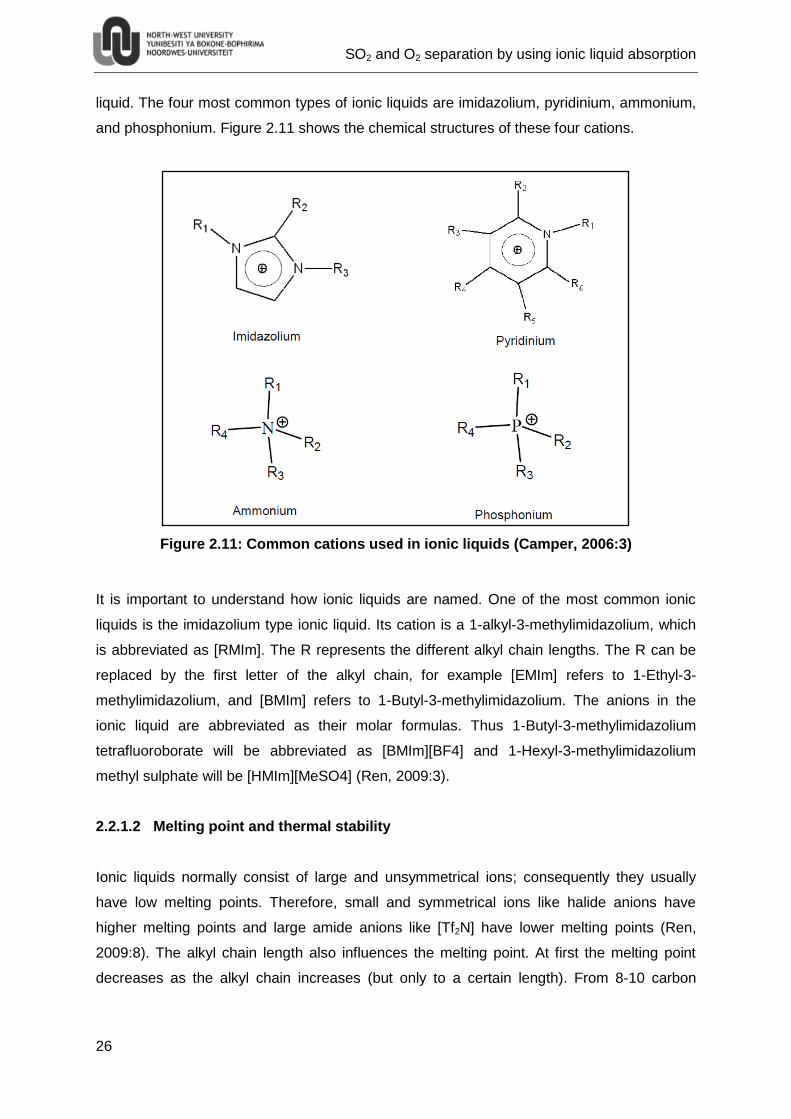
SO2 and O2 separation by using ionic liquid absorption
26
liquid. The four most common types of ionic liquids are imidazolium, pyridinium, ammonium,
and phosphonium. Figure 2.11 shows the chemical structures of these four cations.
Figure 2.11: Common cations used in ionic liquids (Camper, 2006:3)
It is important to understand how ionic liquids are named. One of the most common ionic
liquids is the imidazolium type ionic liquid. Its cation is a 1-alkyl-3-methylimidazolium, which
is abbreviated as [RMIm]. The R represents the different alkyl chain lengths. The R can be
replaced by the first letter of the alkyl chain, for example [EMIm] refers to 1-Ethyl-3-
methylimidazolium, and [BMIm] refers to 1-Butyl-3-methylimidazolium. The anions in the
ionic liquid are abbreviated as their molar formulas. Thus 1-Butyl-3-methylimidazolium
tetrafluoroborate will be abbreviated as [BMIm][BF4] and 1-Hexyl-3-methylimidazolium
methyl sulphate will be [HMIm][MeSO4] (Ren, 2009:3).
2.2.1.2 Melting point and thermal stability
Ionic liquids normally consist of large and unsymmetrical ions; consequently they usually
have low melting points. Therefore, small and symmetrical ions like halide anions have
higher melting points and large amide anions like [Tf2N] have lower melting points (Ren,
2009:8). The alkyl chain length also influences the melting point. At first the melting point
decreases as the alkyl chain increases (but only to a certain length). From 8-10 carbon
SO2 and O2 separation by using ionic liquid absorption
27
atoms in the alkyl chain, the melting point increases when the alkyl chain increases. This
happens due to the difficulty of ion packing (Huddleston et al., 2001:159).
The thermal stability of an ionic liquid is an important property when it is being used as an
absorbent, because the absorption normally takes place at low temperatures and desorption
at high temperatures. For this reason the very wide liquid range of ionic liquids is an
essential feature. The ionic liquids have such a wide liquid range that the only other solvents
that can perhaps match them are liquid polymers (Anderson, 2008:2). The factor that has the
largest influence on the thermal stability of ionic liquids is the anion used in the ionic liquid.
The influence of the cation on the thermal stability is negligible in comparison with the anion.
Therefore, before choosing an ionic liquid it is important to know what the conditions in the
process will be to insure that the liquid is stable within that temperature range.
2.2.1.3 Volumetric properties
The two main volumetric properties are compressibility and expansion upon absorption of
the ionic liquid. It was found that the general trend for ionic liquids is to become more
compressible when the temperature is increased. On the other hand, when the pressure is
increased the ionic liquid becomes less compressible. It should be noted that the data used
to draw this conclusion had very large standard deviations and the compressibility under
changing pressure could be considered constant. The isothermal compressibilities of ionic
liquids are similar to those of water and high-temperature molten salts. They are less
compressible than organic solvents because there are very strong Coulombic interactions
between the ions (Gardas et al., 2007:84).
Gardas et al. (2007:85) also studied the isobaric expansion upon absorption of a few ionic
liquids. It was found that the ionic liquid does not notably expand with an increase in
temperature.
When CO2 is absorbed into normal organic liquids, the volume normally increases. The
classical definition of volume expansion is based on the change in the absolute volume of
the liquid. Equation 2.4 shows this definition where VL is the volume of the entire liquid at a
specific temperature and pressure while V2 is the volume of the pure liquid at the same
temperature and ambient pressure (Aki et al., 2004:20363).
( ) ( )
( ) Equation 2.4
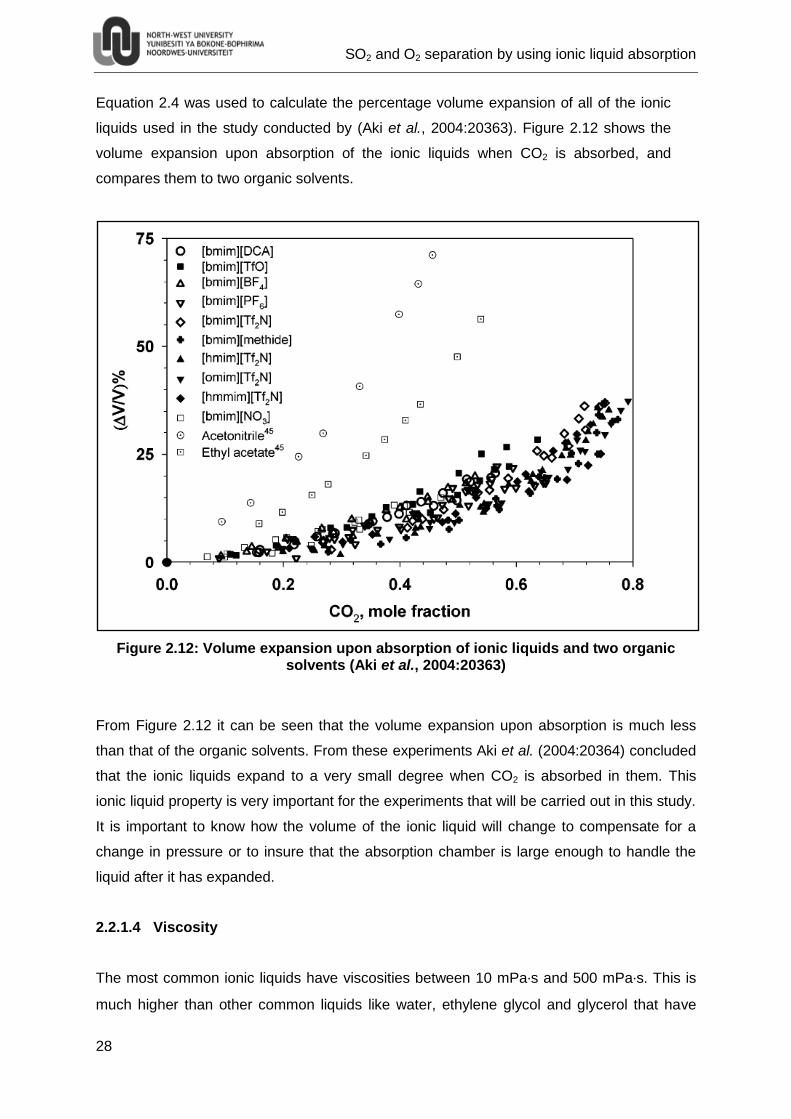
SO2 and O2 separation by using ionic liquid absorption
28
Equation 2.4 was used to calculate the percentage volume expansion of all of the ionic
liquids used in the study conducted by (Aki et al., 2004:20363). Figure 2.12 shows the
volume expansion upon absorption of the ionic liquids when CO2 is absorbed, and
compares them to two organic solvents.
Figure 2.12: Volume expansion upon absorption of ionic liquids and two organic solvents (Aki et al., 2004:20363)
From Figure 2.12 it can be seen that the volume expansion upon absorption is much less
than that of the organic solvents. From these experiments Aki et al. (2004:20364) concluded
that the ionic liquids expand to a very small degree when CO2 is absorbed in them. This
ionic liquid property is very important for the experiments that will be carried out in this study.
It is important to know how the volume of the ionic liquid will change to compensate for a
change in pressure or to insure that the absorption chamber is large enough to handle the
liquid after it has expanded.
2.2.1.4 Viscosity
The most common ionic liquids have viscosities between 10 mPa·s and 500 mPa·s. This is
much higher than other common liquids like water, ethylene glycol and glycerol that have
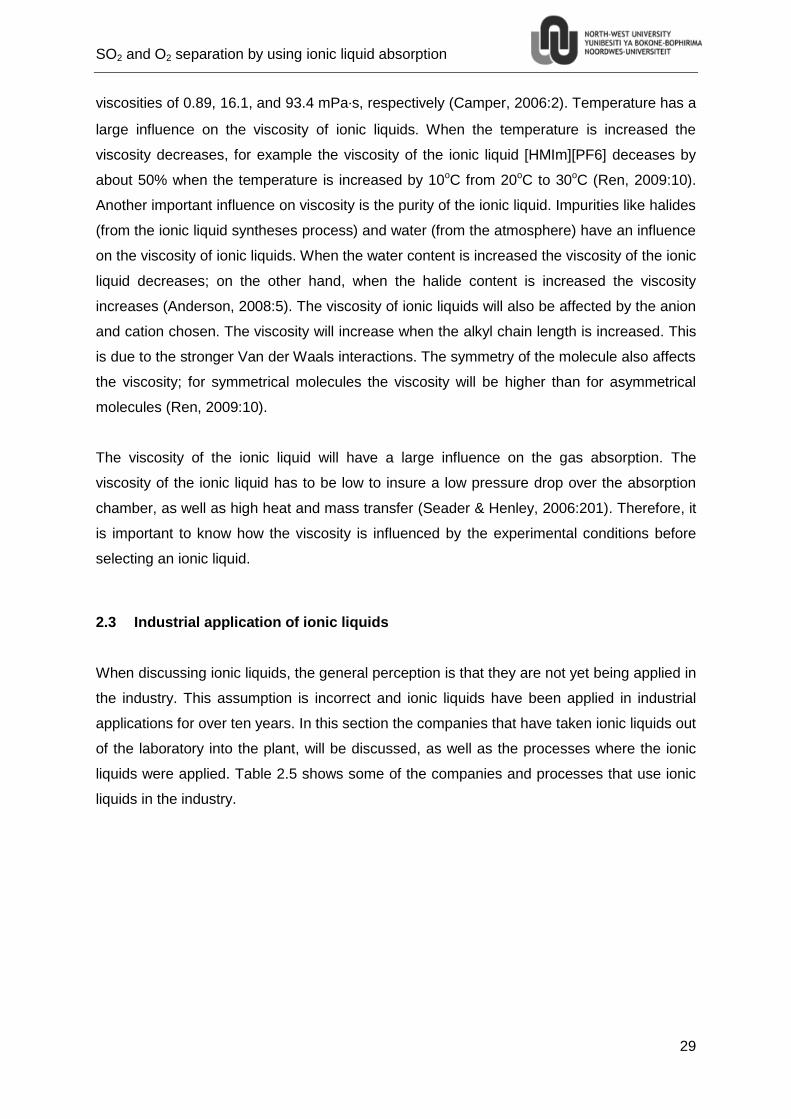
SO2 and O2 separation by using ionic liquid absorption
29
viscosities of 0.89, 16.1, and 93.4 mPa·s, respectively (Camper, 2006:2). Temperature has a
large influence on the viscosity of ionic liquids. When the temperature is increased the
viscosity decreases, for example the viscosity of the ionic liquid [HMIm][PF6] deceases by
about 50% when the temperature is increased by 10oC from 20oC to 30oC (Ren, 2009:10).
Another important influence on viscosity is the purity of the ionic liquid. Impurities like halides
(from the ionic liquid syntheses process) and water (from the atmosphere) have an influence
on the viscosity of ionic liquids. When the water content is increased the viscosity of the ionic
liquid decreases; on the other hand, when the halide content is increased the viscosity
increases (Anderson, 2008:5). The viscosity of ionic liquids will also be affected by the anion
and cation chosen. The viscosity will increase when the alkyl chain length is increased. This
is due to the stronger Van der Waals interactions. The symmetry of the molecule also affects
the viscosity; for symmetrical molecules the viscosity will be higher than for asymmetrical
molecules (Ren, 2009:10).
The viscosity of the ionic liquid will have a large influence on the gas absorption. The
viscosity of the ionic liquid has to be low to insure a low pressure drop over the absorption
chamber, as well as high heat and mass transfer (Seader & Henley, 2006:201). Therefore, it
is important to know how the viscosity is influenced by the experimental conditions before
selecting an ionic liquid.
2.3 Industrial application of ionic liquids
When discussing ionic liquids, the general perception is that they are not yet being applied in
the industry. This assumption is incorrect and ionic liquids have been applied in industrial
applications for over ten years. In this section the companies that have taken ionic liquids out
of the laboratory into the plant, will be discussed, as well as the processes where the ionic
liquids were applied. Table 2.5 shows some of the companies and processes that use ionic
liquids in the industry.
SO2 and O2 separation by using ionic liquid absorption
30
Table 2.5: Companies and processes that use ionic liquids in the industry
Company Process description
BASF The BASILTM process was the first publicly announced commercial process
utilising ionic liquids. It was introduced in Germany at the BASF site in
Ludwigshafen in 2002. After ionic liquids were introduced into the process,
the yield increased from 50 to 98% (Plechkova & Seddon, 2008:135).
Ionic liquids have been used as entrainers or separation enhancers. The
ionic liquid can then be used to break common azeotropes like water-
tetrahydrofuran and water-ethanol. This reduces the cost of separation
significantly (Plechkova & Seddon, 2008:136).
For the reaction of butan-1,4-diol with phosgene BASF discovered that
hydrogen chloride in ionic liquids can replace phosgene. When the reaction
is repeated with hydrogen chloride in ionic liquids, the product is almost
pure with 98% selectivity (Plechkova & Seddon, 2008:136).
Eastman
Chemical
Company
The BASILTM process discussed above was the first publicly announced
process utilizing ionic liquids. However, the Eastman chemical company
had been running a process for the isomerisation of 3,4-epoxybut-1-ene to
2,5-dihydrofuran since December of 1996. (Plechkova & Seddon,
2008:137).
IFP (Institut
français du
pétrole)
BASF and Eastman chemical company commercialised the first processes
using ionic liquids. IFP on the other hand operated the first pilot plant using
ionic liquid. The Dimersol process consists of the dimerisation of alkenes,
like propene and butane, to hexenes and octenes. (Plechkova & Seddon,
2008:137).
Air Products A very exciting new technology was presented at the first International
congress on ionic liquids by Dan Temple of Air products. This new
technology can be used to store dangerous gases. It is at least twice as
efficient as the normal processes that use adsorption of the gases onto
solids. (Plechkova & Seddon, 2008:140).
LoLiTec LoLiTec is a new company and specialises in developing applications for
ionic liquids. One of the applications that they have developed is a practical
and efficient way to clean high value and sensitive surfaces. Figure 2.13
shows the improvement when an ionic liquid is used to clean the spray
nozzle.
SO2 and O2 separation by using ionic liquid absorption
31
Figure 2.13: A spay nozzle after 10 hours of operation. Nozzle for aqueous sodium chloride solutions (left) and ionic liquid (right) (Plechkova & Seddon, 2008:141)
The companies mentioned in Table 2.5 are only a few that are researching and
implementing ionic liquids in industry. Some of the other companies that were not discussed
above are (Plechkova & Seddon, 2008:144):
Degussa
Central Glass Co. Ltd., Japan
BP
ExxonMobil
Chevron and Chevron Phillips
PetroChina
Eli Lilly
Pionics
Scionix
Linde
2.4 Future of ionic liquids
In the past few years the field of ionic liquids has grown remarkably quickly. The number of
applications for ionic liquids and the diversity of the applications are remarkable. Figure 2.14
shows some of the applications of ionic liquids that can be expected in the future (Plechkova
& Seddon, 2008:145).
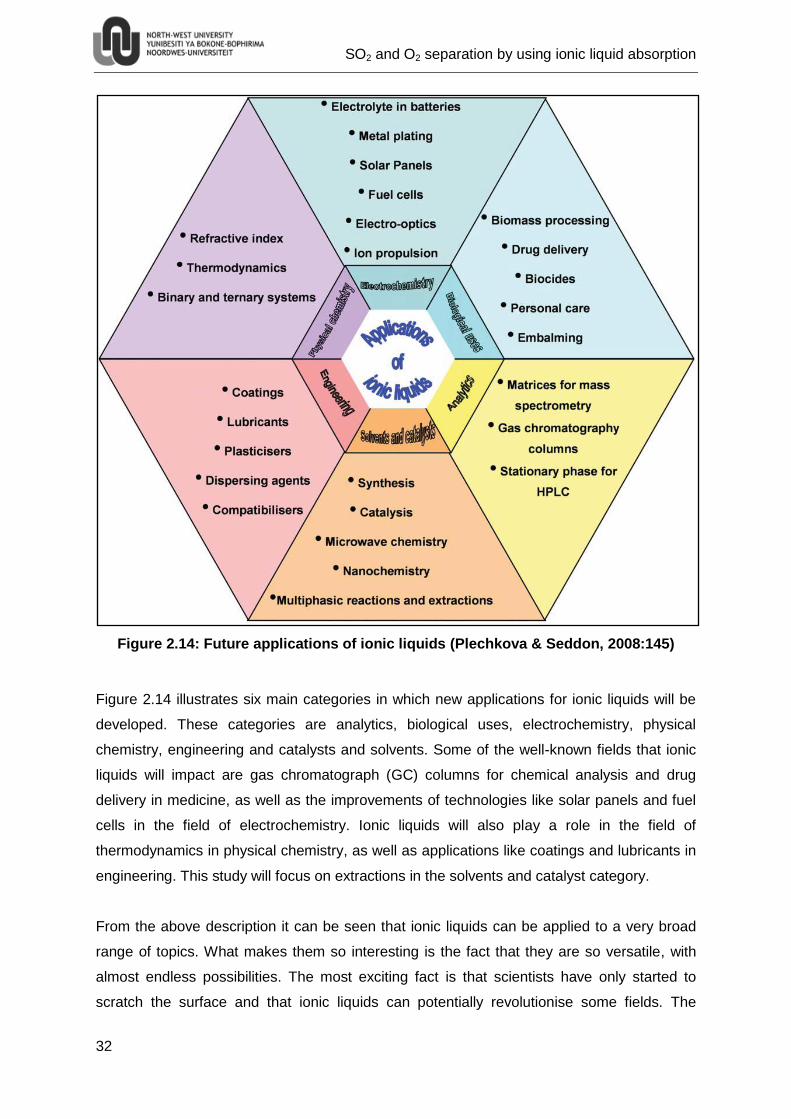
SO2 and O2 separation by using ionic liquid absorption
32
Figure 2.14: Future applications of ionic liquids (Plechkova & Seddon, 2008:145)
Figure 2.14 illustrates six main categories in which new applications for ionic liquids will be
developed. These categories are analytics, biological uses, electrochemistry, physical
chemistry, engineering and catalysts and solvents. Some of the well-known fields that ionic
liquids will impact are gas chromatograph (GC) columns for chemical analysis and drug
delivery in medicine, as well as the improvements of technologies like solar panels and fuel
cells in the field of electrochemistry. Ionic liquids will also play a role in the field of
thermodynamics in physical chemistry, as well as applications like coatings and lubricants in
engineering. This study will focus on extractions in the solvents and catalyst category.
From the above description it can be seen that ionic liquids can be applied to a very broad
range of topics. What makes them so interesting is the fact that they are so versatile, with
almost endless possibilities. The most exciting fact is that scientists have only started to
scratch the surface and that ionic liquids can potentially revolutionise some fields. The
SO2 and O2 separation by using ionic liquid absorption
33
following section looks at what results is expected to be obtained during the experiments
described in Chapter 3.
2.5 Hypothesis
The amount of SO2 absorbed and the rate at which the SO2 is absorbed is influenced by the
pressure, temperature, feed composition and purity of the ionic liquid.
Several hypotheses will be tested during this study:
For low ionic liquid temperatures of 30oC the amount of SO2 absorbed is more than
when the temperature is increased to 60oC, but the absorption rate will increase with
an increase in temperature.
If the feed composition of SO2 is increased from 0 mol% SO2 to 100 mol% SO2, the
absorption rate of SO2 will also be increased.
The absorbed SO2 will desorb if the ionic liquid temperature is above 120oC.
When the feed pressure of SO2 is increased from 1.5 bar (a) to 3 bar (a) and feed
pressure of O2 is increased from 1.5 bar (a) to 9 bar (a) the amount of each gas
absorbed will increase.
The amount of O2 that is absorbed by the ionic liquid is negligibly small.
The 98% pure ionic liquid will absorb more SO2 than the 95% pure ionic liquid.

SO2 and O2 separation by using ionic liquid absorption
34
SO2 and O2 separation by using ionic liquid absorption
35
3. Chapter 3
Experimental
3.1 Introduction
In this chapter all the materials, such as the gases and the ionic liquids that were used, will
be discussed. Then the experimental setup and equipment of both the pressure and
temperature experiments will be introduced, thereafter the experimental procedures and
experimental planning for both experiments will be discussed in detail. Finally the expected
hypotheses for the experimental results will be given.
3.2 Materials used
This section discusses the different gases and the ionic liquids used in the study.
3.2.1 Gases
For this study two gases were used:
- Oxygen (O2)
- Sulphur dioxide (SO2)
Both of these gases were purchased from Afrox and used as received. The O2 is ultra-high
purity (UHP) O2 with a purity of 99.995%. SO2 is stored in liquid form and has a purity of
99.9%. The corrosive nature of SO2 was kept in mind during the design of the equipment.
The MSDSs of these two gases can be found in Appendix F, on the CD included.
3.2.2 Ionic liquids
For this study the ionic liquid 1-Butyl-3-methylimidazolium methyl sulphate [BMIm][MeSO4],
with purities of 95% and 98% will be used in the experiments. The 95% pure ionic liquid was
obtained from Sigma-Aldrich while the 98% pure ionic liquid was purchased from Merck.
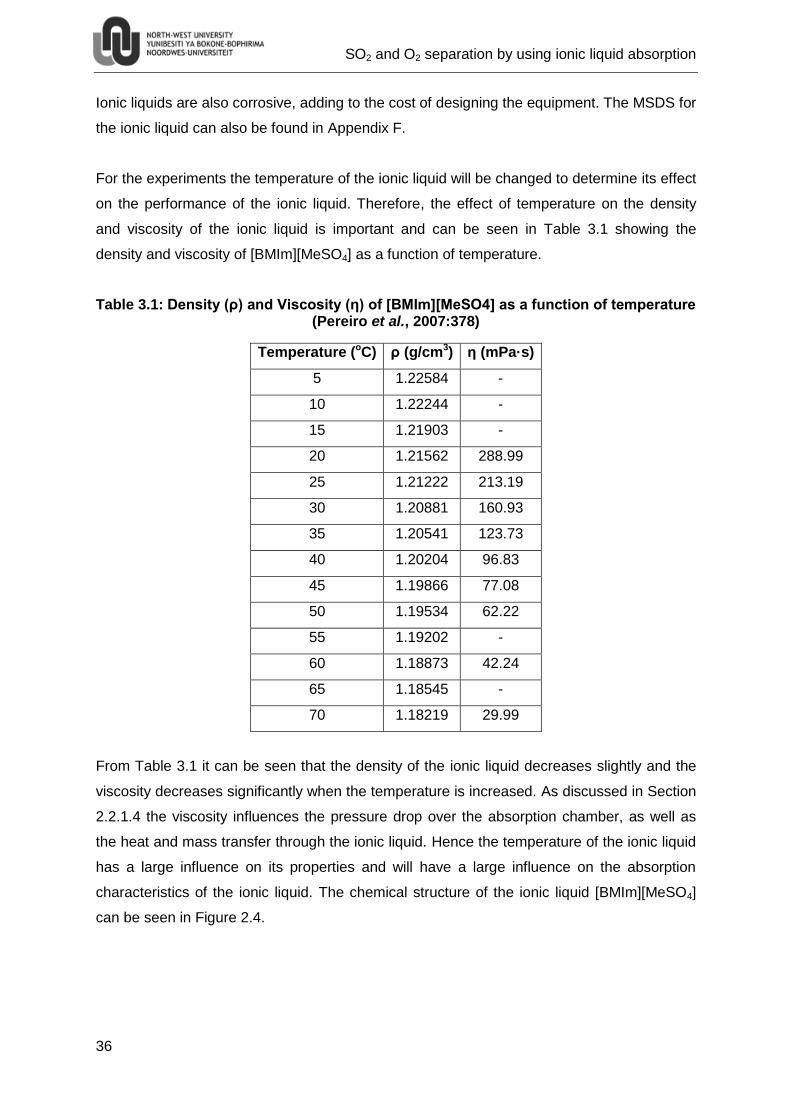
SO2 and O2 separation by using ionic liquid absorption
36
Ionic liquids are also corrosive, adding to the cost of designing the equipment. The MSDS for
the ionic liquid can also be found in Appendix F.
For the experiments the temperature of the ionic liquid will be changed to determine its effect
on the performance of the ionic liquid. Therefore, the effect of temperature on the density
and viscosity of the ionic liquid is important and can be seen in Table 3.1 showing the
density and viscosity of [BMIm][MeSO4] as a function of temperature.
Table 3.1: Density (ρ) and Viscosity (η) of [BMIm][MeSO4] as a function of temperature (Pereiro et al., 2007:378)
Temperature (oC) ρ (g/cm3) η (mPa·s)
5 1.22584 -
10 1.22244 -
15 1.21903 -
20 1.21562 288.99
25 1.21222 213.19
30 1.20881 160.93
35 1.20541 123.73
40 1.20204 96.83
45 1.19866 77.08
50 1.19534 62.22
55 1.19202 -
60 1.18873 42.24
65 1.18545 -
70 1.18219 29.99
From Table 3.1 it can be seen that the density of the ionic liquid decreases slightly and the
viscosity decreases significantly when the temperature is increased. As discussed in Section
2.2.1.4 the viscosity influences the pressure drop over the absorption chamber, as well as
the heat and mass transfer through the ionic liquid. Hence the temperature of the ionic liquid
has a large influence on its properties and will have a large influence on the absorption
characteristics of the ionic liquid. The chemical structure of the ionic liquid [BMIm][MeSO4]
can be seen in Figure 2.4.
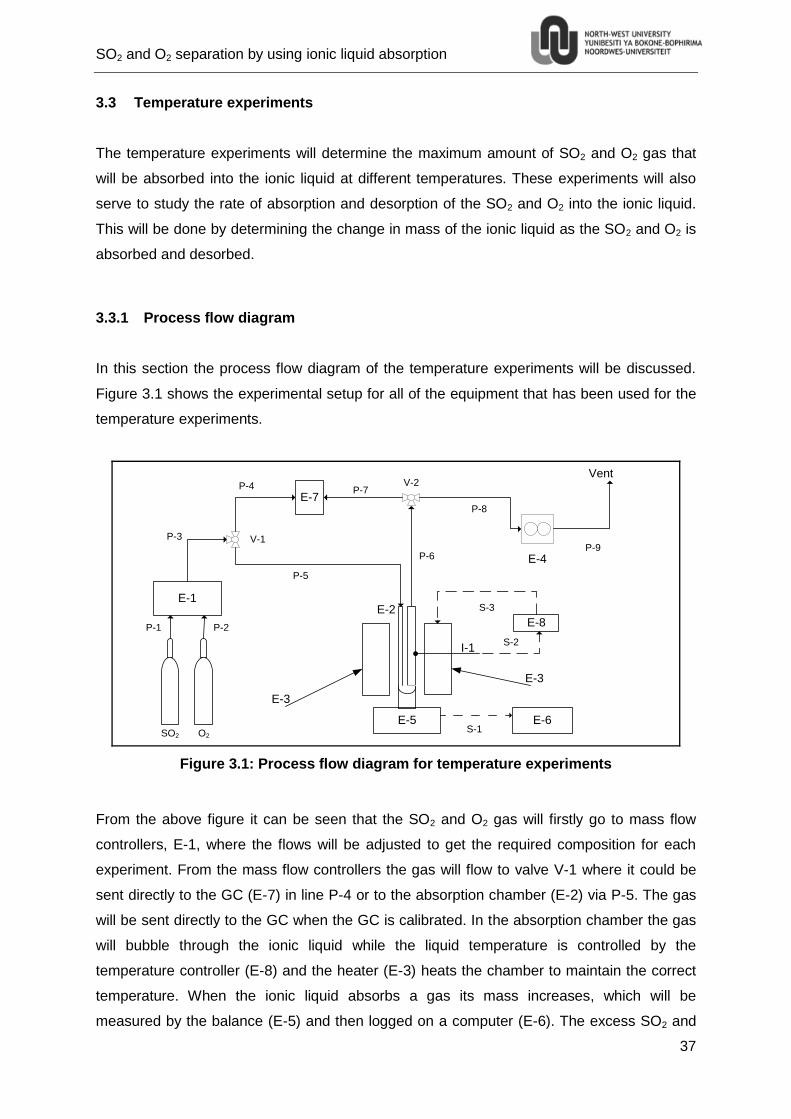
SO2 and O2 separation by using ionic liquid absorption
37
3.3 Temperature experiments
The temperature experiments will determine the maximum amount of SO2 and O2 gas that
will be absorbed into the ionic liquid at different temperatures. These experiments will also
serve to study the rate of absorption and desorption of the SO2 and O2 into the ionic liquid.
This will be done by determining the change in mass of the ionic liquid as the SO2 and O2 is
absorbed and desorbed.
3.3.1 Process flow diagram
In this section the process flow diagram of the temperature experiments will be discussed.
Figure 3.1 shows the experimental setup for all of the equipment that has been used for the
temperature experiments.
SO2 O2
E-1
E-3
E-3
I-1
E-5 E-6
E-7
V-1
V-2
E-4
P-1 P-2
P-3
P-4
P-5
P-6
P-7
P-8
P-9
Vent
S-1
E-2E-8
S-3
S-2
Figure 3.1: Process flow diagram for temperature experiments
From the above figure it can be seen that the SO2 and O2 gas will firstly go to mass flow
controllers, E-1, where the flows will be adjusted to get the required composition for each
experiment. From the mass flow controllers the gas will flow to valve V-1 where it could be
sent directly to the GC (E-7) in line P-4 or to the absorption chamber (E-2) via P-5. The gas
will be sent directly to the GC when the GC is calibrated. In the absorption chamber the gas
will bubble through the ionic liquid while the liquid temperature is controlled by the
temperature controller (E-8) and the heater (E-3) heats the chamber to maintain the correct
temperature. When the ionic liquid absorbs a gas its mass increases, which will be
measured by the balance (E-5) and then logged on a computer (E-6). The excess SO2 and
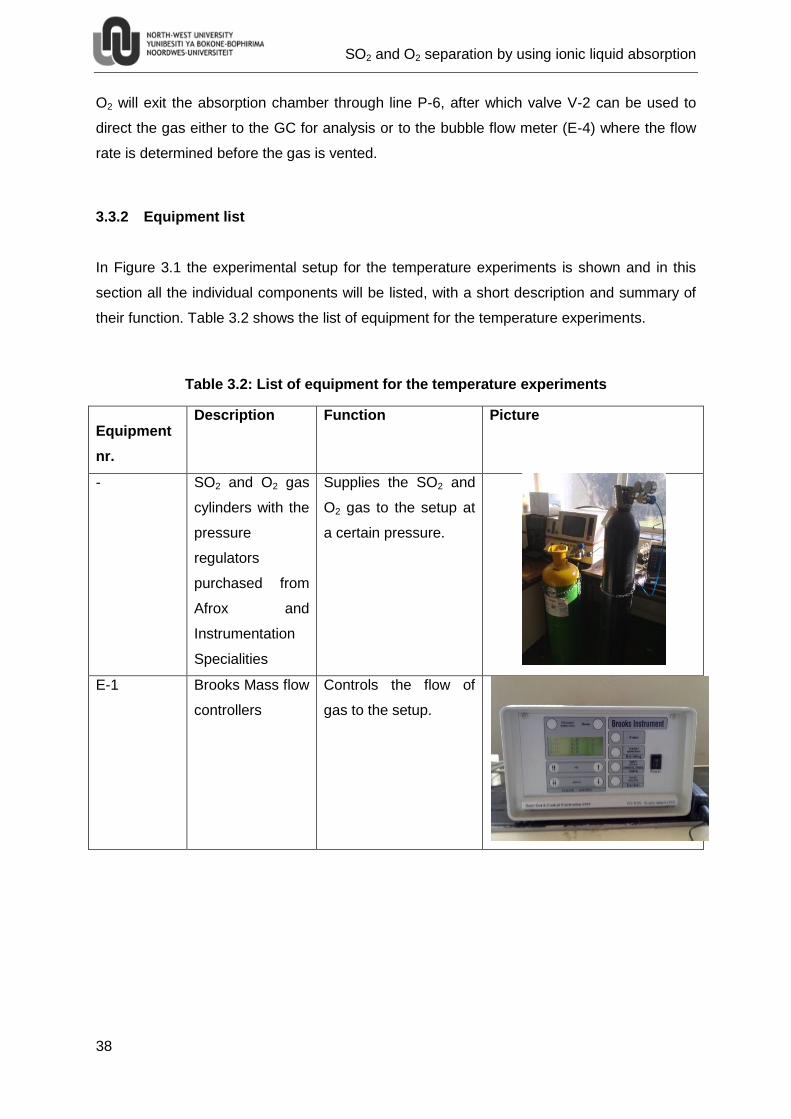
SO2 and O2 separation by using ionic liquid absorption
38
O2 will exit the absorption chamber through line P-6, after which valve V-2 can be used to
direct the gas either to the GC for analysis or to the bubble flow meter (E-4) where the flow
rate is determined before the gas is vented.
3.3.2 Equipment list
In Figure 3.1 the experimental setup for the temperature experiments is shown and in this
section all the individual components will be listed, with a short description and summary of
their function. Table 3.2 shows the list of equipment for the temperature experiments.
Table 3.2: List of equipment for the temperature experiments
Equipment
nr.
Description Function Picture
- SO2 and O2 gas
cylinders with the
pressure
regulators
purchased from
Afrox and
Instrumentation
Specialities
Supplies the SO2 and
O2 gas to the setup at
a certain pressure.
E-1 Brooks Mass flow
controllers
Controls the flow of
gas to the setup.
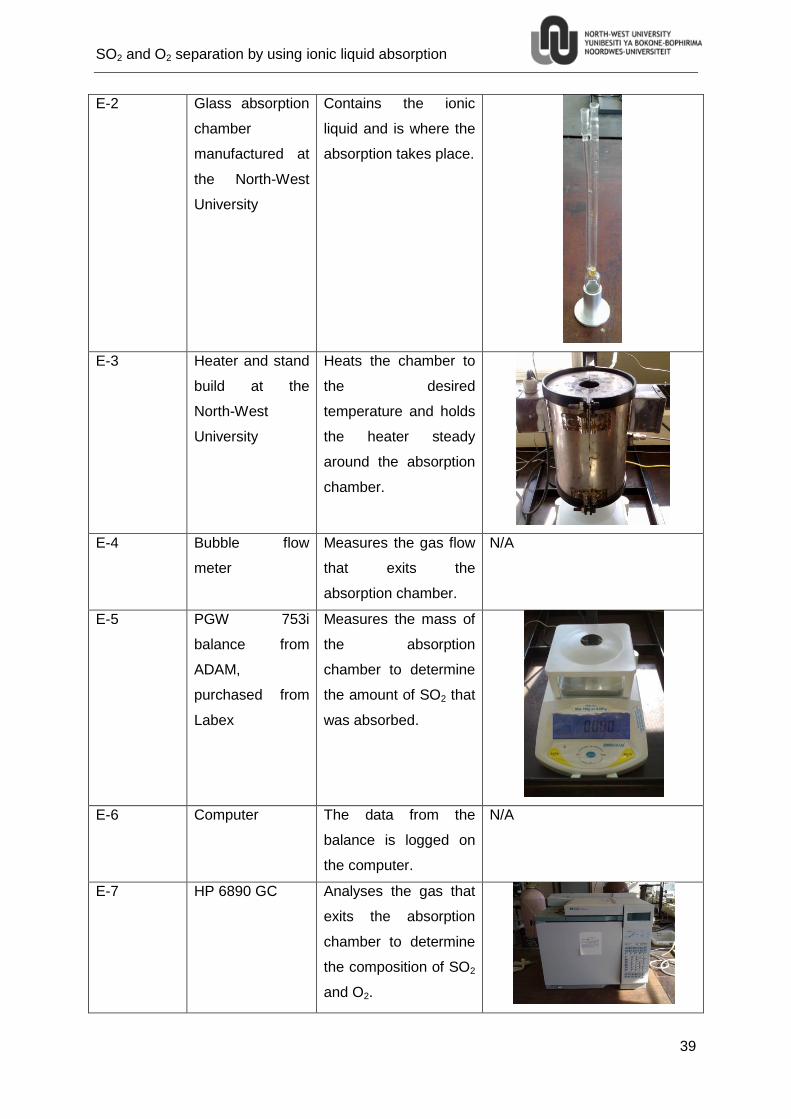
SO2 and O2 separation by using ionic liquid absorption
39
E-2 Glass absorption
chamber
manufactured at
the North-West
University
Contains the ionic
liquid and is where the
absorption takes place.
E-3 Heater and stand
build at the
North-West
University
Heats the chamber to
the desired
temperature and holds
the heater steady
around the absorption
chamber.
E-4 Bubble flow
meter
Measures the gas flow
that exits the
absorption chamber.
N/A
E-5 PGW 753i
balance from
ADAM,
purchased from
Labex
Measures the mass of
the absorption
chamber to determine
the amount of SO2 that
was absorbed.
E-6 Computer The data from the
balance is logged on
the computer.
N/A
E-7 HP 6890 GC Analyses the gas that
exits the absorption
chamber to determine
the composition of SO2
and O2.
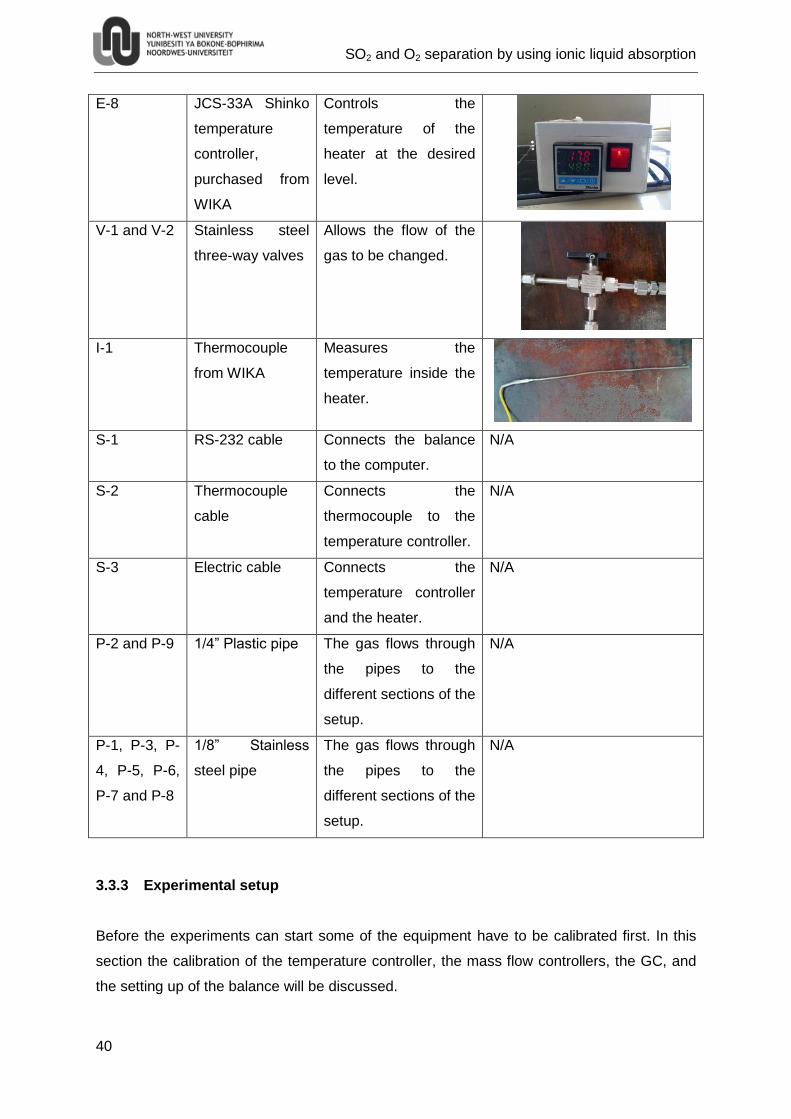
SO2 and O2 separation by using ionic liquid absorption
40
E-8 JCS-33A Shinko
temperature
controller,
purchased from
WIKA
Controls the
temperature of the
heater at the desired
level.
V-1 and V-2 Stainless steel
three-way valves
Allows the flow of the
gas to be changed.
I-1 Thermocouple
from WIKA
Measures the
temperature inside the
heater.
S-1 RS-232 cable Connects the balance
to the computer.
N/A
S-2 Thermocouple
cable
Connects the
thermocouple to the
temperature controller.
N/A
S-3 Electric cable Connects the
temperature controller
and the heater.
N/A
P-2 and P-9 1/4” Plastic pipe The gas flows through
the pipes to the
different sections of the
setup.
N/A
P-1, P-3, P-
4, P-5, P-6,
P-7 and P-8
1/8” Stainless
steel pipe
The gas flows through
the pipes to the
different sections of the
setup.
N/A
3.3.3 Experimental setup
Before the experiments can start some of the equipment have to be calibrated first. In this
section the calibration of the temperature controller, the mass flow controllers, the GC, and
the setting up of the balance will be discussed.
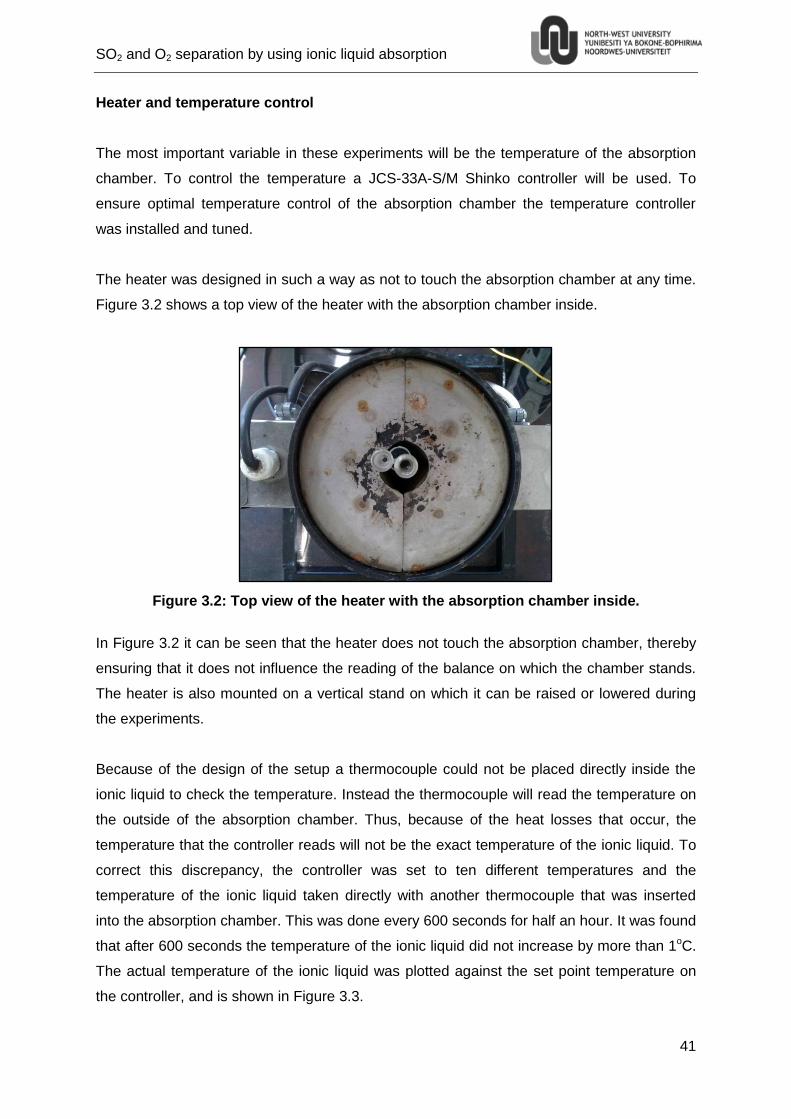
SO2 and O2 separation by using ionic liquid absorption
41
Heater and temperature control
The most important variable in these experiments will be the temperature of the absorption
chamber. To control the temperature a JCS-33A-S/M Shinko controller will be used. To
ensure optimal temperature control of the absorption chamber the temperature controller
was installed and tuned.
The heater was designed in such a way as not to touch the absorption chamber at any time.
Figure 3.2 shows a top view of the heater with the absorption chamber inside.
Figure 3.2: Top view of the heater with the absorption chamber inside.
In Figure 3.2 it can be seen that the heater does not touch the absorption chamber, thereby
ensuring that it does not influence the reading of the balance on which the chamber stands.
The heater is also mounted on a vertical stand on which it can be raised or lowered during
the experiments.
Because of the design of the setup a thermocouple could not be placed directly inside the
ionic liquid to check the temperature. Instead the thermocouple will read the temperature on
the outside of the absorption chamber. Thus, because of the heat losses that occur, the
temperature that the controller reads will not be the exact temperature of the ionic liquid. To
correct this discrepancy, the controller was set to ten different temperatures and the
temperature of the ionic liquid taken directly with another thermocouple that was inserted
into the absorption chamber. This was done every 600 seconds for half an hour. It was found
that after 600 seconds the temperature of the ionic liquid did not increase by more than 1oC.
The actual temperature of the ionic liquid was plotted against the set point temperature on
the controller, and is shown in Figure 3.3.
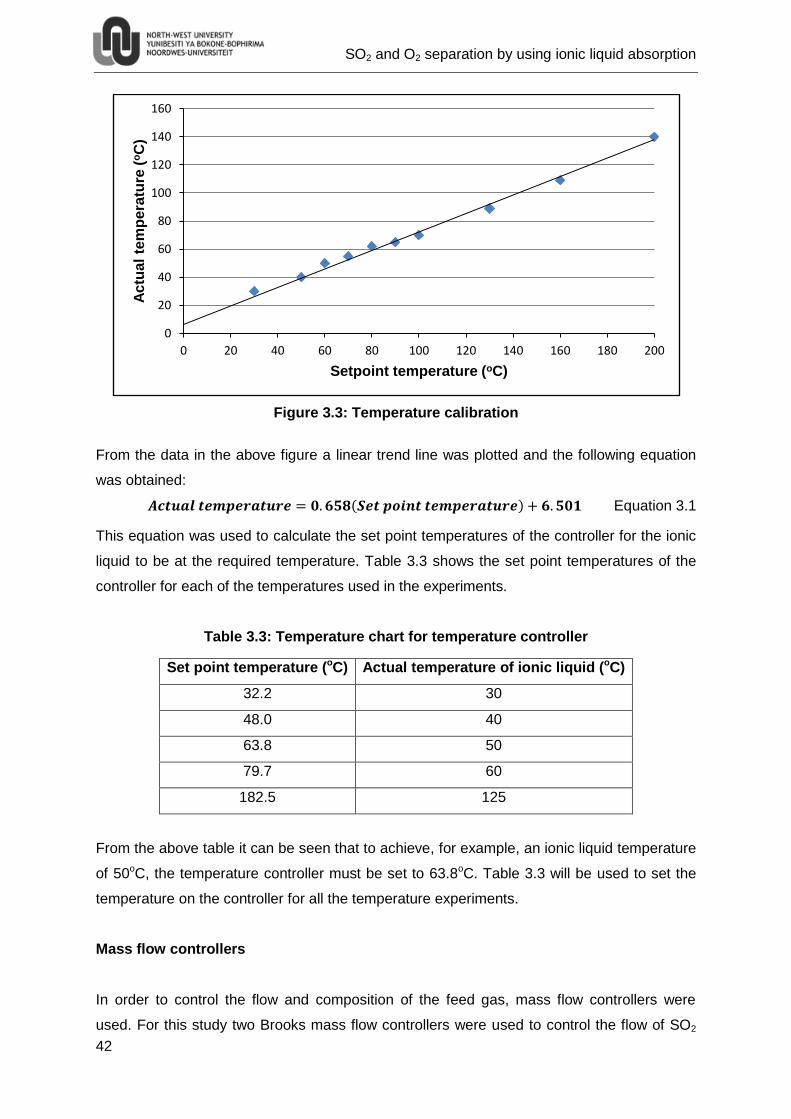
SO2 and O2 separation by using ionic liquid absorption
42
Figure 3.3: Temperature calibration
From the data in the above figure a linear trend line was plotted and the following equation
was obtained:
( ) Equation 3.1
This equation was used to calculate the set point temperatures of the controller for the ionic
liquid to be at the required temperature. Table 3.3 shows the set point temperatures of the
controller for each of the temperatures used in the experiments.
Table 3.3: Temperature chart for temperature controller
Set point temperature (oC) Actual temperature of ionic liquid (oC)
32.2 30
48.0 40
63.8 50
79.7 60
182.5 125
From the above table it can be seen that to achieve, for example, an ionic liquid temperature
of 50oC, the temperature controller must be set to 63.8oC. Table 3.3 will be used to set the
temperature on the controller for all the temperature experiments.
Mass flow controllers
In order to control the flow and composition of the feed gas, mass flow controllers were
used. For this study two Brooks mass flow controllers were used to control the flow of SO2
0
20
40
60
80
100
120
140
160
0 20 40 60 80 100 120 140 160 180 200
Ac
tua
l te
mp
era
ture
(oC
)
Setpoint temperature (oC)
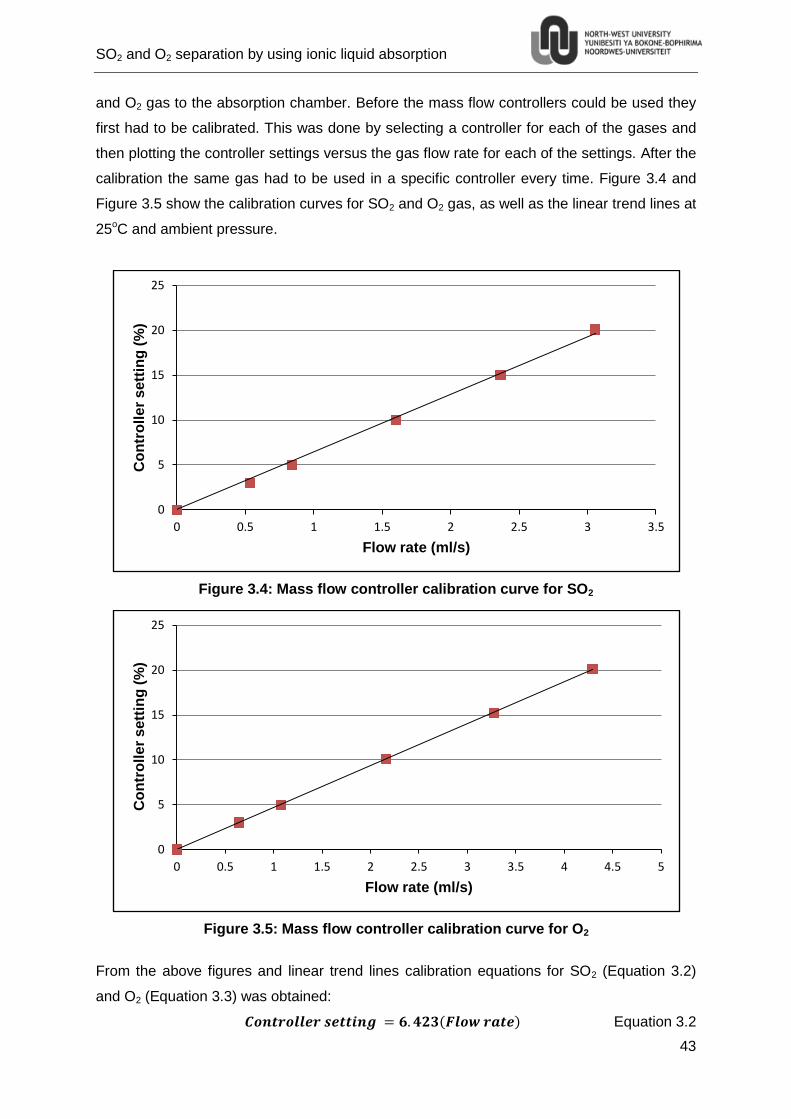
SO2 and O2 separation by using ionic liquid absorption
43
and O2 gas to the absorption chamber. Before the mass flow controllers could be used they
first had to be calibrated. This was done by selecting a controller for each of the gases and
then plotting the controller settings versus the gas flow rate for each of the settings. After the
calibration the same gas had to be used in a specific controller every time. Figure 3.4 and
Figure 3.5 show the calibration curves for SO2 and O2 gas, as well as the linear trend lines at
25oC and ambient pressure.
Figure 3.4: Mass flow controller calibration curve for SO2
Figure 3.5: Mass flow controller calibration curve for O2
From the above figures and linear trend lines calibration equations for SO2 (Equation 3.2)
and O2 (Equation 3.3) was obtained:
( ) Equation 3.2
0
5
10
15
20
25
0 0.5 1 1.5 2 2.5 3 3.5
Co
ntr
oll
er
sett
ing
(%
)
Flow rate (ml/s)
0
5
10
15
20
25
0 0.5 1 1.5 2 2.5 3 3.5 4 4.5 5
Co
ntr
oll
er
sett
ing
(%
)
Flow rate (ml/s)
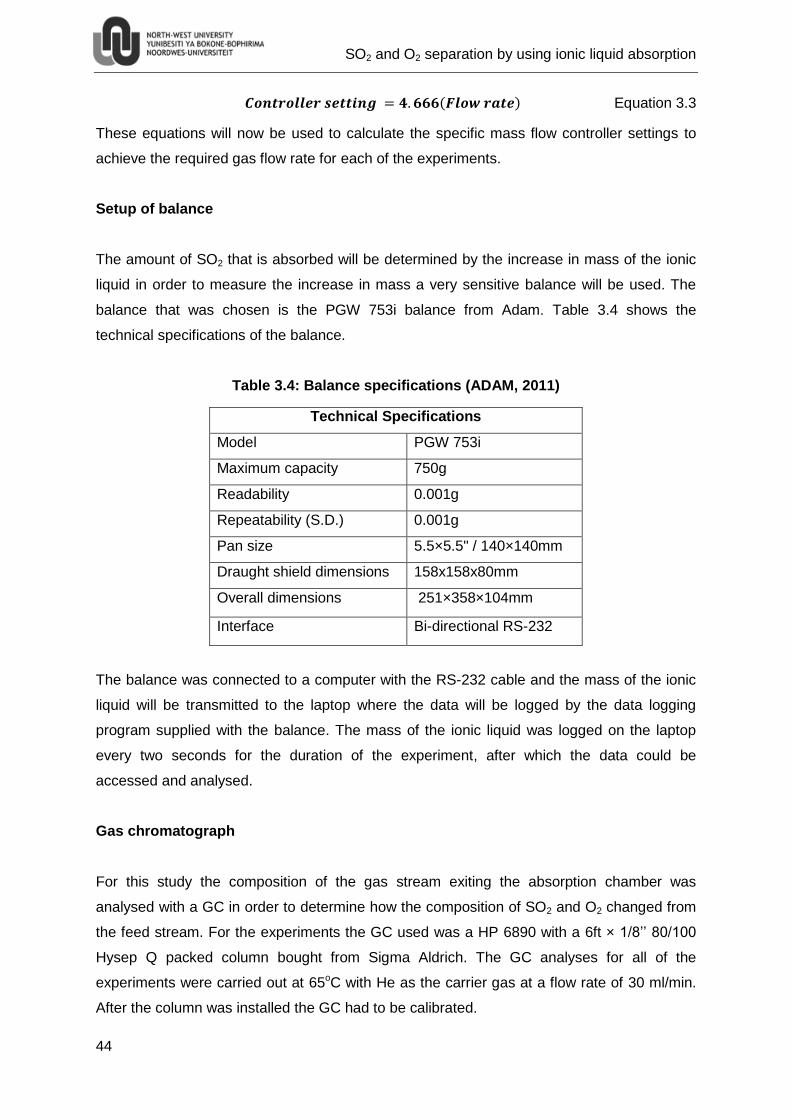
SO2 and O2 separation by using ionic liquid absorption
44
( ) Equation 3.3
These equations will now be used to calculate the specific mass flow controller settings to
achieve the required gas flow rate for each of the experiments.
Setup of balance
The amount of SO2 that is absorbed will be determined by the increase in mass of the ionic
liquid in order to measure the increase in mass a very sensitive balance will be used. The
balance that was chosen is the PGW 753i balance from Adam. Table 3.4 shows the
technical specifications of the balance.
Table 3.4: Balance specifications (ADAM, 2011)
Technical Specifications
Model PGW 753i
Maximum capacity 750g
Readability 0.001g
Repeatability (S.D.) 0.001g
Pan size 5.5×5.5" / 140×140mm
Draught shield dimensions 158x158x80mm
Overall dimensions 251×358×104mm
Interface Bi-directional RS-232
The balance was connected to a computer with the RS-232 cable and the mass of the ionic
liquid will be transmitted to the laptop where the data will be logged by the data logging
program supplied with the balance. The mass of the ionic liquid was logged on the laptop
every two seconds for the duration of the experiment, after which the data could be
accessed and analysed.
Gas chromatograph
For this study the composition of the gas stream exiting the absorption chamber was
analysed with a GC in order to determine how the composition of SO2 and O2 changed from
the feed stream. For the experiments the GC used was a HP 6890 with a 6ft × 1/8’’ 80/100
Hysep Q packed column bought from Sigma Aldrich. The GC analyses for all of the
experiments were carried out at 65oC with He as the carrier gas at a flow rate of 30 ml/min.
After the column was installed the GC had to be calibrated.
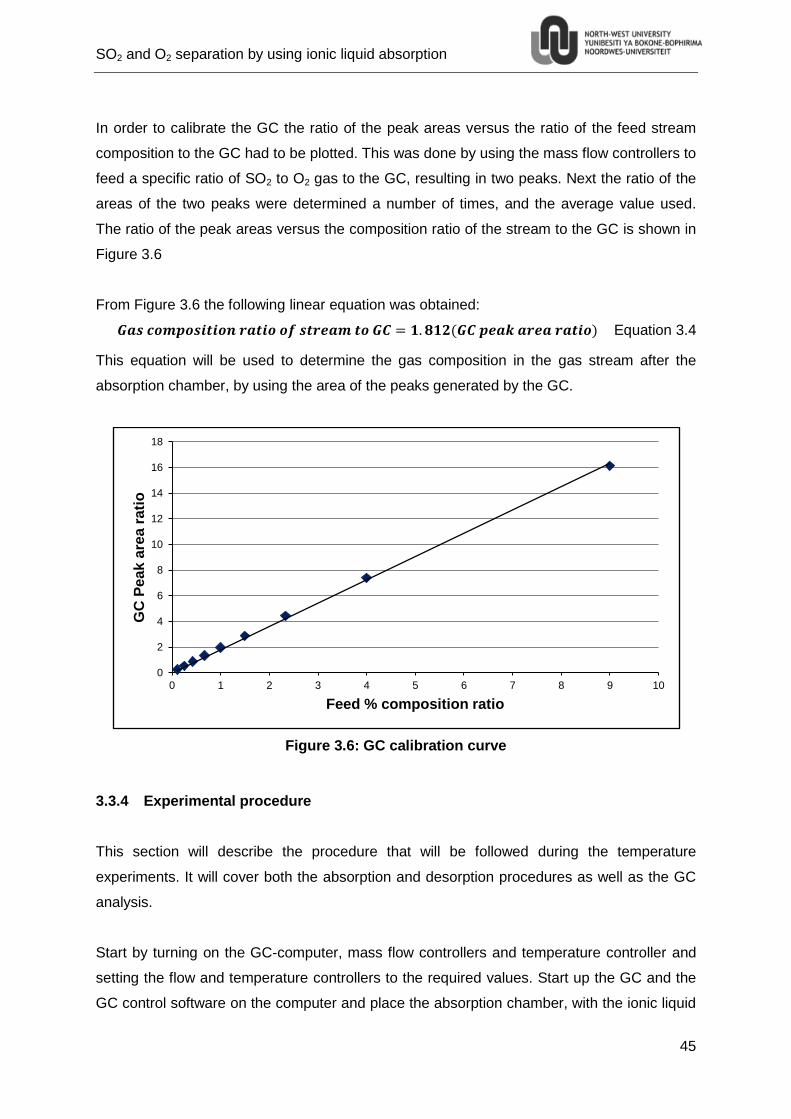
SO2 and O2 separation by using ionic liquid absorption
45
In order to calibrate the GC the ratio of the peak areas versus the ratio of the feed stream
composition to the GC had to be plotted. This was done by using the mass flow controllers to
feed a specific ratio of SO2 to O2 gas to the GC, resulting in two peaks. Next the ratio of the
areas of the two peaks were determined a number of times, and the average value used.
The ratio of the peak areas versus the composition ratio of the stream to the GC is shown in
Figure 3.6
From Figure 3.6 the following linear equation was obtained:
( ) Equation 3.4
This equation will be used to determine the gas composition in the gas stream after the
absorption chamber, by using the area of the peaks generated by the GC.
Figure 3.6: GC calibration curve
3.3.4 Experimental procedure
This section will describe the procedure that will be followed during the temperature
experiments. It will cover both the absorption and desorption procedures as well as the GC
analysis.
Start by turning on the GC-computer, mass flow controllers and temperature controller and
setting the flow and temperature controllers to the required values. Start up the GC and the
GC control software on the computer and place the absorption chamber, with the ionic liquid
0
2
4
6
8
10
12
14
16
18
0 1 2 3 4 5 6 7 8 9 10
GC
Pe
ak
are
a r
ati
o
Feed % composition ratio
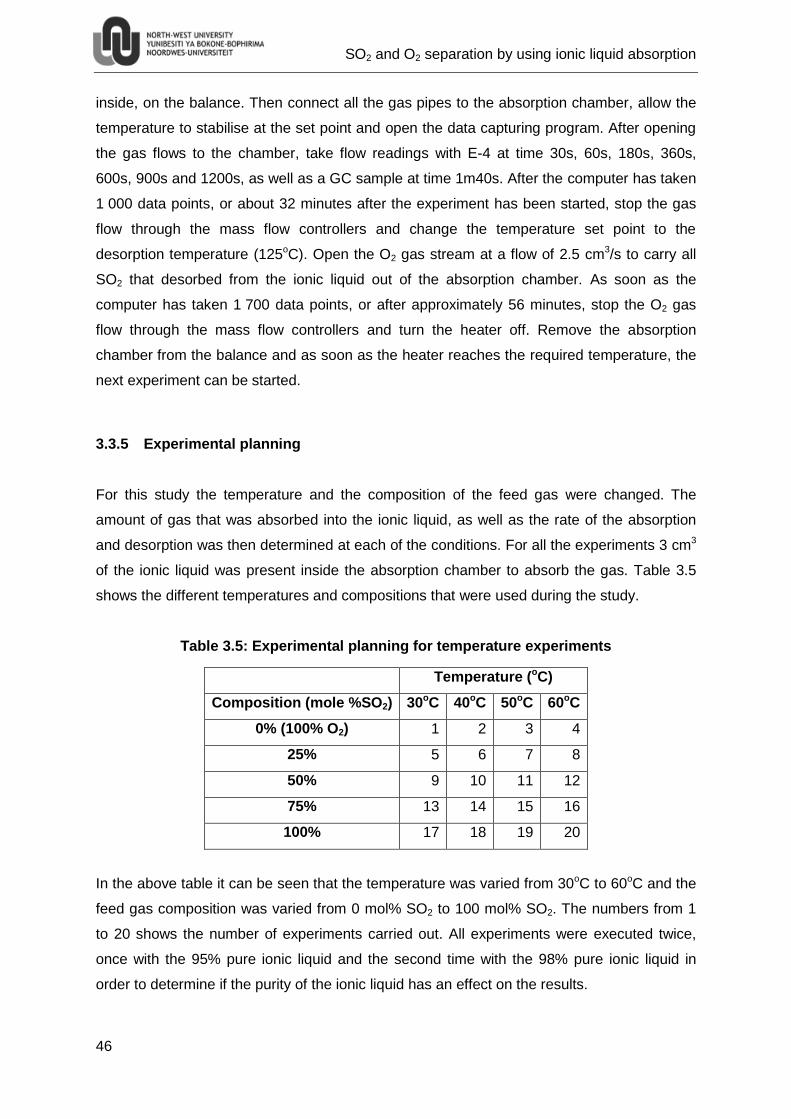
SO2 and O2 separation by using ionic liquid absorption
46
inside, on the balance. Then connect all the gas pipes to the absorption chamber, allow the
temperature to stabilise at the set point and open the data capturing program. After opening
the gas flows to the chamber, take flow readings with E-4 at time 30s, 60s, 180s, 360s,
600s, 900s and 1200s, as well as a GC sample at time 1m40s. After the computer has taken
1 000 data points, or about 32 minutes after the experiment has been started, stop the gas
flow through the mass flow controllers and change the temperature set point to the
desorption temperature (125oC). Open the O2 gas stream at a flow of 2.5 cm3/s to carry all
SO2 that desorbed from the ionic liquid out of the absorption chamber. As soon as the
computer has taken 1 700 data points, or after approximately 56 minutes, stop the O2 gas
flow through the mass flow controllers and turn the heater off. Remove the absorption
chamber from the balance and as soon as the heater reaches the required temperature, the
next experiment can be started.
3.3.5 Experimental planning
For this study the temperature and the composition of the feed gas were changed. The
amount of gas that was absorbed into the ionic liquid, as well as the rate of the absorption
and desorption was then determined at each of the conditions. For all the experiments 3 cm3
of the ionic liquid was present inside the absorption chamber to absorb the gas. Table 3.5
shows the different temperatures and compositions that were used during the study.
Table 3.5: Experimental planning for temperature experiments
Temperature (oC)
Composition (mole %SO2) 30oC 40oC 50oC 60oC
0% (100% O2) 1 2 3 4
25% 5 6 7 8
50% 9 10 11 12
75% 13 14 15 16
100% 17 18 19 20
In the above table it can be seen that the temperature was varied from 30oC to 60oC and the
feed gas composition was varied from 0 mol% SO2 to 100 mol% SO2. The numbers from 1
to 20 shows the number of experiments carried out. All experiments were executed twice,
once with the 95% pure ionic liquid and the second time with the 98% pure ionic liquid in
order to determine if the purity of the ionic liquid has an effect on the results.
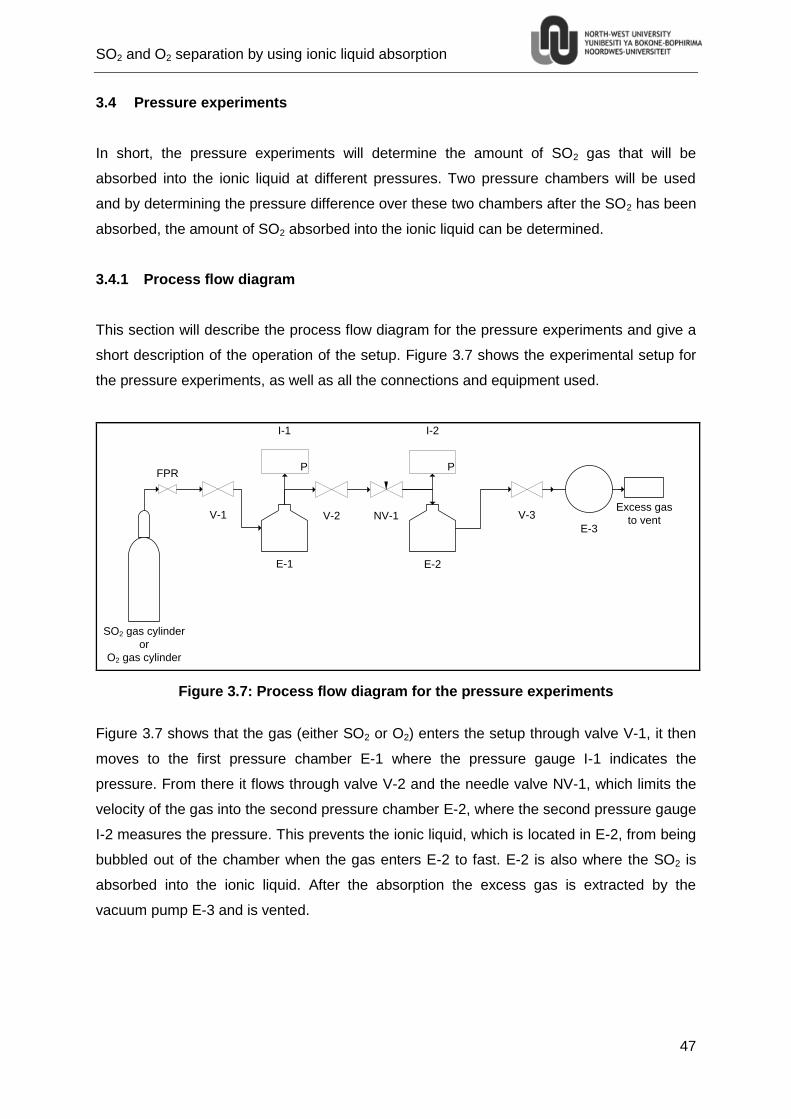
SO2 and O2 separation by using ionic liquid absorption
47
3.4 Pressure experiments
In short, the pressure experiments will determine the amount of SO2 gas that will be
absorbed into the ionic liquid at different pressures. Two pressure chambers will be used
and by determining the pressure difference over these two chambers after the SO2 has been
absorbed, the amount of SO2 absorbed into the ionic liquid can be determined.
3.4.1 Process flow diagram
This section will describe the process flow diagram for the pressure experiments and give a
short description of the operation of the setup. Figure 3.7 shows the experimental setup for
the pressure experiments, as well as all the connections and equipment used.
SO2 gas cylinder
or
O2 gas cylinder
V-1
E-1 E-2
P
I-1
P
I-2
V-2 NV-1 V-3
E-3
Excess gas
to vent
FPR
Figure 3.7: Process flow diagram for the pressure experiments
Figure 3.7 shows that the gas (either SO2 or O2) enters the setup through valve V-1, it then
moves to the first pressure chamber E-1 where the pressure gauge I-1 indicates the
pressure. From there it flows through valve V-2 and the needle valve NV-1, which limits the
velocity of the gas into the second pressure chamber E-2, where the second pressure gauge
I-2 measures the pressure. This prevents the ionic liquid, which is located in E-2, from being
bubbled out of the chamber when the gas enters E-2 to fast. E-2 is also where the SO2 is
absorbed into the ionic liquid. After the absorption the excess gas is extracted by the
vacuum pump E-3 and is vented.
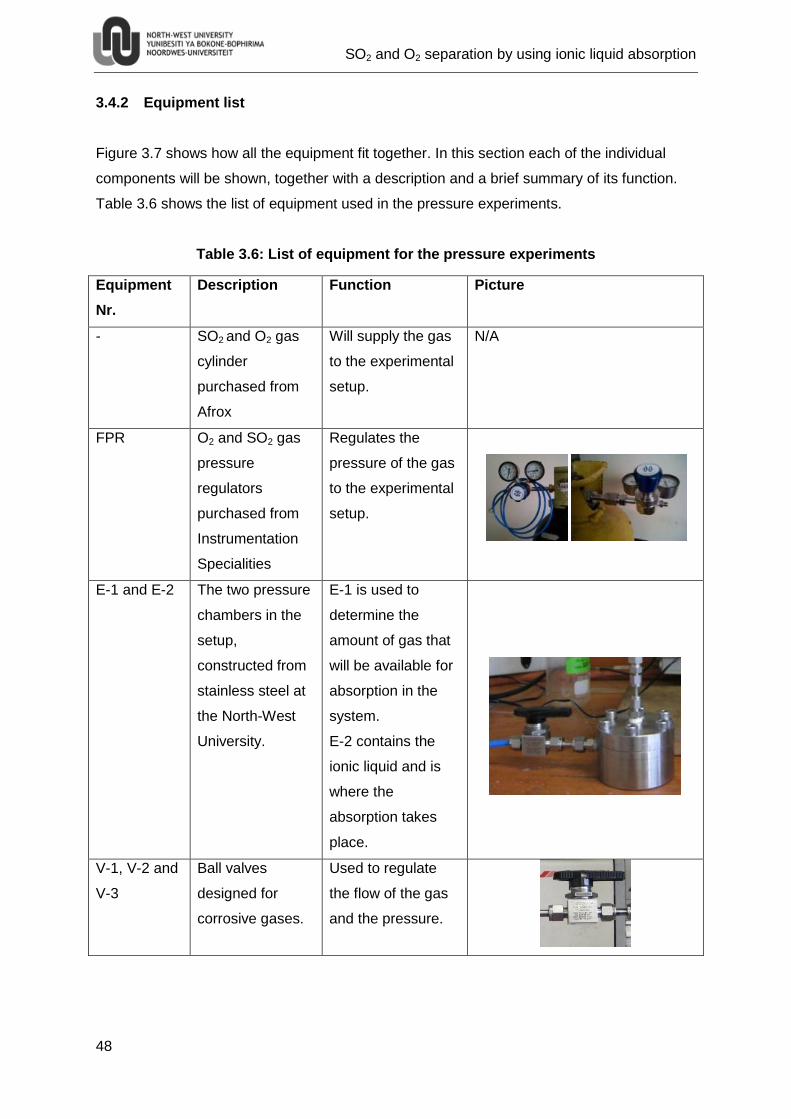
SO2 and O2 separation by using ionic liquid absorption
48
3.4.2 Equipment list
Figure 3.7 shows how all the equipment fit together. In this section each of the individual
components will be shown, together with a description and a brief summary of its function.
Table 3.6 shows the list of equipment used in the pressure experiments.
Table 3.6: List of equipment for the pressure experiments
Equipment
Nr.
Description Function Picture
- SO2 and O2 gas
cylinder
purchased from
Afrox
Will supply the gas
to the experimental
setup.
N/A
FPR O2 and SO2 gas
pressure
regulators
purchased from
Instrumentation
Specialities
Regulates the
pressure of the gas
to the experimental
setup.
E-1 and E-2 The two pressure
chambers in the
setup,
constructed from
stainless steel at
the North-West
University.
E-1 is used to
determine the
amount of gas that
will be available for
absorption in the
system.
E-2 contains the
ionic liquid and is
where the
absorption takes
place.
V-1, V-2 and
V-3
Ball valves
designed for
corrosive gases.
Used to regulate
the flow of the gas
and the pressure.
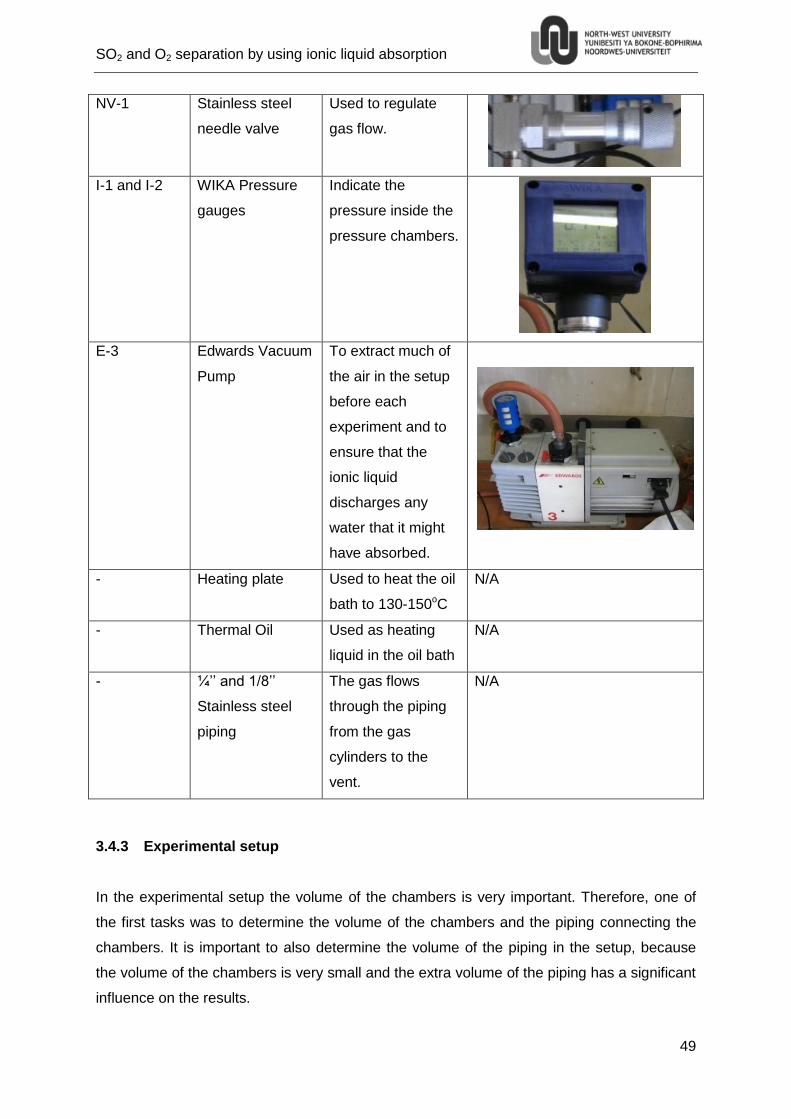
SO2 and O2 separation by using ionic liquid absorption
49
NV-1 Stainless steel
needle valve
Used to regulate
gas flow.
I-1 and I-2 WIKA Pressure
gauges
Indicate the
pressure inside the
pressure chambers.
E-3 Edwards Vacuum
Pump
To extract much of
the air in the setup
before each
experiment and to
ensure that the
ionic liquid
discharges any
water that it might
have absorbed.
- Heating plate Used to heat the oil
bath to 130-150oC
N/A
- Thermal Oil Used as heating
liquid in the oil bath
N/A
- ¼’’ and 1/8’’
Stainless steel
piping
The gas flows
through the piping
from the gas
cylinders to the
vent.
N/A
3.4.3 Experimental setup
In the experimental setup the volume of the chambers is very important. Therefore, one of
the first tasks was to determine the volume of the chambers and the piping connecting the
chambers. It is important to also determine the volume of the piping in the setup, because
the volume of the chambers is very small and the extra volume of the piping has a significant
influence on the results.
SO2 and O2 separation by using ionic liquid absorption
50
In order to establish the volume of the apparatus the volume of water that can be contained
by the setup was determined. The setup was first taken apart into its individual components.
Then the volume for each component was measured repeatedly, and an average value was
obtained. Thereafter the setup was assembled into two sections:
- Section 1 from V-1 to V-2
- Section 2 from V-2 to V-3
The volumes of these two sections were determined by measuring the volume of water that
can be injected into each of the sections. The average of a number of determinations was
calculated and compared with the sum of the volumes as determined dimensionally for the
individual components. The two volumes were found to be equal. The final volumes for the
two sections were then calculated as 18.90 ±0.01 cm3 for section 1 and 21.80 ±0.01 cm3 for
section 2. At these small error margins the error bars on the graphs was too small to see and
was therefore left out of the graphs in Chapter 5.
With the volume of the apparatus now known, the following step was to test the setup for
leakages. This was done in two ways:
- Firstly, the system was pressurised to 10 bar with O2 and then submerged in a water
bath to check for any bubbles escaping from the setup. It was left in the system for
30 min without detecting any bubbles.
- Secondly, the system was pressurised to 10 bar with O2 and then left overnight
(twelve hours) to detect any pressure drop in the system. A pressure drop of less
than 0.001 bar in twelve hours was deemed acceptable for these experiments. No
pressure drops were detected with either of the two tests and therefore, the system
was considered to be leak-free.
The final preparation step was to calibrate the pressure gauges fitted to chamber E-1 and E-
2. The gauges were bought as pre-calibrated gauges, and were found to give accurate
measurements within 0.001 bar.
3.4.4 Experimental procedure
In this section the general experimental method, as well as the detailed experimental
procedures will be discussed.
SO2 and O2 separation by using ionic liquid absorption
51
3.4.4.1 General method
For the pressure experiments all the experiments will be carried out at relatively low
pressures (<10 bar) and at ambient temperature (25oC). Thus, the deviation from the ideal
gas law will be negligibly small (Felder & Rousseau, 2000:213). Because the volume of each
section is known, as well as the pressure and temperature, the number of moles in the
system can be calculated with Equation 3.5 (Ideal gas law):
Equation 3.5
Where:
P – Pressure inside the chamber (1 bar = 1×10⁵ Pa)
V – Volume of the chamber (1 cm3 = 1×10⁻⁶ m3)
n – Number of moles (mol)
R – Gas constant (R = 8.314 J/mol·K)
T – Temperature (298 K)
When chamber E-1 is pressurised the number of moles of gas in the chamber will be
calculated, using the ideal gas law. It is a closed system and from section 2.1.3.2 it was
concluded that no chemical reactions occur, because only physical absorption takes place
when SO2 is absorbed into [BMIm][MeSO4], therefore the number of moles of gas in the
system will remain constant throughout the experiment. When valve V-2 between the
chambers is opened, the volume of the system changes and consequently the pressure also
changes according to the ideal gas law. However, because the ionic liquid absorbs some of
the gas the drop in pressure is larger than that predicted by the ideal gas law in the absence
of absorption. After the system has reached equilibrium the number of moles of gas will be
calculated again, and the difference between these amounts will equal the amount of gas
absorbed into the ionic liquid.
3.4.4.2 Detailed experimental procedures
During these experiments dangerous chemicals will be used; therefore a few basic safety
rules must be adhered to at all times. These rules are:
- All experiments have to be carried out inside a ventilation chamber
- When performing the experiments, protective clothing such as a laboratory coat,
respirator, eye protection and gloves must be worn.
SO2 and O2 separation by using ionic liquid absorption
52
- The vacuum pump and the heated oil bath must also be placed in the ventilation
chamber in view of the fact that the exhaust gas from the vacuum pump and the oil
vapour are carcinogenic.
- The ionic liquids are corrosive and cause burns. Therefore, contact with the skin
should be avoided. In the event of contact, thorough rinsing with soap and water is
required.
The following sections explain two main experimental procedures that will be used during the
pressure experiments. These procedures are the absorption and desorption procedures.
They will indicate how the experiments must be carried out to ensure the proper working of
the experimental setup.
Absorption
Insert the required amount of ionic liquid into chamber E-2 and seal the chamber. Start the
vacuum pump and let it run for five minutes to remove as much air form the system as
possible. After closing V-2 and V-3, switch off the vacuum pump and allow two minutes for
the pressure readings to stabilise before taking the readings. Set the pressure regulator to
the desired pressure and open V-1 to pressurise chamber E-1 to the desired pressure. Allow
two minutes for the pressure gauges to stabilise before the pressure readings are taken.
Next V-2 is opened to let the gas into chamber E-2. After the pressure readings on both
gauges have equalised, open NV-1 to ensure that equilibrium was reached and allow ten
minutes before taking the final pressure readings.
Desorption
After the absorption step ensure that the pressure gauge I-2 indicates a positive reading of
at least 2 bar(g). This step is to insure that the ionic liquid is not spilled when the chamber is
opened. For the experiments with SO2, the reading will be significantly less than 2 bar(g), in
order to increase the pressure just add O2 until the pressure is high enough. Now open
chamber E-2 and extract the ionic liquid from the bottom half of the chamber and place it in a
dark glass container. Place the dark glass container in an oil bath that has been heated to
between 130 and 150oC and let the gas desorb from the liquid for 20-30 minutes (Lee et al.,
2008:6035). Let the gas desorb until no more bubbles can be seen on the surface of the
ionic liquid. After the desorption step, remove the glass container from the oil bath and allow
it to cool, after the ionic liquid has cooled to room temperature it can be used again for
absorption.
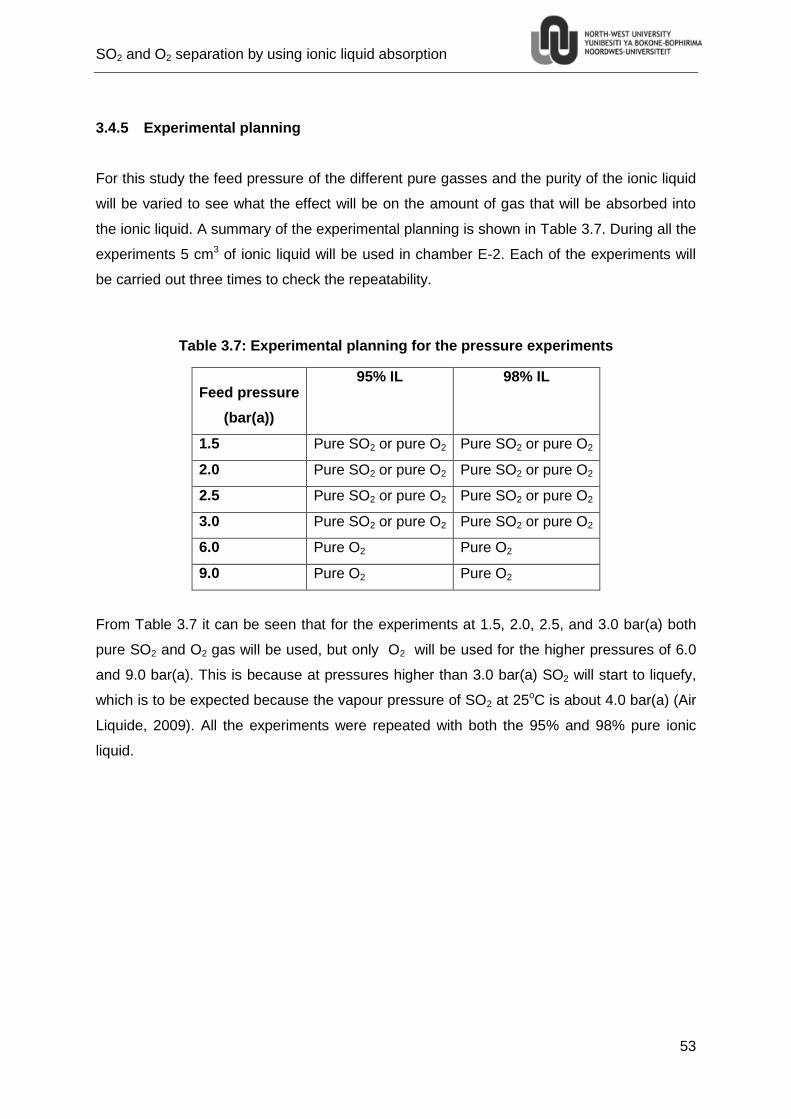
SO2 and O2 separation by using ionic liquid absorption
53
3.4.5 Experimental planning
For this study the feed pressure of the different pure gasses and the purity of the ionic liquid
will be varied to see what the effect will be on the amount of gas that will be absorbed into
the ionic liquid. A summary of the experimental planning is shown in Table 3.7. During all the
experiments 5 cm3 of ionic liquid will be used in chamber E-2. Each of the experiments will
be carried out three times to check the repeatability.
Table 3.7: Experimental planning for the pressure experiments
Feed pressure
(bar(a))
95% IL 98% IL
1.5 Pure SO2 or pure O2 Pure SO2 or pure O2
2.0 Pure SO2 or pure O2 Pure SO2 or pure O2
2.5 Pure SO2 or pure O2 Pure SO2 or pure O2
3.0 Pure SO2 or pure O2 Pure SO2 or pure O2
6.0 Pure O2 Pure O2
9.0 Pure O2 Pure O2
From Table 3.7 it can be seen that for the experiments at 1.5, 2.0, 2.5, and 3.0 bar(a) both
pure SO2 and O2 gas will be used, but only O2 will be used for the higher pressures of 6.0
and 9.0 bar(a). This is because at pressures higher than 3.0 bar(a) SO2 will start to liquefy,
which is to be expected because the vapour pressure of SO2 at 25oC is about 4.0 bar(a) (Air
Liquide, 2009). All the experiments were repeated with both the 95% and 98% pure ionic
liquid.

SO2 and O2 separation by using ionic liquid absorption
54
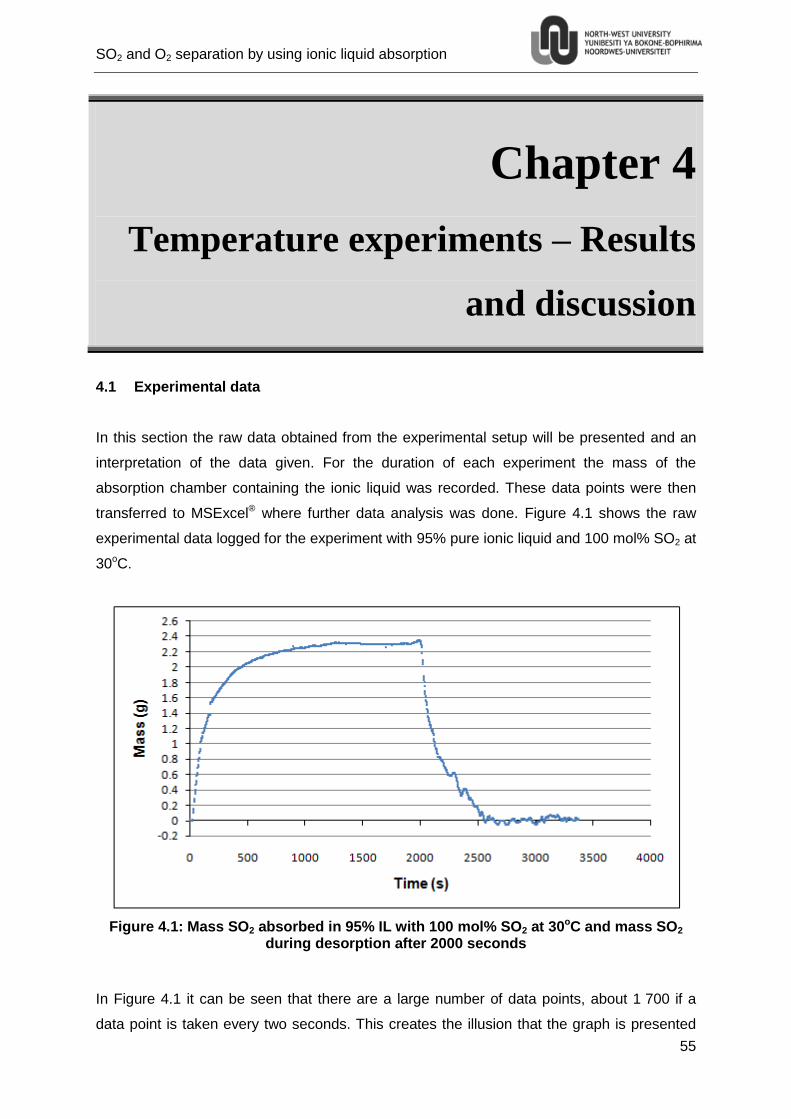
SO2 and O2 separation by using ionic liquid absorption
55
4. Chapter 4
Temperature experiments – Results
and discussion
4.1 Experimental data
In this section the raw data obtained from the experimental setup will be presented and an
interpretation of the data given. For the duration of each experiment the mass of the
absorption chamber containing the ionic liquid was recorded. These data points were then
transferred to MSExcel® where further data analysis was done. Figure 4.1 shows the raw
experimental data logged for the experiment with 95% pure ionic liquid and 100 mol% SO2 at
30oC.
Figure 4.1: Mass SO2 absorbed in 95% IL with 100 mol% SO2 at 30oC and mass SO2 during desorption after 2000 seconds
In Figure 4.1 it can be seen that there are a large number of data points, about 1 700 if a
data point is taken every two seconds. This creates the illusion that the graph is presented
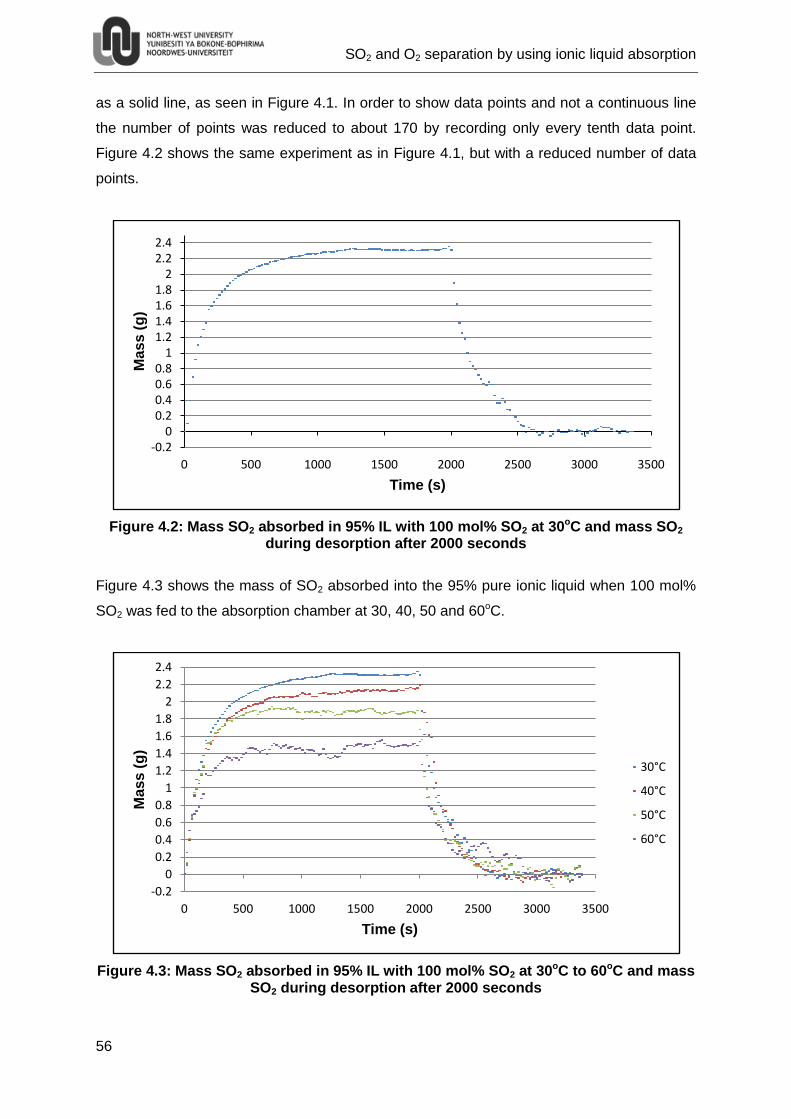
SO2 and O2 separation by using ionic liquid absorption
56
as a solid line, as seen in Figure 4.1. In order to show data points and not a continuous line
the number of points was reduced to about 170 by recording only every tenth data point.
Figure 4.2 shows the same experiment as in Figure 4.1, but with a reduced number of data
points.
Figure 4.2: Mass SO2 absorbed in 95% IL with 100 mol% SO2 at 30oC and mass SO2 during desorption after 2000 seconds
Figure 4.3 shows the mass of SO2 absorbed into the 95% pure ionic liquid when 100 mol%
SO2 was fed to the absorption chamber at 30, 40, 50 and 60oC.
Figure 4.3: Mass SO2 absorbed in 95% IL with 100 mol% SO2 at 30oC to 60oC and mass SO2 during desorption after 2000 seconds
-0.20
0.20.40.60.8
11.21.41.61.8
22.22.4
0 500 1000 1500 2000 2500 3000 3500
Ma
ss
(g
)
Time (s)
-0.2
0
0.2
0.4
0.6
0.8
1
1.2
1.4
1.6
1.8
2
2.2
2.4
0 500 1000 1500 2000 2500 3000 3500
Ma
ss
(g
)
Time (s)
30°C
40°C
50°C
60°C
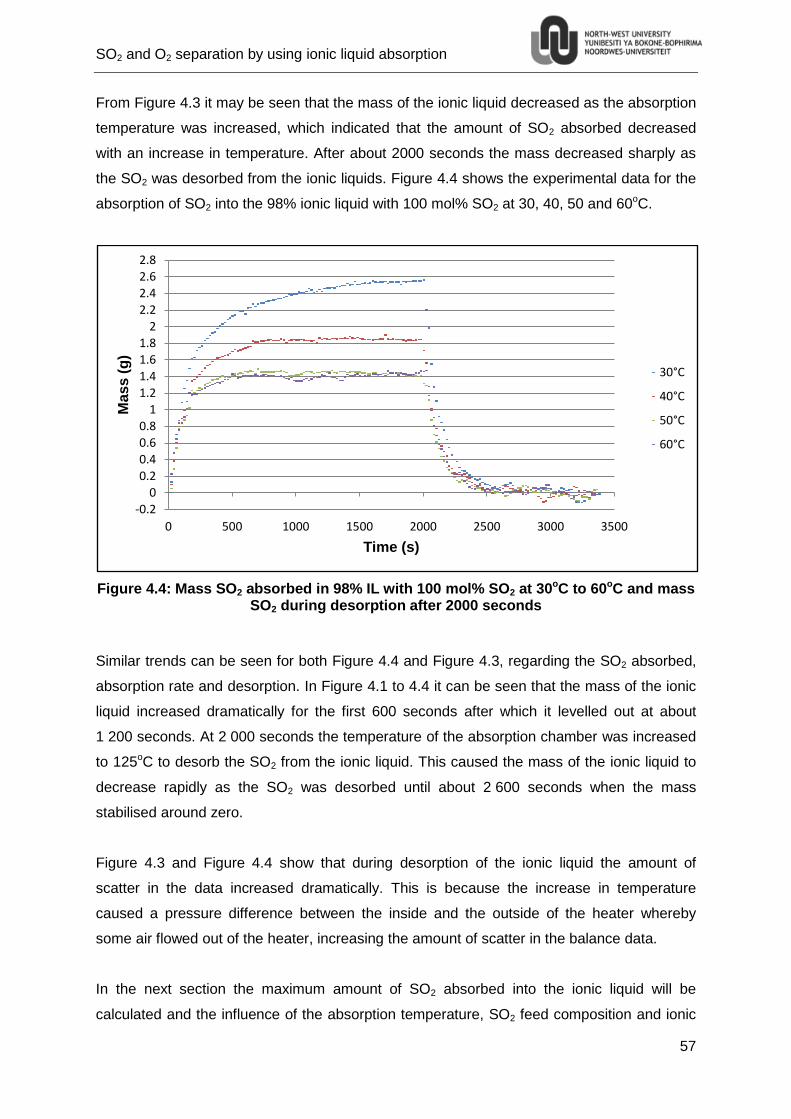
SO2 and O2 separation by using ionic liquid absorption
57
From Figure 4.3 it may be seen that the mass of the ionic liquid decreased as the absorption
temperature was increased, which indicated that the amount of SO2 absorbed decreased
with an increase in temperature. After about 2000 seconds the mass decreased sharply as
the SO2 was desorbed from the ionic liquids. Figure 4.4 shows the experimental data for the
absorption of SO2 into the 98% ionic liquid with 100 mol% SO2 at 30, 40, 50 and 60oC.
Figure 4.4: Mass SO2 absorbed in 98% IL with 100 mol% SO2 at 30oC to 60oC and mass SO2 during desorption after 2000 seconds
Similar trends can be seen for both Figure 4.4 and Figure 4.3, regarding the SO2 absorbed,
absorption rate and desorption. In Figure 4.1 to 4.4 it can be seen that the mass of the ionic
liquid increased dramatically for the first 600 seconds after which it levelled out at about
1 200 seconds. At 2 000 seconds the temperature of the absorption chamber was increased
to 125oC to desorb the SO2 from the ionic liquid. This caused the mass of the ionic liquid to
decrease rapidly as the SO2 was desorbed until about 2 600 seconds when the mass
stabilised around zero.
Figure 4.3 and Figure 4.4 show that during desorption of the ionic liquid the amount of
scatter in the data increased dramatically. This is because the increase in temperature
caused a pressure difference between the inside and the outside of the heater whereby
some air flowed out of the heater, increasing the amount of scatter in the balance data.
In the next section the maximum amount of SO2 absorbed into the ionic liquid will be
calculated and the influence of the absorption temperature, SO2 feed composition and ionic
-0.2
0
0.2
0.4
0.6
0.8
1
1.2
1.4
1.6
1.8
2
2.2
2.4
2.6
2.8
0 500 1000 1500 2000 2500 3000 3500
Ma
ss
(g
)
Time (s)
30°C
40°C
50°C
60°C
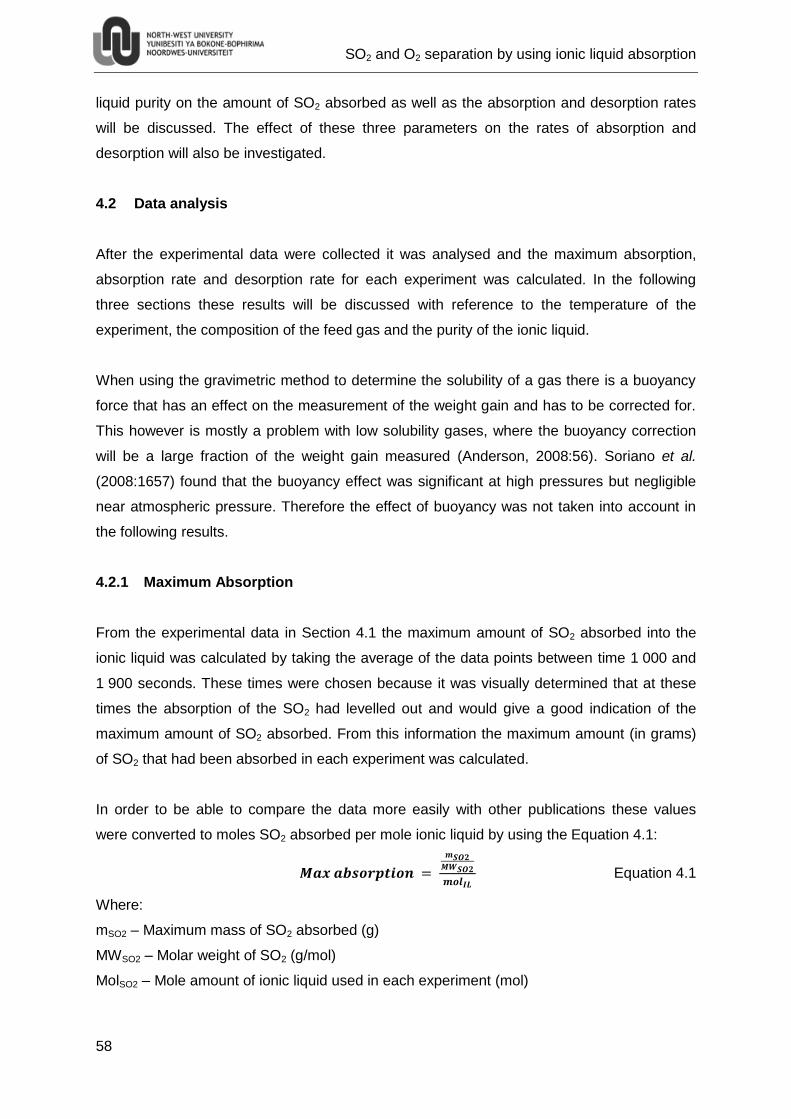
SO2 and O2 separation by using ionic liquid absorption
58
liquid purity on the amount of SO2 absorbed as well as the absorption and desorption rates
will be discussed. The effect of these three parameters on the rates of absorption and
desorption will also be investigated.
4.2 Data analysis
After the experimental data were collected it was analysed and the maximum absorption,
absorption rate and desorption rate for each experiment was calculated. In the following
three sections these results will be discussed with reference to the temperature of the
experiment, the composition of the feed gas and the purity of the ionic liquid.
When using the gravimetric method to determine the solubility of a gas there is a buoyancy
force that has an effect on the measurement of the weight gain and has to be corrected for.
This however is mostly a problem with low solubility gases, where the buoyancy correction
will be a large fraction of the weight gain measured (Anderson, 2008:56). Soriano et al.
(2008:1657) found that the buoyancy effect was significant at high pressures but negligible
near atmospheric pressure. Therefore the effect of buoyancy was not taken into account in
the following results.
4.2.1 Maximum Absorption
From the experimental data in Section 4.1 the maximum amount of SO2 absorbed into the
ionic liquid was calculated by taking the average of the data points between time 1 000 and
1 900 seconds. These times were chosen because it was visually determined that at these
times the absorption of the SO2 had levelled out and would give a good indication of the
maximum amount of SO2 absorbed. From this information the maximum amount (in grams)
of SO2 that had been absorbed in each experiment was calculated.
In order to be able to compare the data more easily with other publications these values
were converted to moles SO2 absorbed per mole ionic liquid by using the Equation 4.1:
Equation 4.1
Where:
mSO2 – Maximum mass of SO2 absorbed (g)
MWSO2 – Molar weight of SO2 (g/mol)
MolSO2 – Mole amount of ionic liquid used in each experiment (mol)
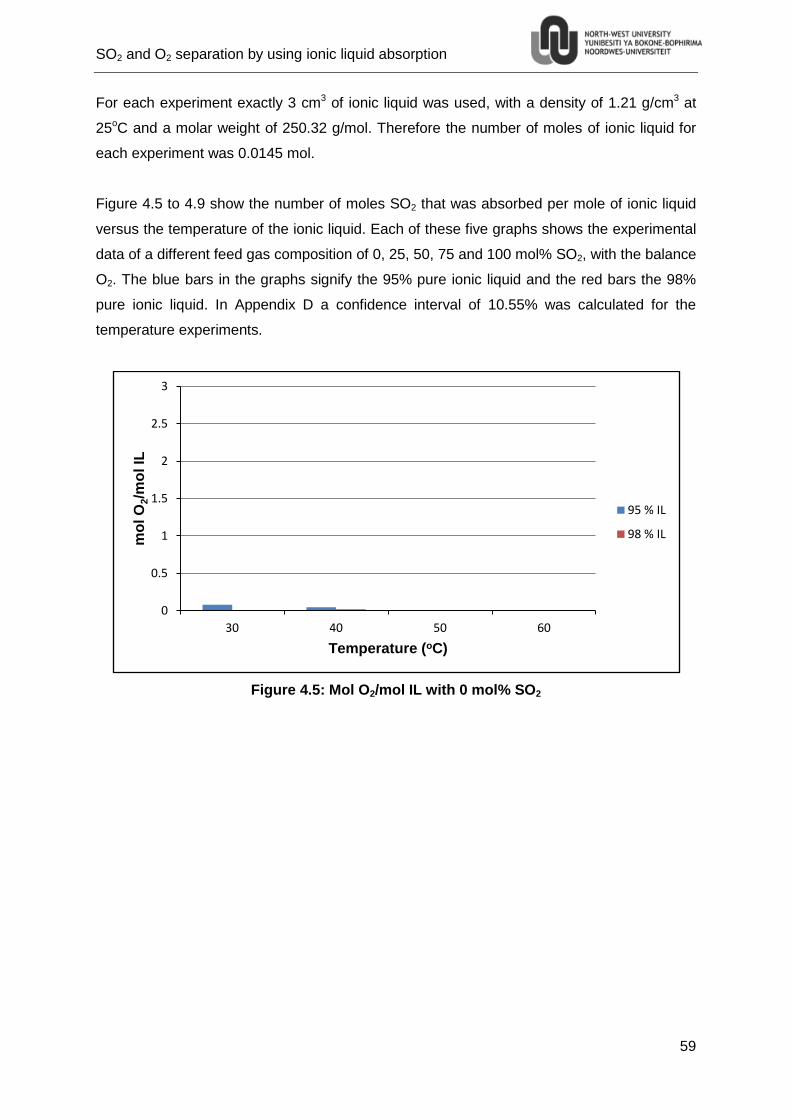
SO2 and O2 separation by using ionic liquid absorption
59
For each experiment exactly 3 cm3 of ionic liquid was used, with a density of 1.21 g/cm3 at
25oC and a molar weight of 250.32 g/mol. Therefore the number of moles of ionic liquid for
each experiment was 0.0145 mol.
Figure 4.5 to 4.9 show the number of moles SO2 that was absorbed per mole of ionic liquid
versus the temperature of the ionic liquid. Each of these five graphs shows the experimental
data of a different feed gas composition of 0, 25, 50, 75 and 100 mol% SO2, with the balance
O2. The blue bars in the graphs signify the 95% pure ionic liquid and the red bars the 98%
pure ionic liquid. In Appendix D a confidence interval of 10.55% was calculated for the
temperature experiments.
Figure 4.5: Mol O2/mol IL with 0 mol% SO2
0
0.5
1
1.5
2
2.5
3
30 40 50 60
mo
l O
2/m
ol IL
Temperature (oC)
95 % IL
98 % IL
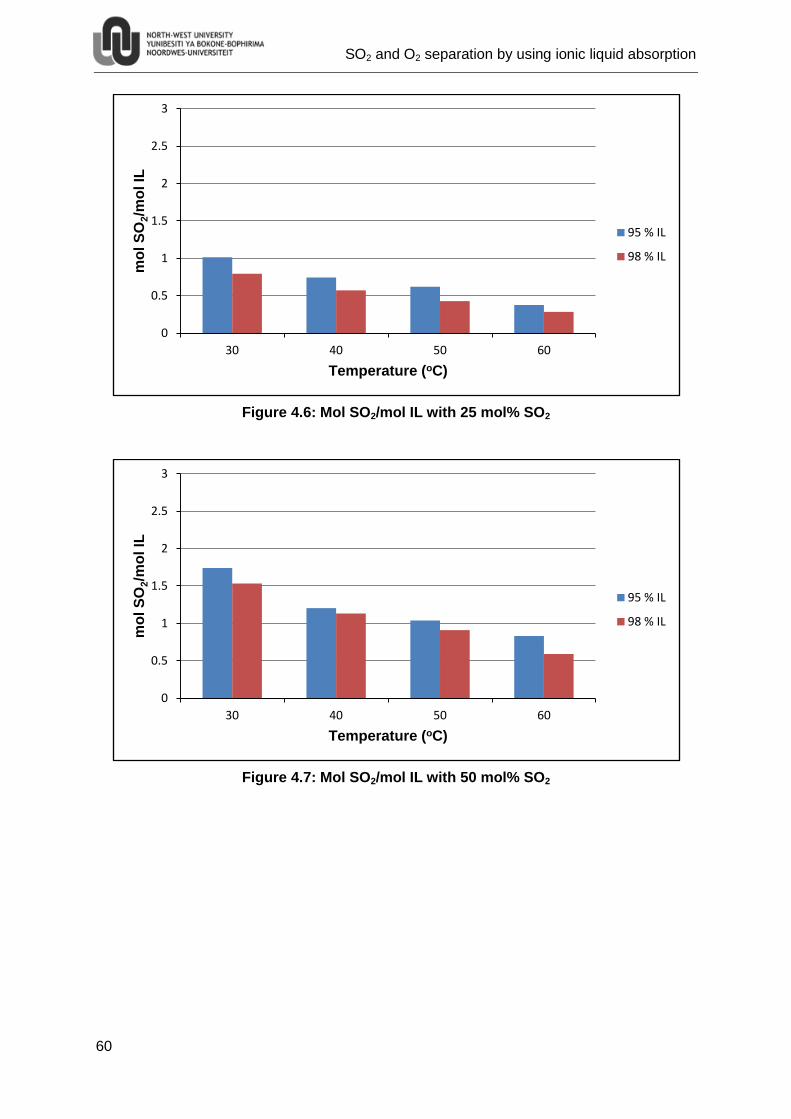
SO2 and O2 separation by using ionic liquid absorption
60
Figure 4.6: Mol SO2/mol IL with 25 mol% SO2
Figure 4.7: Mol SO2/mol IL with 50 mol% SO2
0
0.5
1
1.5
2
2.5
3
30 40 50 60
mo
l S
O2/m
ol IL
Temperature (oC)
95 % IL
98 % IL
0
0.5
1
1.5
2
2.5
3
30 40 50 60
mo
l S
O2/m
ol IL
Temperature (oC)
95 % IL
98 % IL
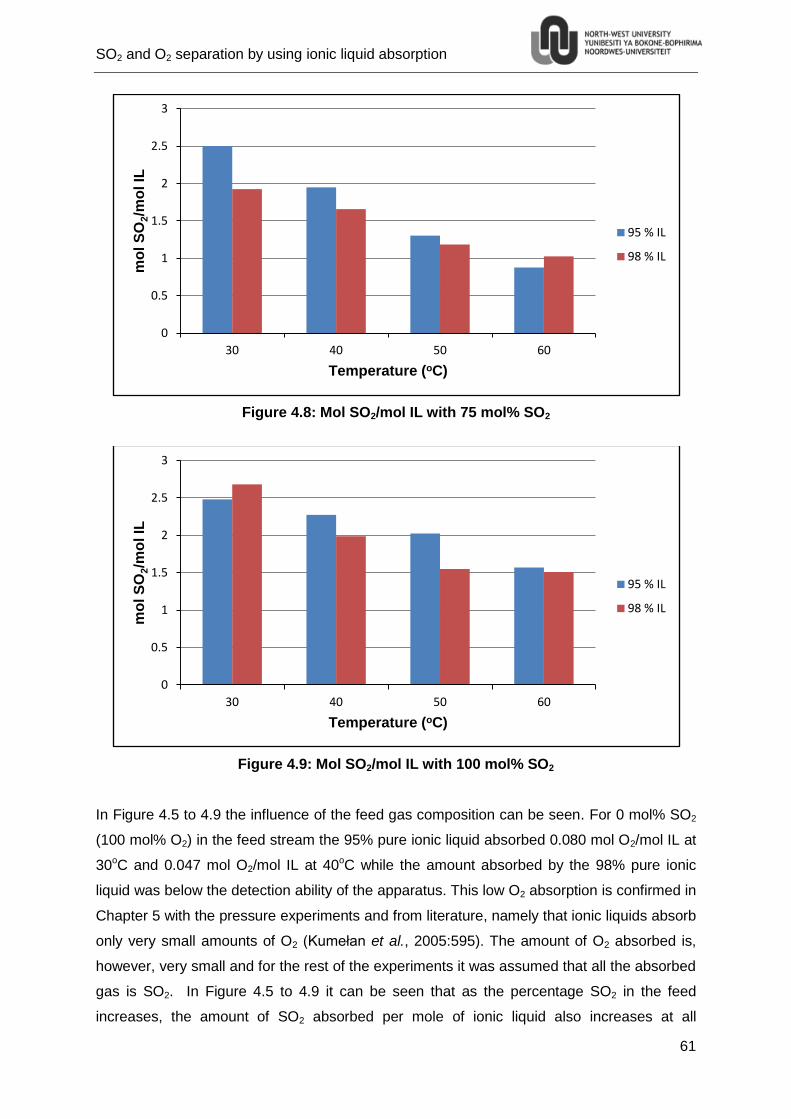
SO2 and O2 separation by using ionic liquid absorption
61
Figure 4.8: Mol SO2/mol IL with 75 mol% SO2
Figure 4.9: Mol SO2/mol IL with 100 mol% SO2
In Figure 4.5 to 4.9 the influence of the feed gas composition can be seen. For 0 mol% SO2
(100 mol% O2) in the feed stream the 95% pure ionic liquid absorbed 0.080 mol O2/mol IL at
30oC and 0.047 mol O2/mol IL at 40oC while the amount absorbed by the 98% pure ionic
liquid was below the detection ability of the apparatus. This low O2 absorption is confirmed in
Chapter 5 with the pressure experiments and from literature, namely that ionic liquids absorb
only very small amounts of O2 (Kumełan et al., 2005:595). The amount of O2 absorbed is,
however, very small and for the rest of the experiments it was assumed that all the absorbed
gas is SO2. In Figure 4.5 to 4.9 it can be seen that as the percentage SO2 in the feed
increases, the amount of SO2 absorbed per mole of ionic liquid also increases at all
0
0.5
1
1.5
2
2.5
3
30 40 50 60
mo
l S
O2/m
ol IL
Temperature (oC)
95 % IL
98 % IL
0
0.5
1
1.5
2
2.5
3
30 40 50 60
mo
l S
O2/m
ol IL
Temperature (oC)
95 % IL
98 % IL
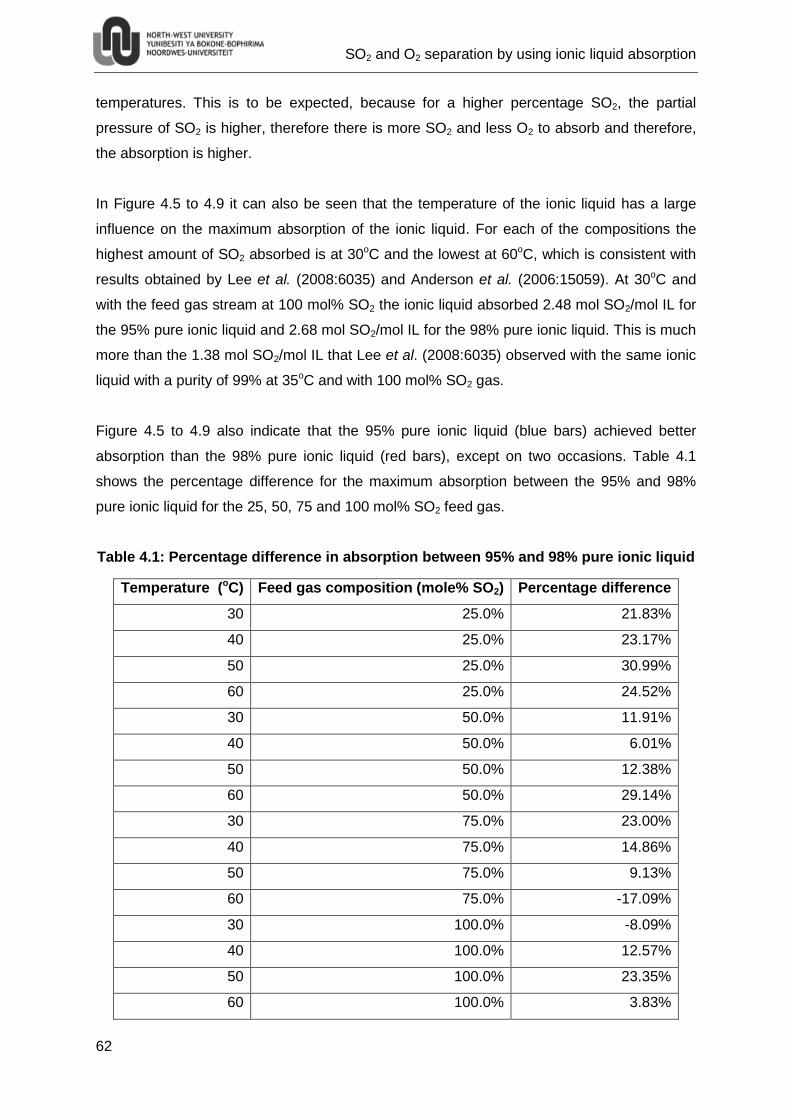
SO2 and O2 separation by using ionic liquid absorption
62
temperatures. This is to be expected, because for a higher percentage SO2, the partial
pressure of SO2 is higher, therefore there is more SO2 and less O2 to absorb and therefore,
the absorption is higher.
In Figure 4.5 to 4.9 it can also be seen that the temperature of the ionic liquid has a large
influence on the maximum absorption of the ionic liquid. For each of the compositions the
highest amount of SO2 absorbed is at 30oC and the lowest at 60oC, which is consistent with
results obtained by Lee et al. (2008:6035) and Anderson et al. (2006:15059). At 30oC and
with the feed gas stream at 100 mol% SO2 the ionic liquid absorbed 2.48 mol SO2/mol IL for
the 95% pure ionic liquid and 2.68 mol SO2/mol IL for the 98% pure ionic liquid. This is much
more than the 1.38 mol SO2/mol IL that Lee et al. (2008:6035) observed with the same ionic
liquid with a purity of 99% at 35oC and with 100 mol% SO2 gas.
Figure 4.5 to 4.9 also indicate that the 95% pure ionic liquid (blue bars) achieved better
absorption than the 98% pure ionic liquid (red bars), except on two occasions. Table 4.1
shows the percentage difference for the maximum absorption between the 95% and 98%
pure ionic liquid for the 25, 50, 75 and 100 mol% SO2 feed gas.
Table 4.1: Percentage difference in absorption between 95% and 98% pure ionic liquid
Temperature (oC) Feed gas composition (mole% SO2) Percentage difference
30 25.0% 21.83%
40 25.0% 23.17%
50 25.0% 30.99%
60 25.0% 24.52%
30 50.0% 11.91%
40 50.0% 6.01%
50 50.0% 12.38%
60 50.0% 29.14%
30 75.0% 23.00%
40 75.0% 14.86%
50 75.0% 9.13%
60 75.0% -17.09%
30 100.0% -8.09%
40 100.0% 12.57%
50 100.0% 23.35%
60 100.0% 3.83%
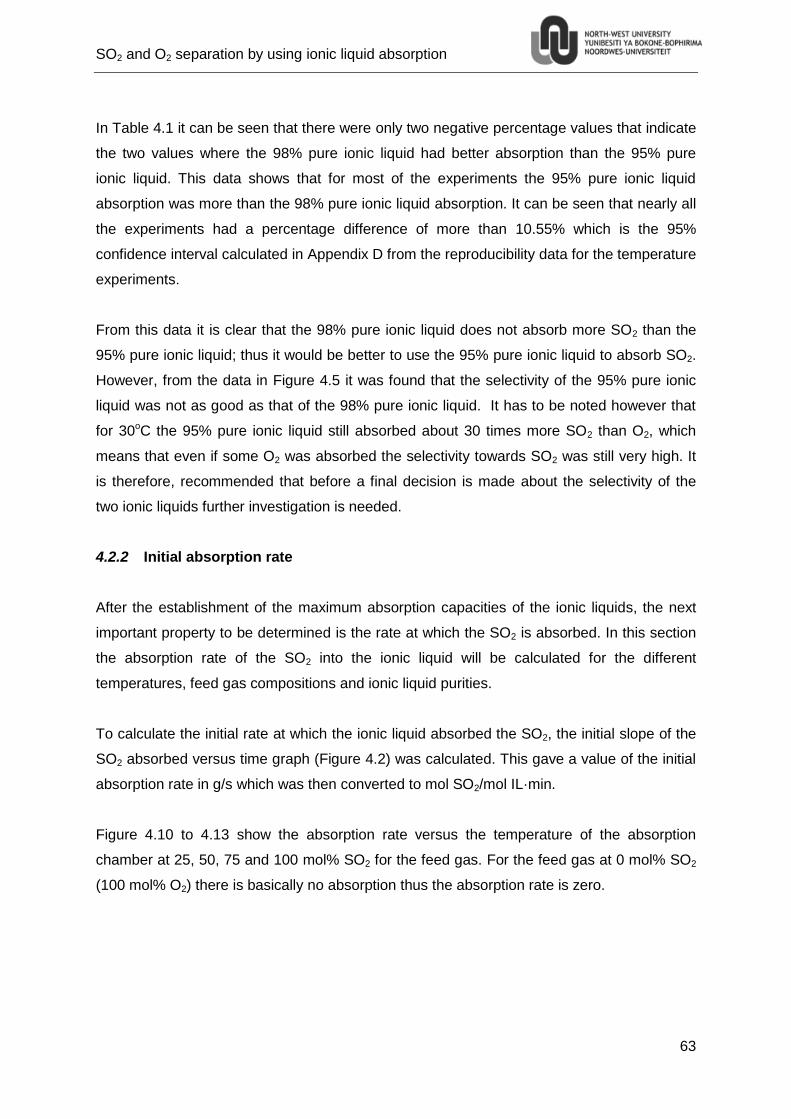
SO2 and O2 separation by using ionic liquid absorption
63
In Table 4.1 it can be seen that there were only two negative percentage values that indicate
the two values where the 98% pure ionic liquid had better absorption than the 95% pure
ionic liquid. This data shows that for most of the experiments the 95% pure ionic liquid
absorption was more than the 98% pure ionic liquid absorption. It can be seen that nearly all
the experiments had a percentage difference of more than 10.55% which is the 95%
confidence interval calculated in Appendix D from the reproducibility data for the temperature
experiments.
From this data it is clear that the 98% pure ionic liquid does not absorb more SO2 than the
95% pure ionic liquid; thus it would be better to use the 95% pure ionic liquid to absorb SO2.
However, from the data in Figure 4.5 it was found that the selectivity of the 95% pure ionic
liquid was not as good as that of the 98% pure ionic liquid. It has to be noted however that
for 30oC the 95% pure ionic liquid still absorbed about 30 times more SO2 than O2, which
means that even if some O2 was absorbed the selectivity towards SO2 was still very high. It
is therefore, recommended that before a final decision is made about the selectivity of the
two ionic liquids further investigation is needed.
4.2.2 Initial absorption rate
After the establishment of the maximum absorption capacities of the ionic liquids, the next
important property to be determined is the rate at which the SO2 is absorbed. In this section
the absorption rate of the SO2 into the ionic liquid will be calculated for the different
temperatures, feed gas compositions and ionic liquid purities.
To calculate the initial rate at which the ionic liquid absorbed the SO2, the initial slope of the
SO2 absorbed versus time graph (Figure 4.2) was calculated. This gave a value of the initial
absorption rate in g/s which was then converted to mol SO2/mol IL·min.
Figure 4.10 to 4.13 show the absorption rate versus the temperature of the absorption
chamber at 25, 50, 75 and 100 mol% SO2 for the feed gas. For the feed gas at 0 mol% SO2
(100 mol% O2) there is basically no absorption thus the absorption rate is zero.
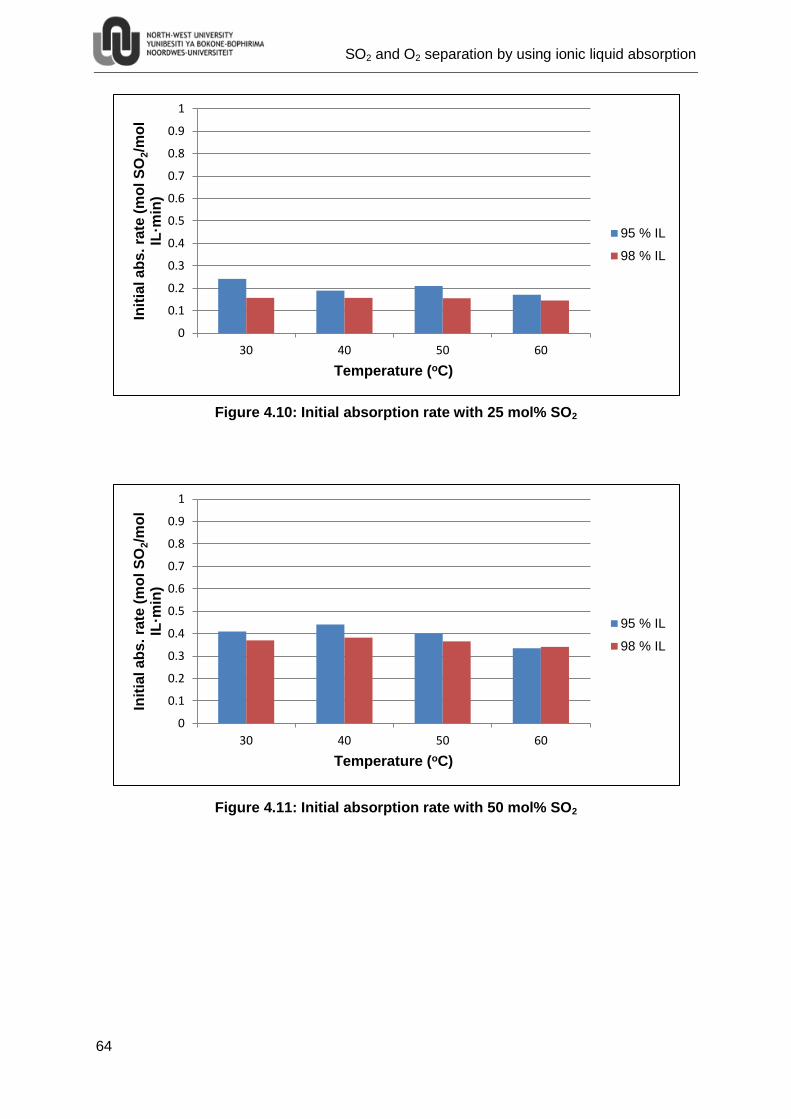
SO2 and O2 separation by using ionic liquid absorption
64
Figure 4.10: Initial absorption rate with 25 mol% SO2
Figure 4.11: Initial absorption rate with 50 mol% SO2
0
0.1
0.2
0.3
0.4
0.5
0.6
0.7
0.8
0.9
1
30 40 50 60
Init
ial a
bs
. ra
te (
mo
l S
O2/m
ol
IL·m
in)
Temperature (oC)
95 % IL
98 % IL
0
0.1
0.2
0.3
0.4
0.5
0.6
0.7
0.8
0.9
1
30 40 50 60
Init
ial a
bs
. ra
te (
mo
l S
O2/m
ol
IL·m
in)
Temperature (oC)
95 % IL
98 % IL
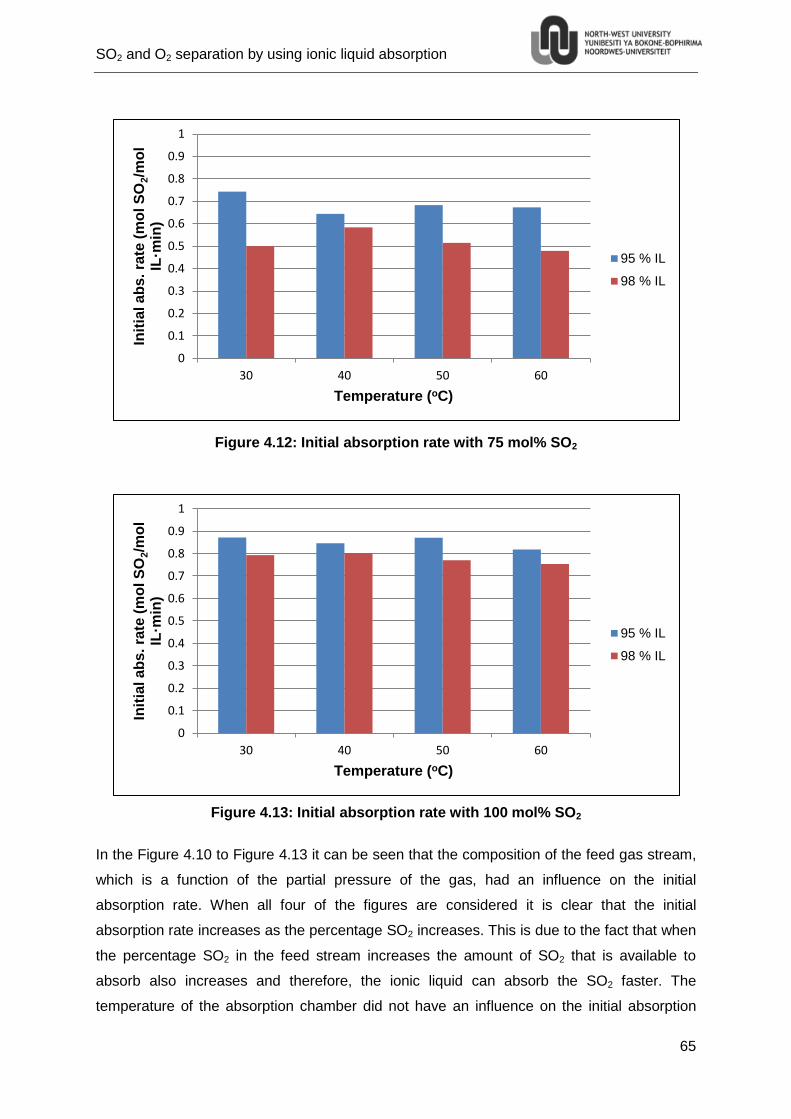
SO2 and O2 separation by using ionic liquid absorption
65
Figure 4.12: Initial absorption rate with 75 mol% SO2
Figure 4.13: Initial absorption rate with 100 mol% SO2
In the Figure 4.10 to Figure 4.13 it can be seen that the composition of the feed gas stream,
which is a function of the partial pressure of the gas, had an influence on the initial
absorption rate. When all four of the figures are considered it is clear that the initial
absorption rate increases as the percentage SO2 increases. This is due to the fact that when
the percentage SO2 in the feed stream increases the amount of SO2 that is available to
absorb also increases and therefore, the ionic liquid can absorb the SO2 faster. The
temperature of the absorption chamber did not have an influence on the initial absorption
0
0.1
0.2
0.3
0.4
0.5
0.6
0.7
0.8
0.9
1
30 40 50 60
Init
ial a
bs
. ra
te (
mo
l S
O2/m
ol
IL·m
in)
Temperature (oC)
95 % IL
98 % IL
0
0.1
0.2
0.3
0.4
0.5
0.6
0.7
0.8
0.9
1
30 40 50 60
Init
ial a
bs
. ra
te (
mo
l S
O2/m
ol
IL·m
in)
Temperature (oC)
95 % IL
98 % IL
SO2 and O2 separation by using ionic liquid absorption
66
rate. For each of the feed compositions the initial absorption rate remained almost constant
across all of the temperatures, this was contrary to the maximum absorption data. When the
absorption rates of all of the experiments are considered, it can be seen that the 95% pure
ionic liquid consistently has a higher initial absorption rate than the 98% pure ionic liquid.
This means that it will be better to use the cheaper 95% pure ionic liquid rather than the 98%
pure ionic liquid.
Lee et al. (2008:6031.) found a maximum initial absorption rate of 0.06 mol SO2/mol IL·min
at 50oC with a SO2 feed composition of 66.6 mol% with a 99% pure ionic liquid, while the
above data show an absorption rate of 0.40 mol SO2/mol IL·min for a 50 mol% SO2 feed at
50oC with the 95% pure ionic liquid. The 98% pure ionic liquid had an absorption rate of 0.36
mol SO2/mol IL·min at the same conditions. Thus the results from this study show higher
initial absorption rates than obtained by Lee et al. (2008:6031) with the same ionic liquid at
different ionic liquid purities.
4.2.3 Desorption rate
After the ionic liquid was saturated with SO2 the temperature of the absorption chamber was
increased to 125oC to desorb the SO2. The desorption rate was calculated in a similar way
as the absorption rate in Section 4.2.2. The initial slope of the SO2 absorbed versus time
graph (Figure 4.2) was calculated for the section after 2000 seconds when the SO2 was
desorbed. From this slope the initial desorption rate in g/s was obtained and then converted
to mol SO2/mol IL·min.
Figure 4.14 to Figure 4.17 show the initial desorption rate versus the feed composition at 30,
40, 50 and 60oC. Because no SO2 was absorbed at 0 mol% SO2 the desorption rate was
zero in each of the graphs.
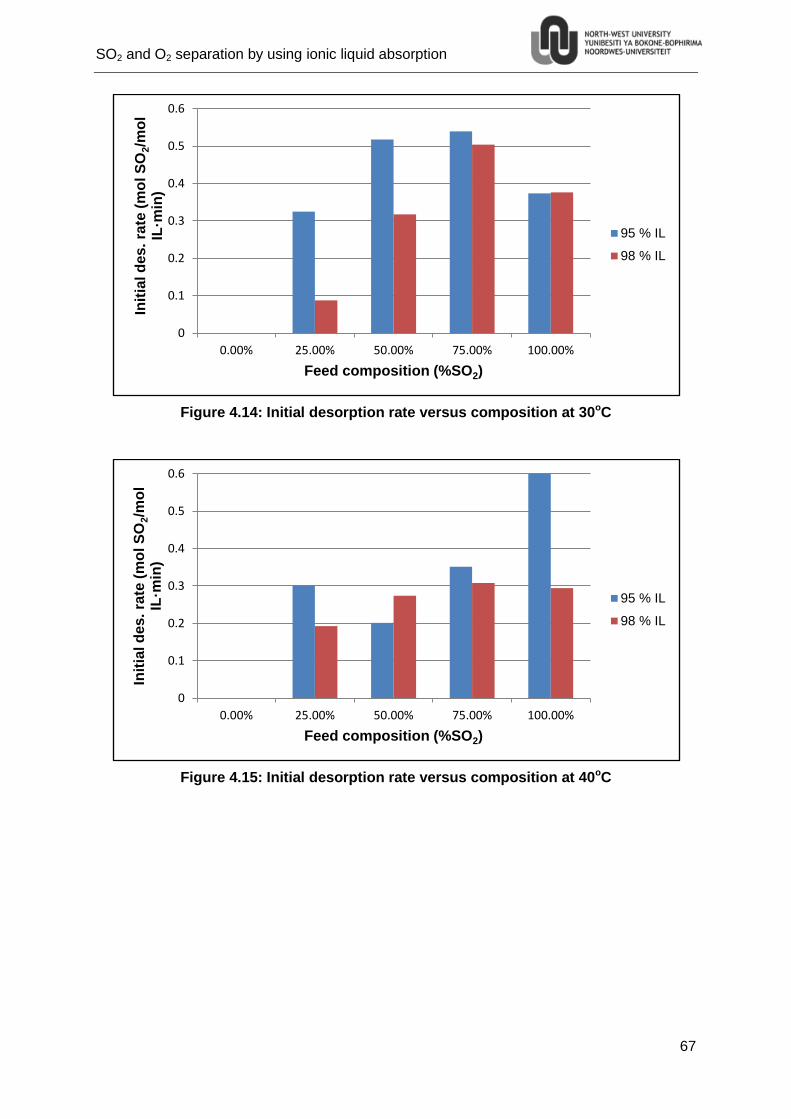
SO2 and O2 separation by using ionic liquid absorption
67
Figure 4.14: Initial desorption rate versus composition at 30oC
Figure 4.15: Initial desorption rate versus composition at 40oC
0
0.1
0.2
0.3
0.4
0.5
0.6
0.00% 25.00% 50.00% 75.00% 100.00%
Init
ial d
es
. ra
te (
mo
l S
O2/m
ol
IL·m
in)
Feed composition (%SO2)
95 % IL
98 % IL
0
0.1
0.2
0.3
0.4
0.5
0.6
0.00% 25.00% 50.00% 75.00% 100.00%
Init
ial d
es
. ra
te (
mo
l S
O2/m
ol
IL·m
in)
Feed composition (%SO2)
95 % IL
98 % IL
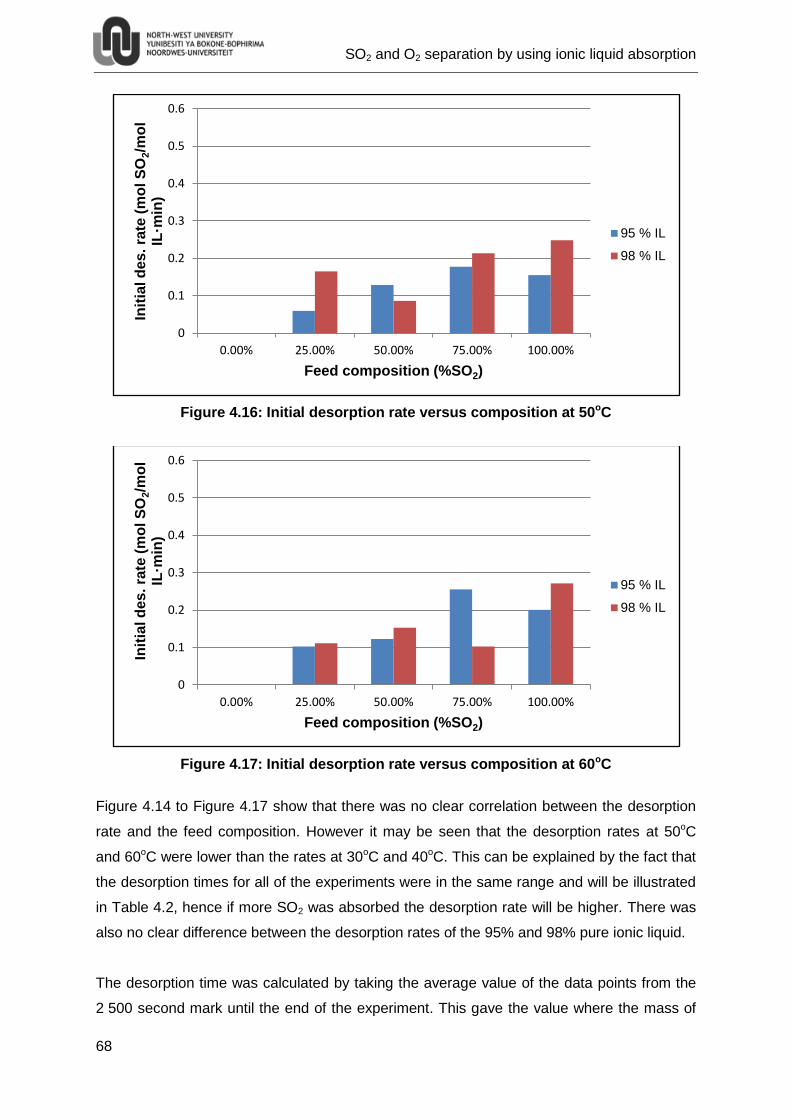
SO2 and O2 separation by using ionic liquid absorption
68
Figure 4.16: Initial desorption rate versus composition at 50oC
Figure 4.17: Initial desorption rate versus composition at 60oC
Figure 4.14 to Figure 4.17 show that there was no clear correlation between the desorption
rate and the feed composition. However it may be seen that the desorption rates at 50oC
and 60oC were lower than the rates at 30oC and 40oC. This can be explained by the fact that
the desorption times for all of the experiments were in the same range and will be illustrated
in Table 4.2, hence if more SO2 was absorbed the desorption rate will be higher. There was
also no clear difference between the desorption rates of the 95% and 98% pure ionic liquid.
The desorption time was calculated by taking the average value of the data points from the
2 500 second mark until the end of the experiment. This gave the value where the mass of
0
0.1
0.2
0.3
0.4
0.5
0.6
0.00% 25.00% 50.00% 75.00% 100.00%
Init
ial d
es
. ra
te (
mo
l S
O2/m
ol
IL·m
in)
Feed composition (%SO2)
95 % IL
98 % IL
0
0.1
0.2
0.3
0.4
0.5
0.6
0.00% 25.00% 50.00% 75.00% 100.00%
Init
ial d
es
. ra
te (
mo
l S
O2/m
ol
IL·m
in)
Feed composition (%SO2)
95 % IL
98 % IL
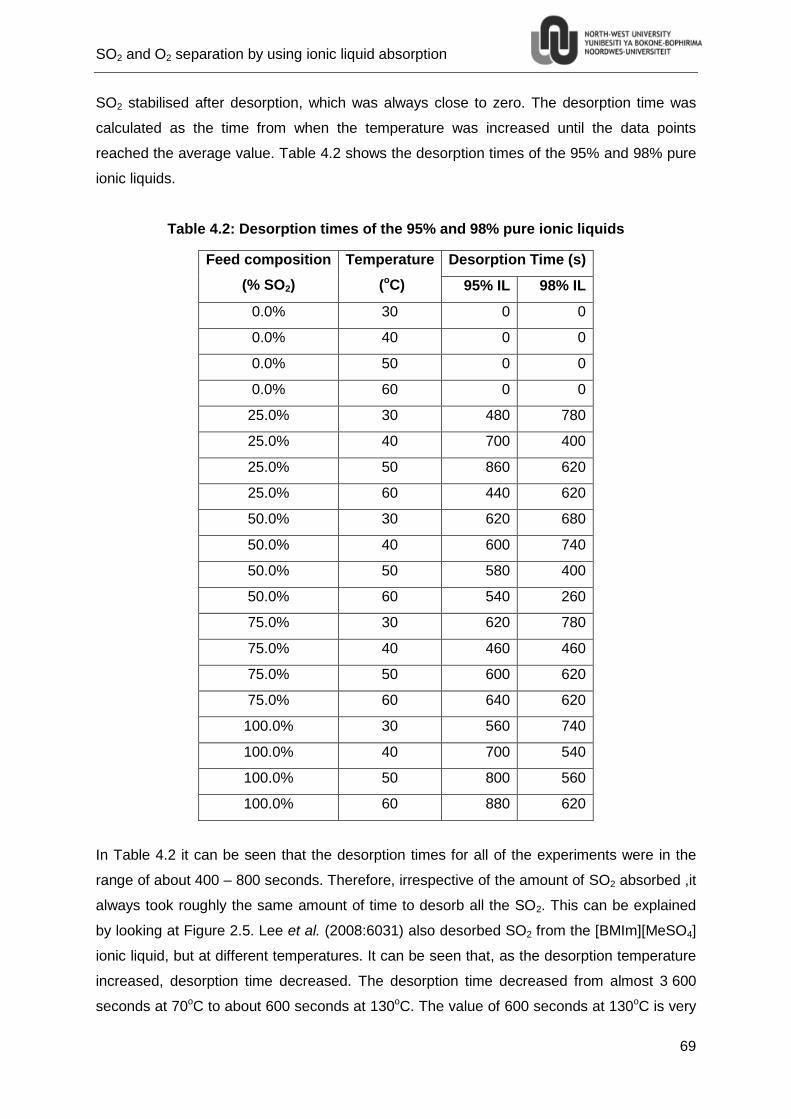
SO2 and O2 separation by using ionic liquid absorption
69
SO2 stabilised after desorption, which was always close to zero. The desorption time was
calculated as the time from when the temperature was increased until the data points
reached the average value. Table 4.2 shows the desorption times of the 95% and 98% pure
ionic liquids.
Table 4.2: Desorption times of the 95% and 98% pure ionic liquids
Feed composition
(% SO2)
Temperature
(oC)
Desorption Time (s)
95% IL 98% IL
0.0% 30 0 0
0.0% 40 0 0
0.0% 50 0 0
0.0% 60 0 0
25.0% 30 480 780
25.0% 40 700 400
25.0% 50 860 620
25.0% 60 440 620
50.0% 30 620 680
50.0% 40 600 740
50.0% 50 580 400
50.0% 60 540 260
75.0% 30 620 780
75.0% 40 460 460
75.0% 50 600 620
75.0% 60 640 620
100.0% 30 560 740
100.0% 40 700 540
100.0% 50 800 560
100.0% 60 880 620
In Table 4.2 it can be seen that the desorption times for all of the experiments were in the
range of about 400 – 800 seconds. Therefore, irrespective of the amount of SO2 absorbed ,it
always took roughly the same amount of time to desorb all the SO2. This can be explained
by looking at Figure 2.5. Lee et al. (2008:6031) also desorbed SO2 from the [BMIm][MeSO4]
ionic liquid, but at different temperatures. It can be seen that, as the desorption temperature
increased, desorption time decreased. The desorption time decreased from almost 3 600
seconds at 70oC to about 600 seconds at 130oC. The value of 600 seconds at 130oC is very
SO2 and O2 separation by using ionic liquid absorption
70
similar to the desorption times achieved in Table 4.2 above (Lee et al., 2008:6031). Thus, it
can be concluded that desorption time is mostly influenced by the desorption temperature
and because desorption temperature was kept constant for all the temperature experiments,
desorption time was always in the same range.
4.3 Data modelling
During the experiments one of the most important results obtained was the maximum
absorption of the ionic liquid as reported in Section 4.2.1. In Section 2.1.3.3, three absorption
isotherms were evaluated. It was decided to use the Langmuir isotherm to model the data
because:
- The Freundlich isotherm assumes that the amount of SO2 absorbed does not have a
limit. However from Figure 4.4 it may be seen that the amount of SO2 absorbed
reaches a maximum and does not increase any further. This is the same with all of
the experiments where a limit is reached after a certain time. The limits that is
reached is the maximum amount of SO2 that the ionic liquid can absorb that was
calculated in Section 4.2.1.
- According to Seader & Henley (2006:145) Henry’s law may not be applicable to
gasses with high solubility, even at low partial pressures. Consider the fact that O2
has a solubility of 0.080 mol O2/mol IL (Figure 4.5), H2 a solubility of 2.148×10⁻³ mol
H2/mol IL and CO a solubility of 4.458×10⁻³ mol CO/mol IL in the ionic liquid
[BMIm][MeSO4] (Kumełan et al., 2007:5). Then it can be assumed that a solubility of
around 2.50 mol SO2/mol IL is a high solubility. Also Henry’s Law is not applicable
when the graph of SO2 absorbed versus the partial pressure of SO2 is not a straight
line. This can be seen in Figure 4.18 and Figure 4.19 where the absorption data is
plotted versus the partial pressure of the SO2. In Figure 4.18 and Figure 4.19 linear
trend lines were also plotted together with error bars that indicate the 10.55%
confidence interval. From these figures it may be seen that there are some points
that do not fall within the linear band indicated by the trend line, also the general
shape of the data is not 100% linear.
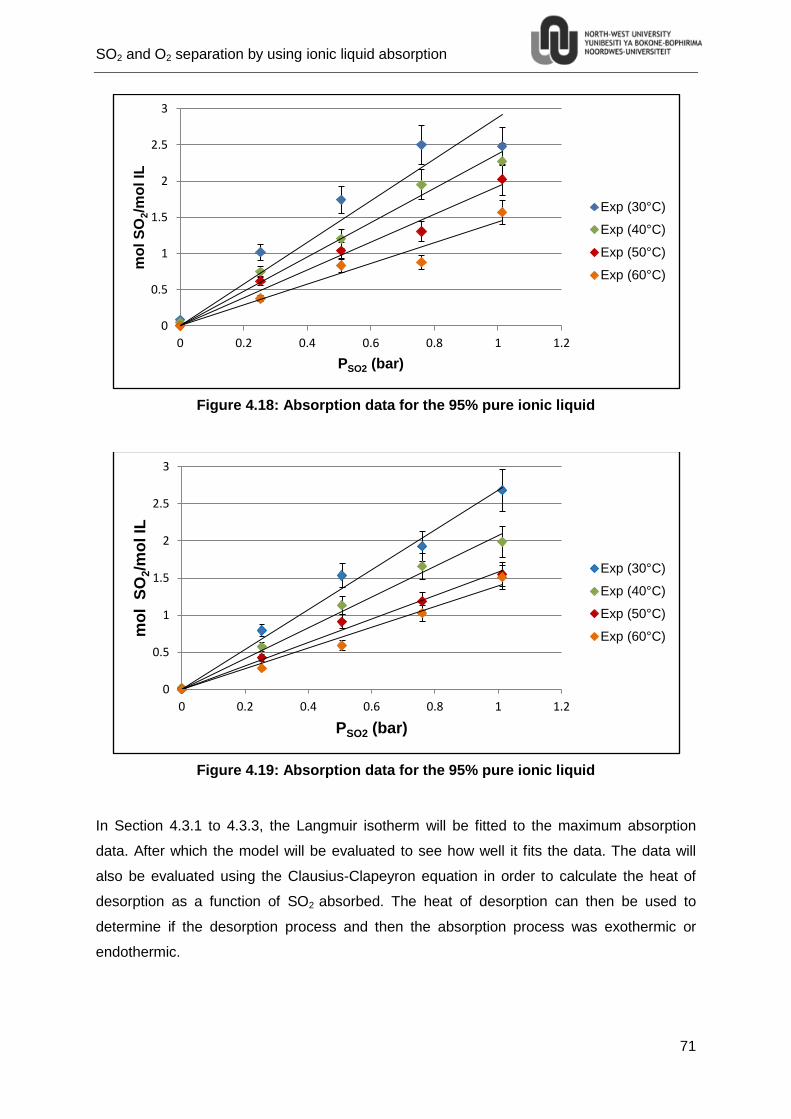
SO2 and O2 separation by using ionic liquid absorption
71
Figure 4.18: Absorption data for the 95% pure ionic liquid
Figure 4.19: Absorption data for the 95% pure ionic liquid
In Section 4.3.1 to 4.3.3, the Langmuir isotherm will be fitted to the maximum absorption
data. After which the model will be evaluated to see how well it fits the data. The data will
also be evaluated using the Clausius-Clapeyron equation in order to calculate the heat of
desorption as a function of SO2 absorbed. The heat of desorption can then be used to
determine if the desorption process and then the absorption process was exothermic or
endothermic.
0
0.5
1
1.5
2
2.5
3
0 0.2 0.4 0.6 0.8 1 1.2
mo
l S
O2/m
ol IL
PSO2 (bar)
Exp (30°C)
Exp (40°C)
Exp (50°C)
Exp (60°C)
0
0.5
1
1.5
2
2.5
3
0 0.2 0.4 0.6 0.8 1 1.2
mo
l S
O2/m
ol IL
PSO2 (bar)
Exp (30°C)
Exp (40°C)
Exp (50°C)
Exp (60°C)
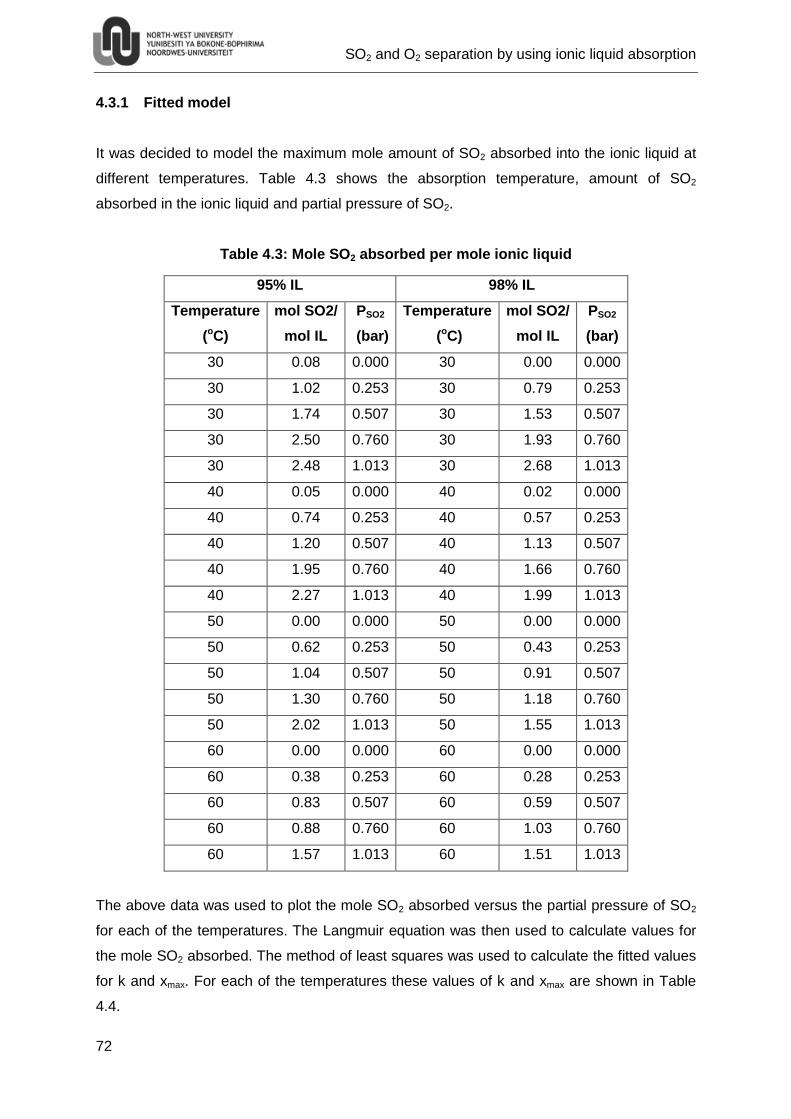
SO2 and O2 separation by using ionic liquid absorption
72
4.3.1 Fitted model
It was decided to model the maximum mole amount of SO2 absorbed into the ionic liquid at
different temperatures. Table 4.3 shows the absorption temperature, amount of SO2
absorbed in the ionic liquid and partial pressure of SO2.
Table 4.3: Mole SO2 absorbed per mole ionic liquid
95% IL 98% IL
Temperature
(oC)
mol SO2/
mol IL
PSO2
(bar)
Temperature
(oC)
mol SO2/
mol IL
PSO2
(bar)
30 0.08 0.000 30 0.00 0.000
30 1.02 0.253 30 0.79 0.253
30 1.74 0.507 30 1.53 0.507
30 2.50 0.760 30 1.93 0.760
30 2.48 1.013 30 2.68 1.013
40 0.05 0.000 40 0.02 0.000
40 0.74 0.253 40 0.57 0.253
40 1.20 0.507 40 1.13 0.507
40 1.95 0.760 40 1.66 0.760
40 2.27 1.013 40 1.99 1.013
50 0.00 0.000 50 0.00 0.000
50 0.62 0.253 50 0.43 0.253
50 1.04 0.507 50 0.91 0.507
50 1.30 0.760 50 1.18 0.760
50 2.02 1.013 50 1.55 1.013
60 0.00 0.000 60 0.00 0.000
60 0.38 0.253 60 0.28 0.253
60 0.83 0.507 60 0.59 0.507
60 0.88 0.760 60 1.03 0.760
60 1.57 1.013 60 1.51 1.013
The above data was used to plot the mole SO2 absorbed versus the partial pressure of SO2
for each of the temperatures. The Langmuir equation was then used to calculate values for
the mole SO2 absorbed. The method of least squares was used to calculate the fitted values
for k and xmax. For each of the temperatures these values of k and xmax are shown in Table
4.4.
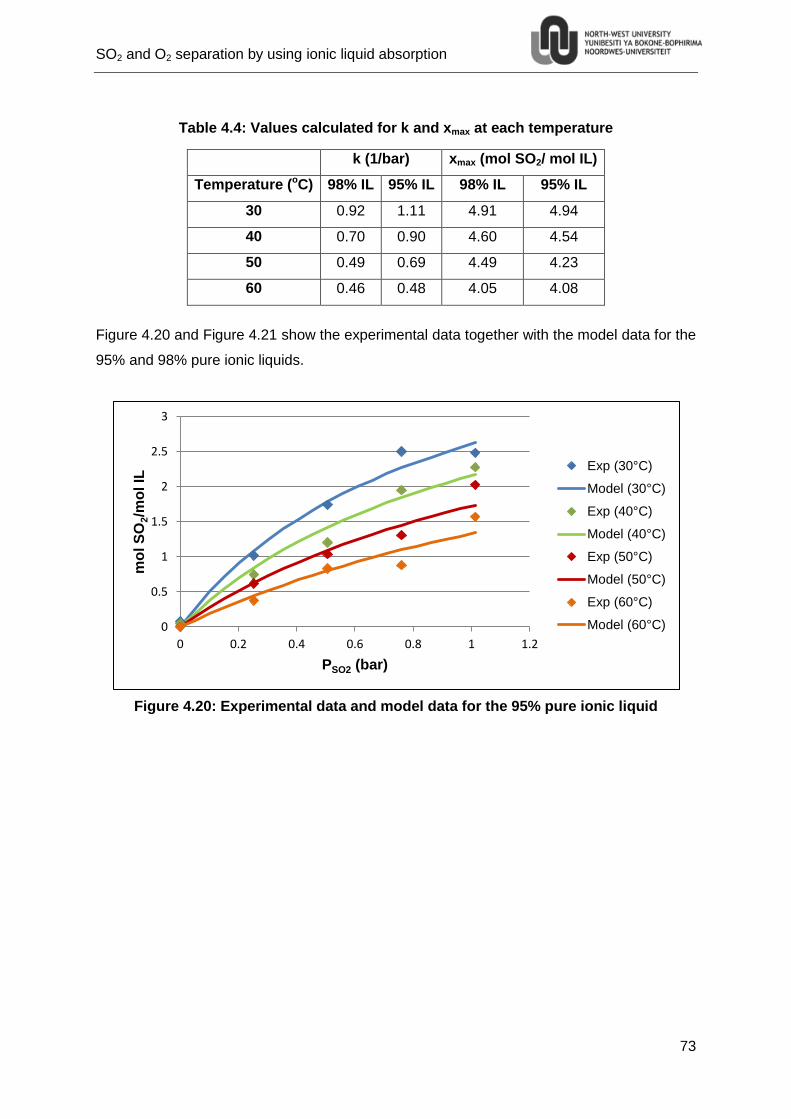
SO2 and O2 separation by using ionic liquid absorption
73
Table 4.4: Values calculated for k and xmax at each temperature
k (1/bar) xmax (mol SO2/ mol IL)
Temperature (oC) 98% IL 95% IL 98% IL 95% IL
30 0.92 1.11 4.91 4.94
40 0.70 0.90 4.60 4.54
50 0.49 0.69 4.49 4.23
60 0.46 0.48 4.05 4.08
Figure 4.20 and Figure 4.21 show the experimental data together with the model data for the
95% and 98% pure ionic liquids.
Figure 4.20: Experimental data and model data for the 95% pure ionic liquid
0
0.5
1
1.5
2
2.5
3
0 0.2 0.4 0.6 0.8 1 1.2
mo
l S
O2/m
ol IL
PSO2 (bar)
Exp (30°C)
Model (30°C)
Exp (40°C)
Model (40°C)
Exp (50°C)
Model (50°C)
Exp (60°C)
Model (60°C)
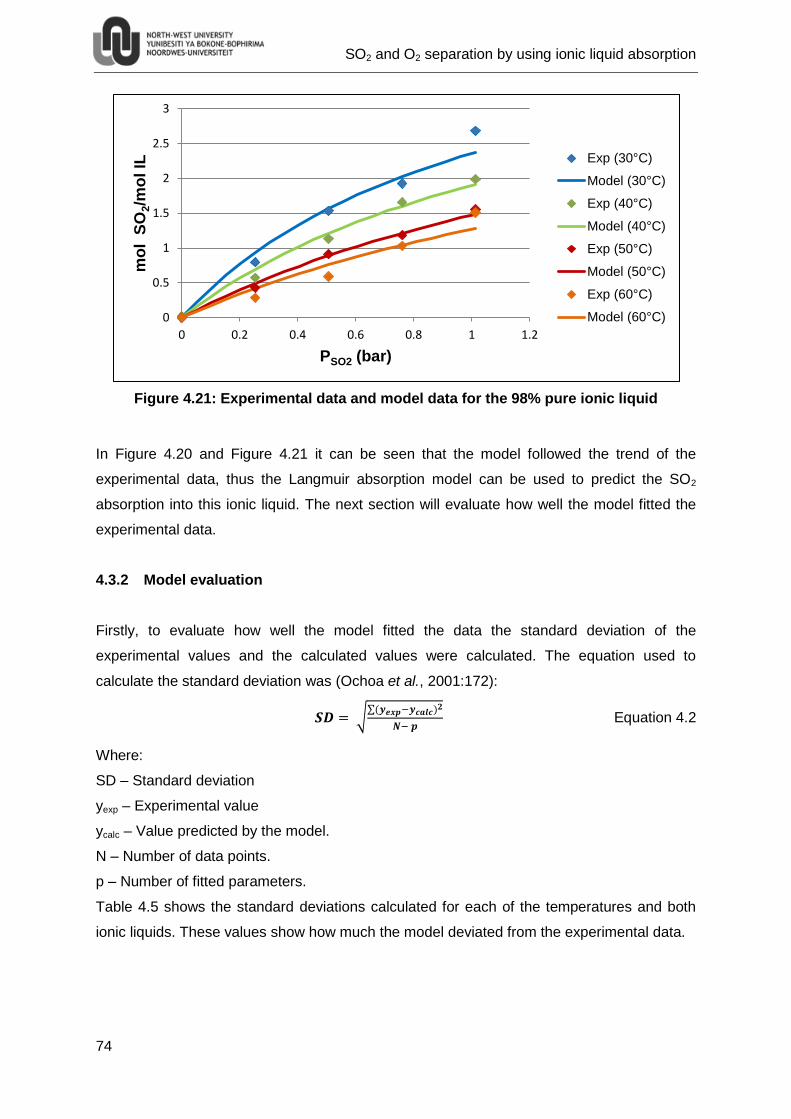
SO2 and O2 separation by using ionic liquid absorption
74
Figure 4.21: Experimental data and model data for the 98% pure ionic liquid
In Figure 4.20 and Figure 4.21 it can be seen that the model followed the trend of the
experimental data, thus the Langmuir absorption model can be used to predict the SO2
absorption into this ionic liquid. The next section will evaluate how well the model fitted the
experimental data.
4.3.2 Model evaluation
Firstly, to evaluate how well the model fitted the data the standard deviation of the
experimental values and the calculated values were calculated. The equation used to
calculate the standard deviation was (Ochoa et al., 2001:172):
√∑( )
Equation 4.2
Where:
SD – Standard deviation
yexp – Experimental value
ycalc – Value predicted by the model.
N – Number of data points.
p – Number of fitted parameters.
Table 4.5 shows the standard deviations calculated for each of the temperatures and both
ionic liquids. These values show how much the model deviated from the experimental data.
0
0.5
1
1.5
2
2.5
3
0 0.2 0.4 0.6 0.8 1 1.2
mo
l S
O2/m
ol IL
PSO2 (bar)
Exp (30°C)
Model (30°C)
Exp (40°C)
Model (40°C)
Exp (50°C)
Model (50°C)
Exp (60°C)
Model (60°C)
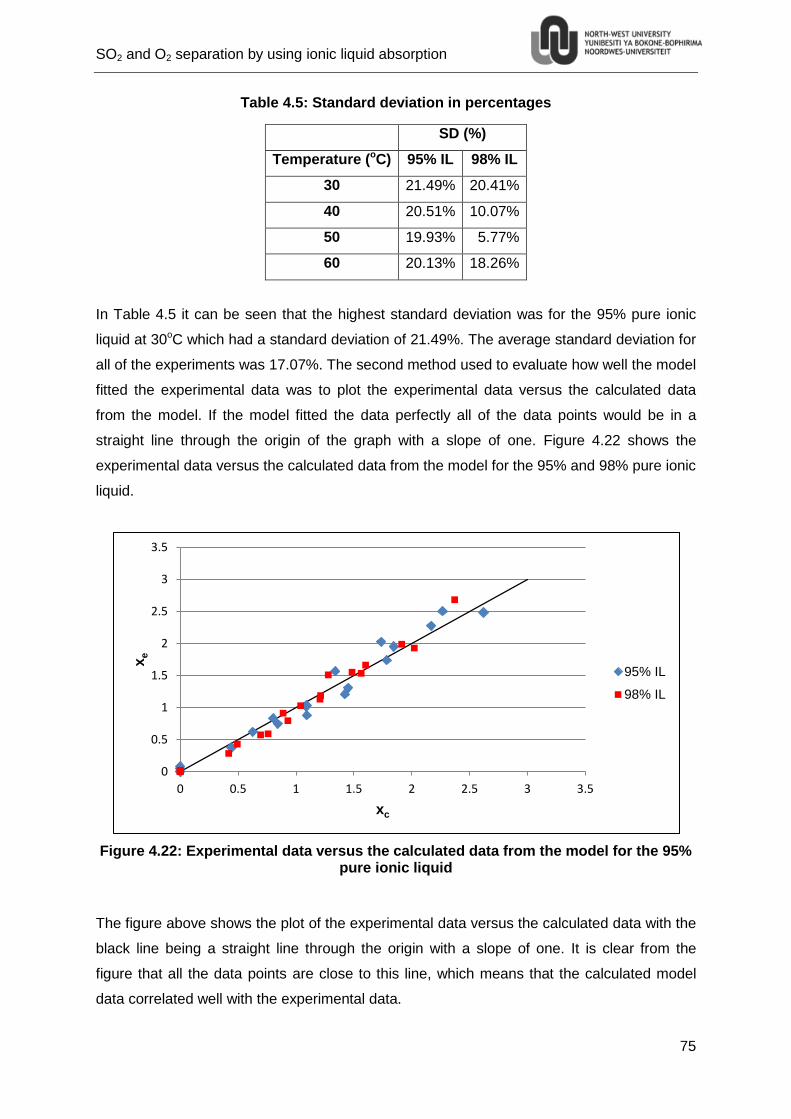
SO2 and O2 separation by using ionic liquid absorption
75
Table 4.5: Standard deviation in percentages
SD (%)
Temperature (oC) 95% IL 98% IL
30 21.49% 20.41%
40 20.51% 10.07%
50 19.93% 5.77%
60 20.13% 18.26%
In Table 4.5 it can be seen that the highest standard deviation was for the 95% pure ionic
liquid at 30oC which had a standard deviation of 21.49%. The average standard deviation for
all of the experiments was 17.07%. The second method used to evaluate how well the model
fitted the experimental data was to plot the experimental data versus the calculated data
from the model. If the model fitted the data perfectly all of the data points would be in a
straight line through the origin of the graph with a slope of one. Figure 4.22 shows the
experimental data versus the calculated data from the model for the 95% and 98% pure ionic
liquid.
Figure 4.22: Experimental data versus the calculated data from the model for the 95% pure ionic liquid
The figure above shows the plot of the experimental data versus the calculated data with the
black line being a straight line through the origin with a slope of one. It is clear from the
figure that all the data points are close to this line, which means that the calculated model
data correlated well with the experimental data.
0
0.5
1
1.5
2
2.5
3
3.5
0 0.5 1 1.5 2 2.5 3 3.5
xe
xc
95% IL
98% IL
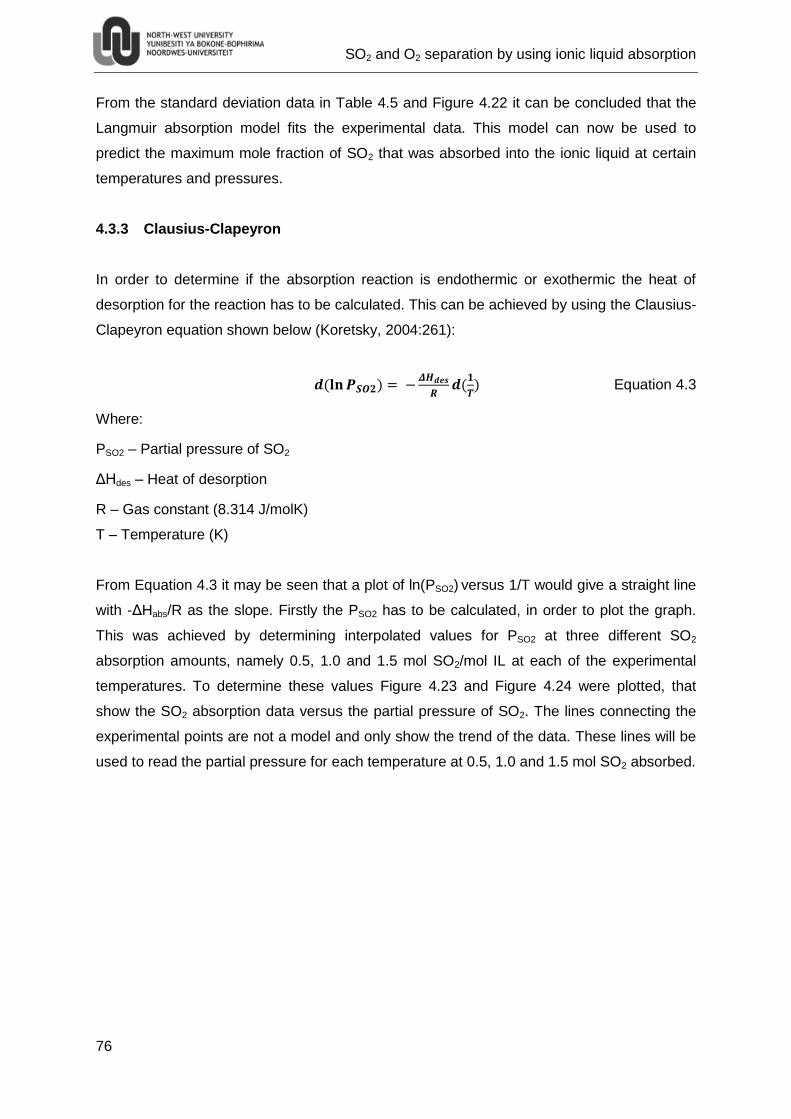
SO2 and O2 separation by using ionic liquid absorption
76
From the standard deviation data in Table 4.5 and Figure 4.22 it can be concluded that the
Langmuir absorption model fits the experimental data. This model can now be used to
predict the maximum mole fraction of SO2 that was absorbed into the ionic liquid at certain
temperatures and pressures.
4.3.3 Clausius-Clapeyron
In order to determine if the absorption reaction is endothermic or exothermic the heat of
desorption for the reaction has to be calculated. This can be achieved by using the Clausius-
Clapeyron equation shown below (Koretsky, 2004:261):
( )
(
) Equation 4.3
Where:
PSO2 – Partial pressure of SO2
ΔHdes – Heat of desorption
R – Gas constant (8.314 J/molK)
T – Temperature (K)
From Equation 4.3 it may be seen that a plot of ln(PSO2) versus 1/T would give a straight line
with -ΔHabs/R as the slope. Firstly the PSO2 has to be calculated, in order to plot the graph.
This was achieved by determining interpolated values for PSO2 at three different SO2
absorption amounts, namely 0.5, 1.0 and 1.5 mol SO2/mol IL at each of the experimental
temperatures. To determine these values Figure 4.23 and Figure 4.24 were plotted, that
show the SO2 absorption data versus the partial pressure of SO2. The lines connecting the
experimental points are not a model and only show the trend of the data. These lines will be
used to read the partial pressure for each temperature at 0.5, 1.0 and 1.5 mol SO2 absorbed.
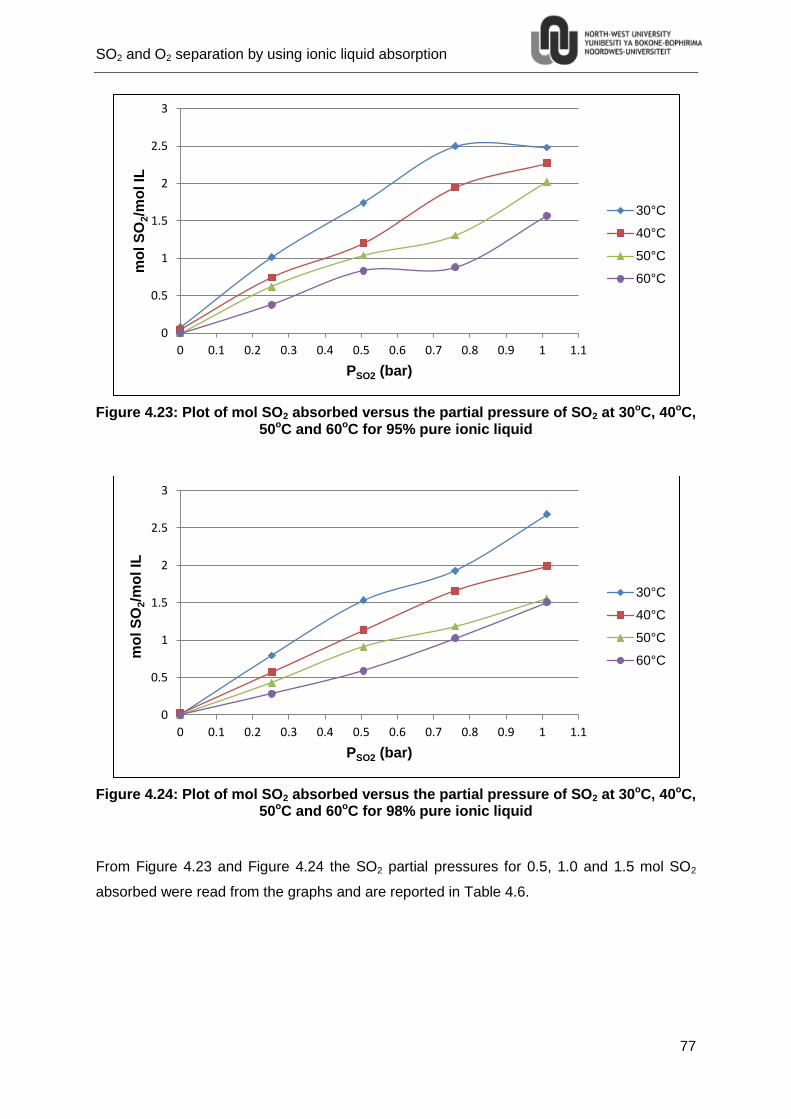
SO2 and O2 separation by using ionic liquid absorption
77
Figure 4.23: Plot of mol SO2 absorbed versus the partial pressure of SO2 at 30oC, 40oC, 50oC and 60oC for 95% pure ionic liquid
Figure 4.24: Plot of mol SO2 absorbed versus the partial pressure of SO2 at 30oC, 40oC, 50oC and 60oC for 98% pure ionic liquid
From Figure 4.23 and Figure 4.24 the SO2 partial pressures for 0.5, 1.0 and 1.5 mol SO2
absorbed were read from the graphs and are reported in Table 4.6.
0
0.5
1
1.5
2
2.5
3
0 0.1 0.2 0.3 0.4 0.5 0.6 0.7 0.8 0.9 1 1.1
mo
l S
O2/m
ol IL
PSO2 (bar)
30°C
40°C
50°C
60°C
0
0.5
1
1.5
2
2.5
3
0 0.1 0.2 0.3 0.4 0.5 0.6 0.7 0.8 0.9 1 1.1
mo
l S
O2/m
ol IL
PSO2 (bar)
30°C
40°C
50°C
60°C
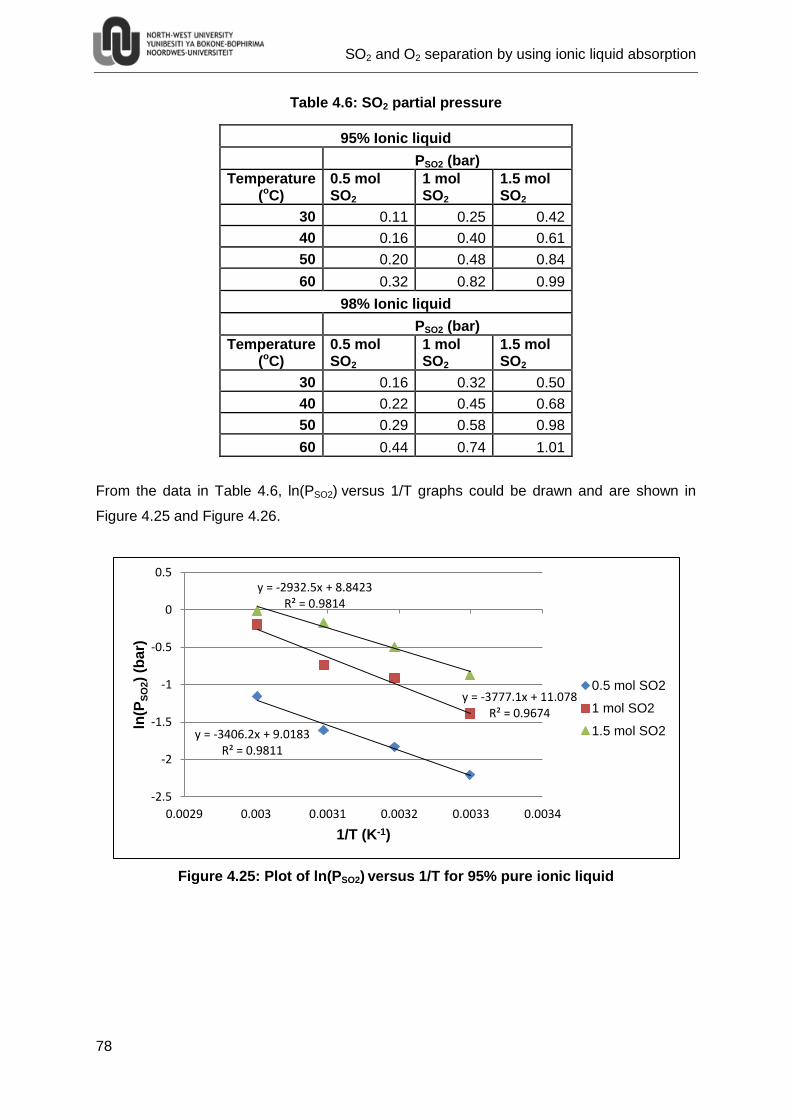
SO2 and O2 separation by using ionic liquid absorption
78
Table 4.6: SO2 partial pressure
95% Ionic liquid
PSO2 (bar)
Temperature (oC)
0.5 mol SO2
1 mol SO2
1.5 mol SO2
30 0.11 0.25 0.42
40 0.16 0.40 0.61
50 0.20 0.48 0.84
60 0.32 0.82 0.99
98% Ionic liquid
PSO2 (bar)
Temperature (oC)
0.5 mol SO2
1 mol SO2
1.5 mol SO2
30 0.16 0.32 0.50
40 0.22 0.45 0.68
50 0.29 0.58 0.98
60 0.44 0.74 1.01
From the data in Table 4.6, ln(PSO2) versus 1/T graphs could be drawn and are shown in
Figure 4.25 and Figure 4.26.
Figure 4.25: Plot of ln(PSO2) versus 1/T for 95% pure ionic liquid
y = -3406.2x + 9.0183 R² = 0.9811
y = -3777.1x + 11.078 R² = 0.9674
y = -2932.5x + 8.8423 R² = 0.9814
-2.5
-2
-1.5
-1
-0.5
0
0.5
0.0029 0.003 0.0031 0.0032 0.0033 0.0034
ln(P
SO
2)
(bar)
1/T (K-1)
0.5 mol SO2
1 mol SO2
1.5 mol SO2
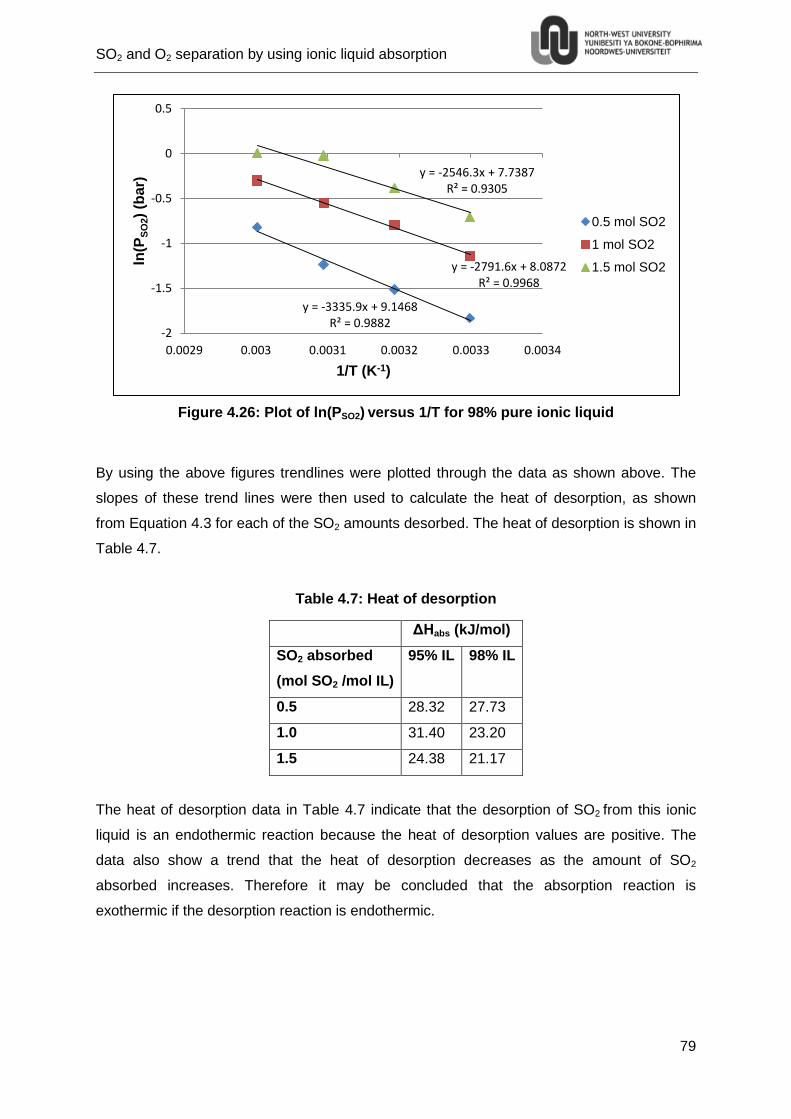
SO2 and O2 separation by using ionic liquid absorption
79
Figure 4.26: Plot of ln(PSO2) versus 1/T for 98% pure ionic liquid
By using the above figures trendlines were plotted through the data as shown above. The
slopes of these trend lines were then used to calculate the heat of desorption, as shown
from Equation 4.3 for each of the SO2 amounts desorbed. The heat of desorption is shown in
Table 4.7.
Table 4.7: Heat of desorption
ΔHabs (kJ/mol)
SO2 absorbed
(mol SO2 /mol IL)
95% IL 98% IL
0.5 28.32 27.73
1.0 31.40 23.20
1.5 24.38 21.17
The heat of desorption data in Table 4.7 indicate that the desorption of SO2 from this ionic
liquid is an endothermic reaction because the heat of desorption values are positive. The
data also show a trend that the heat of desorption decreases as the amount of SO2
absorbed increases. Therefore it may be concluded that the absorption reaction is
exothermic if the desorption reaction is endothermic.
y = -3335.9x + 9.1468 R² = 0.9882
y = -2791.6x + 8.0872 R² = 0.9968
y = -2546.3x + 7.7387 R² = 0.9305
-2
-1.5
-1
-0.5
0
0.5
0.0029 0.003 0.0031 0.0032 0.0033 0.0034
ln(P
SO
2)
(bar)
1/T (K-1)
0.5 mol SO2
1 mol SO2
1.5 mol SO2

SO2 and O2 separation by using ionic liquid absorption
80
SO2 and O2 separation by using ionic liquid absorption
81
5. Chapter 5
Pressure experiments – Results,
discussion and observations
5.1 Experimental results
The raw experimental data for the pressure experiments, as well as the volumes of the
chambers and the constants used in the calculations, can be found in Appendix C. These
results were used in the next section to plot Figure 5.1 and Figure 5.2.
5.2 Analysed data
Figure 5.1 shows the number of moles of gas absorbed into the ionic liquid for O2 and SO2
during each experimental run. For the O2 experiments the pressure stabilised about five
minutes after valve V-2 was opened to let the gas from E-1 into E-2. This is because the
ionic liquid absorbs the O2 very poorly and therefore after about five minutes the maximum
amount of O2 had been absorbed.
For the SO2 experiments the pressure did not stabilise after five minutes as with the O2, but
changed for an extended period of time. During the experiment the absorption takes place
very rapidly for the first ten minutes then it starts to slow down as the concentration of the
SO2 in the chambers decreases. The reason the concentration has an influence on the rate
of absorption is because the absorption is a function of diffusion, which is a function of
concentration. Thus, as the concentration of the SO2 decreases the diffusion rate will
decrease and therefore, the rate of absorption will also decrease. It should also be noted
that the rate of diffusion is influenced by both temperature and viscosity through the diffusion
coefficient (Miller, 1924:724). The influence of the concentration as well as the temperature
and viscosity is discussed in Equation 5.1and 5.2. Hence the reason the pressure keeps on
changing is because the ionic liquid has a very high selectivity towards SO2 and the rate of
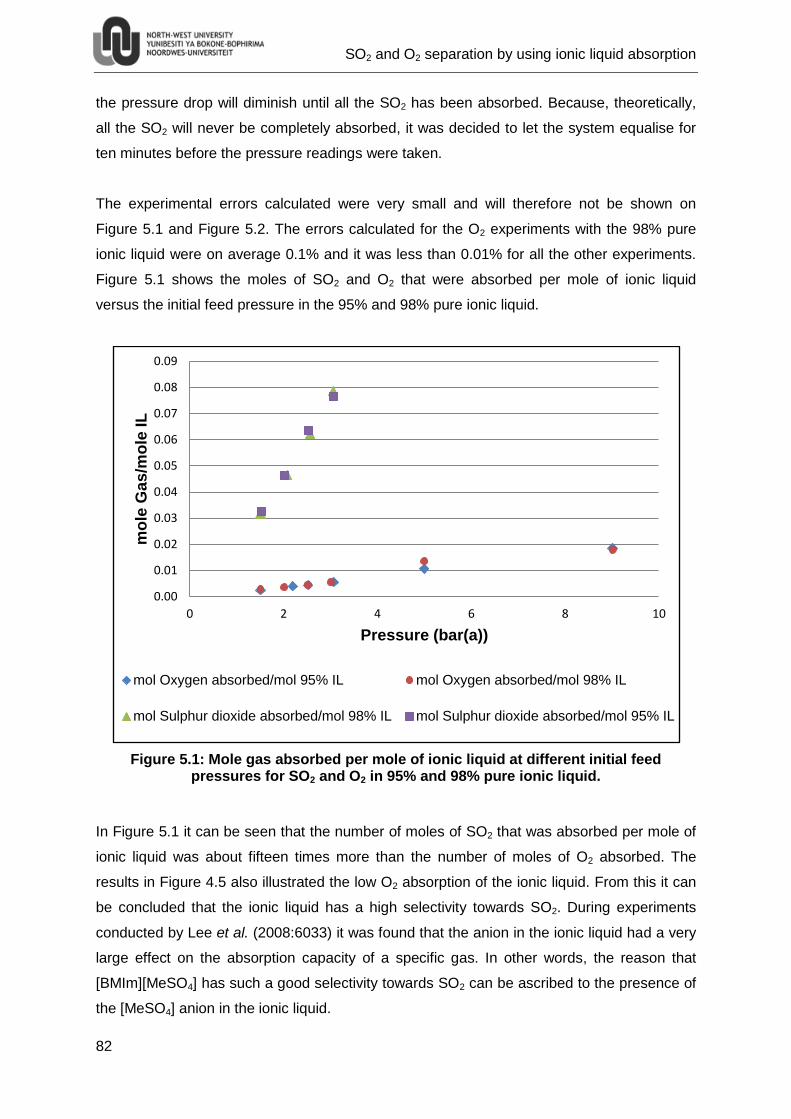
SO2 and O2 separation by using ionic liquid absorption
82
the pressure drop will diminish until all the SO2 has been absorbed. Because, theoretically,
all the SO2 will never be completely absorbed, it was decided to let the system equalise for
ten minutes before the pressure readings were taken.
The experimental errors calculated were very small and will therefore not be shown on
Figure 5.1 and Figure 5.2. The errors calculated for the O2 experiments with the 98% pure
ionic liquid were on average 0.1% and it was less than 0.01% for all the other experiments.
Figure 5.1 shows the moles of SO2 and O2 that were absorbed per mole of ionic liquid
versus the initial feed pressure in the 95% and 98% pure ionic liquid.
Figure 5.1: Mole gas absorbed per mole of ionic liquid at different initial feed pressures for SO2 and O2 in 95% and 98% pure ionic liquid.
In Figure 5.1 it can be seen that the number of moles of SO2 that was absorbed per mole of
ionic liquid was about fifteen times more than the number of moles of O2 absorbed. The
results in Figure 4.5 also illustrated the low O2 absorption of the ionic liquid. From this it can
be concluded that the ionic liquid has a high selectivity towards SO2. During experiments
conducted by Lee et al. (2008:6033) it was found that the anion in the ionic liquid had a very
large effect on the absorption capacity of a specific gas. In other words, the reason that
[BMIm][MeSO4] has such a good selectivity towards SO2 can be ascribed to the presence of
the [MeSO4] anion in the ionic liquid.
0.00
0.01
0.02
0.03
0.04
0.05
0.06
0.07
0.08
0.09
0 2 4 6 8 10
mo
le G
as
/mo
le IL
Pressure (bar(a))
mol Oxygen absorbed/mol 95% IL mol Oxygen absorbed/mol 98% IL
mol Sulphur dioxide absorbed/mol 98% IL mol Sulphur dioxide absorbed/mol 95% IL
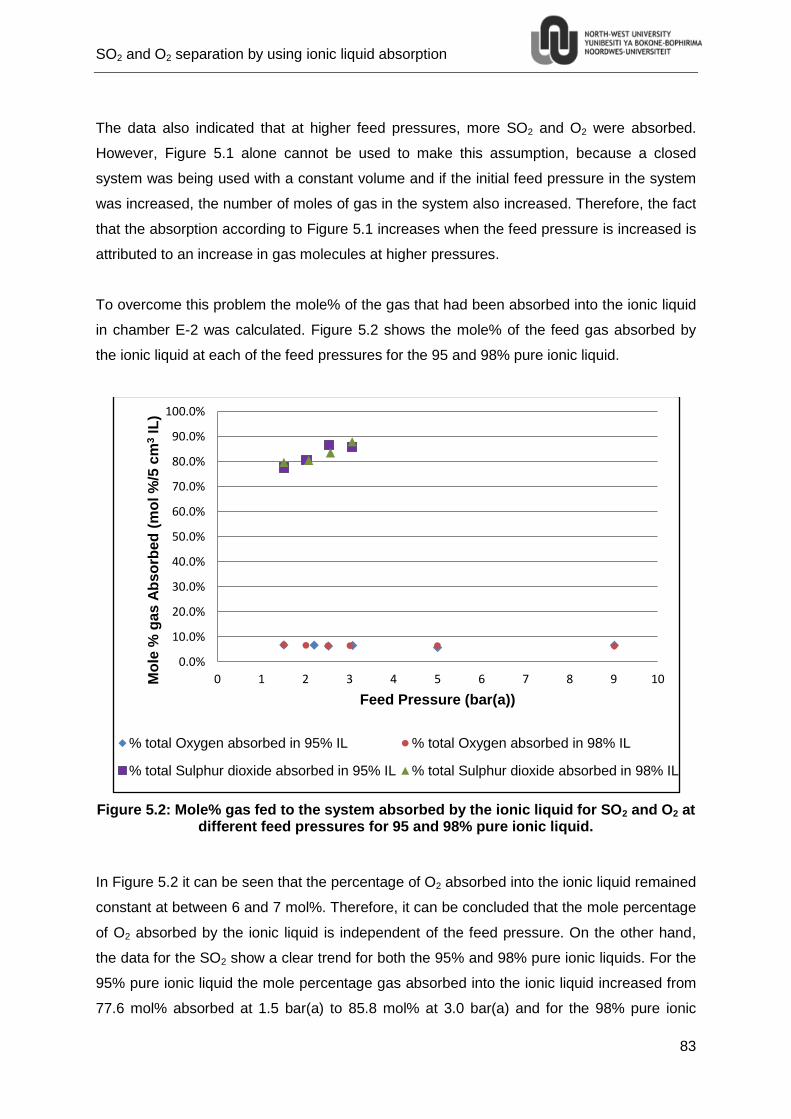
SO2 and O2 separation by using ionic liquid absorption
83
The data also indicated that at higher feed pressures, more SO2 and O2 were absorbed.
However, Figure 5.1 alone cannot be used to make this assumption, because a closed
system was being used with a constant volume and if the initial feed pressure in the system
was increased, the number of moles of gas in the system also increased. Therefore, the fact
that the absorption according to Figure 5.1 increases when the feed pressure is increased is
attributed to an increase in gas molecules at higher pressures.
To overcome this problem the mole% of the gas that had been absorbed into the ionic liquid
in chamber E-2 was calculated. Figure 5.2 shows the mole% of the feed gas absorbed by
the ionic liquid at each of the feed pressures for the 95 and 98% pure ionic liquid.
Figure 5.2: Mole% gas fed to the system absorbed by the ionic liquid for SO2 and O2 at different feed pressures for 95 and 98% pure ionic liquid.
In Figure 5.2 it can be seen that the percentage of O2 absorbed into the ionic liquid remained
constant at between 6 and 7 mol%. Therefore, it can be concluded that the mole percentage
of O2 absorbed by the ionic liquid is independent of the feed pressure. On the other hand,
the data for the SO2 show a clear trend for both the 95% and 98% pure ionic liquids. For the
95% pure ionic liquid the mole percentage gas absorbed into the ionic liquid increased from
77.6 mol% absorbed at 1.5 bar(a) to 85.8 mol% at 3.0 bar(a) and for the 98% pure ionic
0.0%
10.0%
20.0%
30.0%
40.0%
50.0%
60.0%
70.0%
80.0%
90.0%
100.0%
0 1 2 3 4 5 6 7 8 9 10Mo
le %
gas
Ab
so
rbed
(m
ol %
/5 c
m3 IL
)
Feed Pressure (bar(a))
% total Oxygen absorbed in 95% IL % total Oxygen absorbed in 98% IL
% total Sulphur dioxide absorbed in 95% IL % total Sulphur dioxide absorbed in 98% IL
SO2 and O2 separation by using ionic liquid absorption
84
liquid the trend increased from 79.7 mol% absorbed at 1.5 bar(a) to 87.9 mol% at 3.0 bar(a).
These absorption results were obtained after the setup was allowed 10 minutes to reach
equilibrium. When no mechanical stirring is possible in the sample (like the above
experiments) equilibrium is reached only by diffusion of the gas into the sample (Anderson,
2008:56). Therefore trends observed in Figure 5.2 can be explained by Fick’s law of
diffusion, which is shown in Equation 5.1 (Seader & Henley, 2006:8):
Equation 5.1
Where:
JAz – Is the molar flux of A by ordinary diffusion in the positive z direction.
DAB – Diffusion coefficient
CA – Molar concentration of A
– Concentration gradient of A, which is negative in the direction of ordinary diffusion.
Equation 5.1 shows that the molar flux and thus the rate of mass transfer of A is influenced
by the concentration gradient of A. Because it is a closed system the concentration of the
gas will increase when the feed pressure is increased. Therefore, the results in Figure 5.2
can be explained by the fact that as the feed pressure is increased the concentration, and
naturally the concentration gradient, of the SO2 is also increased. Fick’s law shows that if the
concentration gradient is increased the rate of mass transfer will increase and because the
system was only allowed ten minutes to reach equilibrium the SO2 absorption will also
increase, as seen from the results in Figure 5.2. For pressures above 3 bar(a) it is unknown
what the absorption trend will be, and further testing is required to determine how the
absorption will be affected by these higher pressures. Equation 5.1 also holds true for the O2
absorption, however because of the [MeSO4] anion in the ionic liquid that has a good
selectivity towards SO2 the percentage of O2 that is absorbed does not increase in Figure
5.2.
Additionally the rate of mass transfer is also influenced by both the temperature and the
viscosity of the ionic liquid through the diffusion coefficient and should not be ignored. This
influence can be expressed with the Stokes-Einstein equation shown below. (Miller,
1924:724):
Equation 5.2
Where:
DAB – Diffusion coefficient
R – Gas constant (R = 8.314 J/mol·K)
T – Absolute temperature (K)
SO2 and O2 separation by using ionic liquid absorption
85
NA – Avogadro’s number (N = 6.0221415 × 10²³)
η – Viscosity
r – Radius of a diffusing particle
This equation however is only valid under the following conditions:
- The particles move independently of each other.
- The particles have the same average kinetic energy as gas molecules at the same
temperature.
- The equation describes spherical particles moving in a solvent of proportionately
small molecules.
The final condition is not met in the case of SO2 moving in an ionic liquid. Hence the
Sutherland equation can be used in this case (Miller, 1924:743):
Equation 5.3
Or simplified to (Vorotyntsev et al., 2010:5065):
Equation 5.4
Where:
kb - Boltzmann constant (1.3806503 × 10⁻²³ m2 kg s-2K-1)
This equation is exactly the same as the Stokes-Einstein equation except for the
denominator 4 instead of 6.
Equation 5.4 shows the relation between the diffusion coefficient (that influences the rate of
mass transfer in Equation 5.1), temperature and the viscosity of the ionic liquid. From
Equation 5.4 it may be seen that when the temperature of the ionic liquid increases or the
viscosity decreases the diffusion coefficient will increase. When this happens the rate of
mass transfer in Equation 5.1 will also increase.
The decrease of the ionic liquid viscosity during the SO2 absorption process will be
discussed in section 5.3.1. According to Equation 5.4 this would mean that the rate of
absorption should increase as more SO2 was absorbed, however as stated at the beginning
of Section 5.2 the absorption rate decreased over time. Hence it can be concluded that the
effect of the viscosity on the rate of absorption was smaller than that of the SO2
concentration.
SO2 and O2 separation by using ionic liquid absorption
86
5.3 Additional results and observations
This section will describe some of the changes to the ionic liquids that were observed during
the course of the pressure experiments. Experiments were also carried out to determine the
change of ionic liquid volume during absorption. This section will discuss the results obtained
from the volume experiments, as well as some conclusions and interesting observations
about the ionic liquid observed during the experiments.
5.3.1 Physical changes to the ionic liquid
During the experiments the following changes were observed:
- The colour of the ionic liquid changed when it was used repeatedly. The 95% pure
ionic liquid changed from light yellow to yellow and the 98% pure ionic liquid changed
from colourless to yellow. After the change in colour the performance of the ionic
liquids was not affected and the absorption capacity remained the same. Similar
results were obtained by BASF in their pilot plant where the ionic liquid was used for
three months and turned black, but it did not affect the ionic liquid performance. The
colorant responsible for the change in colour has not been isolated yet because the
quantities are very low; however, it is assumed that oligomers of the imidazole or
even radical ions might be responsible for the change in colour (BASF, 2011).
Therefore, if the colour of the ionic liquid changed during the experiments or in the
HyS processes its performance would not be affected.
- The viscosity of both the 95% and 98% pure ionic liquid changed during the
experiments. At the start of the experiments the ionic liquid was more viscous than
water, almost like cooking oil, but when the SO2 was absorbed into the ionic liquid
the viscosity decreased noticeably. After the SO2 had been desorbed from the ionic
liquid and the liquid had cooled to room temperature the viscosity returned back to
normal. As discussed in Section 2.2.1.4 a lower viscosity is advantageous for
pressure drop, heat transfer and mass transfer.
5.3.2 Changes in ionic liquid volume
It was expected that the volume of the ionic liquid would change when SO2 was absorbed.
From the results in Figure 5.2 it is known that at higher pressures more SO2 would be
absorbed into the ionic liquid. Hence, if the volume of the ionic liquid increased when the
pressure is increased it could be concluded that the increase in volume of the ionic liquid
SO2 and O2 separation by using ionic liquid absorption
87
would give an indication of the amount of SO2 absorbed. To test this theory the change in
volume of the ionic liquid before and after SO2 absorption would be determined. To do this
the 95% pure ionic liquid was saturated with SO2 for twelve hours under constant SO2 feed
pressures of 1.5 and 2.0 bar(a), respectively. The results obtained from these two
experiments are as follows:
- For the 1.5 bar(a) feed pressure the volume of the ionic liquid expanded from 5.00
cm3 to 7.78 cm3. This is an expansion of 55.50%.
- For the 2.0 bar(a) feed pressure the volume of the ionic liquid expanded from 5.00
cm3 to 9.19 cm3 . This is an expansion of 83.73%.
From these results it can be seen that the volume of the ionic liquid increased dramatically
when large amounts of SO2 was absorbed. It also confirms the theory that the volume
increase is larger when more SO2 is absorbed. This result is of crucial importance in a setup
like the present, where the volume of the chambers is an important parameter. Thus, large
volume changes as reported above would greatly affect the calculations made in Section
5.2. However, because chamber E-1 had such a small volume the amount of SO2 available
for absorption in each of the pressure experiments was very small and the volume of the
ionic liquid in chamber E-2 was not altered dramatically. This lead to the following
conclusions:
- The absorption results shown in Figure 5.1 and Figure 5.2 show only a small fraction
of what the ionic liquid can absorb, because only a small amount of SO2 was
available in the setup.
- The volume change of ionic liquids as a result of absorption is an important aspect of
ionic liquids that needs to be investigated further in order to design future equipment
and process units to be able to handle the volume increase.
During these experiments some interesting observations were made:
- When the ionic liquid was almost completely saturated with SO2 even a slight
disturbance to the liquid would result in some of the SO2 to desorb. For example,
when the chamber was opened and the pressure allowed to equalise to atmospheric
pressure some of the SO2 desorbed from the ionic liquid. This also happened when
the ionic liquid was stirred. At the end of the experiment an attempt was made to
remove the ionic liquid from the pressure chamber using a syringe. However, when
an attempt was made to transfer the liquid from the chamber to the syringe, only SO2
was transferred. This happened because the change in pressure inside the syringe
caused the SO2 to desorb out of the liquid. (A video is available on the included CD
as Appendix F).
SO2 and O2 separation by using ionic liquid absorption
88
- When the ionic liquid was placed in a heated oil bath to desorb the SO2, the liquid
started to bubble. This bubbling continued for about ten to twelve minutes before
slowing and then stopping completely.
5.4 Summary
In short the following conclusions can be made from the above results:
1. At the higher SO2 partial pressure more SO2 is absorbed into the ionic liquid.
2. Temperature desorption works very fast and effectively. This was observed during
the experiments, when the absorbed SO2 desorbed very fast out of the ionic liquid for
each experiment.
3. The ionic liquid was largely saturated with SO2 when the volume changes were
determined.
4. The ionic liquid can be desorbed by using pressure swing desorption.
5. When the ionic liquid is saturated with SO2 it is very difficult to handle.
6. Both the 95 and 98% pure ionic liquids absorbed similar amounts of SO2.
SO2 and O2 separation by using ionic liquid absorption
89
6. Chapter 6
Conclusions and recommendations
6.1 Introduction
Chapter 6 will consist of the main conclusions made from the results of Chapter 4 and
Chapter 5, as well as some recommendations. The first section will revisit the objectives and
hypotheses indicated at the beginning of the study and address each of them, after which
Section 6.3 will present recommendations for future research and the implementation of the
ionic liquids in the HyS process.
6.2 Conclusions
6.2.1 Temperature
The absorption of SO2, as well as the rate of absorption changed dramatically when the ionic
liquid temperature was changed. For all of the feed stream compositions the SO2 absorption
increased when the temperature was decreased. For the 100 mol% SO2 feed stream the
98% pure ionic liquid absorbed 1.51 mol SO2/mol IL at 60oC and 2.68 mol SO2/mol IL at
30oC while the 95% pure ionic liquid absorbed 1.57 mol SO2/mol IL at 60oC and 2.48
SO2/mol IL at 30oC. Conversely, the temperatures of the absorption chamber did not have
an influence on the initial absorption rate of SO2. This result disproves the hypotheses in
Section 2.5, which states that the absorption rate will increase with an increase in
temperature.
6.2.2 Feed stream composition
The percentage SO2 in the feed stream was changed to see how the ratio of SO2 in the feed
stream influenced the absorption rate. From the results it is seen that the absorption rate
increased when the composition of SO2 was increased. The absorption rate increased from
0.15 mol SO2/mol IL·min for the 98% pure ionic liquid at 60oC with 25 mol% SO2 to 0.75 mol
SO2 and O2 separation by using ionic liquid absorption
90
SO2/mol IL·min at 60oC with 100 mol% SO2. Similarly the 95% pure ionic liquid increased
from 0.17 mol SO2/mol IL·min at 60oC with 25 mol% SO2 to 0.82 mol SO2/mol IL·min at 60oC
with 100 mol% SO2. This happened due to an increase in the amount of SO2 that is available
for absorption. For the results in Section 4.2.2 the 95% pure ionic liquid consistently had a
higher initial absorption rate than the 98% pure ionic liquid.
6.2.3 Absorption of O2
O2 absorption obtained during the pressure experiments was about fifteen times lower than
that of SO2, without the ionic liquid having been saturated with SO2. During the temperature
experiments the 95% pure ionic liquid absorbed very small amounts of O2 at 30 and 40oC
while the 98% pure ionic liquid absorbed almost no O2. Therefore these results from both
Chapter 4 and Chapter 5 indicate that this ionic liquid only absorbs very small amounts of
O2. These amounts were about thirty times smaller than the amounts of SO2 that was
absorbed. Thus, it can be concluded that the amount of O2 absorbed by the ionic liquid is
negligibly small, because the electrolyser will not be negatively influenced by O2 at such low
quantities.
6.2.4 Feed pressure
This objective was to determine what the effects of the feed pressure of both SO2 and O2
have on the absorption capabilities of the ionic liquid. From the O2 data it can be seen that
the mole percentage of O2 absorbed into the ionic liquid remained constant at between 6
and 7% for all feed pressures. Therefore, it can be concluded that the mole percentage of O2
absorbed and the feed gas pressure are independent of one another. The SO2 data on the
other hand show a clear correlation between the mole percentage of SO2 absorbed and the
feed pressure of the gas. For the 95% pure ionic liquid the mole percentage absorbed into
the ionic liquid increased from 77.6 mol% at 1.5 bar(a) to 85.9 mol% at 3.0 bar(a). The 98%
pure ionic liquid shows similar results, namely 79.7 mol% absorbed at 1.5 bar(a) increasing
to 87.9 mol% at 3.0 bar(a). It can be concluded that the feed pressure has an influence on
the amount of SO2 absorbed, but not on the O2; hence when the feed pressure of SO2 is
increased the amount of SO2 absorbed also increases. This trend was explained in Section
5.2 by means of Fick’s law.
SO2 and O2 separation by using ionic liquid absorption
91
6.2.5 Desorption
After the absorption step the ionic liquid was heated to 125oC to desorb the SO2. Desorption
was rapid and effective, with initial desorption rates calculated in Section 4.2.3. The
desorption data showed that there was no clear correlation between the desorption rate and
the feed composition, However it was found that the desorption rates of 50oC and 60oC were
lower than the rates at 30oC and 40oC. This can be explained by the fact that the desorption
times for all of the experiments were around 400 to 800 seconds, hence if more SO2 was
absorbed the desorption rate would be higher as was the case for the lower temperatures.
Therefore the hypothesis that SO2 is desorbed from the ionic liquid at temperatures higher
than 120oC was correct; this also explains the fact that as the temperature of the ionic liquid
increases less SO2 is absorbed.
6.2.6 Ionic liquid purity
The main objective of this study was to determine whether the purity of the ionic liquid had a
significant influence on the SO2 absorption capacity of the ionic liquid. The experimental data
for the pressure experiments showed that the 95% and 98% pure ionic liquids absorbed
similar amounts of SO2. For the temperature experiments the 95% pure ionic liquid absorbed
more SO2 over the entire experimental range, bar two tests. The 95% pure ionic liquid
however also absorbed a small amount of O2 at 30oC and 40oC which means that the
selectivity of the 95% pure ionic liquid was lower than the 98% pure ionic liquid.
These results disprove the hypothesis stated in Section 2.5, namely that a more pure ionic
liquid would absorb greater amounts of SO2. However it showed that the more pure ionic
liquid has a better selectivity towards SO2. Hence, it can be concluded that even with the O2
that was absorbed it would be economically more advantageous to use the less expensive
95% pure ionic liquid rather than the expensive 98% pure liquid, because the O2 would not
influence the performance of the process negatively in such low quantities. Gorensek et al.
(2009:44) also had very small amounts of O2 in the feed stream to the electrolyser, indicating
that a 100% pure SO2 stream is not required. This finding contributes towards the
commercialisation of the HyS process. Because of the expensive nature of ionic liquids, an
economically more viable option was shown to be similar in efficiency. 95% pure ionic liquid
has a cost of R1056.00/100g (Sigma-Aldrich, 2011) whereas 98% pure ionic liquid was
quoted to be R2142.00/100g (Merck, 2011). Just by using the 95% pure ionic liquid instead
of the 98% pure ionic liquid the cost of the ionic liquid can almost be halved.
SO2 and O2 separation by using ionic liquid absorption
92
6.2.7 Data modelling
The Langmuir absorption model was fitted to the SO2 absorption data for the temperature
experiments. The model followed the trend of the data well with an average standard
deviation of 17.07% over all the experiments.
The Clausius-Clapeyron equation was used to determine if the desorption reaction was
endothermic or exothermic by calculating the heat of desorption. The heat of desorption data
in Table 4.7 indicate that the desorption of SO2 from this ionic liquid is an endothermic
reaction because the heat of desorption values are positive. This data also showed a trend
that the heat of desorption decreased as the amount of SO2 absorbed increased. Therefore
if the desorption reaction was endothermic the absorption reaction was exothermic.
6.3 Recommendations
6.3.1 Future research
The following recommendations are proposed for future studies on the subject of SO2 and
O2 separation with ionic liquids:
- Improve the pressure measurements in the pressure experiments by using pressure
gauges that can log the pressure readings as a function of time. This would allow the
pressure change to be presented dynamically.
- Study the effect of feed pressures greater than 3 bar(a) on the ability of the ionic
liquid to absorb SO2. This will help to determine what the trend of SO2 absorption into
the ionic liquid is at higher pressures.
- Investigate how well the ionic liquid absorbs SO2 when the composition of SO2 in the
feed stream is very low. It is important to know if the ionic liquid can absorb the SO2
from a stream containing only 1-10 mol% SO2.
- Investigate the possibility to alter the current experimental setup to reduce the
amount of scatter of the data during the desorption step. This has to reduce the effect
of the air flow from the heater on the balance. A possibility is to increase the distance
between the balance and the heater, or to use a different type of balance.
- Test other ionic liquids, as well to confirm that the [BMIm][MeSO4] ionic liquid is the
most suitable for the separation of SO2 and O2. It will be important to look at some
task-specific ionic liquids that were designed specifically to absorb SO2 (Jin et al.,
2011:6585).
SO2 and O2 separation by using ionic liquid absorption
93
- Investigate how ionic liquid purities lower than 95% will influence the absorption
capabilities of the ionic liquid. Establish whether there is a minimum purity when the
ability of the ionic liquid to absorb SO2 starts to decline.
- Investigate how the lower selectivity of the 95% pure ionic liquid will affect the
performance of the electrolyser in the HyS process if some O2 enters the
electrolyser, and investigate the cost of using multiple absorbers in series with the
95% pure ionic liquid versus just one absorber with the 98% pure ionic liquid.
- Investigate how the ionic liquid performs over extended periods of time in order to
determine how long it can be used in the HyS process before it needs to be replaced.
- This study showed that ionic liquids have great potential to be used in the HyS
process to separate SO2 and O2 and it showed how conditions such as temperature
and pressure influence the performance of the ionic liquids. However, further
research is needed to determine the parameters of the absorption and stripping
columns that can be used in the HyS process. Some of these parameters include the
liquid and gas flow rates, size of the columns and types of columns to use.
6.3.2 Implementation in the HyS process
This section will give some recommendations on how to implement the ionic liquids into the
HyS process:
- During this study the single factor that had the largest influence on the performance
of the ionic liquid was the temperature at which the absorption took place. The results
showed that at lower temperatures the ionic liquid absorbed more SO2. Therefore, in
the HyS process the section where the SO2 is absorbed into the ionic liquid should
be operated at temperatures of 25-35oC to insure optimal absorption.
- Temperature swing absorption can be implemented in the HyS process to absorb
and desorb the SO2 from the ionic liquid. Pressure swing absorption is also an option
but requires compressors to increase the pressure of the gas and vacuum pumps to
desorb the SO2 from the ionic liquid. This equipment is expensive and a complete
cost analysis has to be done to determine the best option for the HyS process.

SO2 and O2 separation by using ionic liquid absorption
94
SO2 and O2 separation by using ionic liquid absorption
95
7. References
ADAM. 2011. Balances and scales. http://www.adamequipment.com/am Date of access: 5 Jul. 2011.
AIR LIQUIDE. 2009. Gas encyclopaedia. http://encyclopedia.airliquide.com/Encyclopedia.asp?GasID=27 Date of access: 30 Jun. 2011.
AKI, S.N.V.K., MELLEIN, B.R., SAURER, E.M. & BRENNECKE, J.F. 2004. High-pressure phase behavior of carbon dioxide with imidazolium-based ionic liquids. The journal of physical chemistry B, 108(52):20355-20365.
ANDERSON, J.L. 2008. Tunable ionic liquids for gas separation: Solubility studies for thermodynamic analysis. Dissertation-Ph.D. ed. Notre Dame: University of Notre Dame.
ANDERSON, T.W. & FINN, J.D. 1996. The new statistical analysis of data. New York: Springer. 712p.
ANDERSON, J.L., DIXON, J.K., MAGINN, E.J. & BRENNECKE, J.F. 2006. Measurement of SO2 solubility in ionic liquids. Journal of physical chemistry B, 110(31):15059-15062.
ANTHONY, J.L., MAGINN, E.J. & BRENNECKE, J.F. 2002. Solubilities and thermodynamic properties of gases in the ionic liquid 1-n-butyl-3-methylimidazolium hexafluorophosphate. The journal of physical chemistry B, 106(29):7315-7320.
BASF. 2011. Frequently asked questions. http://www.intermediates.basf.com/chemicals/ionic-liquids/faq#2 Date of access: 20 Jul. 2011.
BRECHER, L.E., SPEWOCK, S. & WARDE, C.J. 1977. The westinghouse sulfur cycle for the thermochemical decomposition of water. International journal of hydrogen energy, 2(1):7-15.
BROWN, L.C., BESENBRUCH, G.E., LENTSCH, R.D., SCHULTZ, K.R., FUNK, J.F., PICKARD, P.S., MARSHALL, A.C. and SHOWALTER, S.K., 2003. High Efficiency Generation Of Hydrogen Fuels Using Nuclear Power. GA–A24285 Rev. 1. U.S. Department of Energy.
CAMPER, D.E.I. 2006. Gas solubility and diffusion in room temperature ionic liquids with an emphasis on gas separations. Dissertation-Ph.D. ed. Boulder: University of Colorado.
DONG, W. & LONG, Y. 2004. Preparation and characterization of preferentially oriented continuous MFI-type zeolite membranes from porous glass. Microporous and mesoporous materials, 76(1-3):9-15.
SO2 and O2 separation by using ionic liquid absorption
96
FELDER, R.M. & ROUSSEAU, R.W. 2000. Elementary principles of chemical processes. 3rd ed. United States of America: John Wiley & Sons, Inc. 675p.
GARCÍA-ZUBIRI, I.X., GONZÁLEZ-GAITANO, G. & ISASI, J.R. 2009. Sorption models in cyclodextrin polymers: Langmuir, Freundlich, and a dual-mode approach. Journal of colloid and interface science, 337(1):11-18.
GARDAS, R.L., FREIRE, M.G., CARVALHO, P.J., MARRUCHO, I.M., FONSECA, I.M.A., FERREIRA, A.G.M. & COUTINHO, J.A.P. 2007. High-pressure densities and derived thermodynamic properties of imidazolium-based ionic liquids. Journal of chemical & engineering data, 52(1):80-88.
GORENSEK, M.B., SUMMERS, W.A., BOLTHRUNIS, C.O., LAHODA, E.J., ALLEN, D.T. and GREYVENSTEIN, R., 2009. Hybrid sulfur process reference design and cost analysis. Aiken: Savannah River National Laboratory.
HUANG, J., RIISAGER, A., WASSERSCHEID, P. & FEHRMANN, R. 2006a. Reversible physical absorption of SO2 by ionic liquids. Chemical communications, (38):4027-4029.
HUANG, J., RIISAGER, A., WASSERSCHEID, P. & FEHRMANN, R. 2006b. Reversible physical absorption of SO2 by ionic liquids. Chemical communications, (38):4027-4029.
HUDDLESTON, J.G., VISSER, A.E., MATTHEW REICHERT, W., WILLAUER, H.D., BROKER, G.A. & ROGERS, R.D. 2001. Characterization and comparison of hydrophilic and hydrophobic room temperature ionic liquids incorporating the imidazolium cation. Green chemistry, 3(1):156-164.
JIN, M., HOU, Y., WU, W., REN, S., TIAN, S., XIAO, L. & LEI, Z. 2011. Solubilities and thermodynamic properties of SO2 in ionic liquids. The journal of physical chemistry B, 115(20):6585-6591.
JOHNSTON, B., MAYO, M.C. & KHARE, A. 2005. Hydrogen: The energy source for the 21st century. Technovation, 25(6):569-585.
JONKER, A. 2009. Techno-economic evaluation of different technologies for the separation of sulphur dioxide and oxygen applicable to the hybrid sulphur (hys) process. Master of Engineering ed. Potchefstroom: NWU. 43-186.
KIM, C.S., LEE, K.Y., GONG, G.T., KIM, H., LEE, B.G. & JUNG, G.D. 2008. Sulfur dioxide separation and recovery with ionic liquid absorbents. http://www.nt.ntnu.no/users/skoge/prost/proceedings/aiche-008/data/papers/p124708.pdf. Date of access: July 14. 2010.
KIM, C.S., LEE, K.Y., SONG, K.H., GONG, G.T., YOO, K.S., KIM, H., LEE, B.G., AHN, B.S. & JUNG, K.D. 2007. Novel separation process of gaseous mixture of SO2 and O2 with ionic liquid for hydrogen production in thermochemical sulfur-iodine water splitting cycle. (In Anon. 2007.
KIM, D.J. 2004. Adsorption isotherms of 2,2,4-trimethylpentane and toluene vapors on hydrocarbon adsorber and light-off catalyst. Journal of colloid and interface science, 269(2):290-295.
KORETSKY, M.D. 2004. Engineering and chemical thermodynamics. United States of America: Wiley & Sons, Inc. 553p.
SO2 and O2 separation by using ionic liquid absorption
97
KUMEŁAN, J., KAMPS, Á.P., URUKOVA, I., TUMA, D. & MAURER, G. 2005. Solubility of oxygen in the ionic liquid [bmim][PF6]: Experimental and molecular simulation results. The journal of chemical thermodynamics, 37(6):595-602.
KUMEŁAN, J., PÉREZ-SALADO KAMPS, Á., TUMA, D. & MAURER, G. 2007. Solubility of the single gases H2 and CO in the ionic liquid [bmim][CH3SO4]. Fluid phase equilibria, 260(1):3-8.
LATTIN, W.C. & UTGIKAR, V.P. 2007. Transition to hydrogen economy in the united states: A 2006 status report. International journal of hydrogen energy, 32(15):3230-3237.
LE ROUX, M. and HATTINGH, B.B., 2010. HyS Hydrogen Production Process Development Special Studies: Section 4: Separation. Potchefstroom: .
LEE, K.Y., GONG, G.T., SONG, K.H., KIM, H., JUNG, K. & KIM, C.S. 2008. Use of ionic liquids as absorbents to separate SO2 in SO2/O2 in thermochemical processes to produce hydrogen. International journal of hydrogen energy, 33(21):6031-6036.
LEYBROS, J., SATURNIN, A., MANSILLA, C., GILARDI, T. & CARLES, P. 2010. Plant sizing and evaluation of hydrogen production costs from advanced processes coupled to a nuclear heat source: Part II: Hybrid-sulphur cycle. International journal of hydrogen energy, 35(3):1019-1028.
LOCATI, C., LAFONT, U., PETERS, C.J. & KELDER, E.M. 2009. Interaction between carbon dioxide and ionic liquids: Novel electrolyte candidates for safer li-ion batteries. Journal of power sources, 189(1):454-457.
MANAN, N.A., HARDACRE, C., JACQUEMIN, J., ROONEY, D.W. & YOUNGS, T.G.A. 2009. Evaluation of gas solubility prediction in ionic liquids using COSMOthermX. Journal of chemical & engineering data, 54(7):2005-2022.
MERCK. 2011. 1-butyl-3-methylimidazolium methylsulfate. http://www.merck-chemicals.com/africa/1-butyl-3-methylimidazolium-methylsulfate/MDA_CHEM-490063/p_uuid?WT_oss=490063&WT_oss_r=1 Date of access: 19 Feb. 2011.
MILLER, C.C. 1924. The stokes-einstein law for diffusion in solution. Proceedings of the royal society of london.series A, containing papers of a mathematical and physical character, 106(740):pp. 724-749.
MULDER, M. 1998. Basic principles of membrane technology. 2nd ed. ed. Dordrecht: Kluwer Academic Publishers. 568p.
OCHOA, J., CASSANELLO, M.C., BONELLI, P.R. & CUKIERMAN, A.L. 2001. CO2 gasification of argentinean coal chars: A kinetic characterization. Fuel processing technology, 74(3):161-176.
ORME, C.J., KLAEHN, J.R. & STEWART, F.F. 2009. Membrane separation processes for the benefit of the sulfur–iodine and hybrid sulfur thermochemical cycles. International journal of hydrogen energy, 34(9):4088-4096.
PEREIRO, A.B., VERDÃA, P., TOJO, E. & RODRÃGUEZ, A. 2007. Physical properties of 1-butyl-3-methylimidazolium methyl sulfate as a function of temperature. Journal of chemical & engineering data, 52(2):377-380.
SO2 and O2 separation by using ionic liquid absorption
98
PERRY, R.H. & GREEN, D.W. 1997. Perry’s chemical engineers’ handbook. 7th ed. ed. New York: McGraw-Hill. 30-36p.
PLECHKOVA, N.V. & SEDDON, K.R. 2008. Applications of ionic liquids in the chemical industry. The royal society of chemistry, 37(1):123-150.
REN, W. 2009. High-pressure phase equilibria of ionic liquids and compressed gases for applications in reactions and absorption refrigeration. Doctor of Philosophy ed. University of Kansas.
REN, S., HOU, Y., WN, W., LIU, Q., XIAO, Y. & CHEN, X. 2010. Properties of ionic liquids absorbing so2 and the mechanism of the absorption. Journal of physical chemistry B, 114(6):2175-2179.
SEADER, J.D. & HENLEY, E.J. 2006. Separation process principles. 2nd ed. John wiley & Sons inc. 756p.
SEO, Y., KIM, S. & HONG, S.U. 2006. Highly selective polymeric membranes for gas separation. Polymer, 47(13):4501-4504.
SHAFIEE, S. & TOPAL, E. 2009. When will fossil fuel reserves be diminished? Energy policy, 37(1):181-189.
SHIFLETT, M.B. & YOKOZEKI, A. 2010. Chemical absorption of sulfur dioxide in room-temperature ionic liquids. Industrial and engineering chemistry research, 49(3):1370-1377.
SIGMA-ALDRICH. 2011. 1-butyl-3-methylimidazolium methyl sulfate. http://www.sigmaaldrich.com/catalog Date of access: 23 Jun. 2011.
SORIANO, A.N., DOMA JR., B.T. & LI, M. 2008. Solubility of carbon dioxide in 1-ethyl-3-methylimidazolium 2-(2-methoxyethoxy) ethylsulfate. The journal of chemical thermodynamics, 40(12):1654-1660.
SUMMERS, W.A., GORENSEK, M.B. and BUCKNER, M.R., 2005. The hybrid sulfur cycle for nuclear hydrogen production. Aiken: Savannah River National Laboratory.
TONDEUR, D. & TENG, F. 2008. Chapter 18 - carbon capture and storage for greenhouse effect mitigation. (In Trevor M. Letcher, ed. Future energy. Oxford: Elsevier. p. 303-331.).
VOROTYNTSEV, M.A., ZINOVYEVA, V.A. & PICQUET, M. 2010. Diffusional transport in ionic liquids: Stokes–Einstein relation or “sliding sphere” model? ferrocene (fc) in imidazolium liquids. Electrochimica acta, 55(18):5063-5070.
WONG, D.S.H., CHEN, J.P., CHANG, J.M. & CHOU, C.H. 2002. Phase equilibria of water and ionic liquids [emim][PF6] and [bmim][PF6]. Fluid phase equilibria, 194-1971089-1095.
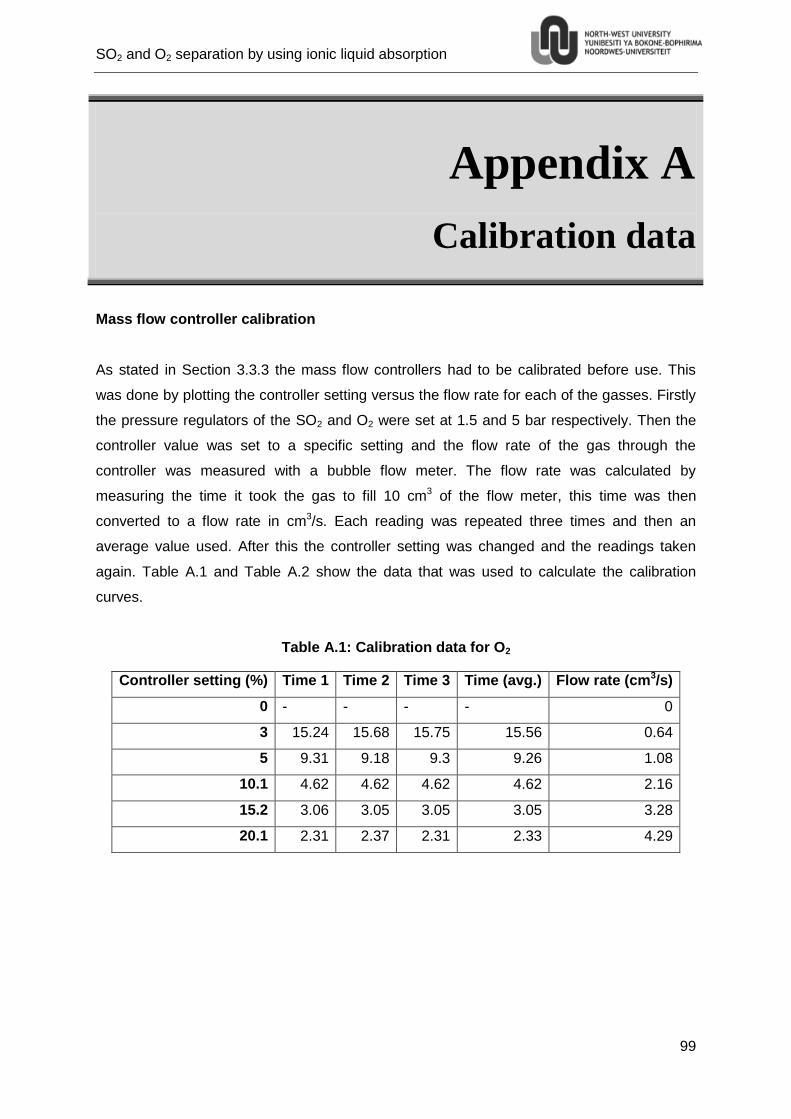
SO2 and O2 separation by using ionic liquid absorption
99
Appendix A
Calibration data
Mass flow controller calibration
As stated in Section 3.3.3 the mass flow controllers had to be calibrated before use. This
was done by plotting the controller setting versus the flow rate for each of the gasses. Firstly
the pressure regulators of the SO2 and O2 were set at 1.5 and 5 bar respectively. Then the
controller value was set to a specific setting and the flow rate of the gas through the
controller was measured with a bubble flow meter. The flow rate was calculated by
measuring the time it took the gas to fill 10 cm3 of the flow meter, this time was then
converted to a flow rate in cm3/s. Each reading was repeated three times and then an
average value used. After this the controller setting was changed and the readings taken
again. Table A.1 and Table A.2 show the data that was used to calculate the calibration
curves.
Table A.1: Calibration data for O2
Controller setting (%) Time 1 Time 2 Time 3 Time (avg.) Flow rate (cm3/s)
0 - - - - 0
3 15.24 15.68 15.75 15.56 0.64
5 9.31 9.18 9.3 9.26 1.08
10.1 4.62 4.62 4.62 4.62 2.16
15.2 3.06 3.05 3.05 3.05 3.28
20.1 2.31 2.37 2.31 2.33 4.29
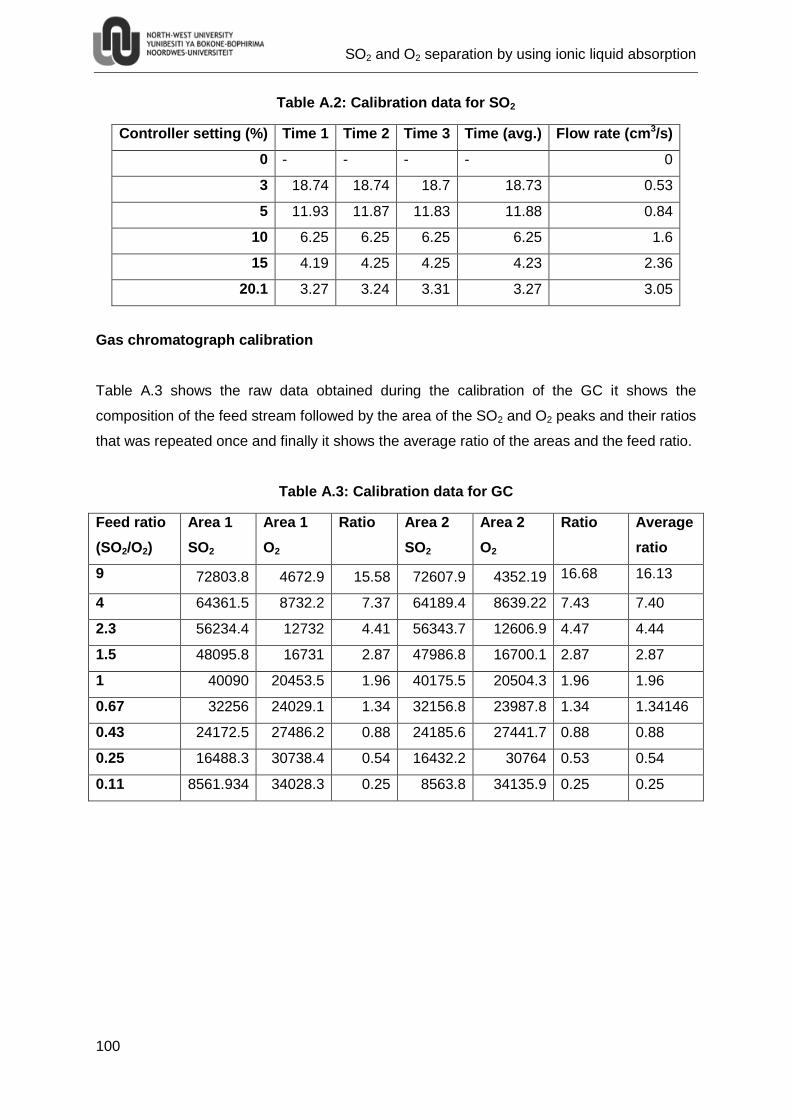
SO2 and O2 separation by using ionic liquid absorption
100
Table A.2: Calibration data for SO2
Controller setting (%) Time 1 Time 2 Time 3 Time (avg.) Flow rate (cm3/s)
0 - - - - 0
3 18.74 18.74 18.7 18.73 0.53
5 11.93 11.87 11.83 11.88 0.84
10 6.25 6.25 6.25 6.25 1.6
15 4.19 4.25 4.25 4.23 2.36
20.1 3.27 3.24 3.31 3.27 3.05
Gas chromatograph calibration
Table A.3 shows the raw data obtained during the calibration of the GC it shows the
composition of the feed stream followed by the area of the SO2 and O2 peaks and their ratios
that was repeated once and finally it shows the average ratio of the areas and the feed ratio.
Table A.3: Calibration data for GC
Feed ratio
(SO2/O2)
Area 1
SO2
Area 1
O2
Ratio Area 2
SO2
Area 2
O2
Ratio Average
ratio
9 72803.8 4672.9 15.58 72607.9 4352.19 16.68 16.13
4 64361.5 8732.2 7.37 64189.4 8639.22 7.43 7.40
2.3 56234.4 12732 4.41 56343.7 12606.9 4.47 4.44
1.5 48095.8 16731 2.87 47986.8 16700.1 2.87 2.87
1 40090 20453.5 1.96 40175.5 20504.3 1.96 1.96
0.67 32256 24029.1 1.34 32156.8 23987.8 1.34 1.34146
0.43 24172.5 27486.2 0.88 24185.6 27441.7 0.88 0.88
0.25 16488.3 30738.4 0.54 16432.2 30764 0.53 0.54
0.11 8561.934 34028.3 0.25 8563.8 34135.9 0.25 0.25
SO2 and O2 separation by using ionic liquid absorption
101
Appendix B
Additional data for temperature
experiments
During the temperature experiments the flow of the stream exiting the absorption chamber
was also measured at certain times during the experiment. These measurements were
made for all of the temperature experiments but only the data for one is shown below. The
flow data in Table B.1 was from the experiment with the 95% pure ionic liquid at 30oC and
100% SO2.
Table B.1: Flow data
Time (s) Flow (s) Flow (cm3/s)
15 0 0.000
45 13.4 0.746
180 2.76 3.623
360 2.26 4.425
600 2.18 4.587
900 2.08 4.808
1200 2.07 4.831
Figure B.1 shows the plot of the flow versus time for the same experiment.
SO2 and O2 separation by using ionic liquid absorption
102
Figure B.1: Plot of the flow data
Table B.2 shows the data obtained from the GC when the stream exiting the absorption
chamber was analysed. This table shows the experiment number, the area of the SO2 and
O2 peaks together with their ratio, the ratio of the gas composition calculated with Equation
3.4 and the percentage compositions of SO2 and O2.
Table B.2: GC data
Exp Area SO2 Area O2 Area ratio Gas composition
ratio mol%SO2 mol%O2
1 1.00E-02 3.91E+04 2.55E-07 1.41E-07 0.00% 100.00%
2 1.00E-02 3.96E+04 2.52E-07 1.39E-07 0.00% 100.00%
3 1.00E-02 3.86E+04 2.59E-07 1.43E-07 0.00% 100.00%
4 1.00E-02 3.81E+04 2.62E-07 1.45E-07 0.00% 100.00%
5 7.26E+03 3.58E+04 2.03E-01 1.12E-01 10.06% 89.94%
6 1.24E+04 3.40E+04 3.64E-01 2.01E-01 16.74% 83.26%
7 1.19E+04 3.33E+04 3.59E-01 1.98E-01 16.53% 83.47%
8 1.52E+04 3.17E+04 4.80E-01 2.65E-01 20.94% 79.06%
9 1.93E+04 3.02E+04 6.40E-01 3.53E-01 26.09% 73.91%
10 2.96E+04 2.48E+04 1.20E+00 6.60E-01 39.75% 60.25%
11 3.13E+04 2.43E+04 1.29E+00 7.11E-01 41.54% 58.46%
12 3.63E+04 2.28E+04 1.59E+00 8.77E-01 46.72% 53.28%
13 4.60E+04 1.76E+04 2.62E+00 1.45E+00 59.11% 40.89%
14 5.19E+04 1.35E+04 3.83E+00 2.12E+00 67.91% 32.09%
15 5.49E+04 1.38E+04 3.96E+00 2.19E+00 68.62% 31.38%
16 5.65E+04 1.18E+04 4.77E+00 2.63E+00 72.46% 27.54%
17 7.51E+04 4.59E+01 1.64E+03 9.04E+02 99.89% 0.11%
0.0
1.0
2.0
3.0
4.0
5.0
6.0
0 200 400 600 800 1000 1200 1400
Flo
w (
ml/
s)
Time (s)
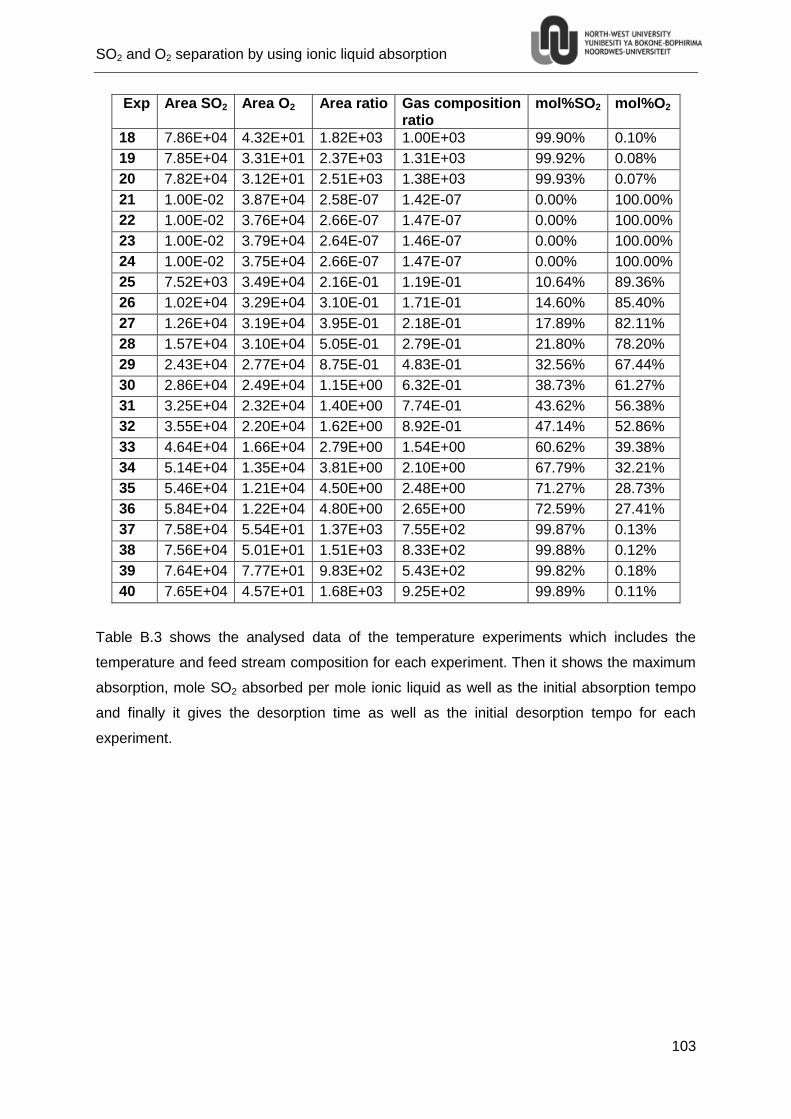
SO2 and O2 separation by using ionic liquid absorption
103
Exp Area SO2 Area O2 Area ratio Gas composition ratio
mol%SO2 mol%O2
18 7.86E+04 4.32E+01 1.82E+03 1.00E+03 99.90% 0.10%
19 7.85E+04 3.31E+01 2.37E+03 1.31E+03 99.92% 0.08%
20 7.82E+04 3.12E+01 2.51E+03 1.38E+03 99.93% 0.07%
21 1.00E-02 3.87E+04 2.58E-07 1.42E-07 0.00% 100.00%
22 1.00E-02 3.76E+04 2.66E-07 1.47E-07 0.00% 100.00%
23 1.00E-02 3.79E+04 2.64E-07 1.46E-07 0.00% 100.00%
24 1.00E-02 3.75E+04 2.66E-07 1.47E-07 0.00% 100.00%
25 7.52E+03 3.49E+04 2.16E-01 1.19E-01 10.64% 89.36%
26 1.02E+04 3.29E+04 3.10E-01 1.71E-01 14.60% 85.40%
27 1.26E+04 3.19E+04 3.95E-01 2.18E-01 17.89% 82.11%
28 1.57E+04 3.10E+04 5.05E-01 2.79E-01 21.80% 78.20%
29 2.43E+04 2.77E+04 8.75E-01 4.83E-01 32.56% 67.44%
30 2.86E+04 2.49E+04 1.15E+00 6.32E-01 38.73% 61.27%
31 3.25E+04 2.32E+04 1.40E+00 7.74E-01 43.62% 56.38%
32 3.55E+04 2.20E+04 1.62E+00 8.92E-01 47.14% 52.86%
33 4.64E+04 1.66E+04 2.79E+00 1.54E+00 60.62% 39.38%
34 5.14E+04 1.35E+04 3.81E+00 2.10E+00 67.79% 32.21%
35 5.46E+04 1.21E+04 4.50E+00 2.48E+00 71.27% 28.73%
36 5.84E+04 1.22E+04 4.80E+00 2.65E+00 72.59% 27.41%
37 7.58E+04 5.54E+01 1.37E+03 7.55E+02 99.87% 0.13%
38 7.56E+04 5.01E+01 1.51E+03 8.33E+02 99.88% 0.12%
39 7.64E+04 7.77E+01 9.83E+02 5.43E+02 99.82% 0.18%
40 7.65E+04 4.57E+01 1.68E+03 9.25E+02 99.89% 0.11%
Table B.3 shows the analysed data of the temperature experiments which includes the
temperature and feed stream composition for each experiment. Then it shows the maximum
absorption, mole SO2 absorbed per mole ionic liquid as well as the initial absorption tempo
and finally it gives the desorption time as well as the initial desorption tempo for each
experiment.
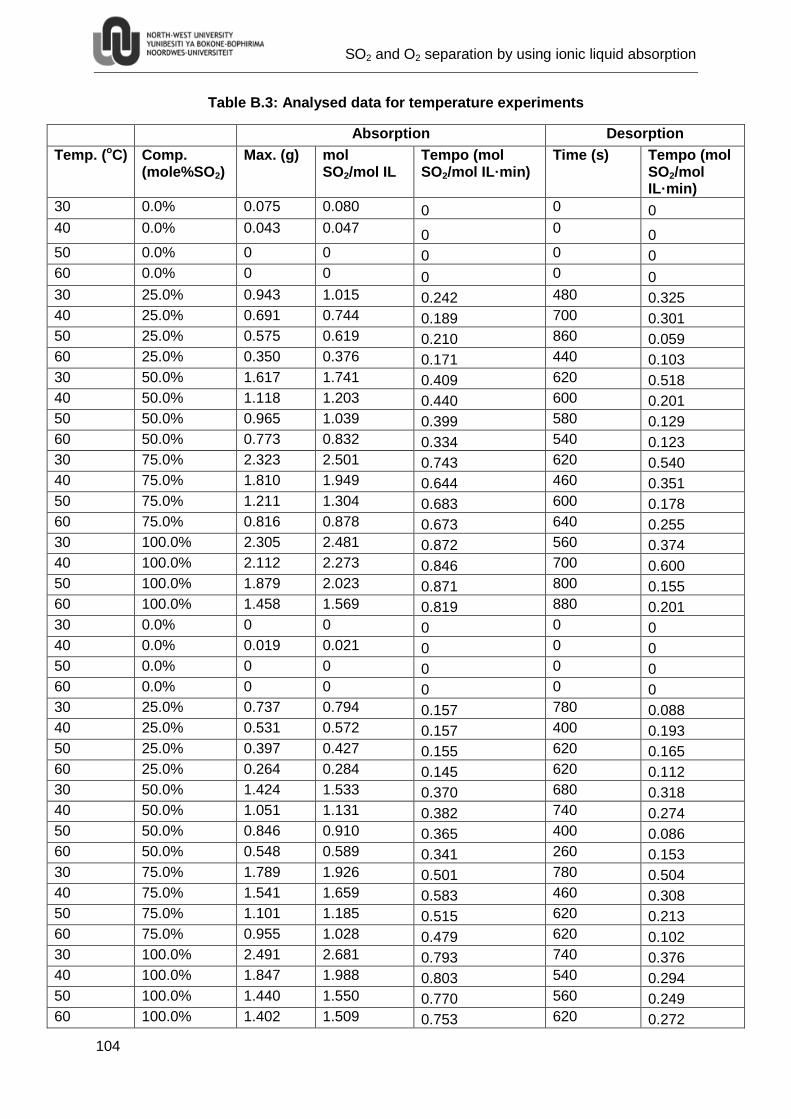
SO2 and O2 separation by using ionic liquid absorption
104
Table B.3: Analysed data for temperature experiments
Absorption Desorption
Temp. (oC) Comp. (mole%SO2)
Max. (g) mol SO2/mol IL
Tempo (mol SO2/mol IL·min)
Time (s) Tempo (mol SO2/mol IL·min)
30 0.0% 0.075 0.080 0 0 0
40 0.0% 0.043 0.047 0
0 0
50 0.0% 0 0 0 0 0
60 0.0% 0 0 0 0 0
30 25.0% 0.943 1.015 0.242 480 0.325
40 25.0% 0.691 0.744 0.189 700 0.301
50 25.0% 0.575 0.619 0.210 860 0.059
60 25.0% 0.350 0.376 0.171 440 0.103
30 50.0% 1.617 1.741 0.409 620 0.518
40 50.0% 1.118 1.203 0.440 600 0.201
50 50.0% 0.965 1.039 0.399 580 0.129
60 50.0% 0.773 0.832 0.334 540 0.123
30 75.0% 2.323 2.501 0.743 620 0.540
40 75.0% 1.810 1.949 0.644 460 0.351
50 75.0% 1.211 1.304 0.683 600 0.178
60 75.0% 0.816 0.878 0.673 640 0.255
30 100.0% 2.305 2.481 0.872 560 0.374
40 100.0% 2.112 2.273 0.846 700 0.600
50 100.0% 1.879 2.023 0.871 800 0.155
60 100.0% 1.458 1.569 0.819 880 0.201
30 0.0% 0 0 0 0 0
40 0.0% 0.019 0.021 0 0 0
50 0.0% 0 0 0 0 0
60 0.0% 0 0 0 0 0
30 25.0% 0.737 0.794 0.157 780 0.088
40 25.0% 0.531 0.572 0.157 400 0.193
50 25.0% 0.397 0.427 0.155 620 0.165
60 25.0% 0.264 0.284 0.145 620 0.112
30 50.0% 1.424 1.533 0.370 680 0.318
40 50.0% 1.051 1.131 0.382 740 0.274
50 50.0% 0.846 0.910 0.365 400 0.086
60 50.0% 0.548 0.589 0.341 260 0.153
30 75.0% 1.789 1.926 0.501 780 0.504
40 75.0% 1.541 1.659 0.583 460 0.308
50 75.0% 1.101 1.185 0.515 620 0.213
60 75.0% 0.955 1.028 0.479 620 0.102
30 100.0% 2.491 2.681 0.793 740 0.376
40 100.0% 1.847 1.988 0.803 540 0.294
50 100.0% 1.440 1.550 0.770 560 0.249
60 100.0% 1.402 1.509 0.753 620 0.272
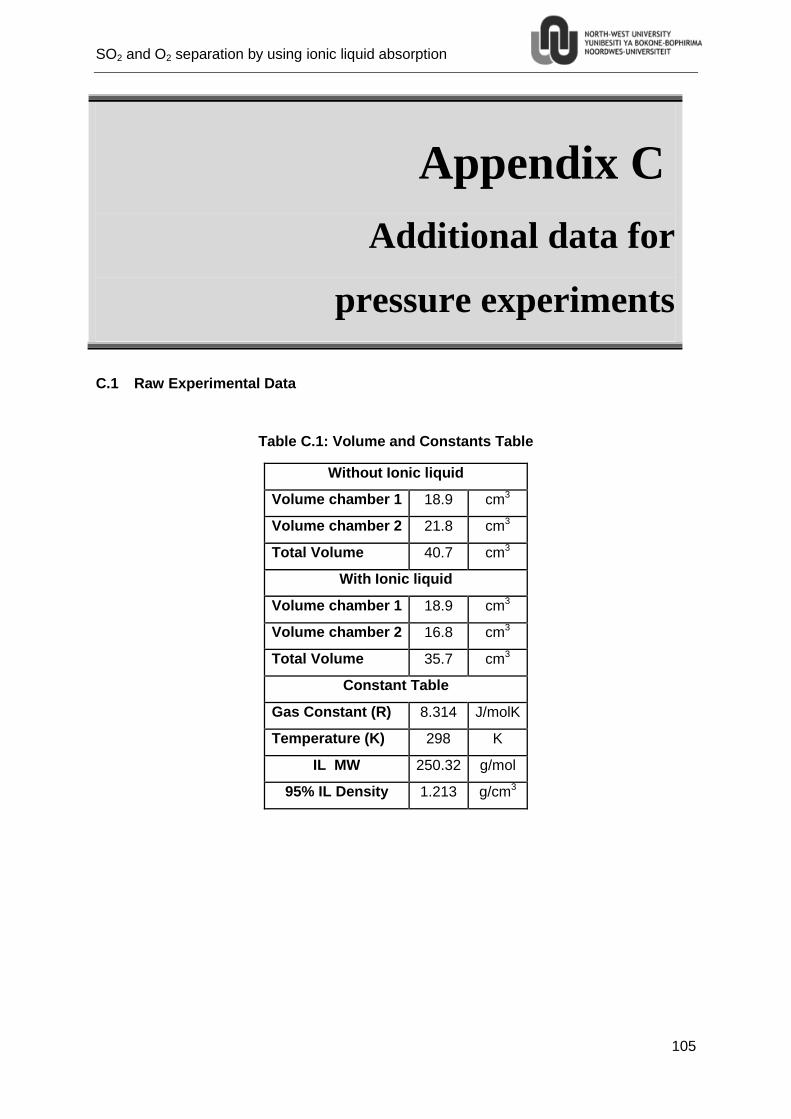
SO2 and O2 separation by using ionic liquid absorption
105
Appendix C
Additional data for
pressure experiments
C.1 Raw Experimental Data
Table C.1: Volume and Constants Table
Without Ionic liquid
Volume chamber 1 18.9 cm3
Volume chamber 2 21.8 cm3
Total Volume 40.7 cm3
With Ionic liquid
Volume chamber 1 18.9 cm3
Volume chamber 2 16.8 cm3
Total Volume 35.7 cm3
Constant Table
Gas Constant (R) 8.314 J/molK
Temperature (K) 298 K
IL MW 250.32 g/mol
95% IL Density 1.213 g/cm3
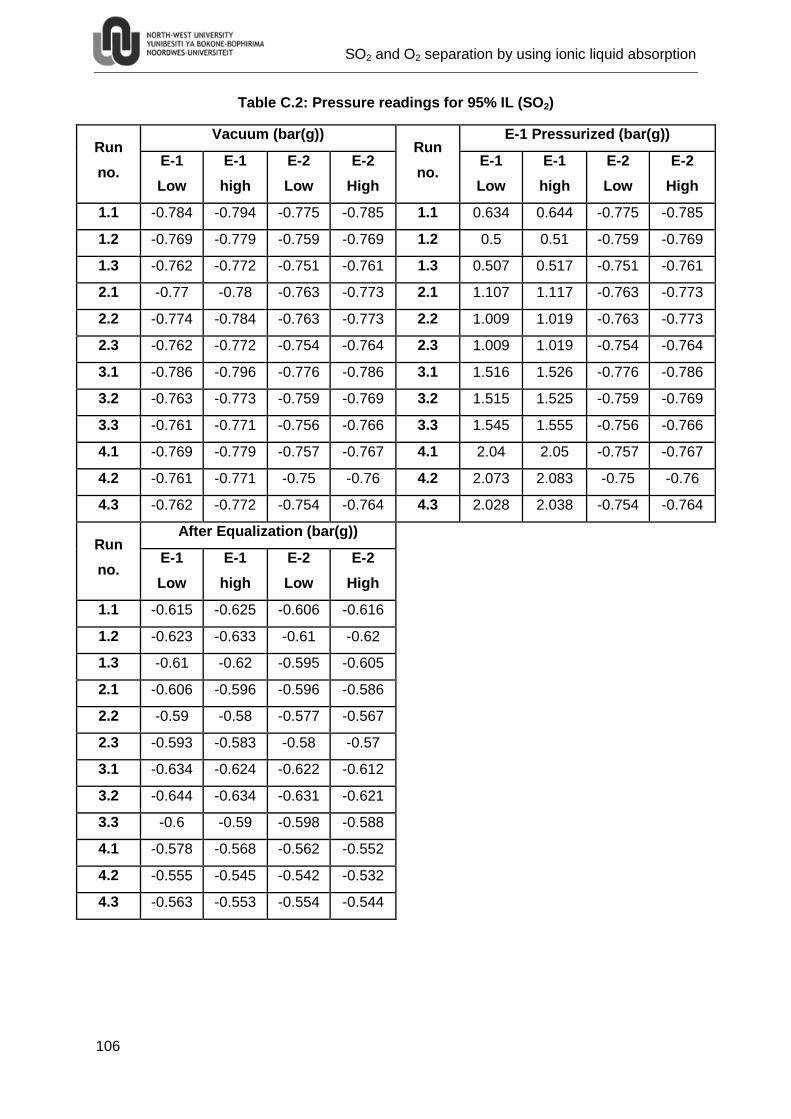
SO2 and O2 separation by using ionic liquid absorption
106
Table C.2: Pressure readings for 95% IL (SO2)
Run
no.
Vacuum (bar(g)) Run
no.
E-1 Pressurized (bar(g))
E-1
Low
E-1
high
E-2
Low
E-2
High
E-1
Low
E-1
high
E-2
Low
E-2
High
1.1 -0.784 -0.794 -0.775 -0.785 1.1 0.634 0.644 -0.775 -0.785
1.2 -0.769 -0.779 -0.759 -0.769 1.2 0.5 0.51 -0.759 -0.769
1.3 -0.762 -0.772 -0.751 -0.761 1.3 0.507 0.517 -0.751 -0.761
2.1 -0.77 -0.78 -0.763 -0.773 2.1 1.107 1.117 -0.763 -0.773
2.2 -0.774 -0.784 -0.763 -0.773 2.2 1.009 1.019 -0.763 -0.773
2.3 -0.762 -0.772 -0.754 -0.764 2.3 1.009 1.019 -0.754 -0.764
3.1 -0.786 -0.796 -0.776 -0.786 3.1 1.516 1.526 -0.776 -0.786
3.2 -0.763 -0.773 -0.759 -0.769 3.2 1.515 1.525 -0.759 -0.769
3.3 -0.761 -0.771 -0.756 -0.766 3.3 1.545 1.555 -0.756 -0.766
4.1 -0.769 -0.779 -0.757 -0.767 4.1 2.04 2.05 -0.757 -0.767
4.2 -0.761 -0.771 -0.75 -0.76 4.2 2.073 2.083 -0.75 -0.76
4.3 -0.762 -0.772 -0.754 -0.764 4.3 2.028 2.038 -0.754 -0.764
Run
no.
After Equalization (bar(g))
E-1
Low
E-1
high
E-2
Low
E-2
High
1.1 -0.615 -0.625 -0.606 -0.616
1.2 -0.623 -0.633 -0.61 -0.62
1.3 -0.61 -0.62 -0.595 -0.605
2.1 -0.606 -0.596 -0.596 -0.586
2.2 -0.59 -0.58 -0.577 -0.567
2.3 -0.593 -0.583 -0.58 -0.57
3.1 -0.634 -0.624 -0.622 -0.612
3.2 -0.644 -0.634 -0.631 -0.621
3.3 -0.6 -0.59 -0.598 -0.588
4.1 -0.578 -0.568 -0.562 -0.552
4.2 -0.555 -0.545 -0.542 -0.532
4.3 -0.563 -0.553 -0.554 -0.544
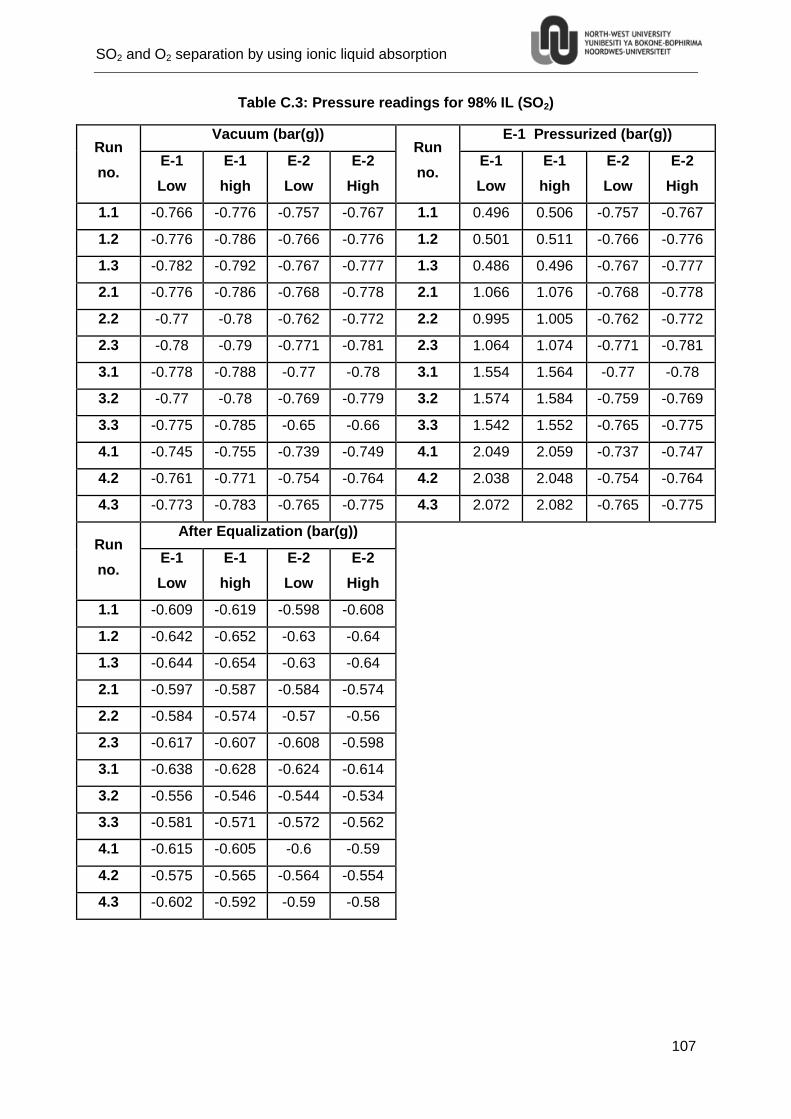
SO2 and O2 separation by using ionic liquid absorption
107
Table C.3: Pressure readings for 98% IL (SO2)
Run
no.
Vacuum (bar(g)) Run
no.
E-1 Pressurized (bar(g))
E-1
Low
E-1
high
E-2
Low
E-2
High
E-1
Low
E-1
high
E-2
Low
E-2
High
1.1 -0.766 -0.776 -0.757 -0.767 1.1 0.496 0.506 -0.757 -0.767
1.2 -0.776 -0.786 -0.766 -0.776 1.2 0.501 0.511 -0.766 -0.776
1.3 -0.782 -0.792 -0.767 -0.777 1.3 0.486 0.496 -0.767 -0.777
2.1 -0.776 -0.786 -0.768 -0.778 2.1 1.066 1.076 -0.768 -0.778
2.2 -0.77 -0.78 -0.762 -0.772 2.2 0.995 1.005 -0.762 -0.772
2.3 -0.78 -0.79 -0.771 -0.781 2.3 1.064 1.074 -0.771 -0.781
3.1 -0.778 -0.788 -0.77 -0.78 3.1 1.554 1.564 -0.77 -0.78
3.2 -0.77 -0.78 -0.769 -0.779 3.2 1.574 1.584 -0.759 -0.769
3.3 -0.775 -0.785 -0.65 -0.66 3.3 1.542 1.552 -0.765 -0.775
4.1 -0.745 -0.755 -0.739 -0.749 4.1 2.049 2.059 -0.737 -0.747
4.2 -0.761 -0.771 -0.754 -0.764 4.2 2.038 2.048 -0.754 -0.764
4.3 -0.773 -0.783 -0.765 -0.775 4.3 2.072 2.082 -0.765 -0.775
Run
no.
After Equalization (bar(g))
E-1
Low
E-1
high
E-2
Low
E-2
High
1.1 -0.609 -0.619 -0.598 -0.608
1.2 -0.642 -0.652 -0.63 -0.64
1.3 -0.644 -0.654 -0.63 -0.64
2.1 -0.597 -0.587 -0.584 -0.574
2.2 -0.584 -0.574 -0.57 -0.56
2.3 -0.617 -0.607 -0.608 -0.598
3.1 -0.638 -0.628 -0.624 -0.614
3.2 -0.556 -0.546 -0.544 -0.534
3.3 -0.581 -0.571 -0.572 -0.562
4.1 -0.615 -0.605 -0.6 -0.59
4.2 -0.575 -0.565 -0.564 -0.554
4.3 -0.602 -0.592 -0.59 -0.58
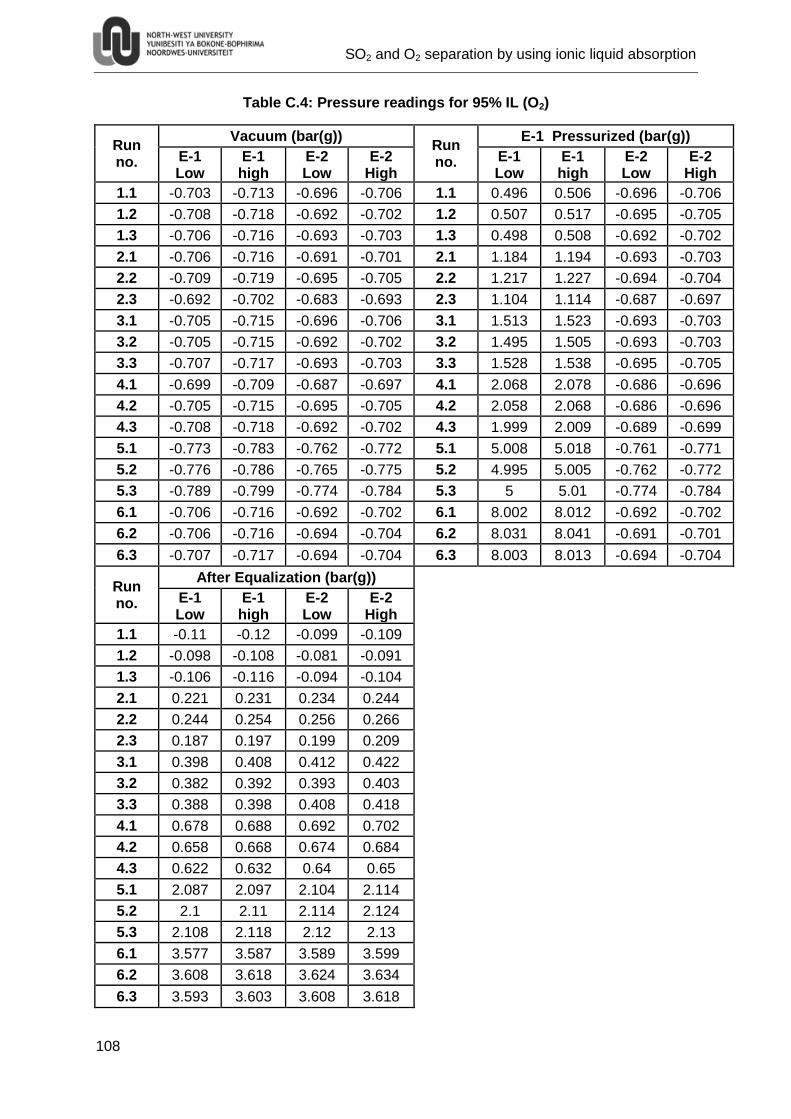
SO2 and O2 separation by using ionic liquid absorption
108
Table C.4: Pressure readings for 95% IL (O2)
Run no.
Vacuum (bar(g)) Run no.
E-1 Pressurized (bar(g))
E-1 Low
E-1 high
E-2 Low
E-2 High
E-1 Low
E-1 high
E-2 Low
E-2 High
1.1 -0.703 -0.713 -0.696 -0.706 1.1 0.496 0.506 -0.696 -0.706
1.2 -0.708 -0.718 -0.692 -0.702 1.2 0.507 0.517 -0.695 -0.705
1.3 -0.706 -0.716 -0.693 -0.703 1.3 0.498 0.508 -0.692 -0.702
2.1 -0.706 -0.716 -0.691 -0.701 2.1 1.184 1.194 -0.693 -0.703
2.2 -0.709 -0.719 -0.695 -0.705 2.2 1.217 1.227 -0.694 -0.704
2.3 -0.692 -0.702 -0.683 -0.693 2.3 1.104 1.114 -0.687 -0.697
3.1 -0.705 -0.715 -0.696 -0.706 3.1 1.513 1.523 -0.693 -0.703
3.2 -0.705 -0.715 -0.692 -0.702 3.2 1.495 1.505 -0.693 -0.703
3.3 -0.707 -0.717 -0.693 -0.703 3.3 1.528 1.538 -0.695 -0.705
4.1 -0.699 -0.709 -0.687 -0.697 4.1 2.068 2.078 -0.686 -0.696
4.2 -0.705 -0.715 -0.695 -0.705 4.2 2.058 2.068 -0.686 -0.696
4.3 -0.708 -0.718 -0.692 -0.702 4.3 1.999 2.009 -0.689 -0.699
5.1 -0.773 -0.783 -0.762 -0.772 5.1 5.008 5.018 -0.761 -0.771
5.2 -0.776 -0.786 -0.765 -0.775 5.2 4.995 5.005 -0.762 -0.772
5.3 -0.789 -0.799 -0.774 -0.784 5.3 5 5.01 -0.774 -0.784
6.1 -0.706 -0.716 -0.692 -0.702 6.1 8.002 8.012 -0.692 -0.702
6.2 -0.706 -0.716 -0.694 -0.704 6.2 8.031 8.041 -0.691 -0.701
6.3 -0.707 -0.717 -0.694 -0.704 6.3 8.003 8.013 -0.694 -0.704
Run no.
After Equalization (bar(g))
E-1 Low
E-1 high
E-2 Low
E-2 High
1.1 -0.11 -0.12 -0.099 -0.109
1.2 -0.098 -0.108 -0.081 -0.091
1.3 -0.106 -0.116 -0.094 -0.104
2.1 0.221 0.231 0.234 0.244
2.2 0.244 0.254 0.256 0.266
2.3 0.187 0.197 0.199 0.209
3.1 0.398 0.408 0.412 0.422
3.2 0.382 0.392 0.393 0.403
3.3 0.388 0.398 0.408 0.418
4.1 0.678 0.688 0.692 0.702
4.2 0.658 0.668 0.674 0.684
4.3 0.622 0.632 0.64 0.65
5.1 2.087 2.097 2.104 2.114
5.2 2.1 2.11 2.114 2.124
5.3 2.108 2.118 2.12 2.13
6.1 3.577 3.587 3.589 3.599
6.2 3.608 3.618 3.624 3.634
6.3 3.593 3.603 3.608 3.618
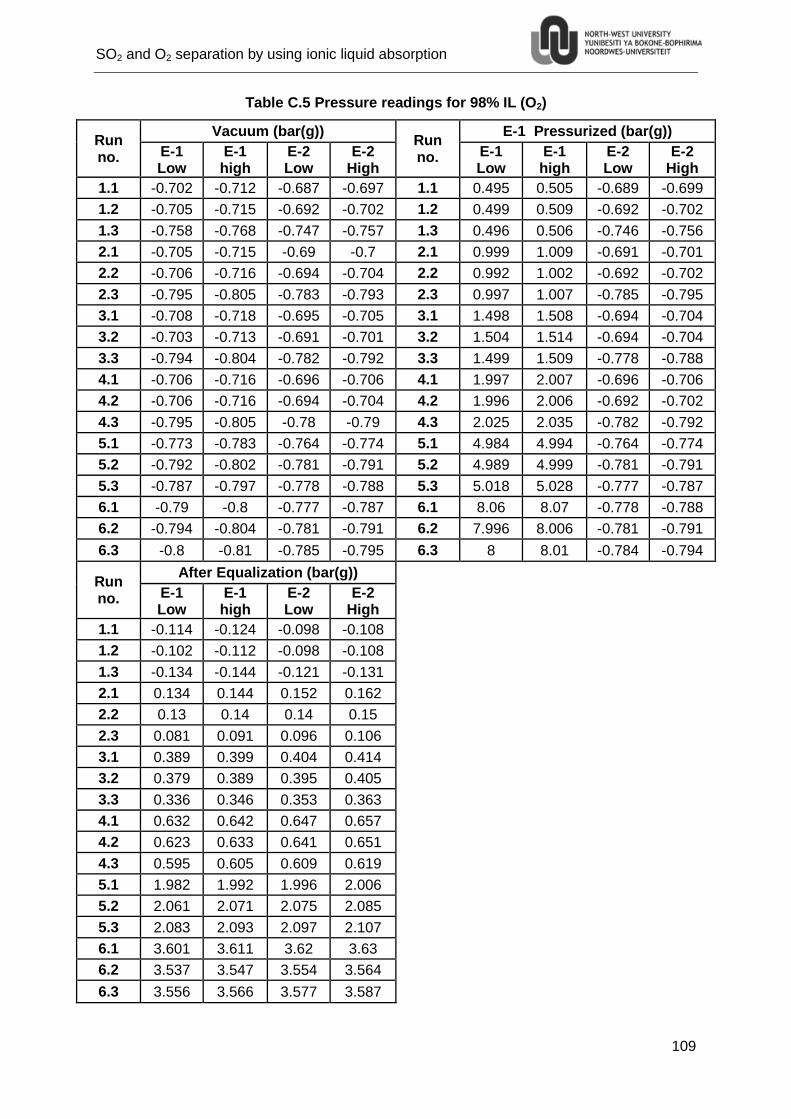
SO2 and O2 separation by using ionic liquid absorption
109
Table C.5 Pressure readings for 98% IL (O2)
Run no.
Vacuum (bar(g)) Run no.
E-1 Pressurized (bar(g))
E-1 Low
E-1 high
E-2 Low
E-2 High
E-1 Low
E-1 high
E-2 Low
E-2 High
1.1 -0.702 -0.712 -0.687 -0.697 1.1 0.495 0.505 -0.689 -0.699
1.2 -0.705 -0.715 -0.692 -0.702 1.2 0.499 0.509 -0.692 -0.702
1.3 -0.758 -0.768 -0.747 -0.757 1.3 0.496 0.506 -0.746 -0.756
2.1 -0.705 -0.715 -0.69 -0.7 2.1 0.999 1.009 -0.691 -0.701
2.2 -0.706 -0.716 -0.694 -0.704 2.2 0.992 1.002 -0.692 -0.702
2.3 -0.795 -0.805 -0.783 -0.793 2.3 0.997 1.007 -0.785 -0.795
3.1 -0.708 -0.718 -0.695 -0.705 3.1 1.498 1.508 -0.694 -0.704
3.2 -0.703 -0.713 -0.691 -0.701 3.2 1.504 1.514 -0.694 -0.704
3.3 -0.794 -0.804 -0.782 -0.792 3.3 1.499 1.509 -0.778 -0.788
4.1 -0.706 -0.716 -0.696 -0.706 4.1 1.997 2.007 -0.696 -0.706
4.2 -0.706 -0.716 -0.694 -0.704 4.2 1.996 2.006 -0.692 -0.702
4.3 -0.795 -0.805 -0.78 -0.79 4.3 2.025 2.035 -0.782 -0.792
5.1 -0.773 -0.783 -0.764 -0.774 5.1 4.984 4.994 -0.764 -0.774
5.2 -0.792 -0.802 -0.781 -0.791 5.2 4.989 4.999 -0.781 -0.791
5.3 -0.787 -0.797 -0.778 -0.788 5.3 5.018 5.028 -0.777 -0.787
6.1 -0.79 -0.8 -0.777 -0.787 6.1 8.06 8.07 -0.778 -0.788
6.2 -0.794 -0.804 -0.781 -0.791 6.2 7.996 8.006 -0.781 -0.791
6.3 -0.8 -0.81 -0.785 -0.795 6.3 8 8.01 -0.784 -0.794
Run no.
After Equalization (bar(g))
E-1 Low
E-1 high
E-2 Low
E-2 High
1.1 -0.114 -0.124 -0.098 -0.108
1.2 -0.102 -0.112 -0.098 -0.108
1.3 -0.134 -0.144 -0.121 -0.131
2.1 0.134 0.144 0.152 0.162
2.2 0.13 0.14 0.14 0.15
2.3 0.081 0.091 0.096 0.106
3.1 0.389 0.399 0.404 0.414
3.2 0.379 0.389 0.395 0.405
3.3 0.336 0.346 0.353 0.363
4.1 0.632 0.642 0.647 0.657
4.2 0.623 0.633 0.641 0.651
4.3 0.595 0.605 0.609 0.619
5.1 1.982 1.992 1.996 2.006
5.2 2.061 2.071 2.075 2.085
5.3 2.083 2.093 2.097 2.107
6.1 3.601 3.611 3.62 3.63
6.2 3.537 3.547 3.554 3.564
6.3 3.556 3.566 3.577 3.587
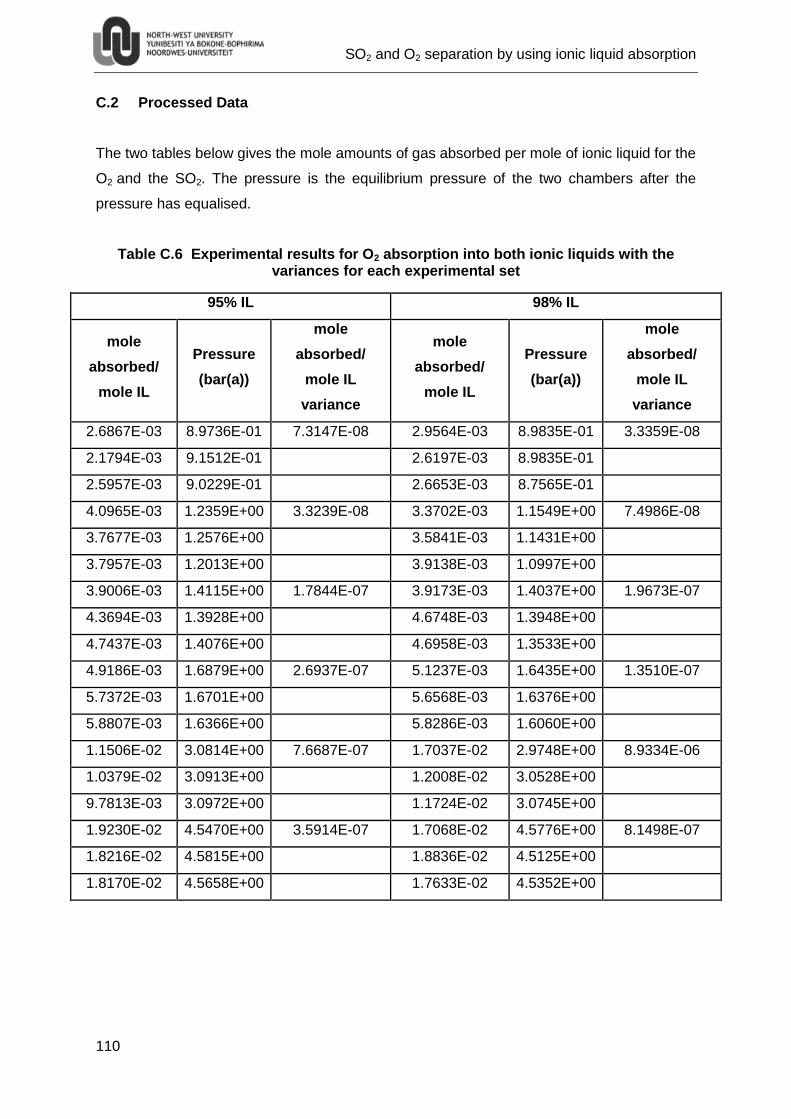
SO2 and O2 separation by using ionic liquid absorption
110
C.2 Processed Data
The two tables below gives the mole amounts of gas absorbed per mole of ionic liquid for the
O2 and the SO2. The pressure is the equilibrium pressure of the two chambers after the
pressure has equalised.
Table C.6 Experimental results for O2 absorption into both ionic liquids with the variances for each experimental set
95% IL 98% IL
mole
absorbed/
mole IL
Pressure
(bar(a))
mole
absorbed/
mole IL
variance
mole
absorbed/
mole IL
Pressure
(bar(a))
mole
absorbed/
mole IL
variance
2.6867E-03 8.9736E-01 7.3147E-08 2.9564E-03 8.9835E-01 3.3359E-08
2.1794E-03 9.1512E-01 2.6197E-03 8.9835E-01
2.5957E-03 9.0229E-01 2.6653E-03 8.7565E-01
4.0965E-03 1.2359E+00 3.3239E-08 3.3702E-03 1.1549E+00 7.4986E-08
3.7677E-03 1.2576E+00 3.5841E-03 1.1431E+00
3.7957E-03 1.2013E+00 3.9138E-03 1.0997E+00
3.9006E-03 1.4115E+00 1.7844E-07 3.9173E-03 1.4037E+00 1.9673E-07
4.3694E-03 1.3928E+00 4.6748E-03 1.3948E+00
4.7437E-03 1.4076E+00 4.6958E-03 1.3533E+00
4.9186E-03 1.6879E+00 2.6937E-07 5.1237E-03 1.6435E+00 1.3510E-07
5.7372E-03 1.6701E+00 5.6568E-03 1.6376E+00
5.8807E-03 1.6366E+00 5.8286E-03 1.6060E+00
1.1506E-02 3.0814E+00 7.6687E-07 1.7037E-02 2.9748E+00 8.9334E-06
1.0379E-02 3.0913E+00 1.2008E-02 3.0528E+00
9.7813E-03 3.0972E+00 1.1724E-02 3.0745E+00
1.9230E-02 4.5470E+00 3.5914E-07 1.7068E-02 4.5776E+00 8.1498E-07
1.8216E-02 4.5815E+00 1.8836E-02 4.5125E+00
1.8170E-02 4.5658E+00 1.7633E-02 4.5352E+00
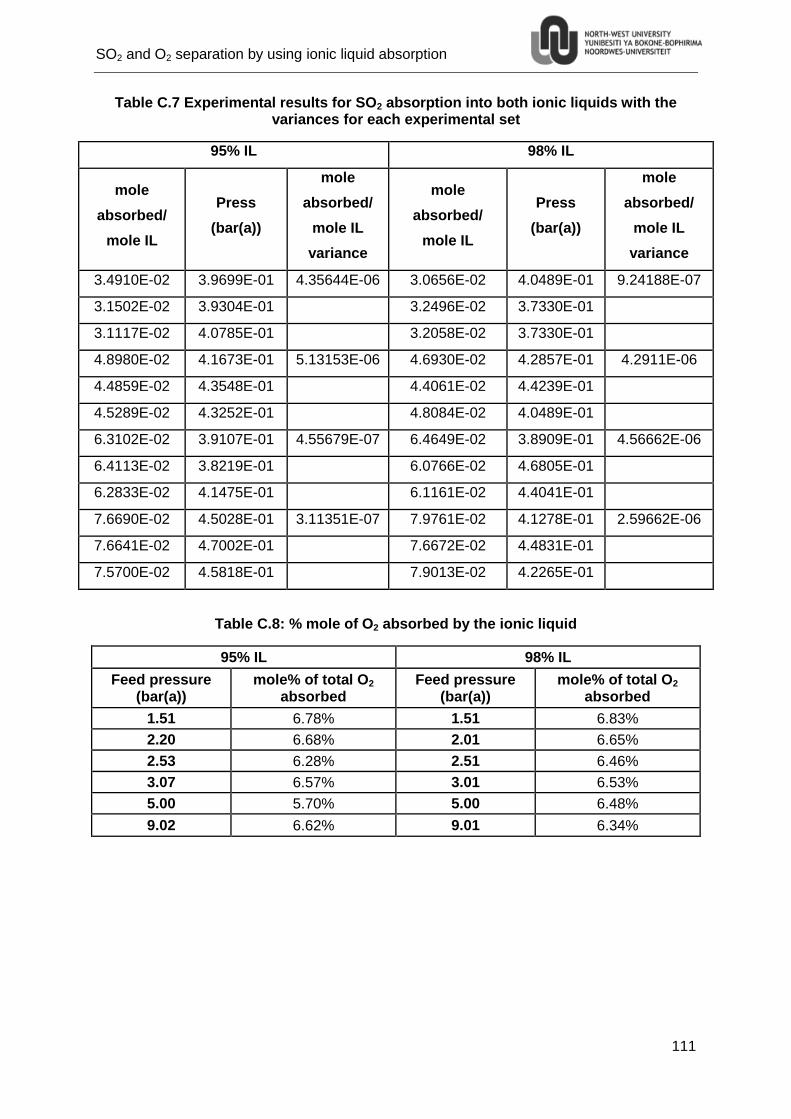
SO2 and O2 separation by using ionic liquid absorption
111
Table C.7 Experimental results for SO2 absorption into both ionic liquids with the variances for each experimental set
95% IL 98% IL
mole
absorbed/
mole IL
Press
(bar(a))
mole
absorbed/
mole IL
variance
mole
absorbed/
mole IL
Press
(bar(a))
mole
absorbed/
mole IL
variance
3.4910E-02 3.9699E-01 4.35644E-06 3.0656E-02 4.0489E-01 9.24188E-07
3.1502E-02 3.9304E-01
3.2496E-02 3.7330E-01
3.1117E-02 4.0785E-01
3.2058E-02 3.7330E-01
4.8980E-02 4.1673E-01 5.13153E-06 4.6930E-02 4.2857E-01 4.2911E-06
4.4859E-02 4.3548E-01
4.4061E-02 4.4239E-01
4.5289E-02 4.3252E-01
4.8084E-02 4.0489E-01
6.3102E-02 3.9107E-01 4.55679E-07 6.4649E-02 3.8909E-01 4.56662E-06
6.4113E-02 3.8219E-01
6.0766E-02 4.6805E-01
6.2833E-02 4.1475E-01
6.1161E-02 4.4041E-01
7.6690E-02 4.5028E-01 3.11351E-07 7.9761E-02 4.1278E-01 2.59662E-06
7.6641E-02 4.7002E-01
7.6672E-02 4.4831E-01
7.5700E-02 4.5818E-01 7.9013E-02 4.2265E-01
Table C.8: % mole of O2 absorbed by the ionic liquid
95% IL 98% IL
Feed pressure (bar(a))
mole% of total O2 absorbed
Feed pressure (bar(a))
mole% of total O2 absorbed
1.51 6.78% 1.51 6.83%
2.20 6.68% 2.01 6.65%
2.53 6.28% 2.51 6.46%
3.07 6.57% 3.01 6.53%
5.00 5.70% 5.00 6.48%
9.02 6.62% 9.01 6.34%
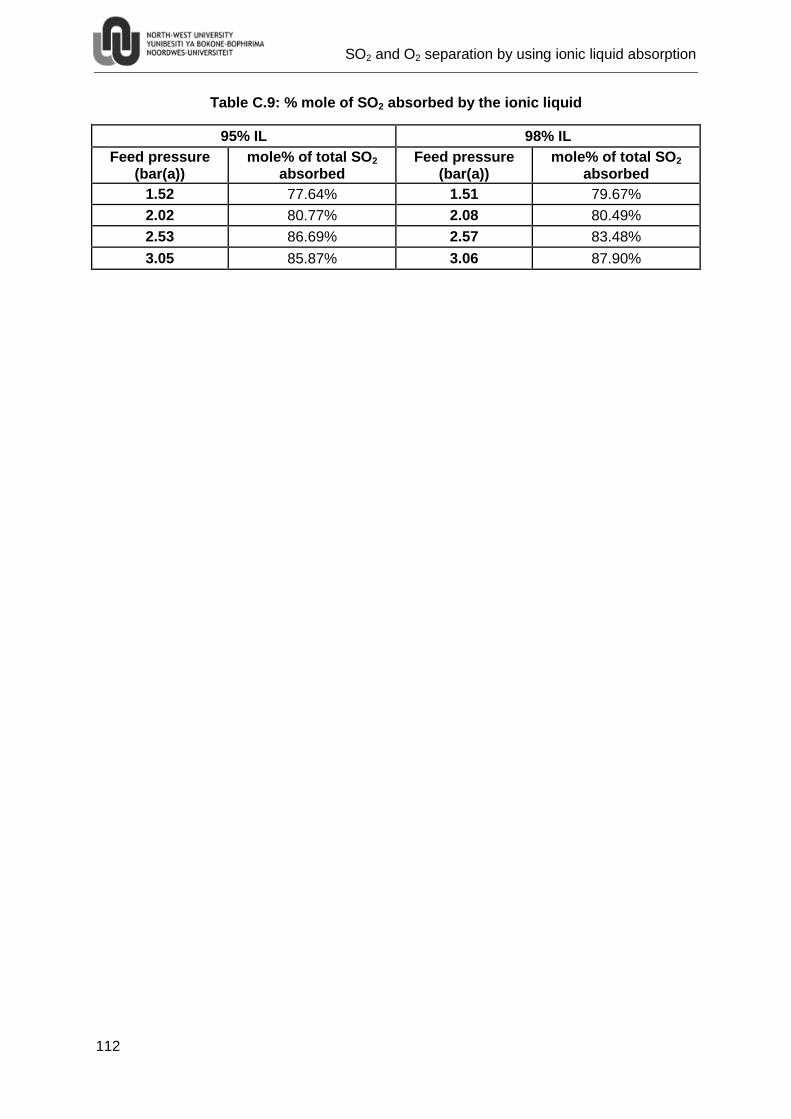
SO2 and O2 separation by using ionic liquid absorption
112
Table C.9: % mole of SO2 absorbed by the ionic liquid
95% IL 98% IL
Feed pressure (bar(a))
mole% of total SO2 absorbed
Feed pressure (bar(a))
mole% of total SO2 absorbed
1.52 77.64% 1.51 79.67%
2.02 80.77% 2.08 80.49%
2.53 86.69% 2.57 83.48%
3.05 85.87% 3.06 87.90%
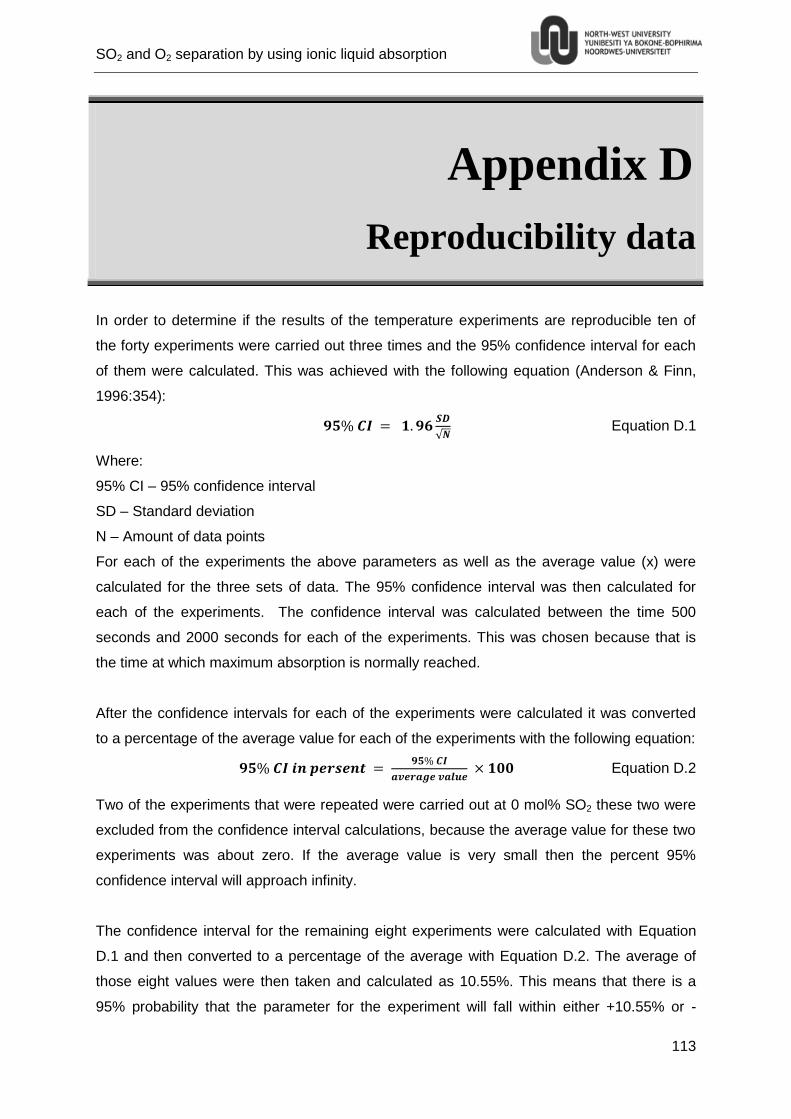
SO2 and O2 separation by using ionic liquid absorption
113
In order to determine if the results of the temperature experiments are reproducible ten of
the forty experiments were carried out three times and the 95% confidence interval for each
of them were calculated. This was achieved with the following equation (Anderson & Finn,
1996:354):
√ Equation D.1
Where:
95% CI – 95% confidence interval
SD – Standard deviation
N – Amount of data points
For each of the experiments the above parameters as well as the average value (x) were
calculated for the three sets of data. The 95% confidence interval was then calculated for
each of the experiments. The confidence interval was calculated between the time 500
seconds and 2000 seconds for each of the experiments. This was chosen because that is
the time at which maximum absorption is normally reached.
After the confidence intervals for each of the experiments were calculated it was converted
to a percentage of the average value for each of the experiments with the following equation:
Equation D.2
Two of the experiments that were repeated were carried out at 0 mol% SO2 these two were
excluded from the confidence interval calculations, because the average value for these two
experiments was about zero. If the average value is very small then the percent 95%
confidence interval will approach infinity.
The confidence interval for the remaining eight experiments were calculated with Equation
D.1 and then converted to a percentage of the average with Equation D.2. The average of
those eight values were then taken and calculated as 10.55%. This means that there is a
95% probability that the parameter for the experiment will fall within either +10.55% or -
Appendix D
Reproducibility data
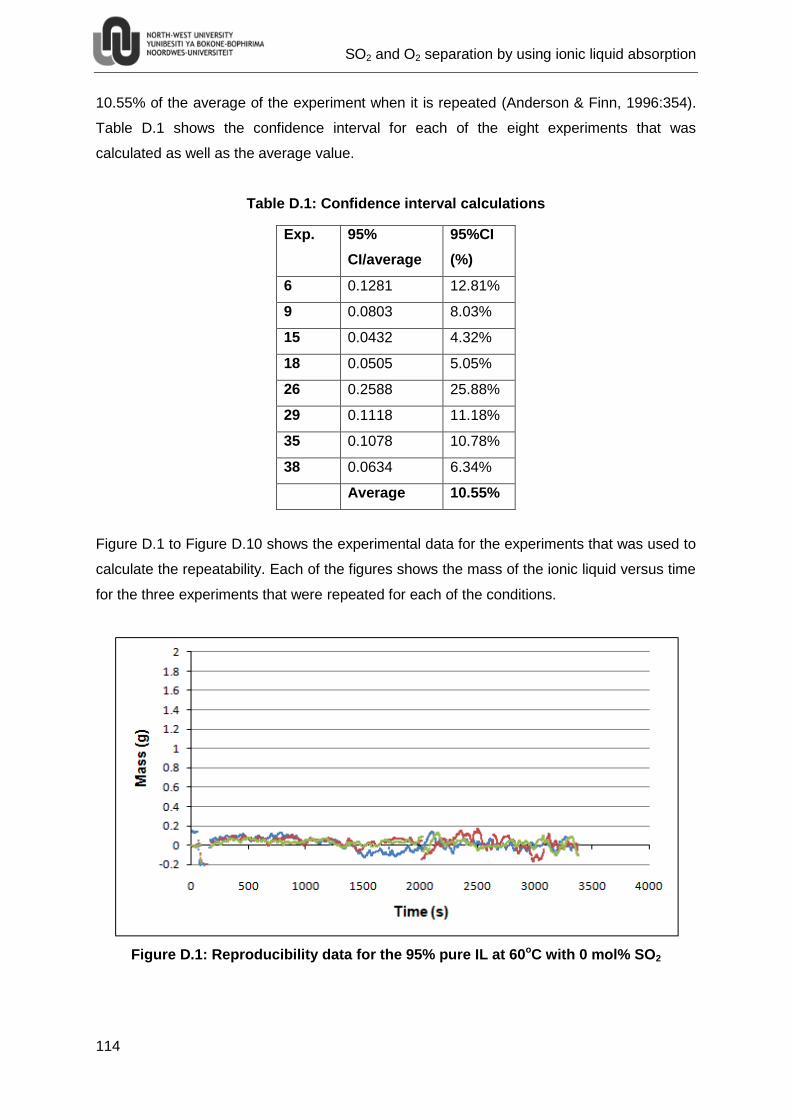
SO2 and O2 separation by using ionic liquid absorption
114
10.55% of the average of the experiment when it is repeated (Anderson & Finn, 1996:354).
Table D.1 shows the confidence interval for each of the eight experiments that was
calculated as well as the average value.
Table D.1: Confidence interval calculations
Exp. 95%
CI/average
95%CI
(%)
6 0.1281 12.81%
9 0.0803 8.03%
15 0.0432 4.32%
18 0.0505 5.05%
26 0.2588 25.88%
29 0.1118 11.18%
35 0.1078 10.78%
38 0.0634 6.34%
Average 10.55%
Figure D.1 to Figure D.10 shows the experimental data for the experiments that was used to
calculate the repeatability. Each of the figures shows the mass of the ionic liquid versus time
for the three experiments that were repeated for each of the conditions.
Figure D.1: Reproducibility data for the 95% pure IL at 60oC with 0 mol% SO2
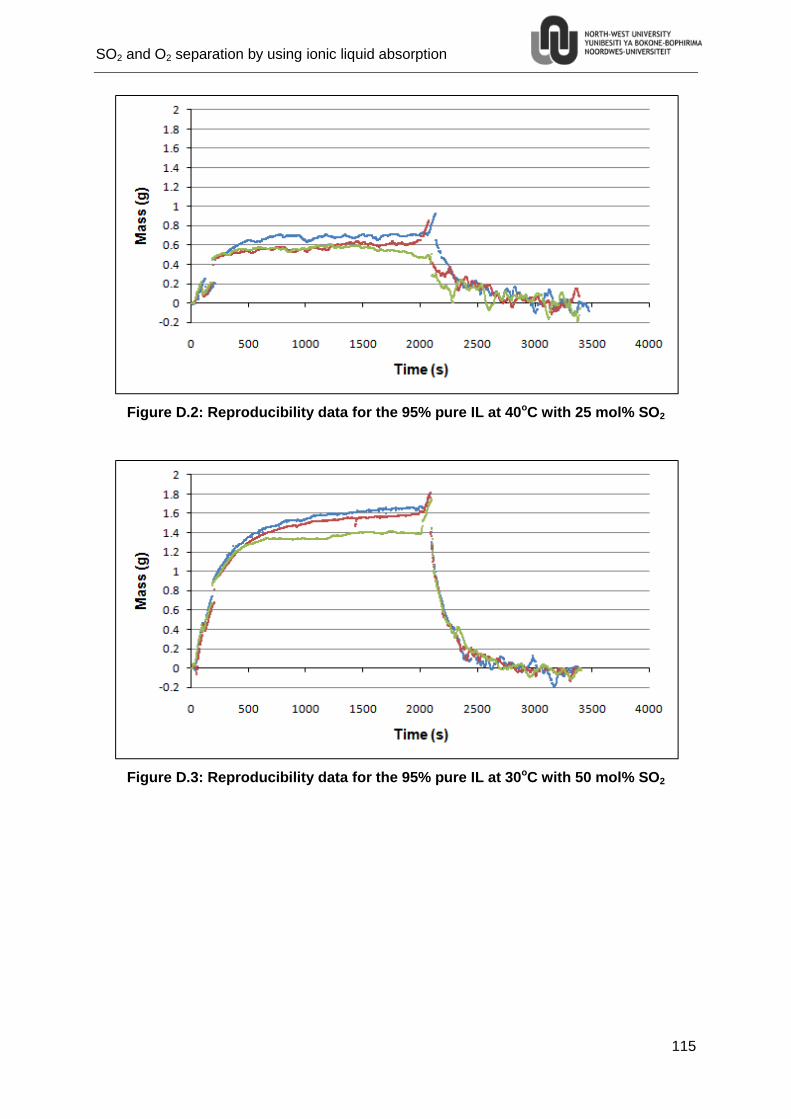
SO2 and O2 separation by using ionic liquid absorption
115
Figure D.2: Reproducibility data for the 95% pure IL at 40oC with 25 mol% SO2
Figure D.3: Reproducibility data for the 95% pure IL at 30oC with 50 mol% SO2
SO2 and O2 separation by using ionic liquid absorption
116
Figure D.4: Reproducibility data for the 95% pure IL at 50oC with 75 mol% SO2
Figure D.5: Reproducibility data for the 95% pure IL at 40oC with 100 mol% SO2
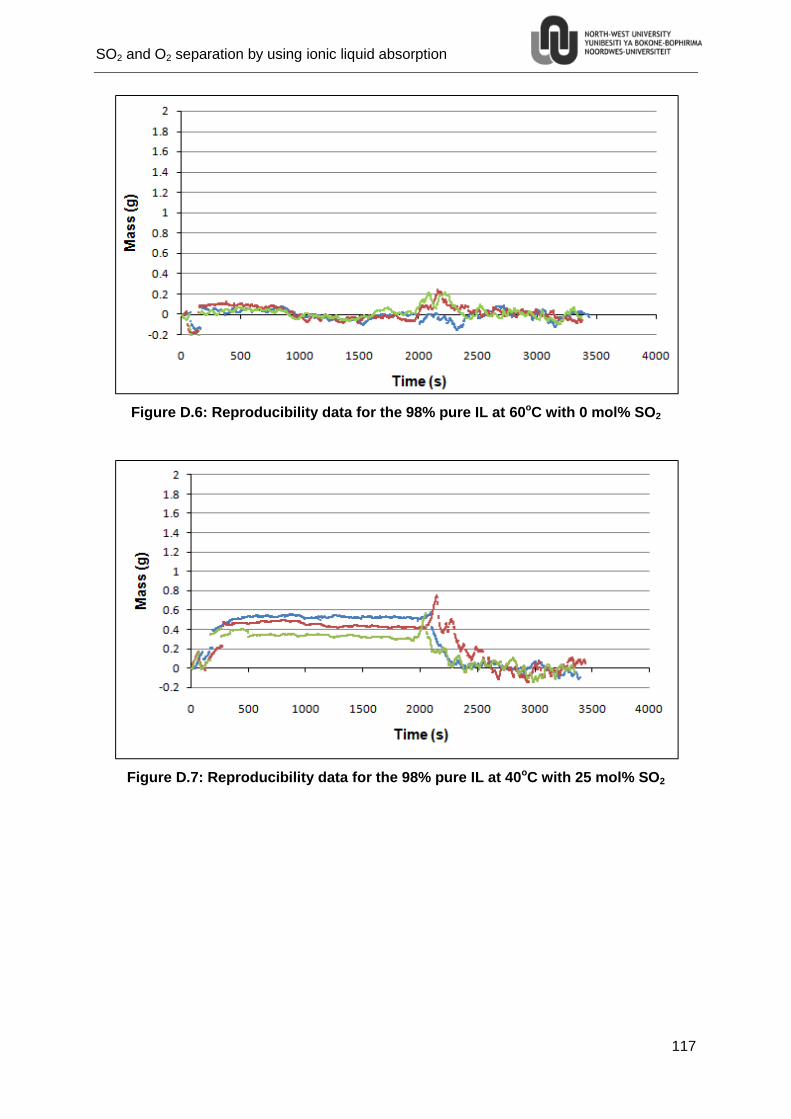
SO2 and O2 separation by using ionic liquid absorption
117
Figure D.6: Reproducibility data for the 98% pure IL at 60oC with 0 mol% SO2
Figure D.7: Reproducibility data for the 98% pure IL at 40oC with 25 mol% SO2
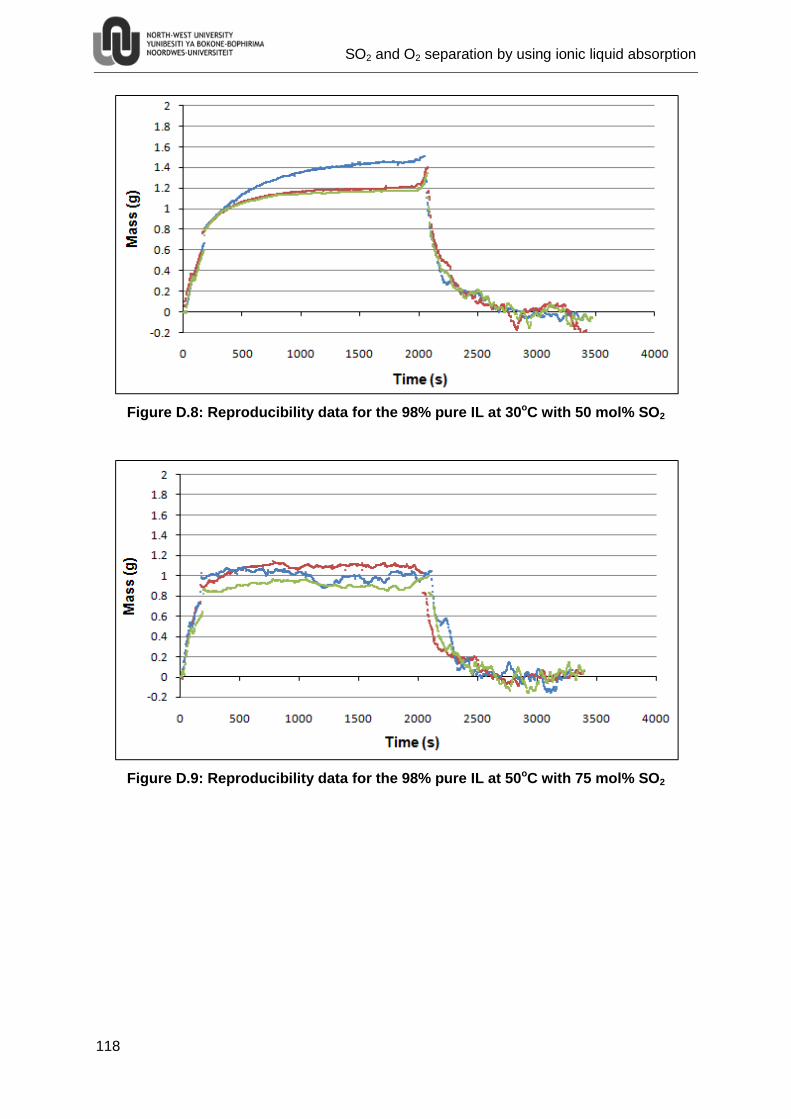
SO2 and O2 separation by using ionic liquid absorption
118
Figure D.8: Reproducibility data for the 98% pure IL at 30oC with 50 mol% SO2
Figure D.9: Reproducibility data for the 98% pure IL at 50oC with 75 mol% SO2
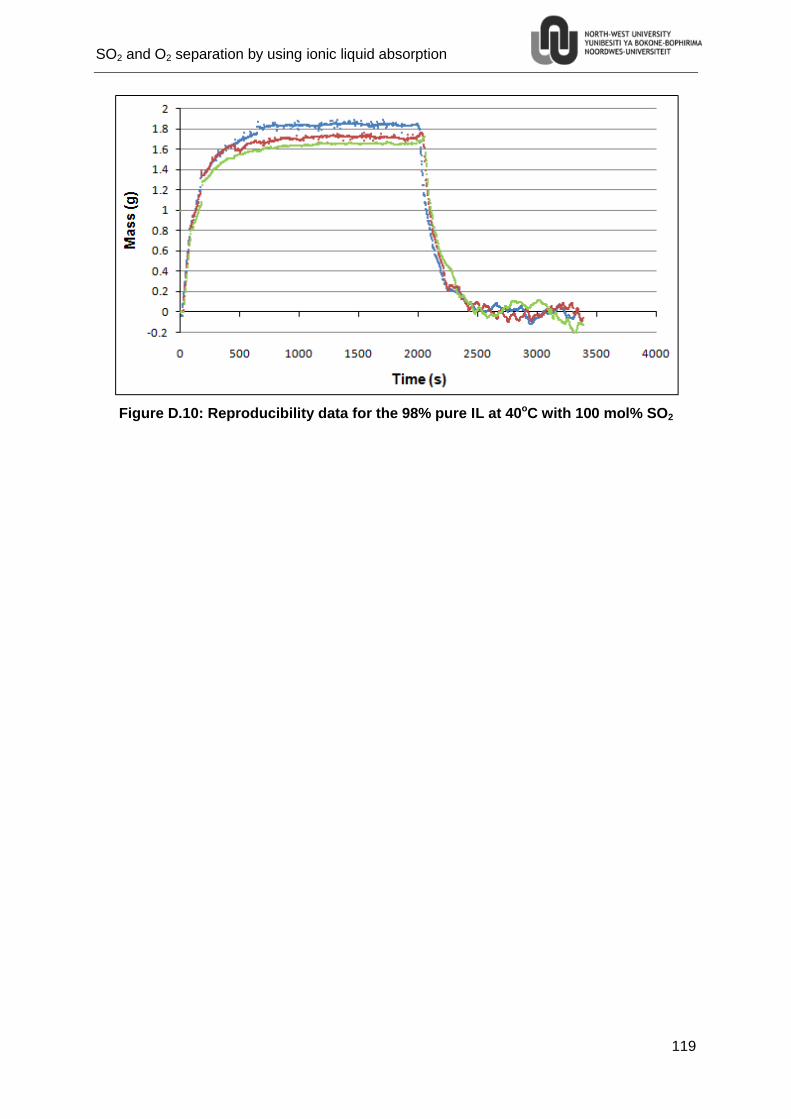
SO2 and O2 separation by using ionic liquid absorption
119
Figure D.10: Reproducibility data for the 98% pure IL at 40oC with 100 mol% SO2

SO2 and O2 separation by using ionic liquid absorption
120
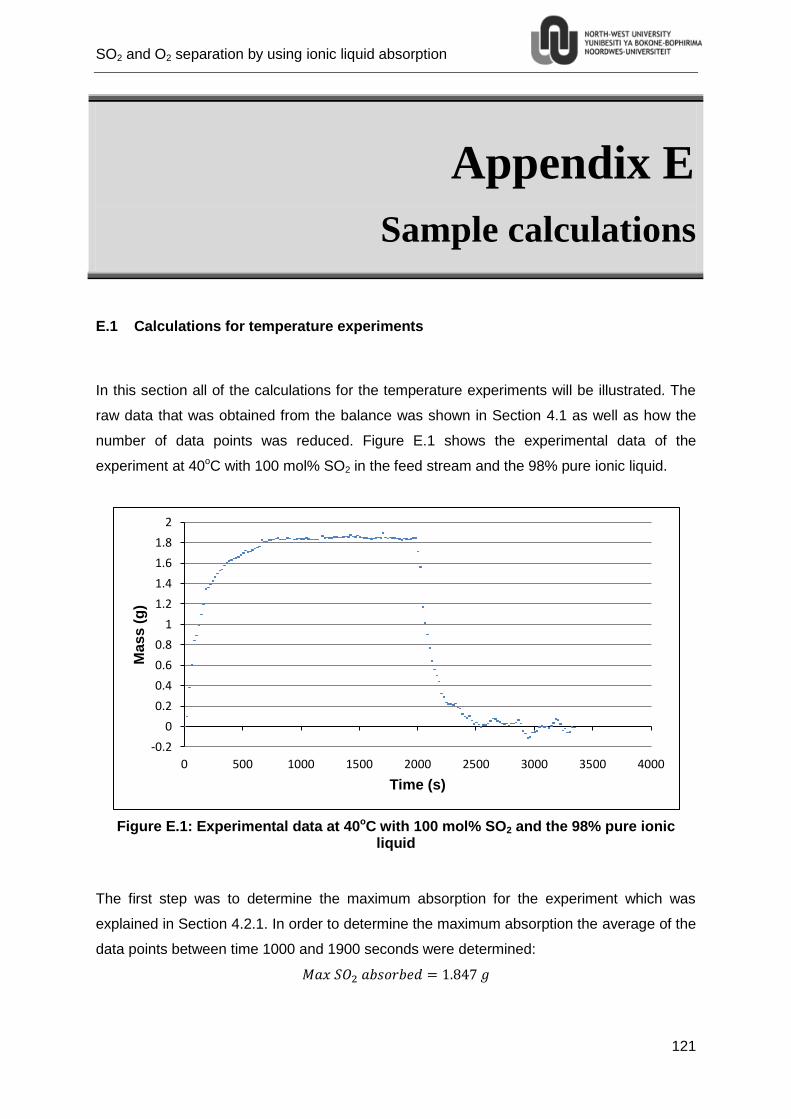
SO2 and O2 separation by using ionic liquid absorption
121
Appendix E
Sample calculations
E.1 Calculations for temperature experiments
In this section all of the calculations for the temperature experiments will be illustrated. The
raw data that was obtained from the balance was shown in Section 4.1 as well as how the
number of data points was reduced. Figure E.1 shows the experimental data of the
experiment at 40oC with 100 mol% SO2 in the feed stream and the 98% pure ionic liquid.
Figure E.1: Experimental data at 40oC with 100 mol% SO2 and the 98% pure ionic liquid
The first step was to determine the maximum absorption for the experiment which was
explained in Section 4.2.1. In order to determine the maximum absorption the average of the
data points between time 1000 and 1900 seconds were determined:
-0.2
0
0.2
0.4
0.6
0.8
1
1.2
1.4
1.6
1.8
2
0 500 1000 1500 2000 2500 3000 3500 4000
Ma
ss
(g
)
Time (s)
SO2 and O2 separation by using ionic liquid absorption
122
Now the amount of mole SO2 that was absorbed into the ionic liquid per mole of ionic liquid
was determined:
The MoleSO2 absorbed was calculated as:
Where:
MWSO2 – Molecular weight of SO2 (64.066 g/mol)
The moleIL can be calculated as:
Where:
VIL – Volume of the ionic liquid used in the experiment (3 cm3)
ρIL – Density of the ionic liquid (1.21 g/cm3)
MWIL – Molecular weight of the ionic liquid (250.32 g/mol)
Thus:
( )( )
Now:
And:
After the mole SO2 absorbed per mole ionic liquid the initial absorption rate of the SO2 had to
be calculated. This was done by calculating the initial slope of the SO2 absorbed versus time
graph (Figure E.1). In order to do this the average slope between the points from 20 seconds
to 80 seconds was calculated:
This value is then converted to mol SO2/mol IL·min:
Secondly the initial desorption rate was calculated as described in Section 4.2.3. This is
similar to the way the initial absorption rate was calculated in this case the initial slope of the
SO2 absorbed versus time graph (Figure E.1) was calculated for the section after 2000
seconds when the SO2 was desorbed. This was done by calculating the average slope
between the points from 2100 seconds to 2160 seconds:
SO2 and O2 separation by using ionic liquid absorption
123
This value is then converted to mol SO2/mol IL·min:
Then the desorption time was calculated as described in Section 4.2.3. This is similar to the
way the absorption time was calculated in this case the average value of the data points
from time 2500 seconds to the end of the experiment was calculated. After which the time at
which the data points reached the average value was determined, then the time from when
the temperature was increased to when the data points reached the average value was
calculated and this was the desorption time.
After this the maximum absorption data was modelled with the Langmuir absorption model
which was discussed in Section 4.3.1. The mole amount of SO2 that was absorbed by the
ionic liquid was plotted versus partial pressure of SO2 for each of the temperatures. The
Langmuir equation was then used to calculate values for the mole SO2 absorbed after which
the method of least squares was used to calculate the fitted values for k and xmax. For the
98% pure ionic liquid at 40oC the value of k = 0.7 1/bar and the xmax value was 4.60 mol SO2/
mol IL. After this the evaluation of the model was done in Section 4.3.2.
Finally the heat of desorption for the desorption reaction was calculated by using the
Clausius-Clapeyron equation (Equation 4.3). Firstly PSO2 was calculated by determining
interpolated values for PSO2 at three different SO2 absorption amounts, namely 0.5, 1.0 and
1.5 mol SO2/mol IL at each of the experimental temperatures. To determine these values
Figure 4.23 and Figure 4.24 were plotted, that show the SO2 absorption data versus the
partial pressure of SO2. The SO2 partial pressures of the 98% pure ionic liquid at 40oC for
0.5, 1.0 and 1.5 mol SO2/mol IL was 0.22, 0.45 and 0.68 bar respectively. From this data the
ln(PSO2) versus 1/T graphs were drawn. The slopes of the data in these graphs were then
used to calculate the heat of desorption at each amount of SO2 absorbed which is shown in
Table 4.7.
E.2 Calculations for pressure experiments
This section will show all of the calculations that were made for the pressure experiments.
The raw data for one of the experiments will be taken and then all of the calculations that
were made in order to calculate the percent of the gas that was absorbed into the ionic liquid
SO2 and O2 separation by using ionic liquid absorption
124
will be shown. The first step was to obtain the raw data, for this section the data from the
experiment with the 95% pure ionic liquid at 3 bar(a) feed pressure with SO2 was used.
Table E.1 shows an example of data obtained from the pressure experiments.
Table E.1: Example of raw data for pressure experiment
E-1 (bar(g)) E-2 (bar(g)) E-1 (Pa(a)) E-2 (Pa(a))
Vacuum -0.772 -0.764 24125 24925
E-1 Pressurised 2.038 -0.764 305125 24925
Equalised pressure -0.553 -0.544 46025 46925
Table E.1 shows the pressure in both chamber E-1 and E-2 when the setup was under
vacuum, when chamber E-1 was pressurised and after the pressure had been equalised,
these pressures were obtained in bar(g) and then they were converted to Pa(a). The next
step was to calculate the delta pressure between the vacuum and E-1 pressurised in order
to calculate the amount of mole gas that was in E-1 before the gas was absorbed into the
ionic liquid. This was done as follows:
After which the amount of mole in chamber E-1 was calculated with the ideal gas law:
Where :
Mole – Amount of mole in chamber E-1 before the gas is absorbed into the ionic liquid.
∆P – 281000 Pa
V – Volume of chamber E-1 (18.9×10⁻⁶ m3)
R – Gas constant (8.314 J/molK)
T – Temperature (298 K)
( )( )
( )( )
Then valve V-2 was opened and the gas was allowed to absorb into the ionic liquid after the
pressure equalised the mole amount of gas was determined for both chamber E-1 and E-2
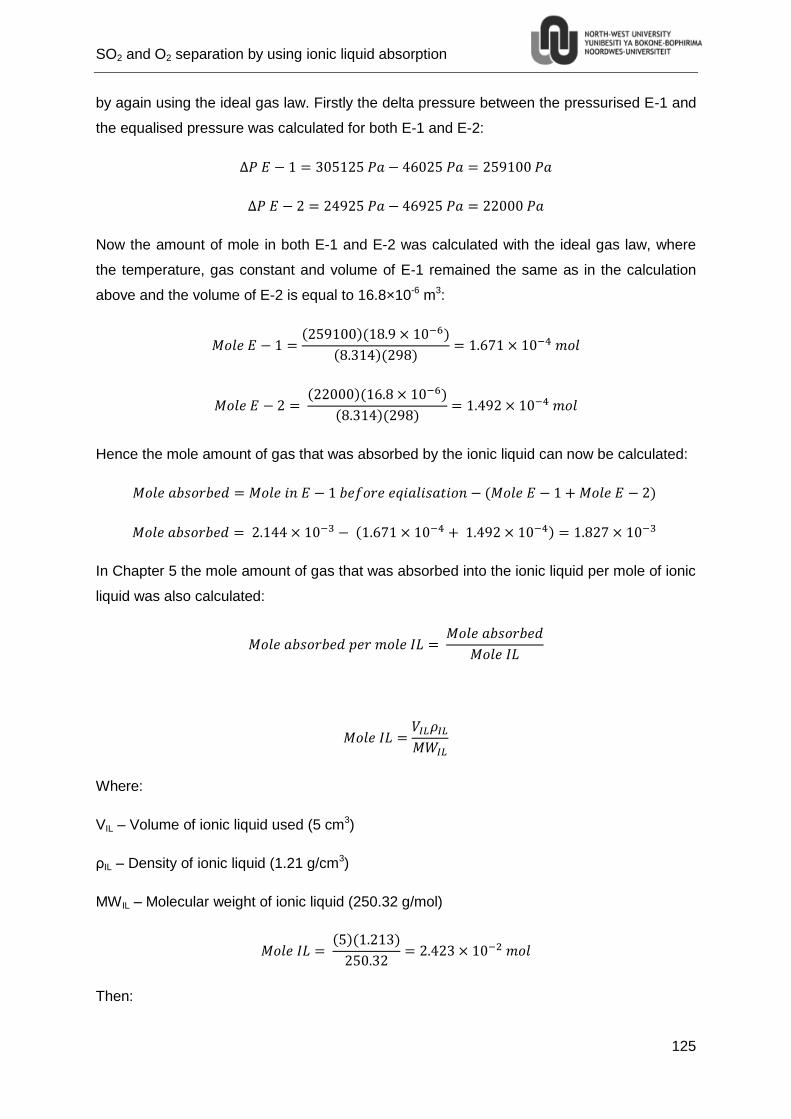
SO2 and O2 separation by using ionic liquid absorption
125
by again using the ideal gas law. Firstly the delta pressure between the pressurised E-1 and
the equalised pressure was calculated for both E-1 and E-2:
Now the amount of mole in both E-1 and E-2 was calculated with the ideal gas law, where
the temperature, gas constant and volume of E-1 remained the same as in the calculation
above and the volume of E-2 is equal to 16.8×10⁻⁶ m3:
( )( )
( )( )
( )( )
( )( )
Hence the mole amount of gas that was absorbed by the ionic liquid can now be calculated:
( )
( )
In Chapter 5 the mole amount of gas that was absorbed into the ionic liquid per mole of ionic
liquid was also calculated:
Where:
VIL – Volume of ionic liquid used (5 cm3)
ρIL – Density of ionic liquid (1.21 g/cm3)
MWIL – Molecular weight of ionic liquid (250.32 g/mol)
( )( )
Then:
SO2 and O2 separation by using ionic liquid absorption
126
This was done three times and the average value of the three experiments was taken as the
mole value of gas absorbed per mole ionic liquid. The mole percent of the gas that was fed
to the ionic liquid that was actually absorbed was also calculated:
The percent value was also calculated for all three experiments and the average value taken
as the final mole percent gas absorbed.
SO2 and O2 separation by using ionic liquid absorption
127
Appendix F
CD
The data on the CD will include:
- The desorption video discussed in Section 5.3.2.
- MSDS for [BMIm][MeSO4].
- MSDS for Oxygen.
- MSDS for Sulphur dioxide.
- Digital copy of the dissertation.

Safety Data SheetAccording to EC Directive 91/155/EEC
Date of issue: 08.05.2007Supersedes edition of 22.09.2004
1. Identification of the substance/preparation and of the company/undertaking
Identification of the product
Catalogue No.: 490063
Product name: 1-Butyl-3-methylimidazolium methylsulfate for synthesis
Use of the substance/preparation
Solvent
Chemical for synthesis
Company/undertaking identification
Company: Merck KGaA * 64271 Darmstadt * Germany * Phone: +49 6151 72-0
Emergency telephone No.: Please contact the regional Merck representation in your country.
2. Composition/information on ingredients
CAS-No.: 401788-98-5
M: 250.32 g/mol
Formula Hill: C9H18N2O4S
3. Hazards identification
Causes burns.
Caution! Substance not yet fully tested.
The test results available so far do not permit a complete evaluation. Further risks cannot be excluded if the product is handled inappropriately.
4. First aid measures
After inhalation: fresh air. Call in physician. After skin contact: wash off with plenty of water. Dab with polyethylene glycol 400.Immediately remove contaminated clothing. After eye contact: rinse out with plenty of water with the eyelid held wide open. Immediately callin ophtalmologist. After swallowing: make victim drink plenty of water, avoid vomiting (risk of perforation!).Immediately call in physician. Do not attempt to neutralize.
The Safety Data Sheets for catalog items are also available at www.chemdat.info Page 1 of 5
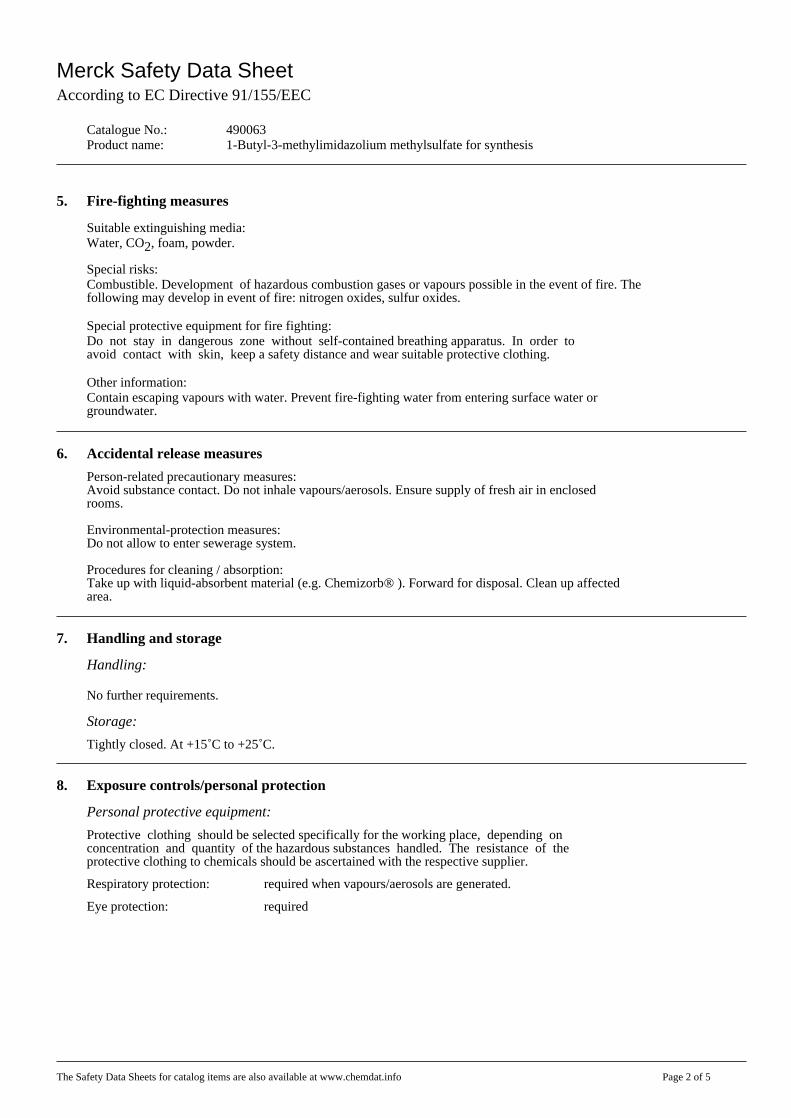
Merck Safety Data SheetAccording to EC Directive 91/155/EEC
Catalogue No.: 490063Product name: 1-Butyl-3-methylimidazolium methylsulfate for synthesis
5. Fire-fighting measures
Suitable extinguishing media:Water, CO2, foam, powder.
Special risks:Combustible. Development of hazardous combustion gases or vapours possible in the event of fire. Thefollowing may develop in event of fire: nitrogen oxides, sulfur oxides.
Special protective equipment for fire fighting:Do not stay in dangerous zone without self-contained breathing apparatus. In order to avoid contact with skin, keep a safety distance and wear suitable protective clothing.
Other information:Contain escaping vapours with water. Prevent fire-fighting water from entering surface water orgroundwater.
6. Accidental release measures
Person-related precautionary measures: Avoid substance contact. Do not inhale vapours/aerosols. Ensure supply of fresh air in enclosedrooms. Environmental-protection measures: Do not allow to enter sewerage system. Procedures for cleaning / absorption: Take up with liquid-absorbent material (e.g. Chemizorb® ). Forward for disposal. Clean up affectedarea.
7. Handling and storage
Handling:
No further requirements.
Storage:
Tightly closed. At +15˚C to +25˚C.
8. Exposure controls/personal protection
Personal protective equipment:
Protective clothing should be selected specifically for the working place, depending on concentration and quantity of the hazardous substances handled. The resistance of theprotective clothing to chemicals should be ascertained with the respective supplier.
Respiratory protection: required when vapours/aerosols are generated.
Eye protection: required
The Safety Data Sheets for catalog items are also available at www.chemdat.info Page 2 of 5
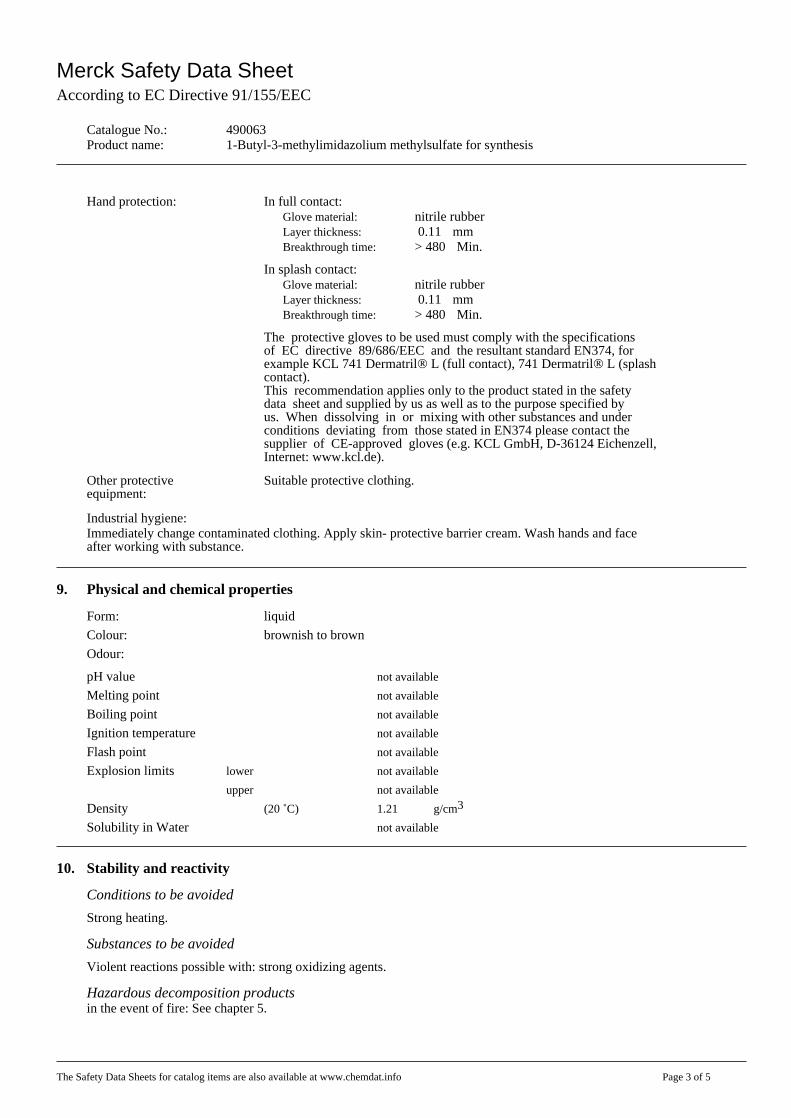
Merck Safety Data SheetAccording to EC Directive 91/155/EEC
Catalogue No.: 490063Product name: 1-Butyl-3-methylimidazolium methylsulfate for synthesis
Hand protection: In full contact:Glove material: nitrile rubberLayer thickness: 0.11 mmBreakthrough time: > 480 Min.
In splash contact:Glove material: nitrile rubberLayer thickness: 0.11 mmBreakthrough time: > 480 Min.
The protective gloves to be used must comply with the specificationsof EC directive 89/686/EEC and the resultant standard EN374, forexample KCL 741 Dermatril® L (full contact), 741 Dermatril® L (splashcontact). This recommendation applies only to the product stated in the safetydata sheet and supplied by us as well as to the purpose specified byus. When dissolving in or mixing with other substances and underconditions deviating from those stated in EN374 please contact thesupplier of CE-approved gloves (e.g. KCL GmbH, D-36124 Eichenzell,Internet: www.kcl.de).
Other protectiveequipment:
Suitable protective clothing.
Industrial hygiene:Immediately change contaminated clothing. Apply skin- protective barrier cream. Wash hands and faceafter working with substance.
9. Physical and chemical properties
Form: liquid
Colour: brownish to brown
Odour:
pH value not available
Melting point not available
Boiling point not available
Ignition temperature not available
Flash point not available
Explosion limits lower not available
upper not available
Density (20 ˚C) 1.21 g/cm3
Solubility in Water not available
10. Stability and reactivity
Conditions to be avoided
Strong heating.
Substances to be avoided
Violent reactions possible with: strong oxidizing agents.
Hazardous decomposition productsin the event of fire: See chapter 5.
The Safety Data Sheets for catalog items are also available at www.chemdat.info Page 3 of 5
Merck Safety Data SheetAccording to EC Directive 91/155/EEC
Catalogue No.: 490063Product name: 1-Butyl-3-methylimidazolium methylsulfate for synthesis
11. Toxicological information
Acute toxicity
Quantitative data on the toxicity of this product are not available.
Further toxicological information
After inhalation: Irritations of the mucous membranes, coughing, and dyspnoea. After skin contact: burns. After eye contact: burns. After swallowing: burns in mouth, throat, oesophagus and gastrointestinal tract. Risk ofperforation in the oesophagus and stomach.
Further data
Further hazardous properties cannot be excluded. The product should be handled with the care usual when dealing with chemicals.
12. Ecological information
Ecotoxic effects: Quantitative data on the ecological effect of this product are not available. Further ecologic data: Do not allow to enter waters, waste water, or soil!
13. Disposal considerations
Product:
Chemicals must be disposed of in compliance with the respective national regulations. Under www.retrologistik.de you will find country- and substance-specific information as well as contact partners.
Packaging:
Merck product packaging must be disposed of in compliance with the country-specific regulationsor must be passed to a packaging return system. Under www.retrologistik.de you will find specialinformation on the respective national conditions as well as contact partners.
14. Transport information
Road & Rail ADR, RIDUN 3265 AETZENDER SAURER ORGANISCHER FLUESSIGER STOFF, N.A.G.(1-BUTYL-3-METHYL-IMIDAZOLIUMMETHYLSULFAT), 8, III
Inland waterway ADN, ADNR not tested
Sea IMDG-CodeUN 3265 CORROSIVE LIQUID, ACIDIC, ORGANIC, N.O.S.(1-BUTYL-3-METHYL-IMIDAZOLIUM METHYL SULFATE), 8, IIIEms F-A S-B
Air CAO, PAXUN 3265 CORROSIVE LIQUID, ACIDIC, ORGANIC, N.O.S.(1-BUTYL-3-METHYL-IMIDAZOLIUM METHYL SULFATE), 8, III
The transport regulations are cited according to international regulations and in the formapplicable in Germany . Possible national deviations in other countries are not considered.
The Safety Data Sheets for catalog items are also available at www.chemdat.info Page 4 of 5
Merck Safety Data SheetAccording to EC Directive 91/155/EEC
Catalogue No.: 490063Product name: 1-Butyl-3-methylimidazolium methylsulfate for synthesis
15. Regulatory information
Labelling according to EC DirectivesSymbol: C Corrosive
R-phrases: 34 Causes burns.
S-phrases: 26-36/37/39-45 In case of contact with eyes, rinse immediatelywith plenty of water and seek medical advice. Wearsuitable protective clothing, gloves and eye/faceprotection. In case of accident or if you feelunwell, seek medical advice immediately (show thelabel where possible).
Additional labelling Caution! Substance not yet fully tested.
16. Other information
Reason for alteration
General update.
Regional representation:
This information is given on the authorised Safety Data Sheet for your country.
The information contained herein is based on the present state of our knowledge. Itcharacterizes the product with regard to the appropriate safety precautions. It does notrepresent a guarantee of the properties of the product.
The Safety Data Sheets for catalog items are also available at www.chemdat.info Page 5 of 5
Oxygen
001043
Synthetic/Analytical chemistry.
6/16/2011.
Material Safety Data Sheet
Product name
AIRGAS INC., on behalf of its subsidiaries259 North Radnor-Chester RoadSuite 100Radnor, PA 19087-52831-610-687-5253
Product use
MSDS #
Date ofPreparation/Revision
In case of emergency
Section 1. Chemical product and company identification
Oxygen
:
:
:
:
Supplier
1-866-734-3438
Synonym : Molecular oxygen; Oxygen molecule; Pure oxygen; O2; Liquid-oxygen-; UN 1072; UN1073; Dioxygen; Oxygen USP, Aviator’s Breathing Oxygen (ABO)
:
:
Inhalation
Emergency overview
Section 2. Hazards identification
Routes of entry
Potential acute health effects
Respiratory system irritation after overexposure to high oxygen concentrations.
May cause eye irritation. Contact with rapidly expanding gas may cause burns orfrostbite. Contact with cryogenic liquid can cause frostbite and cryogenic burns.
Ingestion is not a normal route of exposure for gases. Contact with cryogenic liquid cancause frostbite and cryogenic burns.
May cause skin irritation. Contact with rapidly expanding gas may cause burns orfrostbite. Contact with cryogenic liquid can cause frostbite and cryogenic burns.
Eyes
Skin
Inhalation
Ingestion
Physical state Gas.
See toxicological information (Section 11)
DANGER!
GAS:OXIDIZER.CONTACT WITH COMBUSTIBLE MATERIAL MAY CAUSE FIRE.CONTENTS UNDER PRESURE.Do not puncture or incinerate container.May cause severe frostbite.LIQUID:OXIDIZER.CONTACT WITH COMBUSTIBLE MATERIAL MAY CAUSE FIRE.Extremely cold liquid and gas under pressure.May cause severe frostbite.
Do not puncture or incinerate container. Store in tightly-closed container. Avoid contactwith combustible materials.
:
:
:
:
:
:
:
Medical conditionsaggravated by over-exposure
Acute or chronic respiratory conditions may be aggravated by overexposure to this gas.:
Contact with rapidly expanding gases or liquids can cause frostbite.
Page: 1/7Build 1.1
Oxygen
Oxygen 7782-44-7 100
Section 3. Composition, Information on IngredientsName % Volume Exposure limitsCAS number
As this product is a gas, refer to the inhalation section.
Check for and remove any contact lenses. Immediately flush eyes with plenty of waterfor at least 15 minutes, occasionally lifting the upper and lower eyelids. Get medicalattention immediately.
None expected.
If inhaled, remove to fresh air. If not breathing, give artificial respiration. Get medicalattention.
Section 4. First aid measures
Eye contact
Skin contact
Inhalation
Ingestion
:
:
:
:
No action shall be taken involving any personal risk or without suitable training.If it is suspected that fumes are still present,the rescuer should wear an appropriate mask or self-contained breathing apparatus.It may be dangerous to the personproviding aid to give mouth-to-mouth resuscitation.
Frostbite : Try to warm up the frozen tissues and seek medical attention.
Non-flammable.
No specific data.
Use an extinguishing agent suitable for the surrounding fire.
Extremely flammable in the presence of the following materials or conditions: reducingmaterials, combustible materials and organic materials.
Section 5. Fire-fighting measuresFlammability of the product
Products of combustion
Fire hazards in the presenceof various substances
Fire-fighting media andinstructions
Apply water from a safe distance to cool container and protect surrounding area. Ifinvolved in fire, shut off flow immediately if it can be done without risk.
Contains gas under pressure. Contact with combustible material may cause fire. Thismaterial increases the risk of fire and may aid combustion. In a fire or if heated, apressure increase will occur and the container may burst or explode.
Special protectiveequipment for fire-fighters
Fire-fighters should wear appropriate protective equipment and self-contained breathingapparatus (SCBA) with a full face-piece operated in positive pressure mode.
:
:
:
:
:
Immediately contact emergency personnel. Keep unnecessary personnel away. Usesuitable protective equipment (section 8). Eliminate all ignition sources if safe to do so.Do not touch or walk through spilled material. Shut off gas supply if this can be donesafely. Isolate area until gas has dispersed.
Immediately contact emergency personnel. Stop leak if without risk. Use spark-prooftools and explosion-proof equipment. Note: see section 1 for emergency contactinformation and section 13 for waste disposal.
Environmental precautions
Section 6. Accidental release measures
: Avoid dispersal of spilled material and runoff and contact with soil, waterways, drainsand sewers.
Personal precautions :
Methods for cleaning up :
High pressure gas. Do not puncture or incinerate container. Use equipment rated forcylinder pressure. Close valve after each use and when empty. Store in tightly-closedcontainer. Avoid contact with combustible materials. Protect cylinders from physicaldamage; do not drag, roll, slide, or drop. Use a suitable hand truck for cylindermovement. Never allow any unprotected part of the body to touch uninsulated pipes or vessels thatcontain cryogenic liquids. Prevent entrapment of liquid in closed systems or pipingwithout pressure relief devices. Some materials may become brittle at low temperaturesand will easily fracture.
Section 7. Handling and storageHandling :
Page: 2/7Build 1.1
Oxygen
Keep container tightly closed. Keep container in a cool, well-ventilated area. Separatefrom acids, alkalies, reducing agents and combustibles. Cylinders should be storedupright, with valve protection cap in place, and firmly secured to prevent falling or beingknocked over. Cylinder temperatures should not exceed 52 °C (125 °F).For additional information concerning storage and handling refer to Compressed GasAssociation pamphlets P-1 Safe Handling of Compressed Gases in Containers and P-12 Safe Handling of Cryogenic Liquids available from the Compressed Gas Association,Inc.
Storage :
Use only with adequate ventilation. Use process enclosures, local exhaust ventilation orother engineering controls to keep worker exposure to airborne contaminants below anyrecommended or statutory limits.
Oxygen
Section 8. Exposure controls/personal protectionEngineering controls
Product name
Use a properly fitted, air-purifying or air-fed respirator complying with an approvedstandard if a risk assessment indicates this is necessary. Respirator selection must bebased on known or anticipated exposure levels, the hazards of the product and the safeworking limits of the selected respirator.
Safety eyewear complying with an approved standard should be used when a riskassessment indicates this is necessary to avoid exposure to liquid splashes, mists ordusts.
Personal protective equipment for the body should be selected based on the task beingperformed and the risks involved and should be approved by a specialist before handlingthis product.
Personal protection
Eyes
Skin
Respiratory
Consult local authorities for acceptable exposure limits.
:
:
:
:
Personal protection in caseof a large spill
: Self-contained breathing apparatus (SCBA) should be used to avoid inhalation of theproduct.
Chemical-resistant, impervious gloves complying with an approved standard should beworn at all times when handling chemical products if a risk assessment indicates this isnecessary.
Hands :
The applicable standards are (US) 29 CFR 1910.134 and (Canada) Z94.4-93
When working with cryogenic liquids, wear a full face shield.
Insulated gloves suitable for low temperatures
-183°C (-297.4°F)
-218.4°C (-361.1°F)
1.105 (Air = 1) Liquid Density@BP: 71.23 lb/ft3 (1141 kg/m3)
-118.6°C (-181.5°F)
32 g/mole
Boiling/condensation point
Melting/freezing point
Section 9. Physical and chemical propertiesMolecular weight
Critical temperature
Vapor density
O2Molecular formula
:
:
:
:
:
:
Specific Volume (ft 3/lb) : 12.0482
Gas Density (lb/ft 3) : 0.083
The product is stable.
Extremely reactive or incompatible with the following materials: oxidizing materials,reducing materials and combustible materials.
Under normal conditions of storage and use, hazardous polymerization will not occur.
Under normal conditions of storage and use, hazardous decomposition products shouldnot be produced.
Section 10. Stability and reactivityStability and reactivity
Incompatibility with varioussubstances
Hazardous decompositionproducts
Hazardous polymerization
:
:
:
:
Page: 3/7Build 1.1
Oxygen
Section 11. Toxicological information
Specific effects
Carcinogenic effects No known significant effects or critical hazards.
Mutagenic effects No known significant effects or critical hazards.
Reproduction toxicity No known significant effects or critical hazards.
No specific information is available in our database regarding the other toxic effects ofthis material to humans.
Other toxic effects onhumans
:
Toxicity data
:
:
:
Section 12. Ecological information
Environmental fate : Not available.
Environmental hazards : This product shows a low bioaccumulation potential.
Toxicity to the environment : Not available.
Aquatic ecotoxicity
Not available.
Section 13. Disposal considerationsProduct removed from the cylinder must be disposed of in accordance with appropriate Federal, State, localregulation.Return cylinders with residual product to Airgas, Inc.Do not dispose of locally.
Section 14. Transport information
2.2 LimitedquantityYes.
PackaginginstructionPassengeraircraftQuantitylimitation:75 kg
Cargo aircraftQuantitylimitation:150 kg
SpecialprovisionsA52
DOT Classification
TDG Classification 2.2
OXYGEN,COMPRESSED
Oxygen, refrigeratedliquid
UN1072
UN1073
OXYGEN,COMPRESSED
Oxygen, refrigeratedliquid
Regulatoryinformation
UN number Proper shippingname
Class Packing group Label Additionalinformation
UN1072
UN1073
ExplosiveLimit andLimitedQuantityIndex0.125
ERAP Index3000
PassengerCarrying Ship
Not applicable (gas).
Not applicable (gas).
Page: 4/7Build 1.1
Oxygen
Index50
PassengerCarryingRoad or RailIndex75
Specialprovisions42
MexicoClassification
UN1072
UN1073
OXYGEN,COMPRESSED
Oxygen, refrigeratedliquid
2.2 -Not applicable (gas).
“Refer to CFR 49 (or authority having jurisdiction) to determine the information required for shipment of theproduct.”
Section 15. Regulatory information
U.S. Federal regulations
Connecticut Carcinogen Reporting: This material is not listed.Connecticut Hazardous Material Survey: This material is not listed.Florida substances: This material is not listed.Illinois Chemical Safety Act: This material is not listed.Illinois Toxic Substances Disclosure to Employee Act: This material is not listed.Louisiana Reporting: This material is not listed.Louisiana Spill: This material is not listed.Massachusetts Spill: This material is not listed.Massachusetts Substances: This material is listed.Michigan Critical Material: This material is not listed.Minnesota Hazardous Substances: This material is not listed.New Jersey Hazardous Substances: This material is listed.New Jersey Spill: This material is not listed.New Jersey Toxic Catastrophe Prevention Act: This material is not listed.New York Acutely Hazardous Substances: This material is not listed.New York Toxic Chemical Release Reporting: This material is not listed.Pennsylvania RTK Hazardous Substances: This material is listed.Rhode Island Hazardous Substances: This material is not listed.
TSCA 8(a) IUR: Partial exemptionUnited States inventory (TSCA 8b): This material is listed or exempted.
State regulations
WHMIS (Canada) Class A: Compressed gas.Class C: Oxidizing material.
SARA 302/304/311/312 extremely hazardous substances: No products were found.SARA 302/304 emergency planning and notification: No products were found.SARA 302/304/311/312 hazardous chemicals: OxygenSARA 311/312 MSDS distribution - chemical inventory - hazard identification:Oxygen: Fire hazard, Sudden release of pressure, Delayed (chronic) health hazard
:
:
:
Canada
United States
Page: 5/7Build 1.1
Oxygen
CEPA Toxic substances: This material is not listed.Canadian ARET: This material is not listed.Canadian NPRI: This material is not listed.Alberta Designated Substances: This material is not listed.Ontario Designated Substances: This material is not listed.Quebec Designated Substances: This material is not listed.
Section 16. Other information
3
0
0
0
0
3Health
Special
Instability
Flammability
Health
Fire hazard
Reactivity
Personal protection
GAS:OXIDIZER.CONTACT WITH COMBUSTIBLE MATERIAL MAY CAUSE FIRE.CONTENTS UNDER PRESURE.Do not puncture or incinerate container.May cause severe frostbite.LIQUID:OXIDIZER.CONTACT WITH COMBUSTIBLE MATERIAL MAY CAUSE FIRE.Extremely cold liquid and gas under pressure.May cause severe frostbite.
Label requirements :
Notice to reader
Label requirements : Class A: Compressed gas.Class C: Oxidizing material.
United States
Canada
00
0
National Fire ProtectionAssociation (U.S.A.)
Health
Special
Instability
Flammability:
liquid:
liquid:
Hazardous MaterialInformation System (U.S.A.)
0
0
0
Health
Flammability
Physical hazards
:
Page: 6/7Build 1.1

Oxygen
To the best of our knowledge, the information contained herein is accurate. However, neither the above-namedsupplier, nor any of its subsidiaries, assumes any liability whatsoever for the accuracy or completeness of theinformation contained herein.Final determination of suitability of any material is the sole responsibility of the user. All materials may presentunknown hazards and should be used with caution. Although certain hazards are described herein, we cannotguarantee that these are the only hazards that exist.
Page: 7/7Build 1.1
MATERIAL SAFETY DATA SHEET (MSDS) SULPHUR DIOXIDE
Page 1 of 3
AFROX is a member of The Linde Group Page 1 of 3 The Stripe Symbol and the word “AFROX” are AFROX Group Trademarks.
DATE: May 2010 Version 2Ref. No.: MS 026 1 PRODUCT AND COMPANY IDENTIFICATION Product Names SULPHUR DIOXIDE Synonym Sulfurous Acid Anhydride Chemical Formula SO2
Trade Name Sulphur Dioxide Colour coding Brunswick green (H.O7) body with a
Golden yellow (B49) shoulder Valve CGA 240 – Steel 3/8 inch 18 NGT right hand female
Company Identification African Oxygen Limited 23 Webber Street Johannesburg, 2001 Tel. No: (011) 490-0400 Fax No: (011) 490-0506 Emergency Number 086 011 1185 or (011) 873 4382 [24 hours]
2 COMPOSITION/INFORMATION ON INGREDIENTS Chemical Name Sulphur Dioxide Chemical Family Inorganic, acidic gas CAS No. 7446-09-5 UN No. 1079 ERG No. 125 Hazchem Warning Toxic and corrosive gas 3 HAZARDS IDENTIFICATION Main Hazards All cylinders are portable gas containers, and must be regarded as pressure vessels at all times. Sulphur dioxide is a highly irritating gas; it readily elicits respiratory reflexes. It is intensely irritating to the eyes, throat, and respiratory tract. Adverse Health effects Inhalation of this gas in concentrations of 8-12ppm in air causes throat irritation, coughing, constriction of the chest, lachrimation, and smarting of the eyes. A concentration of 150 ppm can be endured only a few minutes, because of eye irritation and the effect on the membranes of the nose, throat and lungs. Exposure to a concentration of 500 ppm by volume in air for a few minutes is very dangerous. Chemical hazards Sulphur dioxide dissolves in water forming sulphurous acid, which is unstable toward heat. In many of its reactions, sulphur dioxide behaves as a reducing agent. Biological Hazards Liquid Sulphur dioxide may cause skin and eye burns upon contact with these tissues, which results from the freezing effect of the liquid on the skin or eyes. Low (1%) concentrations of the vapour are irritating to moist skin within a period of 3 minutes. Vapour Inhalation Acute exposure through inhalation may result in dryness and irritation of the nose and throat, choking, sneezing, coughing, and bronchospasm. Severe overexposure may cause death through systemic acidosis, from pulmonary oedema, or from respiratory arrest. Eye Contact Corneal burns, opacification of the cornea, and blindness may result if liquid Sulphur dioxide is splashed in the eyes. Sulphur dioxide can penetrate the intact cornea and cause iritis. Skin Contact Liquid sulphur dioxide can cause frostbite and skin burns, and it converts to sulphurous acid in moist environments, which may cause skin irritation.
Ingestion Severe burns to the mouth, throat, and gastrointestinal system may occur.
4 FIRST AID MEASURES Move victims of sulphur dioxide inhalation to fresh air. If breathing has ceased, begin artificial respiration immediately. Administer oxygen if exposure has been severe and breathing is difficult. Skin exposure first aid treatment includes flushing the contaminated skin with copious amounts of water, and continuing as required in order to control burning sensation. Medical attention should be sought if irritation persists, or if skin is broken or blistered. In the event of eye contact, flush eyes immediately with copious amounts of water for at least 15 minutes. Eyelids should be held apart to ensure complete irrigation. Seek medical attention immediately.
5 FIRE FIGHTING MEASURES Extinguishing Media As sulphur dioxide is non-flammable, the correct extinguishing media should be used for the surrounding fire. Specific Hazards Water should never be sprayed at or into a tank or system which is leaking sulphur dioxide. The presence of water causes sulphur dioxide to be very corrosive, and water directed into a tank would also increase the venting rate. Emergency Actions A sulphur dioxide container exposed to a fire should be removed. If for any reason it cannot be removed, the container should be kept cool with a water spray until well after the fire is out. Fire fighting personnel should be equipped with protective clothing and respiratory equipment. CONTACT THE NEAREST AFROX BRANCH. Protective Clothing Exposed fire fighters should wear approved self- contained breathing apparatus with full face mask. Environmental Precautions When sulphur dioxide is released to the environment, the appropriate regulatory agency should be notified. In the event of a release however, provincial, municipal, and/or local reporting regulations must be complied with. It is most important that the response groups in the area affected be notified as quickly as possible.
6 ACCIDENTAL RELEASE MEASURES
Personal Precautions It is essential that every facility handling sulphur dioxide has an emergency plan outlining the actions that employees should take in case of specific emergencies. These actions should include alerting fellow employees and area emergency control groups of the nature and extent of the emergency. The plan should also include co-ordination procedures with area emergency control groups in the event of a major release. If, despite all precautions, persons should become trapped in a sulphur dioxide atmosphere, they should breathe as little as possible and open their eyes only when necessary. Partial protection may be gained by holding a wet cloth over the nose and mouth. Environmental Precautions Only personnel trained for and designated to handle emergencies should attempt to stop a leak. Respiratory equipment of a type suitable for sulphur dioxide must be worn. All persons not so equipped must leave the affected area until the leak has been stopped.
MATERIAL SAFETY DATA SHEET (MSDS) SULPHUR DIOXIDE
Page 2 of 3
AFROX is a member of The Linde Group Page 2 of 3 The Stripe Symbol and the word “AFROX” are AFROX Group Trademarks.
Small spills If sulphur dioxide is released, the irritating effect of the vapour will force personnel to leave the area long before they have been exposed to dangerous concentrations. Sulphur dioxide is fairly soluble in cool water and therefore the vapour concentration can be reduced by the use of spray or fog nozzles. If disposal of sulphur dioxide becomes necessary, such as from a leaking container or vessel, it can be vented into a lime or caustic soda solution. The resulting salt solution should be taken to a plant treating unit for neutralisation and disposal. Large spills See “Personal Precautions” above.
6 HANDLING AND STORAGE Sulphur dioxide should be handled only in a well-ventilated area, preferably a hood with forced ventilation. Personnel handling sulphur dioxide should wear chemical safety goggles and/or plastic face shields, approved safety shoes, and rubber gloves. Additional gas masks, air-line gas masks, and self-contained breathing apparatus should be conveniently located for use in emergencies. Instant-acting safety showers should be available in convenient locations. Cylinders should always be transported in the upright position, with the valve uppermost, and be firmly secured. Use the “first in - first out” inventory system to prevent full cylinders from being stored for excessive periods of time. Compliance with all relevant legislation is essential. Keep away from children.
8 EXPOSURE CONTROLS/PERSONAL PROTECTION Occupational exposure hazards Prolonged or repeated exposure may cause impaired lung function, bronchitis, hacking cough, nasal irritation and discharge, increased fatigue, alteration in the sense of taste and smell, and longer duration of common colds. TLV 2 ppm STEL (15 minutes) 5 ppm IDLH 100 ppm Engineering control measures Engineering control measures are preferred to reduce exposures. General methods include mechanical ventilation, process or personal enclosure, and control of process conditions. Administrative controls and personal protective equipment may also be required . Personal protection Use an approved gas mask or self contained breathing apparatus when entering a sulphur dioxide contaminated area. Eyes Wear a chemical safety goggle or full face shield when handling cylinders. Hands Wear suitable protective gloves when handling cylinders. Feet Wear protective foot wear when working with cylinders. Skin Wear suitable protective clothing to prevent the gas from coming into direct contact with skin.
9 PHYSICAL AND CHEMICAL PROPERTIES PHYSICAL DATA Chemical Symbol SO2Molecular Weight 64,063 Specific volume @ 20°C & 101,325 kPa 366.9 ml/g Relative density of gas @ 101,325 kPa (Air = 1) 2,263 Boiling point @ 101,325 kPa - 10°C Colour None Taste Acidic
Odour Pungent, Sulphurous
10 STABILITY AND REACTIVITY Conditions to avoid Overheating of cylinders. Never use cylinders as rollers or supports; or for any other purpose than the storage of sulphur dioxide. Incompatible Material Moist sulphur dioxide is corrosive to carbon steel; therefore, other materials of construction have to be considered in this case. Hazardous Decomposition Products Sulphur dioxide is not flammable, or explosive, in either the gaseous or liquid state. It is a relatively stable chemical. Temperatures above 2000ºC are required to bring about detectable decomposition of sulphur dioxide.
11 TOXICOLOGICAL INFORMATION Acute Toxicity In extreme cases, dental cavities, loss of fillings, gum disorders, and the rapid and painless destruction of teeth may result from repeated overexposure. See section 3. Skin & eye contact See Section 3 Chronic Toxicity See Section 3 Carcinogenicity No known effect Mutagenicity No known effect Reproductive Hazards No known effect
12 ECOLOGICAL INFORMATION Environment Poses a severe hazard to the ecology in the form of “acid rain”. 13 DISPOSAL CONSIDERATIONS Disposal Methods Due to the complexity and scope of sulphur dioxide disposal procedures, care must be taken to ensure that all existing regulations are complied with. For more detailed information or guidance. CONTACT THE NEAREST AFROX BRANCH.
14 TRANSPORT INFORMATION ROAD TRANSPORTATION UN No. 1079 Class 2.3 Subsidiary risk Toxic and corrosive gas ERG No 125 Hazchem warning Toxic and corrosive gas SEA TRANSPORTATION IMDG 1079 Class 2.3 Label Toxic gas AIR TRANSPORTATION ICAO/IATA Code 1079 Class 2.3 Subsidiary risk Toxic and corrosive gas Packaging instructions - Cargo 200 - Passenger Forbidden Maximum quantity allowed
- Cargo 25 kg - Passengers forbidden
MATERIAL SAFETY DATA SHEET (MSDS) SULPHUR DIOXIDE
Page 3 of 3
AFROX is a member of The Linde Group Page 3 of 3 The Stripe Symbol and the word “AFROX” are AFROX Group Trademarks.
15 REGULATORY INFORMATION EEC Hazard class Toxic, Corrosive gas.
R23 Toxic By Inhalation Risk phrases
R34 Causes burns
S(1/2) Keep locked up and out of reach of children
S9 Keep container in a well-ventilated place
S26 In case of contact with eyes, rinse immediately with plenty of water and seek medical advice
S29 Do not empty in drains
S(36/37/39) Wear suitable protective clothing, gloves and eye/face protection
S45 In case of accident or if you feel unwell, seek medical advice immediately and show label were possible
S51 Use only in well ventilated areas
Safety phrases
S57 Use appropriate containment to avoid environmental contamination
National legislation None Refer to SANS 10265 for explanation of the above.
16 OTHER INFORMATION Ensure all national/local regulations are observed. Ensure operators understand the toxicity hazard. Users of breathing apparatus must be trained. Ensure operators understand the toxicity hazard. Before using this product in any new process or experiment, a through material compatibility and safety study should be carried out. Bibliography Bibliography Compressed Gas Association, Arlington, Virginia Handbook of Compressed Gases - 3
rd Edition
Matheson Gas Data Book - 6th
Edition SANS 11014 - Safety data sheet for chemical products: Content and order of sections SANS 10265 – Classification and Labelling of Dangerous Substances
17 EXCLUSION OF LIABILITY Information contained in this publication is accurate at the date of publication. Whilst AFROX made best endeavour to ensure that the information contained in this publication is accurate at the date of publication, AFROX does not accept liability for an inaccuracy or liability arising from the use of this information, or the use, application, adaptation or process of any products described here

SO2 and O2 separation by using ionic liquid absorption
128
SO2 and O2 separation by using ionic liquid absorption
129
Appendix G
Article
This section contains the article that was submitted to the International Journal of Hydrogen
Energy:
The effect of ionic liquid purity on the separation of SO2 and O2
in the HyS process
aSL Rabie &
a*M le Roux
*Corresponding author: [email protected] Tel: +27 18 299 1990 Fax: +27 18 299 1535
aSchool of Chemical and Minerals Engineering
North-West University, Potchefstroom campus
Private Bag X6001
Potchefstroom
South Africa, 2522
Abstract
In the HyS process sulphuric acid is decomposed to form SO2 and O2. After the
decomposition step, it is necessary to purify the SO2 before sending it to an electrolyser
wherein SO2-depolarised electrolysis of water occurs. Past success in using ionic liquids to
act as an SO2 solvent for the separation of SO2 from O2 is well documented. Most of these
studies make use of high purity ionic liquids that is very expensive. This study was
conducted to determine the use of a lesser pure ionic liquid for the separation of SO2 from
O2. The amount of SO2 that was absorbed as well as the absorption rate of SO2 were
determined at different feed pressures, absorption temperatures and feed gas compositions.
In order to determine the effect of ionic liquid purity on the absorption process all of the
experiments were carried out using both 95% and 98% pure 1-Butyl-3-Methylimidazolium
methyl sulphate. Results obtained confirmed previous findings in terms of temperature, gas
composition and feed pressure dependence of SO2 absorption. It did however also confirm
that the 95% pure ionic liquid performed similar or even better than the 98% pure ionic liquid.
It can therefore be concluded that a less expensive option for use in thermo-chemical cycles
is viable.
Keywords: Sulphur dioxide (SO2), Oxygen (O2), separation, Hybrid sulphur process, ionic
liquid purity
1. Introduction
Fossil fuels currently meet most of the world’s energy requirements; examples of these
include burning coal to generate electricity, using oil to manufacture petroleum products,
which in turn is used to power vehicles, and using gas to heat homes. It is well documented
that the burning of fossil fuels contributes towards atmospheric pollution. Apart from this
negativity, fossil fuels are also a non-renewable energy source that is heading to depletion at
a fast rate. For these reasons, it is important to explore alternative energy sources for future
use. Hydrogen provides an excellent option as an energy carrier, which can be implemented
in several sectors ranging from automotive to hardcore industrial manufacturing. The main
advantages provided by hydrogen is, firstly, its abundance (it is one of the most abundant
elements in the universe) and, secondly, the fact that it is a clean fuel (when hydrogen is
combusted the only by-product is water vapour). Therefore, hydrogen is a very attractive
option as alternative fuel source for the future [1].
One of the ways to manufacture hydrogen is by using a thermochemical cycle like the Hybrid
Sulphur (HyS) cycle. In 2002, the HyS cycle was identified as the leading contender from
115 thermochemical hydrogen production cycles to produce hydrogen commercially [2]. The
HyS cycle is one of the simplest thermochemical cycles due to the fact that it only has liquid
reagents and consists of just two reaction steps. These two reactions are the decomposition
of sulphuric acid at 800oC [3]:
𝐻2𝑆𝑂4 → 𝐻2𝑂 + 𝑆𝑂2 +1
2𝑂2 (1)
and the SO2-depolarised electrolysis of water [3]:
𝑆𝑂2 + 2𝐻2𝑂 → 𝐻2 + 𝐻2𝑆𝑂4 (2)
The first step in the HyS process is the decomposition of sulphuric acid at high temperatures,
which is common to all sulphur cycles. According to reaction 1, it produces three products
namely H2O, SO2 and O2. From this product mixture, O2 is removed while make-up water is
added to the remaining SO2 and H2O. This mixture e is then fed to the anode side of the
electrolyser where electrolysis takes place [3]. H2 is produced at the cathode while H2SO4 is
formed at the anode. H2SO4 is then recycled back to step one and the H2 is removed as the
main product [4].
In the original design of the HyS cycle, the removal of O2 was achieved by a series of six
knock-out drums followed by an absorption tower [2]. Although this design proved successful
in separating O2 from the mixture, it is rather capital and energy intensive. Kim et al. [5]
proposed a separation technique for SO2 and O2 that was very similar to the Linde Solinox
process. This technique consists of a separation and regeneration cycle for the separation of
SO2 and O2 using temperature swing ionic liquid absorption. This technique was designed
specifically for thermochemical cycles. Lee et al. [6] demonstrated the validity of using 99%
pure [BMIm][MeSO4] (1-Butyl-3-Methylimidazolium methyl sulphate) for the separation of
SO2 and O2. The results showed favourable absorption of SO2 into the ionic liquid as well as
almost perfect recovery of SO2 from the ionic liquid at elevated temperatures above 110C.
Huang et al. [7] studied the effect of temperature on the absorption amount of SO2 into the
ionic liquid, as well as the regeneration capabilities of the ionic liquid. Anderson et al. [8] also
investigated the effect of temperature on the absorption capabilities of SO2 into ionic liquids.
Their study further included the effect of changes in the partial pressure of the SO2 in the
feed, from which Henry constants at three pressures were determined from the solubility
data (although it was found that absorption happened outside the Henry regime, it was used
for comparison with other systems). Finally, Lee et al. [6] studied the effect that different SO2
compositions in the feed gas stream had at different temperatures on the amount of SO2
absorbed. They also calculated the Henry constants for the different temperatures. Huang et
al., Anderson et al. and Lee et al. concluded that [6-8]:
- The amount of SO2 absorbed by the ionic liquid increased at lower absorption
temperatures.
- SO2 absorption increased at a higher SO2 partial pressure in the feed stream.
- The absorption capability of the ionic liquid did not change after repeated use.
- The Henry constants of the ionic liquids decreased when the temperature was
reduced, which also indicated that the absorption capability increased with
decreasing temperature.
2. Experimental material and methods
2.1 Materials
Ultra high purity (UHP) O2 with a purity of 99.995% and liquid SO2 with a purity of 99.9%
were purchased form Afrox in South Africa and used as received. The ionic liquid
[BMIm][MeSO4] with purities of 95% (Sigma-Aldrich) and 98% (Merck) were purchased and
used as received. The 98% pure ionic liquid was about double the price of the 95% pure
ionic liquid.
2.2 Project scope
The main aim of this study was to show the validity in using a lesser pure ionic liquid,
[BMIm][MeSO4], for the separation of SO2 and O2. This was achieved by following two
approaches concerning the gas separation:
Testing the temperature influence on the separation capabilities of both a 98% pure
and 95% pure [BMIm][MeSO4].
Testing the influence of total feed gas and partial gas feed pressure on the
separation capabilities of the above mentioned ionic liquids.
2.3 Temperature and partial pressure influence setup
Fig. 1 shows the process flow diagram for the experimental setup of the temperature
influence tests. This figure shows that SO2 and O2 gas first flowed to mass flow controllers
(Brooks), where the flows were adjusted to get the required composition for each experiment.
The feed composition was set at 0%, 25%, 50%, 75% and 100% SO2, with O2 as the
balance. Gas flowed to the absorption chamber from the mass flow controllers. Here, the
gas was allowed to bubbled through the ionic liquid while the liquid temperature was
controlled by the temperature controller (JCS-33A Shinko) coupled to a pre-calibrated
external heater. 3 cm3 of ionic liquid was used in the absorption chamber. The change in
ionic liquid mass during gas absorption was measured by a balance (ADAM PGW 753i) and
logged on a computer in real time. The excess SO2 and O2 gas exited the absorption
chamber to the vent. The vent was configured in such a manner that it could be coupled to
an online gas chromatograph (GC) for analyses of the composition thereof. After the ionic
liquid had been saturated with SO2 the chamber was heated to 125oC to desorb the SO2
from the liquid; when desorption was completed and the ionic liquid cooled to room
temperature it was ready to be used again.
In this study, the amounts of SO2 that was absorbed, as well as the absorption and
desorption rates of SO2 were determined. Absorption was done at four temperatures namely
30ºC, 40oC, 50oC and 60oC. From these results, the influence of absorption temperature and
feed gas composition on the ionic liquid’s ability to absorb and desorb SO2 was determined.
Furthermore, the absorption and desorption of O2 was investigated in parallel with the
previously mentioned experiments.
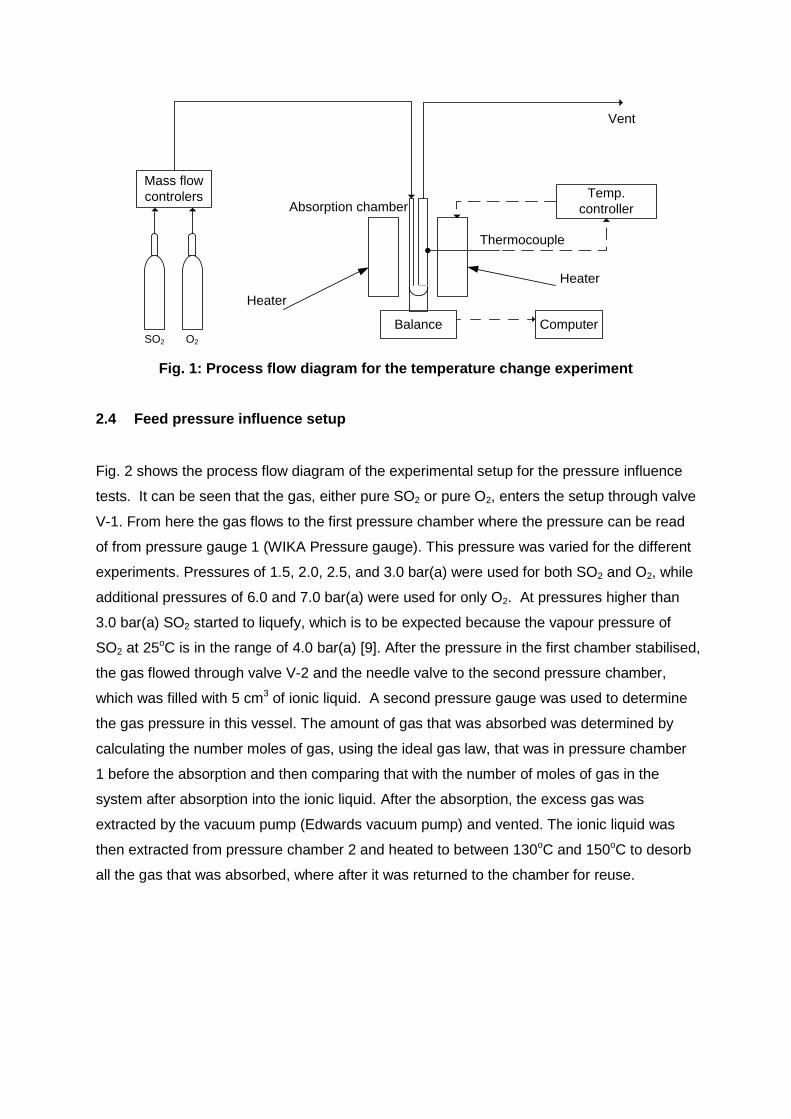
SO2 O2
Mass flow
controlers
Heater
Heater
Thermocouple
Balance Computer
Vent
Absorption chamberTemp.
controller
Fig. 1: Process flow diagram for the temperature change experiment
2.4 Feed pressure influence setup
Fig. 2 shows the process flow diagram of the experimental setup for the pressure influence
tests. It can be seen that the gas, either pure SO2 or pure O2, enters the setup through valve
V-1. From here the gas flows to the first pressure chamber where the pressure can be read
of from pressure gauge 1 (WIKA Pressure gauge). This pressure was varied for the different
experiments. Pressures of 1.5, 2.0, 2.5, and 3.0 bar(a) were used for both SO2 and O2, while
additional pressures of 6.0 and 7.0 bar(a) were used for only O2. At pressures higher than
3.0 bar(a) SO2 started to liquefy, which is to be expected because the vapour pressure of
SO2 at 25oC is in the range of 4.0 bar(a) [9]. After the pressure in the first chamber stabilised,
the gas flowed through valve V-2 and the needle valve to the second pressure chamber,
which was filled with 5 cm3 of ionic liquid. A second pressure gauge was used to determine
the gas pressure in this vessel. The amount of gas that was absorbed was determined by
calculating the number moles of gas, using the ideal gas law, that was in pressure chamber
1 before the absorption and then comparing that with the number of moles of gas in the
system after absorption into the ionic liquid. After the absorption, the excess gas was
extracted by the vacuum pump (Edwards vacuum pump) and vented. The ionic liquid was
then extracted from pressure chamber 2 and heated to between 130oC and 150oC to desorb
all the gas that was absorbed, where after it was returned to the chamber for reuse.
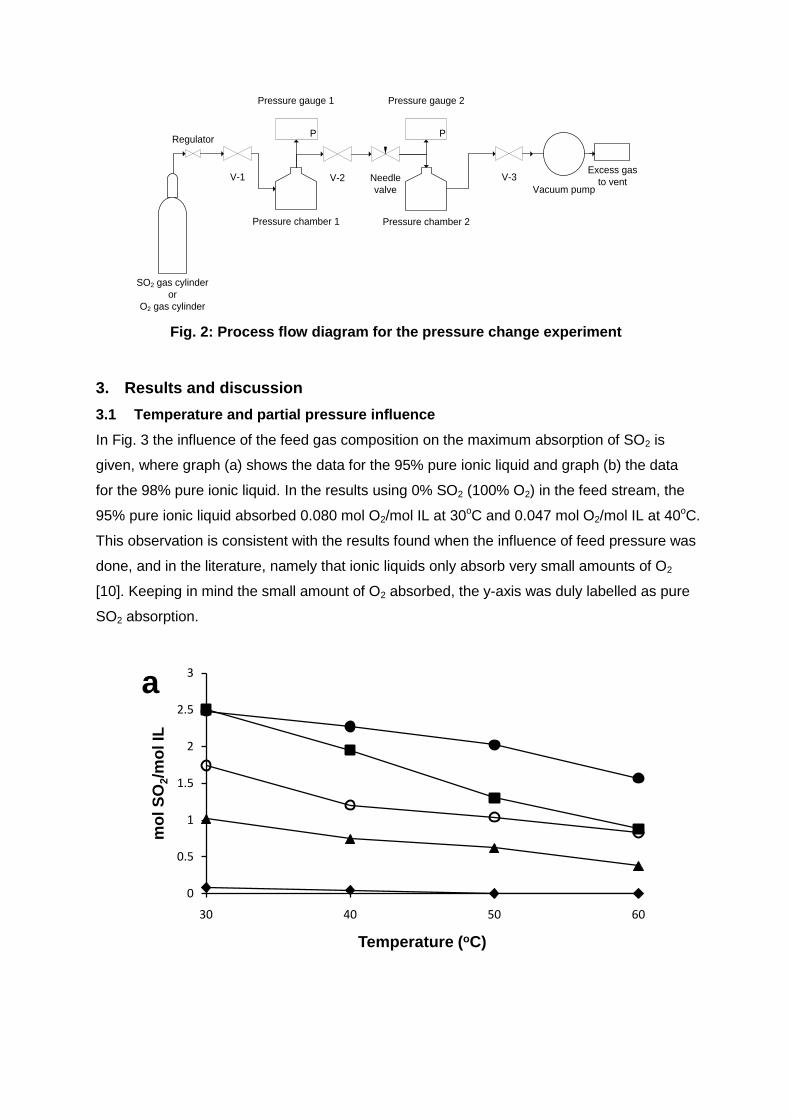
SO2 gas cylinder
or
O2 gas cylinder
V-1
Pressure chamber 1 Pressure chamber 2
P
Pressure gauge 1
P
Pressure gauge 2
V-2 Needle
valve
V-3
Vacuum pump
Excess gas
to vent
Regulator
Fig. 2: Process flow diagram for the pressure change experiment
3. Results and discussion
3.1 Temperature and partial pressure influence
In Fig. 3 the influence of the feed gas composition on the maximum absorption of SO2 is
given, where graph (a) shows the data for the 95% pure ionic liquid and graph (b) the data
for the 98% pure ionic liquid. In the results using 0% SO2 (100% O2) in the feed stream, the
95% pure ionic liquid absorbed 0.080 mol O2/mol IL at 30oC and 0.047 mol O2/mol IL at 40oC.
This observation is consistent with the results found when the influence of feed pressure was
done, and in the literature, namely that ionic liquids only absorb very small amounts of O2
[10]. Keeping in mind the small amount of O2 absorbed, the y-axis was duly labelled as pure
SO2 absorption.
0
0.5
1
1.5
2
2.5
3
30 40 50 60
mo
l S
O2/m
ol IL
Temperature (oC)
a
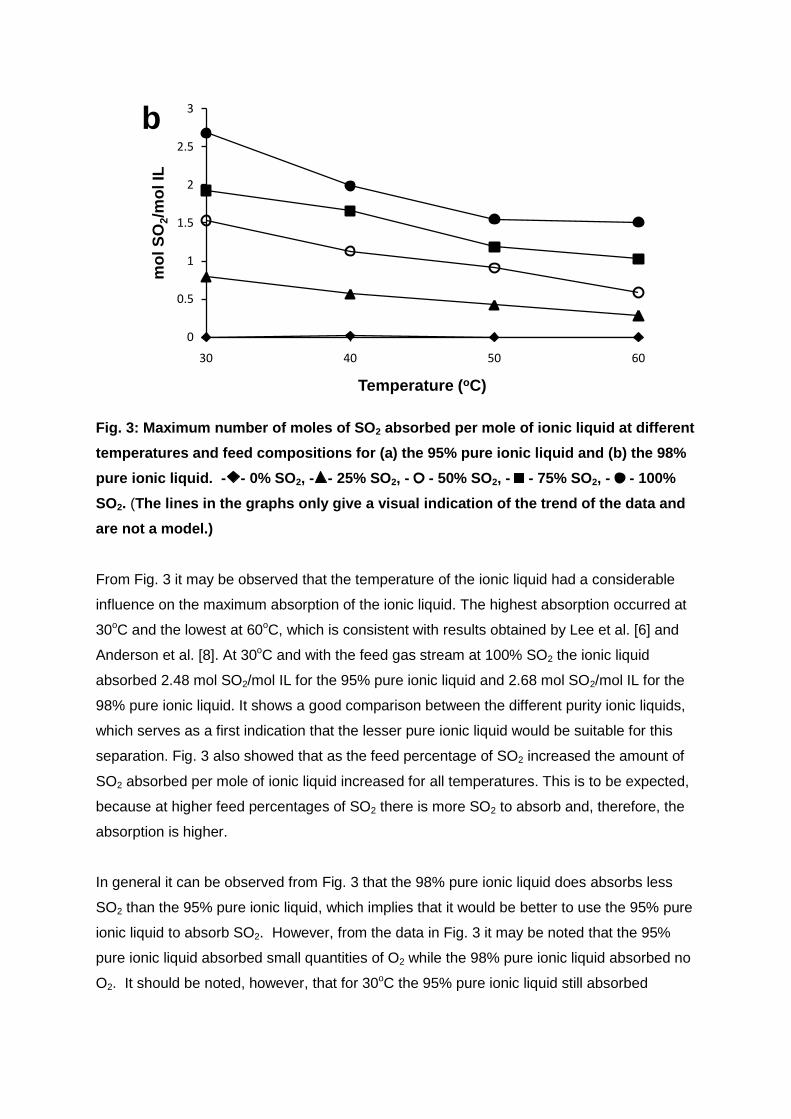
Fig. 3: Maximum number of moles of SO2 absorbed per mole of ionic liquid at different
temperatures and feed compositions for (a) the 95% pure ionic liquid and (b) the 98%
pure ionic liquid. - - 0% SO2, - - 25% SO2, - - 50% SO2, - - 75% SO2, - - 100%
SO2. (The lines in the graphs only give a visual indication of the trend of the data and
are not a model.)
From Fig. 3 it may be observed that the temperature of the ionic liquid had a considerable
influence on the maximum absorption of the ionic liquid. The highest absorption occurred at
30oC and the lowest at 60oC, which is consistent with results obtained by Lee et al. [6] and
Anderson et al. [8]. At 30oC and with the feed gas stream at 100% SO2 the ionic liquid
absorbed 2.48 mol SO2/mol IL for the 95% pure ionic liquid and 2.68 mol SO2/mol IL for the
98% pure ionic liquid. It shows a good comparison between the different purity ionic liquids,
which serves as a first indication that the lesser pure ionic liquid would be suitable for this
separation. Fig. 3 also showed that as the feed percentage of SO2 increased the amount of
SO2 absorbed per mole of ionic liquid increased for all temperatures. This is to be expected,
because at higher feed percentages of SO2 there is more SO2 to absorb and, therefore, the
absorption is higher.
In general it can be observed from Fig. 3 that the 98% pure ionic liquid does absorbs less
SO2 than the 95% pure ionic liquid, which implies that it would be better to use the 95% pure
ionic liquid to absorb SO2. However, from the data in Fig. 3 it may be noted that the 95%
pure ionic liquid absorbed small quantities of O2 while the 98% pure ionic liquid absorbed no
O2. It should be noted, however, that for 30oC the 95% pure ionic liquid still absorbed
0
0.5
1
1.5
2
2.5
3
30 40 50 60
mo
l S
O2/m
ol IL
Temperature (oC)
b
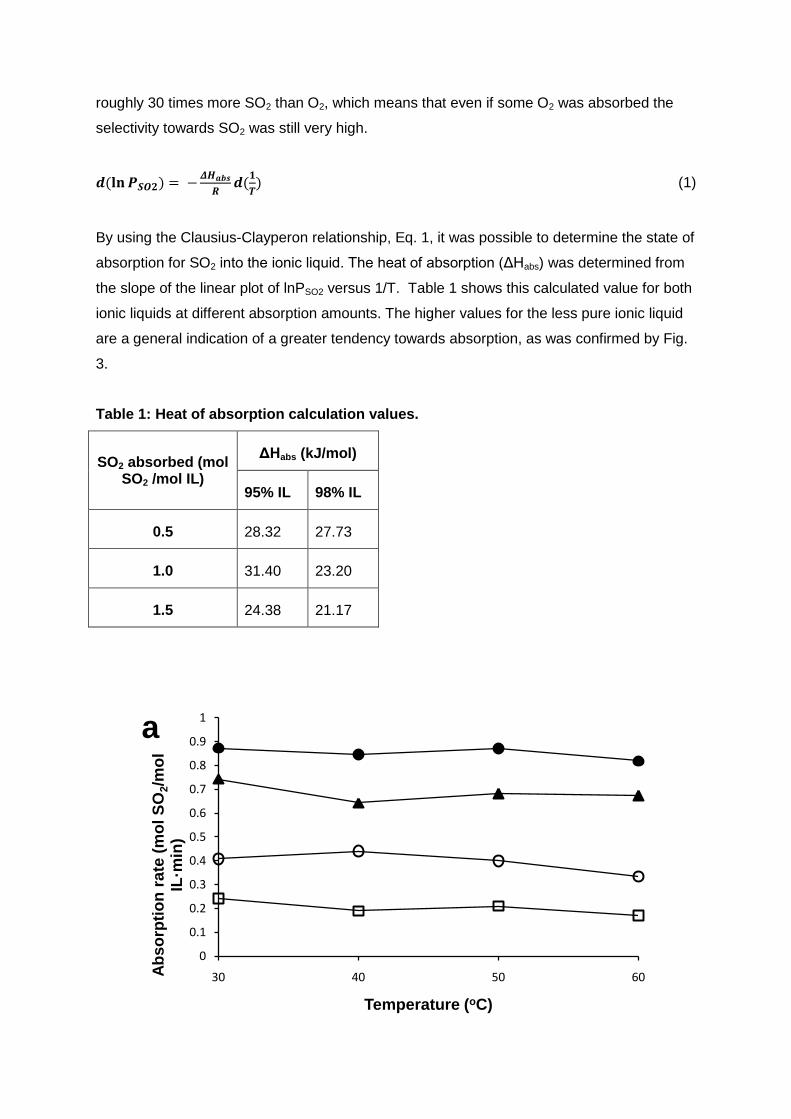
roughly 30 times more SO2 than O2, which means that even if some O2 was absorbed the
selectivity towards SO2 was still very high.
𝒅(𝐥𝐧𝑷𝑺𝑶𝟐) = −𝜟𝑯𝒂𝒃𝒔
𝑹𝒅(𝟏
𝑻) (1)
By using the Clausius-Clayperon relationship, Eq. 1, it was possible to determine the state of
absorption for SO2 into the ionic liquid. The heat of absorption (ΔHabs) was determined from
the slope of the linear plot of lnPSO2 versus 1/T. Table 1 shows this calculated value for both
ionic liquids at different absorption amounts. The higher values for the less pure ionic liquid
are a general indication of a greater tendency towards absorption, as was confirmed by Fig.
3.
Table 1: Heat of absorption calculation values.
SO2 absorbed (mol SO2 /mol IL)
ΔHabs (kJ/mol)
95% IL 98% IL
0.5 28.32 27.73
1.0 31.40 23.20
1.5 24.38 21.17
0
0.1
0.2
0.3
0.4
0.5
0.6
0.7
0.8
0.9
1
30 40 50 60Ab
so
rpti
on
ra
te (
mo
l S
O2/m
ol
IL·m
in)
Temperature (oC)
a
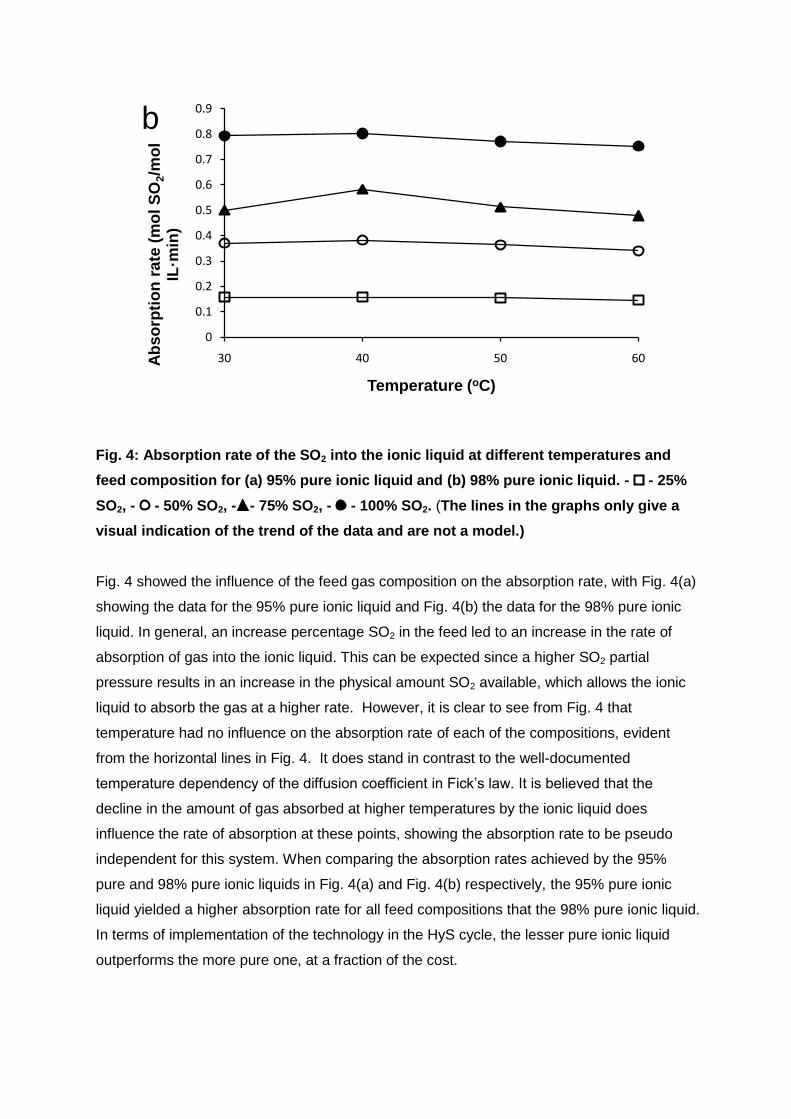
Fig. 4: Absorption rate of the SO2 into the ionic liquid at different temperatures and
feed composition for (a) 95% pure ionic liquid and (b) 98% pure ionic liquid. - - 25%
SO2, - - 50% SO2, - - 75% SO2, - - 100% SO2. (The lines in the graphs only give a
visual indication of the trend of the data and are not a model.)
Fig. 4 showed the influence of the feed gas composition on the absorption rate, with Fig. 4(a)
showing the data for the 95% pure ionic liquid and Fig. 4(b) the data for the 98% pure ionic
liquid. In general, an increase percentage SO2 in the feed led to an increase in the rate of
absorption of gas into the ionic liquid. This can be expected since a higher SO2 partial
pressure results in an increase in the physical amount SO2 available, which allows the ionic
liquid to absorb the gas at a higher rate. However, it is clear to see from Fig. 4 that
temperature had no influence on the absorption rate of each of the compositions, evident
from the horizontal lines in Fig. 4. It does stand in contrast to the well-documented
temperature dependency of the diffusion coefficient in Fick’s law. It is believed that the
decline in the amount of gas absorbed at higher temperatures by the ionic liquid does
influence the rate of absorption at these points, showing the absorption rate to be pseudo
independent for this system. When comparing the absorption rates achieved by the 95%
pure and 98% pure ionic liquids in Fig. 4(a) and Fig. 4(b) respectively, the 95% pure ionic
liquid yielded a higher absorption rate for all feed compositions that the 98% pure ionic liquid.
In terms of implementation of the technology in the HyS cycle, the lesser pure ionic liquid
outperforms the more pure one, at a fraction of the cost.
0
0.1
0.2
0.3
0.4
0.5
0.6
0.7
0.8
0.9
30 40 50 60Ab
so
rpti
on
ra
te (
mo
l S
O2/m
ol
IL·m
in)
Temperature (oC)
b
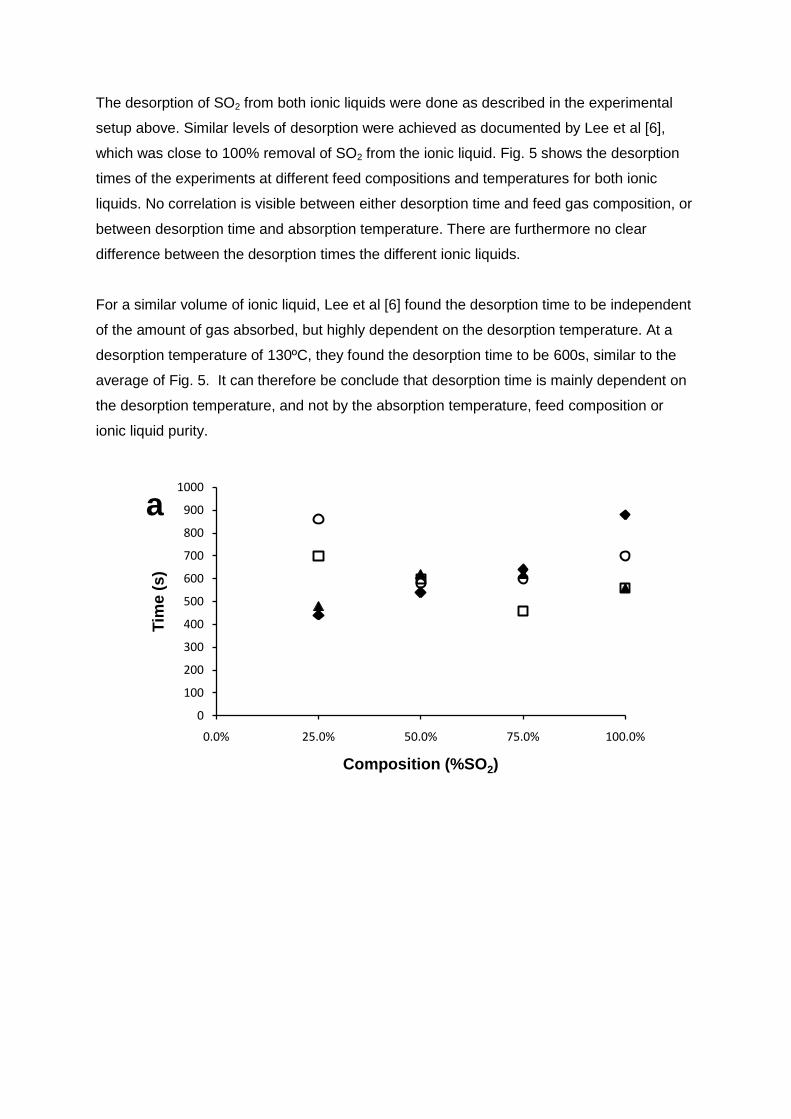
The desorption of SO2 from both ionic liquids were done as described in the experimental
setup above. Similar levels of desorption were achieved as documented by Lee et al [6],
which was close to 100% removal of SO2 from the ionic liquid. Fig. 5 shows the desorption
times of the experiments at different feed compositions and temperatures for both ionic
liquids. No correlation is visible between either desorption time and feed gas composition, or
between desorption time and absorption temperature. There are furthermore no clear
difference between the desorption times the different ionic liquids.
For a similar volume of ionic liquid, Lee et al [6] found the desorption time to be independent
of the amount of gas absorbed, but highly dependent on the desorption temperature. At a
desorption temperature of 130ºC, they found the desorption time to be 600s, similar to the
average of Fig. 5. It can therefore be conclude that desorption time is mainly dependent on
the desorption temperature, and not by the absorption temperature, feed composition or
ionic liquid purity.
0
100
200
300
400
500
600
700
800
900
1000
0.0% 25.0% 50.0% 75.0% 100.0%
Tim
e (
s)
Composition (%SO2)
a
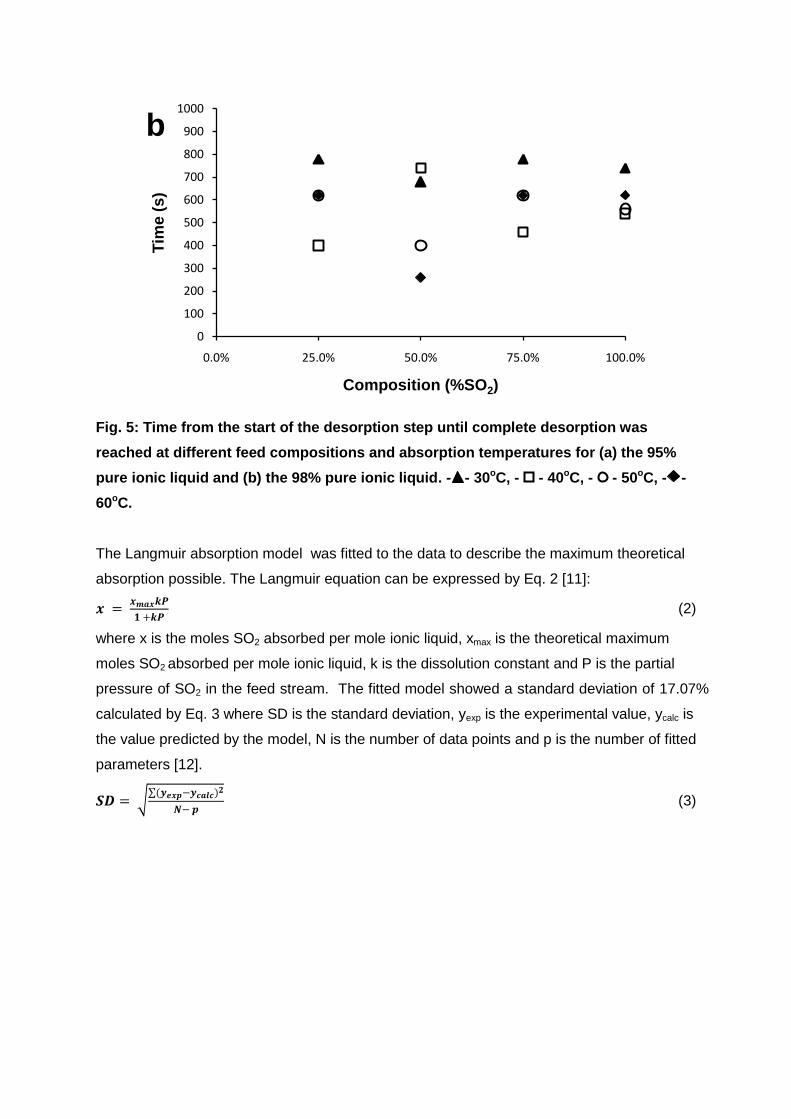
Fig. 5: Time from the start of the desorption step until complete desorption was
reached at different feed compositions and absorption temperatures for (a) the 95%
pure ionic liquid and (b) the 98% pure ionic liquid. - - 30oC, - - 40oC, - - 50oC, - -
60oC.
The Langmuir absorption model was fitted to the data to describe the maximum theoretical
absorption possible. The Langmuir equation can be expressed by Eq. 2 [11]:
𝒙 = 𝒙𝒎𝒂𝒙𝒌𝑷
𝟏 +𝒌𝑷 (2)
where x is the moles SO2 absorbed per mole ionic liquid, xmax is the theoretical maximum
moles SO2 absorbed per mole ionic liquid, k is the dissolution constant and P is the partial
pressure of SO2 in the feed stream. The fitted model showed a standard deviation of 17.07%
calculated by Eq. 3 where SD is the standard deviation, yexp is the experimental value, ycalc is
the value predicted by the model, N is the number of data points and p is the number of fitted
parameters [12].
𝑺𝑫 = (𝒚𝒆𝒙𝒑−𝒚𝒄𝒂𝒍𝒄)𝟐
𝑵− 𝒑 (3)
0
100
200
300
400
500
600
700
800
900
1000
0.0% 25.0% 50.0% 75.0% 100.0%
Tim
e (
s)
Composition (%SO2)
b
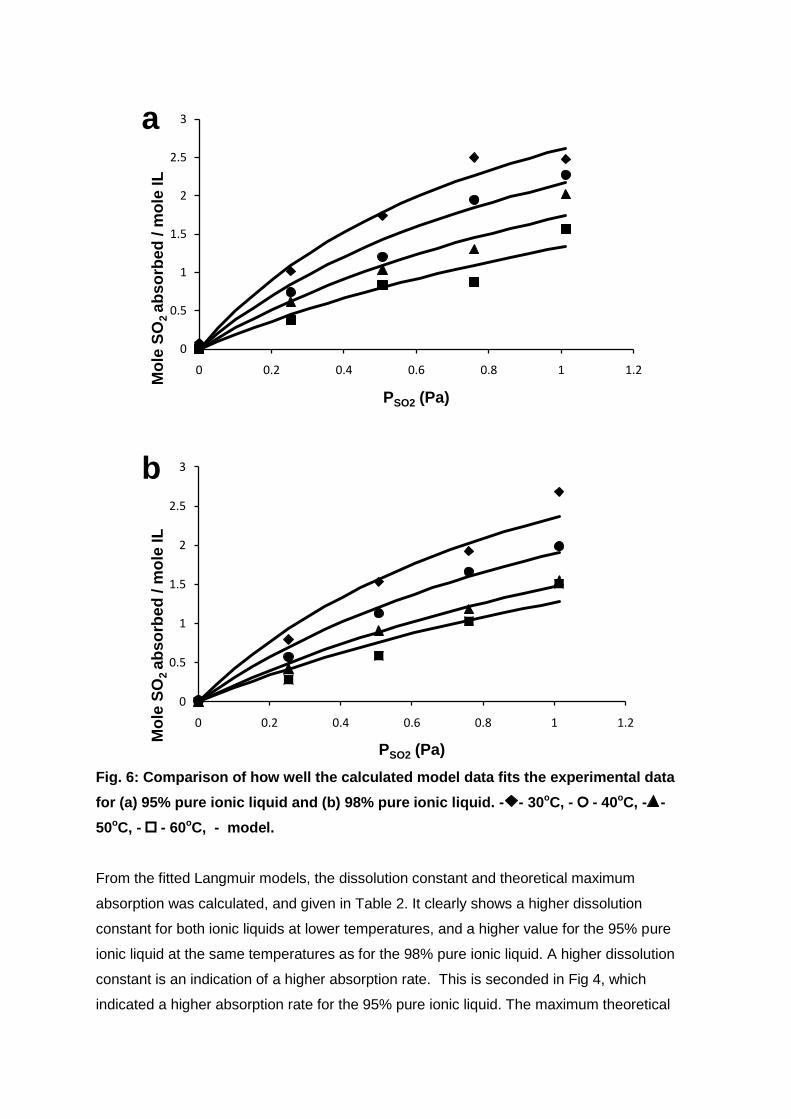
Fig. 6: Comparison of how well the calculated model data fits the experimental data
for (a) 95% pure ionic liquid and (b) 98% pure ionic liquid. - - 30oC, - - 40oC, - -
50oC, - - 60oC, - model.
From the fitted Langmuir models, the dissolution constant and theoretical maximum
absorption was calculated, and given in Table 2. It clearly shows a higher dissolution
constant for both ionic liquids at lower temperatures, and a higher value for the 95% pure
ionic liquid at the same temperatures as for the 98% pure ionic liquid. A higher dissolution
constant is an indication of a higher absorption rate. This is seconded in Fig 4, which
indicated a higher absorption rate for the 95% pure ionic liquid. The maximum theoretical
0
0.5
1
1.5
2
2.5
3
0 0.2 0.4 0.6 0.8 1 1.2
Mo
le S
O2 a
bso
rbed
/ m
ole
IL
PSO2 (Pa)
a
0
0.5
1
1.5
2
2.5
3
0 0.2 0.4 0.6 0.8 1 1.2
Mo
le S
O2 a
bso
rbed
/ m
ole
IL
PSO2 (Pa)
b
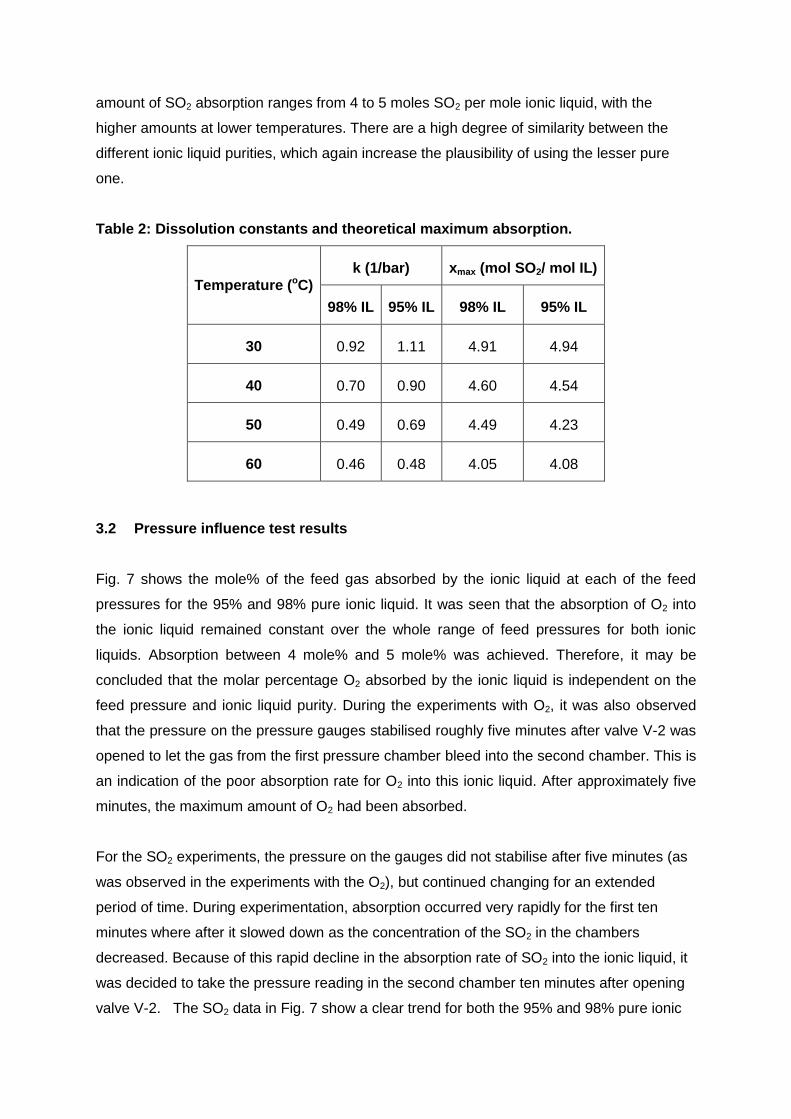
amount of SO2 absorption ranges from 4 to 5 moles SO2 per mole ionic liquid, with the
higher amounts at lower temperatures. There are a high degree of similarity between the
different ionic liquid purities, which again increase the plausibility of using the lesser pure
one.
Table 2: Dissolution constants and theoretical maximum absorption.
Temperature (oC)
k (1/bar) xmax (mol SO2/ mol IL)
98% IL 95% IL 98% IL 95% IL
30 0.92 1.11 4.91 4.94
40 0.70 0.90 4.60 4.54
50 0.49 0.69 4.49 4.23
60 0.46 0.48 4.05 4.08
3.2 Pressure influence test results
Fig. 7 shows the mole% of the feed gas absorbed by the ionic liquid at each of the feed
pressures for the 95% and 98% pure ionic liquid. It was seen that the absorption of O2 into
the ionic liquid remained constant over the whole range of feed pressures for both ionic
liquids. Absorption between 4 mole% and 5 mole% was achieved. Therefore, it may be
concluded that the molar percentage O2 absorbed by the ionic liquid is independent on the
feed pressure and ionic liquid purity. During the experiments with O2, it was also observed
that the pressure on the pressure gauges stabilised roughly five minutes after valve V-2 was
opened to let the gas from the first pressure chamber bleed into the second chamber. This is
an indication of the poor absorption rate for O2 into this ionic liquid. After approximately five
minutes, the maximum amount of O2 had been absorbed.
For the SO2 experiments, the pressure on the gauges did not stabilise after five minutes (as
was observed in the experiments with the O2), but continued changing for an extended
period of time. During experimentation, absorption occurred very rapidly for the first ten
minutes where after it slowed down as the concentration of the SO2 in the chambers
decreased. Because of this rapid decline in the absorption rate of SO2 into the ionic liquid, it
was decided to take the pressure reading in the second chamber ten minutes after opening
valve V-2. The SO2 data in Fig. 7 show a clear trend for both the 95% and 98% pure ionic
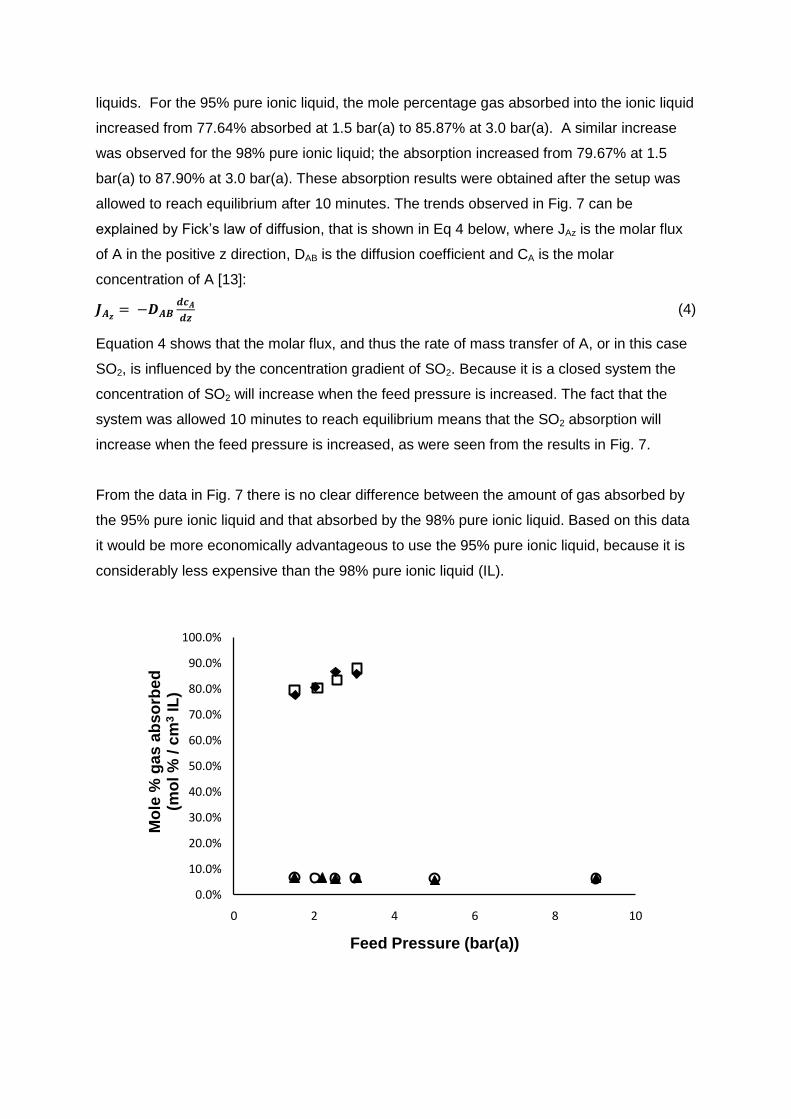
liquids. For the 95% pure ionic liquid, the mole percentage gas absorbed into the ionic liquid
increased from 77.64% absorbed at 1.5 bar(a) to 85.87% at 3.0 bar(a). A similar increase
was observed for the 98% pure ionic liquid; the absorption increased from 79.67% at 1.5
bar(a) to 87.90% at 3.0 bar(a). These absorption results were obtained after the setup was
allowed to reach equilibrium after 10 minutes. The trends observed in Fig. 7 can be
explained by Fick’s law of diffusion, that is shown in Eq 4 below, where JAz is the molar flux
of A in the positive z direction, DAB is the diffusion coefficient and CA is the molar
concentration of A [13]:
𝑱𝑨𝒛 = −𝑫𝑨𝑩𝒅𝒄𝑨
𝒅𝒛 (4)
Equation 4 shows that the molar flux, and thus the rate of mass transfer of A, or in this case
SO2, is influenced by the concentration gradient of SO2. Because it is a closed system the
concentration of SO2 will increase when the feed pressure is increased. The fact that the
system was allowed 10 minutes to reach equilibrium means that the SO2 absorption will
increase when the feed pressure is increased, as were seen from the results in Fig. 7.
From the data in Fig. 7 there is no clear difference between the amount of gas absorbed by
the 95% pure ionic liquid and that absorbed by the 98% pure ionic liquid. Based on this data
it would be more economically advantageous to use the 95% pure ionic liquid, because it is
considerably less expensive than the 98% pure ionic liquid (IL).
0.0%
10.0%
20.0%
30.0%
40.0%
50.0%
60.0%
70.0%
80.0%
90.0%
100.0%
0 2 4 6 8 10
Mo
le %
ga
s a
bso
rbed
(m
ol %
/ c
m3
IL)
Feed Pressure (bar(a))
Fig. 7: Mole% gas fed to the system absorbed by the ionic liquid at different feed
pressures for 95% and 98% pure ionic liquid. - - % SO2 absorbed in 95% IL, - - %
SO2 absorbed in 98% IL, - - % O2 absorbed in 95% IL, - - % O2 absorbed in 98% IL.
4. Conclusions
The possibility of using lesser ionic liquid to separate SO2 and O2 in the HyS process was
investigated by considering the absorption capability of the different ionic liquids. The
influence of feed pressure, absorption temperature, feed gas composition and ionic liquid
purity on the ability of the ionic liquid to absorb and desorb SO2 was determined. SO2
absorption results at different temperatures indicated that the amount of gas absorbed
increased when the temperature of the ionic liquid decreased, while the absorption rate
remained constant over a range of different temperatures. The rate of absorption also
increased when the percentage SO2 in the feed stream was increased. The SO2 absorption
data was fitted with the Langmuir absorption model, from which dissolution constants and
theoretical maximum absorption values were calculated. The dissolution constant showed a
reliance on both temperature and ionic liquid purity, favouring lower temperatures as well as
the lesser pure ionic liquid. In contrast, the theoretical maximum absorption was found to be
dependent only on temperature, again favouring lower temperature. Maximum absorption
values between the different liquids were found to be similar. The effect of feed pressure on
the SO2 absorption into the ionic liquid showed that when the feed pressure of the SO2 was
increased the amount of SO2 absorbed also increased.
The main objective of the study was to determine the influence of the ionic liquid purity on
the SO2 absorption capacity of the liquid. For most part, the performance of the two ionic
liquids was either very similar, of favoured the lesser pure one. Hence, it can be concluded
that even with the O2 that was absorbed it would be economically more advantageous to use
the less expensive 95% pure ionic liquid rather than the more expensive 98% pure liquid,
because O2 would not influence the performance of the process negatively in the low
quantities observed. This would be very beneficial for the commercialisation of the HyS
process, due to the fact that ionic liquids are very expensive. This study illustrates that the
less expensive 95% pure ionic liquid can be used instead of the more expensive 98% pure
ionic liquid whilst still achieving adequate separation of SO2 and O2.
5. Acknowledgements
The authors wish to thank the HySA Research Hub for providing the necessary financial
support to complete this project, as well as the School of Chemical and Minerals Engineering
at the Potchefstroom Campus of the North-West University for supplying the laboratory and
equipment used in the study.
Nomenclature
Symbol Unit Description
CA Mol/m3 Molar concentration of A
DAB m2/s Diffusion coefficient
ΔHabs kJ/mol Heat of absorption
JAz kg/s·m2 Molar flux of A in z direction
k 1/bar The dissolution constant
N - Number of data points
P bar Pressure
p - Number of fitted parameters
x mol SO2/mol IL Amount of SO2 absorbed into the ionic liquid
xmax mol SO2/mol IL Maximum amount of SO2 absorbed into the ionic liquid
R J/mol·K Gas constant
T oC Temperature
yexp - Experimental value
ycalc - Value predicted by the model
References
[1] B Johnston, MC Mayo, A Khare. Hydrogen: the energy source for the 21st century, Technovation. 25 (2005) 569-585.
[2] WA Summers, MB Gorensek, MR Buckner, The hybrid sulfur cycle for nuclear hydrogen production, (2005).
[3] MB Gorensek, WA Summers, CO Bolthrunis, EJ Lahoda, DT Allen, R Greyvenstein, Hybrid sulfur process reference design and cost analysis, (2009).
[4] J Leybros, A Saturnin, C Mansilla, T Gilardi, P Carles. Plant sizing and evaluation of hydrogen production costs from advanced processes coupled to a nuclear heat source: Part II: Hybrid-sulphur cycle, Int J Hydrogen Energy. 35 (2010) 1019-1028.
[5] CS Kim, KY Lee, GT Gong, H Kim, BG Lee, GD Jung, Sulfur Dioxide Separation and Recovery with Ionic Liquid Absorbents, 2010 (2008) 5.
[6] KY Lee, GT Gong, KH Song, H Kim, K Jung, CS Kim. Use of ionic liquids as absorbents to separate SO2 in SO2/O2 in thermochemical processes to produce hydrogen, Int J Hydrogen Energy. 33 (2008) 6031-6036.
[7] J Huang, A Riisager, RW Berg, R Fehrmann. Tuning ionic liquids for high gas solubility and reversible gas sorption, Journal of Molecular Catalysis A: Chemical. 279 (2008) 170-176.
[8] JL Anderson, JK Dixon, EJ Maginn, JF Brennecke. Measurement of SO2 solubility in ionic liquids, J Phys Chem B. 110 (2006) 15059-15062.
[9] Air Liquide, Gas Encyclopaedia, 2011 (2009).
[10] J Kumełan, ÁP Kamps, I Urukova, D Tuma, G Maurer. Solubility of oxygen in the ionic liquid [bmim][PF6]: Experimental and molecular simulation results, The Journal of Chemical Thermodynamics. 37 (2005) 595-602.
[11] C Locati, U Lafont, CJ Peters, EM Kelder. Interaction between carbon dioxide and ionic liquids: Novel electrolyte candidates for safer Li-ion batteries, J.Power Sources. 189 (2009) 454-457.
[12] J Ochoa, MC Cassanello, PR Bonelli, AL Cukierman. CO2 gasification of Argentinean coal chars: a kinetic characterization, Fuel Process Technol. 74 (2001) 161-176.
[13] JD Seader, EJ Henley, Separation process principles, 2nd ed., John wiley & Sons inc. 2006.