Embed Size (px)
Citation preview
akamai.com
[Q2 2015 ]
• In both Q1 and Q2 of 2015, the number of DDoS attacks
recorded hit a new record
• For the last three quarters, year-over-year DDoS activity has
doubled
• Since Q2 of 2014, the profile of the typical attack has shifted
from high-bandwidth, short-duration attacks to less powerful,
longer duration attacks
• Mega attacks are getting larger and more frequent
• The largest attack measured 249 Gbps
• Five attacks in Q2 2015 peaked at over 50 Mpps
• SYN and Simple Service Discovery Protocol (SSDP) were the
most common attack vectors
• Though infrastructure attacks are most common, application
layer DDoS attacks continue to grow rapidly
= malicious activity: key trends
2 / [The State of the Internet] / Security (Q1 2015)
= major DDoS statistical trends
3 / [The State of the Internet] / Security (Q1 2015)
• Dramatic increase in DDoS attack frequency
• Compared to Q2 2014, a 132% increase in total DDoS attacks
• Longer, less powerful attacks persist
• Average peak volume of attacks decreased by 77% percent compared to
Q2 2014
• Average peak bandwidth decreased 11%
• Average attack duration increased 19%
• Mega attacks double year-over-year
• Q2 2014 saw 6 attacks exceeding 100 Gbps
• 12 attacks in Q2 2015 exceeded 100 Gbps
= DDoS attack makeup
4 / [The State of the Internet] / Security (Q1 2015)
Infrastructure-layer attacks dominated DDoS methodologies,
accounting for 90% of all recorded attacks:
• SYN floods were the most common attack vector, at 16% of
all DDoS Attacks
• SYN floods played a significant role in mega attacks
• Largely due to the rise of SSDP attacks, the percentage of SYN floods has
declined since Q2 2014, when it was 26%
• SSDP attacks were just under 16% of total DDoS attacks
• Slight decline from Q1 2015, when SSDP attacks were 21% of total
• SSDP attacks are more difficult to mitigate because they often use
unsecured, home-based Internet devices
• Most-common application-layer attack was HTTP GET ,
accounting for 7.5% of DDoS activity, consistent with Q1 2015
and Q4 2014 observations
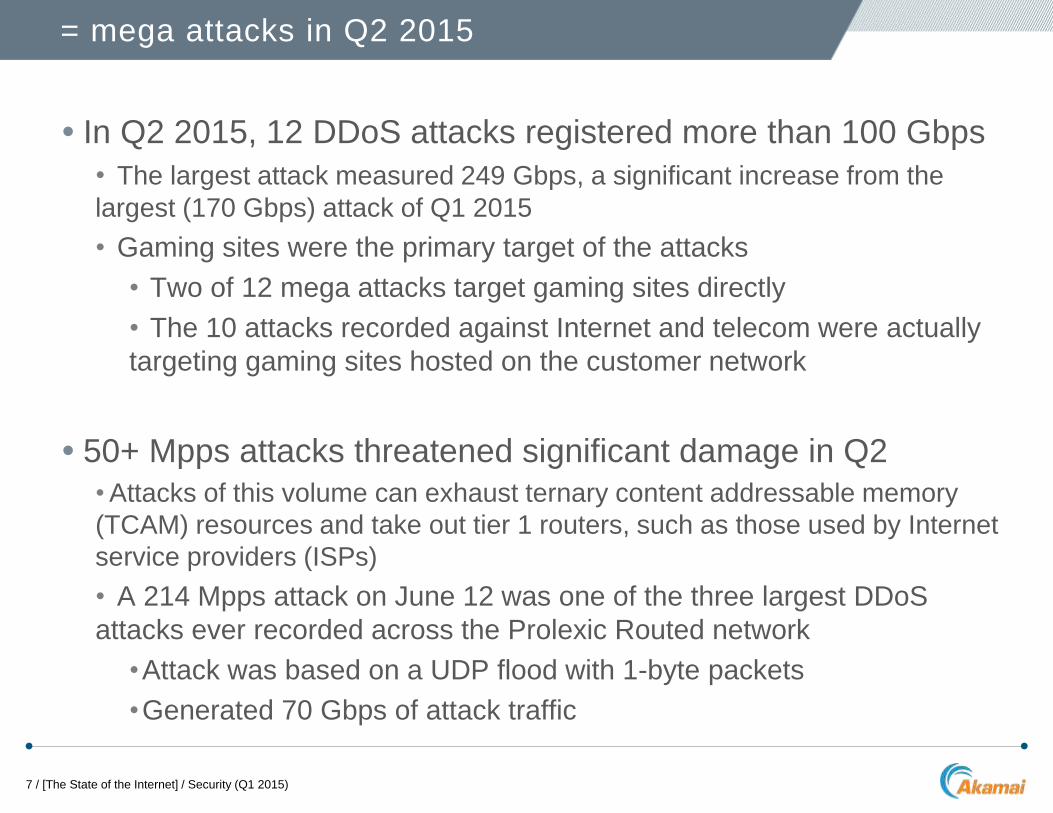
= mega attacks in Q2 2015
7 / [The State of the Internet] / Security (Q1 2015)
• In Q2 2015, 12 DDoS attacks registered more than 100 Gbps
• The largest attack measured 249 Gbps, a significant increase from the
largest (170 Gbps) attack of Q1 2015
• Gaming sites were the primary target of the attacks
• Two of 12 mega attacks target gaming sites directly
• The 10 attacks recorded against Internet and telecom were actually
targeting gaming sites hosted on the customer network
• 50+ Mpps attacks threatened significant damage in Q2
• Attacks of this volume can exhaust ternary content addressable memory
(TCAM) resources and take out tier 1 routers, such as those used by Internet
service providers (ISPs)
• A 214 Mpps attack on June 12 was one of the three largest DDoS
attacks ever recorded across the Prolexic Routed network
•Attack was based on a UDP flood with 1-byte packets
•Generated 70 Gbps of attack traffic
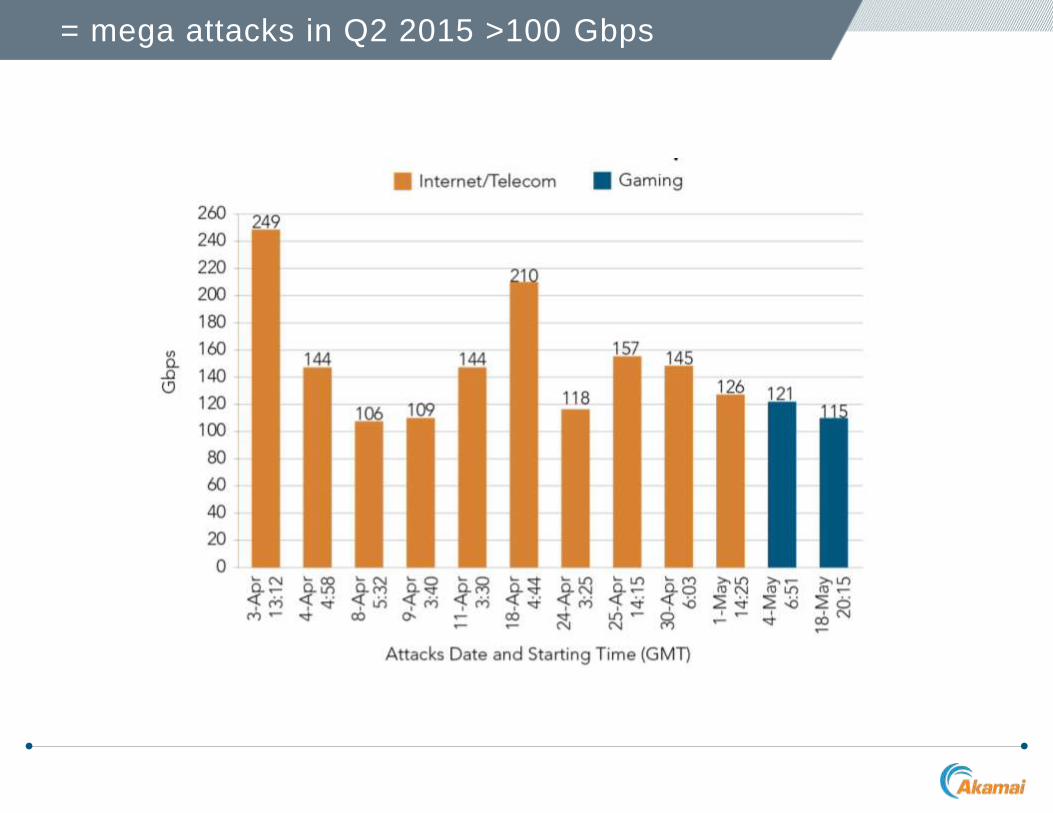
= mega attacks in Q2 2015 >100 Gbps
= targeted industries
5 / [The State of the Internet] / Security (Q1 2015)
• Gaming has been the most targeted industry since Q2 2014
• Online gaming networks suffered 35% of DDoS attacks, as in Q1 2015
• Software and Technology, including Software-as-a-Service
and cloud-based technologies, was the second most
common target
• Suffered 28% of attacks, a slight increase of 2% from Q1 2015
• Internet and Telecoms suffered 13%
• Slight decrease of 1% from last quarter
• Media and Entertainment surpassed Financial Services
• Attacks on media and entertainment businesses increased by 2 percent.
• China remained the leading source of non-spoofed DDoS
attack traffic
• Accounted for 37% of DDoS traffic, up from 23% last quarter
• US rose to second place
• 18% of recorded DDoS traffic originated from the US
• A shift from Q2 2014, when the US was the number one source at 20%
• UK was the third most common source country
• Accounted 10% of DDoS traffic
• In Q2 2014, the UK was not in the top 10
• Decreases in percentages do not represent a drop in DDoS
traffic from these countries
• DDoS traffic sources have increasingly diversified – other countries are
producing more DDoS traffic, rather than the US producing less
= source countries
6 / [The State of the Internet] / Security (Q1 2015)
Download the Q2 2015 State of the Internet Security Report
• The Q2 2015 report covers:
⁄ Analysis of DDoS web application attack trends
⁄ Bandwidth (Gbps) and volume (Mpps) statistics
⁄ Year-over-year and quarter-by-quarter analysis
⁄ Attack frequency, size, types and sources
⁄ Multi-vector mega attacks leveraging UPD and SYN floods
⁄ Dangers of third-party WordPress plugins and themes
⁄ Analysis of the Onion Router (Tor) project risks
⁄ Threat advisories issued in Q2 2015, including OurMine Team and RIPv1
= Q1 2015 State of the Internet –Security Report
9 / [The State of the Internet] / Security (Q1 2015)
• StateoftheInternet.com, brought to you by Akamai,
serves as the home for content and information intended to
provide an informed view into online connectivity and
cybersecurity trends as well as related metrics, including
Internet connection speeds, broadband adoption, mobile
usage, outages, and cyber-attacks and threats.
• Visitors to www.stateoftheinternet.com can find current and
archived versions of Akamai’s State of the Internet
(Connectivity and Security) reports, the company’s data
visualizations, and other resources designed to put context
around the ever-changing Internet landscape.
= about stateoftheinternet.com
10 / [The State of the Internet] / Security (Q1 2015)

![akamai’s [state of the internet] Q2 2015 report · Visit stateoftheinternet.com for the latest cloud security threat intelligence. ... SECURE. Over the last several years, many](https://img.pdfslide.net/doc/110x75/5f4b13e02734317e1b3814d7/akamaias-state-of-the-internet-q2-2015-report-visit-stateoftheinternetcom-for.jpg)