Embed Size (px)
Citation preview
Smart Grids aus der Sicht der europäischenNetzbetreiber
Gunnar Lorenz
Head of Unit - Networks
e-control
09 March 2010

At the forefront of the ELECTRICITY INDUSTRY:
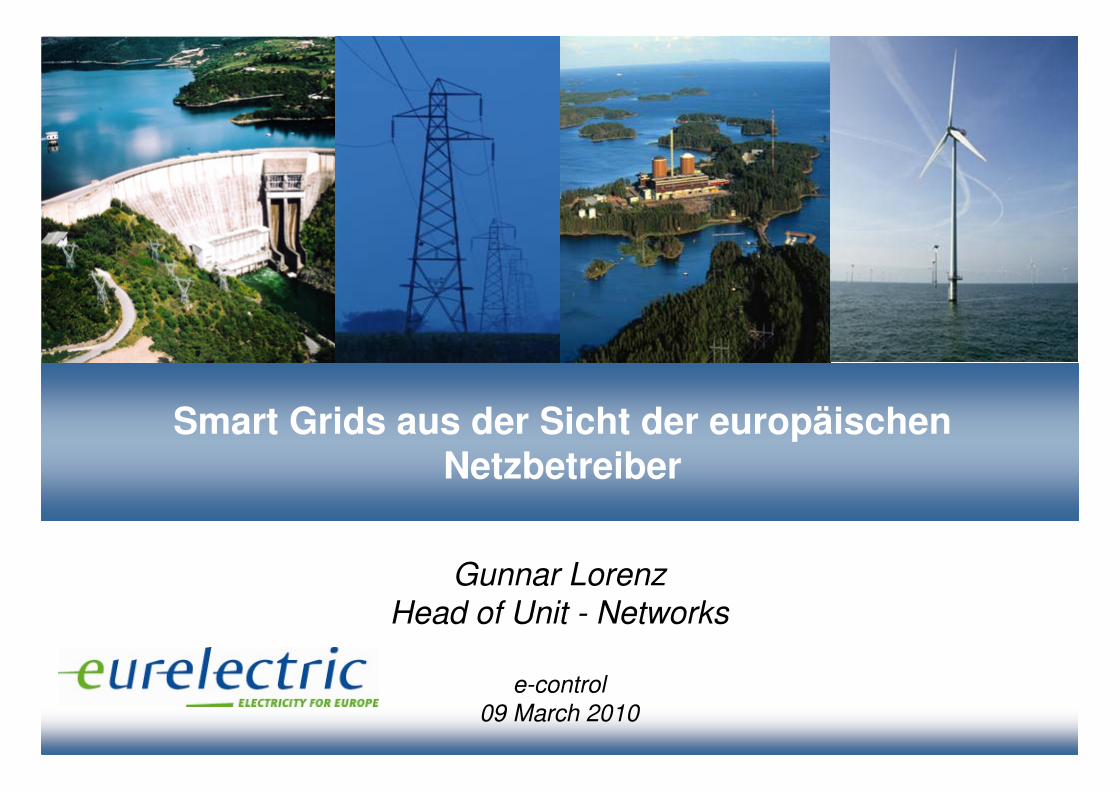
Representing the electricity industry at expert,
strategic and policymaking levels.
33 FULL MEMBERS
9 EUROPEAN AFFILIATE MEMBERS
7 MEDITERRANEAN AFFILIATE MEMBERS
7 INTERNATIONAL AFFILIATE MEMBERS
9 EI ASSOCIATE MEMBERS
25 BUSINESS ASSOCIATE MEMBERS
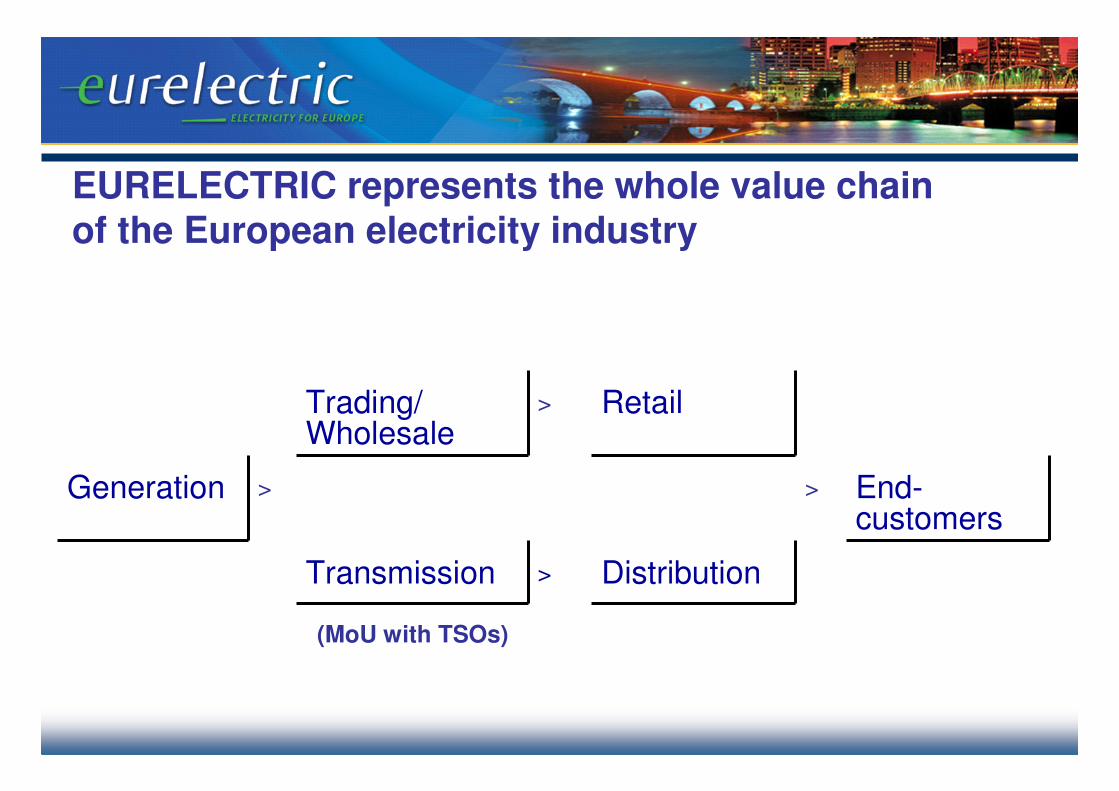
EURELECTRIC represents the whole value chain of the European electricity industry
Trading/ Wholesale
> Retail
Generation > > End-customers
Transmission > Distribution
(MoU with TSOs)
5
Highlights
1. The regulatory framework should adapt to the new challenges
– DSOs have a new mission – The regulatory framework must adapt to this
– Not all technology related activities must be regulated –regulation must also facilitate a market development
– Adding “smartness” to the regulatory framework
2. Smart Grids Case Studies
3. Implications for the wholesale and retail market
2.
3.
6
Highlights
1. The regulatory framework should adapt to the new challenges
– DSOs have a new mission – The regulatory framework must adapt to this
– Not all technology related activities must be regulated –regulation must also facilitate a market development
– Adding “smartness” to the regulatory framework
2. Smart Grids Case Studies
3. Implications for the wholesale and retail market
2.
3.
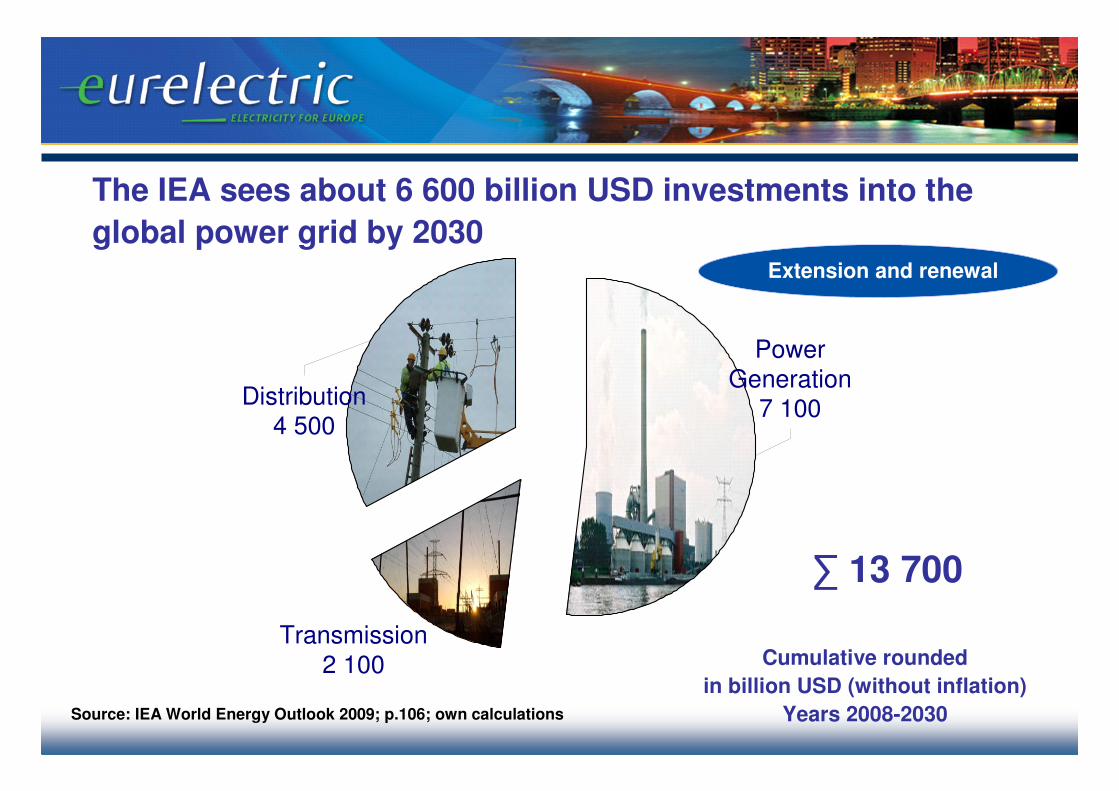
Source: IEA World Energy Outlook 2009; p.106; own calculations
Cumulative rounded
in billion USD (without inflation)
Years 2008-2030
The IEA sees about 6 600 billion USD investments into the
global power grid by 2030Extension and renewal
Power Generation
7 100
Transmission2 100
Distribution4 500
∑ 13 700
8
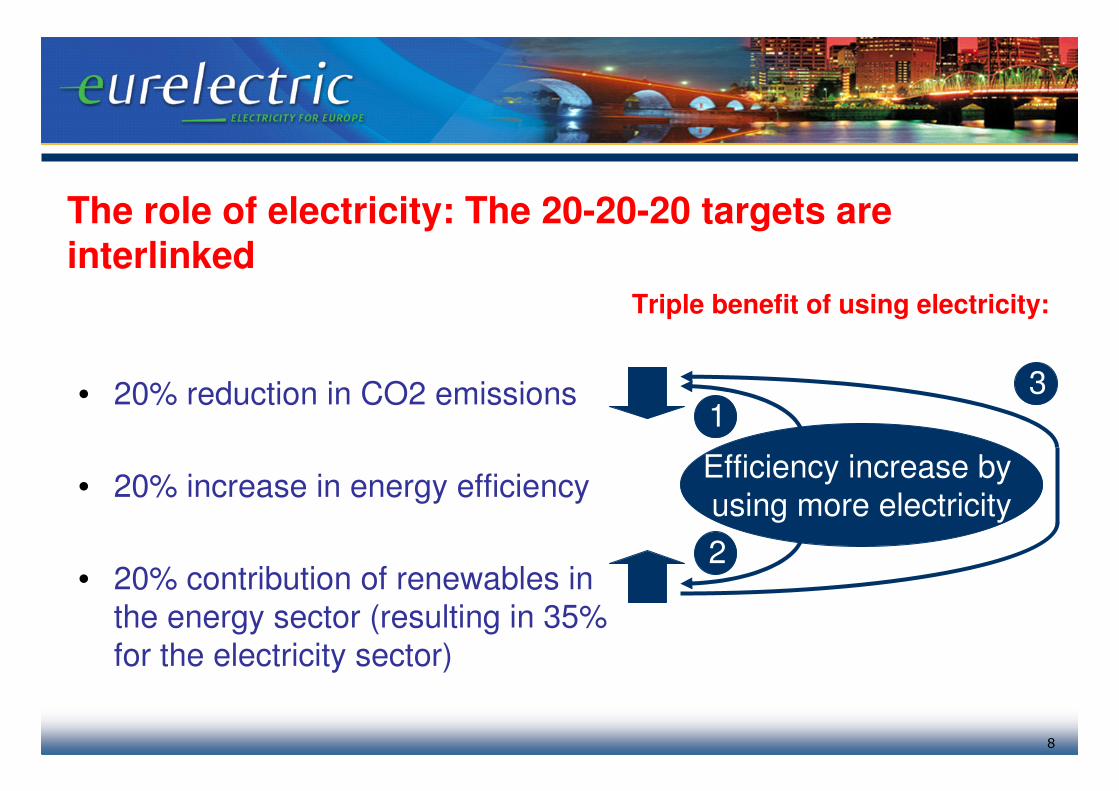
The role of electricity: The 20-20-20 targets are interlinked
• 20% reduction in CO2 emissions
• 20% increase in energy efficiency
• 20% contribution of renewables in
the energy sector (resulting in 35%
for the electricity sector)
Efficiency increase by
using more electricity
1
2
3
Triple benefit of using electricity:
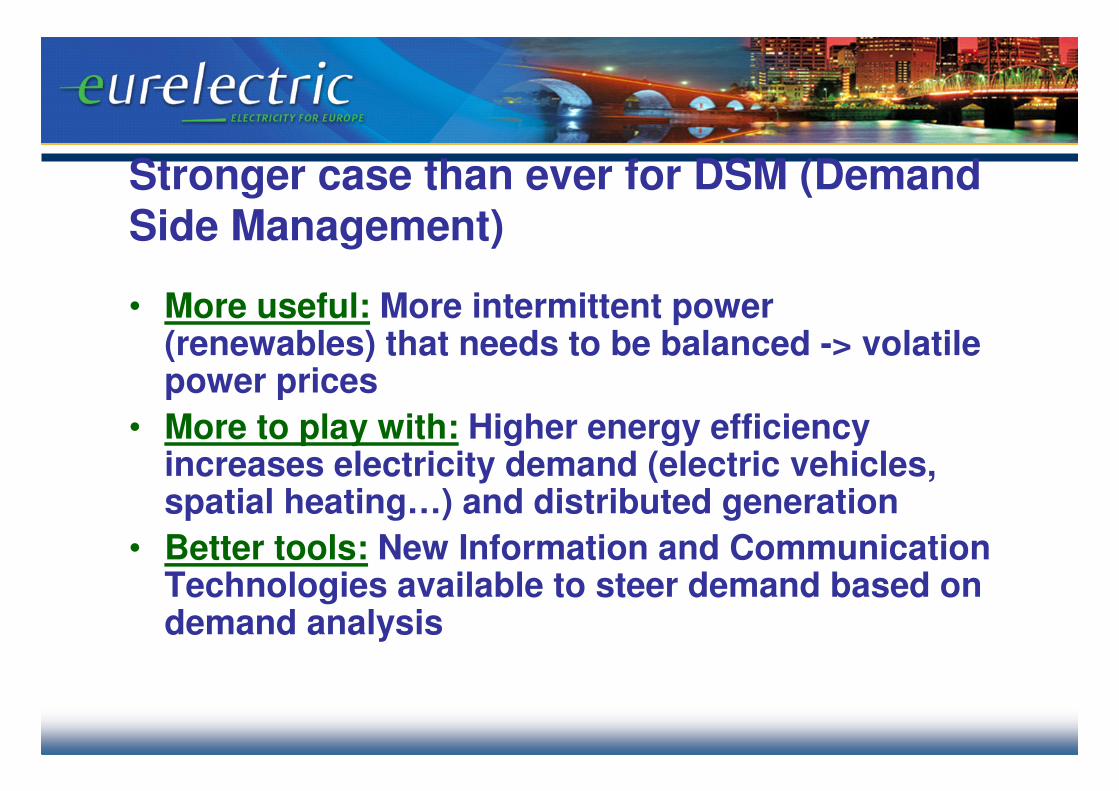
Stronger case than ever for DSM (Demand Side Management)
• More useful: More intermittent power (renewables) that needs to be balanced -> volatile power prices
• More to play with: Higher energy efficiency increases electricity demand (electric vehicles, spatial heating…) and distributed generation
• Better tools: New Information and Communication Technologies available to steer demand based on demand analysis
10
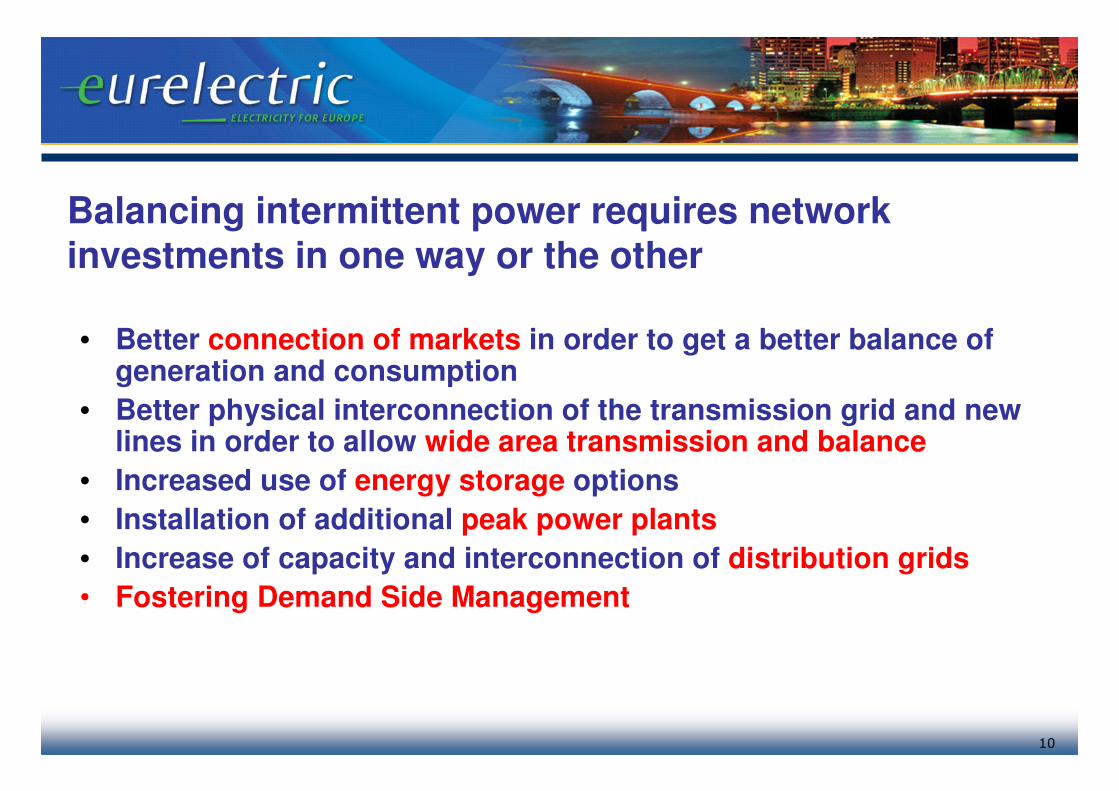
Balancing intermittent power requires network investments in one way or the other
• Better connection of markets in order to get a better balance of generation and consumption
• Better physical interconnection of the transmission grid and newlines in order to allow wide area transmission and balance
• Increased use of energy storage options
• Installation of additional peak power plants
• Increase of capacity and interconnection of distribution grids
• Fostering Demand Side Management
11
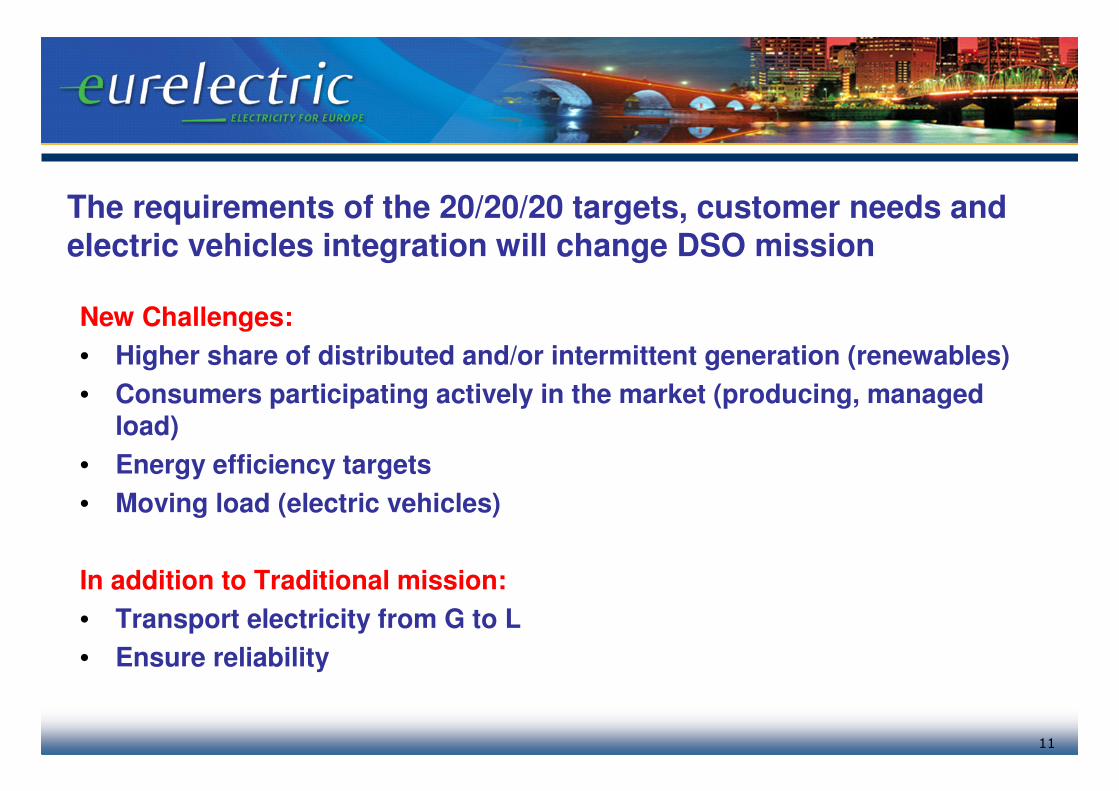
The requirements of the 20/20/20 targets, customer needs and electric vehicles integration will change DSO mission
New Challenges:
• Higher share of distributed and/or intermittent generation (renewables)
• Consumers participating actively in the market (producing, managed load)
• Energy efficiency targets
• Moving load (electric vehicles)
In addition to Traditional mission:
• Transport electricity from G to L
• Ensure reliability
12
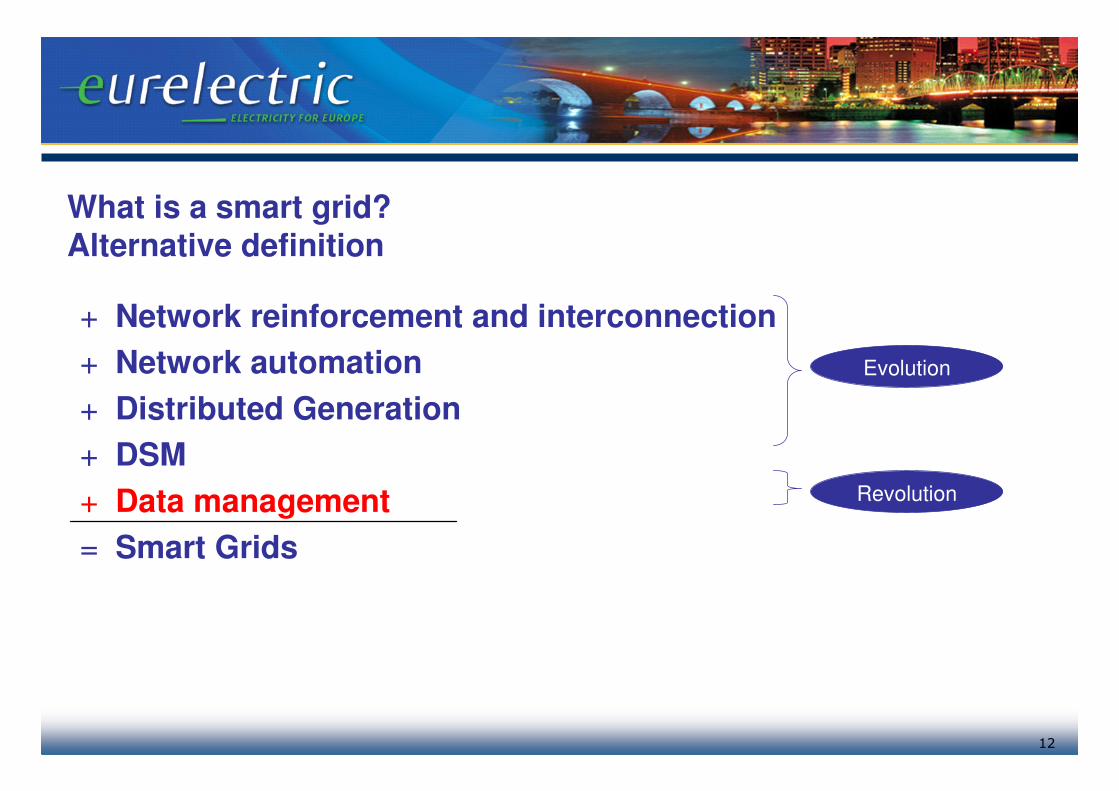
What is a smart grid? Alternative definition
+ Network reinforcement and interconnection
+ Network automation
+ Distributed Generation
+ DSM
+ Data management
= Smart Grids
Evolution
Revolution
Electrical grids play an important role
• The future will be greener, however, it also will be more electric
• Smart grids for smart customers
• If you like renewables you also have to have like electrical lines
15
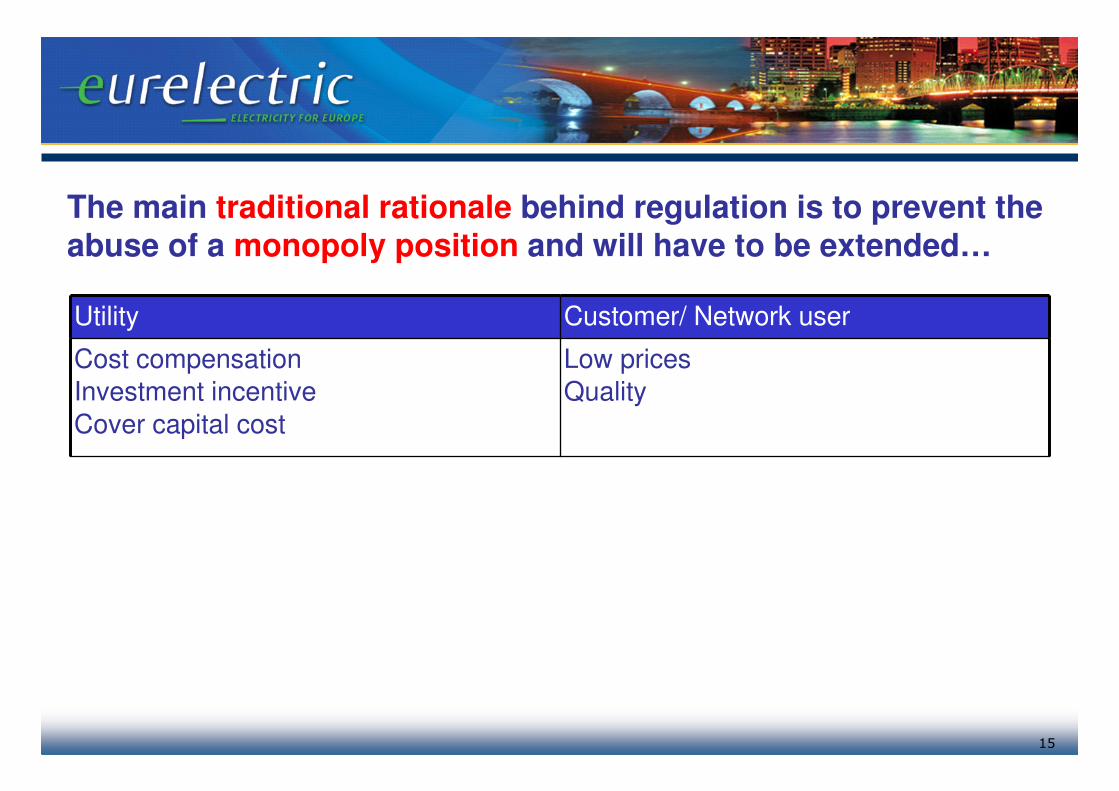
The main traditional rationale behind regulation is to prevent the abuse of a monopoly position and will have to be extended…
Utility Customer/ Network user
Cost compensation
Investment incentive
Cover capital cost
Low prices
Quality
16
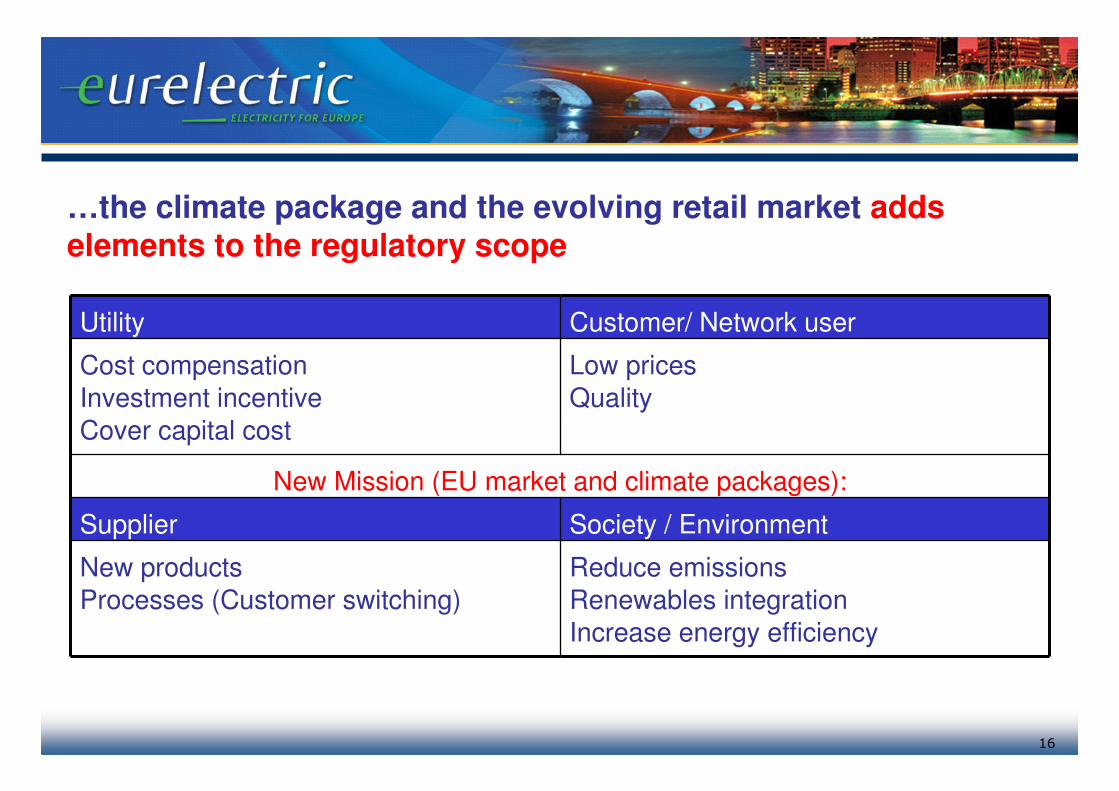
…the climate package and the evolving retail market adds elements to the regulatory scope
Utility Customer/ Network user
Cost compensation
Investment incentive
Cover capital cost
Low prices
Quality
New Mission (EU market and climate packages):
Supplier Society / Environment
New products
Processes (Customer switching)
Reduce emissions
Renewables integration
Increase energy efficiency
17
Regulatory framework must consider the new mission of DSOs
• Integrating environmental goals on distribution level
• Incentivising smart grids that enable the creation of
a better functioning retail market place
• Removing barriers for investing in technological innovation
18
Highlights
1. The regulatory framework should adapt to the new challenges
– DSOs have a new mission – The regulatory framework must adapt to this
– Not all technology related activities must be regulated –regulation must also facilitate a market development
– Adding “smartness” to the regulatory framework
2. Smart Grids Case Studies
3. Implications for the wholesale and retail market
2.
3.
19
There are areas where regulation is essential
• Economies of scale
• Externalities
• Setting standards enabling interoperability
20
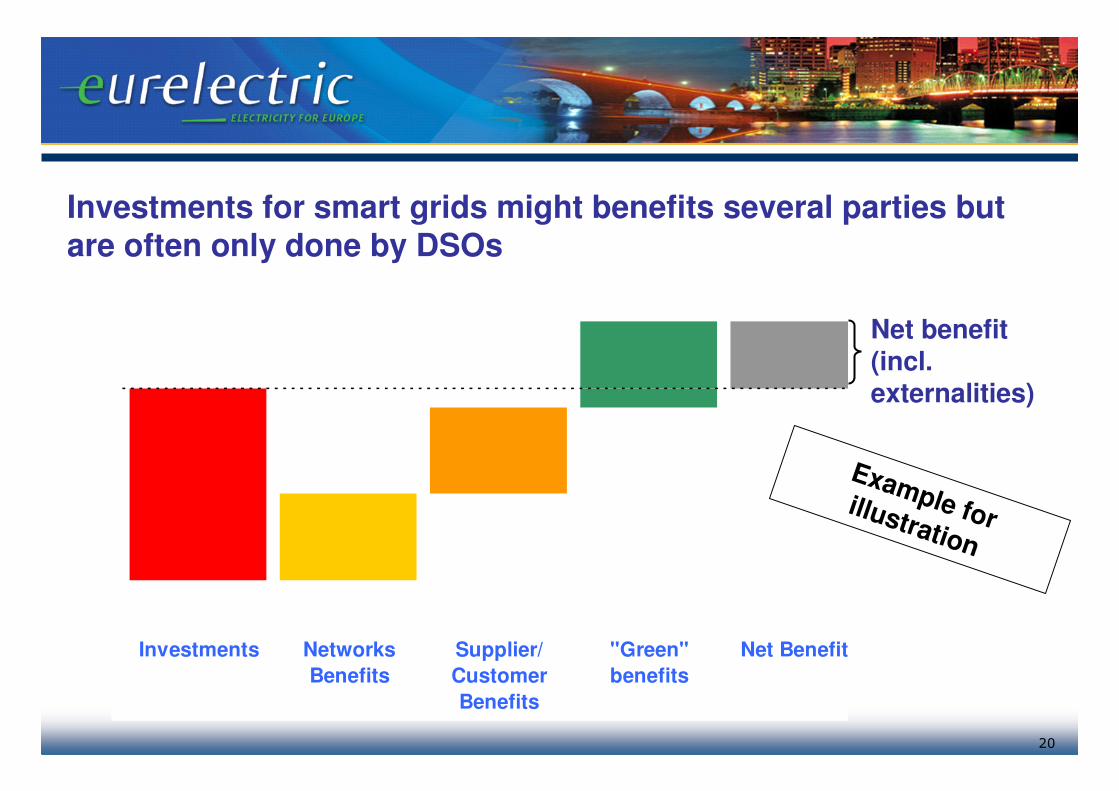
Investments for smart grids might benefits several parties but are often only done by DSOs
Investments Networks
Benefits
Supplier/
Customer
Benefits
"Green"
benefits
Net Benefits
Example for illustration
Net benefit(incl. externalities)
21
Unbundling rules need to be respected when implementing smart grids
• Existing unbundling rules pose a challenge for synchronisation of network investments and the creation of new services.
• Interoperability standards enable the market to compensate for lack of synchronisation due to existing functional and information unbundling
• Not everything must be regulated but regulation is needed to create the right environment for a market to be developed
22
A stable and predictable regulatory framework ensures market development and avoid stranded investments
• Danger of stranded investments (smart meters)
• For customers to put trust in new technologies data protection issues must be addressed in a credible and predictable manner
• In order to give equal access to new players in the new market interoperability of technology is key for success.
23
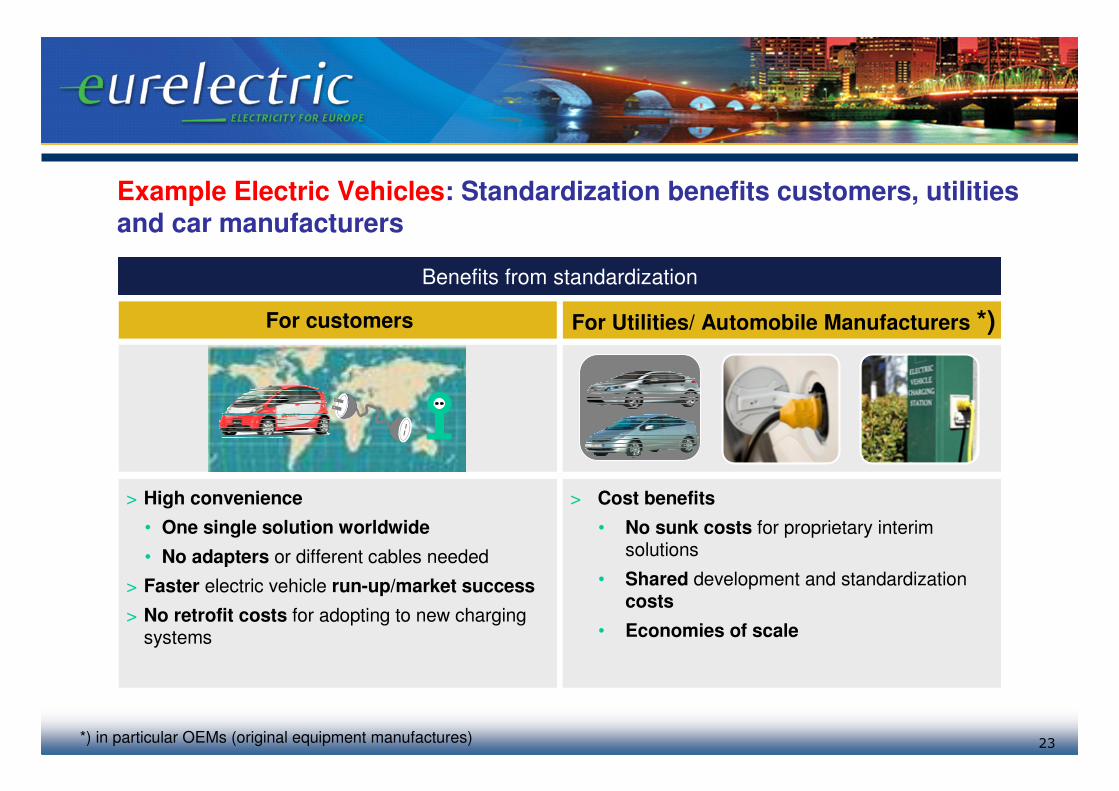
Example Electric Vehicles: Standardization benefits customers, utilities and car manufacturers
> High convenience
• One single solution worldwide
• No adapters or different cables needed
> Faster electric vehicle run-up/market success
> No retrofit costs for adopting to new charging systems
> Cost benefits
• No sunk costs for proprietary interim solutions
• Shared development and standardization costs
• Economies of scale
For Utilities/ Automobile Manufacturers *)For customers
Benefits from standardization
*) in particular OEMs (original equipment manufactures)
24
Electric vehicles
EURELECTRIC supports an OEM/Utility standardisation initiativestarted end of 2008 to accelerate and improve standards definition
• Draft Proposal accepted as pre-standard
• Initiative will be converted into official ISO/ IEC standardisation groups
Within the Framework of the Task Force Electric Vehicles EURELECTRIC participates in this initiative.
25
Principals of electric vehicle/ grid standards can be transferred to smart grids components
• Open communication standard (TCP / IP)
• All market stakeholders can use protocol to communicate
• Several software provider can be used ensuring competitive prices that keep cost and tariffs low
• Standards offer investment security and give market opportunities to new players
26
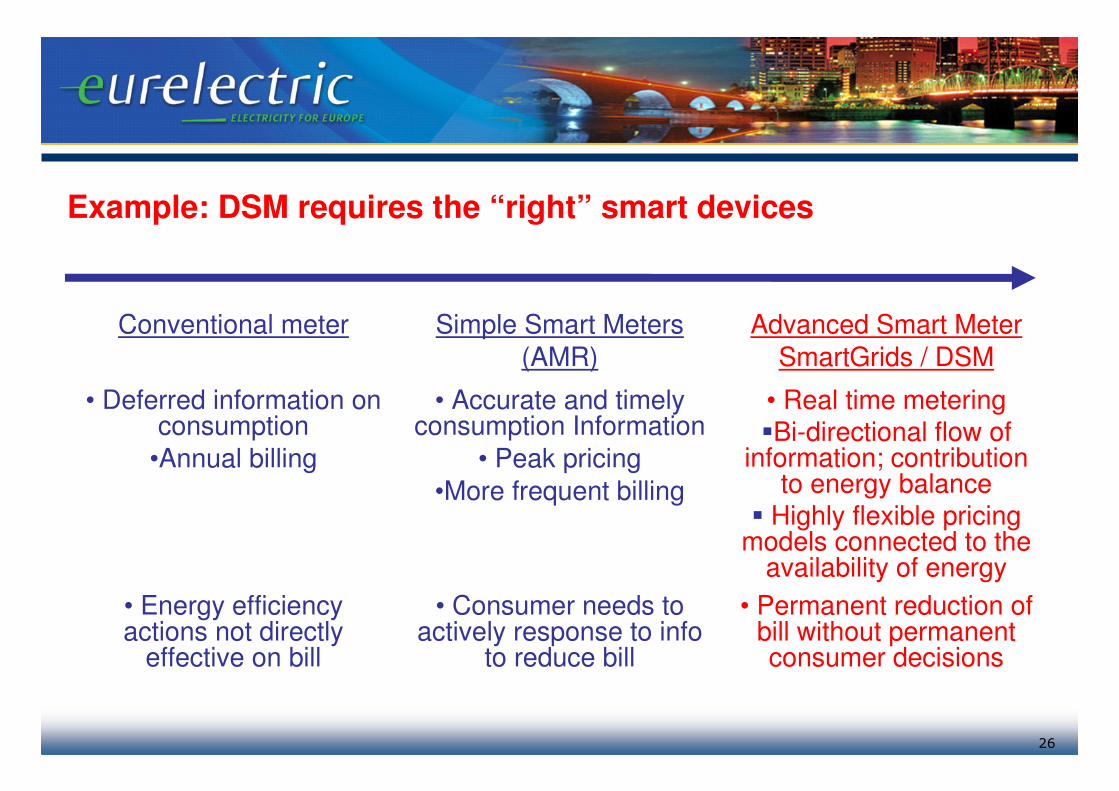
Conventional meter Simple Smart Meters
(AMR)
Advanced Smart Meter
SmartGrids / DSM
• Deferred information on consumption
•Annual billing
• Accurate and timely consumption Information
• Peak pricing
•More frequent billing
• Real time metering�Bi-directional flow of
information; contribution to energy balance
� Highly flexible pricing models connected to the
availability of energy
• Energy efficiency actions not directly
effective on bill
• Consumer needs to actively response to info
to reduce bill
• Permanent reduction of bill without permanent consumer decisions
Example: DSM requires the “right” smart devices
27
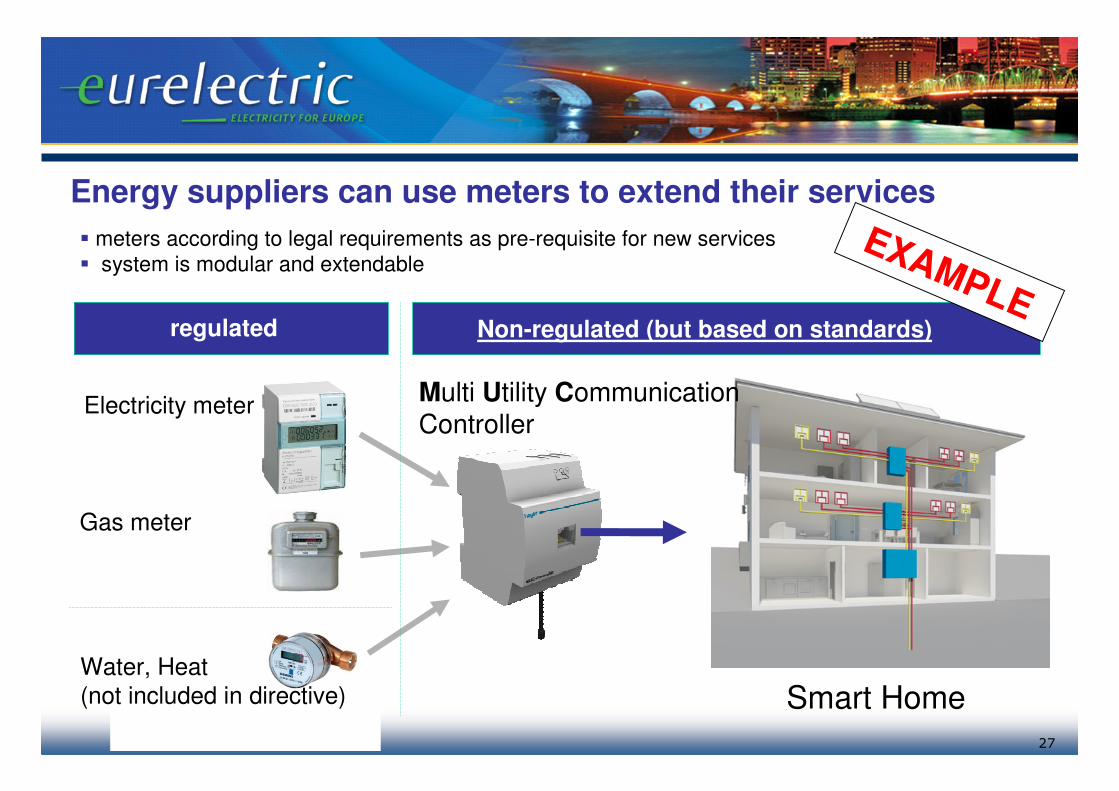
Energy suppliers can use meters to extend their services
� meters according to legal requirements as pre-requisite for new services
� system is modular and extendable
Electricity meter
Water, Heat
(not included in directive)
Multi Utility CommunicationController
Smart Home
regulated Non-regulated (but based on standards)
Gas meter
EXAMPLE
28
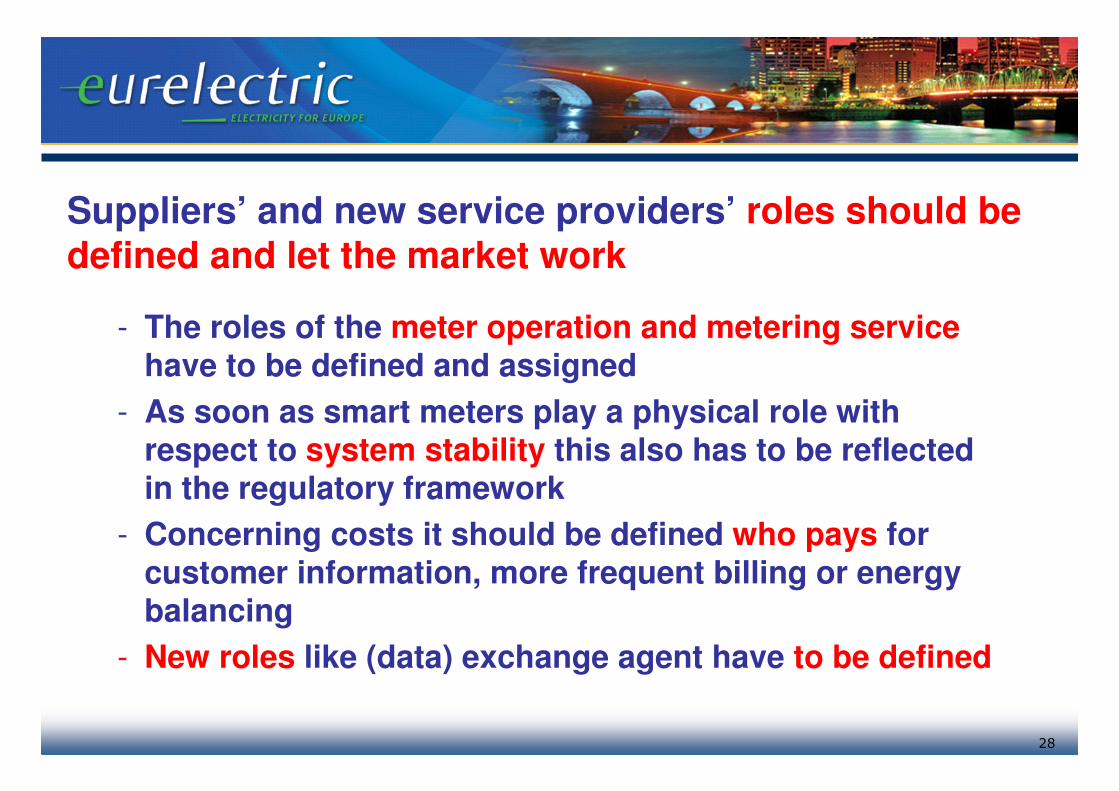
- The roles of the meter operation and metering servicehave to be defined and assigned
- As soon as smart meters play a physical role with respect to system stability this also has to be reflected in the regulatory framework
- Concerning costs it should be defined who pays for customer information, more frequent billing or energy balancing
- New roles like (data) exchange agent have to be defined
Suppliers’ and new service providers’ roles should be defined and let the market work
29
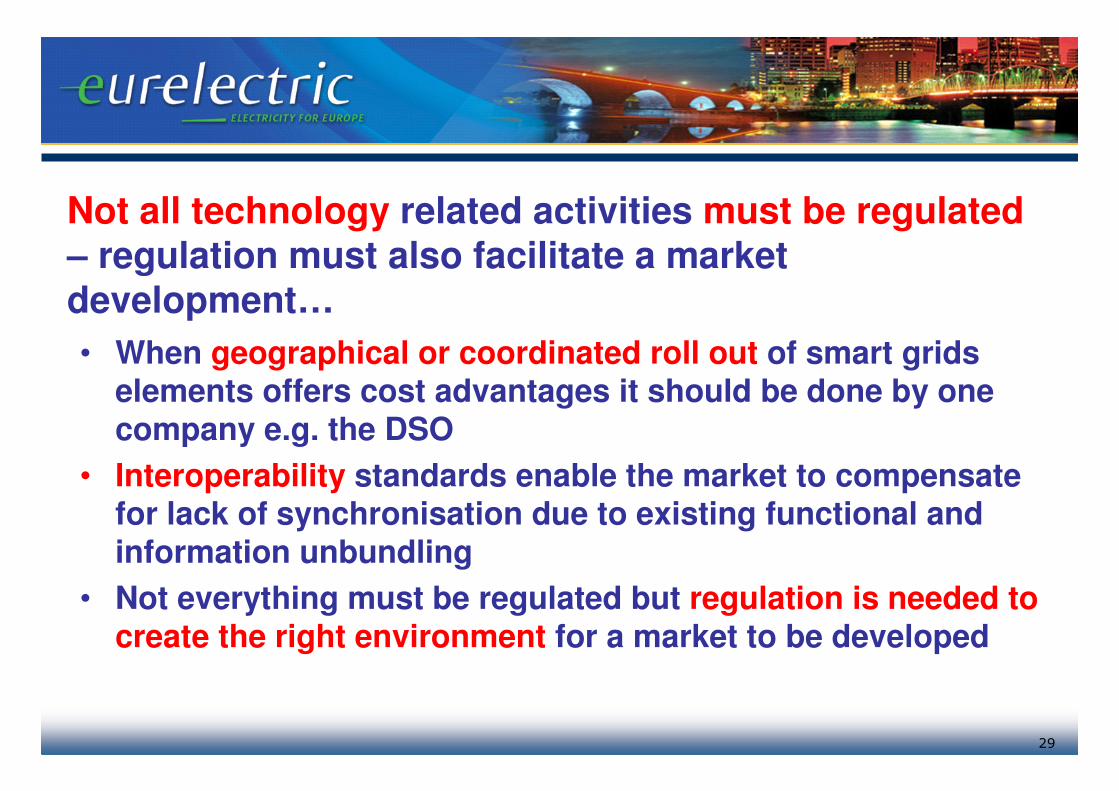
Not all technology related activities must be regulated– regulation must also facilitate a market development…
• When geographical or coordinated roll out of smart grids elements offers cost advantages it should be done by one company e.g. the DSO
• Interoperability standards enable the market to compensate for lack of synchronisation due to existing functional and information unbundling
• Not everything must be regulated but regulation is needed to create the right environment for a market to be developed
30
Highlights
1. The regulatory framework should adapt to the new challenges
– DSOs have a new mission – The regulatory framework must adapt to this
– Not all technology related activities must be regulated –regulation must also facilitate a market development
– Adding “smartness” to the regulatory framework
2. Smart Grids Case Studies
3. Implications for the wholesale and retail market
2.
3.
31
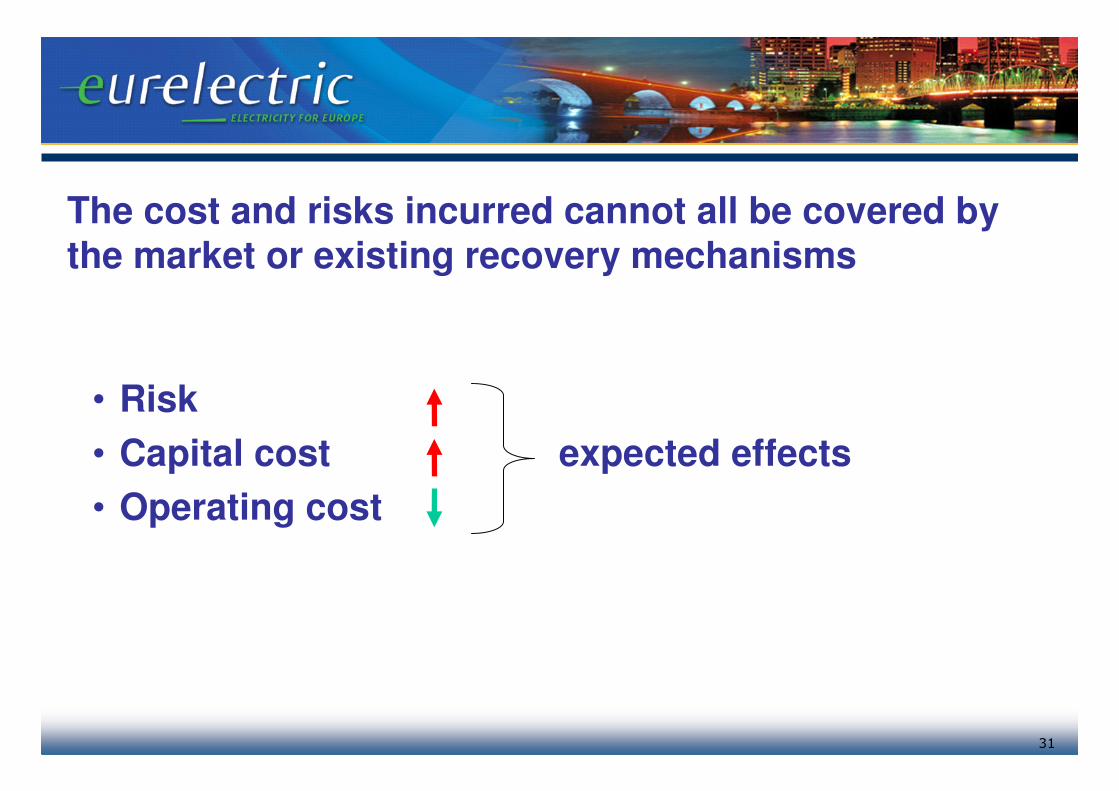
• Risk
• Capital cost expected effects
• Operating cost
The cost and risks incurred cannot all be covered by the market or existing recovery mechanisms
32
Ideas for adding “smartness” to the regulatory framework (1/2)
• Internalise positive externalities
• Foster collaboration projects among stakeholders
• Tariff of use – reallocate network tariffs among stakeholders
33
Ideas for adding “smartness” to the regulatory framework (2/2)
• Performance based ratemaking (guaranteed/overall standards)
• Smart Grids factor in regulation formula (direct effect on DSOs revenues)
• Load revenues – charge customers for actual load(capacity tariff €/kW)
34
Conclusion
Regulation must…
• Open new market opportunities for existing suppliers and new players
• Empower the customers to make use of new possibilities
• Contribute to define the right market model
• Incentivise investments in new technologies with positive externalities
35
Highlights
1. The regulatory framework should adapt to the new challenges
– DSOs have a new mission – The regulatory framework must adapt to this
– Not all technology related activities must be regulated –regulation must also facilitate a market development
– Adding “smartness” to the regulatory framework
2. Smart Grids Case Studies
3. Implications for the wholesale and retail market
2.
3.
Case Study: ESB (Ireland)
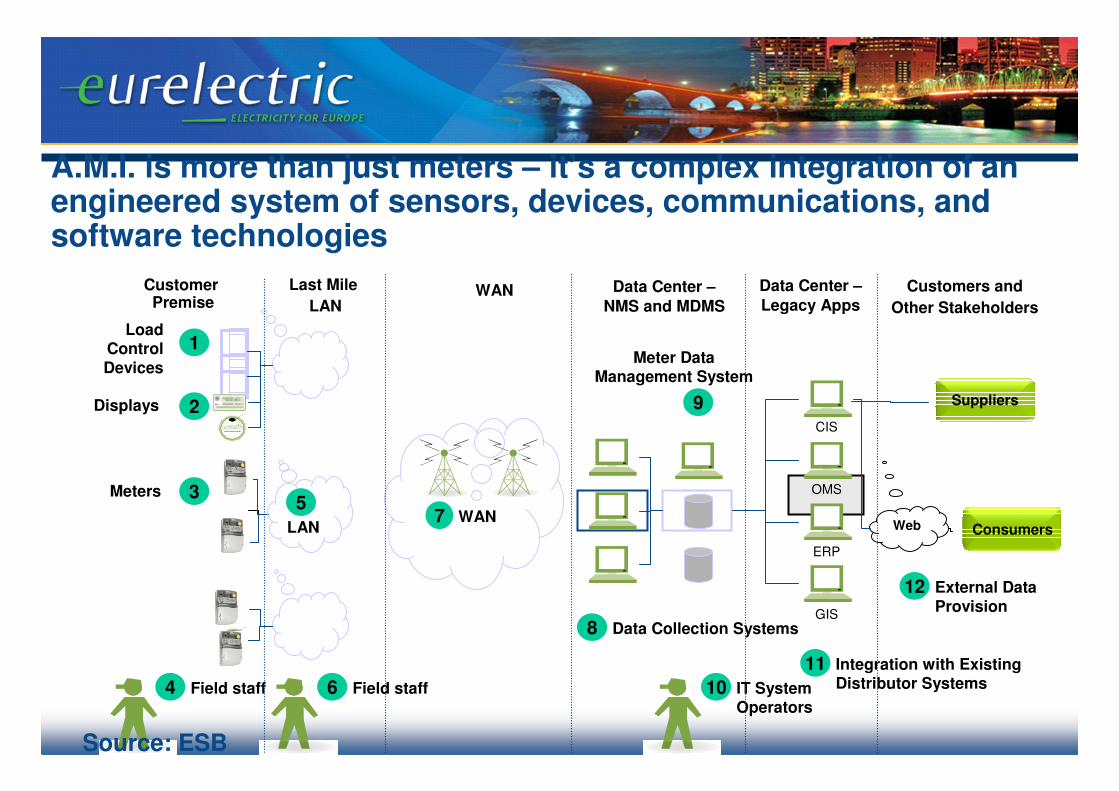
A.M.I. is more than just meters – it’s a complex integration of an engineered system of sensors, devices, communications, and software technologies
9
Meter Data Management System
4 Field staff 6 Field staff
5
LAN
3Meters
7 WAN
1Load
Control Devices
10 IT System Operators
Suppliers
Consumers
2Displays
8 Data Collection Systems
11 Integration with Existing Distributor Systems
GIS
ERP
OMS
CIS
Web
12 External Data Provision
Customer Premise
Last Mile
LANWAN Data Center –
NMS and MDMS
Data Center –
Legacy AppsCustomers and
Other Stakeholders
Source: ESB
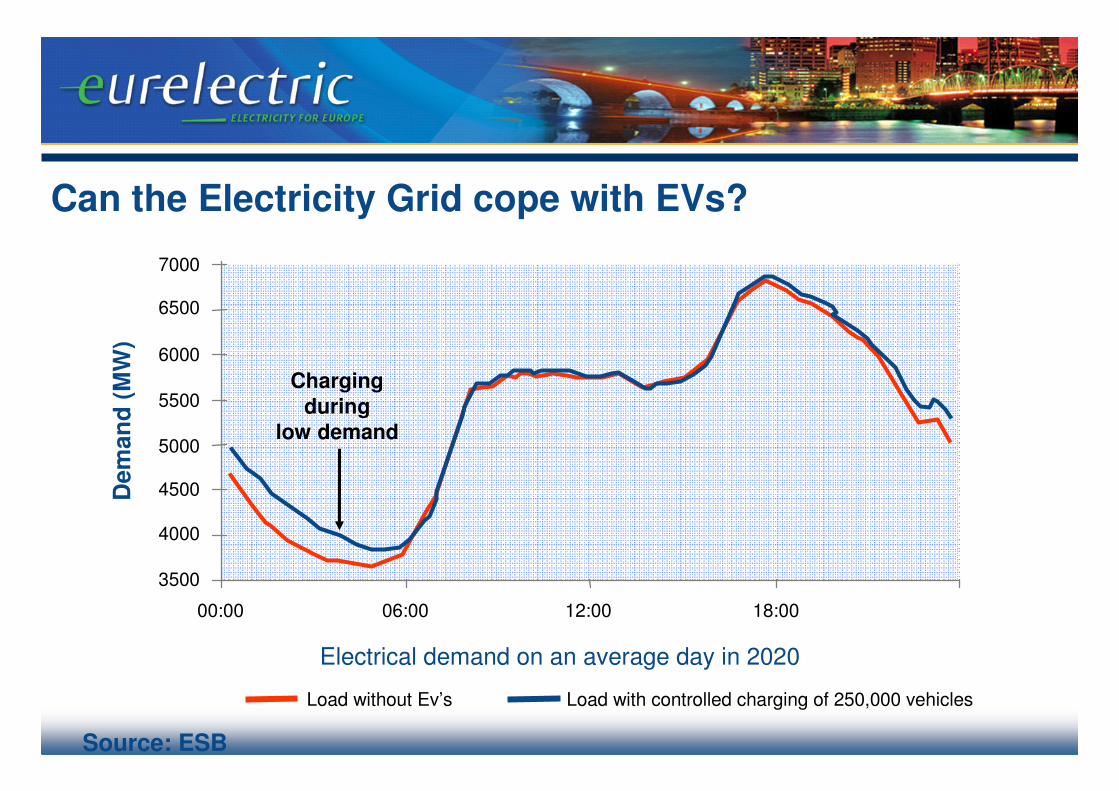
Can the Electricity Grid cope with EVs?
7000
6500
6000
5500
5000
4500
4000
3500
00:00 06:00 12:00 18:00
Electrical demand on an average day in 2020
Load without Ev’s Load with controlled charging of 250,000 vehicles
Dem
an
d (
MW
)
Charging
duringlow demand
Source: ESB

Electric Vehicle Implementation in Ireland
2010/112009
Initial ProjectInitial Project
� Ensure supply of EV’s to Ireland !
� Demonstration: Cars + Charge I/S
� Identify IT /Market System Options
� Link to Smart Networks
� R&D
2020
Early Adoption phase Large Scale Roll-Out Phase
Regulated Business Regulated Business
Other Business Other Business
� Secure large scale penetration
� Address scale infrastructure requirement
� Address System Issues - storage/demand
Source: ESB
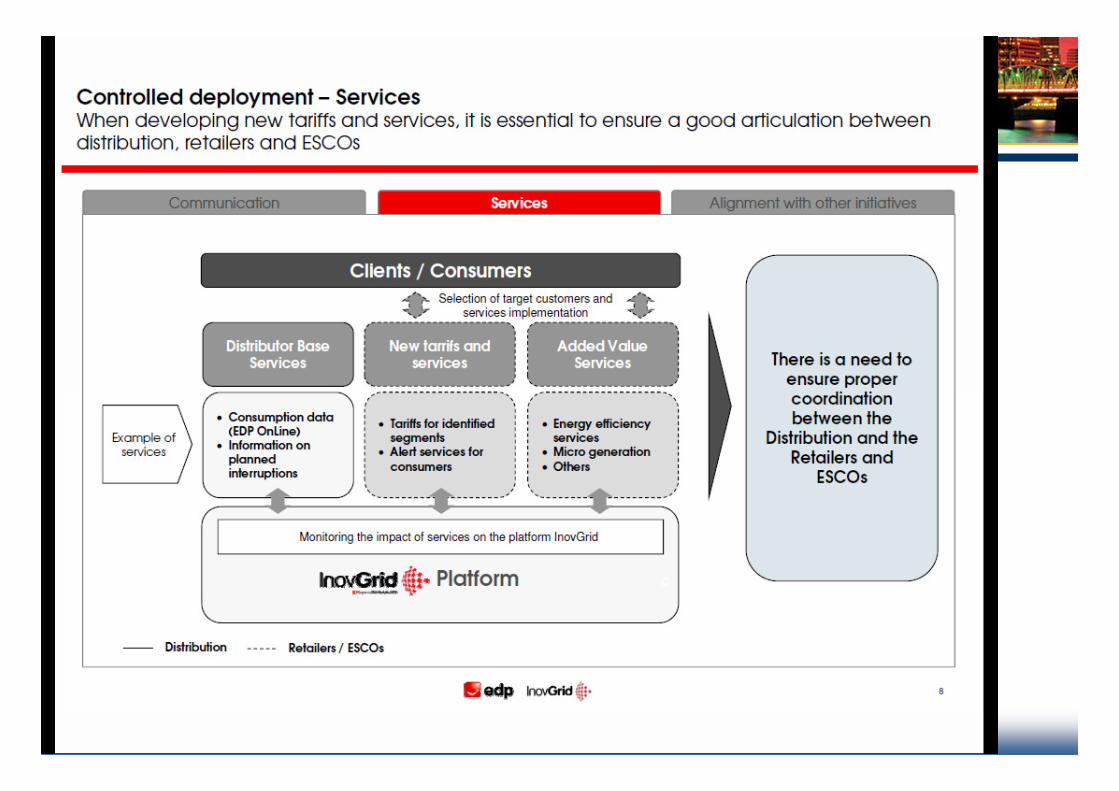
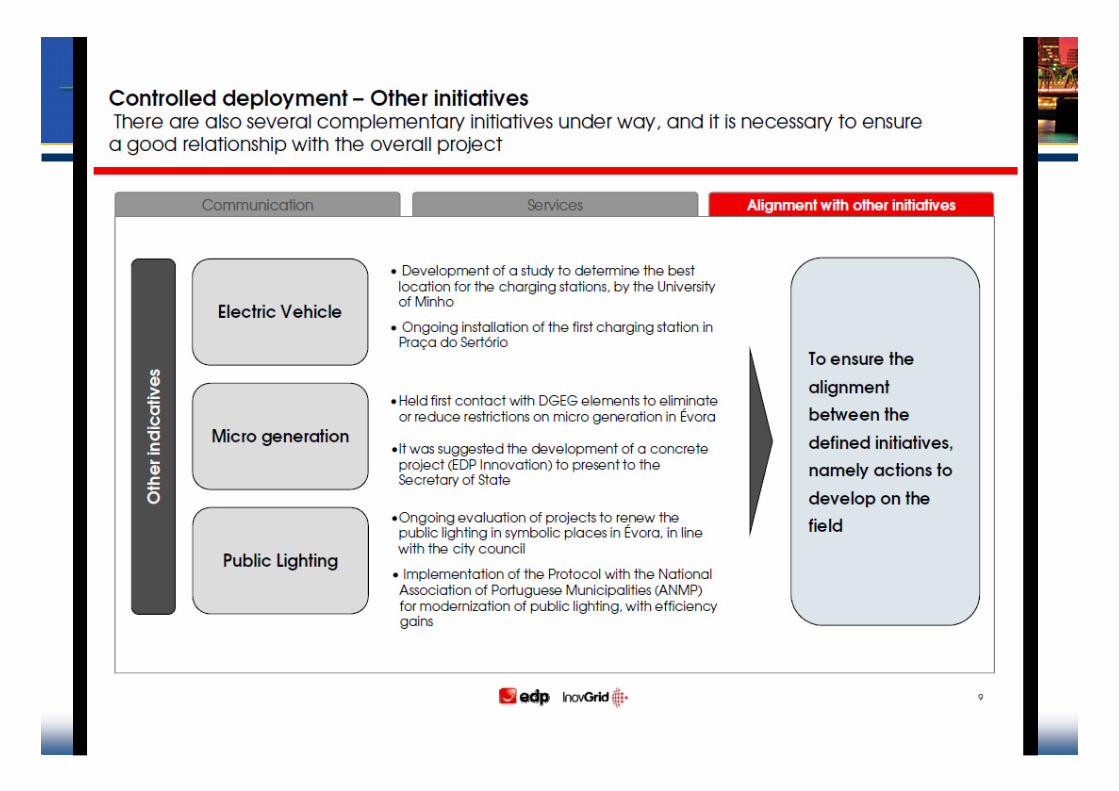
Case Study: EdP (Portugal): Inovgrid
43
Highlights
1. The regulatory framework should adapt to the new challenges
– DSOs have a new mission – The regulatory framework must adapt to this
– Not all technology related activities must be regulated –regulation must also facilitate a market development
– Adding “smartness” to the regulatory framework
2. Smart Grids Case Studies
3. Implications for the wholesale and retail market
2.
3.
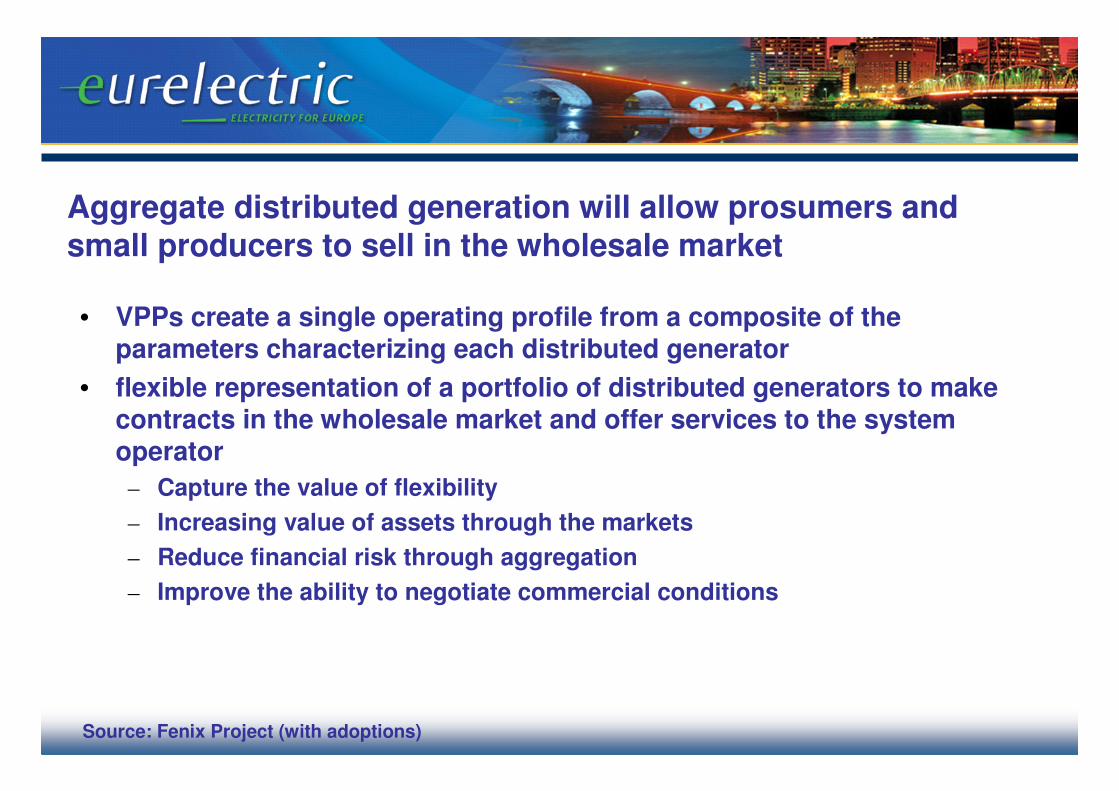
Aggregate distributed generation will allow prosumers and small producers to sell in the wholesale market
• VPPs create a single operating profile from a composite of the parameters characterizing each distributed generator
• flexible representation of a portfolio of distributed generators to make contracts in the wholesale market and offer services to the system operator
– Capture the value of flexibility
– Increasing value of assets through the markets
– Reduce financial risk through aggregation
– Improve the ability to negotiate commercial conditions
Source: Fenix Project (with adoptions)
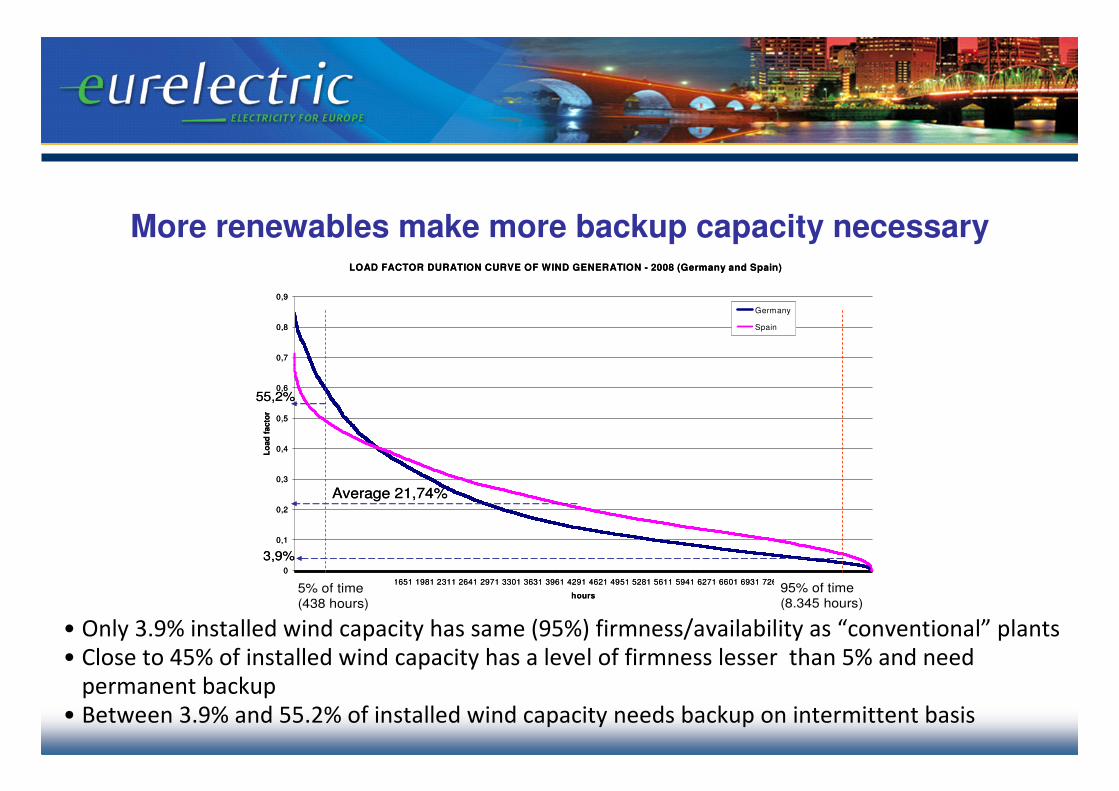
More renewables make more backup capacity necessary
• Only 3.9% installed wind capacity has same (95%) firmness/availability as “conventional” plants
• Close to 45% of installed wind capacity has a level of firmness lesser than 5% and need
permanent backup
• Between 3.9% and 55.2% of installed wind capacity needs backup on intermittent basis
LOAD FACTOR DURATION CURVE OF WIND GENERATION - 2008 (Germany and Spain)
0
0,1
0,2
0,3
0,4
0,5
0,6
0,7
0,8
0,9
1 331 661 991 1321 1651 1981 2311 2641 2971 3301 3631 3961 4291 4621 4951 5281 5611 5941 6271 6601 6931 7261 7591 7921 8251 8581
hours
Lo
ad
fa
cto
r
Germany
Spain
5% of time(438 hours)
55,2%
Average 21,74%
95% of time(8.345 hours)
3,9%
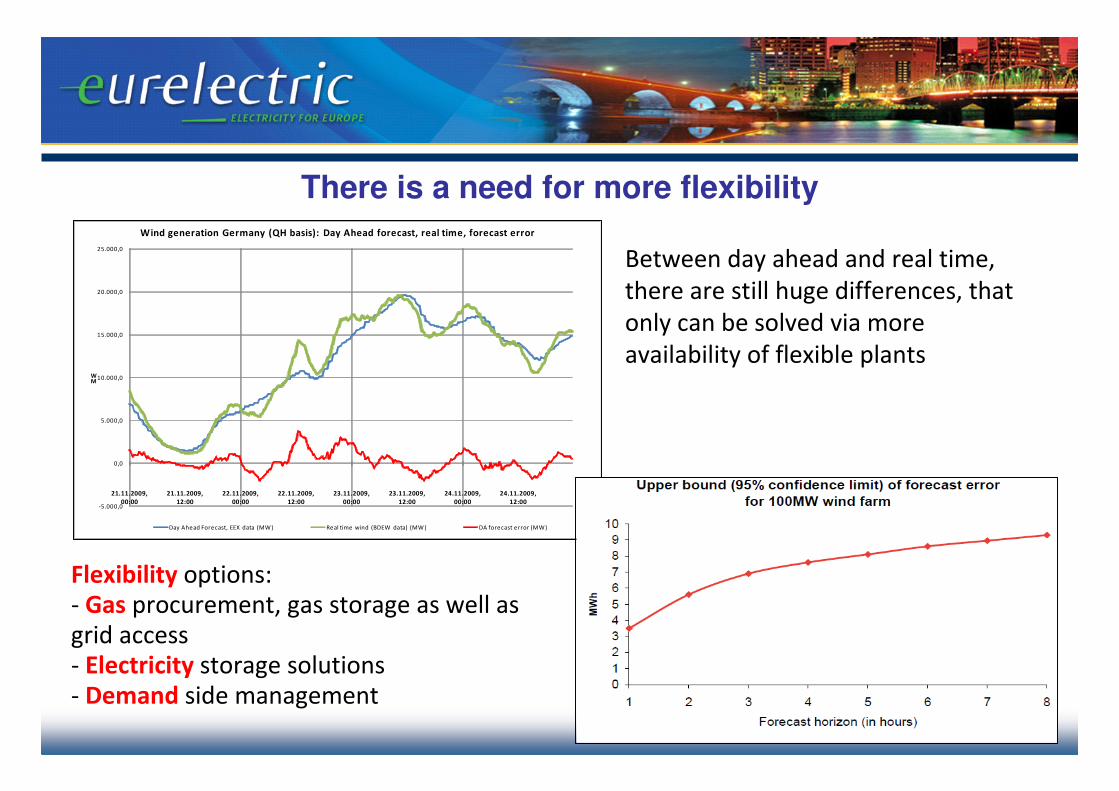
There is a need for more flexibility
-5.000,0
0,0
5.000,0
10.000,0
15.000,0
20.000,0
25.000,0
21.11.2009,
00:00
21.11.2009,
12:00
22.11.2009,
00:00
22.11.2009,
12:00
23.11.2009,
00:00
23.11.2009,
12:00
24.11.2009,
00:00
24.11.2009,
12:00
MW
Wind generation Germany (QH basis): Day Ahead forecast, real time, forecast error
Day Ahead Forecast, EEX data (MW) Real time wind (BDEW data) (MW ) DA forecast error (MW)
Between day ahead and real time,
there are still huge differences, that
only can be solved via more
availability of flexible plants
Flexibility options:
- Gas procurement, gas storage as well as
grid access
- Electricity storage solutions
- Demand side management
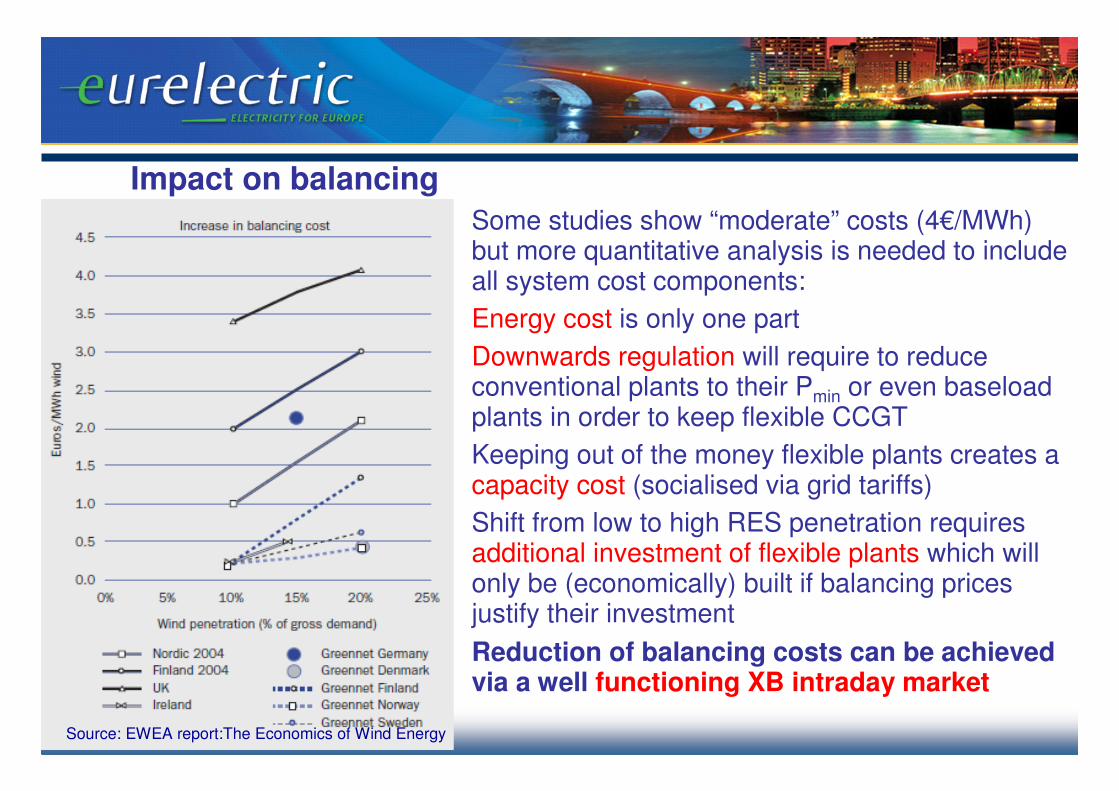
Impact on balancing
Some studies show “moderate” costs (4€/MWh) but more quantitative analysis is needed to include all system cost components:
Energy cost is only one part
Downwards regulation will require to reduce conventional plants to their Pmin or even baseload plants in order to keep flexible CCGT
Keeping out of the money flexible plants creates a capacity cost (socialised via grid tariffs)
Shift from low to high RES penetration requires additional investment of flexible plants which will only be (economically) built if balancing prices justify their investment
Reduction of balancing costs can be achieved via a well functioning XB intraday market
Source: EWEA report:The Economics of Wind Energy
48
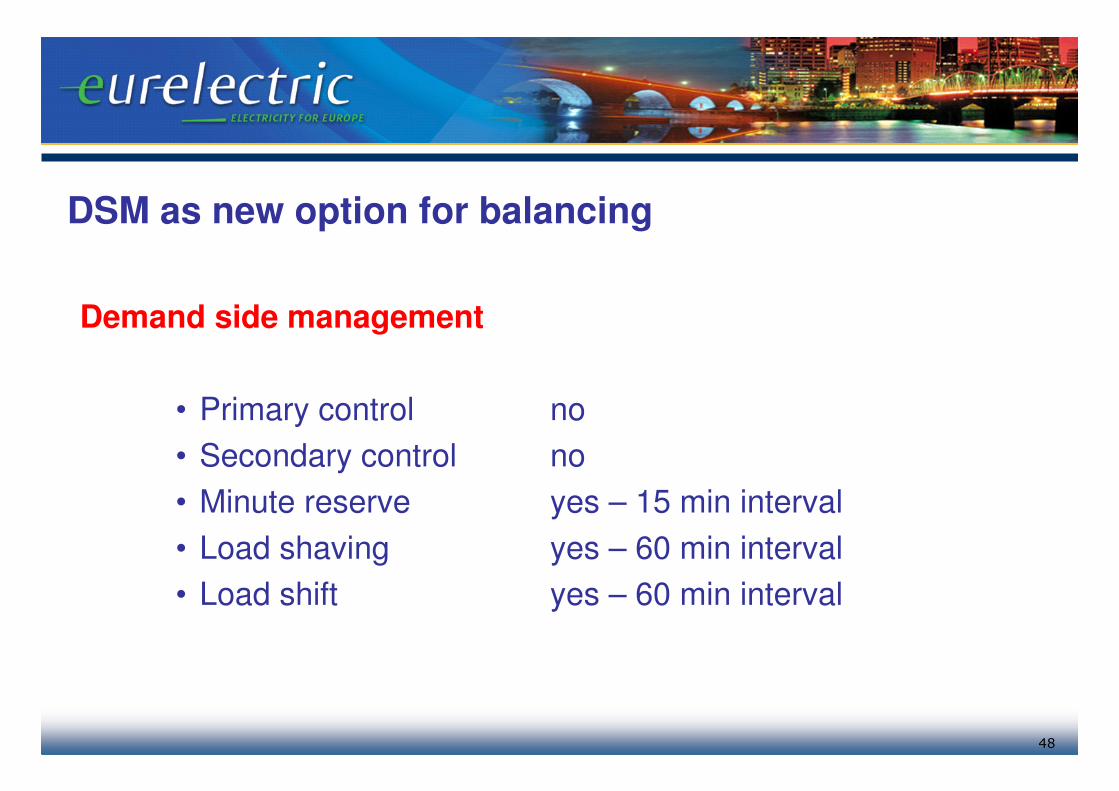
DSM as new option for balancing
Demand side management
• Primary control no
• Secondary control no
• Minute reserve yes – 15 min interval
• Load shaving yes – 60 min interval
• Load shift yes – 60 min interval
49
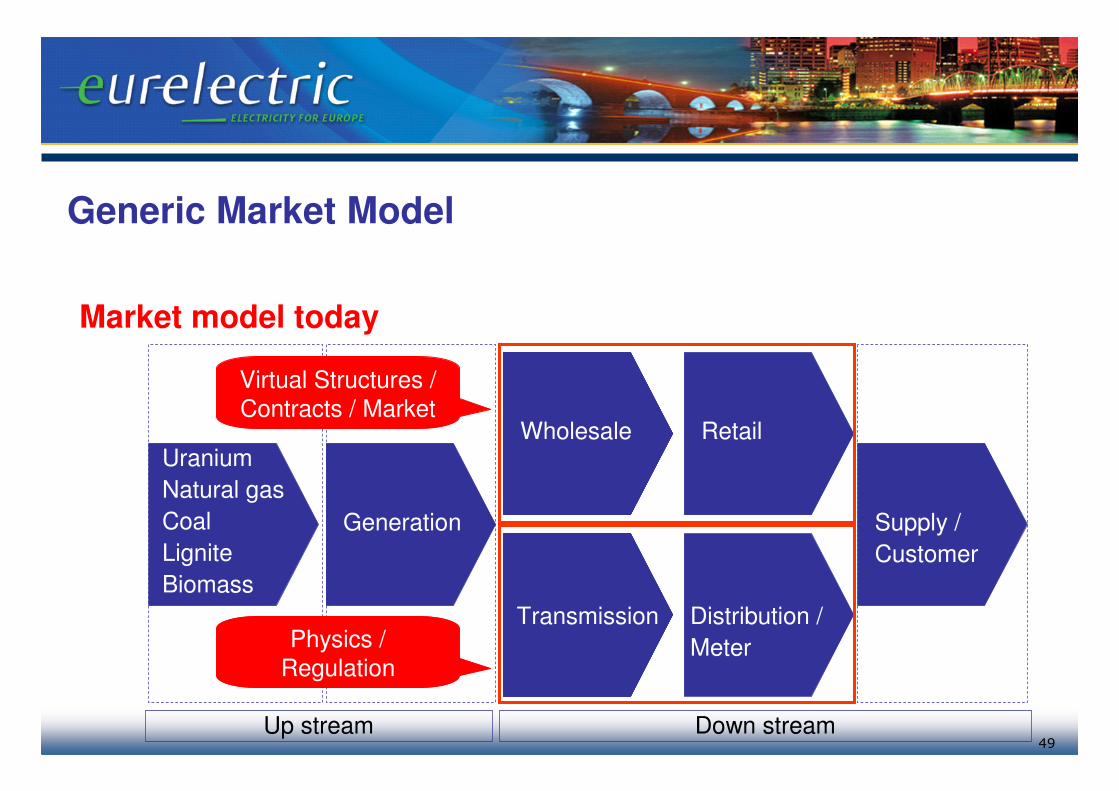
Generic Market Model
Market model today
Up stream
Uranium
Natural gas
Coal
Lignite
Biomass
Down stream
Generation Supply /
Customer
Wholesale Retail
Transmission Distribution /
Meter
Virtual Structures /
Contracts / Market
Physics /
Regulation
50
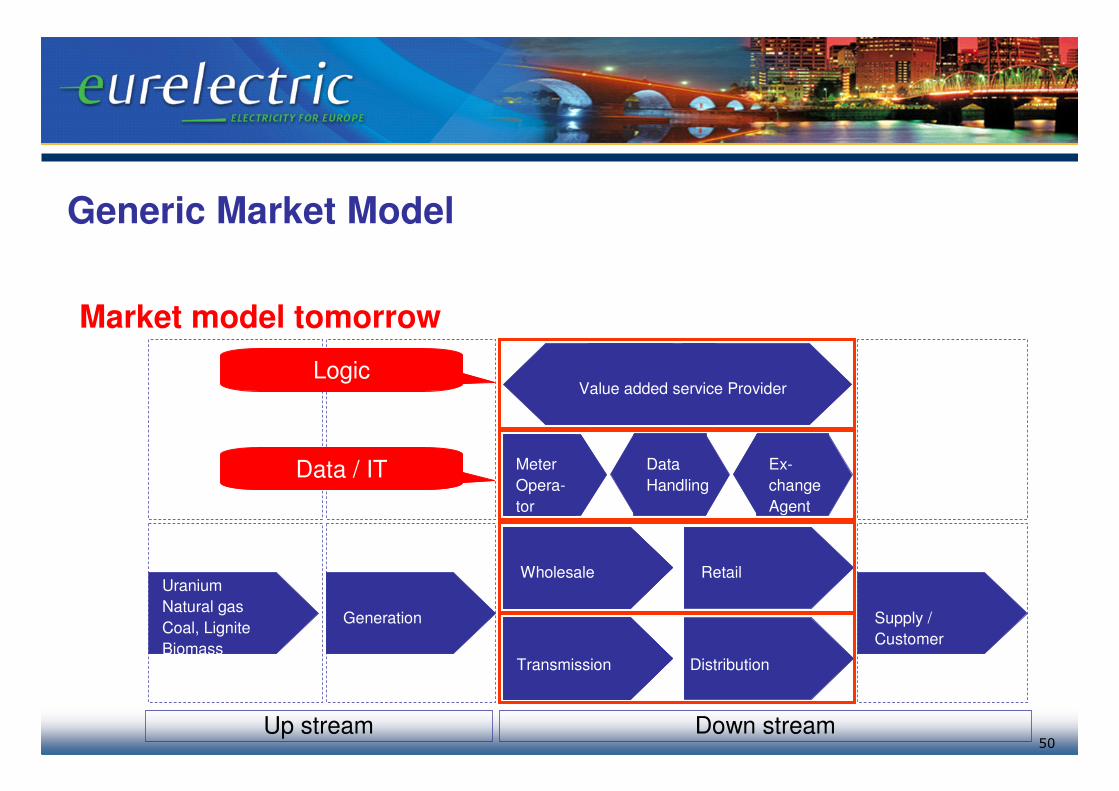
Generic Market Model
Market model tomorrow
Up stream Down stream
Uranium
Natural gas
Coal, Lignite
Biomass
Generation Supply /
Customer
Wholesale Retail
Transmission Distribution
Meter
Opera-
tor
Data
Handling
Ex-
change
Agent
Value added service ProviderLogic
Data / IT
51
Further Information
Conference: How will Smart Grids change the the face of how we distribute and consume electricity
• EURELECTRIC 2 x ½ day Conference
• 13/14 April in Brussels
www.eurelectric.org• Smart Metering position paper (2008)
• Upcoming: Smart Metering roll-out recommendations