Embed Size (px)
Citation preview
June 2, 2017
Developed by CRESST for Smarter Balanced
Smarter Balanced
Assessment Consortium: 2015–16 Summative Assessment
Technical Report
▪ Validity
▪ Reliability, Precision and Errors of Measurement
▪ Test Fairness
▪ Test Design
▪ Scores, Scales, and Norms and
▪ Administration
▪ Reporting and Interpretation
Smarter Balanced 2015–16 Summative Assessment Technical Report
Introduction
i
Table of Contents Introduction and Overview ........................................................................................................................... v
Overview .................................................................................................................................................... v
Technical Report Approach ..................................................................................................................... vi
Peer Review Guidelines and Established Standards ........................................................................... vii
Overview and Background of the Smarter Balanced Theory of Action .............................................. viii
Six Principles of Smarter Balanced Underlying the Theory of Action ................................................. viii
Purposes for the Smarter Balanced Assessment System ..................................................................... x
Overview of Report Chapters: ................................................................................................................. xi
Chapter 1: Validity ............................................................................................................................... xii
Chapter 2: Reliability/Precision and Errors of Measurement .......................................................... xii
Chapter 3: Test Fairness .................................................................................................................... xii
Chapter 4: Test Design ....................................................................................................................... xii
Chapter: 5 Scores, Scales and Norms ............................................................................................. xiii
Chapter 6: Test Administration ......................................................................................................... xiii
Chapter 7: Reporting and Interpretation .......................................................................................... xiii
Acknowledgments .................................................................................................................................. xiv
Outside Groups and Organizations that Collaborated with the Smarter Balanced Assessment
Consortium ......................................................................................................................................... xiv
Contributors to the Accessibility Accommodations Framework. .................................................... xiv
Other Acknowledgments. ................................................................................................................... xv
References ............................................................................................................................................. xvi
Chapter 1 : Validity .................................................................................................................................... 1-1
Introduction ........................................................................................................................................... 1-2
Purposes of the Smarter Balanced System for Summative Assessments ....................................... 1-2
Summary of Validity Argument ............................................................................................................. 1-3
Validity Framework for Summative Assessments............................................................................... 1-3
Essential Validity Evidence Derived from the Standards ................................................................. 1-13
The 2014 Standards’ Five Primary Sources of Validity Evidence ................................................... 1-14
Conclusion for Summative Test Validity Results .............................................................................. 1-16
References .......................................................................................................................................... 1-17
Chapter 2 : Reliability, Precision and Errors of Measurement............................................................... 2-1
Smarter Balanced 2015–16 Summative Assessment Technical Report
Introduction
ii
Introduction ........................................................................................................................................... 2-2
Simulations Studies for 2015-16 Operational Summative Tests ..................................................... 2-2
Tests for Special Populations......................................................................................................... 2-10
Item exposure ................................................................................................................................. 2-26
Observed Reliability ............................................................................................................................ 2-27
Paper/Pencil Test Reliability .......................................................................................................... 2-35
Classification Accuracy ................................................................................................................... 2-35
Standard Errors of Measurement .................................................................................................. 2-51
Online Platform Effects ....................................................................................................................... 2-57
References .......................................................................................................................................... 2-61
Chapter 3 : Test Fairness ......................................................................................................................... 3-1
Introduction ........................................................................................................................................... 3-2
Definitions for Validity, Bias, Sensitivity, and Fairness. ................................................................. 3-3
The Smarter Balanced Accessibility and Accommodations Framework ........................................... 3-4
Meeting the Needs of Traditionally Underrepresented Populations. ............................................ 3-7
How the Framework Meets Needs of Students Who Are ELLs. ..................................................... 3-7
How the Framework Meets Needs of Students with Disabilities................................................... 3-7
The Individual Student Assessment Accessibility Profile (ISAAP). ................................................. 3-8
Usability, Accessibility, and Accommodations Guidelines: Intended Audience and Recommended
Applications. ...................................................................................................................................... 3-9
Guidelines for Accessibility for English Language Learners. ....................................................... 3-11
Provision of Specialized Tests or Pools ............................................................................................. 3-13
Fairness as a Lack of Measurement Bias: Differential Item Functioning Analyses ....................... 3-14
Differential Item Functioning (DIF) Analyses for the Calibration Item Pool .................................... 3-14
Test Fairness and Implications for Ongoing Research ..................................................................... 3-21
References .......................................................................................................................................... 3-22
Chapter 4 : Test Design ............................................................................................................................ 4-1
Introduction ........................................................................................................................................... 4-2
A Brief Description of Smarter Balanced Content Structure.............................................................. 4-2
Synopsis of Assessment System Components ................................................................................... 4-4
Evidence-Centered Design in Constructing Smarter Balanced Assessments .................................. 4-4
Test Blueprints ...................................................................................................................................... 4-5
Operational Summative Assessment Blueprints and Specifications. ........................................... 4-7
Smarter Balanced 2015–16 Summative Assessment Technical Report
Introduction
iii
CAT and Performance Task Test Components ................................................................................. 4-11
Adaptive Test Design and Algorithm Overview ................................................................................. 4-11
Item attributes................................................................................................................................. 4-12
Item measurement data:................................................................................................................ 4-12
Test Operation Walkthrough .......................................................................................................... 4-13
Item and Task Development .............................................................................................................. 4-14
Item and Task Specifications ......................................................................................................... 4-14
Performance Task Design .............................................................................................................. 4-16
The Item/task Pool Specification................................................................................................... 4-17
Item Writing ..................................................................................................................................... 4-18
Item Reviews ................................................................................................................................... 4-19
Field Testing .................................................................................................................................... 4-20
Composition of Summative Item Pools ............................................................................................. 4-22
Content Alignment .............................................................................................................................. 4-31
Fordham/HumRRO study ............................................................................................................... 4-32
Summary of Test Design .................................................................................................................... 4-33
References .......................................................................................................................................... 4-34
Chapter 5 : Scores, Scales and Norms ................................................................................................... 5-1
Introduction ........................................................................................................................................... 5-2
Item Response Theory .......................................................................................................................... 5-2
Calibration and Scaling .................................................................................................................... 5-3
Vertical Scale..................................................................................................................................... 5-4
Transforming the Theta Metric to the Scale Score ......................................................................... 5-4
Minimum and Maximum Scale Scores ............................................................................................ 5-5
Achievement-Level Setting ................................................................................................................... 5-6
Results for the 2015-2016 Assessments ........................................................................................... 5-8
Overall Results .................................................................................................................................. 5-9
Claim-Level Results ........................................................................................................................ 5-16
Percentile Tables for Overall Scale Scores ................................................................................... 5-42
Percentile Tables for Claim-level Scale Scores ............................................................................. 5-42
Modes of Administration ................................................................................................................ 5-81
References .......................................................................................................................................... 5-96
Smarter Balanced 2015–16 Summative Assessment Technical Report
Introduction
iv
Chapter 6 : Test Administration ............................................................................................................... 6-1
Introduction ........................................................................................................................................... 6-2
Test Administration ............................................................................................................................... 6-2
Session Time ..................................................................................................................................... 6-2
Test Administration Manual ................................................................................................................. 6-3
Clear Directions to Ensure Uniform Administration ........................................................................ 6-4
Detailed Instructions for Test Takers .............................................................................................. 6-4
Responsibilities of Test Administrators ........................................................................................... 6-5
Tools, Designated Supports, and Accommodations ....................................................................... 6-5
Item Exposure Rates............................................................................................................................. 6-6
Blueprint Fidelity ................................................................................................................................... 6-9
Spring 2015 Embedded Field Test Results ...................................................................................... 6-10
Machine-Scored Items .................................................................................................................... 6-10
Hand-Scored Items ......................................................................................................................... 6-17
Spring 2015 Embedded Field Test Results .................................................................................. 6-18
References .......................................................................................................................................... 6-19
Chapter 7 : Reporting and Interpretation ................................................................................................ 7-1
Introduction ........................................................................................................................................... 7-2
Overall Test Scores ............................................................................................................................... 7-2
Sub-scores ............................................................................................................................................. 7-3
Types of Reports ................................................................................................................................... 7-5
Individual Student Report (ISR) ....................................................................................................... 7-5
Lists.................................................................................................................................................... 7-6
Aggregate Reports ............................................................................................................................ 7-7
Data Downloads .................................................................................................................................... 7-7
Summary ............................................................................................................................................... 7-8
References ............................................................................................................................................ 7-9
Smarter Balanced 2015–16 Summative Assessment Technical Report
Introduction
v
Introduction and Overview
Overview
The Smarter Balanced Assessment Consortium’s (Smarter Balanced) Assessment System includes a
set of balanced components that are designed to meet a diversity of students’ needs across all of
the Consortium’s members. This system provides valid, reliable, and fair assessments of the deep
disciplinary understanding and higher-order thinking skills increasingly demanded by a knowledge-
based global economy. The system is based on the belief that assessment must support ongoing
improvements in instruction and learning experiences for students that lead to outcomes valued by
all stakeholders. Smarter Balanced supports the goals of its members who seek to ensure that all
students leave high school prepared for postsecondary success in college or a career through a
planned sequence of educational experiences and opportunities. The system was grounded in the
strong foundational assessments, policies and procedures of its members including supports and
resources from institutions of higher education (IHEs) and workplace representatives. The
Consortium expanded on these proven successes to create a high quality, balanced, multistate
assessment system based on the Common Core State Standards (CCSS) in English language
arts/literacy (ELA/literacy) and mathematics.
The Consortium’s staff provide expert guidance and facilitate member driven decisions regarding the
maintenance and enhancement of the system as required to fulfill its mission to improve teaching
and learning. Smarter Balanced members retain flexibility regarding how to customize the system so
that it may best be used as part of their approach to improving their local educational systems. The
Consortium’s assessment system strategically uses of a variety of item types including performance
tasks to measure the full range of the CCSS. The Consortium also deploys essential resources that
are embedded in the test to ensure accurate assessment of all students, including students with
disabilities, English language learners, and low- and high-performing students. Smarter Balanced
implemented a system that features
• assessment of CCSS using secure adaptive summative assessments that incorporate items that
are deliberatively designed to measure specific content. The assessments include a variety of
item types including technology-enhanced items, items that require constructed response and
performance tasks.
• interim assessments that incorporate items that are developed according to the same processes
as the items incorporated in the summative assessment. The interim assessments are not
secure and provide more flexible administration options to assist educators in determining what
students know and can do in relation to the CCSS.
• a digital library that includes research-supported tools, processes, and practices developed by
experts that support the formative process teachers can use to improve their professional
practices.
• open sourced technology that members can use to deliver assessments and report results to
educators.
Smarter Balanced 2015–16 Summative Assessment Technical Report
Introduction
vi
• cross-member state communications to inform stakeholders about Smarter Balanced activities
and to ensure a common focus on the goal of college- and career-readiness for all students.
The innovative and efficient use of technology serves as a central feature of this balanced
assessment system. Some central notions concerning technology use are that
1. the Smarter Balanced system uses computer adaptive testing to increase the precision and
efficiency of the summative tests,
2. the expanded use of technology enables the development of innovative and realistic item
types that measure student achievement across a wide performance continuum providing
opportunities for educator and administrator professional development and local capacity
building, and
3. through the use of an interoperable electronic platform and leveraging of cross-member
state resources, Smarter Balanced delivers assessments and produces standardized reports
that are cost effective, timely, and useful for a range of audiences in tracking and analyzing
student progress toward college- and career-readiness at the individual student, student
subgroup, classroom, school, district, and state levels.
In summary, the Smarter Balanced learning and assessment system is grounded in a sound theory
of action. This system promotes research-supported classroom practice and incorporates a balanced
set of technology-enabled tools, innovative assessments, and classroom support materials intended
to work coherently to facilitate teaching and learning.
Technical Report Approach
The intent of this report is to provide comprehensive and detailed evidence in support of the validity
of Smarter Balanced assessment program. This report focuses on summative tests and will be
supplemented with information about interim tests. Information about the overall system is provided
to provide context. At the outset, it should be recognized that demonstration of validity is an ongoing
process. Validity evidence provided here includes evidence from the first year of operational testing,
referencing initial pilot and field test phases as needed.
Because the consortium is comprised of members who contract separately for test delivery and
scoring and have varied practices for test administration, some evidence of validity comes from the
member, not from the Consortium. This will be noted throughout this report. In some cases (e.g., the
Online Test Administration Manual), the consortium provides a customizable template or a guidance
document, that allows for members to document their test administration practices.
To inform the Consortium, the Standards for Educational and Psychological Testing (American
Educational Research Association [AERA], American Psychological Association [APA], & National
Council on Measurement in Education [NCME], 2014), hereafter referred to as the Standards, was
used as the foundation for developing the necessary validity evidence. Also referenced is the U.S.
Department of Education (U.S. DOE) Peer Review of State Assessment Systems Non-Regulatory
Guidance for States for Meeting Requirements of the Elementary and Secondary Education Act of
1965 (2015), which stipulates the requirements for assessment programs to receive federal
approval under current ESEA legislation. With respect to Smarter Balanced, this information is
Smarter Balanced 2015–16 Summative Assessment Technical Report
Introduction
vii
necessary for understanding the degree to which the Consortium is meeting its goals, and in some
cases, what further tasks remain to improve the system as it evolves operationally.
Peer Review Guidelines and Established Standards
Among the principles underlying the Smarter Balanced theory of action is adherence “to established
professional standards” (Smarter Balanced, 2010, p. 33). In addition to adhering to the AERA et al.
(2014) Standards, the Consortium will also meet selected requirements of the U.S. DOE peer review
process for ESEA assessments. There is a great deal of overlap between the AERA et al. (2014)
Standards and the U.S. DOE Peer Review Guidance. However, the Guidance stipulates many
important requirements. In particular, to meet these requirements the validity evidence and the
ongoing research agenda should include
• evidence concerning the purpose of an assessment system and studies that support the validity
of using results from the assessment system based on their stated purpose and use,
• strong correlations of test and item scores, with relevant measures of academic achievement
and weak correlations with irrelevant characteristics, such as demographics (i.e., convergent and
discriminant validity),
• documentation of the definitions for cut scores and the rationale and procedures for establishing
them,
• evidence concerning the precision of the cut scores and consistency of student classification,
• evidence of sufficient levels of reliability for the overall population and for each targeted
subpopulation,
• evidence of content alignment over time through quality control reviews,
• evidence of comprehensive alignment and measurement of the full range of content standards,
Depth of Knowledge, and cognitive complexity,
• evidence that the assessment plan and test specifications describe how all content standards
are assessed and how the domain is sampled that lead to valid inferences about student
performance on the standards, both individually and aggregated,
• scores that reflect the full range of achievement standards,
• documentation that describes how the assessments consist of a coherent system across grades
and subjects including studies establishing vertical scales, and
• identification of how assessments provide information on the progress of students.
These characteristics of high-quality assessment systems were given consideration in the
development of the Smarter Balanced Assessment System to provide evidence that assessments
meet these high standards. The Theory of Action and primary purposes and goals of Smarter
Balanced are briefly described below.
Smarter Balanced 2015–16 Summative Assessment Technical Report
Introduction
viii
Overview and Background of the Smarter Balanced Theory of Action
The Smarter Balanced Assessment Consortium supports the development and implementation of
learning and assessment systems to reshape education in member states in order to improve
student outcomes. Through expanded use of technology and targeted professional development, the
Consortium’s Theory of Action calls for the integration of learning and assessment systems, leading
to more informed decision-making and higher-quality instruction and ultimately increasing the
number of students who are well prepared for college and careers.
The ultimate goal of Smarter Balanced is to ensure that all students leave high school prepared for
postsecondary success in college or a career through increased student learning and improved
teaching. This approach suggests that enhanced learning will result from high-quality assessments
that support ongoing improvements in instruction and learning. A quality assessment system
strategically “balances” summative, interim, and formative components (Darling-Hammond &
Pecheone, 2010). An assessment system must provide valid measurement across the full range of
performance on common academic content, including assessment of deep disciplinary
understanding and higher-order thinking skills increasingly demanded by a knowledge-based
economy.
Six Principles of Smarter Balanced Underlying the Theory of Action
The Smarter Balanced assessment is guided by a set of six principles shared by systems in high-
achieving nations and a number of high-achieving states in the U.S.
1. Assessments are grounded in a thoughtful, standards-based curriculum and managed as
part of an integrated system of standards, curriculum, assessment, instruction, and teacher
development. Curriculum and assessments are organized around a well-defined set of
learning progressions along multiple dimensions within subject areas. Formative and
interim/benchmark assessments and associated support tools are conceptualized in tandem
with summative assessments; all of them are linked to the CCSS and supported by a unified
technology platform.
2. Assessments produce evidence of student performance on challenging tasks that evaluate
the CCSS. Instruction and assessments seek to teach and evaluate knowledge and skills that
generalize and can transfer to higher education and multiple work domains. These
assessments emphasize deep knowledge of core concepts and ideas within and across the
disciplines—along with analysis, synthesis, problem solving, communication, and critical
thinking—thereby requiring a focus on complex performances as well as on specific concepts,
facts, and skills.
3. Teachers are integrally involved in the development and scoring of assessments. While many
assessment components are efficiently scored with computer assistance, teachers must also
be involved in the formative and summative assessment systems so that they understand
and can teach in a manner that is consistent with the full intent of the standards while
becoming more skilled in their own classroom assessment practices.
4. The development and implementation of the assessment system is a state-led effort with a
transparent and inclusive governance structure. Assessments are structured to improve
Smarter Balanced 2015–16 Summative Assessment Technical Report
Introduction
ix
teaching and learning. Assessments as, of, and for learning are designed to develop
understanding of learning standards, what constitutes high-quality work, to what degree is
growth occurring, and what is needed for further student learning.
5. Assessment, reporting, and accountability systems provide useful information on multiple
measures that is educative for all Stakeholders. Reporting of assessment results is timely
and meaningful—offering specific information about areas of performance so that teachers
can follow up with targeted instruction, students can better target their own efforts, and
administrators and policymakers can fully understand what students know and can do—in
order to guide curriculum and professional development decisions.
6. Design and implementation strategies adhere to established professional standards. The
development of an integrated, balanced assessment system is an enormous undertaking,
requiring commitment to established quality standards in order for the system to be credible,
fair, and technically sound. Smarter Balanced continues to be committed to developing an
assessment system that meets critical elements required by US DOE Peer Review, relying
heavily on the Standards as its core resource for quality design.
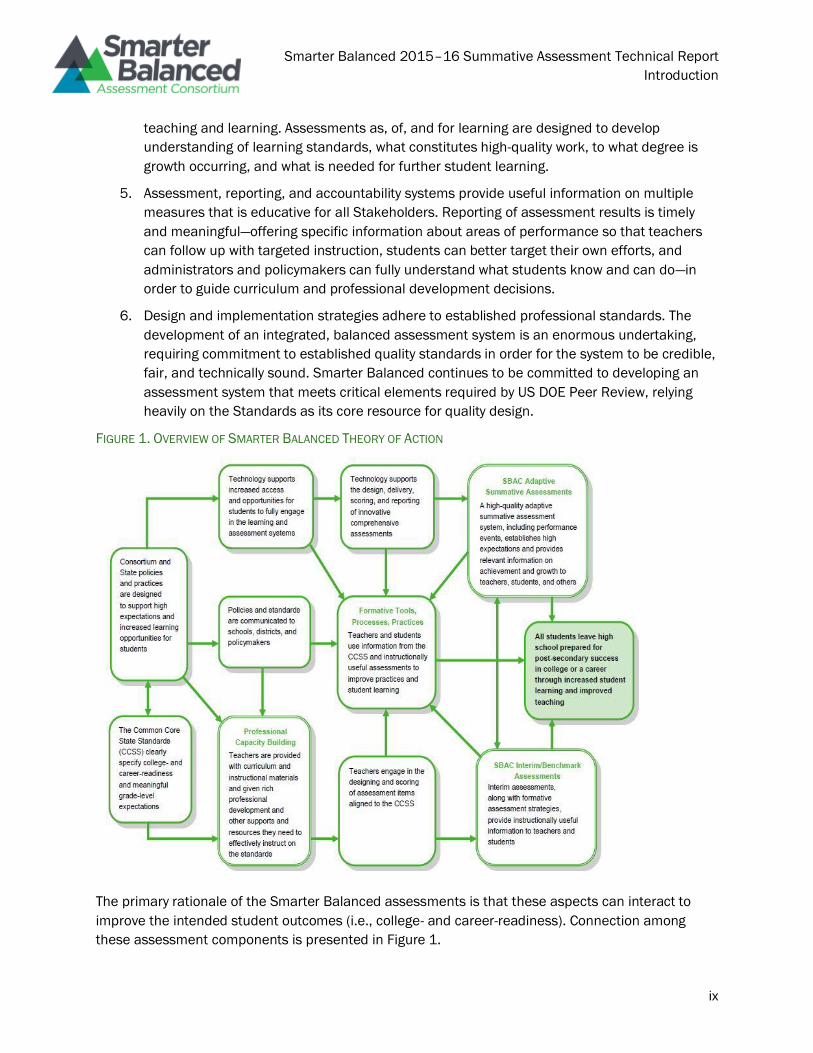
FIGURE 1. OVERVIEW OF SMARTER BALANCED THEORY OF ACTION
The primary rationale of the Smarter Balanced assessments is that these aspects can interact to
improve the intended student outcomes (i.e., college- and career-readiness). Connection among
these assessment components is presented in Figure 1.
Smarter Balanced 2015–16 Summative Assessment Technical Report
Introduction
x
Purposes for the Smarter Balanced Assessment System
The Smarter Balanced purpose statements refer to three categories: (a) summative assessments, (b)
interim assessments, and (c) formative assessment resources.
The purposes of the Smarter Balanced summative assessments are to provide valid, reliable, and
fair information about
• students’ ELA/literacy and mathematics achievement with respect those CCSS measured by the
ELA/literacy and mathematics summative assessments in grades 3 to 8 and high school,
• whether students prior to grade 11 have demonstrated sufficient academic proficiency in
ELA/literacy and mathematics to be on track for achieving college readiness,
• whether grade 11 students have sufficient academic proficiency in ELA/literacy and
mathematics to be ready to take credit-bearing, transferable college courses after completing
their high school coursework,
• students’ annual progress toward college- and career-readiness in ELA/literacy and
mathematics,
• how instruction can be improved at the classroom, school, district, and state levels,
• students’ ELA/literacy and mathematics proficiencies for federal accountability purposes and
potentially for state and local accountability systems, and
• students’ achievement in ELA/literacy and mathematics that is equitable for all students and
subgroups of students.
This report provides technical information about the summative assessments, but the purposes of
interim assessments and formative resources are given here to provide context for summative
assessments as a component of the assessment system.
The purposes of the Smarter Balanced interim assessments are to provide valid, reliable, and fair
information about
• student progress toward mastery of the skills in ELA/literacy and mathematics measured by the
summative assessment,
• student performance at the Claim or cluster of Assessment Targets so teachers and
administrators can track student progress throughout the year and adjust instruction
accordingly,
• individual and group (e.g., school, district) performance at the Claim level in ELA/literacy and
mathematics to determine whether teaching and learning are on target,
• teacher-moderated scoring of performance events as a professional development vehicle to
enhance teacher capacity to evaluate student work aligned to the standards, and
• student progress toward the mastery of skills measured in ELA/literacy and mathematics across
all students and subgroups.
Smarter Balanced 2015–16 Summative Assessment Technical Report
Introduction
xi
The purposes of the Smarter Balanced formative assessment resources are to provide measurement
tools and resources to
• improve teaching and learning,
• provide resources to teachers to help them monitor their students’ progress throughout the
school year,
• illustrate how teachers and other educators can use assessment data to engage students in
monitoring their own learning,
• help teachers and other educators align instruction, curricula, and assessments,
• assist teachers and other educators in using the summative and interim assessments to improve
instruction at the individual and classroom levels, and
• offer professional development and resources for how to use assessment information to improve
teacher decision-making in the classroom.
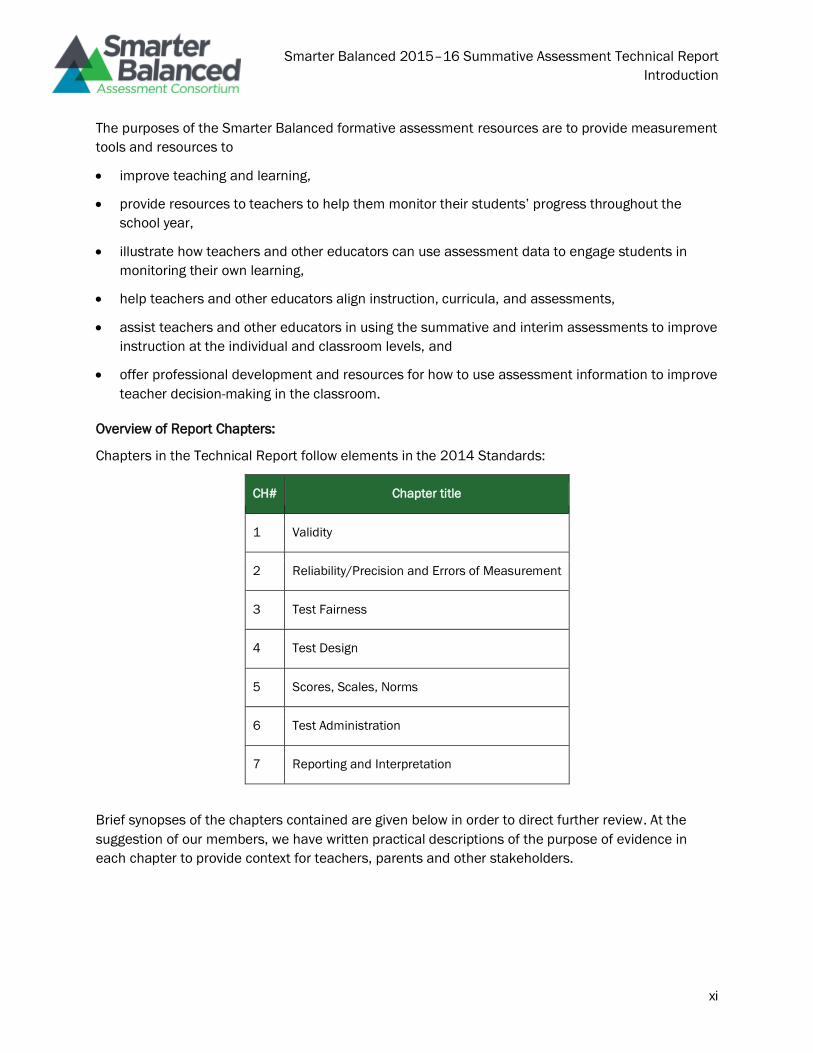
Overview of Report Chapters:
Chapters in the Technical Report follow elements in the 2014 Standards:
CH# Chapter title
1 Validity
2 Reliability/Precision and Errors of Measurement
3 Test Fairness
4 Test Design
5 Scores, Scales, Norms
6 Test Administration
7 Reporting and Interpretation
Brief synopses of the chapters contained are given below in order to direct further review. At the
suggestion of our members, we have written practical descriptions of the purpose of evidence in
each chapter to provide context for teachers, parents and other stakeholders.
Smarter Balanced 2015–16 Summative Assessment Technical Report
Introduction
xii
Chapter 1: Validity
In a sense, all of the information in this Technical Report provides validity evidence. This chapter
provides information about test purposes and the overall approach to showing how scores are
appropriate for those purposes.
Description: This chapter provides information in answer to the following questions. For what
purposes was the summative assessment designed to be used? What evidence shows that test
scores are appropriate for these uses? What are the intended test score interpretations for specific
uses?
Content: Chapter 1 provides the statement of test purposes; valid score uses and
interpretations; outline of validity evidence in the rest of the report.
Chapter 2: Reliability/Precision and Errors of Measurement
Information about simulated and operational performance of the test in delivering scores is provided
in this chapter. The degree of accuracy and precision of scores contributes to evidence about
appropriate test score interpretation and use. Decisions must be made with full knowledge of
measurement error and reliability.
Description: How do we know that scores are accurate? What kind of instructional decisions
does precision support? Are scores accurate enough to evaluate change over time in growth
models? How do we know they are stable and have the same meaning for all students?
Content: Chapter 2 presents simulated and operational conditional standard errors of
measurement, marginal and fixed-form reliability, test information curves; observed decision
consistency and accuracy; simulation results for bias and theta recovery.
Chapter 3: Test Fairness
Test fairness concerns whether score interpretations are valid for all relevant subgroups that
minimizes construct irrelevant variance. The evidence for test fairness can be logical (e.g., bias
review of items) or statistical in nature (e.g., differential item functioning) and includes availability of
resources that increase participation and improve assessment of skills.
Description: How do we know that the test is fair to all students? How was fairness
guaranteed in developing test questions and tasks? How is the test administered so that each
student can demonstrate their skills?
Content: Chapter 3 presents the Smarter Balanced Conceptual Framework for Usability,
Accessibility, and Accommodations, bias and sensitivity reviews conducted during item and task
development and differential item functioning (DIF) analysis.
Chapter 4: Test Design
This chapter provides information pertaining to the content validity of the Smarter Balanced
assessment system. It describes the how tasks and items are structured to achieve domain
coverage. For Smarter Balanced tests, test design includes the relationship of claims and targets to
the underlying CCSS and how adaptive and performance components work together. The full test
Smarter Balanced 2015–16 Summative Assessment Technical Report
Introduction
xiii
design also encompasses the delivery algorithm and the method of scoring the test. This chapter
includes a description of item pool and task development supporting test design.
Description: What's on the test? Is it consistent with stated test purposes? Does each
student get a set of questions that addresses content fully? How does each student gets a test with
an appropriate level of difficulty?
Content: Chapter 4 provides evidence that the CCSS address skills required for college and
career readiness. It also describes test structure (claims, targets) and its relationship to the CCSS,
item and task development and alignment studies. Chapter 4 also has information about the
operational blueprints, adaptive algorithm, test scoring method and application and pool analysis.
Chapter: 5 Scores, Scales and Norms
This chapter describes the steps to adopting a psychometric model and how Smarter Balanced
scales were constructed. It also covers the achievement level setting process and resulting cut
scores. Normative information about the Consortium population is also included.
Description: What do the scores mean? How can we know that descriptions of achievement
levels match criteria for those levels? Are criteria stable so teachers can work toward a fixed goal?
How does a student's score compare to expected criteria; to those of his or her peers?
Content: Chapter 5 summarizes how scales were established in pilot and field test stages. It
describes how cut scores were developed from foundational achievement levels that delineated
progress toward career and college readiness. It provides logit-to-scale transformations. Normative
information, including means, percentiles and achievement level distribution is displayed.
Chapter 6: Test Administration
Part of test validity rests on the assumption that assessments are given in a standard manner.
Because Smarter Balanced tests are given on such a large scale, in different policy and operational
contexts, the Consortium provides a common administration template that members customize for
specific use. This chapter includes analysis of field test items presented during test administration.
Description: What are conditions for test administration to assure that every student was
afforded the same chance for success? How was the test administered to allow for accessibility for
all students? Was the test administration secure? Do test records show that the test was
administered as intended? Were field tested items successful?
Content: Chapter 6 describes the customizable Smarter Balanced Online Test Administration
Manual. It presents operational item exposure rates and blueprint fidelity. Embedded field test
results, including item scoring processes and inter-rater reliability of field tested items are shown.
Chapter 7: Reporting and Interpretation
Examples of Smarter Balanced reports are shown here, along with an explanation of report
elements. This chapter discusses intended uses of report information.
Description: What information do Smarter Balance reports contain? What do scores mean?
How can the reports best be used by teachers and parents?
Smarter Balanced 2015–16 Summative Assessment Technical Report
Introduction
xiv
Content: Chapter 7 provides examples of the Smarter Balanced suite of reports and
interpretive information.
Acknowledgments
Outside Groups and Organizations that Collaborated with the Smarter Balanced Assessment
Consortium
Below is a partial list of individuals and groups that contributed time and expertise to the work of the
Consortium.
2014-15 Technical Advisory Committee.
• Jamal Abedi, Ph.D. UC Davis/CRESST
• Randy Bennett, Ph.D. ETS
• Derek C. Briggs, Ph.D. University of Colorado
• Gregory J. Cizek, Ph.D. University of North Carolina
• David T. Conley, Ph.D. University of Oregon
• Linda Darling-Hammond, Ph.D. Stanford University
• Brian Gong, Ph.D. The Center for Assessment
• Edward Haertel, Ph.D. Stanford University
• Joan Herman, Ph.D. UCLA/CRESST
• G. Gage Kingsbury, Ph.D. Psychometric Consultant
• James W. Pellegrino, Ph.D. University of Illinois, Chicago
• W. James Popham, Ph.D. UCLA, Emeritus
• Joseph Ryan, Ph.D. Arizona State University
• Martha Thurlow, Ph.D. University of Minnesota/NCEO
Contributors to the Accessibility Accommodations Framework.
In February 2012, the Smarter Balanced Assessment Consortium Accessibility and Accommodations
Work Group began work on developing the Accessibility and Accommodations Framework. The
primary goal of this effort was to develop uniform accessibility and accommodation policies and
guidelines that will be adopted and used by all Smarter Balanced members. Recognizing the diversity
in policies and practices that currently exist across member states, the legal issues that must be
addressed by the policies, the mixed research findings regarding many accommodation practices,
and the differences in opinion regarding accommodation policies, the work group undertook an
iterative process designed to gather input from a large and diverse audience. This effort began by
contracting with Measured Progress and its partners, who included:
Smarter Balanced 2015–16 Summative Assessment Technical Report
Introduction
xv
• Members of the Measured Progress Innovation Lab who conducted work in accessibility in digital
environments, developed the Accessible Test Design model, and were leaders in developing the
Accessible Portable Item Protocol (APIP) Standard,
• Experts at Educational Testing Service who have conducted a variety of studies on test
accommodations and accessibility for students with disabilities and for students who are English
language learners, and who have developed industry-recognized guidelines for accessibility in
the context of assessment,
• Experts at the George Washington University Center for Equity and Excellence in Education, who
are nationally recognized experts in accessible assessment for students who are English
language learners and who have worked with several states to develop policies on test
accommodations for students who are English language learners, and
• Experts affiliated with the National Center on Educational Outcomes who have conducted
extensive reviews of state test accommodation policies, worked with the Assessing Special
Education Students (ASES) work group of the Council of Chief State School Officers (CCSSO) to
develop test accommodation policies, and closely monitored research on test accommodations.
In addition to these partners, an expert panel was formed composed of the following members:
• Jamal Abedi assessment of English language learners, UC Davis/CRESST,
• Martha Thurlow assessment of students with disabilities, University of
Minnesota/NCEO,
• Sheryl Lazarus test accommodations for students with disabilities, University of
Minnesota/NCEO,
• Stephanie Cawthon accommodations for students who communicate in American Sign
Language, University of Texas at Austin,
• Richard Jackson accommodations for students with visual impairments, Boston
College,
• Rebecca Kopriva assessment of students who are English language learners,
Wisconsin Center for Education Research, and
• Stephen Sireci validity of test accommodations, University of Massachusetts
Amherst/CEA.
Other Acknowledgments.
This technical report leveraged the Smarter Balanced Comprehensive Research Agenda by Stephen
G. Sireci (2012) as the primary validity framework and sources of evidence. Input was provided on
critical aspects of the program and this report by the Smarter Balanced Technical Advisory
Committee.
Smarter Balanced 2015–16 Summative Assessment Technical Report
Introduction
xvi
References
American Educational Research Association, American Psychological Association, & National Council
on Measurement in Education. (2014). Standards for Educational and Psychological
Testing. Washington, D.C.: American Educational Research Association.
Darling‐Hammond, L., & Pecheone, R. (2010). Developing an Internationally Comparable Balanced
Assessment System that Supports High‐Quality Learning. Retrieved from
https://www.ets.org/Media/Research/pdf/Darling-HammondPechoneSystemModel.pdf .
Smarter Balanced Assessment Consortium (2010, June 23). Race to the top assessment program
application for new grants: Comprehensive assessment systems. CFDA Number: 84.395B.
OMB Control Number 1810-0699. Retrieved from
http://www.smarterbalanced.org/assessments/development/additional-technical-
documentation/
U.S. Department of Education (2015, September). Peer review of state assessment systems non-
regulatory guidance for states for meeting requirements of the Elementary and Secondary
Education Act of 1965. Washington, DC: Author.
Sireci, S. G. (2012). Smarter Balanced Assessment Consortium: Comprehensive research agenda.
Los Angeles, CA: Smarter Balanced Assessment Consortium. Retrieved from
http://www.smarterbalanced.org/assessments/development/additional-technical-
documentation/

Smarter Balanced 2015–16 Summative Assessment Technical Report
Chapter 1: Validity
1-1
Chapter 1: Validity
Smarter Balanced 2015–16 Summative Assessment Technical Report
Chapter 1: Validity
1-2
Introduction
Validity refers to the degree to which each interpretation or use of a test score is supported by the
accumulated evidence (American Educational Research Association [AERA], American Psychological
Association [APA], & National Council on Measurement in Education [NCME], 2014; ETS, 2002). It
constitutes the central notion underlying the development, administration, and scoring of a test and
the uses and interpretations of test scores. Validation is the process of accumulating evidence to
support each proposed score interpretation or use. This validation process does not rely on a single
study or gathering one type of evidence. Rather, validation involves multiple investigations and
different kinds of supporting evidence (AERA, APA, & NCME, 2014; Cronbach, 1971; ETS, 2002;
Kane, 2006). It begins with test design and is implicit throughout the assessment process, which
includes development, field-testing and analyses of items, test scaling and linking, scoring, and
reporting. This chapter provides an evaluative framework for the validation of the Smarter Balanced
summative assessment. It points the reader to supporting evidence in other parts of the technical
report and other sources that seek to demonstrate that the Smarter Balanced Assessment System
adheres to guidelines for fair and high quality assessment.
The validity argument begins with a statement of summative assessment intended purposes,
followed by the evidentiary framework supporting the validity argument. Evidence is organized
around the principles in the AERA, APA, and NCME’s Standards for Educational and Psychological
Testing (2014), hereafter referred to as the Standards, and the Smarter Balanced Assessment
Consortium: Comprehensive Research Agenda (Sireci, 2012).
The Standards are considered to be “the most authoritative statement of professional consensus
regarding the development and evaluation of educational and psychological tests” (Linn, 2006, p.
27) currently available. The 2014 Standards differ from earlier versions in the emphasis given to the
increased prominence of technology in testing, including computer adaptive testing (CAT). Dr. Sireci
based his research agenda work on the Standards and his work in operational interpretation of
validity argumentation (Sireci, 2013).
Purposes of the Smarter Balanced System for Summative Assessments
To derive the statements of purpose listed below, panels consisting of Smarter Balanced leadership,
including the Executive Director, Smarter Balanced staff, Dr. Stephen Sireci and key personnel from
Consortium states were convened.
The purposes of the Smarter Balanced summative assessments are to provide valid, reliable, and
fair information about:
7. Students’ ELA/literacy and mathematics achievement with respect to those CCSS measured
by the ELA/literacy and mathematics summative assessments in grades 3 to 8 and high
school.
8. Whether students prior to grade 11 have demonstrated sufficient academic proficiency in
ELA/literacy and mathematics to be on track for achieving college readiness.
Smarter Balanced 2015–16 Summative Assessment Technical Report
Chapter 1: Validity
1-3
9. Whether grade 11 students have sufficient academic proficiency in ELA/literacy and
mathematics to be ready to take credit-bearing, transferable college courses after
completing their high school coursework.
10. Students’ annual progress toward college and career readiness in ELA/literacy and
mathematics.
11. How instruction can be improved at the classroom, school, district, and state levels.
12. Students’ ELA/literacy and mathematics proficiencies for federal accountability purposes
and potentially for state and local accountability systems.
13. Students’ achievement in ELA/literacy and mathematics that is equitable for all students and
subgroups of students.
Summary of Validity Argument
The crux of the argument presented here is that the technical quality of the summative assessments
supports these purposes. The Common Core State Standards (CCSS), which have been adopted by
Smarter Balanced members, are widely recognized content standards for college and career
readiness in high school grades, and for being on track for college and career readiness in lower
grades (Conley et al 2011). Content specifications and test blueprints show that the Smarter
Balanced summative assessments essentially cover the breadth and depth of assessable standards.
Content experts developed expanded item types that allow response processes that reveal skills and
knowledge. Most of each content area test is delivered adaptively so that blueprint requirements are
met, scores are more accurate, and student experience is enhanced. Summative test scores are
suitable for use in a variety of member accountability systems. Claim-level sub-score reports
indicate directions for gaining further instructional information through the interim system or
classroom observation.
The consortium chose its psychometric model after investigating a variety of models and establishing
a clear structural relationship across grades. The vertical scale was constructed to provide
measurement across grades, facilitating estimates of progress toward career and college readiness.
The appropriateness of Smarter Balanced performance standards as predictors of college and
career readiness in grade 11 and of being on-track for readiness in grades three through eight was
established by an extended achievement level setting process. The process began with authoring
achievement levels and continued through a rigorous process of setting achievement criteria. These
processes involved participants from member higher education systems to ensure that readiness
criteria represented skills needed for success in first year college courses.
This is a high-level view of the validity argument. A detailed description of evidence appears below.
Validity Framework for Summative Assessments
The Standards describe a process of validation that consists of developing a sufficiently convincing
argument, based on empirical evidence, that the interpretations and actions based on test scores
are sound. Kane (1992, 2006) characterized this process as a validity argument, which is consistent
with the validation process described by the 2014 Standards.
Smarter Balanced 2015–16 Summative Assessment Technical Report
Chapter 1: Validity
1-4
A sound validity argument integrates various strands of evidence into a coherent
account of the degree to which existing evidence and theory support the intended
interpretation of test scores for specific uses. Ultimately, the validity of an intended
interpretation of test scores relies on all the available evidence relevant to the
technical quality of a testing system (AERA et al., 2014, p. 21-22).
The validity framework corresponds to validity evidence sources described in the Standards (AERA et
al. 2014, pp. 26-31). They are also the organizing principles for the Smarter Balanced research
framework document (Sireci, 2012). These five sources of validity evidence consist of:
14. Evidence Based on Test Content
15. Evidence Based on Response Processes
16. Evidence Based on Internal Structure
17. Evidence Based on Relations to Other Variables
18. Evidence for Validity and Consequences of Testing.
This Technical Report provides part of the evidence for this framework. As many observers have
noted, validity is an ongoing process with continuous addition of evidence from a variety of
contributors. This report summarizes development and performance of the instrument itself,
addressing test content, response processes and internal structure. Other elements come from
supplemental research projects or third party studies.
As the Standards note, “validation is the joint responsibility of the test developer and the test user.”
(AERA, et. al. 2014, p, 13). The Consortium does not control aspects of test administration and use.
It is comprised of members who deliver the test, score operational items and provide reports.
Members use Smarter Balanced test scores in their own accountability models. In this report,
guidelines for administration and use are documented. For complete validity evidence, member
documentation on specific test administration procedures, reporting, and use should be consulted.
This report does not provide evidence related to the consequences of testing. Ultimate use of test
scores is determined by consortium members. Each member decides the purpose and interpretation
of scores and each has crafted its own system of reporting and accountability. The Consortium
provides information about test content and technical quality, but does not interfere in member use
of scores. The consortium does not endorse or critique member uses.
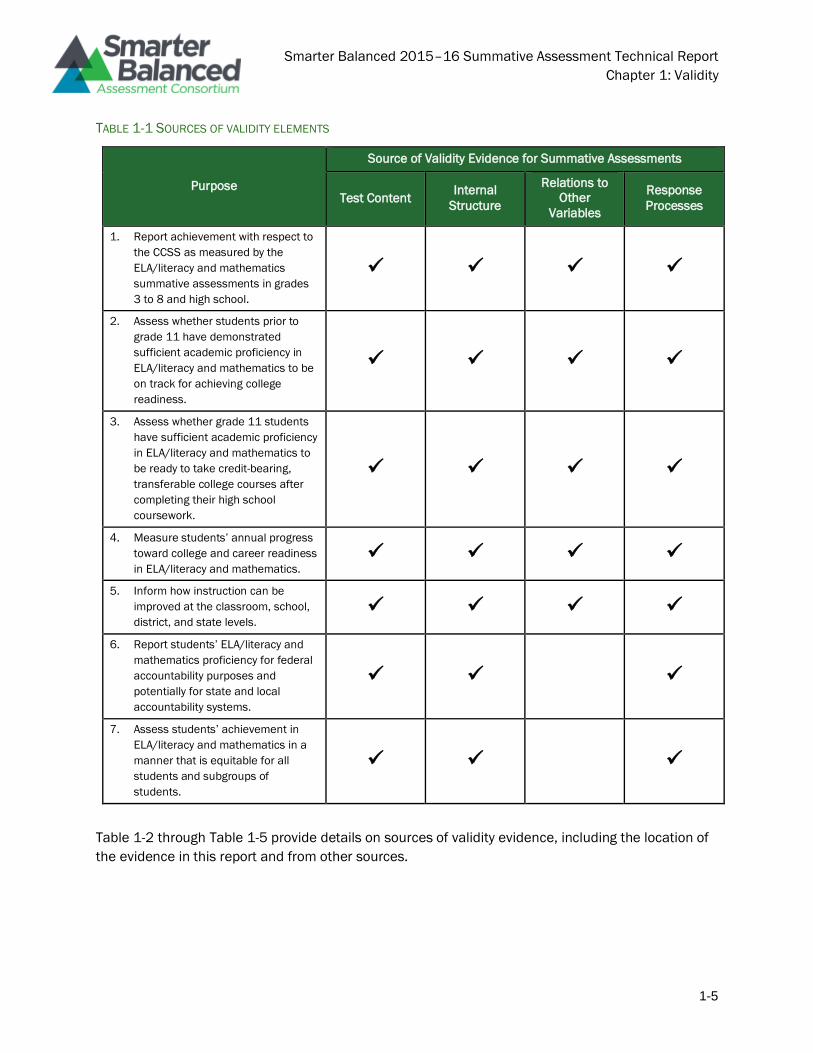
In many cases, validity evidence will come from an outside auditor, such as the federal peer reviewer
process or from an external study. Table 1-1 shows the components of validity covered in this report,
other sources, and future studies.
Smarter Balanced 2015–16 Summative Assessment Technical Report
Chapter 1: Validity
1-5
TABLE 1-1 SOURCES OF VALIDITY ELEMENTS
Purpose
Source of Validity Evidence for Summative Assessments
Test Content Internal
Structure
Relations to
Other
Variables
Response
Processes
1. Report achievement with respect to
the CCSS as measured by the
ELA/literacy and mathematics
summative assessments in grades
3 to 8 and high school.
✓ ✓ ✓ ✓
2. Assess whether students prior to
grade 11 have demonstrated
sufficient academic proficiency in
ELA/literacy and mathematics to be
on track for achieving college
readiness.
✓ ✓ ✓ ✓
3. Assess whether grade 11 students
have sufficient academic proficiency
in ELA/literacy and mathematics to
be ready to take credit-bearing,
transferable college courses after
completing their high school
coursework.
✓ ✓ ✓ ✓
4. Measure students’ annual progress
toward college and career readiness
in ELA/literacy and mathematics. ✓ ✓ ✓ ✓
5. Inform how instruction can be
improved at the classroom, school,
district, and state levels. ✓ ✓ ✓ ✓
6. Report students’ ELA/literacy and
mathematics proficiency for federal
accountability purposes and
potentially for state and local
accountability systems.
✓ ✓ ✓
7. Assess students’ achievement in
ELA/literacy and mathematics in a
manner that is equitable for all
students and subgroups of
students.
✓ ✓ ✓
Table 1-2 through Table 1-5 provide details on sources of validity evidence, including the location of
the evidence in this report and from other sources.
Smarter Balanced 2015–16 Summative Assessment Technical Report
Chapter 1: Validity
1-6
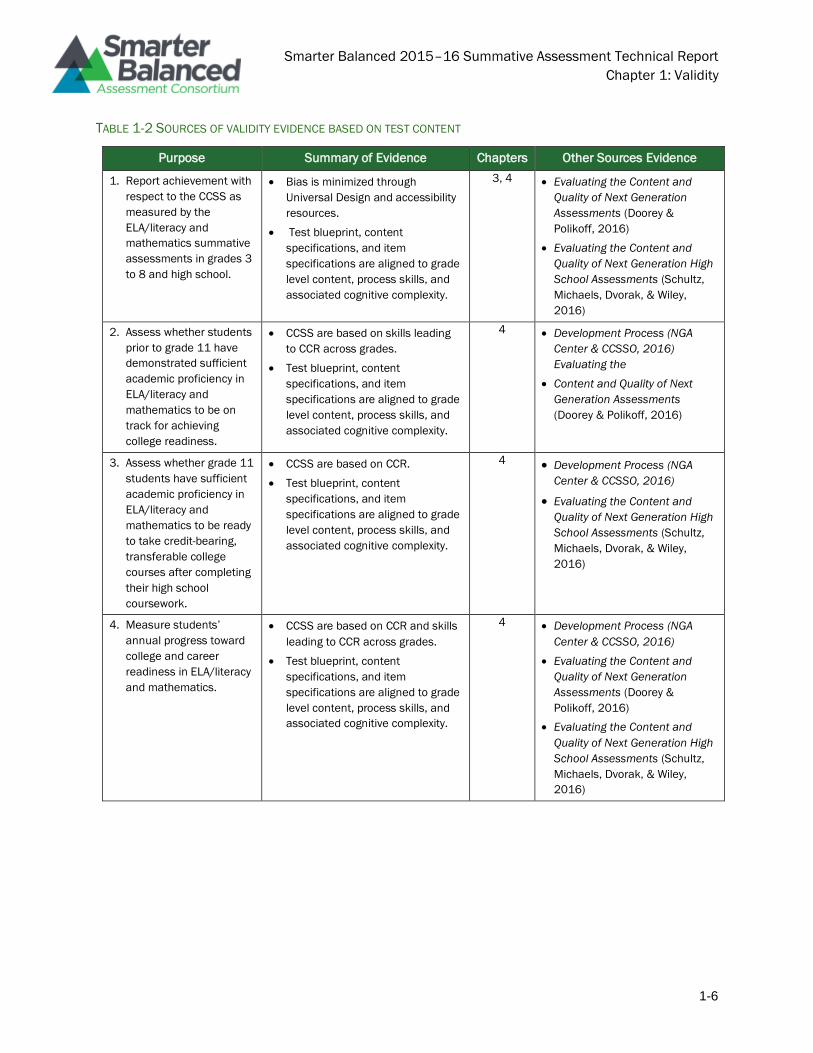
TABLE 1-2 SOURCES OF VALIDITY EVIDENCE BASED ON TEST CONTENT
Purpose Summary of Evidence Chapters Other Sources Evidence
1. Report achievement with
respect to the CCSS as
measured by the
ELA/literacy and
mathematics summative
assessments in grades 3
to 8 and high school.
• Bias is minimized through
Universal Design and accessibility
resources.
• Test blueprint, content
specifications, and item
specifications are aligned to grade
level content, process skills, and
associated cognitive complexity.
3, 4 • Evaluating the Content and
Quality of Next Generation
Assessments (Doorey &
Polikoff, 2016)
• Evaluating the Content and
Quality of Next Generation High
School Assessments (Schultz,
Michaels, Dvorak, & Wiley,
2016)
2. Assess whether students
prior to grade 11 have
demonstrated sufficient
academic proficiency in
ELA/literacy and
mathematics to be on
track for achieving
college readiness.
• CCSS are based on skills leading
to CCR across grades.
• Test blueprint, content
specifications, and item
specifications are aligned to grade
level content, process skills, and
associated cognitive complexity.
4 • Development Process (NGA
Center & CCSSO, 2016)
Evaluating the
• Content and Quality of Next
Generation Assessments
(Doorey & Polikoff, 2016)
3. Assess whether grade 11
students have sufficient
academic proficiency in
ELA/literacy and
mathematics to be ready
to take credit-bearing,
transferable college
courses after completing
their high school
coursework.
• CCSS are based on CCR.
• Test blueprint, content
specifications, and item
specifications are aligned to grade
level content, process skills, and
associated cognitive complexity.
4 • Development Process (NGA
Center & CCSSO, 2016)
• Evaluating the Content and
Quality of Next Generation High
School Assessments (Schultz,
Michaels, Dvorak, & Wiley,
2016)
4. Measure students’
annual progress toward
college and career
readiness in ELA/literacy
and mathematics.
• CCSS are based on CCR and skills
leading to CCR across grades.
• Test blueprint, content
specifications, and item
specifications are aligned to grade
level content, process skills, and
associated cognitive complexity.
4 • Development Process (NGA
Center & CCSSO, 2016)
• Evaluating the Content and
Quality of Next Generation
Assessments (Doorey &
Polikoff, 2016)
• Evaluating the Content and
Quality of Next Generation High
School Assessments (Schultz,
Michaels, Dvorak, & Wiley,
2016)
Smarter Balanced 2015–16 Summative Assessment Technical Report
Chapter 1: Validity
1-7
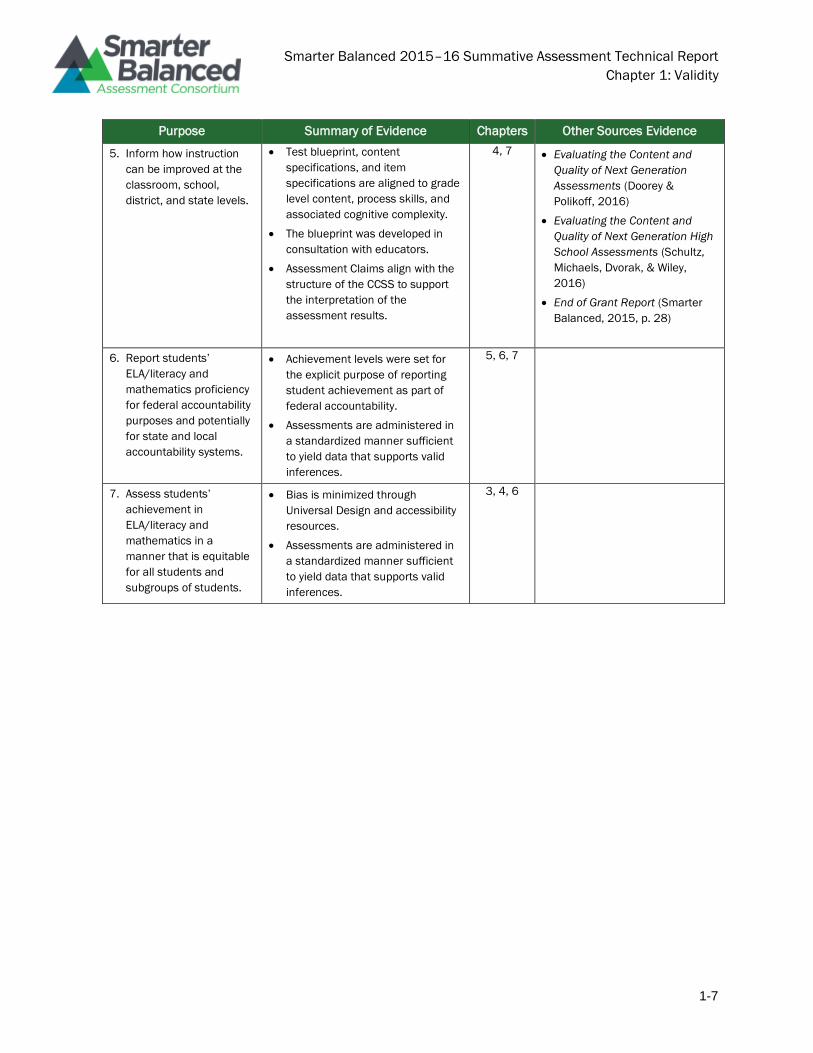
Purpose Summary of Evidence Chapters Other Sources Evidence
5. Inform how instruction
can be improved at the
classroom, school,
district, and state levels.
• Test blueprint, content
specifications, and item
specifications are aligned to grade
level content, process skills, and
associated cognitive complexity.
• The blueprint was developed in
consultation with educators.
• Assessment Claims align with the
structure of the CCSS to support
the interpretation of the
assessment results.
4, 7 • Evaluating the Content and
Quality of Next Generation
Assessments (Doorey &
Polikoff, 2016)
• Evaluating the Content and
Quality of Next Generation High
School Assessments (Schultz,
Michaels, Dvorak, & Wiley,
2016)
• End of Grant Report (Smarter
Balanced, 2015, p. 28)
6. Report students’
ELA/literacy and
mathematics proficiency
for federal accountability
purposes and potentially
for state and local
accountability systems.
• Achievement levels were set for
the explicit purpose of reporting
student achievement as part of
federal accountability.
• Assessments are administered in
a standardized manner sufficient
to yield data that supports valid
inferences.
5, 6, 7
7. Assess students’
achievement in
ELA/literacy and
mathematics in a
manner that is equitable
for all students and
subgroups of students.
• Bias is minimized through
Universal Design and accessibility
resources.
• Assessments are administered in
a standardized manner sufficient
to yield data that supports valid
inferences.
3, 4, 6
Smarter Balanced 2015–16 Summative Assessment Technical Report
Chapter 1: Validity
1-8
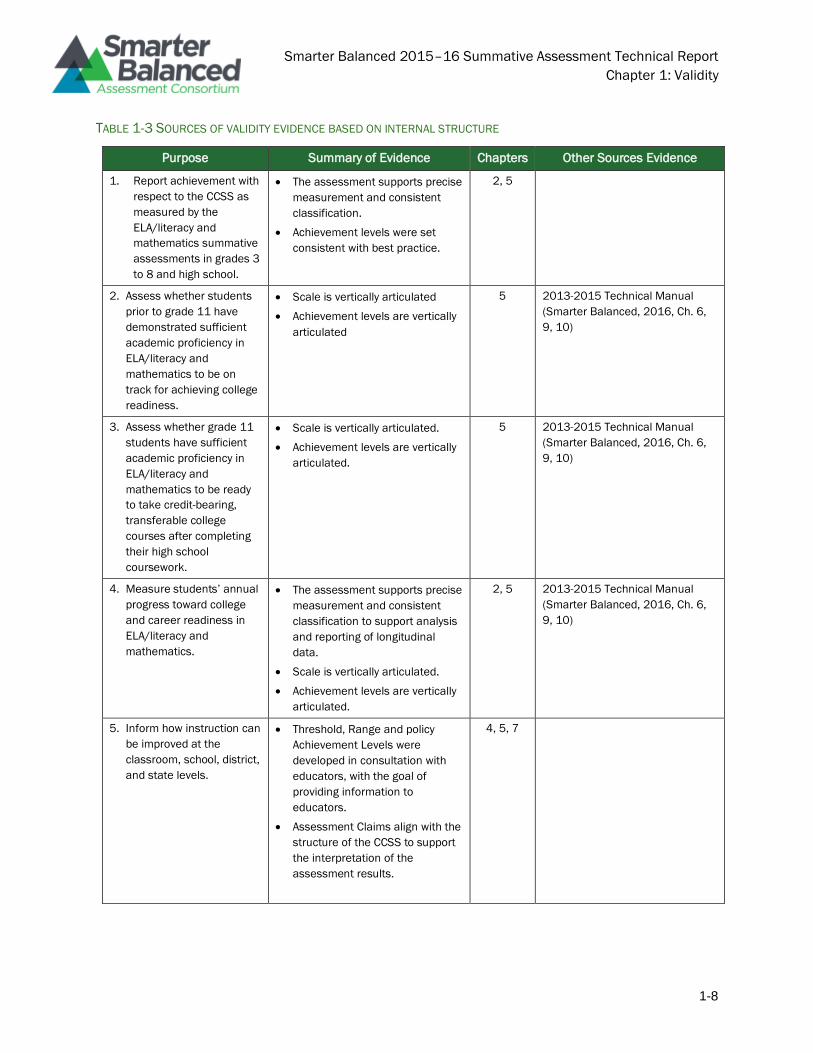
TABLE 1-3 SOURCES OF VALIDITY EVIDENCE BASED ON INTERNAL STRUCTURE
Purpose Summary of Evidence Chapters Other Sources Evidence
1. Report achievement with
respect to the CCSS as
measured by the
ELA/literacy and
mathematics summative
assessments in grades 3
to 8 and high school.
• The assessment supports precise
measurement and consistent
classification.
• Achievement levels were set
consistent with best practice.
2, 5
2. Assess whether students
prior to grade 11 have
demonstrated sufficient
academic proficiency in
ELA/literacy and
mathematics to be on
track for achieving college
readiness.
• Scale is vertically articulated
• Achievement levels are vertically
articulated
5 2013-2015 Technical Manual
(Smarter Balanced, 2016, Ch. 6,
9, 10)
3. Assess whether grade 11
students have sufficient
academic proficiency in
ELA/literacy and
mathematics to be ready
to take credit-bearing,
transferable college
courses after completing
their high school
coursework.
• Scale is vertically articulated.
• Achievement levels are vertically
articulated.
5 2013-2015 Technical Manual
(Smarter Balanced, 2016, Ch. 6,
9, 10)
4. Measure students’ annual
progress toward college
and career readiness in
ELA/literacy and
mathematics.
• The assessment supports precise
measurement and consistent
classification to support analysis
and reporting of longitudinal
data.
• Scale is vertically articulated.
• Achievement levels are vertically
articulated.
2, 5 2013-2015 Technical Manual
(Smarter Balanced, 2016, Ch. 6,
9, 10)
5. Inform how instruction can
be improved at the
classroom, school, district,
and state levels.
• Threshold, Range and policy
Achievement Levels were
developed in consultation with
educators, with the goal of
providing information to
educators.
• Assessment Claims align with the
structure of the CCSS to support
the interpretation of the
assessment results.
4, 5, 7
Smarter Balanced 2015–16 Summative Assessment Technical Report
Chapter 1: Validity
1-9
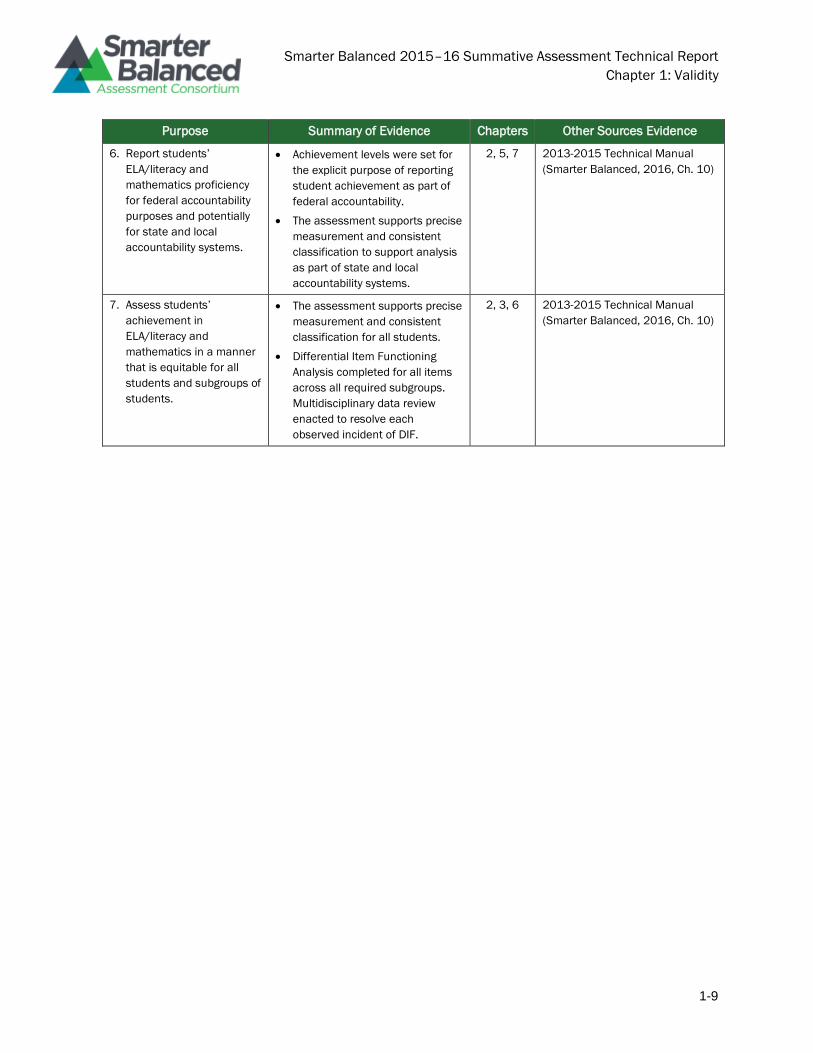
Purpose Summary of Evidence Chapters Other Sources Evidence
6. Report students’
ELA/literacy and
mathematics proficiency
for federal accountability
purposes and potentially
for state and local
accountability systems.
• Achievement levels were set for
the explicit purpose of reporting
student achievement as part of
federal accountability.
• The assessment supports precise
measurement and consistent
classification to support analysis
as part of state and local
accountability systems.
2, 5, 7 2013-2015 Technical Manual
(Smarter Balanced, 2016, Ch. 10)
7. Assess students’
achievement in
ELA/literacy and
mathematics in a manner
that is equitable for all
students and subgroups of
students.
• The assessment supports precise
measurement and consistent
classification for all students.
• Differential Item Functioning
Analysis completed for all items
across all required subgroups.
Multidisciplinary data review
enacted to resolve each
observed incident of DIF.
2, 3, 6 2013-2015 Technical Manual
(Smarter Balanced, 2016, Ch. 10)
Smarter Balanced 2015–16 Summative Assessment Technical Report
Chapter 1: Validity
1-10
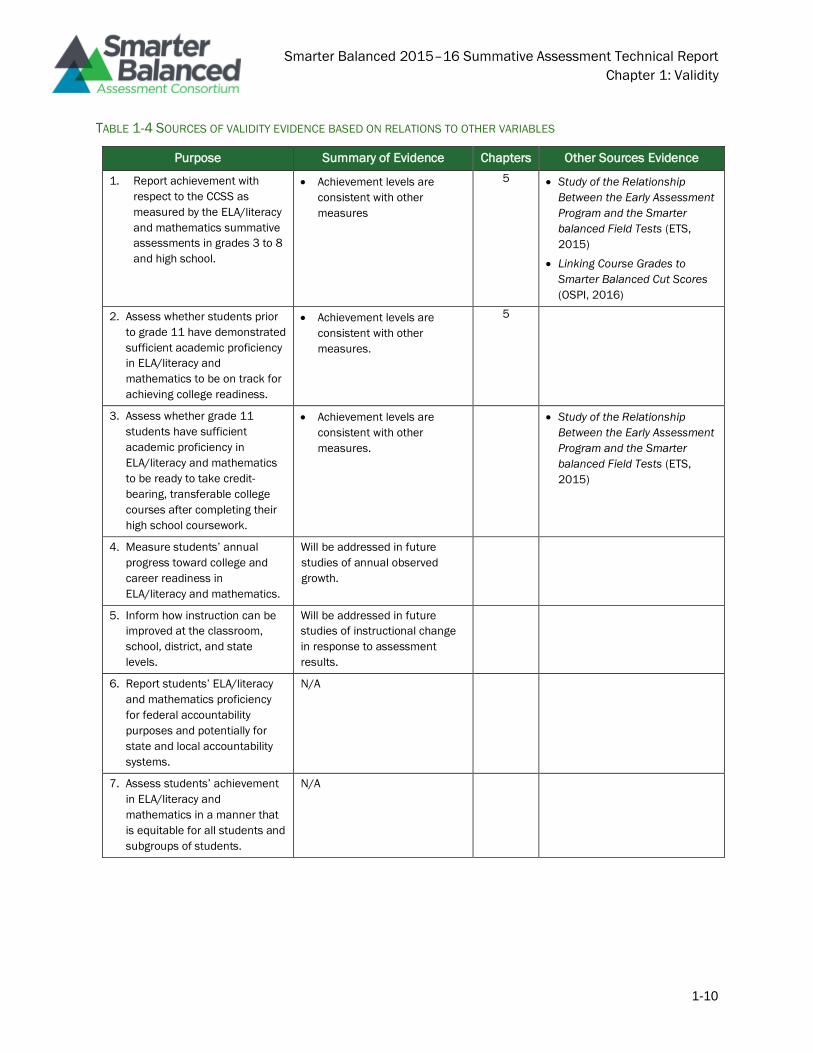
TABLE 1-4 SOURCES OF VALIDITY EVIDENCE BASED ON RELATIONS TO OTHER VARIABLES
Purpose Summary of Evidence Chapters Other Sources Evidence
1. Report achievement with
respect to the CCSS as
measured by the ELA/literacy
and mathematics summative
assessments in grades 3 to 8
and high school.
• Achievement levels are
consistent with other
measures
5 • Study of the Relationship
Between the Early Assessment
Program and the Smarter
balanced Field Tests (ETS,
2015)
• Linking Course Grades to
Smarter Balanced Cut Scores
(OSPI, 2016)
2. Assess whether students prior
to grade 11 have demonstrated
sufficient academic proficiency
in ELA/literacy and
mathematics to be on track for
achieving college readiness.
• Achievement levels are
consistent with other
measures.
5
3. Assess whether grade 11
students have sufficient
academic proficiency in
ELA/literacy and mathematics
to be ready to take credit-
bearing, transferable college
courses after completing their
high school coursework.
• Achievement levels are
consistent with other
measures.
• Study of the Relationship
Between the Early Assessment
Program and the Smarter
balanced Field Tests (ETS,
2015)
4. Measure students’ annual
progress toward college and
career readiness in
ELA/literacy and mathematics.
Will be addressed in future
studies of annual observed
growth.
5. Inform how instruction can be
improved at the classroom,
school, district, and state
levels.
Will be addressed in future
studies of instructional change
in response to assessment
results.
6. Report students’ ELA/literacy
and mathematics proficiency
for federal accountability
purposes and potentially for
state and local accountability
systems.
N/A
7. Assess students’ achievement
in ELA/literacy and
mathematics in a manner that
is equitable for all students and
subgroups of students.
N/A
Smarter Balanced 2015–16 Summative Assessment Technical Report
Chapter 1: Validity
1-11
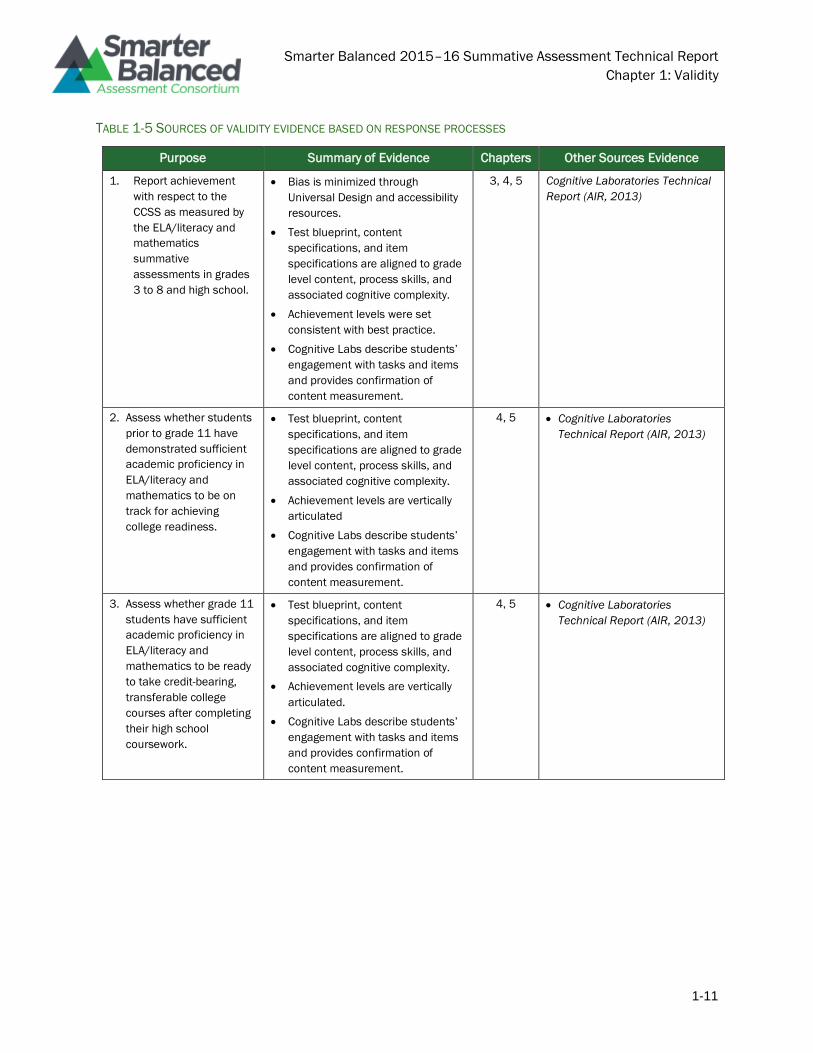
TABLE 1-5 SOURCES OF VALIDITY EVIDENCE BASED ON RESPONSE PROCESSES
Purpose Summary of Evidence Chapters Other Sources Evidence
1. Report achievement
with respect to the
CCSS as measured by
the ELA/literacy and
mathematics
summative
assessments in grades
3 to 8 and high school.
• Bias is minimized through
Universal Design and accessibility
resources.
• Test blueprint, content
specifications, and item
specifications are aligned to grade
level content, process skills, and
associated cognitive complexity.
• Achievement levels were set
consistent with best practice.
• Cognitive Labs describe students’
engagement with tasks and items
and provides confirmation of
content measurement.
3, 4, 5 Cognitive Laboratories Technical
Report (AIR, 2013)
2. Assess whether students
prior to grade 11 have
demonstrated sufficient
academic proficiency in
ELA/literacy and
mathematics to be on
track for achieving
college readiness.
• Test blueprint, content
specifications, and item
specifications are aligned to grade
level content, process skills, and
associated cognitive complexity.
• Achievement levels are vertically
articulated
• Cognitive Labs describe students’
engagement with tasks and items
and provides confirmation of
content measurement.
4, 5 • Cognitive Laboratories
Technical Report (AIR, 2013)
3. Assess whether grade 11
students have sufficient
academic proficiency in
ELA/literacy and
mathematics to be ready
to take credit-bearing,
transferable college
courses after completing
their high school
coursework.
• Test blueprint, content
specifications, and item
specifications are aligned to grade
level content, process skills, and
associated cognitive complexity.
• Achievement levels are vertically
articulated.
• Cognitive Labs describe students’
engagement with tasks and items
and provides confirmation of
content measurement.
4, 5 • Cognitive Laboratories
Technical Report (AIR, 2013)
Smarter Balanced 2015–16 Summative Assessment Technical Report
Chapter 1: Validity
1-12
Purpose Summary of Evidence Chapters Other Sources Evidence
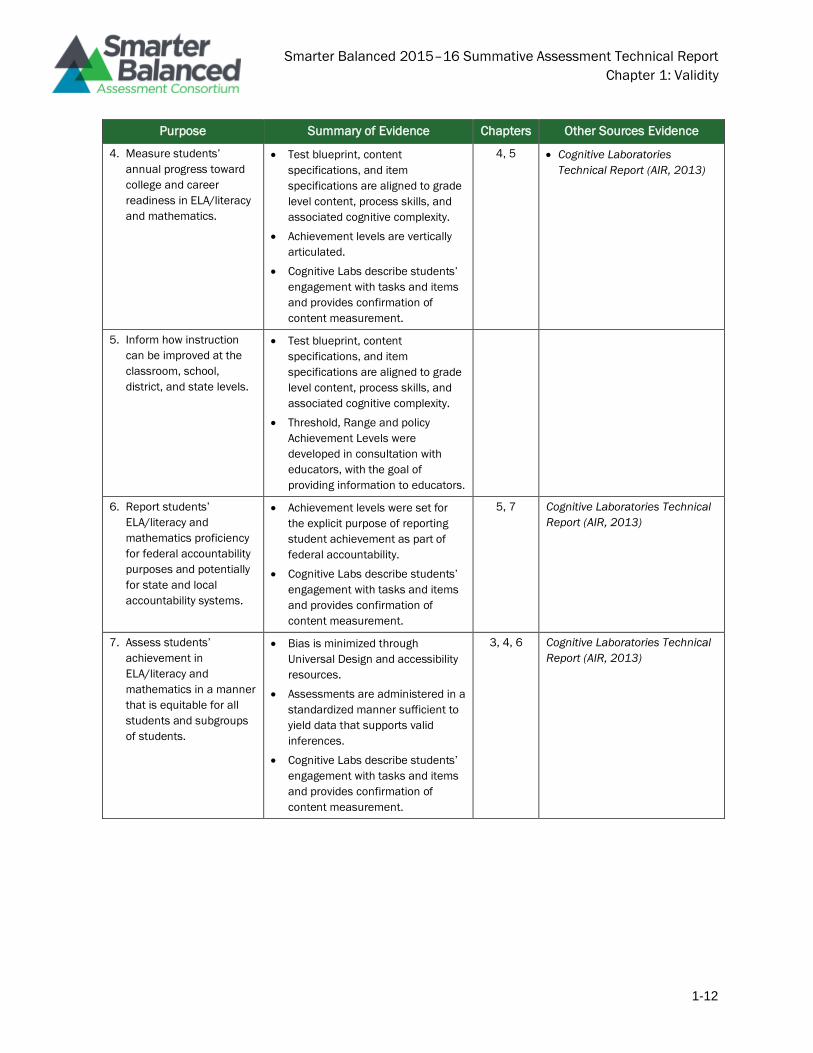
4. Measure students’
annual progress toward
college and career
readiness in ELA/literacy
and mathematics.
• Test blueprint, content
specifications, and item
specifications are aligned to grade
level content, process skills, and
associated cognitive complexity.
• Achievement levels are vertically
articulated.
• Cognitive Labs describe students’
engagement with tasks and items
and provides confirmation of
content measurement.
4, 5 • Cognitive Laboratories
Technical Report (AIR, 2013)
5. Inform how instruction
can be improved at the
classroom, school,
district, and state levels.
• Test blueprint, content
specifications, and item
specifications are aligned to grade
level content, process skills, and
associated cognitive complexity.
• Threshold, Range and policy
Achievement Levels were
developed in consultation with
educators, with the goal of
providing information to educators.
6. Report students’
ELA/literacy and
mathematics proficiency
for federal accountability
purposes and potentially
for state and local
accountability systems.
• Achievement levels were set for
the explicit purpose of reporting
student achievement as part of
federal accountability.
• Cognitive Labs describe students’
engagement with tasks and items
and provides confirmation of
content measurement.
5, 7 Cognitive Laboratories Technical
Report (AIR, 2013)
7. Assess students’
achievement in
ELA/literacy and
mathematics in a manner
that is equitable for all
students and subgroups
of students.
• Bias is minimized through
Universal Design and accessibility
resources.
• Assessments are administered in a
standardized manner sufficient to
yield data that supports valid
inferences.
• Cognitive Labs describe students’
engagement with tasks and items
and provides confirmation of
content measurement.
3, 4, 6 Cognitive Laboratories Technical
Report (AIR, 2013)
Smarter Balanced 2015–16 Summative Assessment Technical Report
Chapter 1: Validity
1-13
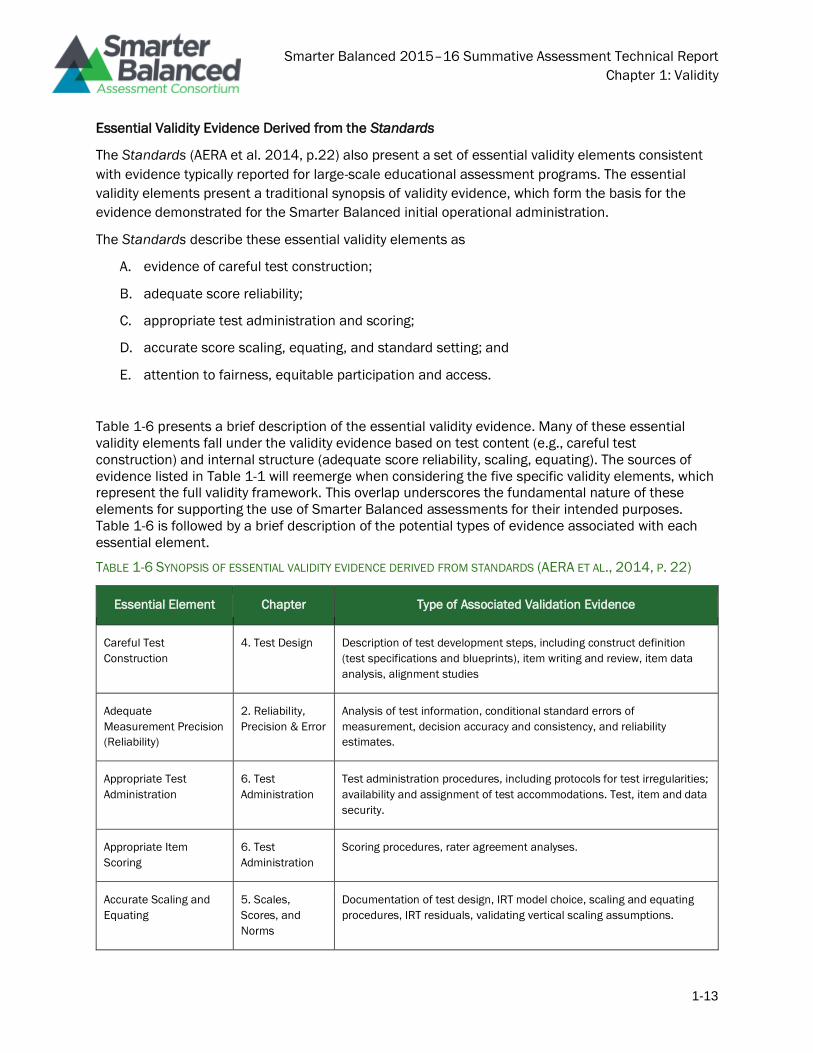
Essential Validity Evidence Derived from the Standards
The Standards (AERA et al. 2014, p.22) also present a set of essential validity elements consistent
with evidence typically reported for large-scale educational assessment programs. The essential
validity elements present a traditional synopsis of validity evidence, which form the basis for the
evidence demonstrated for the Smarter Balanced initial operational administration.
The Standards describe these essential validity elements as
A. evidence of careful test construction;
B. adequate score reliability;
C. appropriate test administration and scoring;
D. accurate score scaling, equating, and standard setting; and
E. attention to fairness, equitable participation and access.
Table 1-6 presents a brief description of the essential validity evidence. Many of these essential
validity elements fall under the validity evidence based on test content (e.g., careful test
construction) and internal structure (adequate score reliability, scaling, equating). The sources of
evidence listed in Table 1-1 will reemerge when considering the five specific validity elements, which
represent the full validity framework. This overlap underscores the fundamental nature of these
elements for supporting the use of Smarter Balanced assessments for their intended purposes.
Table 1-6 is followed by a brief description of the potential types of evidence associated with each
essential element.
TABLE 1-6 SYNOPSIS OF ESSENTIAL VALIDITY EVIDENCE DERIVED FROM STANDARDS (AERA ET AL., 2014, P. 22)
Essential Element Chapter Type of Associated Validation Evidence
Careful Test
Construction
4. Test Design Description of test development steps, including construct definition
(test specifications and blueprints), item writing and review, item data
analysis, alignment studies
Adequate
Measurement Precision
(Reliability)
2. Reliability,
Precision & Error
Analysis of test information, conditional standard errors of
measurement, decision accuracy and consistency, and reliability
estimates.
Appropriate Test
Administration
6. Test
Administration
Test administration procedures, including protocols for test irregularities;
availability and assignment of test accommodations. Test, item and data
security.
Appropriate Item
Scoring
6. Test
Administration
Scoring procedures, rater agreement analyses.
Accurate Scaling and
Equating
5. Scales,
Scores, and
Norms
Documentation of test design, IRT model choice, scaling and equating
procedures, IRT residuals, validating vertical scaling assumptions.
Smarter Balanced 2015–16 Summative Assessment Technical Report
Chapter 1: Validity
1-14
Essential Element Chapter Type of Associated Validation Evidence
Appropriate Standard
Setting
5. Scales,
Scores, and
Norms
Comprehensive standard-setting documentation provided, including
procedural, internal, and external validity evidence for all achievement-
level standards.
Attention to Fairness,
Equitable Participation
and Access
3. Test Fairness Accommodation policy guidelines, implementation of accommodations,
sensitivity review, DIF analyses, analyses of accommodated tests;
analysis of participation rates, availability of translations.
The 2014 Standards’ Five Primary Sources of Validity Evidence
The five sources of validity evidence serve as organizing principles and represent a comprehensive
framework for evaluating validity for Smarter Balanced. These sources of validity evidence are
intended to emphasize different aspects of validity. However, since validity is a unitary concept, they
do not constitute distinct types of validity. These five sources of validity evidence consist of (1) test
content, (2) response processes, (3) internal structure, (4) relations to other variables, and (5)
consequences of testing. They are briefly described below:
1. Validity evidence based on test content refers to traditional forms of content validity
evidence, such as the rating of test specifications and test items (Crocker, Miller, & Franks,
1989; Sireci, 1998), as well as “alignment” methods for educational tests that evaluate the
interactions between curriculum frameworks, testing, and instruction (Rothman, Slattery,
Vranek, & Resnick, 2002; Bhola, Impara & Buckendahl, 2003; Martone & Sireci, 2009). The
degree to which (a) the Smarter Balanced test specifications captured the Common Core
State Standards and (b) the items adequately represent the domains delineated in the test
specifications, were demonstrated in the alignment studies. The major assumption here is
that the knowledge, skills, and abilities measured by the Smarter Balanced assessments are
consistent with the ones specified in the Common Core State Standards. Administration and
scoring can be considered as aspects of content-based evidence. With computer adaptive
testing, an extra dimension of test content is to ensure that the tests administered to
students conform to the test blueprint.
2. Validity evidence based on response processes refers to “evidence concerning the fit
between the construct and the detailed nature of performance or response actually engaged
in by examinees” (AERA et al., 1999 p. 12). This evidence might include documentation of
such activities as
• interviewing students concerning their responses to test items (i.e., speak alouds);
• systematic observations of test response behavior;
• evaluation of the criteria used by judges when scoring performance tasks, analysis of
student item-response-time data, features scored by automated algorithms; and
Smarter Balanced 2015–16 Summative Assessment Technical Report
Chapter 1: Validity
1-15
• evaluation of the reasoning processes students employ when solving test items
(Emberetson, 1983; Messick, 1989; Mislevy, 2009).
This type of evidence was used to confirm that the Smarter Balanced assessments are
measuring the cognitive skills that are intended to be the objects of measurement and that
students are using these targeted skills to respond to the items.
3. Validity evidence based on internal structure refers to statistical analyses of item and score
subdomains to investigate the primary and secondary (if any) dimensions measured by an
assessment. Procedures for gathering such evidence include factor analysis or
multidimensional IRT scaling (both exploratory and confirmatory). With a vertical scale, a
consistent primary dimension or construct shift across the levels of the test should be
maintained. Internal structure evidence also evaluates the “strength” or “salience” of the
major dimensions underlying an assessment using indices of measurement precision such
as test reliability, decision accuracy and consistency, generalizability coefficients, conditional
and unconditional standard errors of measurement, and test information functions. In
addition, analysis of item functioning using Item Response Theory (IRT) and differential item
functioning (DIF) fall under the internal structure category. For Smarter Balanced, a
dimensionality study was conducted in the Pilot Test to determine the factor structure of the
assessments and the types of scales developed as well as the associated IRT models used
to calibrate them.
4. Evidence based on relations to other variables refers to traditional forms of criterion-related
validity evidence such as concurrent and predictive validity, as well as more comprehensive
investigations of the relationships among test scores and other variables such as multitrait-
multimethod studies (Campbell & Fiske, 1959). These external variables can be used to
evaluate hypothesized relationships between test scores and other measures of student
achievement (e.g., test scores and teacher grades), the degree to which different tests
actually measure different skills and the utility of test scores for predicting specific criteria
(e.g., college grades). This type of evidence is essential for supporting the validity of certain
inferences based on scores from the Smarter Balanced assessments for certifying college
and career readiness, which is one of the primary test purposes. A subset of students who
took NAEP and PISA items also took Smarter Balanced items and performance tasks. A
summary of the resulting item performance for NAEP, PISA, and all Smarter Balanced items
was conducted, the results are discussed in Chapter 5. Usually, association with other
assessment results requires a data set with a common set of either test items or examinees.
The Consortium has not yet acquired a data set from its members so a study of this type is
out of the scope of this manual. However, other organizations have studied the association
between Smarter Balanced tests and other tests of similar constructs. These include linking
Smarter Balanced to California’s current high school graduation tests (ETS, 2015) and linking
course grades to Smarter Balanced cut scores in Washington (OSPI, 2016)
5. Finally, evidence based on consequences of testing refers to the evaluation of the intended
and unintended consequences associated with a testing program. Examples of evidence
based on testing consequences include investigations of adverse impact, evaluation of the
effects of testing on instruction, and evaluation of the effects of testing on issues such as
Smarter Balanced 2015–16 Summative Assessment Technical Report
Chapter 1: Validity
1-16
high school dropout rates. With respect to educational tests, the Standards stress the
importance of evaluating test consequences. For example, they state,
When educational testing programs are mandated . . . the ways in which test
results are intended to be used should be clearly described. It is the
responsibility of those who mandate the use of tests to monitor their impact
and to identify and minimize potential negative consequences.
Consequences resulting from the use of the test, both intended and
unintended, should also be examined by the test user (AERA et al., 2014, p.
145).
Investigations of testing consequences relevant to the Smarter Balanced goals include analyses of
students’ opportunity to learn with regard to the Common Core State Standards, and analyses of
changes in textbooks and instructional approaches. Unintended consequences, such as changes in
instruction, diminished morale among teachers and students, increased pressure on students
leading to increased dropout rates, or the pursuit of college majors and careers that are less
challenging, can be evaluated. These studies are beyond the scope of this report.
Conclusion for Summative Test Validity Results
Validation is an ongoing, essentially perpetual endeavor in which additional evidence can be
provided but one can never absolutely “assert” an assessment is perfectly valid (Haertel, 1999). This
is particularly true for the many purposes typically placed on tests. Program requirements are often
subject to change and the populations assessed change over time. Nonetheless, at some point
decisions must be made regarding whether sufficient evidence exists to justify the use of a test for a
particular purpose. A review of the purpose statements and the available validity evidence
determines the degree to which the principles outlined here have been realized. Most of this report
focuses on describing some of the essential validity elements required for necessary evidence. The
essential validity elements presented here constitute critical evidence “relevant to the technical
quality of a testing system” (AERA et al., 2014, p. 22).
Smarter Balanced 2015–16 Summative Assessment Technical Report
Chapter 1: Validity
1-17
References
American Educational Research Association, American Psychological Association, & National Council
on Measurement in Education. (2014). Standards for educational and psychological testing.
Washington, DC: American Educational Research Association.
American Institute for Research. (2013). Cognitive laboratories technical report. Los Angeles, CA:
Smarter Balanced Assessment Consortium. Retrieved from
http://www.smarterbalanced.org/assessments/development/additional-technical-
documentation/
National Governors Association Center for Best Practices, & Council of Chief State School Officers.
(2016). Development Process. Washington, DC: Author. Retrieved from
http://www.corestandards.org/about-the-standards/development-process/
Conley, D. T., Drummond, K. V., de Gonzalez, A., Rooseboom, J., & Stout. O. (2011). Reaching the
goal: The applicability and importance of the Common Core State Standards to college and
career readiness. Eugene, OR: Educational Policy Improvement Center.
Cronbach, L. J. (1971).Test validation. In R. L. Thorndike (Ed.), Educational measurement (2nd ed.).
Washington, DC: American Council on Education.
Educational Testing Service (2002). ETS standards for quality and fairness. Princeton, NJ: Author.
Educational Testing Service (2015). Study of the relationship between the early assessment
program and the smarter balanced field tests. Sacramento: California Department of
Education.
Kane, M. T. (1992). An argument-based approach to validity. Psychological Bulletin, 112, 527-535.
Kane, M. (2006). Validation. In R. L. Brennan (Ed). Educational measurement (4th ed., pp. 17-64).
Washington, DC: American Council on Education/Praeger.
Linn, R. L. (2006). The standards for educational and psychological Testing: Guidance in test
development. In S. M. Downing & T. M. Haladyna (Eds.), Handbook of test development (pp.
27-38), Mahwah, NJ: Lawrence Erlbaum.
Sireci, S. G. (2013). Agreeing on validity arguments. Journal of Educational Measurement. 50, 1,
99–104.
Sireci, S. G. (2012). Smarter Balanced Assessment Consortium: Comprehensive research agenda.
Los Angeles, CA: Smarter Balanced Assessment Consortium. Retrieved from
http://www.smarterbalanced.org/assessments/development/additional-technical-
documentation/
Smarter Balanced Assessment Consortium. (2015). End of grant report. Los Angeles, CA: Author.
Retrieved from https://portal.smarterbalanced.org/library/en/v1.0/end-of-grant-report.pdf
Smarter Balanced 2015–16 Summative Assessment Technical Report
Chapter 2: Reliability, Precision and Errors of Measurement
2-1
Chapter 2: Reliability, Precision and
Errors of Measurement
Smarter Balanced 2015–16 Summative Assessment Technical Report
Chapter 2: Reliability, Precision and Errors of Measurement
2-2
Introduction
This chapter addresses the technical quality of operational test functioning with regard to precision
and reliability. Part of the test validity argument is that scores must be consistent and precise
enough to be useful for intended purposes. If scores are to be meaningful, tests should deliver the
same results under repeated administrations or for students of the same ability. In addition, the
range of certainty around the score should be small enough to support educational decisions. The
concepts of reliability and precision are examined through analysis of measurement error in
simulated and operational conditions. Reliability in physical instruments is checked by repeated
measurement. For example, reliability of scales is verified by seeing that the scale always gives the
same weight for the same object. For assessments, it isn’t possible to give the same test more than
once to the same individual without altering the object of measurement. Consequently, reliability is
inferred from test properties, including test length and the information provided by item parameters.
Items with difficulty parameters appropriate to examinee ability, and those with higher discrimination
values provide more information. Longer tests give more information because they provide more
certainty about student functioning. Smarter Balanced uses an adaptive model because adaptive
tests are customized to each student, thereby yielding lower error and greater reliability than fixed
form tests of the same length. Standard errors of measurement, the inverse of the square root of
information, are related to reliability in that they represent the standard deviation of repeated test
scores.
Simulation Studies for 2015-16 Operational Summative Tests
For Smarter Balanced tests with an adaptive component, test reliability is estimated through
simulations conducted using the operational summative item pool. For fixed form tests, reliability
and measurement error are calculated using the number of items and their psychometric properties
relative to the population.
The National Center for Research on Evaluation, Standards, & Student Testing (CRESST) conducted
simulation studies for the 2015-16 tests using packaged pools with its own simulation engine. This
serves as a baseline for service providers that deliver Smarter Balanced assessments. American
Institutes for Research also conducted a simulation study of the CAT portion of the summative tests
(AIR, 2014b).
Results from CRESST’s simulation are presented here. For each grade and content area, true ability
(theta) values for 1,000 simulees were created using the population distribution of the sample used
in standard setting.
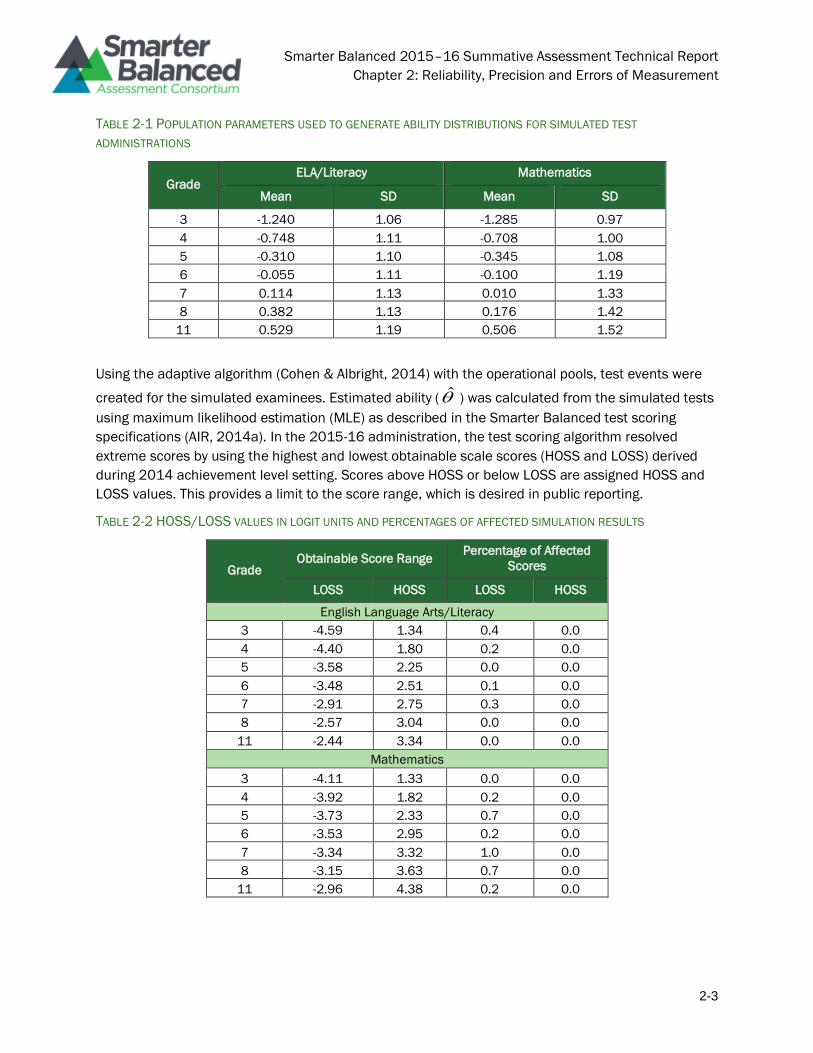
Smarter Balanced 2015–16 Summative Assessment Technical Report
Chapter 2: Reliability, Precision and Errors of Measurement
2-3
TABLE 2-1 POPULATION PARAMETERS USED TO GENERATE ABILITY DISTRIBUTIONS FOR SIMULATED TEST
ADMINISTRATIONS
Grade ELA/Literacy Mathematics
Mean SD Mean SD
3 -1.240 1.06 -1.285 0.97
4 -0.748 1.11 -0.708 1.00
5 -0.310 1.10 -0.345 1.08
6 -0.055 1.11 -0.100 1.19
7 0.114 1.13 0.010 1.33
8 0.382 1.13 0.176 1.42
11 0.529 1.19 0.506 1.52
Using the adaptive algorithm (Cohen & Albright, 2014) with the operational pools, test events were
created for the simulated examinees. Estimated ability ( ) was calculated from the simulated tests
using maximum likelihood estimation (MLE) as described in the Smarter Balanced test scoring
specifications (AIR, 2014a). In the 2015-16 administration, the test scoring algorithm resolved
extreme scores by using the highest and lowest obtainable scale scores (HOSS and LOSS) derived
during 2014 achievement level setting. Scores above HOSS or below LOSS are assigned HOSS and
LOSS values. This provides a limit to the score range, which is desired in public reporting.
TABLE 2-2 HOSS/LOSS VALUES IN LOGIT UNITS AND PERCENTAGES OF AFFECTED SIMULATION RESULTS
Grade Obtainable Score Range
Percentage of Affected
Scores
LOSS HOSS LOSS HOSS
English Language Arts/Literacy
3 -4.59 1.34 0.4 0.0
4 -4.40 1.80 0.2 0.0
5 -3.58 2.25 0.0 0.0
6 -3.48 2.51 0.1 0.0
7 -2.91 2.75 0.3 0.0
8 -2.57 3.04 0.0 0.0
11 -2.44 3.34 0.0 0.0
Mathematics
3 -4.11 1.33 0.0 0.0
4 -3.92 1.82 0.2 0.0
5 -3.73 2.33 0.7 0.0
6 -3.53 2.95 0.2 0.0
7 -3.34 3.32 1.0 0.0
8 -3.15 3.63 0.7 0.0
11 -2.96 4.38 0.2 0.0
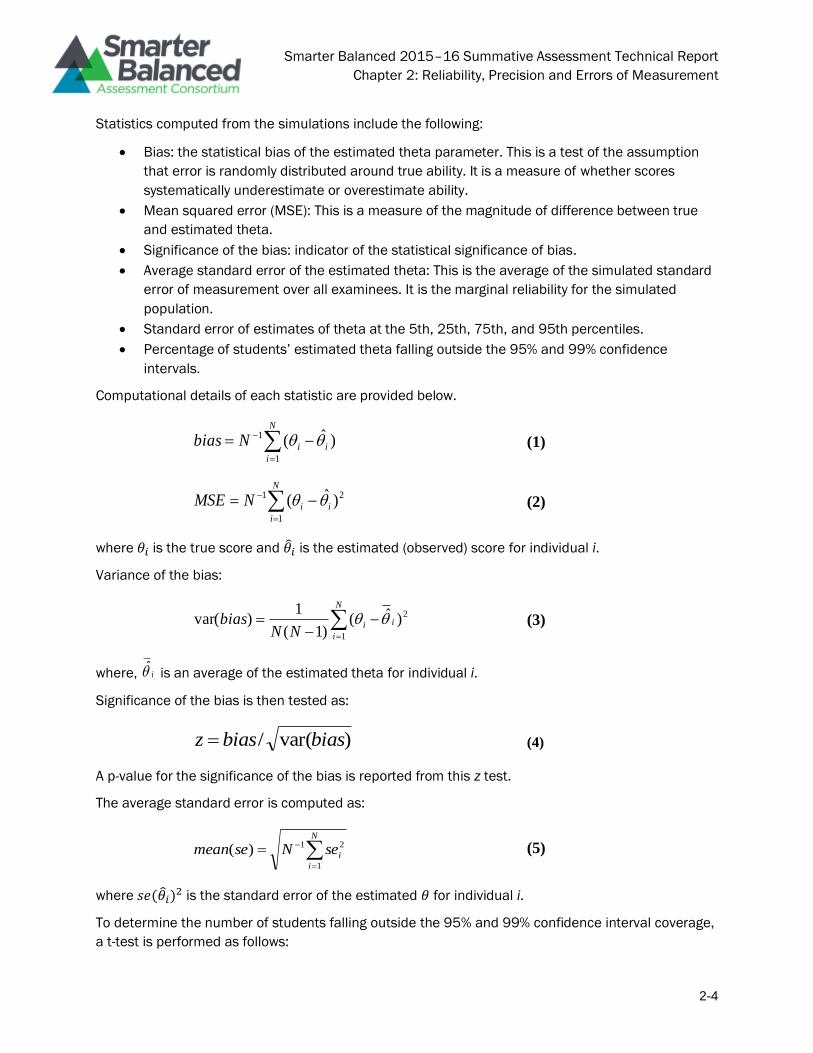
Smarter Balanced 2015–16 Summative Assessment Technical Report
Chapter 2: Reliability, Precision and Errors of Measurement
2-4
Statistics computed from the simulations include the following:
• Bias: the statistical bias of the estimated theta parameter. This is a test of the assumption
that error is randomly distributed around true ability. It is a measure of whether scores
systematically underestimate or overestimate ability.
• Mean squared error (MSE): This is a measure of the magnitude of difference between true
and estimated theta.
• Significance of the bias: indicator of the statistical significance of bias.
• Average standard error of the estimated theta: This is the average of the simulated standard
error of measurement over all examinees. It is the marginal reliability for the simulated
population.
• Standard error of estimates of theta at the 5th, 25th, 75th, and 95th percentiles.
• Percentage of students’ estimated theta falling outside the 95% and 99% confidence
intervals.
Computational details of each statistic are provided below.
(1)
(2)
where 𝜃𝑖 is the true score and 𝜃𝑖 is the estimated (observed) score for individual i.
Variance of the bias:
(3)
where, is an average of the estimated theta for individual i.
Significance of the bias is then tested as:
(4)
A p-value for the significance of the bias is reported from this z test.
The average standard error is computed as:
(5)
where 𝑠𝑒(𝜃𝑖)2 is the standard error of the estimated 𝜃 for individual i.
To determine the number of students falling outside the 95% and 99% confidence interval coverage,
a t-test is performed as follows:
N
i
iiNbias1
1 )ˆ(
N
i
iiNMSE1
21 )ˆ(
N
i
iiNN
bias1
2)ˆ()1(
1)var(
i
)var(/ biasbiasz
N
i
iseNsemean1
21)(
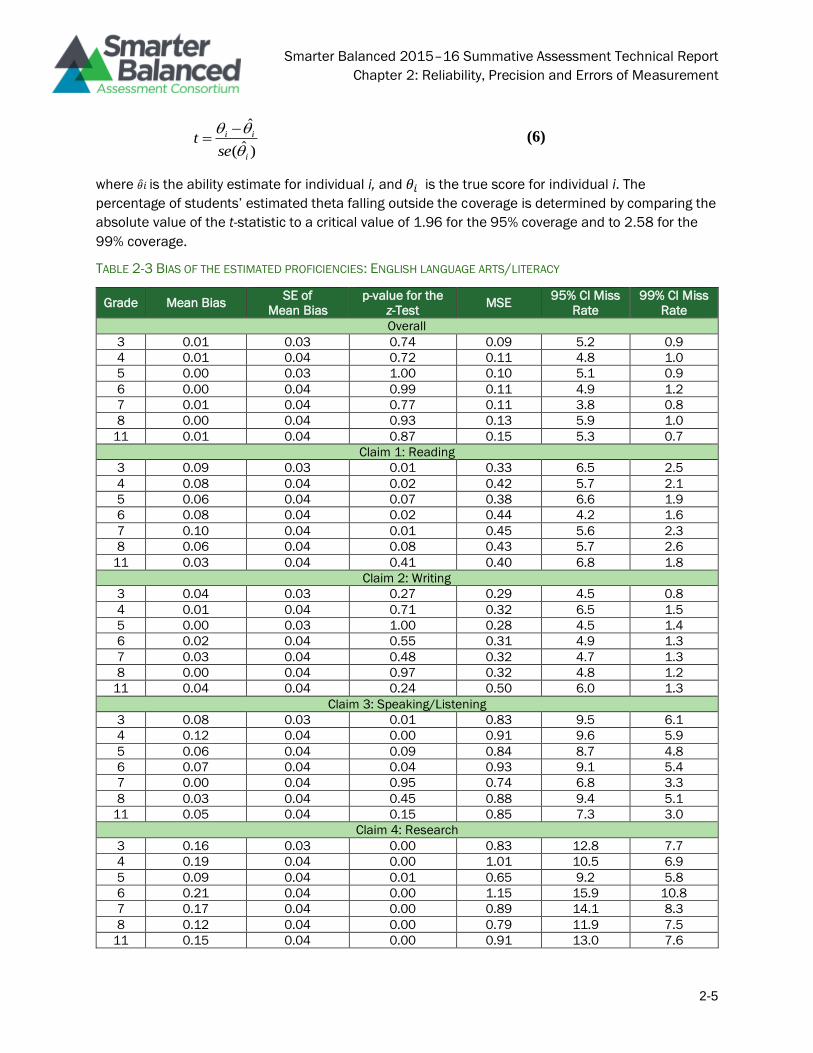
Smarter Balanced 2015–16 Summative Assessment Technical Report
Chapter 2: Reliability, Precision and Errors of Measurement
2-5
(6)
where 𝜃𝑖 is the ability estimate for individual i, and 𝜃𝑖 is the true score for individual i. The
percentage of students’ estimated theta falling outside the coverage is determined by comparing the
absolute value of the t-statistic to a critical value of 1.96 for the 95% coverage and to 2.58 for the
99% coverage.
TABLE 2-3 BIAS OF THE ESTIMATED PROFICIENCIES: ENGLISH LANGUAGE ARTS/LITERACY
Grade Mean Bias SE of
Mean Bias
p-value for the
z-Test MSE
95% CI Miss
Rate
99% CI Miss
Rate
Overall
3 0.01 0.03 0.74 0.09 5.2 0.9
4 0.01 0.04 0.72 0.11 4.8 1.0
5 0.00 0.03 1.00 0.10 5.1 0.9
6 0.00 0.04 0.99 0.11 4.9 1.2
7 0.01 0.04 0.77 0.11 3.8 0.8
8 0.00 0.04 0.93 0.13 5.9 1.0
11 0.01 0.04 0.87 0.15 5.3 0.7
Claim 1: Reading
3 0.09 0.03 0.01 0.33 6.5 2.5
4 0.08 0.04 0.02 0.42 5.7 2.1
5 0.06 0.04 0.07 0.38 6.6 1.9
6 0.08 0.04 0.02 0.44 4.2 1.6
7 0.10 0.04 0.01 0.45 5.6 2.3
8 0.06 0.04 0.08 0.43 5.7 2.6
11 0.03 0.04 0.41 0.40 6.8 1.8
Claim 2: Writing
3 0.04 0.03 0.27 0.29 4.5 0.8
4 0.01 0.04 0.71 0.32 6.5 1.5
5 0.00 0.03 1.00 0.28 4.5 1.4
6 0.02 0.04 0.55 0.31 4.9 1.3
7 0.03 0.04 0.48 0.32 4.7 1.3
8 0.00 0.04 0.97 0.32 4.8 1.2
11 0.04 0.04 0.24 0.50 6.0 1.3
Claim 3: Speaking/Listening
3 0.08 0.03 0.01 0.83 9.5 6.1
4 0.12 0.04 0.00 0.91 9.6 5.9
5 0.06 0.04 0.09 0.84 8.7 4.8
6 0.07 0.04 0.04 0.93 9.1 5.4
7 0.00 0.04 0.95 0.74 6.8 3.3
8 0.03 0.04 0.45 0.88 9.4 5.1
11 0.05 0.04 0.15 0.85 7.3 3.0
Claim 4: Research
3 0.16 0.03 0.00 0.83 12.8 7.7
4 0.19 0.04 0.00 1.01 10.5 6.9
5 0.09 0.04 0.01 0.65 9.2 5.8
6 0.21 0.04 0.00 1.15 15.9 10.8
7 0.17 0.04 0.00 0.89 14.1 8.3
8 0.12 0.04 0.00 0.79 11.9 7.5
11 0.15 0.04 0.00 0.91 13.0 7.6
)ˆ(
ˆ
i
ii
set
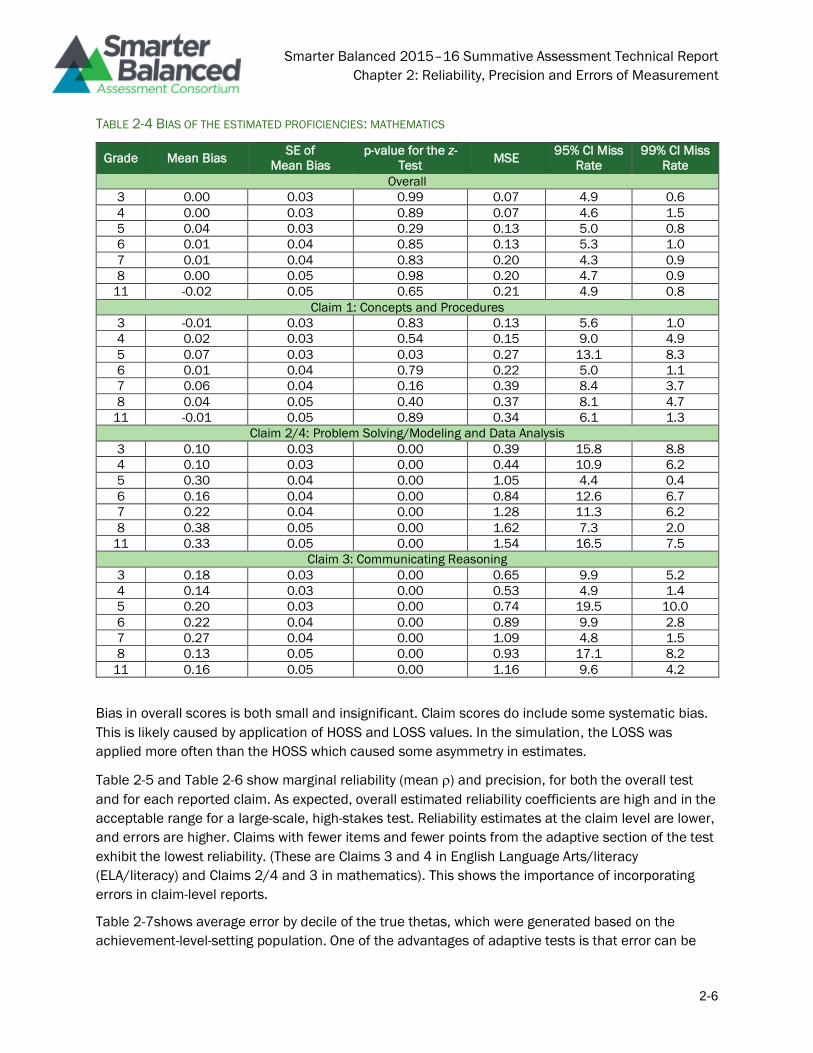
Smarter Balanced 2015–16 Summative Assessment Technical Report
Chapter 2: Reliability, Precision and Errors of Measurement
2-6
TABLE 2-4 BIAS OF THE ESTIMATED PROFICIENCIES: MATHEMATICS
Grade Mean Bias SE of
Mean Bias
p-value for the z-
Test MSE
95% CI Miss
Rate
99% CI Miss
Rate
Overall
3 0.00 0.03 0.99 0.07 4.9 0.6
4 0.00 0.03 0.89 0.07 4.6 1.5
5 0.04 0.03 0.29 0.13 5.0 0.8
6 0.01 0.04 0.85 0.13 5.3 1.0
7 0.01 0.04 0.83 0.20 4.3 0.9
8 0.00 0.05 0.98 0.20 4.7 0.9
11 -0.02 0.05 0.65 0.21 4.9 0.8
Claim 1: Concepts and Procedures
3 -0.01 0.03 0.83 0.13 5.6 1.0
4 0.02 0.03 0.54 0.15 9.0 4.9
5 0.07 0.03 0.03 0.27 13.1 8.3
6 0.01 0.04 0.79 0.22 5.0 1.1
7 0.06 0.04 0.16 0.39 8.4 3.7
8 0.04 0.05 0.40 0.37 8.1 4.7
11 -0.01 0.05 0.89 0.34 6.1 1.3
Claim 2/4: Problem Solving/Modeling and Data Analysis
3 0.10 0.03 0.00 0.39 15.8 8.8
4 0.10 0.03 0.00 0.44 10.9 6.2
5 0.30 0.04 0.00 1.05 4.4 0.4
6 0.16 0.04 0.00 0.84 12.6 6.7
7 0.22 0.04 0.00 1.28 11.3 6.2
8 0.38 0.05 0.00 1.62 7.3 2.0
11 0.33 0.05 0.00 1.54 16.5 7.5
Claim 3: Communicating Reasoning
3 0.18 0.03 0.00 0.65 9.9 5.2
4 0.14 0.03 0.00 0.53 4.9 1.4
5 0.20 0.03 0.00 0.74 19.5 10.0
6 0.22 0.04 0.00 0.89 9.9 2.8
7 0.27 0.04 0.00 1.09 4.8 1.5
8 0.13 0.05 0.00 0.93 17.1 8.2
11 0.16 0.05 0.00 1.16 9.6 4.2
Bias in overall scores is both small and insignificant. Claim scores do include some systematic bias.
This is likely caused by application of HOSS and LOSS values. In the simulation, the LOSS was
applied more often than the HOSS which caused some asymmetry in estimates.
Table 2-5 and Table 2-6 show marginal reliability (mean ) and precision, for both the overall test
and for each reported claim. As expected, overall estimated reliability coefficients are high and in the
acceptable range for a large-scale, high-stakes test. Reliability estimates at the claim level are lower,
and errors are higher. Claims with fewer items and fewer points from the adaptive section of the test
exhibit the lowest reliability. (These are Claims 3 and 4 in English Language Arts/literacy
(ELA/literacy) and Claims 2/4 and 3 in mathematics). This shows the importance of incorporating
errors in claim-level reports.
Table 2-7shows average error by decile of the true thetas, which were generated based on the
achievement-level-setting population. One of the advantages of adaptive tests is that error can be
Smarter Balanced 2015–16 Summative Assessment Technical Report
Chapter 2: Reliability, Precision and Errors of Measurement
2-7
controlled for all levels of theta. Table 2-7shows that error at the high end of the achievement
distribution is consistent with overall error and only slightly above error for the mean population.
There is some increase in error at the first and second deciles, caused by the relative difficulty of the
pools noted in Chapter 4.

Smarter Balanced 2015–16 Summative Assessment Technical Report
Chapter 2: Reliability, Precision and Errors of Measurement
2-8
TABLE 2-5 OVERALL SCORE AND CLAIM SCORE PRECISION/RELIABILITY: ENGLISH LANGUAGE ARTS/LITERACY
Grade
Overall ELA/literacy Claim 1 Claim 2 Claim 3 Claim 4
ave #
items SD(��)
mean
SEM RMSE ��
ave #
items SD(��)
mean
SE(��) RMSE ��
ave #
items SD(��)
mean
SE(��) RMSE ��
ave #
items SD(��)
mean
SE(��) RMSE ��
ave #
items SD(��)
mean
SE(��) RMSE ��
3 45.4 1.1 .31 .31 .93 16.0 1.3 .52 .58 .80 12.0 1.2 .54 .54 .81 9.0 1.4 .83 .91 .60 8.4 1.5 .71 .91 .62
4 45.5 1.2 .32 .33 .92 16.0 1.4 .58 .65 .77 12.0 1.3 .53 .57 .81 9.0 1.5 .84 .95 .61 8.5 1.5 .80 1.00 .58
5 45.8 1.1 .31 .32 .92 16.0 1.3 .55 .61 .77 12.0 1.3 .52 .53 .82 9.0 1.5 .86 .92 .61 8.8 1.4 .68 .81 .66
6 43.3 1.2 .33 .34 .92 14.0 1.3 .66 .66 .75 12.0 1.3 .53 .56 .81 9.0 1.5 .88 .96 .61 8.3 1.6 .76 1.07 .56
7 43.1 1.2 .35 .34 .92 14.0 1.3 .67 .67 .74 12.0 1.3 .58 .56 .81 9.0 1.4 .87 .86 .64 8.2 1.5 .79 .94 .62
8 43.4 1.2 .34 .35 .91 14.0 1.3 .63 .65 .75 12.0 1.3 .57 .57 .81 9.0 1.5 .89 .94 .60 8.5 1.5 .78 .89 .63
11 45.4 1.3 .38 .38 .91 16.0 1.4 .64 .63 .79 12.0 1.4 .67 .71 .74 9.0 1.5 .94 .92 .62 8.4 1.5 .85 .95 .62
TABLE 2-6 OVERALL SCORE AND CLAIM SCORE PRECISION/RELIABILITY: MATHEMATICS
Grade
Overall Mathematics Claim 1 Claim 2/4 Claim 3
ave #
items SD(��)
mean
SEM RMSE ��
ave #
items SD(��)
mean
SE(��) RMSE ��
ave #
items SD(��)
mean
SE(��) RMSE ��
ave #
items SD(��)
mean
SE(��) RMSE ��
3 39.7 1.0 .25 .26 .93 20.0 1.1 .34 .36 .88 9.9 1.2 .51 .63 .74 9.8 1.3 .61 .81 .62
4 39.2 1.0 .27 .26 .94 20.0 1.1 .38 .39 .88 9.6 1.3 .55 .66 .72 9.6 1.3 .61 .73 .69
5 39.7 1.2 .35 .36 .91 20.0 1.3 .48 .52 .83 9.8 1.6 .65 1.03 .60 9.9 1.4 .65 .86 .64
6 38.8 1.3 .35 .36 .92 19.0 1.3 .47 .47 .87 9.8 1.6 .67 .92 .67 10.0 1.6 .75 .94 .64
7 39.4 1.4 .43 .45 .90 20.0 1.5 .58 .63 .82 10.0 1.8 .81 1.13 .60 9.4 1.7 .94 1.05 .62
8 38.8 1.5 .47 .45 .91 20.0 1.5 .62 .61 .84 9.1 2.0 .88 1.27 .59 9.7 1.7 .92 .96 .67
11 41.3 1.5 .47 .45 .91 22.0 1.6 .60 .58 .86 9.3 2.0 .92 1.24 .63 10.0 1.8 .99 1.08 .66
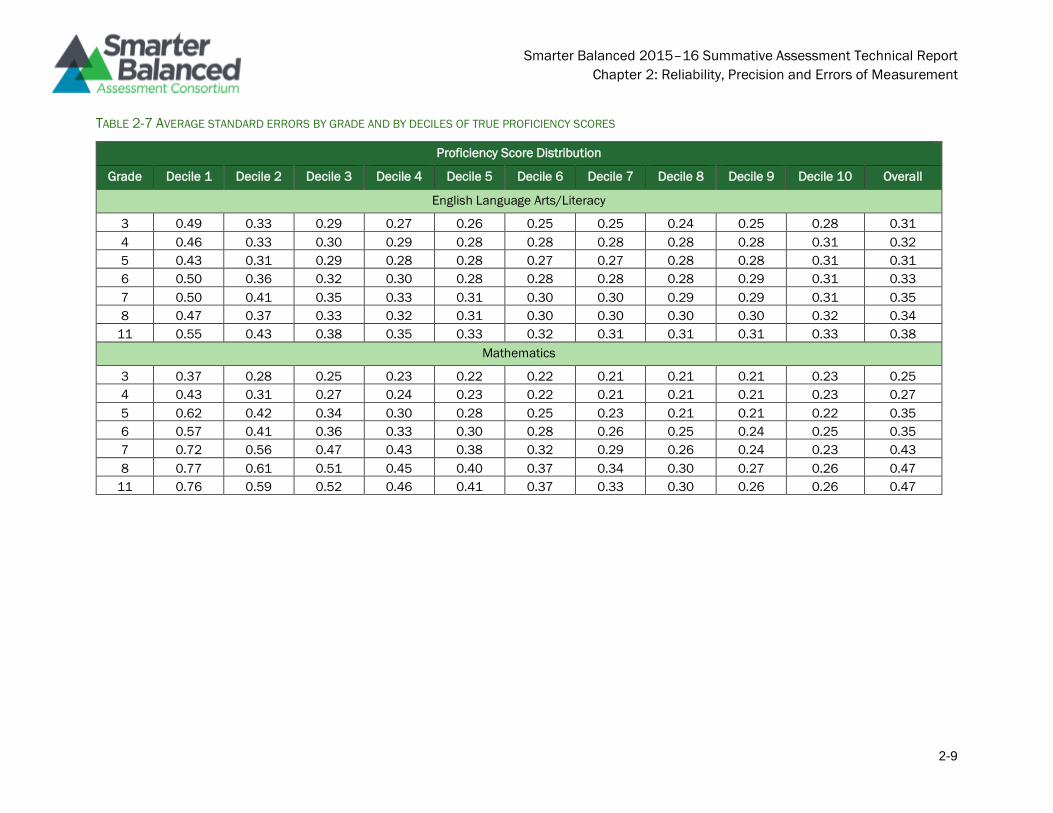
Smarter Balanced 2015–16 Summative Assessment Technical Report
Chapter 2: Reliability, Precision and Errors of Measurement
2-9
TABLE 2-7 AVERAGE STANDARD ERRORS BY GRADE AND BY DECILES OF TRUE PROFICIENCY SCORES
Proficiency Score Distribution
Grade Decile 1 Decile 2 Decile 3 Decile 4 Decile 5 Decile 6 Decile 7 Decile 8 Decile 9 Decile 10 Overall
English Language Arts/Literacy
3 0.49 0.33 0.29 0.27 0.26 0.25 0.25 0.24 0.25 0.28 0.31
4 0.46 0.33 0.30 0.29 0.28 0.28 0.28 0.28 0.28 0.31 0.32
5 0.43 0.31 0.29 0.28 0.28 0.27 0.27 0.28 0.28 0.31 0.31
6 0.50 0.36 0.32 0.30 0.28 0.28 0.28 0.28 0.29 0.31 0.33
7 0.50 0.41 0.35 0.33 0.31 0.30 0.30 0.29 0.29 0.31 0.35
8 0.47 0.37 0.33 0.32 0.31 0.30 0.30 0.30 0.30 0.32 0.34
11 0.55 0.43 0.38 0.35 0.33 0.32 0.31 0.31 0.31 0.33 0.38
Mathematics
3 0.37 0.28 0.25 0.23 0.22 0.22 0.21 0.21 0.21 0.23 0.25
4 0.43 0.31 0.27 0.24 0.23 0.22 0.21 0.21 0.21 0.23 0.27
5 0.62 0.42 0.34 0.30 0.28 0.25 0.23 0.21 0.21 0.22 0.35
6 0.57 0.41 0.36 0.33 0.30 0.28 0.26 0.25 0.24 0.25 0.35
7 0.72 0.56 0.47 0.43 0.38 0.32 0.29 0.26 0.24 0.23 0.43
8 0.77 0.61 0.51 0.45 0.40 0.37 0.34 0.30 0.27 0.26 0.47
11 0.76 0.59 0.52 0.46 0.41 0.37 0.33 0.30 0.26 0.26 0.47
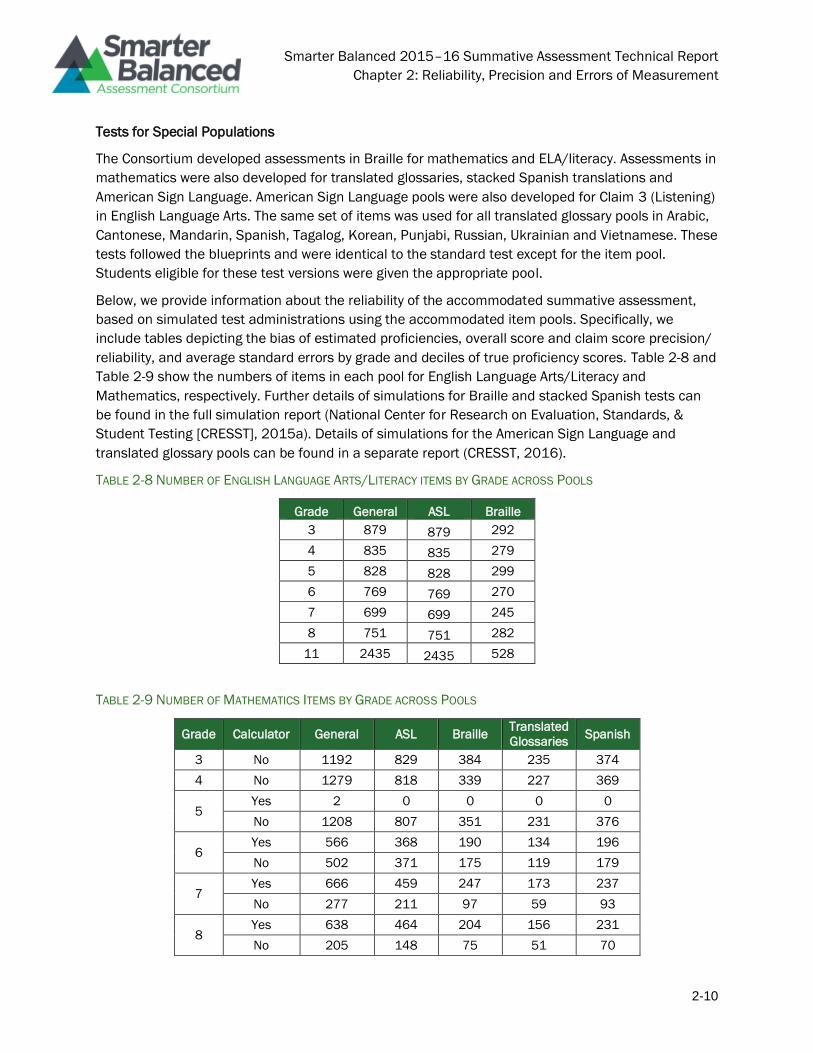
Smarter Balanced 2015–16 Summative Assessment Technical Report
Chapter 2: Reliability, Precision and Errors of Measurement
2-10
Tests for Special Populations
The Consortium developed assessments in Braille for mathematics and ELA/literacy. Assessments in
mathematics were also developed for translated glossaries, stacked Spanish translations and
American Sign Language. American Sign Language pools were also developed for Claim 3 (Listening)
in English Language Arts. The same set of items was used for all translated glossary pools in Arabic,
Cantonese, Mandarin, Spanish, Tagalog, Korean, Punjabi, Russian, Ukrainian and Vietnamese. These
tests followed the blueprints and were identical to the standard test except for the item pool.
Students eligible for these test versions were given the appropriate pool.
Below, we provide information about the reliability of the accommodated summative assessment,
based on simulated test administrations using the accommodated item pools. Specifically, we
include tables depicting the bias of estimated proficiencies, overall score and claim score precision/
reliability, and average standard errors by grade and deciles of true proficiency scores. Table 2-8 and
Table 2-9 show the numbers of items in each pool for English Language Arts/Literacy and
Mathematics, respectively. Further details of simulations for Braille and stacked Spanish tests can
be found in the full simulation report (National Center for Research on Evaluation, Standards, &
Student Testing [CRESST], 2015a). Details of simulations for the American Sign Language and
translated glossary pools can be found in a separate report (CRESST, 2016).
TABLE 2-8 NUMBER OF ENGLISH LANGUAGE ARTS/LITERACY ITEMS BY GRADE ACROSS POOLS
Grade General ASL Braille
3 879 879 292
4 835 835 279
5 828 828 299
6 769 769 270
7 699 699 245
8 751 751 282
11 2435 2435 528
TABLE 2-9 NUMBER OF MATHEMATICS ITEMS BY GRADE ACROSS POOLS
Grade Calculator General ASL Braille Translated
Glossaries Spanish
3 No 1192 829 384 235 374
4 No 1279 818 339 227 369
5 Yes 2 0 0 0 0
No 1208 807 351 231 376
6 Yes 566 368 190 134 196
No 502 371 175 119 179
7 Yes 666 459 247 173 237
No 277 211 97 59 93
8 Yes 638 464 204 156 231
No 205 148 75 51 70
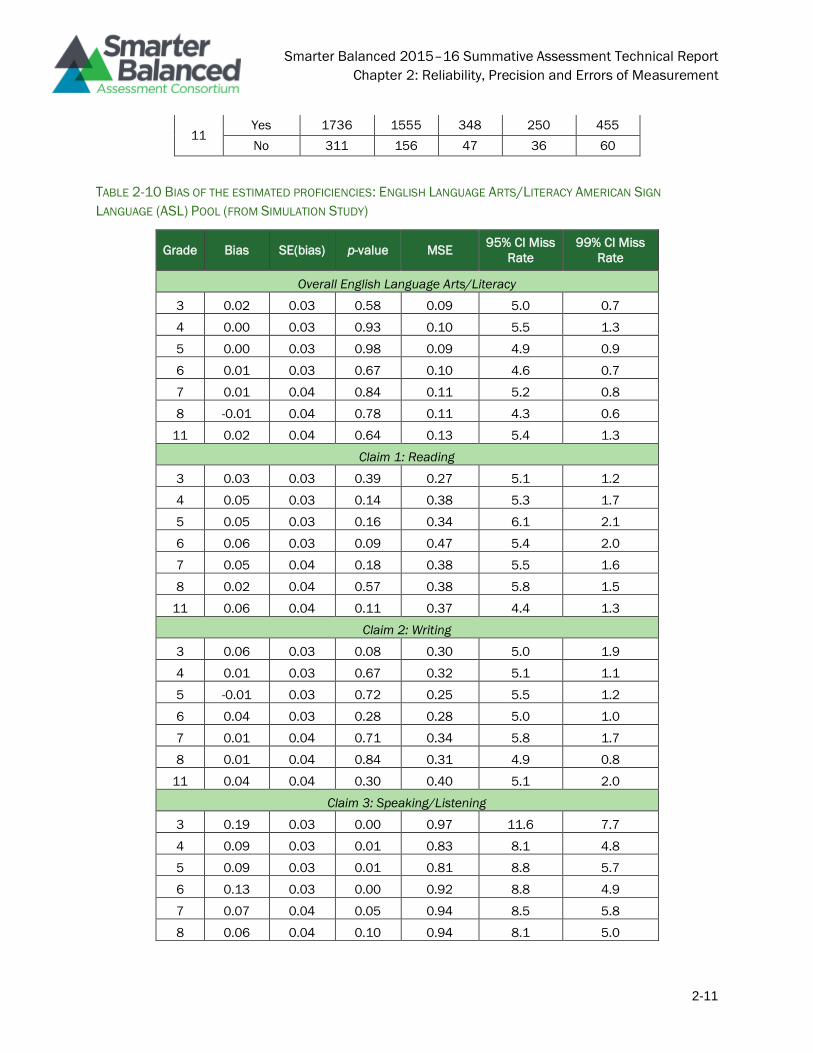
Smarter Balanced 2015–16 Summative Assessment Technical Report
Chapter 2: Reliability, Precision and Errors of Measurement
2-11
11 Yes 1736 1555 348 250 455
No 311 156 47 36 60
TABLE 2-10 BIAS OF THE ESTIMATED PROFICIENCIES: ENGLISH LANGUAGE ARTS/LITERACY AMERICAN SIGN
LANGUAGE (ASL) POOL (FROM SIMULATION STUDY)
Grade Bias SE(bias) p-value MSE 95% CI Miss
Rate
99% CI Miss
Rate
Overall English Language Arts/Literacy
3 0.02 0.03 0.58 0.09 5.0 0.7
4 0.00 0.03 0.93 0.10 5.5 1.3
5 0.00 0.03 0.98 0.09 4.9 0.9
6 0.01 0.03 0.67 0.10 4.6 0.7
7 0.01 0.04 0.84 0.11 5.2 0.8
8 -0.01 0.04 0.78 0.11 4.3 0.6
11 0.02 0.04 0.64 0.13 5.4 1.3
Claim 1: Reading
3 0.03 0.03 0.39 0.27 5.1 1.2
4 0.05 0.03 0.14 0.38 5.3 1.7
5 0.05 0.03 0.16 0.34 6.1 2.1
6 0.06 0.03 0.09 0.47 5.4 2.0
7 0.05 0.04 0.18 0.38 5.5 1.6
8 0.02 0.04 0.57 0.38 5.8 1.5
11 0.06 0.04 0.11 0.37 4.4 1.3
Claim 2: Writing
3 0.06 0.03 0.08 0.30 5.0 1.9
4 0.01 0.03 0.67 0.32 5.1 1.1
5 -0.01 0.03 0.72 0.25 5.5 1.2
6 0.04 0.03 0.28 0.28 5.0 1.0
7 0.01 0.04 0.71 0.34 5.8 1.7
8 0.01 0.04 0.84 0.31 4.9 0.8
11 0.04 0.04 0.30 0.40 5.1 2.0
Claim 3: Speaking/Listening
3 0.19 0.03 0.00 0.97 11.6 7.7
4 0.09 0.03 0.01 0.83 8.1 4.8
5 0.09 0.03 0.01 0.81 8.8 5.7
6 0.13 0.03 0.00 0.92 8.8 4.9
7 0.07 0.04 0.05 0.94 8.5 5.8
8 0.06 0.04 0.10 0.94 8.1 5.0
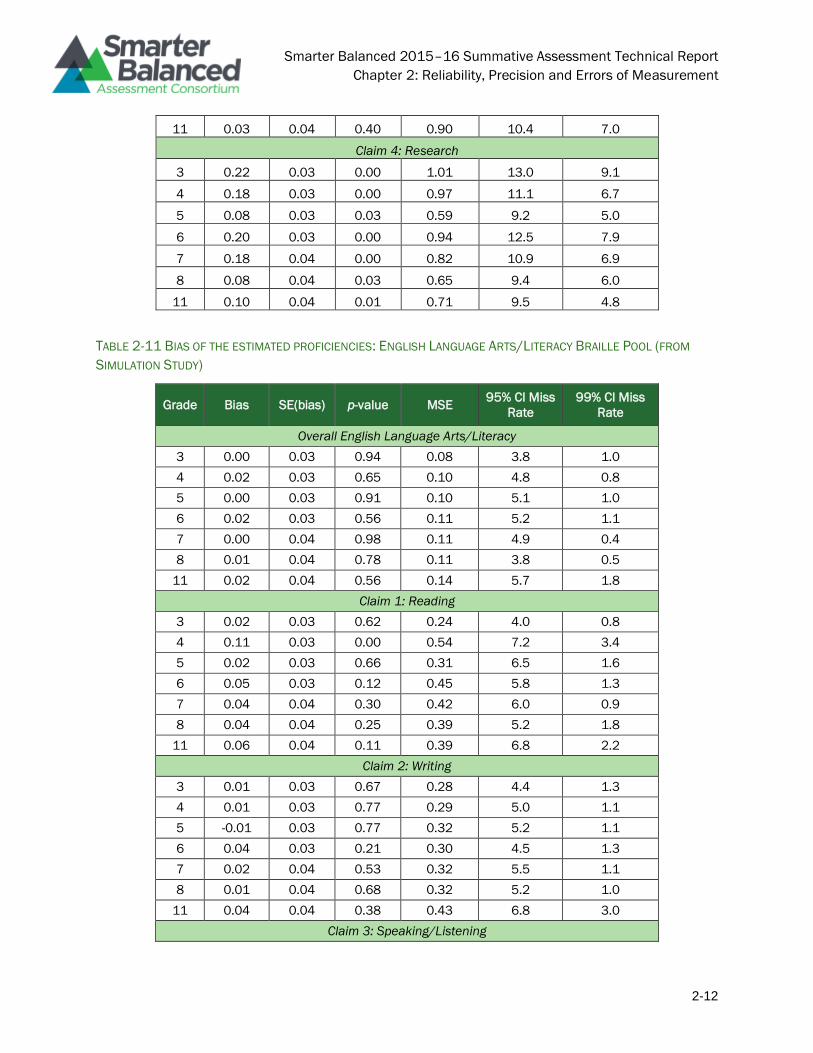
Smarter Balanced 2015–16 Summative Assessment Technical Report
Chapter 2: Reliability, Precision and Errors of Measurement
2-12
11 0.03 0.04 0.40 0.90 10.4 7.0
Claim 4: Research
3 0.22 0.03 0.00 1.01 13.0 9.1
4 0.18 0.03 0.00 0.97 11.1 6.7
5 0.08 0.03 0.03 0.59 9.2 5.0
6 0.20 0.03 0.00 0.94 12.5 7.9
7 0.18 0.04 0.00 0.82 10.9 6.9
8 0.08 0.04 0.03 0.65 9.4 6.0
11 0.10 0.04 0.01 0.71 9.5 4.8
TABLE 2-11 BIAS OF THE ESTIMATED PROFICIENCIES: ENGLISH LANGUAGE ARTS/LITERACY BRAILLE POOL (FROM
SIMULATION STUDY)
Grade Bias SE(bias) p-value MSE 95% CI Miss
Rate
99% CI Miss
Rate
Overall English Language Arts/Literacy
3 0.00 0.03 0.94 0.08 3.8 1.0
4 0.02 0.03 0.65 0.10 4.8 0.8
5 0.00 0.03 0.91 0.10 5.1 1.0
6 0.02 0.03 0.56 0.11 5.2 1.1
7 0.00 0.04 0.98 0.11 4.9 0.4
8 0.01 0.04 0.78 0.11 3.8 0.5
11 0.02 0.04 0.56 0.14 5.7 1.8
Claim 1: Reading
3 0.02 0.03 0.62 0.24 4.0 0.8
4 0.11 0.03 0.00 0.54 7.2 3.4
5 0.02 0.03 0.66 0.31 6.5 1.6
6 0.05 0.03 0.12 0.45 5.8 1.3
7 0.04 0.04 0.30 0.42 6.0 0.9
8 0.04 0.04 0.25 0.39 5.2 1.8
11 0.06 0.04 0.11 0.39 6.8 2.2
Claim 2: Writing
3 0.01 0.03 0.67 0.28 4.4 1.3
4 0.01 0.03 0.77 0.29 5.0 1.1
5 -0.01 0.03 0.77 0.32 5.2 1.1
6 0.04 0.03 0.21 0.30 4.5 1.3
7 0.02 0.04 0.53 0.32 5.5 1.1
8 0.01 0.04 0.68 0.32 5.2 1.0
11 0.04 0.04 0.38 0.43 6.8 3.0
Claim 3: Speaking/Listening
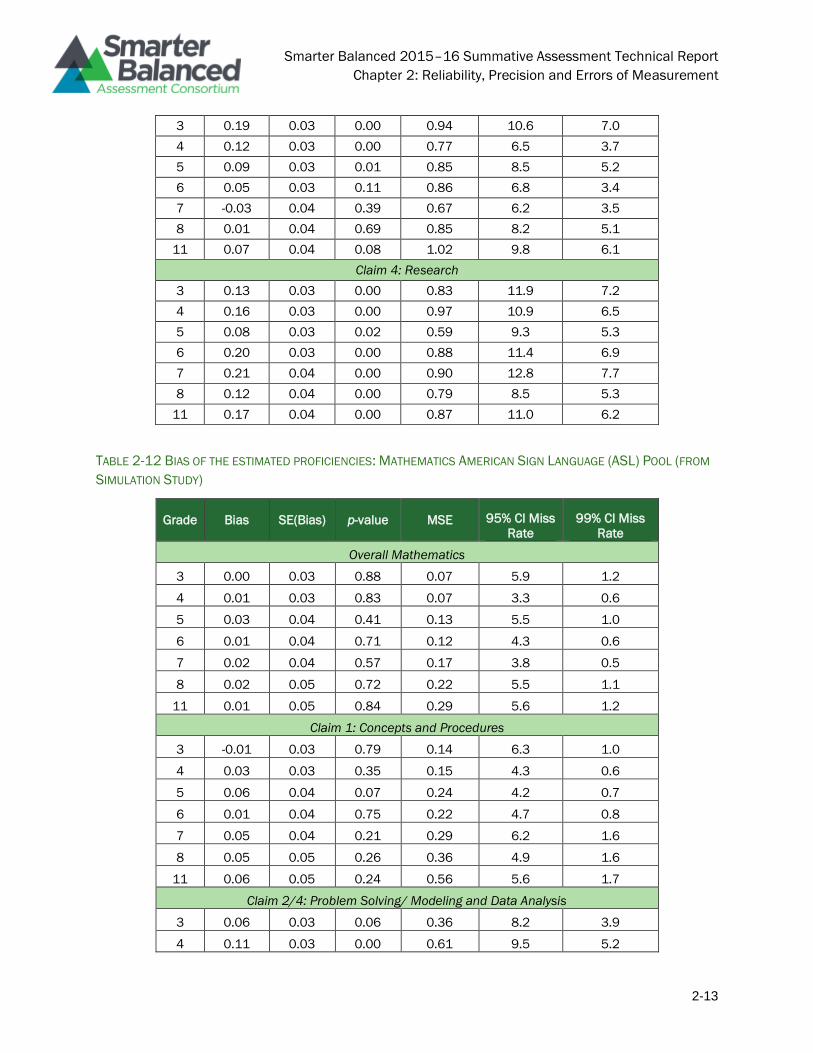
Smarter Balanced 2015–16 Summative Assessment Technical Report
Chapter 2: Reliability, Precision and Errors of Measurement
2-13
3 0.19 0.03 0.00 0.94 10.6 7.0
4 0.12 0.03 0.00 0.77 6.5 3.7
5 0.09 0.03 0.01 0.85 8.5 5.2
6 0.05 0.03 0.11 0.86 6.8 3.4
7 -0.03 0.04 0.39 0.67 6.2 3.5
8 0.01 0.04 0.69 0.85 8.2 5.1
11 0.07 0.04 0.08 1.02 9.8 6.1
Claim 4: Research
3 0.13 0.03 0.00 0.83 11.9 7.2
4 0.16 0.03 0.00 0.97 10.9 6.5
5 0.08 0.03 0.02 0.59 9.3 5.3
6 0.20 0.03 0.00 0.88 11.4 6.9
7 0.21 0.04 0.00 0.90 12.8 7.7
8 0.12 0.04 0.00 0.79 8.5 5.3
11 0.17 0.04 0.00 0.87 11.0 6.2
TABLE 2-12 BIAS OF THE ESTIMATED PROFICIENCIES: MATHEMATICS AMERICAN SIGN LANGUAGE (ASL) POOL (FROM
SIMULATION STUDY)
Grade Bias SE(Bias) p-value MSE 95% CI Miss
Rate
99% CI Miss
Rate
Overall Mathematics
3 0.00 0.03 0.88 0.07 5.9 1.2
4 0.01 0.03 0.83 0.07 3.3 0.6
5 0.03 0.04 0.41 0.13 5.5 1.0
6 0.01 0.04 0.71 0.12 4.3 0.6
7 0.02 0.04 0.57 0.17 3.8 0.5
8 0.02 0.05 0.72 0.22 5.5 1.1
11 0.01 0.05 0.84 0.29 5.6 1.2
Claim 1: Concepts and Procedures
3 -0.01 0.03 0.79 0.14 6.3 1.0
4 0.03 0.03 0.35 0.15 4.3 0.6
5 0.06 0.04 0.07 0.24 4.2 0.7
6 0.01 0.04 0.75 0.22 4.7 0.8
7 0.05 0.04 0.21 0.29 6.2 1.6
8 0.05 0.05 0.26 0.36 4.9 1.6
11 0.06 0.05 0.24 0.56 5.6 1.7
Claim 2/4: Problem Solving/ Modeling and Data Analysis
3 0.06 0.03 0.06 0.36 8.2 3.9
4 0.11 0.03 0.00 0.61 9.5 5.2
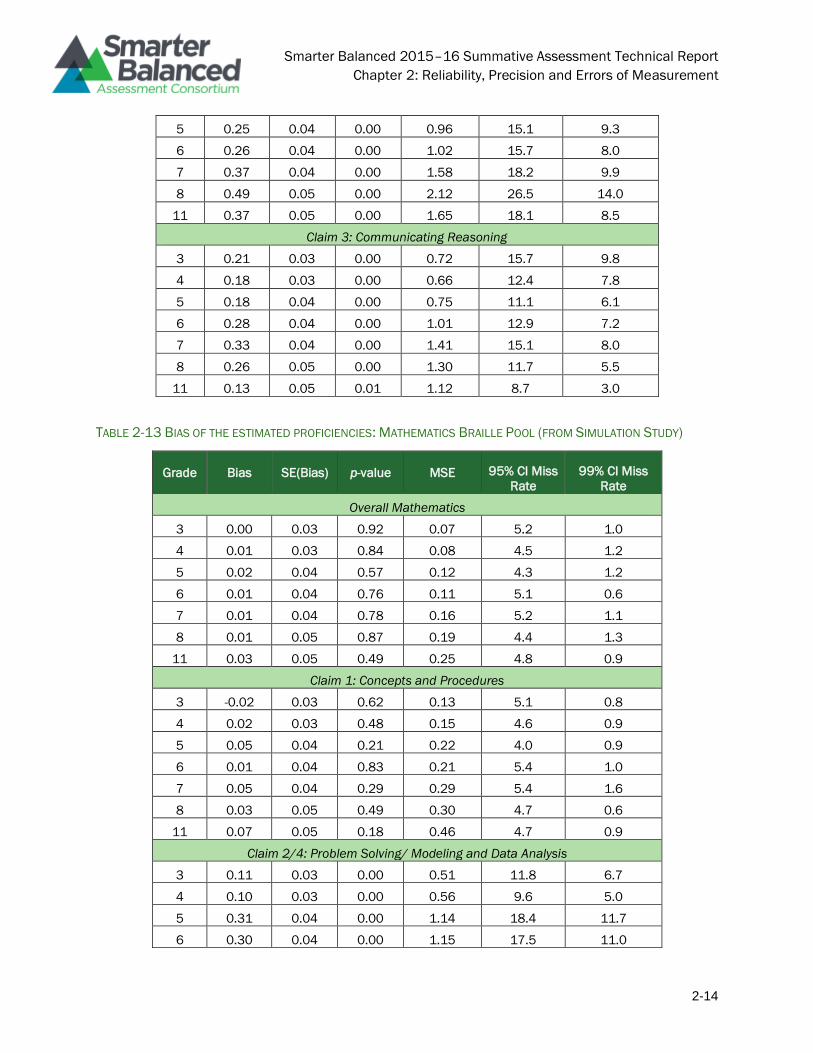
Smarter Balanced 2015–16 Summative Assessment Technical Report
Chapter 2: Reliability, Precision and Errors of Measurement
2-14
5 0.25 0.04 0.00 0.96 15.1 9.3
6 0.26 0.04 0.00 1.02 15.7 8.0
7 0.37 0.04 0.00 1.58 18.2 9.9
8 0.49 0.05 0.00 2.12 26.5 14.0
11 0.37 0.05 0.00 1.65 18.1 8.5
Claim 3: Communicating Reasoning
3 0.21 0.03 0.00 0.72 15.7 9.8
4 0.18 0.03 0.00 0.66 12.4 7.8
5 0.18 0.04 0.00 0.75 11.1 6.1
6 0.28 0.04 0.00 1.01 12.9 7.2
7 0.33 0.04 0.00 1.41 15.1 8.0
8 0.26 0.05 0.00 1.30 11.7 5.5
11 0.13 0.05 0.01 1.12 8.7 3.0
TABLE 2-13 BIAS OF THE ESTIMATED PROFICIENCIES: MATHEMATICS BRAILLE POOL (FROM SIMULATION STUDY)
Grade Bias SE(Bias) p-value MSE 95% CI Miss
Rate
99% CI Miss
Rate
Overall Mathematics
3 0.00 0.03 0.92 0.07 5.2 1.0
4 0.01 0.03 0.84 0.08 4.5 1.2
5 0.02 0.04 0.57 0.12 4.3 1.2
6 0.01 0.04 0.76 0.11 5.1 0.6
7 0.01 0.04 0.78 0.16 5.2 1.1
8 0.01 0.05 0.87 0.19 4.4 1.3
11 0.03 0.05 0.49 0.25 4.8 0.9
Claim 1: Concepts and Procedures
3 -0.02 0.03 0.62 0.13 5.1 0.8
4 0.02 0.03 0.48 0.15 4.6 0.9
5 0.05 0.04 0.21 0.22 4.0 0.9
6 0.01 0.04 0.83 0.21 5.4 1.0
7 0.05 0.04 0.29 0.29 5.4 1.6
8 0.03 0.05 0.49 0.30 4.7 0.6
11 0.07 0.05 0.18 0.46 4.7 0.9
Claim 2/4: Problem Solving/ Modeling and Data Analysis
3 0.11 0.03 0.00 0.51 11.8 6.7
4 0.10 0.03 0.00 0.56 9.6 5.0
5 0.31 0.04 0.00 1.14 18.4 11.7
6 0.30 0.04 0.00 1.15 17.5 11.0
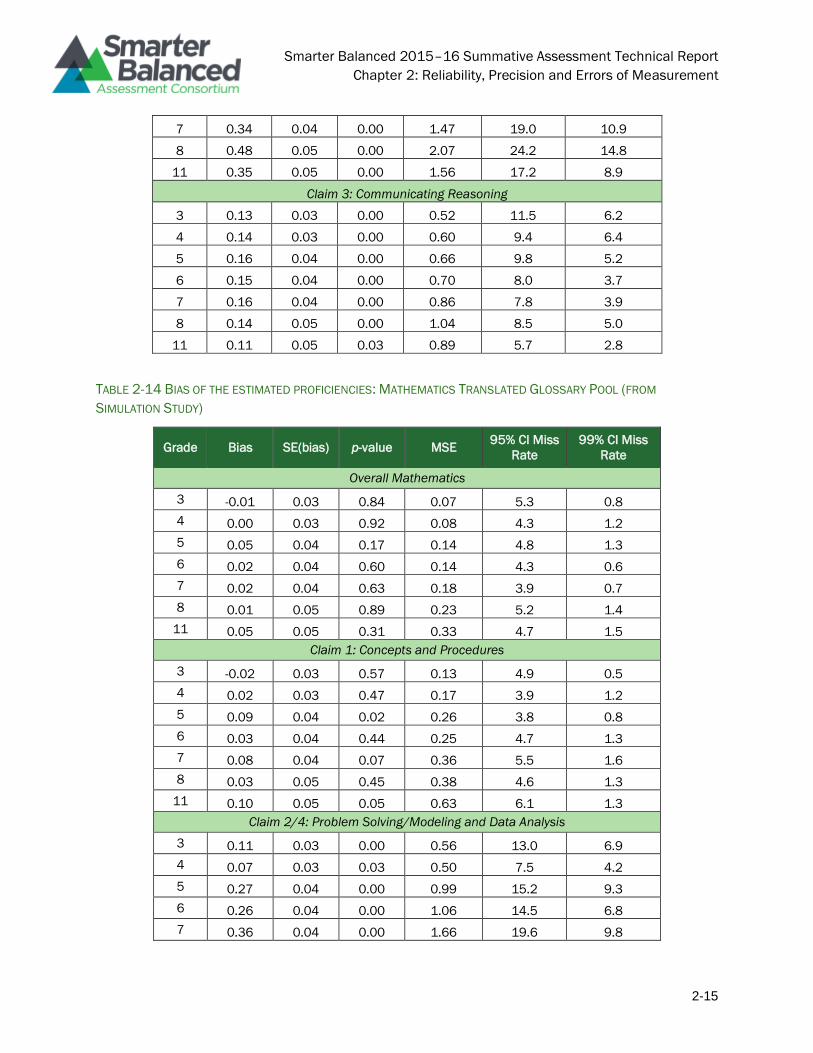
Smarter Balanced 2015–16 Summative Assessment Technical Report
Chapter 2: Reliability, Precision and Errors of Measurement
2-15
7 0.34 0.04 0.00 1.47 19.0 10.9
8 0.48 0.05 0.00 2.07 24.2 14.8
11 0.35 0.05 0.00 1.56 17.2 8.9
Claim 3: Communicating Reasoning
3 0.13 0.03 0.00 0.52 11.5 6.2
4 0.14 0.03 0.00 0.60 9.4 6.4
5 0.16 0.04 0.00 0.66 9.8 5.2
6 0.15 0.04 0.00 0.70 8.0 3.7
7 0.16 0.04 0.00 0.86 7.8 3.9
8 0.14 0.05 0.00 1.04 8.5 5.0
11 0.11 0.05 0.03 0.89 5.7 2.8
TABLE 2-14 BIAS OF THE ESTIMATED PROFICIENCIES: MATHEMATICS TRANSLATED GLOSSARY POOL (FROM
SIMULATION STUDY)
Grade Bias SE(bias) p-value MSE 95% CI Miss
Rate
99% CI Miss
Rate
Overall Mathematics
3 -0.01 0.03 0.84 0.07 5.3 0.8
4 0.00 0.03 0.92 0.08 4.3 1.2
5 0.05 0.04 0.17 0.14 4.8 1.3
6 0.02 0.04 0.60 0.14 4.3 0.6
7 0.02 0.04 0.63 0.18 3.9 0.7
8 0.01 0.05 0.89 0.23 5.2 1.4
11 0.05 0.05 0.31 0.33 4.7 1.5
Claim 1: Concepts and Procedures
3 -0.02 0.03 0.57 0.13 4.9 0.5
4 0.02 0.03 0.47 0.17 3.9 1.2
5 0.09 0.04 0.02 0.26 3.8 0.8
6 0.03 0.04 0.44 0.25 4.7 1.3
7 0.08 0.04 0.07 0.36 5.5 1.6
8 0.03 0.05 0.45 0.38 4.6 1.3
11 0.10 0.05 0.05 0.63 6.1 1.3
Claim 2/4: Problem Solving/Modeling and Data Analysis
3 0.11 0.03 0.00 0.56 13.0 6.9
4 0.07 0.03 0.03 0.50 7.5 4.2
5 0.27 0.04 0.00 0.99 15.2 9.3
6 0.26 0.04 0.00 1.06 14.5 6.8
7 0.36 0.04 0.00 1.66 19.6 9.8
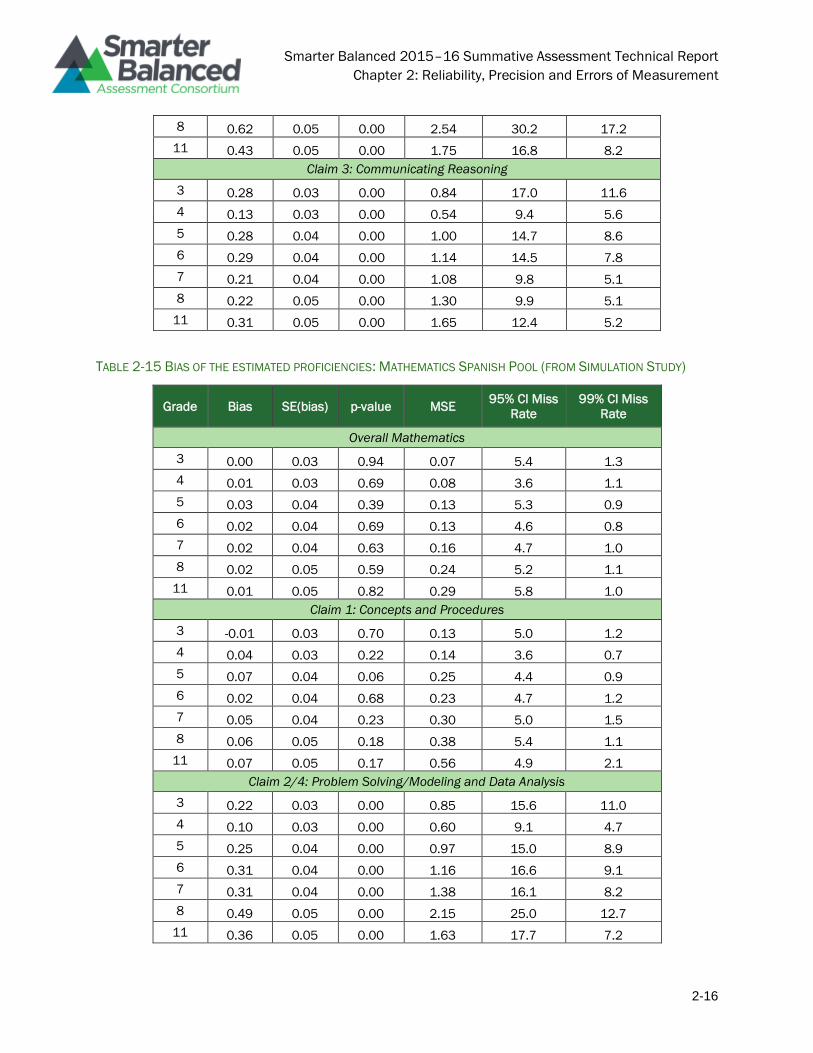
Smarter Balanced 2015–16 Summative Assessment Technical Report
Chapter 2: Reliability, Precision and Errors of Measurement
2-16
8 0.62 0.05 0.00 2.54 30.2 17.2
11 0.43 0.05 0.00 1.75 16.8 8.2
Claim 3: Communicating Reasoning
3 0.28 0.03 0.00 0.84 17.0 11.6
4 0.13 0.03 0.00 0.54 9.4 5.6
5 0.28 0.04 0.00 1.00 14.7 8.6
6 0.29 0.04 0.00 1.14 14.5 7.8
7 0.21 0.04 0.00 1.08 9.8 5.1
8 0.22 0.05 0.00 1.30 9.9 5.1
11 0.31 0.05 0.00 1.65 12.4 5.2
TABLE 2-15 BIAS OF THE ESTIMATED PROFICIENCIES: MATHEMATICS SPANISH POOL (FROM SIMULATION STUDY)
Grade Bias SE(bias) p-value MSE 95% CI Miss
Rate
99% CI Miss
Rate
Overall Mathematics
3 0.00 0.03 0.94 0.07 5.4 1.3
4 0.01 0.03 0.69 0.08 3.6 1.1
5 0.03 0.04 0.39 0.13 5.3 0.9
6 0.02 0.04 0.69 0.13 4.6 0.8
7 0.02 0.04 0.63 0.16 4.7 1.0
8 0.02 0.05 0.59 0.24 5.2 1.1
11 0.01 0.05 0.82 0.29 5.8 1.0
Claim 1: Concepts and Procedures
3 -0.01 0.03 0.70 0.13 5.0 1.2
4 0.04 0.03 0.22 0.14 3.6 0.7
5 0.07 0.04 0.06 0.25 4.4 0.9
6 0.02 0.04 0.68 0.23 4.7 1.2
7 0.05 0.04 0.23 0.30 5.0 1.5
8 0.06 0.05 0.18 0.38 5.4 1.1
11 0.07 0.05 0.17 0.56 4.9 2.1
Claim 2/4: Problem Solving/Modeling and Data Analysis
3 0.22 0.03 0.00 0.85 15.6 11.0
4 0.10 0.03 0.00 0.60 9.1 4.7
5 0.25 0.04 0.00 0.97 15.0 8.9
6 0.31 0.04 0.00 1.16 16.6 9.1
7 0.31 0.04 0.00 1.38 16.1 8.2
8 0.49 0.05 0.00 2.15 25.0 12.7
11 0.36 0.05 0.00 1.63 17.7 7.2
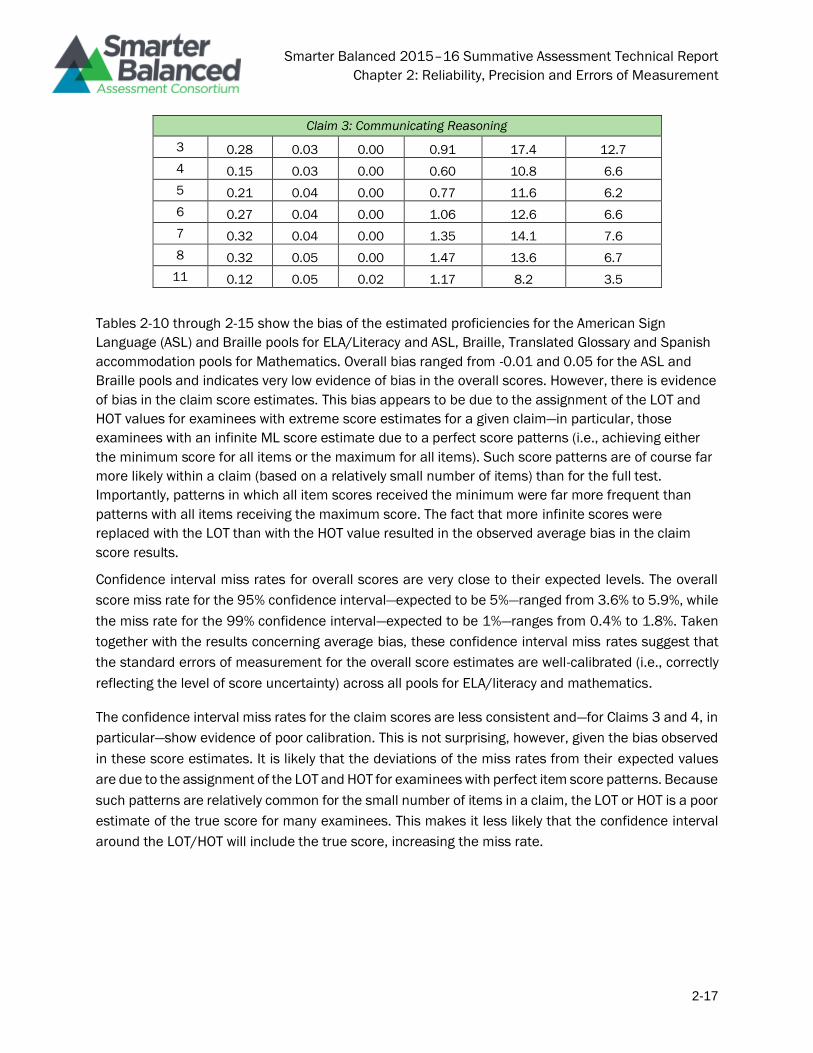
Smarter Balanced 2015–16 Summative Assessment Technical Report
Chapter 2: Reliability, Precision and Errors of Measurement
2-17
Claim 3: Communicating Reasoning
3 0.28 0.03 0.00 0.91 17.4 12.7
4 0.15 0.03 0.00 0.60 10.8 6.6
5 0.21 0.04 0.00 0.77 11.6 6.2
6 0.27 0.04 0.00 1.06 12.6 6.6
7 0.32 0.04 0.00 1.35 14.1 7.6
8 0.32 0.05 0.00 1.47 13.6 6.7
11 0.12 0.05 0.02 1.17 8.2 3.5
Tables 2-10 through 2-15 show the bias of the estimated proficiencies for the American Sign
Language (ASL) and Braille pools for ELA/Literacy and ASL, Braille, Translated Glossary and Spanish
accommodation pools for Mathematics. Overall bias ranged from -0.01 and 0.05 for the ASL and
Braille pools and indicates very low evidence of bias in the overall scores. However, there is evidence
of bias in the claim score estimates. This bias appears to be due to the assignment of the LOT and
HOT values for examinees with extreme score estimates for a given claim—in particular, those
examinees with an infinite ML score estimate due to a perfect score patterns (i.e., achieving either
the minimum score for all items or the maximum for all items). Such score patterns are of course far
more likely within a claim (based on a relatively small number of items) than for the full test.
Importantly, patterns in which all item scores received the minimum were far more frequent than
patterns with all items receiving the maximum score. The fact that more infinite scores were
replaced with the LOT than with the HOT value resulted in the observed average bias in the claim
score results.
Confidence interval miss rates for overall scores are very close to their expected levels. The overall
score miss rate for the 95% confidence interval—expected to be 5%—ranged from 3.6% to 5.9%, while
the miss rate for the 99% confidence interval—expected to be 1%—ranges from 0.4% to 1.8%. Taken
together with the results concerning average bias, these confidence interval miss rates suggest that
the standard errors of measurement for the overall score estimates are well-calibrated (i.e., correctly
reflecting the level of score uncertainty) across all pools for ELA/literacy and mathematics.
The confidence interval miss rates for the claim scores are less consistent and—for Claims 3 and 4, in
particular—show evidence of poor calibration. This is not surprising, however, given the bias observed
in these score estimates. It is likely that the deviations of the miss rates from their expected values
are due to the assignment of the LOT and HOT for examinees with perfect item score patterns. Because
such patterns are relatively common for the small number of items in a claim, the LOT or HOT is a poor
estimate of the true score for many examinees. This makes it less likely that the confidence interval
around the LOT/HOT will include the true score, increasing the miss rate.
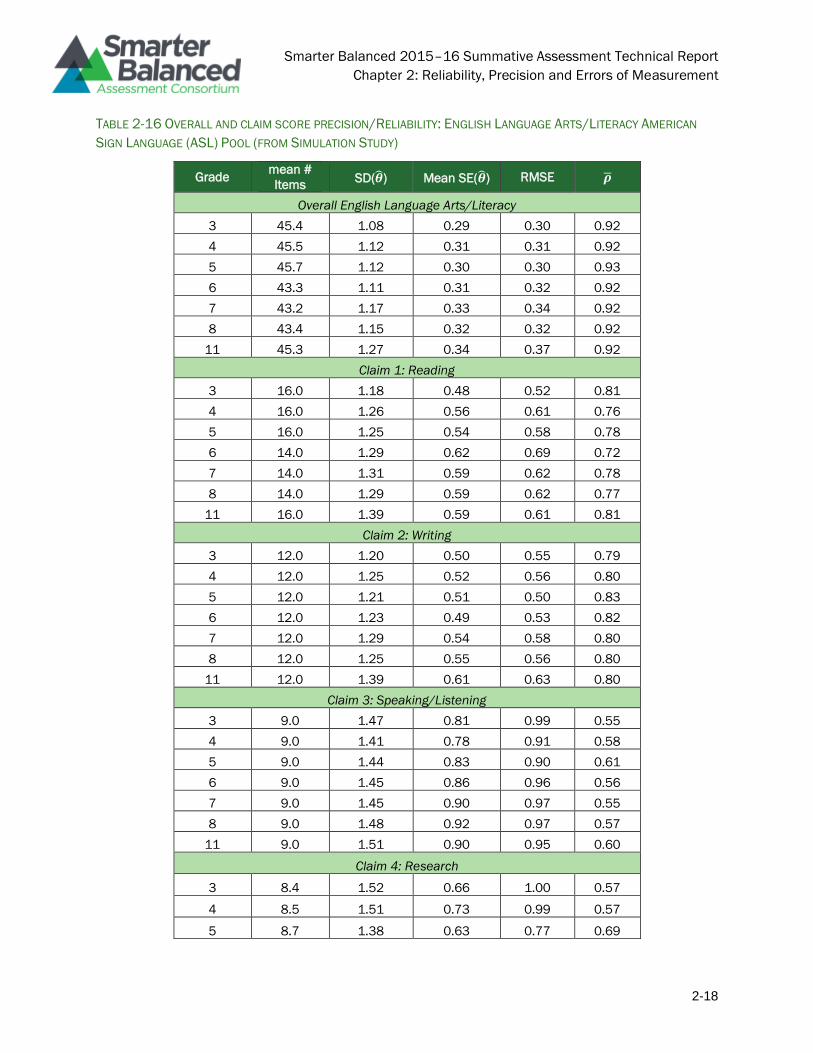
Smarter Balanced 2015–16 Summative Assessment Technical Report
Chapter 2: Reliability, Precision and Errors of Measurement
2-18
TABLE 2-16 OVERALL AND CLAIM SCORE PRECISION/RELIABILITY: ENGLISH LANGUAGE ARTS/LITERACY AMERICAN
SIGN LANGUAGE (ASL) POOL (FROM SIMULATION STUDY)
Grade mean #
Items SD(��) Mean SE(��) RMSE ��
Overall English Language Arts/Literacy
3 45.4 1.08 0.29 0.30 0.92
4 45.5 1.12 0.31 0.31 0.92
5 45.7 1.12 0.30 0.30 0.93
6 43.3 1.11 0.31 0.32 0.92
7 43.2 1.17 0.33 0.34 0.92
8 43.4 1.15 0.32 0.32 0.92
11 45.3 1.27 0.34 0.37 0.92
Claim 1: Reading
3 16.0 1.18 0.48 0.52 0.81
4 16.0 1.26 0.56 0.61 0.76
5 16.0 1.25 0.54 0.58 0.78
6 14.0 1.29 0.62 0.69 0.72
7 14.0 1.31 0.59 0.62 0.78
8 14.0 1.29 0.59 0.62 0.77
11 16.0 1.39 0.59 0.61 0.81
Claim 2: Writing
3 12.0 1.20 0.50 0.55 0.79
4 12.0 1.25 0.52 0.56 0.80
5 12.0 1.21 0.51 0.50 0.83
6 12.0 1.23 0.49 0.53 0.82
7 12.0 1.29 0.54 0.58 0.80
8 12.0 1.25 0.55 0.56 0.80
11 12.0 1.39 0.61 0.63 0.80
Claim 3: Speaking/Listening
3 9.0 1.47 0.81 0.99 0.55
4 9.0 1.41 0.78 0.91 0.58
5 9.0 1.44 0.83 0.90 0.61
6 9.0 1.45 0.86 0.96 0.56
7 9.0 1.45 0.90 0.97 0.55
8 9.0 1.48 0.92 0.97 0.57
11 9.0 1.51 0.90 0.95 0.60
Claim 4: Research
3 8.4 1.52 0.66 1.00 0.57
4 8.5 1.51 0.73 0.99 0.57
5 8.7 1.38 0.63 0.77 0.69
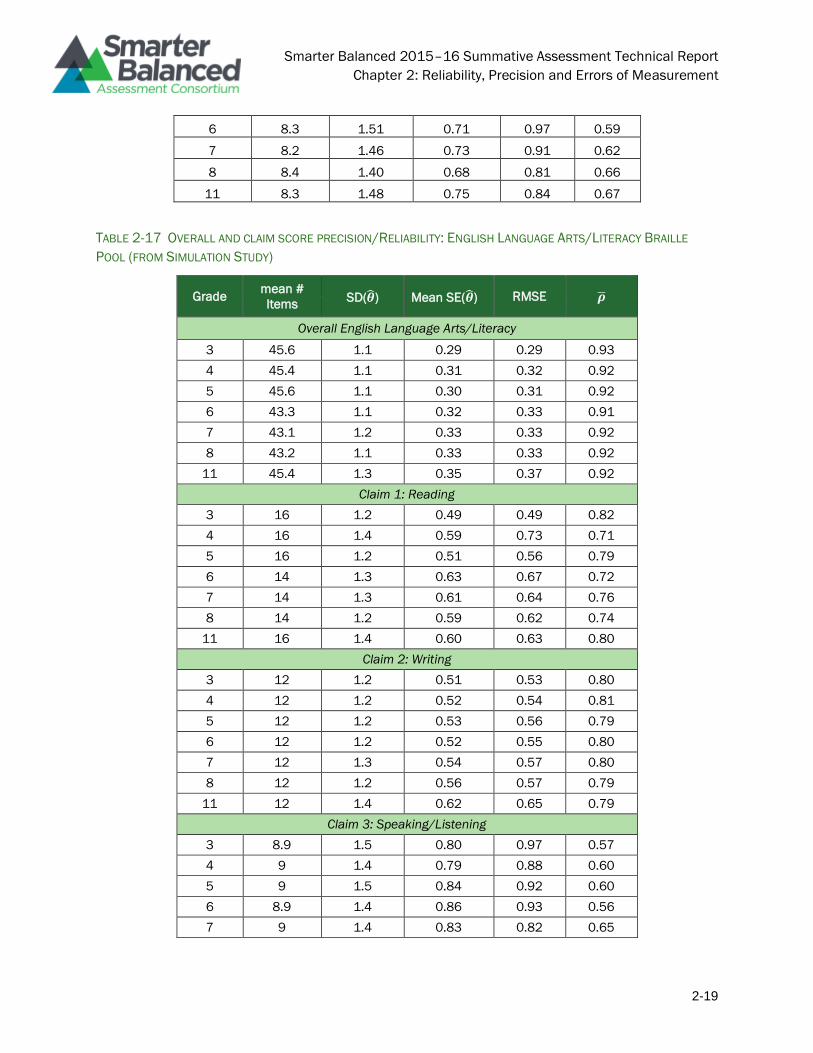
Smarter Balanced 2015–16 Summative Assessment Technical Report
Chapter 2: Reliability, Precision and Errors of Measurement
2-19
6 8.3 1.51 0.71 0.97 0.59
7 8.2 1.46 0.73 0.91 0.62
8 8.4 1.40 0.68 0.81 0.66
11 8.3 1.48 0.75 0.84 0.67
TABLE 2-17 OVERALL AND CLAIM SCORE PRECISION/RELIABILITY: ENGLISH LANGUAGE ARTS/LITERACY BRAILLE
POOL (FROM SIMULATION STUDY)
Grade mean #
Items SD(��) Mean SE(��) RMSE ��
Overall English Language Arts/Literacy
3 45.6 1.1 0.29 0.29 0.93
4 45.4 1.1 0.31 0.32 0.92
5 45.6 1.1 0.30 0.31 0.92
6 43.3 1.1 0.32 0.33 0.91
7 43.1 1.2 0.33 0.33 0.92
8 43.2 1.1 0.33 0.33 0.92
11 45.4 1.3 0.35 0.37 0.92
Claim 1: Reading
3 16 1.2 0.49 0.49 0.82
4 16 1.4 0.59 0.73 0.71
5 16 1.2 0.51 0.56 0.79
6 14 1.3 0.63 0.67 0.72
7 14 1.3 0.61 0.64 0.76
8 14 1.2 0.59 0.62 0.74
11 16 1.4 0.60 0.63 0.80
Claim 2: Writing
3 12 1.2 0.51 0.53 0.80
4 12 1.2 0.52 0.54 0.81
5 12 1.2 0.53 0.56 0.79
6 12 1.2 0.52 0.55 0.80
7 12 1.3 0.54 0.57 0.80
8 12 1.2 0.56 0.57 0.79
11 12 1.4 0.62 0.65 0.79
Claim 3: Speaking/Listening
3 8.9 1.5 0.80 0.97 0.57
4 9 1.4 0.79 0.88 0.60
5 9 1.5 0.84 0.92 0.60
6 8.9 1.4 0.86 0.93 0.56
7 9 1.4 0.83 0.82 0.65
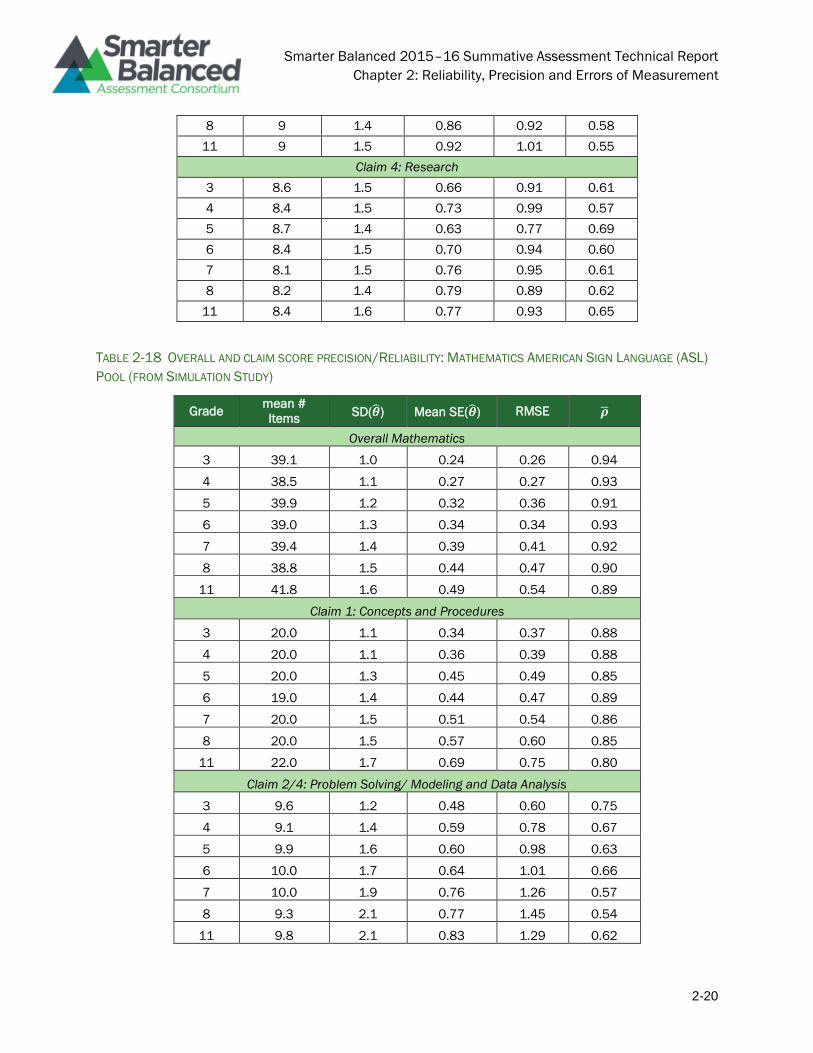
Smarter Balanced 2015–16 Summative Assessment Technical Report
Chapter 2: Reliability, Precision and Errors of Measurement
2-20
8 9 1.4 0.86 0.92 0.58
11 9 1.5 0.92 1.01 0.55
Claim 4: Research
3 8.6 1.5 0.66 0.91 0.61
4 8.4 1.5 0.73 0.99 0.57
5 8.7 1.4 0.63 0.77 0.69
6 8.4 1.5 0.70 0.94 0.60
7 8.1 1.5 0.76 0.95 0.61
8 8.2 1.4 0.79 0.89 0.62
11 8.4 1.6 0.77 0.93 0.65
TABLE 2-18 OVERALL AND CLAIM SCORE PRECISION/RELIABILITY: MATHEMATICS AMERICAN SIGN LANGUAGE (ASL)
POOL (FROM SIMULATION STUDY)
Grade mean #
Items SD(��) Mean SE(��) RMSE ��
Overall Mathematics
3 39.1 1.0 0.24 0.26 0.94
4 38.5 1.1 0.27 0.27 0.93
5 39.9 1.2 0.32 0.36 0.91
6 39.0 1.3 0.34 0.34 0.93
7 39.4 1.4 0.39 0.41 0.92
8 38.8 1.5 0.44 0.47 0.90
11 41.8 1.6 0.49 0.54 0.89
Claim 1: Concepts and Procedures
3 20.0 1.1 0.34 0.37 0.88
4 20.0 1.1 0.36 0.39 0.88
5 20.0 1.3 0.45 0.49 0.85
6 19.0 1.4 0.44 0.47 0.89
7 20.0 1.5 0.51 0.54 0.86
8 20.0 1.5 0.57 0.60 0.85
11 22.0 1.7 0.69 0.75 0.80
Claim 2/4: Problem Solving/ Modeling and Data Analysis
3 9.6 1.2 0.48 0.60 0.75
4 9.1 1.4 0.59 0.78 0.67
5 9.9 1.6 0.60 0.98 0.63
6 10.0 1.7 0.64 1.01 0.66
7 10.0 1.9 0.76 1.26 0.57
8 9.3 2.1 0.77 1.45 0.54
11 9.8 2.1 0.83 1.29 0.62
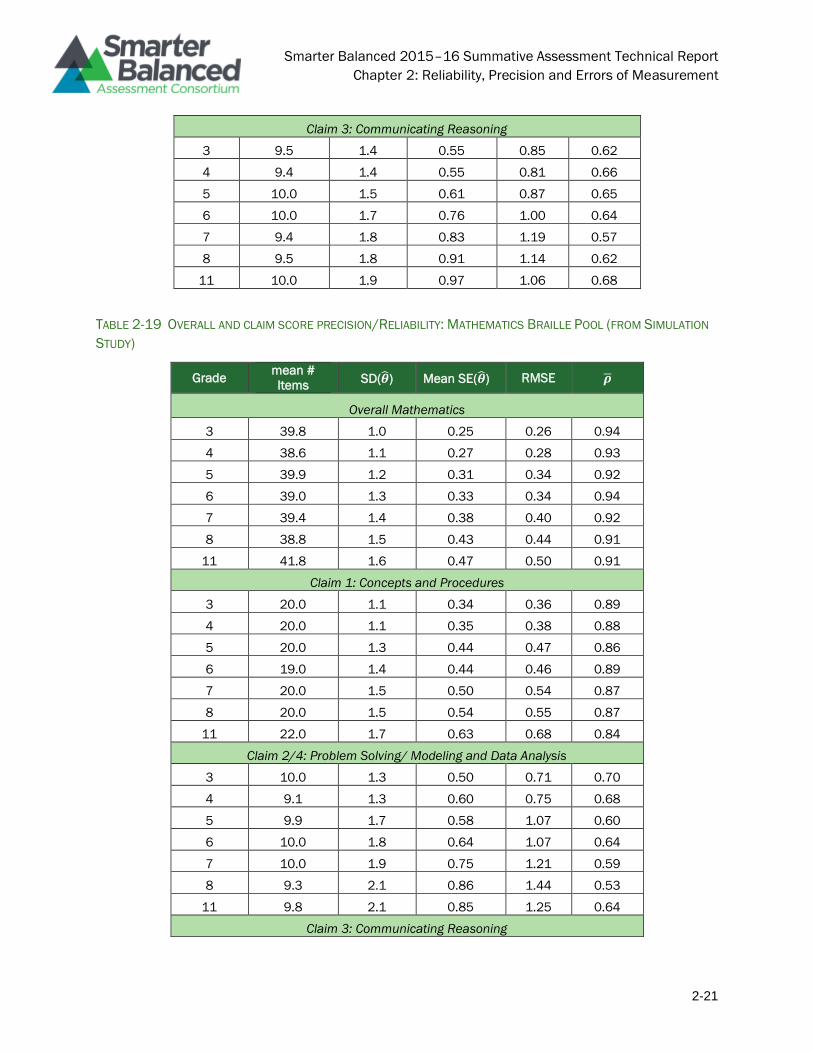
Smarter Balanced 2015–16 Summative Assessment Technical Report
Chapter 2: Reliability, Precision and Errors of Measurement
2-21
Claim 3: Communicating Reasoning
3 9.5 1.4 0.55 0.85 0.62
4 9.4 1.4 0.55 0.81 0.66
5 10.0 1.5 0.61 0.87 0.65
6 10.0 1.7 0.76 1.00 0.64
7 9.4 1.8 0.83 1.19 0.57
8 9.5 1.8 0.91 1.14 0.62
11 10.0 1.9 0.97 1.06 0.68
TABLE 2-19 OVERALL AND CLAIM SCORE PRECISION/RELIABILITY: MATHEMATICS BRAILLE POOL (FROM SIMULATION
STUDY)
Grade mean #
Items SD(��) Mean SE(��) RMSE ��
Overall Mathematics
3 39.8 1.0 0.25 0.26 0.94
4 38.6 1.1 0.27 0.28 0.93
5 39.9 1.2 0.31 0.34 0.92
6 39.0 1.3 0.33 0.34 0.94
7 39.4 1.4 0.38 0.40 0.92
8 38.8 1.5 0.43 0.44 0.91
11 41.8 1.6 0.47 0.50 0.91
Claim 1: Concepts and Procedures
3 20.0 1.1 0.34 0.36 0.89
4 20.0 1.1 0.35 0.38 0.88
5 20.0 1.3 0.44 0.47 0.86
6 19.0 1.4 0.44 0.46 0.89
7 20.0 1.5 0.50 0.54 0.87
8 20.0 1.5 0.54 0.55 0.87
11 22.0 1.7 0.63 0.68 0.84
Claim 2/4: Problem Solving/ Modeling and Data Analysis
3 10.0 1.3 0.50 0.71 0.70
4 9.1 1.3 0.60 0.75 0.68
5 9.9 1.7 0.58 1.07 0.60
6 10.0 1.8 0.64 1.07 0.64
7 10.0 1.9 0.75 1.21 0.59
8 9.3 2.1 0.86 1.44 0.53
11 9.8 2.1 0.85 1.25 0.64
Claim 3: Communicating Reasoning
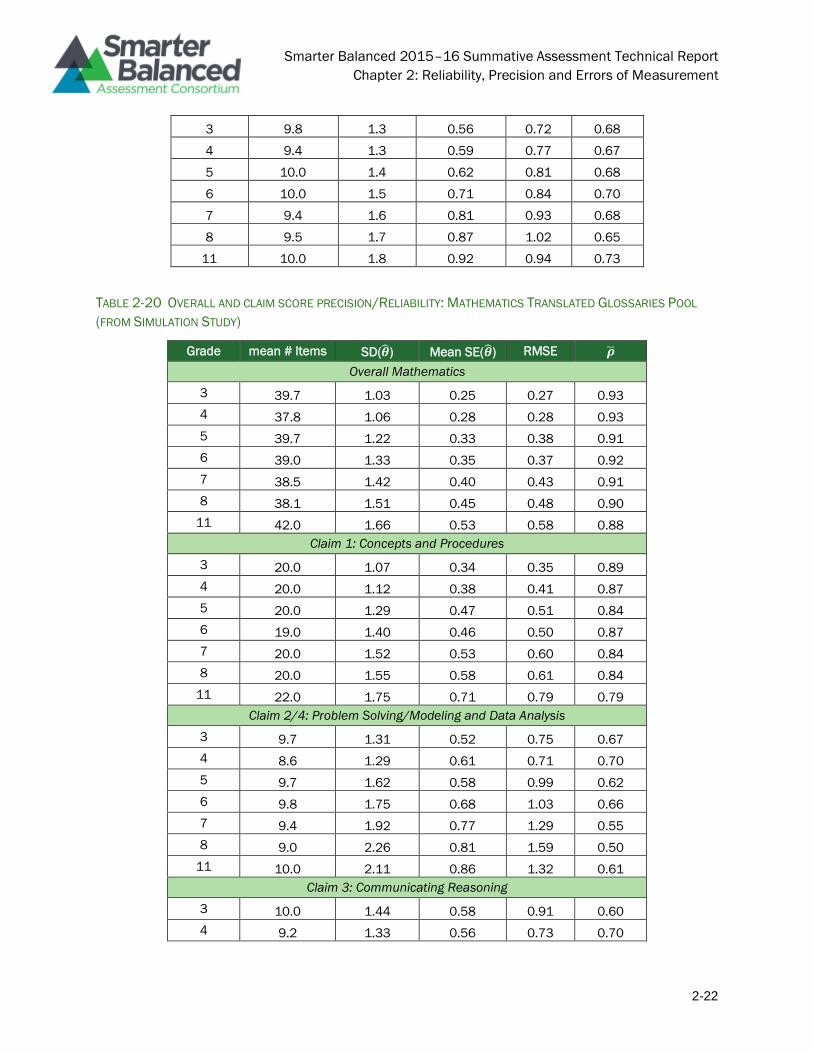
Smarter Balanced 2015–16 Summative Assessment Technical Report
Chapter 2: Reliability, Precision and Errors of Measurement
2-22
3 9.8 1.3 0.56 0.72 0.68
4 9.4 1.3 0.59 0.77 0.67
5 10.0 1.4 0.62 0.81 0.68
6 10.0 1.5 0.71 0.84 0.70
7 9.4 1.6 0.81 0.93 0.68
8 9.5 1.7 0.87 1.02 0.65
11 10.0 1.8 0.92 0.94 0.73
TABLE 2-20 OVERALL AND CLAIM SCORE PRECISION/RELIABILITY: MATHEMATICS TRANSLATED GLOSSARIES POOL
(FROM SIMULATION STUDY)
Grade mean # Items SD(��) Mean SE(��) RMSE ��
Overall Mathematics
3 39.7 1.03 0.25 0.27 0.93
4 37.8 1.06 0.28 0.28 0.93
5 39.7 1.22 0.33 0.38 0.91
6 39.0 1.33 0.35 0.37 0.92
7 38.5 1.42 0.40 0.43 0.91
8 38.1 1.51 0.45 0.48 0.90
11 42.0 1.66 0.53 0.58 0.88
Claim 1: Concepts and Procedures
3 20.0 1.07 0.34 0.35 0.89
4 20.0 1.12 0.38 0.41 0.87
5 20.0 1.29 0.47 0.51 0.84
6 19.0 1.40 0.46 0.50 0.87
7 20.0 1.52 0.53 0.60 0.84
8 20.0 1.55 0.58 0.61 0.84
11 22.0 1.75 0.71 0.79 0.79
Claim 2/4: Problem Solving/Modeling and Data Analysis
3 9.7 1.31 0.52 0.75 0.67
4 8.6 1.29 0.61 0.71 0.70
5 9.7 1.62 0.58 0.99 0.62
6 9.8 1.75 0.68 1.03 0.66
7 9.4 1.92 0.77 1.29 0.55
8 9.0 2.26 0.81 1.59 0.50
11 10.0 2.11 0.86 1.32 0.61
Claim 3: Communicating Reasoning
3 10.0 1.44 0.58 0.91 0.60
4 9.2 1.33 0.56 0.73 0.70
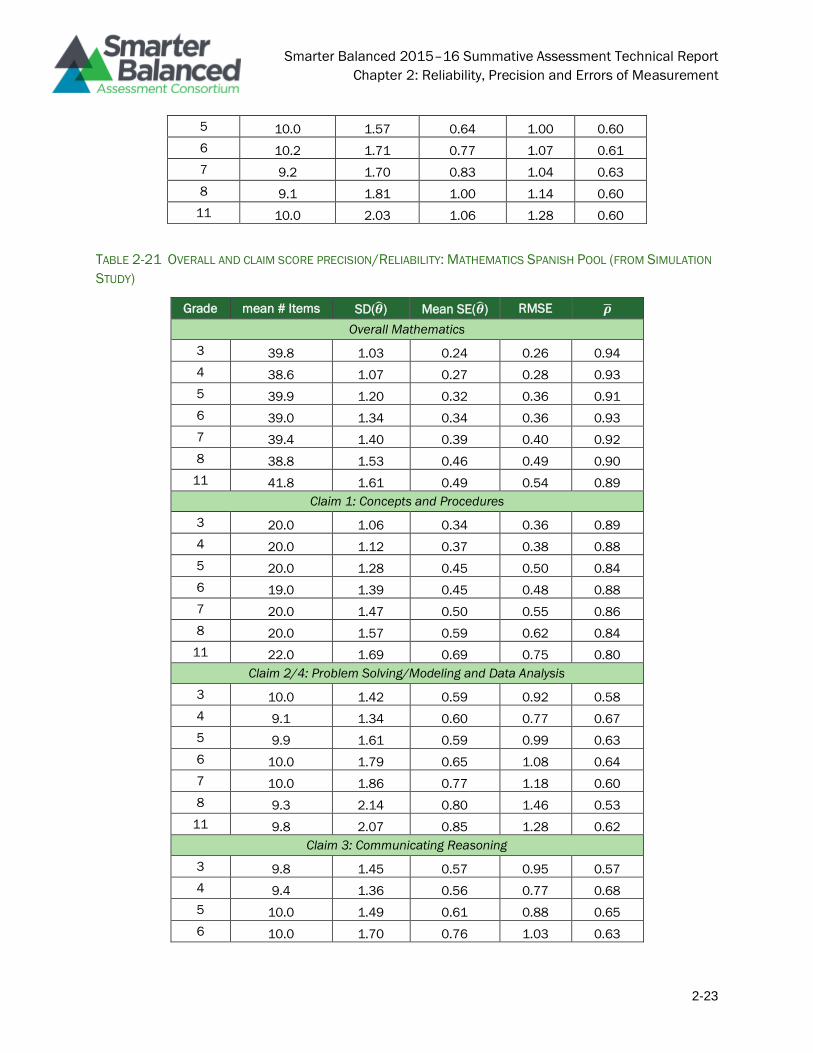
Smarter Balanced 2015–16 Summative Assessment Technical Report
Chapter 2: Reliability, Precision and Errors of Measurement
2-23
5 10.0 1.57 0.64 1.00 0.60
6 10.2 1.71 0.77 1.07 0.61
7 9.2 1.70 0.83 1.04 0.63
8 9.1 1.81 1.00 1.14 0.60
11 10.0 2.03 1.06 1.28 0.60
TABLE 2-21 OVERALL AND CLAIM SCORE PRECISION/RELIABILITY: MATHEMATICS SPANISH POOL (FROM SIMULATION
STUDY)
Grade mean # Items SD(��) Mean SE(��) RMSE ��
Overall Mathematics
3 39.8 1.03 0.24 0.26 0.94
4 38.6 1.07 0.27 0.28 0.93
5 39.9 1.20 0.32 0.36 0.91
6 39.0 1.34 0.34 0.36 0.93
7 39.4 1.40 0.39 0.40 0.92
8 38.8 1.53 0.46 0.49 0.90
11 41.8 1.61 0.49 0.54 0.89
Claim 1: Concepts and Procedures
3 20.0 1.06 0.34 0.36 0.89
4 20.0 1.12 0.37 0.38 0.88
5 20.0 1.28 0.45 0.50 0.84
6 19.0 1.39 0.45 0.48 0.88
7 20.0 1.47 0.50 0.55 0.86
8 20.0 1.57 0.59 0.62 0.84
11 22.0 1.69 0.69 0.75 0.80
Claim 2/4: Problem Solving/Modeling and Data Analysis
3 10.0 1.42 0.59 0.92 0.58
4 9.1 1.34 0.60 0.77 0.67
5 9.9 1.61 0.59 0.99 0.63
6 10.0 1.79 0.65 1.08 0.64
7 10.0 1.86 0.77 1.18 0.60
8 9.3 2.14 0.80 1.46 0.53
11 9.8 2.07 0.85 1.28 0.62
Claim 3: Communicating Reasoning
3 9.8 1.45 0.57 0.95 0.57
4 9.4 1.36 0.56 0.77 0.68
5 10.0 1.49 0.61 0.88 0.65
6 10.0 1.70 0.76 1.03 0.63
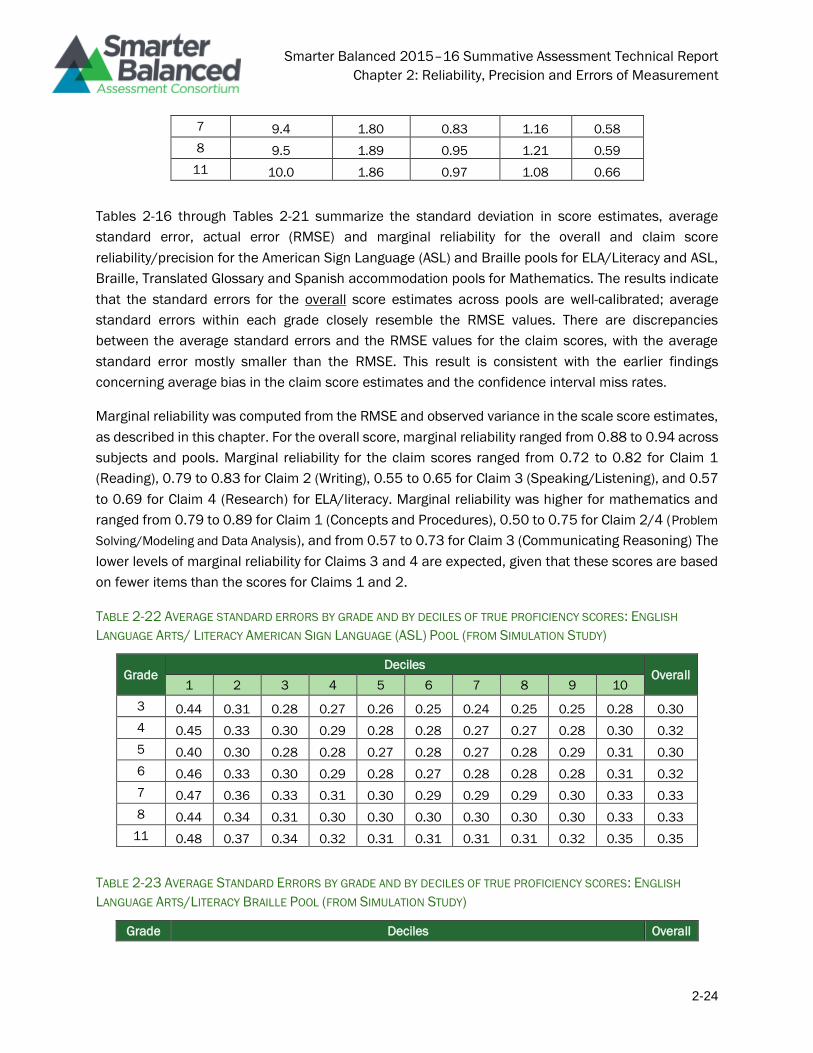
Smarter Balanced 2015–16 Summative Assessment Technical Report
Chapter 2: Reliability, Precision and Errors of Measurement
2-24
7 9.4 1.80 0.83 1.16 0.58
8 9.5 1.89 0.95 1.21 0.59
11 10.0 1.86 0.97 1.08 0.66
Tables 2-16 through Tables 2-21 summarize the standard deviation in score estimates, average
standard error, actual error (RMSE) and marginal reliability for the overall and claim score
reliability/precision for the American Sign Language (ASL) and Braille pools for ELA/Literacy and ASL,
Braille, Translated Glossary and Spanish accommodation pools for Mathematics. The results indicate
that the standard errors for the overall score estimates across pools are well-calibrated; average
standard errors within each grade closely resemble the RMSE values. There are discrepancies
between the average standard errors and the RMSE values for the claim scores, with the average
standard error mostly smaller than the RMSE. This result is consistent with the earlier findings
concerning average bias in the claim score estimates and the confidence interval miss rates.
Marginal reliability was computed from the RMSE and observed variance in the scale score estimates,
as described in this chapter. For the overall score, marginal reliability ranged from 0.88 to 0.94 across
subjects and pools. Marginal reliability for the claim scores ranged from 0.72 to 0.82 for Claim 1
(Reading), 0.79 to 0.83 for Claim 2 (Writing), 0.55 to 0.65 for Claim 3 (Speaking/Listening), and 0.57
to 0.69 for Claim 4 (Research) for ELA/literacy. Marginal reliability was higher for mathematics and
ranged from 0.79 to 0.89 for Claim 1 (Concepts and Procedures), 0.50 to 0.75 for Claim 2/4 (Problem
Solving/Modeling and Data Analysis), and from 0.57 to 0.73 for Claim 3 (Communicating Reasoning) The
lower levels of marginal reliability for Claims 3 and 4 are expected, given that these scores are based
on fewer items than the scores for Claims 1 and 2.
TABLE 2-22 AVERAGE STANDARD ERRORS BY GRADE AND BY DECILES OF TRUE PROFICIENCY SCORES: ENGLISH
LANGUAGE ARTS/ LITERACY AMERICAN SIGN LANGUAGE (ASL) POOL (FROM SIMULATION STUDY)
Grade Deciles
Overall 1 2 3 4 5 6 7 8 9 10
3 0.44 0.31 0.28 0.27 0.26 0.25 0.24 0.25 0.25 0.28 0.30
4 0.45 0.33 0.30 0.29 0.28 0.28 0.27 0.27 0.28 0.30 0.32
5 0.40 0.30 0.28 0.28 0.27 0.28 0.27 0.28 0.29 0.31 0.30
6 0.46 0.33 0.30 0.29 0.28 0.27 0.28 0.28 0.28 0.31 0.32
7 0.47 0.36 0.33 0.31 0.30 0.29 0.29 0.29 0.30 0.33 0.33
8 0.44 0.34 0.31 0.30 0.30 0.30 0.30 0.30 0.30 0.33 0.33
11 0.48 0.37 0.34 0.32 0.31 0.31 0.31 0.31 0.32 0.35 0.35
TABLE 2-23 AVERAGE STANDARD ERRORS BY GRADE AND BY DECILES OF TRUE PROFICIENCY SCORES: ENGLISH
LANGUAGE ARTS/LITERACY BRAILLE POOL (FROM SIMULATION STUDY)
Grade Deciles Overall
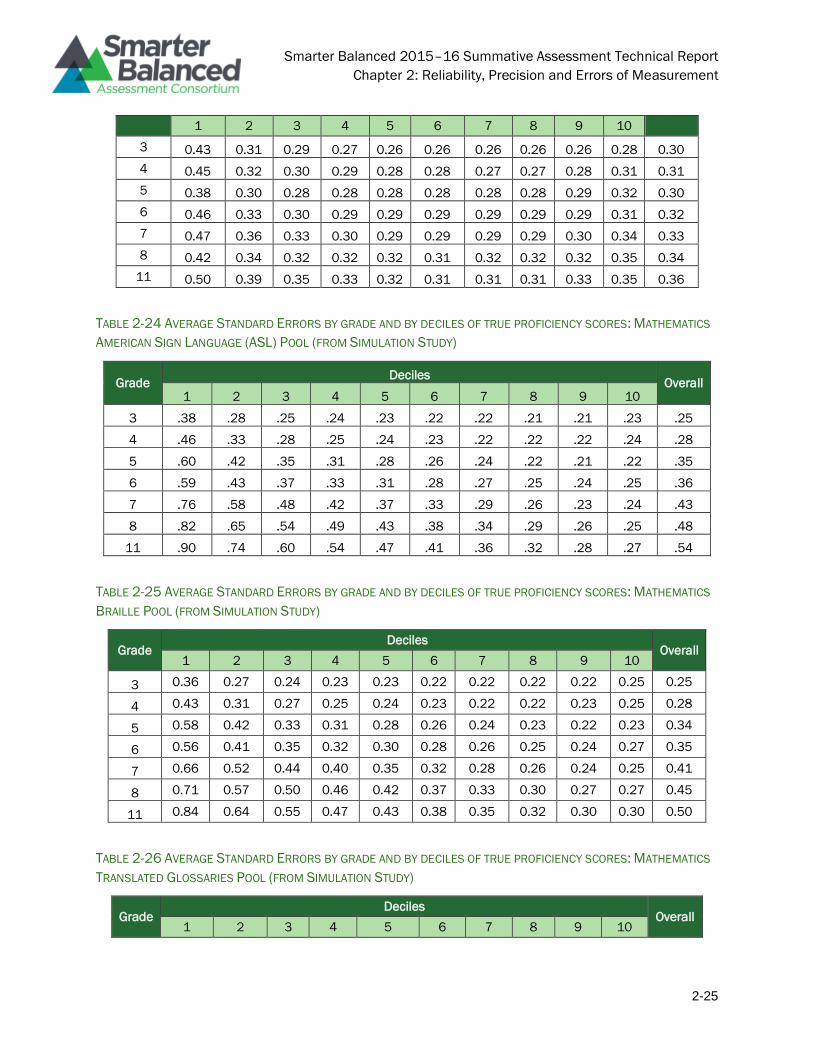
Smarter Balanced 2015–16 Summative Assessment Technical Report
Chapter 2: Reliability, Precision and Errors of Measurement
2-25
1 2 3 4 5 6 7 8 9 10
3 0.43 0.31 0.29 0.27 0.26 0.26 0.26 0.26 0.26 0.28 0.30
4 0.45 0.32 0.30 0.29 0.28 0.28 0.27 0.27 0.28 0.31 0.31
5 0.38 0.30 0.28 0.28 0.28 0.28 0.28 0.28 0.29 0.32 0.30
6 0.46 0.33 0.30 0.29 0.29 0.29 0.29 0.29 0.29 0.31 0.32
7 0.47 0.36 0.33 0.30 0.29 0.29 0.29 0.29 0.30 0.34 0.33
8 0.42 0.34 0.32 0.32 0.32 0.31 0.32 0.32 0.32 0.35 0.34
11 0.50 0.39 0.35 0.33 0.32 0.31 0.31 0.31 0.33 0.35 0.36
TABLE 2-24 AVERAGE STANDARD ERRORS BY GRADE AND BY DECILES OF TRUE PROFICIENCY SCORES: MATHEMATICS
AMERICAN SIGN LANGUAGE (ASL) POOL (FROM SIMULATION STUDY)
Grade Deciles
Overall 1 2 3 4 5 6 7 8 9 10
3 .38 .28 .25 .24 .23 .22 .22 .21 .21 .23 .25
4 .46 .33 .28 .25 .24 .23 .22 .22 .22 .24 .28
5 .60 .42 .35 .31 .28 .26 .24 .22 .21 .22 .35
6 .59 .43 .37 .33 .31 .28 .27 .25 .24 .25 .36
7 .76 .58 .48 .42 .37 .33 .29 .26 .23 .24 .43
8 .82 .65 .54 .49 .43 .38 .34 .29 .26 .25 .48
11 .90 .74 .60 .54 .47 .41 .36 .32 .28 .27 .54
TABLE 2-25 AVERAGE STANDARD ERRORS BY GRADE AND BY DECILES OF TRUE PROFICIENCY SCORES: MATHEMATICS
BRAILLE POOL (FROM SIMULATION STUDY)
Grade Deciles
Overall 1 2 3 4 5 6 7 8 9 10
3 0.36 0.27 0.24 0.23 0.23 0.22 0.22 0.22 0.22 0.25 0.25
4 0.43 0.31 0.27 0.25 0.24 0.23 0.22 0.22 0.23 0.25 0.28
5 0.58 0.42 0.33 0.31 0.28 0.26 0.24 0.23 0.22 0.23 0.34
6 0.56 0.41 0.35 0.32 0.30 0.28 0.26 0.25 0.24 0.27 0.35
7 0.66 0.52 0.44 0.40 0.35 0.32 0.28 0.26 0.24 0.25 0.41
8 0.71 0.57 0.50 0.46 0.42 0.37 0.33 0.30 0.27 0.27 0.45
11 0.84 0.64 0.55 0.47 0.43 0.38 0.35 0.32 0.30 0.30 0.50
TABLE 2-26 AVERAGE STANDARD ERRORS BY GRADE AND BY DECILES OF TRUE PROFICIENCY SCORES: MATHEMATICS
TRANSLATED GLOSSARIES POOL (FROM SIMULATION STUDY)
Grade Deciles
Overall 1 2 3 4 5 6 7 8 9 10
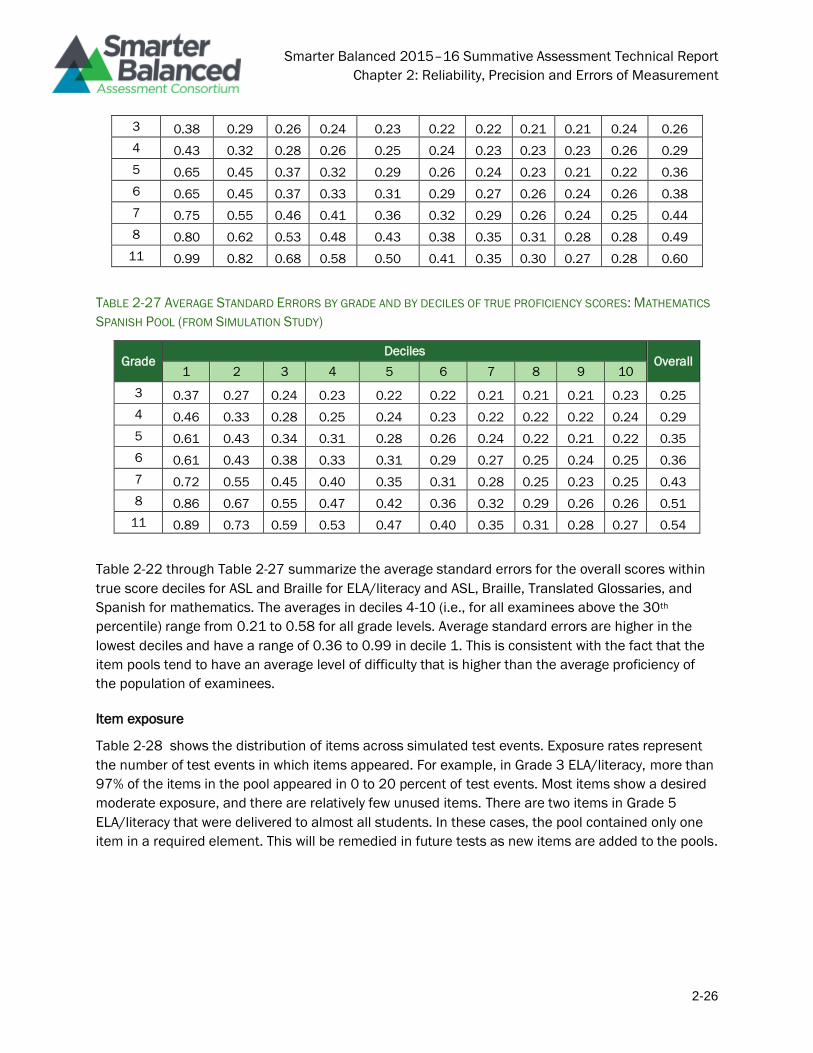
Smarter Balanced 2015–16 Summative Assessment Technical Report
Chapter 2: Reliability, Precision and Errors of Measurement
2-26
3 0.38 0.29 0.26 0.24 0.23 0.22 0.22 0.21 0.21 0.24 0.26
4 0.43 0.32 0.28 0.26 0.25 0.24 0.23 0.23 0.23 0.26 0.29
5 0.65 0.45 0.37 0.32 0.29 0.26 0.24 0.23 0.21 0.22 0.36
6 0.65 0.45 0.37 0.33 0.31 0.29 0.27 0.26 0.24 0.26 0.38
7 0.75 0.55 0.46 0.41 0.36 0.32 0.29 0.26 0.24 0.25 0.44
8 0.80 0.62 0.53 0.48 0.43 0.38 0.35 0.31 0.28 0.28 0.49
11 0.99 0.82 0.68 0.58 0.50 0.41 0.35 0.30 0.27 0.28 0.60
TABLE 2-27 AVERAGE STANDARD ERRORS BY GRADE AND BY DECILES OF TRUE PROFICIENCY SCORES: MATHEMATICS
SPANISH POOL (FROM SIMULATION STUDY)
Grade Deciles
Overall 1 2 3 4 5 6 7 8 9 10
3 0.37 0.27 0.24 0.23 0.22 0.22 0.21 0.21 0.21 0.23 0.25
4 0.46 0.33 0.28 0.25 0.24 0.23 0.22 0.22 0.22 0.24 0.29
5 0.61 0.43 0.34 0.31 0.28 0.26 0.24 0.22 0.21 0.22 0.35
6 0.61 0.43 0.38 0.33 0.31 0.29 0.27 0.25 0.24 0.25 0.36
7 0.72 0.55 0.45 0.40 0.35 0.31 0.28 0.25 0.23 0.25 0.43
8 0.86 0.67 0.55 0.47 0.42 0.36 0.32 0.29 0.26 0.26 0.51
11 0.89 0.73 0.59 0.53 0.47 0.40 0.35 0.31 0.28 0.27 0.54
Table 2-22 through Table 2-27 summarize the average standard errors for the overall scores within
true score deciles for ASL and Braille for ELA/literacy and ASL, Braille, Translated Glossaries, and
Spanish for mathematics. The averages in deciles 4-10 (i.e., for all examinees above the 30th
percentile) range from 0.21 to 0.58 for all grade levels. Average standard errors are higher in the
lowest deciles and have a range of 0.36 to 0.99 in decile 1. This is consistent with the fact that the
item pools tend to have an average level of difficulty that is higher than the average proficiency of
the population of examinees.
Item exposure
Table 2-28 shows the distribution of items across simulated test events. Exposure rates represent
the number of test events in which items appeared. For example, in Grade 3 ELA/literacy, more than
97% of the items in the pool appeared in 0 to 20 percent of test events. Most items show a desired
moderate exposure, and there are relatively few unused items. There are two items in Grade 5
ELA/literacy that were delivered to almost all students. In these cases, the pool contained only one
item in a required element. This will be remedied in future tests as new items are added to the pools.
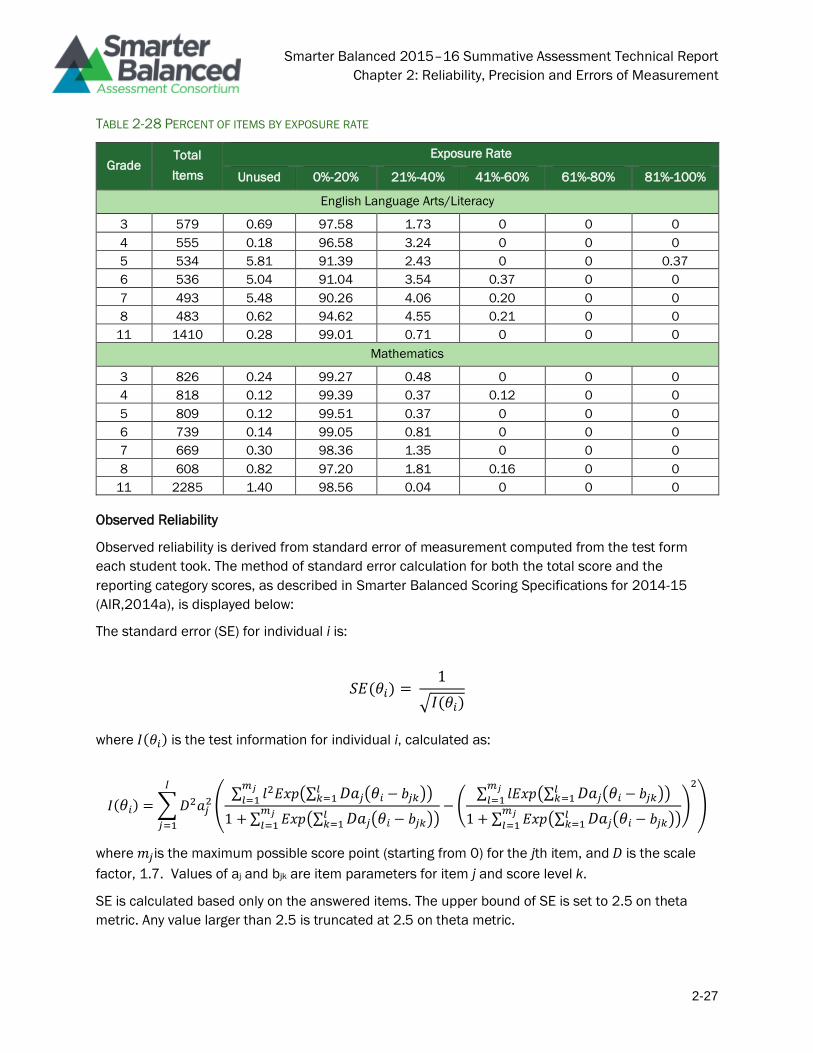
Smarter Balanced 2015–16 Summative Assessment Technical Report
Chapter 2: Reliability, Precision and Errors of Measurement
2-27
TABLE 2-28 PERCENT OF ITEMS BY EXPOSURE RATE
Grade Total
Items
Exposure Rate
Unused 0%-20% 21%-40% 41%-60% 61%-80% 81%-100%
English Language Arts/Literacy
3 579 0.69 97.58 1.73 0 0 0
4 555 0.18 96.58 3.24 0 0 0
5 534 5.81 91.39 2.43 0 0 0.37
6 536 5.04 91.04 3.54 0.37 0 0
7 493 5.48 90.26 4.06 0.20 0 0
8 483 0.62 94.62 4.55 0.21 0 0
11 1410 0.28 99.01 0.71 0 0 0
Mathematics
3 826 0.24 99.27 0.48 0 0 0
4 818 0.12 99.39 0.37 0.12 0 0
5 809 0.12 99.51 0.37 0 0 0
6 739 0.14 99.05 0.81 0 0 0
7 669 0.30 98.36 1.35 0 0 0
8 608 0.82 97.20 1.81 0.16 0 0
11 2285 1.40 98.56 0.04 0 0 0
Observed Reliability
Observed reliability is derived from standard error of measurement computed from the test form
each student took. The method of standard error calculation for both the total score and the
reporting category scores, as described in Smarter Balanced Scoring Specifications for 2014-15
(AIR,2014a), is displayed below:
The standard error (SE) for individual i is:
𝑆𝐸(𝜃𝑖) = 1
√𝐼(𝜃𝑖)
where 𝐼(𝜃𝑖) is the test information for individual i, calculated as:
𝐼(𝜃𝑖) = ∑ 𝐷2𝑎𝑗2 (
∑ 𝑙2𝐸𝑥𝑝(∑ 𝐷𝑎𝑗(𝜃𝑖 − 𝑏𝑗𝑘)𝑙𝑘=1 )
𝑚𝑗
𝑙=1
1 + ∑ 𝐸𝑥𝑝(∑ 𝐷𝑎𝑗(𝜃𝑖 − 𝑏𝑗𝑘)𝑙𝑘=1 )
𝑚𝑗
𝑙=1
− (∑ 𝑙𝐸𝑥𝑝(∑ 𝐷𝑎𝑗(𝜃𝑖 − 𝑏𝑗𝑘)𝑙
𝑘=1 )𝑚𝑗
𝑙=1
1 + ∑ 𝐸𝑥𝑝(∑ 𝐷𝑎𝑗(𝜃𝑖 − 𝑏𝑗𝑘)𝑙𝑘=1 )
𝑚𝑗
𝑙=1
)
2
)
𝐼
𝑗=1
where 𝑚𝑗is the maximum possible score point (starting from 0) for the jth item, and 𝐷 is the scale
factor, 1.7. Values of aj and bjk are item parameters for item j and score level k.
SE is calculated based only on the answered items. The upper bound of SE is set to 2.5 on theta
metric. Any value larger than 2.5 is truncated at 2.5 on theta metric.
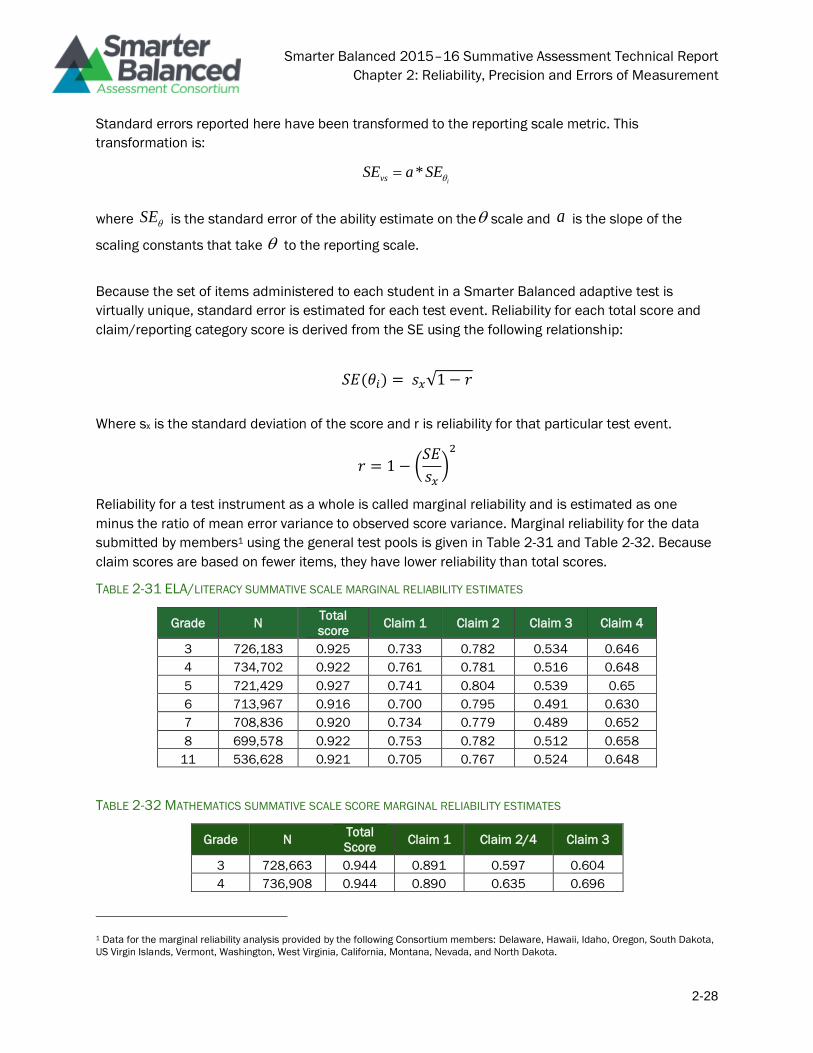
Smarter Balanced 2015–16 Summative Assessment Technical Report
Chapter 2: Reliability, Precision and Errors of Measurement
2-28
Standard errors reported here have been transformed to the reporting scale metric. This
transformation is:
where is the standard error of the ability estimate on the scale and is the slope of the
scaling constants that take to the reporting scale.
Because the set of items administered to each student in a Smarter Balanced adaptive test is
virtually unique, standard error is estimated for each test event. Reliability for each total score and
claim/reporting category score is derived from the SE using the following relationship:
𝑆𝐸(𝜃𝑖) = 𝑠𝑥√1 − 𝑟
Where sx is the standard deviation of the score and r is reliability for that particular test event.
𝑟 = 1 − (𝑆𝐸
𝑠𝑥)
2
Reliability for a test instrument as a whole is called marginal reliability and is estimated as one
minus the ratio of mean error variance to observed score variance. Marginal reliability for the data
submitted by members1 using the general test pools is given in Table 2-31 and Table 2-32. Because
claim scores are based on fewer items, they have lower reliability than total scores.
TABLE 2-31 ELA/LITERACY SUMMATIVE SCALE MARGINAL RELIABILITY ESTIMATES
Grade N Total
score Claim 1 Claim 2 Claim 3 Claim 4
3 726,183 0.925 0.733 0.782 0.534 0.646
4 734,702 0.922 0.761 0.781 0.516 0.648
5 721,429 0.927 0.741 0.804 0.539 0.65
6 713,967 0.916 0.700 0.795 0.491 0.630
7 708,836 0.920 0.734 0.779 0.489 0.652
8 699,578 0.922 0.753 0.782 0.512 0.658
11 536,628 0.921 0.705 0.767 0.524 0.648
TABLE 2-32 MATHEMATICS SUMMATIVE SCALE SCORE MARGINAL RELIABILITY ESTIMATES
Grade N Total
Score Claim 1 Claim 2/4 Claim 3
3 728,663 0.944 0.891 0.597 0.604
4 736,908 0.944 0.890 0.635 0.696
1 Data for the marginal reliability analysis provided by the following Consortium members: Delaware, Hawaii, Idaho, Oregon, South Dakota,
US Virgin Islands, Vermont, Washington, West Virginia, California, Montana, Nevada, and North Dakota.
*ivsSE a SE
SE a
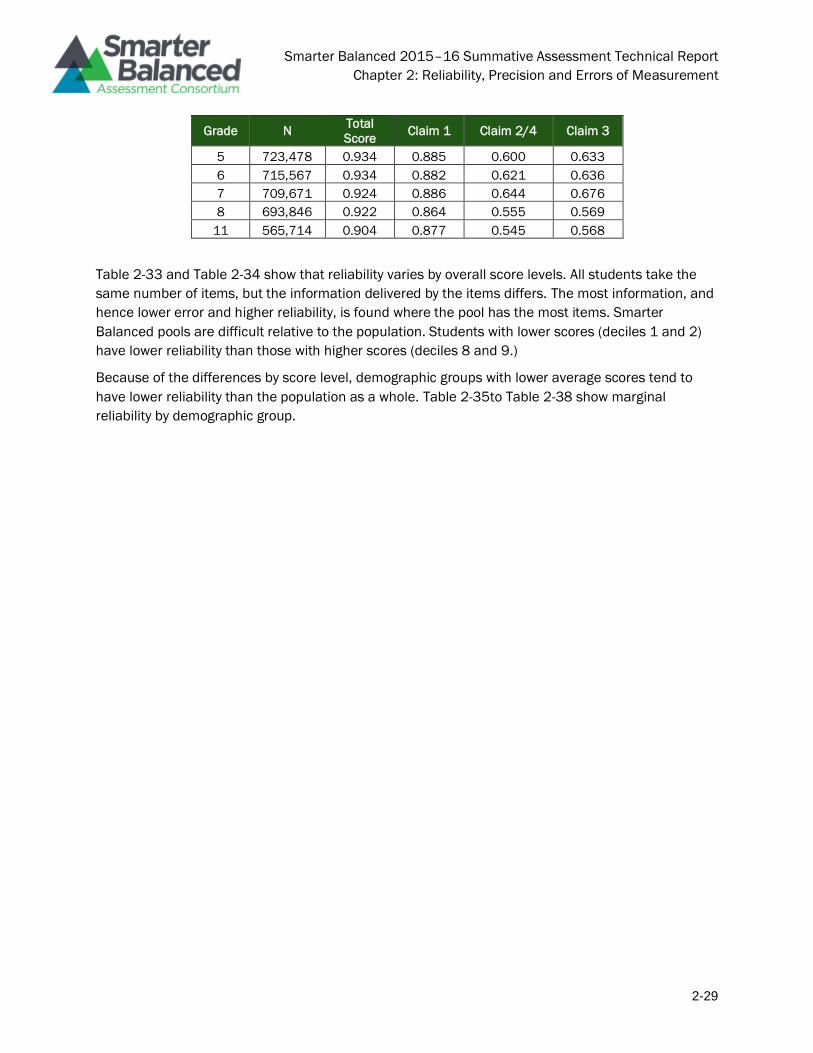
Smarter Balanced 2015–16 Summative Assessment Technical Report
Chapter 2: Reliability, Precision and Errors of Measurement
2-29
Grade N Total
Score Claim 1 Claim 2/4 Claim 3
5 723,478 0.934 0.885 0.600 0.633
6 715,567 0.934 0.882 0.621 0.636
7 709,671 0.924 0.886 0.644 0.676
8 693,846 0.922 0.864 0.555 0.569
11 565,714 0.904 0.877 0.545 0.568
Table 2-33 and Table 2-34 show that reliability varies by overall score levels. All students take the
same number of items, but the information delivered by the items differs. The most information, and
hence lower error and higher reliability, is found where the pool has the most items. Smarter
Balanced pools are difficult relative to the population. Students with lower scores (deciles 1 and 2)
have lower reliability than those with higher scores (deciles 8 and 9.)
Because of the differences by score level, demographic groups with lower average scores tend to
have lower reliability than the population as a whole. Table 2-35to Table 2-38 show marginal
reliability by demographic group.
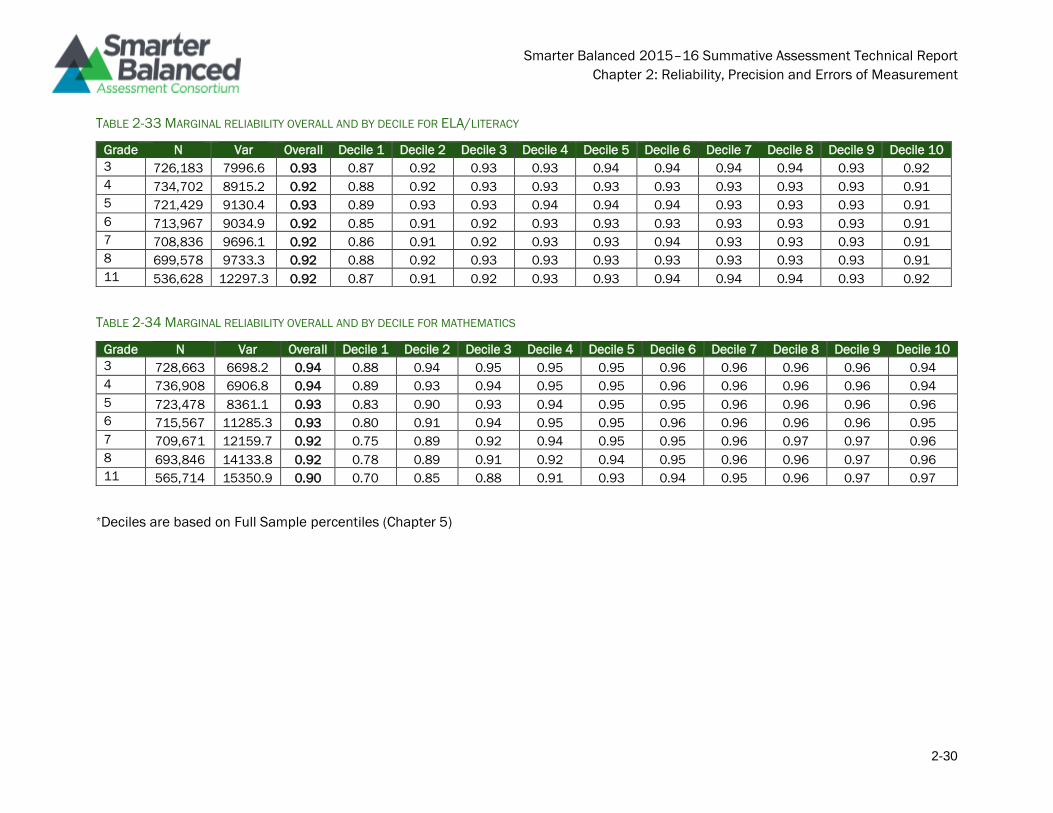
Smarter Balanced 2015–16 Summative Assessment Technical Report
Chapter 2: Reliability, Precision and Errors of Measurement
2-30
TABLE 2-33 MARGINAL RELIABILITY OVERALL AND BY DECILE FOR ELA/LITERACY
Grade N Var Overall Decile 1 Decile 2 Decile 3 Decile 4 Decile 5 Decile 6 Decile 7 Decile 8 Decile 9 Decile 10
3 726,183 7996.6 0.93 0.87 0.92 0.93 0.93 0.94 0.94 0.94 0.94 0.93 0.92
4 734,702 8915.2 0.92 0.88 0.92 0.93 0.93 0.93 0.93 0.93 0.93 0.93 0.91
5 721,429 9130.4 0.93 0.89 0.93 0.93 0.94 0.94 0.94 0.93 0.93 0.93 0.91
6 713,967 9034.9 0.92 0.85 0.91 0.92 0.93 0.93 0.93 0.93 0.93 0.93 0.91
7 708,836 9696.1 0.92 0.86 0.91 0.92 0.93 0.93 0.94 0.93 0.93 0.93 0.91
8 699,578 9733.3 0.92 0.88 0.92 0.93 0.93 0.93 0.93 0.93 0.93 0.93 0.91
11 536,628 12297.3 0.92 0.87 0.91 0.92 0.93 0.93 0.94 0.94 0.94 0.93 0.92
TABLE 2-34 MARGINAL RELIABILITY OVERALL AND BY DECILE FOR MATHEMATICS
Grade N Var Overall Decile 1 Decile 2 Decile 3 Decile 4 Decile 5 Decile 6 Decile 7 Decile 8 Decile 9 Decile 10
3 728,663 6698.2 0.94 0.88 0.94 0.95 0.95 0.95 0.96 0.96 0.96 0.96 0.94
4 736,908 6906.8 0.94 0.89 0.93 0.94 0.95 0.95 0.96 0.96 0.96 0.96 0.94
5 723,478 8361.1 0.93 0.83 0.90 0.93 0.94 0.95 0.95 0.96 0.96 0.96 0.96
6 715,567 11285.3 0.93 0.80 0.91 0.94 0.95 0.95 0.96 0.96 0.96 0.96 0.95
7 709,671 12159.7 0.92 0.75 0.89 0.92 0.94 0.95 0.95 0.96 0.97 0.97 0.96
8 693,846 14133.8 0.92 0.78 0.89 0.91 0.92 0.94 0.95 0.96 0.96 0.97 0.96
11 565,714 15350.9 0.90 0.70 0.85 0.88 0.91 0.93 0.94 0.95 0.96 0.97 0.97
*Deciles are based on Full Sample percentiles (Chapter 5)
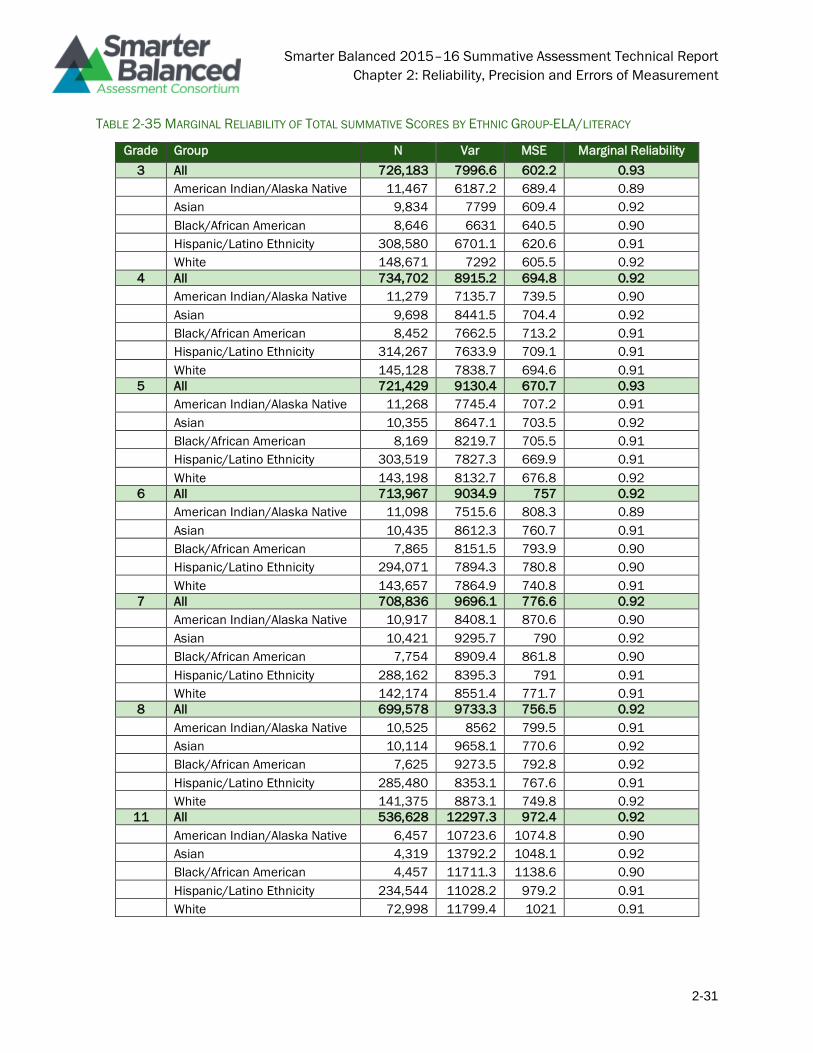
Smarter Balanced 2015–16 Summative Assessment Technical Report
Chapter 2: Reliability, Precision and Errors of Measurement
2-31
TABLE 2-35 MARGINAL RELIABILITY OF TOTAL SUMMATIVE SCORES BY ETHNIC GROUP-ELA/LITERACY
Grade Group N Var MSE Marginal Reliability
3 All 726,183 7996.6 602.2 0.93
American Indian/Alaska Native 11,467 6187.2 689.4 0.89
Asian 9,834 7799 609.4 0.92
Black/African American 8,646 6631 640.5 0.90
Hispanic/Latino Ethnicity 308,580 6701.1 620.6 0.91
White 148,671 7292 605.5 0.92
4 All 734,702 8915.2 694.8 0.92
American Indian/Alaska Native 11,279 7135.7 739.5 0.90
Asian 9,698 8441.5 704.4 0.92
Black/African American 8,452 7662.5 713.2 0.91
Hispanic/Latino Ethnicity 314,267 7633.9 709.1 0.91
White 145,128 7838.7 694.6 0.91
5 All 721,429 9130.4 670.7 0.93
American Indian/Alaska Native 11,268 7745.4 707.2 0.91
Asian 10,355 8647.1 703.5 0.92
Black/African American 8,169 8219.7 705.5 0.91
Hispanic/Latino Ethnicity 303,519 7827.3 669.9 0.91
White 143,198 8132.7 676.8 0.92
6 All 713,967 9034.9 757 0.92
American Indian/Alaska Native 11,098 7515.6 808.3 0.89
Asian 10,435 8612.3 760.7 0.91
Black/African American 7,865 8151.5 793.9 0.90
Hispanic/Latino Ethnicity 294,071 7894.3 780.8 0.90
White 143,657 7864.9 740.8 0.91
7 All 708,836 9696.1 776.6 0.92
American Indian/Alaska Native 10,917 8408.1 870.6 0.90
Asian 10,421 9295.7 790 0.92
Black/African American 7,754 8909.4 861.8 0.90
Hispanic/Latino Ethnicity 288,162 8395.3 791 0.91
White 142,174 8551.4 771.7 0.91
8 All 699,578 9733.3 756.5 0.92
American Indian/Alaska Native 10,525 8562 799.5 0.91
Asian 10,114 9658.1 770.6 0.92
Black/African American 7,625 9273.5 792.8 0.92
Hispanic/Latino Ethnicity 285,480 8353.1 767.6 0.91
White 141,375 8873.1 749.8 0.92
11 All 536,628 12297.3 972.4 0.92
American Indian/Alaska Native 6,457 10723.6 1074.8 0.90
Asian 4,319 13792.2 1048.1 0.92
Black/African American 4,457 11711.3 1138.6 0.90
Hispanic/Latino Ethnicity 234,544 11028.2 979.2 0.91
White 72,998 11799.4 1021 0.91
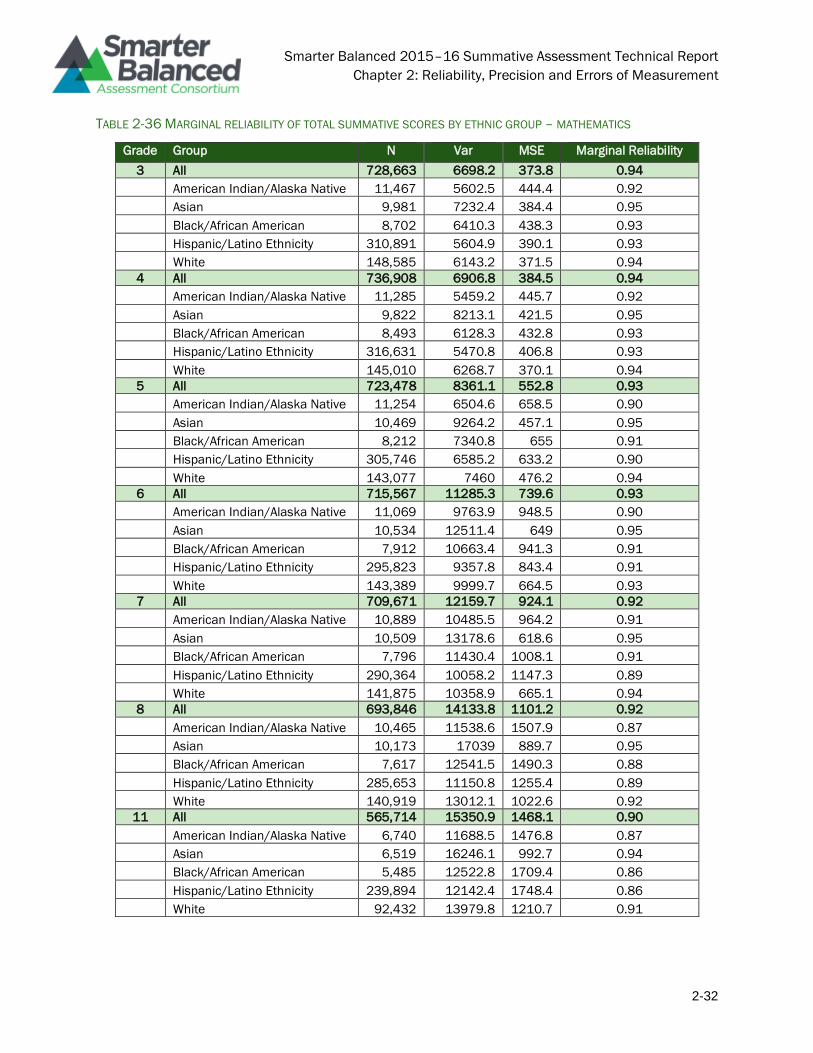
Smarter Balanced 2015–16 Summative Assessment Technical Report
Chapter 2: Reliability, Precision and Errors of Measurement
2-32
TABLE 2-36 MARGINAL RELIABILITY OF TOTAL SUMMATIVE SCORES BY ETHNIC GROUP – MATHEMATICS
Grade Group N Var MSE Marginal Reliability
3 All 728,663 6698.2 373.8 0.94
American Indian/Alaska Native 11,467 5602.5 444.4 0.92
Asian 9,981 7232.4 384.4 0.95
Black/African American 8,702 6410.3 438.3 0.93
Hispanic/Latino Ethnicity 310,891 5604.9 390.1 0.93
White 148,585 6143.2 371.5 0.94
4 All 736,908 6906.8 384.5 0.94
American Indian/Alaska Native 11,285 5459.2 445.7 0.92
Asian 9,822 8213.1 421.5 0.95
Black/African American 8,493 6128.3 432.8 0.93
Hispanic/Latino Ethnicity 316,631 5470.8 406.8 0.93
White 145,010 6268.7 370.1 0.94
5 All 723,478 8361.1 552.8 0.93
American Indian/Alaska Native 11,254 6504.6 658.5 0.90
Asian 10,469 9264.2 457.1 0.95
Black/African American 8,212 7340.8 655 0.91
Hispanic/Latino Ethnicity 305,746 6585.2 633.2 0.90
White 143,077 7460 476.2 0.94
6 All 715,567 11285.3 739.6 0.93
American Indian/Alaska Native 11,069 9763.9 948.5 0.90
Asian 10,534 12511.4 649 0.95
Black/African American 7,912 10663.4 941.3 0.91
Hispanic/Latino Ethnicity 295,823 9357.8 843.4 0.91
White 143,389 9999.7 664.5 0.93
7 All 709,671 12159.7 924.1 0.92
American Indian/Alaska Native 10,889 10485.5 964.2 0.91
Asian 10,509 13178.6 618.6 0.95
Black/African American 7,796 11430.4 1008.1 0.91
Hispanic/Latino Ethnicity 290,364 10058.2 1147.3 0.89
White 141,875 10358.9 665.1 0.94
8 All 693,846 14133.8 1101.2 0.92
American Indian/Alaska Native 10,465 11538.6 1507.9 0.87
Asian 10,173 17039 889.7 0.95
Black/African American 7,617 12541.5 1490.3 0.88
Hispanic/Latino Ethnicity 285,653 11150.8 1255.4 0.89
White 140,919 13012.1 1022.6 0.92
11 All 565,714 15350.9 1468.1 0.90
American Indian/Alaska Native 6,740 11688.5 1476.8 0.87
Asian 6,519 16246.1 992.7 0.94
Black/African American 5,485 12522.8 1709.4 0.86
Hispanic/Latino Ethnicity 239,894 12142.4 1748.4 0.86
White 92,432 13979.8 1210.7 0.91
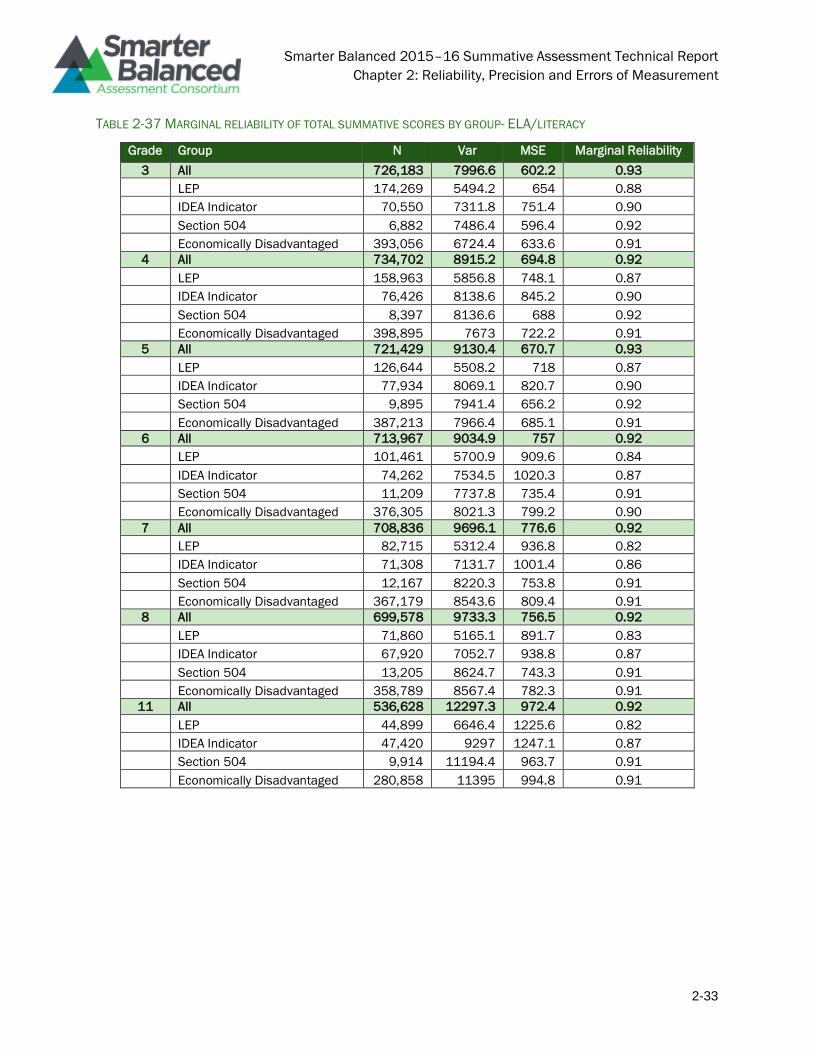
Smarter Balanced 2015–16 Summative Assessment Technical Report
Chapter 2: Reliability, Precision and Errors of Measurement
2-33
TABLE 2-37 MARGINAL RELIABILITY OF TOTAL SUMMATIVE SCORES BY GROUP- ELA/LITERACY
Grade Group N Var MSE Marginal Reliability
3 All 726,183 7996.6 602.2 0.93
LEP 174,269 5494.2 654 0.88
IDEA Indicator 70,550 7311.8 751.4 0.90
Section 504 6,882 7486.4 596.4 0.92
Economically Disadvantaged 393,056 6724.4 633.6 0.91
4 All 734,702 8915.2 694.8 0.92
LEP 158,963 5856.8 748.1 0.87
IDEA Indicator 76,426 8138.6 845.2 0.90
Section 504 8,397 8136.6 688 0.92
Economically Disadvantaged 398,895 7673 722.2 0.91
5 All 721,429 9130.4 670.7 0.93
LEP 126,644 5508.2 718 0.87
IDEA Indicator 77,934 8069.1 820.7 0.90
Section 504 9,895 7941.4 656.2 0.92
Economically Disadvantaged 387,213 7966.4 685.1 0.91
6 All 713,967 9034.9 757 0.92
LEP 101,461 5700.9 909.6 0.84
IDEA Indicator 74,262 7534.5 1020.3 0.87
Section 504 11,209 7737.8 735.4 0.91
Economically Disadvantaged 376,305 8021.3 799.2 0.90
7 All 708,836 9696.1 776.6 0.92
LEP 82,715 5312.4 936.8 0.82
IDEA Indicator 71,308 7131.7 1001.4 0.86
Section 504 12,167 8220.3 753.8 0.91
Economically Disadvantaged 367,179 8543.6 809.4 0.91
8 All 699,578 9733.3 756.5 0.92
LEP 71,860 5165.1 891.7 0.83
IDEA Indicator 67,920 7052.7 938.8 0.87
Section 504 13,205 8624.7 743.3 0.91
Economically Disadvantaged 358,789 8567.4 782.3 0.91
11 All 536,628 12297.3 972.4 0.92
LEP 44,899 6646.4 1225.6 0.82
IDEA Indicator 47,420 9297 1247.1 0.87
Section 504 9,914 11194.4 963.7 0.91
Economically Disadvantaged 280,858 11395 994.8 0.91
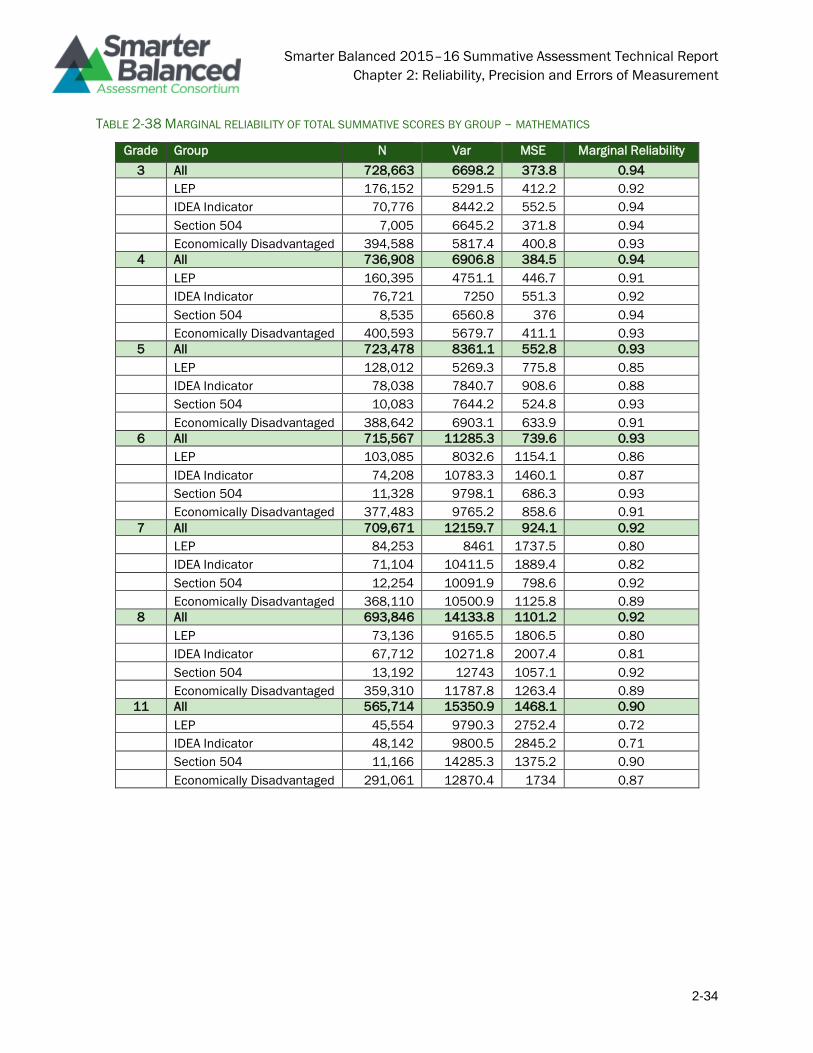
Smarter Balanced 2015–16 Summative Assessment Technical Report
Chapter 2: Reliability, Precision and Errors of Measurement
2-34
TABLE 2-38 MARGINAL RELIABILITY OF TOTAL SUMMATIVE SCORES BY GROUP – MATHEMATICS
Grade Group N Var MSE Marginal Reliability
3 All 728,663 6698.2 373.8 0.94
LEP 176,152 5291.5 412.2 0.92
IDEA Indicator 70,776 8442.2 552.5 0.94
Section 504 7,005 6645.2 371.8 0.94
Economically Disadvantaged 394,588 5817.4 400.8 0.93
4 All 736,908 6906.8 384.5 0.94
LEP 160,395 4751.1 446.7 0.91
IDEA Indicator 76,721 7250 551.3 0.92
Section 504 8,535 6560.8 376 0.94
Economically Disadvantaged 400,593 5679.7 411.1 0.93
5 All 723,478 8361.1 552.8 0.93
LEP 128,012 5269.3 775.8 0.85
IDEA Indicator 78,038 7840.7 908.6 0.88
Section 504 10,083 7644.2 524.8 0.93
Economically Disadvantaged 388,642 6903.1 633.9 0.91
6 All 715,567 11285.3 739.6 0.93
LEP 103,085 8032.6 1154.1 0.86
IDEA Indicator 74,208 10783.3 1460.1 0.87
Section 504 11,328 9798.1 686.3 0.93
Economically Disadvantaged 377,483 9765.2 858.6 0.91
7 All 709,671 12159.7 924.1 0.92
LEP 84,253 8461 1737.5 0.80
IDEA Indicator 71,104 10411.5 1889.4 0.82
Section 504 12,254 10091.9 798.6 0.92
Economically Disadvantaged 368,110 10500.9 1125.8 0.89
8 All 693,846 14133.8 1101.2 0.92
LEP 73,136 9165.5 1806.5 0.80
IDEA Indicator 67,712 10271.8 2007.4 0.81
Section 504 13,192 12743 1057.1 0.92
Economically Disadvantaged 359,310 11787.8 1263.4 0.89
11 All 565,714 15350.9 1468.1 0.90
LEP 45,554 9790.3 2752.4 0.72
IDEA Indicator 48,142 9800.5 2845.2 0.71
Section 504 11,166 14285.3 1375.2 0.90
Economically Disadvantaged 291,061 12870.4 1734 0.87
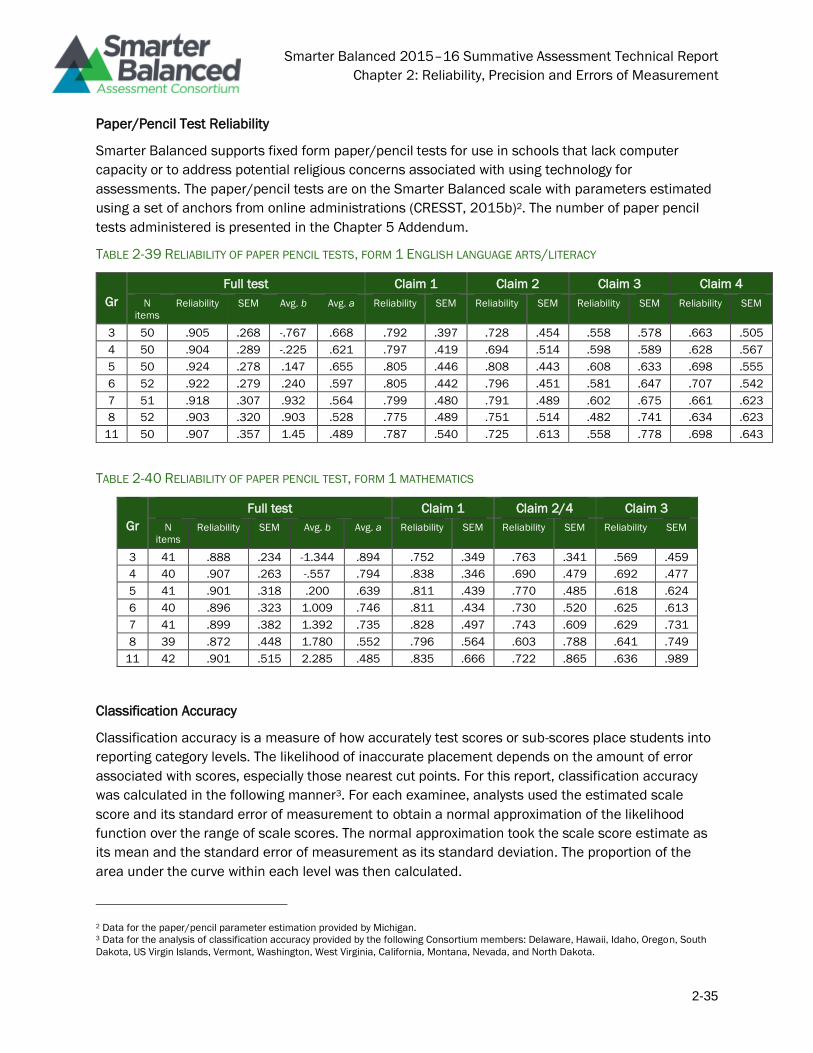
Smarter Balanced 2015–16 Summative Assessment Technical Report
Chapter 2: Reliability, Precision and Errors of Measurement
2-35
Paper/Pencil Test Reliability
Smarter Balanced supports fixed form paper/pencil tests for use in schools that lack computer
capacity or to address potential religious concerns associated with using technology for
assessments. The paper/pencil tests are on the Smarter Balanced scale with parameters estimated
using a set of anchors from online administrations (CRESST, 2015b)2. The number of paper pencil
tests administered is presented in the Chapter 5 Addendum.
TABLE 2-39 RELIABILITY OF PAPER PENCIL TESTS, FORM 1 ENGLISH LANGUAGE ARTS/LITERACY
Gr
Full test Claim 1 Claim 2 Claim 3 Claim 4
N
items
Reliability SEM Avg. b Avg. a Reliability SEM Reliability SEM Reliability SEM Reliability SEM
3 50 .905 .268 -.767 .668 .792 .397 .728 .454 .558 .578 .663 .505
4 50 .904 .289 -.225 .621 .797 .419 .694 .514 .598 .589 .628 .567
5 50 .924 .278 .147 .655 .805 .446 .808 .443 .608 .633 .698 .555
6 52 .922 .279 .240 .597 .805 .442 .796 .451 .581 .647 .707 .542
7 51 .918 .307 .932 .564 .799 .480 .791 .489 .602 .675 .661 .623
8 52 .903 .320 .903 .528 .775 .489 .751 .514 .482 .741 .634 .623
11 50 .907 .357 1.45 .489 .787 .540 .725 .613 .558 .778 .698 .643
TABLE 2-40 RELIABILITY OF PAPER PENCIL TEST, FORM 1 MATHEMATICS
Gr
Full test Claim 1 Claim 2/4 Claim 3
N
items
Reliability SEM Avg. b Avg. a Reliability SEM Reliability SEM Reliability SEM
3 41 .888 .234 -1.344 .894 .752 .349 .763 .341 .569 .459
4 40 .907 .263 -.557 .794 .838 .346 .690 .479 .692 .477
5 41 .901 .318 .200 .639 .811 .439 .770 .485 .618 .624
6 40 .896 .323 1.009 .746 .811 .434 .730 .520 .625 .613
7 41 .899 .382 1.392 .735 .828 .497 .743 .609 .629 .731
8 39 .872 .448 1.780 .552 .796 .564 .603 .788 .641 .749
11 42 .901 .515 2.285 .485 .835 .666 .722 .865 .636 .989
Classification Accuracy
Classification accuracy is a measure of how accurately test scores or sub-scores place students into
reporting category levels. The likelihood of inaccurate placement depends on the amount of error
associated with scores, especially those nearest cut points. For this report, classification accuracy
was calculated in the following manner3. For each examinee, analysts used the estimated scale
score and its standard error of measurement to obtain a normal approximation of the likelihood
function over the range of scale scores. The normal approximation took the scale score estimate as
its mean and the standard error of measurement as its standard deviation. The proportion of the
area under the curve within each level was then calculated.
2 Data for the paper/pencil parameter estimation provided by Michigan. 3 Data for the analysis of classification accuracy provided by the following Consortium members: Delaware, Hawaii, Idaho, Oregon, South
Dakota, US Virgin Islands, Vermont, Washington, West Virginia, California, Montana, Nevada, and North Dakota.
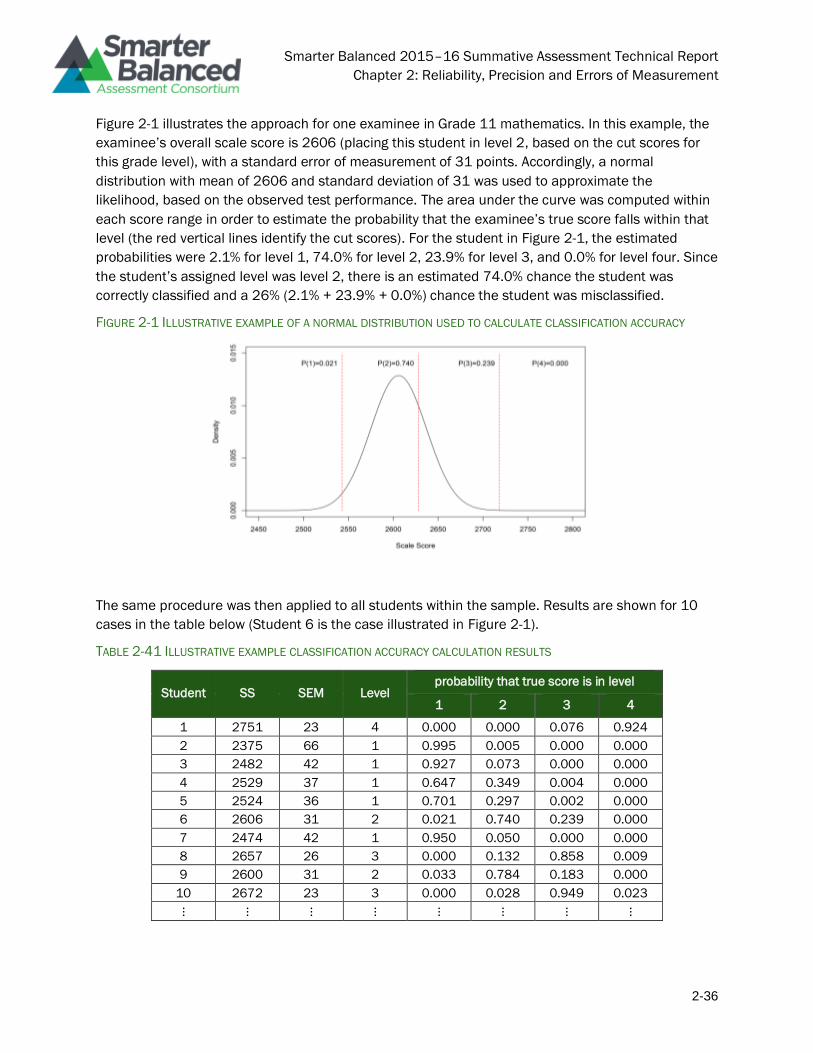
Smarter Balanced 2015–16 Summative Assessment Technical Report
Chapter 2: Reliability, Precision and Errors of Measurement
2-36
Figure 2-1 illustrates the approach for one examinee in Grade 11 mathematics. In this example, the
examinee’s overall scale score is 2606 (placing this student in level 2, based on the cut scores for
this grade level), with a standard error of measurement of 31 points. Accordingly, a normal
distribution with mean of 2606 and standard deviation of 31 was used to approximate the
likelihood, based on the observed test performance. The area under the curve was computed within
each score range in order to estimate the probability that the examinee’s true score falls within that
level (the red vertical lines identify the cut scores). For the student in Figure 2-1, the estimated
probabilities were 2.1% for level 1, 74.0% for level 2, 23.9% for level 3, and 0.0% for level four. Since
the student’s assigned level was level 2, there is an estimated 74.0% chance the student was
correctly classified and a 26% (2.1% + 23.9% + 0.0%) chance the student was misclassified.
FIGURE 2-1 ILLUSTRATIVE EXAMPLE OF A NORMAL DISTRIBUTION USED TO CALCULATE CLASSIFICATION ACCURACY
The same procedure was then applied to all students within the sample. Results are shown for 10
cases in the table below (Student 6 is the case illustrated in Figure 2-1).
TABLE 2-41 ILLUSTRATIVE EXAMPLE CLASSIFICATION ACCURACY CALCULATION RESULTS
Student SS SEM Level probability that true score is in level
1 2 3 4
1 2751 23 4 0.000 0.000 0.076 0.924
2 2375 66 1 0.995 0.005 0.000 0.000
3 2482 42 1 0.927 0.073 0.000 0.000
4 2529 37 1 0.647 0.349 0.004 0.000
5 2524 36 1 0.701 0.297 0.002 0.000
6 2606 31 2 0.021 0.740 0.239 0.000
7 2474 42 1 0.950 0.050 0.000 0.000
8 2657 26 3 0.000 0.132 0.858 0.009
9 2600 31 2 0.033 0.784 0.183 0.000
10 2672 23 3 0.000 0.028 0.949 0.023
⋮ ⋮ ⋮ ⋮ ⋮ ⋮ ⋮ ⋮
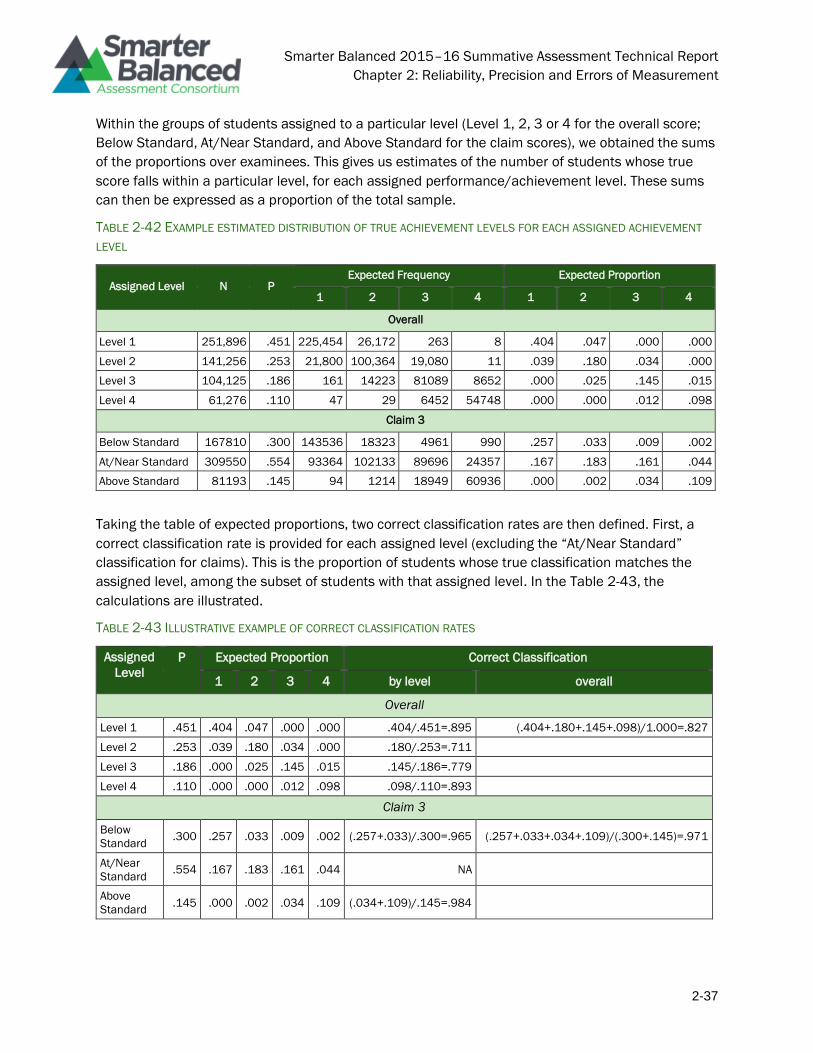
Smarter Balanced 2015–16 Summative Assessment Technical Report
Chapter 2: Reliability, Precision and Errors of Measurement
2-37
Within the groups of students assigned to a particular level (Level 1, 2, 3 or 4 for the overall score;
Below Standard, At/Near Standard, and Above Standard for the claim scores), we obtained the sums
of the proportions over examinees. This gives us estimates of the number of students whose true
score falls within a particular level, for each assigned performance/achievement level. These sums
can then be expressed as a proportion of the total sample.
TABLE 2-42 EXAMPLE ESTIMATED DISTRIBUTION OF TRUE ACHIEVEMENT LEVELS FOR EACH ASSIGNED ACHIEVEMENT
LEVEL
Assigned Level N P Expected Frequency Expected Proportion
1 2 3 4 1 2 3 4
Overall
Level 1 251,896 .451 225,454 26,172 263 8 .404 .047 .000 .000
Level 2 141,256 .253 21,800 100,364 19,080 11 .039 .180 .034 .000
Level 3 104,125 .186 161 14223 81089 8652 .000 .025 .145 .015
Level 4 61,276 .110 47 29 6452 54748 .000 .000 .012 .098
Claim 3
Below Standard 167810 .300 143536 18323 4961 990 .257 .033 .009 .002
At/Near Standard 309550 .554 93364 102133 89696 24357 .167 .183 .161 .044
Above Standard 81193 .145 94 1214 18949 60936 .000 .002 .034 .109
Taking the table of expected proportions, two correct classification rates are then defined. First, a
correct classification rate is provided for each assigned level (excluding the “At/Near Standard”
classification for claims). This is the proportion of students whose true classification matches the
assigned level, among the subset of students with that assigned level. In the Table 2-43, the
calculations are illustrated.
TABLE 2-43 ILLUSTRATIVE EXAMPLE OF CORRECT CLASSIFICATION RATES
Assigned
Level
P Expected Proportion Correct Classification
1 2 3 4 by level overall
Overall
Level 1 .451 .404 .047 .000 .000 .404/.451=.895 (.404+.180+.145+.098)/1.000=.827
Level 2 .253 .039 .180 .034 .000 .180/.253=.711
Level 3 .186 .000 .025 .145 .015 .145/.186=.779
Level 4 .110 .000 .000 .012 .098 .098/.110=.893
Claim 3
Below
Standard .300 .257 .033 .009 .002 (.257+.033)/.300=.965 (.257+.033+.034+.109)/(.300+.145)=.971
At/Near
Standard .554 .167 .183 .161 .044 NA
Above
Standard .145 .000 .002 .034 .109 (.034+.109)/.145=.984
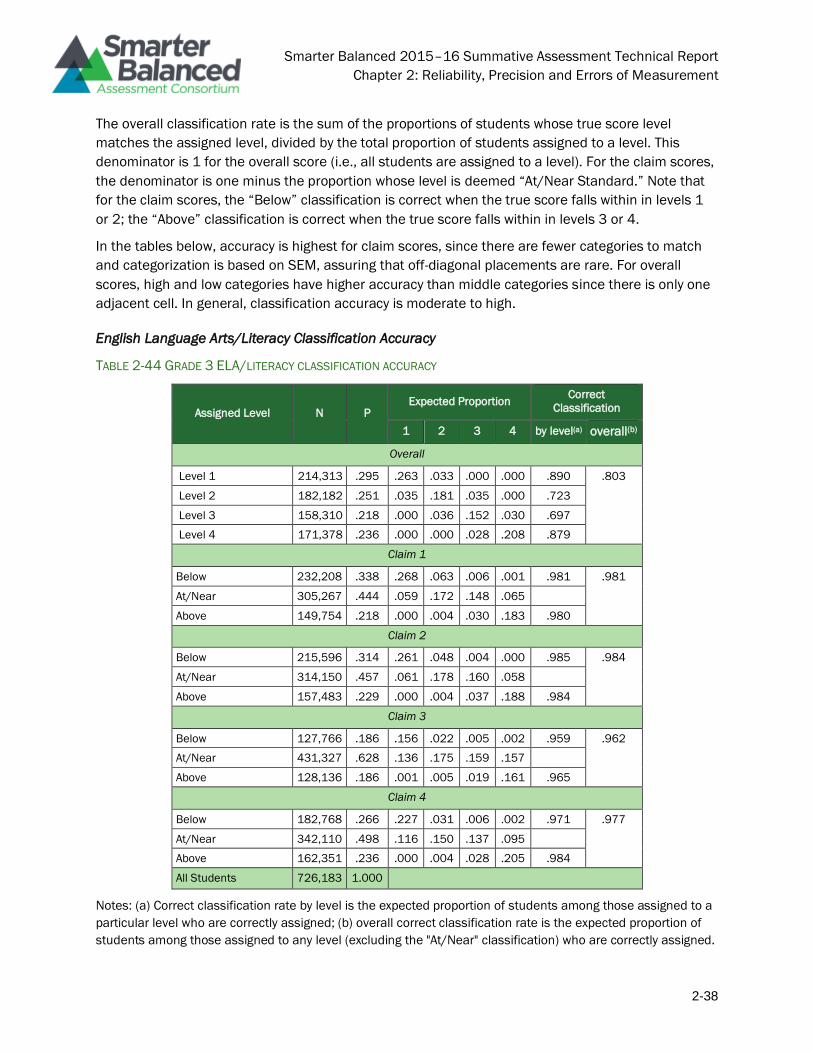
Smarter Balanced 2015–16 Summative Assessment Technical Report
Chapter 2: Reliability, Precision and Errors of Measurement
2-38
The overall classification rate is the sum of the proportions of students whose true score level
matches the assigned level, divided by the total proportion of students assigned to a level. This
denominator is 1 for the overall score (i.e., all students are assigned to a level). For the claim scores,
the denominator is one minus the proportion whose level is deemed “At/Near Standard.” Note that
for the claim scores, the “Below” classification is correct when the true score falls within in levels 1
or 2; the “Above” classification is correct when the true score falls within in levels 3 or 4.
In the tables below, accuracy is highest for claim scores, since there are fewer categories to match
and categorization is based on SEM, assuring that off-diagonal placements are rare. For overall
scores, high and low categories have higher accuracy than middle categories since there is only one
adjacent cell. In general, classification accuracy is moderate to high.
English Language Arts/Literacy Classification Accuracy
TABLE 2-44 GRADE 3 ELA/LITERACY CLASSIFICATION ACCURACY
Assigned Level N P Expected Proportion
Correct
Classification
1 2 3 4 by level(a) overall(b)
Overall
Level 1 214,313 .295 .263 .033 .000 .000 .890 .803
Level 2 182,182 .251 .035 .181 .035 .000 .723
Level 3 158,310 .218 .000 .036 .152 .030 .697
Level 4 171,378 .236 .000 .000 .028 .208 .879
Claim 1
Below 232,208 .338 .268 .063 .006 .001 .981 .981
At/Near 305,267 .444 .059 .172 .148 .065
Above 149,754 .218 .000 .004 .030 .183 .980
Claim 2
Below 215,596 .314 .261 .048 .004 .000 .985 .984
At/Near 314,150 .457 .061 .178 .160 .058
Above 157,483 .229 .000 .004 .037 .188 .984
Claim 3
Below 127,766 .186 .156 .022 .005 .002 .959 .962
At/Near 431,327 .628 .136 .175 .159 .157
Above 128,136 .186 .001 .005 .019 .161 .965
Claim 4
Below 182,768 .266 .227 .031 .006 .002 .971 .977
At/Near 342,110 .498 .116 .150 .137 .095
Above 162,351 .236 .000 .004 .028 .205 .984
All Students 726,183 1.000
Notes: (a) Correct classification rate by level is the expected proportion of students among those assigned to a
particular level who are correctly assigned; (b) overall correct classification rate is the expected proportion of
students among those assigned to any level (excluding the "At/Near" classification) who are correctly assigned.
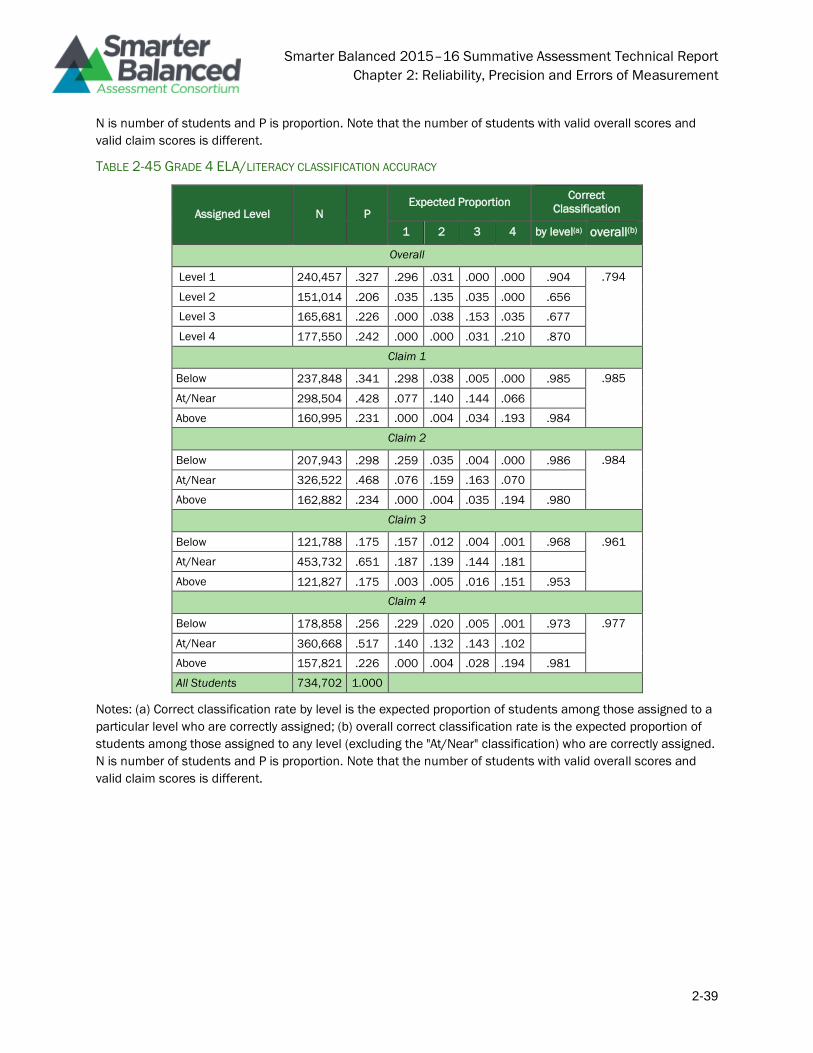
Smarter Balanced 2015–16 Summative Assessment Technical Report
Chapter 2: Reliability, Precision and Errors of Measurement
2-39
N is number of students and P is proportion. Note that the number of students with valid overall scores and
valid claim scores is different.
TABLE 2-45 GRADE 4 ELA/LITERACY CLASSIFICATION ACCURACY
Assigned Level N P Expected Proportion
Correct
Classification
1 2 3 4 by level(a) overall(b)
Overall
Level 1 240,457 .327 .296 .031 .000 .000 .904 .794
Level 2 151,014 .206 .035 .135 .035 .000 .656
Level 3 165,681 .226 .000 .038 .153 .035 .677
Level 4 177,550 .242 .000 .000 .031 .210 .870
Claim 1
Below 237,848 .341 .298 .038 .005 .000 .985 .985
At/Near 298,504 .428 .077 .140 .144 .066
Above 160,995 .231 .000 .004 .034 .193 .984
Claim 2
Below 207,943 .298 .259 .035 .004 .000 .986 .984
At/Near 326,522 .468 .076 .159 .163 .070
Above 162,882 .234 .000 .004 .035 .194 .980
Claim 3
Below 121,788 .175 .157 .012 .004 .001 .968 .961
At/Near 453,732 .651 .187 .139 .144 .181
Above 121,827 .175 .003 .005 .016 .151 .953
Claim 4
Below 178,858 .256 .229 .020 .005 .001 .973 .977
At/Near 360,668 .517 .140 .132 .143 .102
Above 157,821 .226 .000 .004 .028 .194 .981
All Students 734,702 1.000
Notes: (a) Correct classification rate by level is the expected proportion of students among those assigned to a
particular level who are correctly assigned; (b) overall correct classification rate is the expected proportion of
students among those assigned to any level (excluding the "At/Near" classification) who are correctly assigned.
N is number of students and P is proportion. Note that the number of students with valid overall scores and
valid claim scores is different.

Smarter Balanced 2015–16 Summative Assessment Technical Report
Chapter 2: Reliability, Precision and Errors of Measurement
2-40
TABLE 2-46 GRADE 5 ELA/LITERACY CLASSIFICATION ACCURACY
Assigned Level N P Expected Proportion
Correct
Classification
1 2 3 4 by level(a) overall(b)
Overall
Level 1 204,230 .283 .254 .029 .000 .000 .898 .804
Level 2 147,927 .205 .032 .140 .033 .000 .682
Level 3 214,683 .298 .000 .038 .226 .034 .760
Level 4 154,589 .214 .000 .000 .030 .184 .860
Claim 1
Below 227,108 .332 .282 .044 .005 .001 .982 .982
At/Near 292,998 .428 .065 .147 .177 .038
Above 164,950 .241 .000 .004 .059 .177 .982
Claim 2
Below 196,117 .286 .246 .037 .003 .000 .988 .986
At/Near 297,775 .435 .060 .148 .186 .041
Above 191,164 .279 .000 .004 .065 .210 .984
Claim 3
Below 137,374 .201 .179 .015 .006 .002 .963 .968
At/Near 424,583 .620 .185 .135 .172 .127
Above 123,099 .180 .001 .004 .026 .149 .973
Claim 4
Below 115,302 .168 .143 .019 .005 .001 .964 .975
At/Near 350,516 .512 .104 .147 .196 .065
Above 219,238 .320 .001 .005 .066 .248 .981
All Students 721,429 1.000
Notes: (a) Correct classification rate by level is the expected proportion of students among those assigned to a
particular level who are correctly assigned; (b) overall correct classification rate is the expected proportion of
students among those assigned to any level (excluding the "At/Near" classification) who are correctly assigned.
N is number of students and P is proportion. Note that the number of students with valid overall scores and
valid claim scores is different.

Smarter Balanced 2015–16 Summative Assessment Technical Report
Chapter 2: Reliability, Precision and Errors of Measurement
2-41
TABLE 2-47 GRADE 6 ELA/LITERACY CLASSIFICATION ACCURACY
Assigned Level N P Expected Proportion
Correct
Classification
1 2 3 4 by level(a) overall(b)
Overall
Level 1 176,555 .247 .218 .029 .000 .000 .882 .797
Level 2 188,804 .264 .034 .192 .038 .000 .726
Level 3 228,875 .321 .000 .041 .247 .033 .770
Level 4 119,733 .168 .000 .000 .027 .141 .838
Claim 1
Below 230,859 .341 .283 .051 .006 .000 .980 .981
At/Near 320,327 .472 .075 .172 .182 .043
Above 126,792 .187 .000 .003 .049 .134 .982
Claim 2
Below 198,954 .293 .225 .064 .004 .000 .987 .984
At/Near 314,348 .464 .032 .191 .211 .030
Above 164,676 .243 .000 .004 .071 .167 .982
Claim 3
Below 106,592 .157 .137 .015 .004 .001 .970 .960
At/Near 459,512 .678 .148 .169 .201 .160
Above 111,874 .165 .002 .006 .023 .134 .950
Claim 4
Below 107,241 .158 .133 .020 .005 .001 .966 .977
At/Near 369,801 .545 .110 .168 .209 .060
Above 200,936 .296 .000 .005 .077 .214 .983
All Students 713,967 1.000
Notes: (a) Correct classification rate by level is the expected proportion of students among those assigned to a
particular level who are correctly assigned; (b) overall correct classification rate is the expected proportion of
students among those assigned to any level (excluding the "At/Near" classification) who are correctly assigned.
N is number of students and P is proportion. Note that the number of students with valid overall scores and
valid claim scores is different.

Smarter Balanced 2015–16 Summative Assessment Technical Report
Chapter 2: Reliability, Precision and Errors of Measurement
2-42
TABLE 2-48 GRADE 7 ELA/LITERACY CLASSIFICATION ACCURACY
Assigned Level N P Expected Proportion
Correct
Classification
1 2 3 4 by level(a) overall(b)
Overall
Level 1 182,427 .257 .228 .029 .000 .000 .886 .807
Level 2 172,508 .243 .033 .175 .036 .000 0.718
Level 3 241,852 .341 .000 .039 .271 .031 .796
Level 4 112,049 .158 .000 .000 .026 .132 .838
Claim 1
Below 209,359 .311 .256 .049 .006 .000 .980 .981
At/Near 307,572 .458 .068 .168 .193 .029
Above 155,196 .231 .000 .004 .071 .155 .982
Claim 2
Below 171,419 .255 .205 .046 .004 .000 .984 .983
At/Near 313,082 .466 .045 .181 .217 .023
Above 187,626 .279 .000 .005 .096 .178 .983
Claim 3
Below 123,123 .183 .156 .021 .005 .001 .966 .960
At/Near 437,867 .651 .149 .166 .212 .125
Above 111,137 .165 .002 .006 .029 .129 .954
Claim 4
Below 144,124 .214 .185 .023 .005 .001 .972 .977
At/Near 348,250 .518 .111 .157 .207 .043
Above 179,753 .267 .000 .005 .084 .178 .982
All Students 708,836 .999
Notes: (a) Correct classification rate by level is the expected proportion of students among those assigned to a
particular level who are correctly assigned; (b) overall correct classification rate is the expected proportion of
students among those assigned to any level (excluding the "At/Near" classification) who are correctly assigned.
N is number of students and P is proportion. Note that the number of students with valid overall scores and
valid claim scores is different.
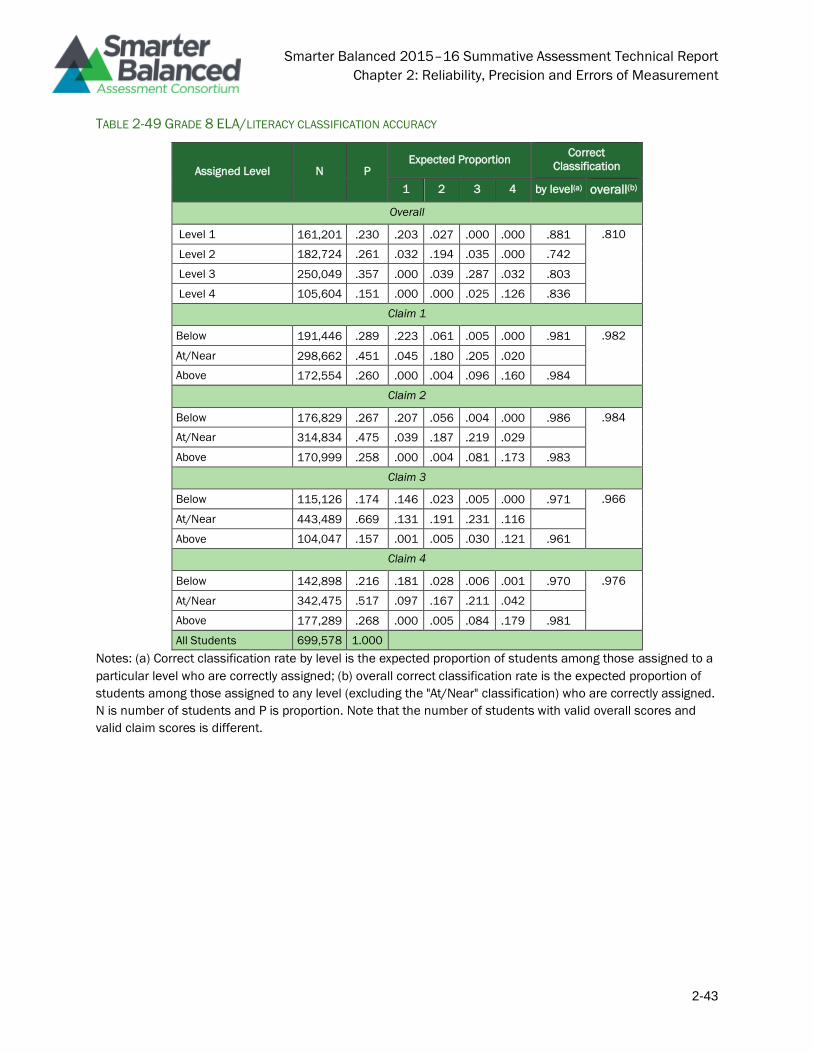
Smarter Balanced 2015–16 Summative Assessment Technical Report
Chapter 2: Reliability, Precision and Errors of Measurement
2-43
TABLE 2-49 GRADE 8 ELA/LITERACY CLASSIFICATION ACCURACY
Assigned Level N P Expected Proportion
Correct
Classification
1 2 3 4 by level(a) overall(b)
Overall
Level 1 161,201 .230 .203 .027 .000 .000 .881 .810
Level 2 182,724 .261 .032 .194 .035 .000 .742
Level 3 250,049 .357 .000 .039 .287 .032 .803
Level 4 105,604 .151 .000 .000 .025 .126 .836
Claim 1
Below 191,446 .289 .223 .061 .005 .000 .981 .982
At/Near 298,662 .451 .045 .180 .205 .020
Above 172,554 .260 .000 .004 .096 .160 .984
Claim 2
Below 176,829 .267 .207 .056 .004 .000 .986 .984
At/Near 314,834 .475 .039 .187 .219 .029
Above 170,999 .258 .000 .004 .081 .173 .983
Claim 3
Below 115,126 .174 .146 .023 .005 .000 .971 .966
At/Near 443,489 .669 .131 .191 .231 .116
Above 104,047 .157 .001 .005 .030 .121 .961
Claim 4
Below 142,898 .216 .181 .028 .006 .001 .970 .976
At/Near 342,475 .517 .097 .167 .211 .042
Above 177,289 .268 .000 .005 .084 .179 .981
All Students 699,578 1.000
Notes: (a) Correct classification rate by level is the expected proportion of students among those assigned to a
particular level who are correctly assigned; (b) overall correct classification rate is the expected proportion of
students among those assigned to any level (excluding the "At/Near" classification) who are correctly assigned.
N is number of students and P is proportion. Note that the number of students with valid overall scores and
valid claim scores is different.

Smarter Balanced 2015–16 Summative Assessment Technical Report
Chapter 2: Reliability, Precision and Errors of Measurement
2-44
TABLE 2-50 GRADE 11 ELA/LITERACY CLASSIFICATION ACCURACY
Assigned Level N P Expected Proportion
Correct
Classification
1 2 3 4 by level(a) overall(b)
Overall
Level 1 100,800 .188 .164 .024 .000 .000 .872 .807
Level 2 122,204 .228 .028 .167 .033 .000 .733
Level 3 179,550 .335 .000 .037 .260 .037 .778
Level 4 134,074 .250 .000 .000 .034 .216 .863
Claim 1
Below 106,479 .200 .155 .039 .005 .000 .975 .980
At/Near 272,651 .511 .064 .190 .212 .046
Above 154,452 .289 .000 .005 .077 .208 .984
Claim 2
Below 115,559 .217 .172 .040 .004 .000 .980 .983
At/Near 237,715 .446 .043 .172 .197 .033
Above 180,308 .338 .000 .005 .087 .246 .985
Claim 3
Below 89,334 .167 .141 .022 .004 .000 .975 .968
At/Near 333,558 .625 .121 .177 .199 .129
Above 110,690 .207 .001 .006 .035 .164 .963
Claim 4
Below 79,340 .149 .122 .020 .005 .001 .958 .975
At/Near 261,700 .490 .089 .156 .189 .056
Above 192,542 .361 .000 .006 .087 .267 .982
All Students 536,628 1.000
Notes: (a) Correct classification rate by level is the expected proportion of students among those assigned to a
particular level who are correctly assigned; (b) overall correct classification rate is the expected proportion of
students among those assigned to any level (excluding the "At/Near" classification) who are correctly assigned.
N is number of students and P is proportion. Note that the number of students with valid overall scores and
valid claim scores is different.
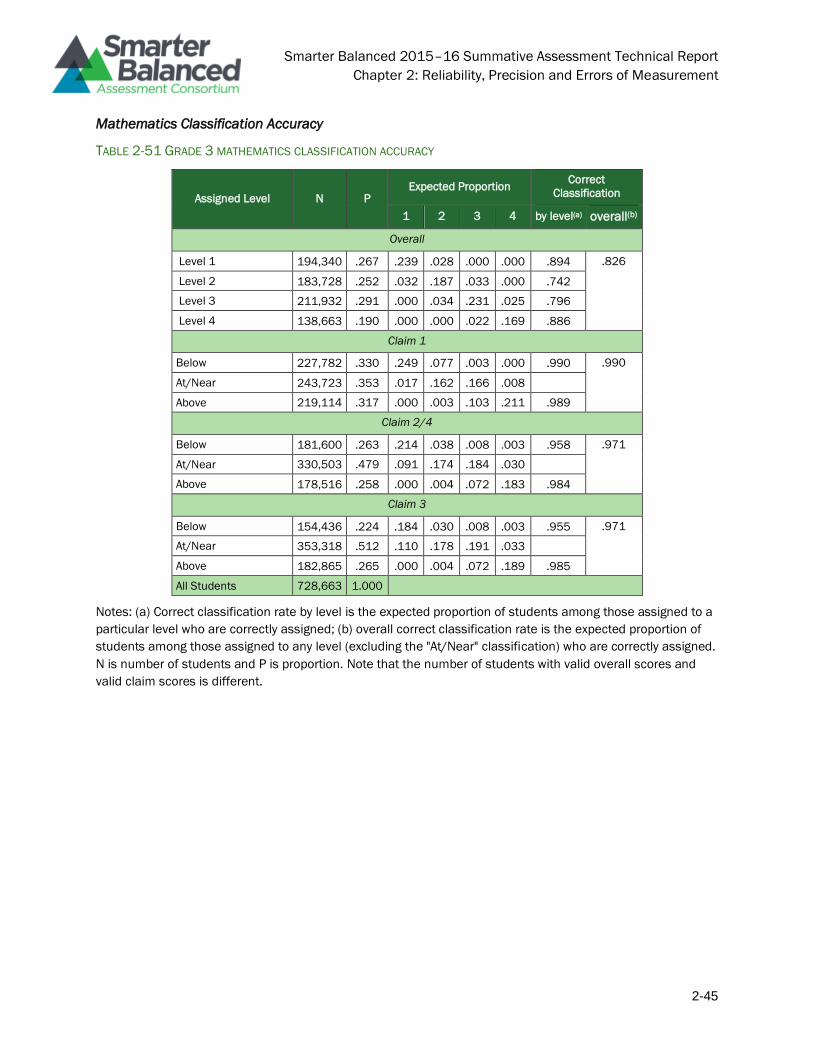
Smarter Balanced 2015–16 Summative Assessment Technical Report
Chapter 2: Reliability, Precision and Errors of Measurement
2-45
Mathematics Classification Accuracy
TABLE 2-51 GRADE 3 MATHEMATICS CLASSIFICATION ACCURACY
Assigned Level N P Expected Proportion
Correct
Classification
1 2 3 4 by level(a) overall(b)
Overall
Level 1 194,340 .267 .239 .028 .000 .000 .894 .826
Level 2 183,728 .252 .032 .187 .033 .000 .742
Level 3 211,932 .291 .000 .034 .231 .025 .796
Level 4 138,663 .190 .000 .000 .022 .169 .886
Claim 1
Below 227,782 .330 .249 .077 .003 .000 .990 .990
At/Near 243,723 .353 .017 .162 .166 .008
Above 219,114 .317 .000 .003 .103 .211 .989
Claim 2/4
Below 181,600 .263 .214 .038 .008 .003 .958 .971
At/Near 330,503 .479 .091 .174 .184 .030
Above 178,516 .258 .000 .004 .072 .183 .984
Claim 3
Below 154,436 .224 .184 .030 .008 .003 .955 .971
At/Near 353,318 .512 .110 .178 .191 .033
Above 182,865 .265 .000 .004 .072 .189 .985
All Students 728,663 1.000
Notes: (a) Correct classification rate by level is the expected proportion of students among those assigned to a
particular level who are correctly assigned; (b) overall correct classification rate is the expected proportion of
students among those assigned to any level (excluding the "At/Near" classification) who are correctly assigned.
N is number of students and P is proportion. Note that the number of students with valid overall scores and
valid claim scores is different.
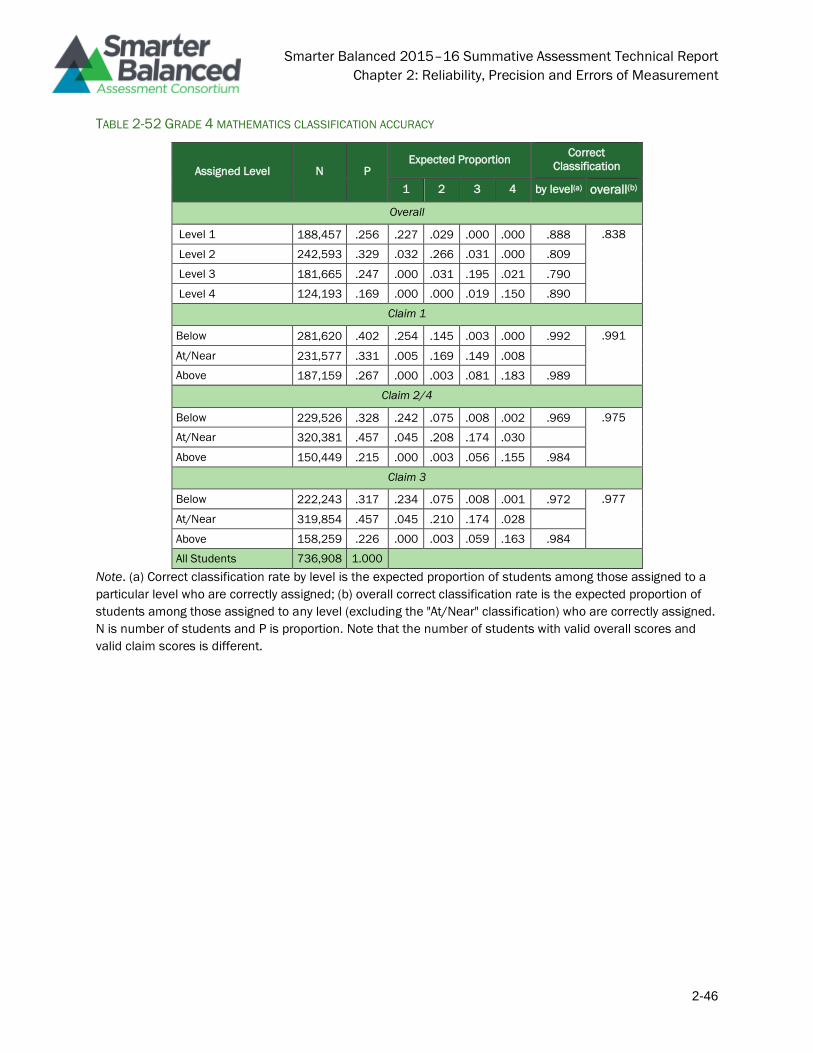
Smarter Balanced 2015–16 Summative Assessment Technical Report
Chapter 2: Reliability, Precision and Errors of Measurement
2-46
TABLE 2-52 GRADE 4 MATHEMATICS CLASSIFICATION ACCURACY
Assigned Level N P Expected Proportion
Correct
Classification
1 2 3 4 by level(a) overall(b)
Overall
Level 1 188,457 .256 .227 .029 .000 .000 .888 .838
Level 2 242,593 .329 .032 .266 .031 .000 .809
Level 3 181,665 .247 .000 .031 .195 .021 .790
Level 4 124,193 .169 .000 .000 .019 .150 .890
Claim 1
Below 281,620 .402 .254 .145 .003 .000 .992 .991
At/Near 231,577 .331 .005 .169 .149 .008
Above 187,159 .267 .000 .003 .081 .183 .989
Claim 2/4
Below 229,526 .328 .242 .075 .008 .002 .969 .975
At/Near 320,381 .457 .045 .208 .174 .030
Above 150,449 .215 .000 .003 .056 .155 .984
Claim 3
Below 222,243 .317 .234 .075 .008 .001 .972 .977
At/Near 319,854 .457 .045 .210 .174 .028
Above 158,259 .226 .000 .003 .059 .163 .984
All Students 736,908 1.000
Note. (a) Correct classification rate by level is the expected proportion of students among those assigned to a
particular level who are correctly assigned; (b) overall correct classification rate is the expected proportion of
students among those assigned to any level (excluding the "At/Near" classification) who are correctly assigned.
N is number of students and P is proportion. Note that the number of students with valid overall scores and
valid claim scores is different.
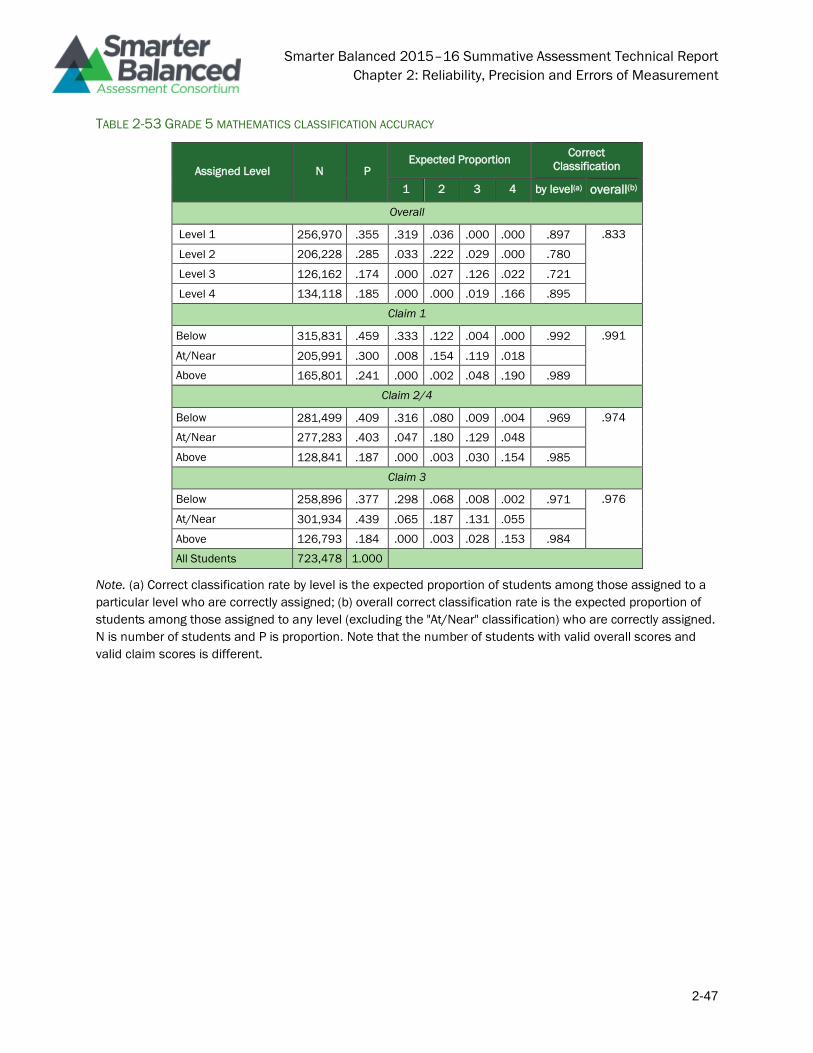
Smarter Balanced 2015–16 Summative Assessment Technical Report
Chapter 2: Reliability, Precision and Errors of Measurement
2-47
TABLE 2-53 GRADE 5 MATHEMATICS CLASSIFICATION ACCURACY
Assigned Level N P Expected Proportion
Correct
Classification
1 2 3 4 by level(a) overall(b)
Overall
Level 1 256,970 .355 .319 .036 .000 .000 .897 .833
Level 2 206,228 .285 .033 .222 .029 .000 .780
Level 3 126,162 .174 .000 .027 .126 .022 .721
Level 4 134,118 .185 .000 .000 .019 .166 .895
Claim 1
Below 315,831 .459 .333 .122 .004 .000 .992 .991
At/Near 205,991 .300 .008 .154 .119 .018
Above 165,801 .241 .000 .002 .048 .190 .989
Claim 2/4
Below 281,499 .409 .316 .080 .009 .004 .969 .974
At/Near 277,283 .403 .047 .180 .129 .048
Above 128,841 .187 .000 .003 .030 .154 .985
Claim 3
Below 258,896 .377 .298 .068 .008 .002 .971 .976
At/Near 301,934 .439 .065 .187 .131 .055
Above 126,793 .184 .000 .003 .028 .153 .984
All Students 723,478 1.000
Note. (a) Correct classification rate by level is the expected proportion of students among those assigned to a
particular level who are correctly assigned; (b) overall correct classification rate is the expected proportion of
students among those assigned to any level (excluding the "At/Near" classification) who are correctly assigned.
N is number of students and P is proportion. Note that the number of students with valid overall scores and
valid claim scores is different.
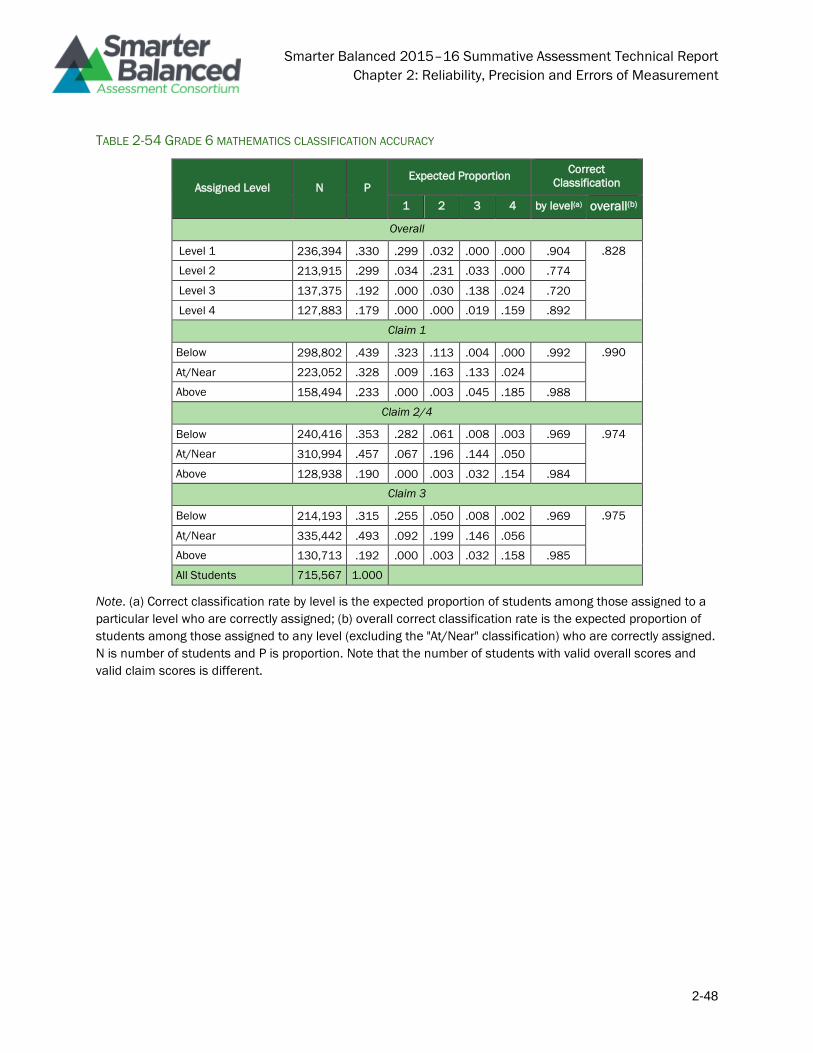
Smarter Balanced 2015–16 Summative Assessment Technical Report
Chapter 2: Reliability, Precision and Errors of Measurement
2-48
TABLE 2-54 GRADE 6 MATHEMATICS CLASSIFICATION ACCURACY
Assigned Level N P Expected Proportion
Correct
Classification
1 2 3 4 by level(a) overall(b)
Overall
Level 1 236,394 .330 .299 .032 .000 .000 .904 .828
Level 2 213,915 .299 .034 .231 .033 .000 .774
Level 3 137,375 .192 .000 .030 .138 .024 .720
Level 4 127,883 .179 .000 .000 .019 .159 .892
Claim 1
Below 298,802 .439 .323 .113 .004 .000 .992 .990
At/Near 223,052 .328 .009 .163 .133 .024
Above 158,494 .233 .000 .003 .045 .185 .988
Claim 2/4
Below 240,416 .353 .282 .061 .008 .003 .969 .974
At/Near 310,994 .457 .067 .196 .144 .050
Above 128,938 .190 .000 .003 .032 .154 .984
Claim 3
Below 214,193 .315 .255 .050 .008 .002 .969 .975
At/Near 335,442 .493 .092 .199 .146 .056
Above 130,713 .192 .000 .003 .032 .158 .985
All Students 715,567 1.000
Note. (a) Correct classification rate by level is the expected proportion of students among those assigned to a
particular level who are correctly assigned; (b) overall correct classification rate is the expected proportion of
students among those assigned to any level (excluding the "At/Near" classification) who are correctly assigned.
N is number of students and P is proportion. Note that the number of students with valid overall scores and
valid claim scores is different.

Smarter Balanced 2015–16 Summative Assessment Technical Report
Chapter 2: Reliability, Precision and Errors of Measurement
2-49
TABLE 2-55 GRADE 7 MATHEMATICS CLASSIFICATION ACCURACY
Assigned Level N P Expected Proportion
Correct
Classification
1 2 3 4 by level(a) overall(b)
Overall
Level 1 227,486 .321 .287 .033 .000 .000 .896 .828
Level 2 210,900 .297 .035 .227 .035 .000 .763
Level 3 146,607 .207 .000 .029 .156 .022 .754
Level 4 124,678 .176 .000 .000 .018 .158 .899
Claim 1
Below 282,382 .419 .308 .107 .003 .000 .992 .991
At/Near 223,031 .331 .010 .169 .138 .014
Above 169,104 .251 .000 .002 .060 .188 .990
Claim 2/4
Below 220,054 .326 .272 .044 .007 .002 .970 .977
At/Near 311,691 .462 .089 .189 .149 .036
Above 142,772 .212 .000 .002 .045 .164 .988
Claim 3
Below 188,870 .280 .237 .036 .006 .001 .973 .979
At/Near 338,078 .501 .100 .198 .163 .041
Above 147,569 .219 .000 .003 .047 .169 .987
All Students 709,671 1.000
Note. (a) Correct classification rate by level is the expected proportion of students among those assigned to a
particular level who are correctly assigned; (b) overall correct classification rate is the expected proportion of
students among those assigned to any level (excluding the "At/Near" classification) who are correctly assigned.
N is number of students and P is proportion. Note that the number of students with valid overall scores and
valid claim scores is different.

Smarter Balanced 2015–16 Summative Assessment Technical Report
Chapter 2: Reliability, Precision and Errors of Measurement
2-50
TABLE 2-56 GRADE 8 MATHEMATICS CLASSIFICATION ACCURACY
Assigned Level N P Expected Proportion
Correct
Classification
1 2 3 4 by level(a) overall(b)
Overall
Level 1 259,134 .373 .332 .041 .000 .000 .889 .819
Level 2 179,096 .258 .038 .186 .034 .000 .721
Level 3 122,253 .176 .000 .027 .127 .022 .720
Level 4 133,363 .192 .000 .000 .018 .174 .906
Claim 1
Below 287,200 .432 .345 .083 .004 .000 .990 .990
At/Near 208,281 .314 .022 .152 .122 .018
Above 168,866 .254 .000 .002 .049 .203 .991
Claim 2/4
Below 189,742 .286 .245 .029 .008 .004 .957 .970
At/Near 338,694 .510 .138 .179 .141 .051
Above 135,911 .205 .000 .002 .034 .168 .987
Claim 3
Below 148,301 .223 .187 .028 .006 .002 .964 .975
At/Near 375,867 .566 .167 .192 .148 .060
Above 140,179 .211 .000 .003 .033 .175 .987
All Students 693,846 1.000
Note. (a) Correct classification rate by level is the expected proportion of students among those assigned to a
particular level who are correctly assigned; (b) overall correct classification rate is the expected proportion of
students among those assigned to any level (excluding the "At/Near" classification) who are correctly assigned.
N is number of students and P is proportion. Note that the number of students with valid overall scores and
valid claim scores is different.
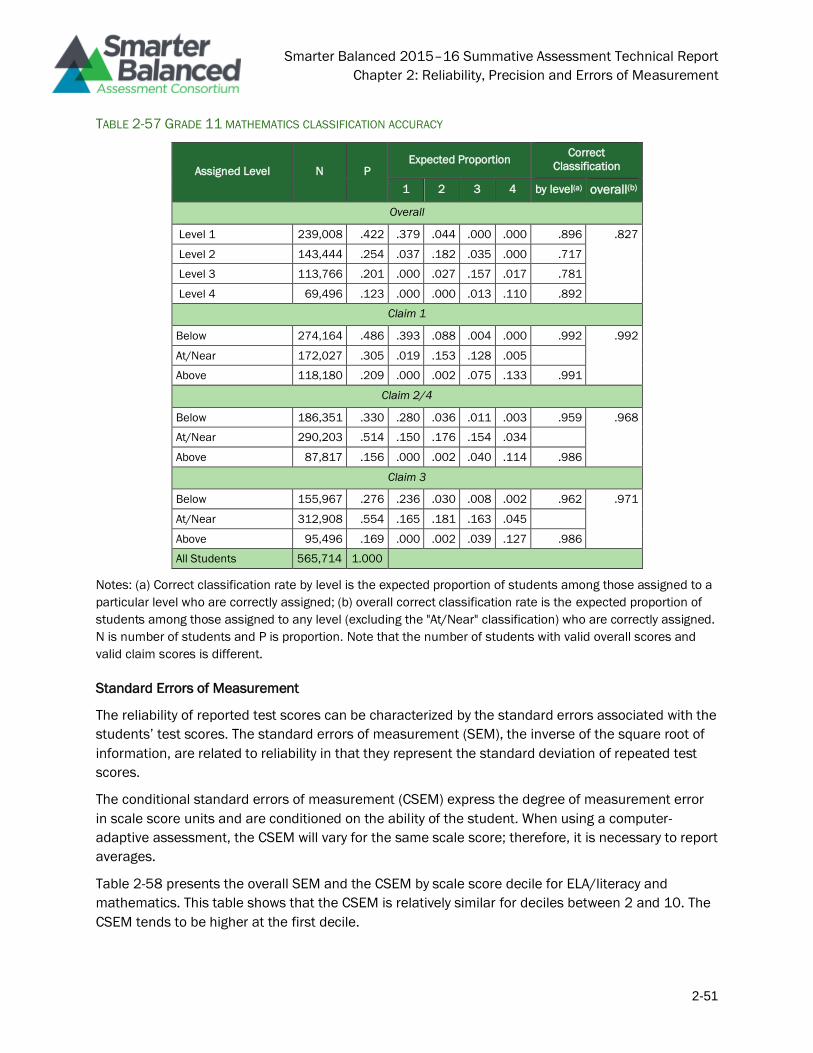
Smarter Balanced 2015–16 Summative Assessment Technical Report
Chapter 2: Reliability, Precision and Errors of Measurement
2-51
TABLE 2-57 GRADE 11 MATHEMATICS CLASSIFICATION ACCURACY
Assigned Level N P Expected Proportion
Correct
Classification
1 2 3 4 by level(a) overall(b)
Overall
Level 1 239,008 .422 .379 .044 .000 .000 .896 .827
Level 2 143,444 .254 .037 .182 .035 .000 .717
Level 3 113,766 .201 .000 .027 .157 .017 .781
Level 4 69,496 .123 .000 .000 .013 .110 .892
Claim 1
Below 274,164 .486 .393 .088 .004 .000 .992 .992
At/Near 172,027 .305 .019 .153 .128 .005
Above 118,180 .209 .000 .002 .075 .133 .991
Claim 2/4
Below 186,351 .330 .280 .036 .011 .003 .959 .968
At/Near 290,203 .514 .150 .176 .154 .034
Above 87,817 .156 .000 .002 .040 .114 .986
Claim 3
Below 155,967 .276 .236 .030 .008 .002 .962 .971
At/Near 312,908 .554 .165 .181 .163 .045
Above 95,496 .169 .000 .002 .039 .127 .986
All Students 565,714 1.000
Notes: (a) Correct classification rate by level is the expected proportion of students among those assigned to a
particular level who are correctly assigned; (b) overall correct classification rate is the expected proportion of
students among those assigned to any level (excluding the "At/Near" classification) who are correctly assigned.
N is number of students and P is proportion. Note that the number of students with valid overall scores and
valid claim scores is different.
Standard Errors of Measurement
The reliability of reported test scores can be characterized by the standard errors associated with the
students’ test scores. The standard errors of measurement (SEM), the inverse of the square root of
information, are related to reliability in that they represent the standard deviation of repeated test
scores.
The conditional standard errors of measurement (CSEM) express the degree of measurement error
in scale score units and are conditioned on the ability of the student. When using a computer-
adaptive assessment, the CSEM will vary for the same scale score; therefore, it is necessary to report
averages.
Table 2-58 presents the overall SEM and the CSEM by scale score decile for ELA/literacy and
mathematics. This table shows that the CSEM is relatively similar for deciles between 2 and 10. The
CSEM tends to be higher at the first decile.
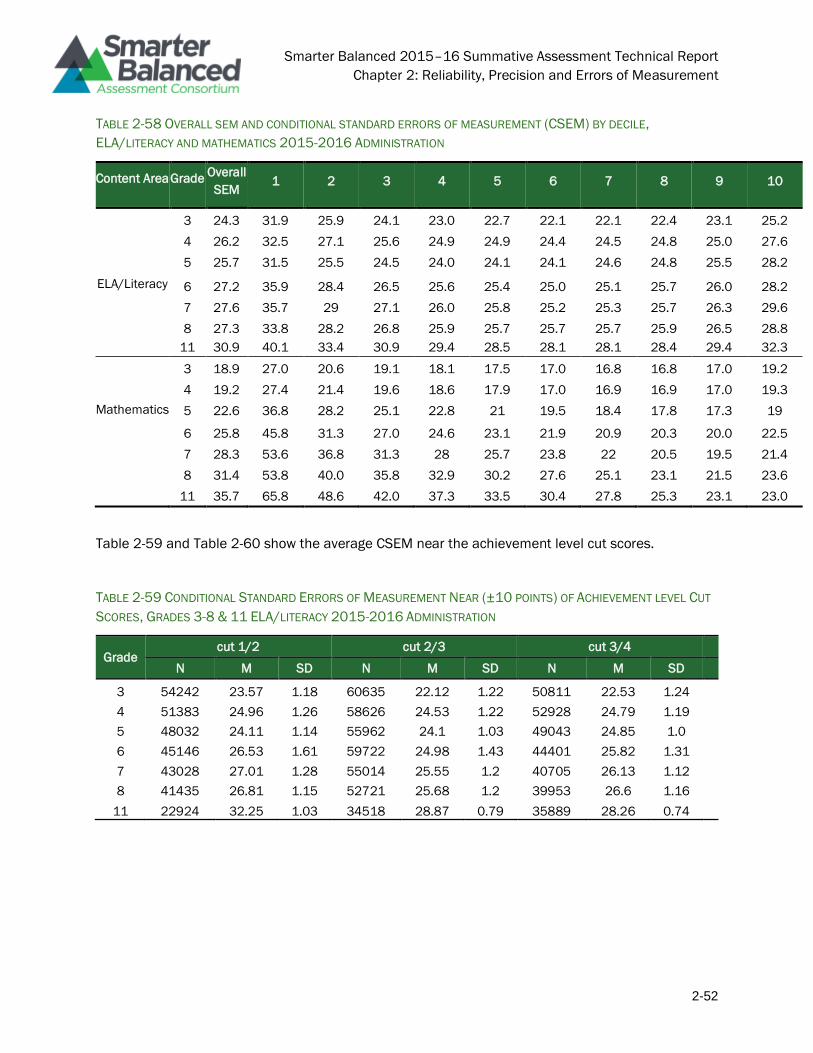
Smarter Balanced 2015–16 Summative Assessment Technical Report
Chapter 2: Reliability, Precision and Errors of Measurement
2-52
TABLE 2-58 OVERALL SEM AND CONDITIONAL STANDARD ERRORS OF MEASUREMENT (CSEM) BY DECILE,
ELA/LITERACY AND MATHEMATICS 2015-2016 ADMINISTRATION
Content Area Grade Overall
SEM 1 2 3 4 5 6 7 8 9 10
3 24.3 31.9 25.9 24.1 23.0 22.7 22.1 22.1 22.4 23.1 25.2
4 26.2 32.5 27.1 25.6 24.9 24.9 24.4 24.5 24.8 25.0 27.6
5 25.7 31.5 25.5 24.5 24.0 24.1 24.1 24.6 24.8 25.5 28.2
ELA/Literacy 6 27.2 35.9 28.4 26.5 25.6 25.4 25.0 25.1 25.7 26.0 28.2
7 27.6 35.7 29 27.1 26.0 25.8 25.2 25.3 25.7 26.3 29.6
8 27.3 33.8 28.2 26.8 25.9 25.7 25.7 25.7 25.9 26.5 28.8
11 30.9 40.1 33.4 30.9 29.4 28.5 28.1 28.1 28.4 29.4 32.3
3 18.9 27.0 20.6 19.1 18.1 17.5 17.0 16.8 16.8 17.0 19.2
4 19.2 27.4 21.4 19.6 18.6 17.9 17.0 16.9 16.9 17.0 19.3
Mathematics 5 22.6 36.8 28.2 25.1 22.8 21 19.5 18.4 17.8 17.3 19
6 25.8 45.8 31.3 27.0 24.6 23.1 21.9 20.9 20.3 20.0 22.5
7 28.3 53.6 36.8 31.3 28 25.7 23.8 22 20.5 19.5 21.4
8 31.4 53.8 40.0 35.8 32.9 30.2 27.6 25.1 23.1 21.5 23.6
11 35.7 65.8 48.6 42.0 37.3 33.5 30.4 27.8 25.3 23.1 23.0
Table 2-59 and Table 2-60 show the average CSEM near the achievement level cut scores.
TABLE 2-59 CONDITIONAL STANDARD ERRORS OF MEASUREMENT NEAR (±10 POINTS) OF ACHIEVEMENT LEVEL CUT
SCORES, GRADES 3-8 & 11 ELA/LITERACY 2015-2016 ADMINISTRATION
Grade cut 1/2 cut 2/3 cut 3/4
N M SD N M SD N M SD
3 54242 23.57 1.18 60635 22.12 1.22 50811 22.53 1.24
4 51383 24.96 1.26 58626 24.53 1.22 52928 24.79 1.19
5 48032 24.11 1.14 55962 24.1 1.03 49043 24.85 1.0
6 45146 26.53 1.61 59722 24.98 1.43 44401 25.82 1.31
7 43028 27.01 1.28 55014 25.55 1.2 40705 26.13 1.12
8 41435 26.81 1.15 52721 25.68 1.2 39953 26.6 1.16
11 22924 32.25 1.03 34518 28.87 0.79 35889 28.26 0.74
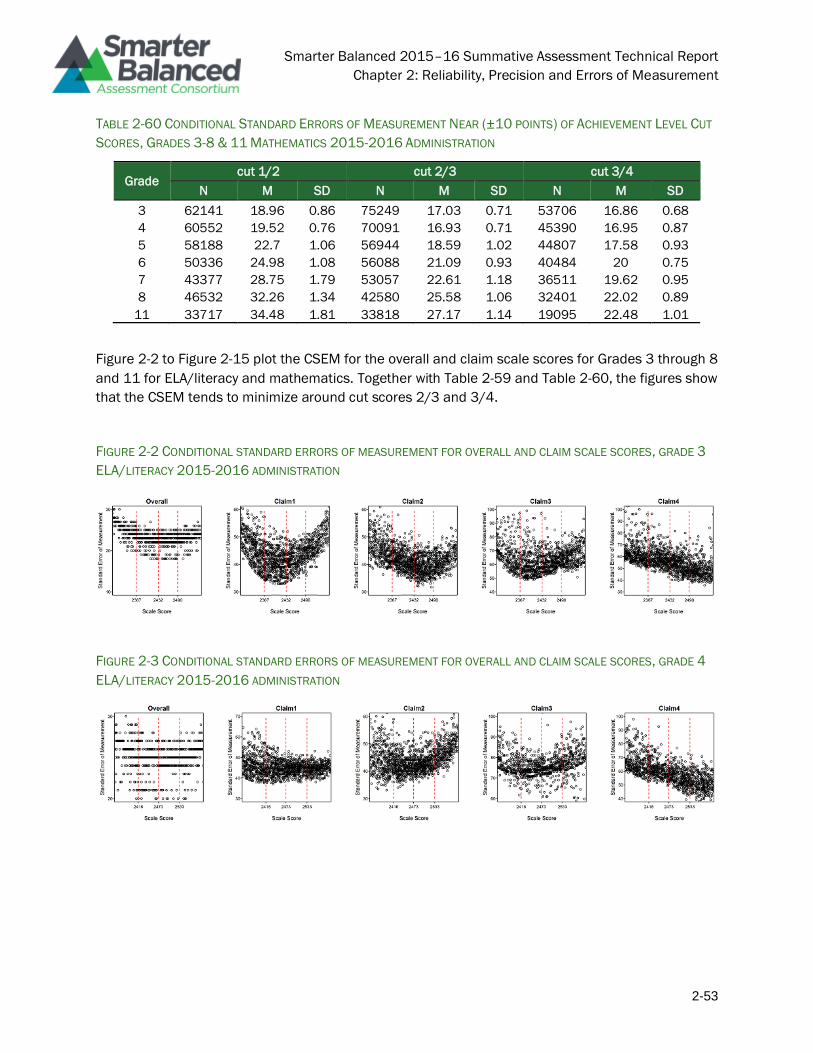
Smarter Balanced 2015–16 Summative Assessment Technical Report
Chapter 2: Reliability, Precision and Errors of Measurement
2-53
TABLE 2-60 CONDITIONAL STANDARD ERRORS OF MEASUREMENT NEAR (±10 POINTS) OF ACHIEVEMENT LEVEL CUT
SCORES, GRADES 3-8 & 11 MATHEMATICS 2015-2016 ADMINISTRATION
Grade cut 1/2 cut 2/3 cut 3/4
N M SD N M SD N M SD
3 62141 18.96 0.86 75249 17.03 0.71 53706 16.86 0.68
4 60552 19.52 0.76 70091 16.93 0.71 45390 16.95 0.87
5 58188 22.7 1.06 56944 18.59 1.02 44807 17.58 0.93
6 50336 24.98 1.08 56088 21.09 0.93 40484 20 0.75
7 43377 28.75 1.79 53057 22.61 1.18 36511 19.62 0.95
8 46532 32.26 1.34 42580 25.58 1.06 32401 22.02 0.89
11 33717 34.48 1.81 33818 27.17 1.14 19095 22.48 1.01
Figure 2-2 to Figure 2-15 plot the CSEM for the overall and claim scale scores for Grades 3 through 8
and 11 for ELA/literacy and mathematics. Together with Table 2-59 and Table 2-60, the figures show
that the CSEM tends to minimize around cut scores 2/3 and 3/4.
FIGURE 2-2 CONDITIONAL STANDARD ERRORS OF MEASUREMENT FOR OVERALL AND CLAIM SCALE SCORES, GRADE 3
ELA/LITERACY 2015-2016 ADMINISTRATION
FIGURE 2-3 CONDITIONAL STANDARD ERRORS OF MEASUREMENT FOR OVERALL AND CLAIM SCALE SCORES, GRADE 4
ELA/LITERACY 2015-2016 ADMINISTRATION
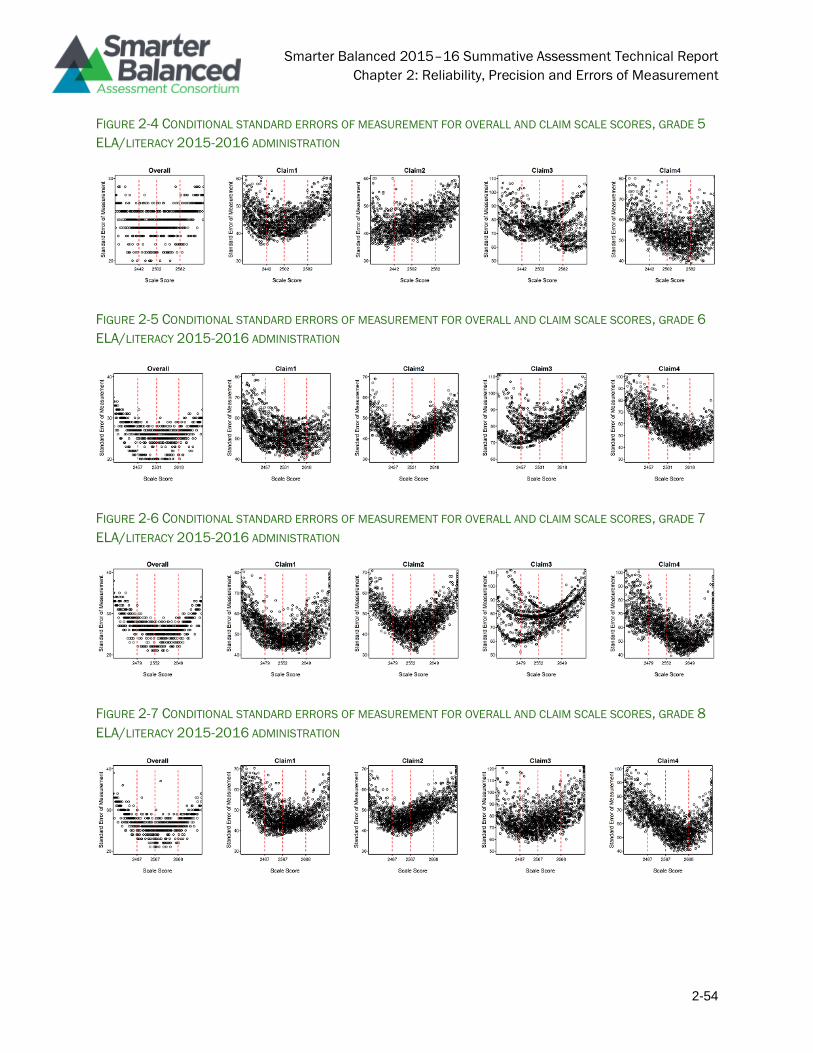
Smarter Balanced 2015–16 Summative Assessment Technical Report
Chapter 2: Reliability, Precision and Errors of Measurement
2-54
FIGURE 2-4 CONDITIONAL STANDARD ERRORS OF MEASUREMENT FOR OVERALL AND CLAIM SCALE SCORES, GRADE 5
ELA/LITERACY 2015-2016 ADMINISTRATION
FIGURE 2-5 CONDITIONAL STANDARD ERRORS OF MEASUREMENT FOR OVERALL AND CLAIM SCALE SCORES, GRADE 6
ELA/LITERACY 2015-2016 ADMINISTRATION
FIGURE 2-6 CONDITIONAL STANDARD ERRORS OF MEASUREMENT FOR OVERALL AND CLAIM SCALE SCORES, GRADE 7
ELA/LITERACY 2015-2016 ADMINISTRATION
FIGURE 2-7 CONDITIONAL STANDARD ERRORS OF MEASUREMENT FOR OVERALL AND CLAIM SCALE SCORES, GRADE 8
ELA/LITERACY 2015-2016 ADMINISTRATION
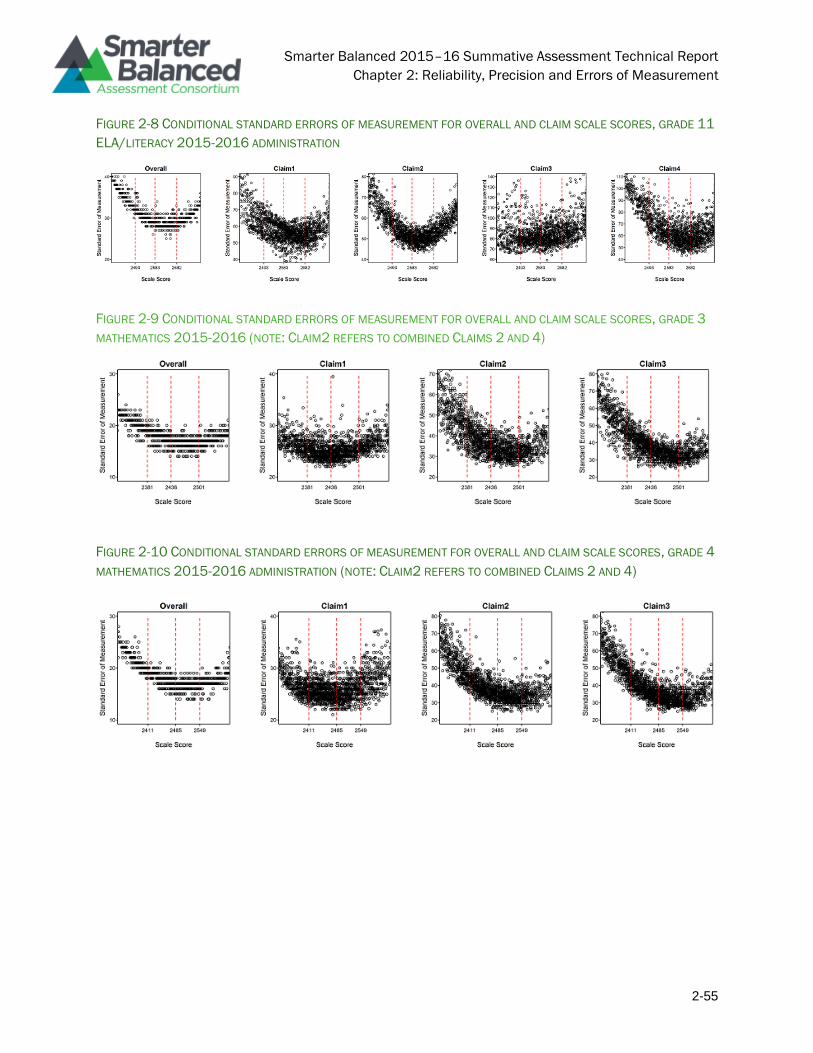
Smarter Balanced 2015–16 Summative Assessment Technical Report
Chapter 2: Reliability, Precision and Errors of Measurement
2-55
FIGURE 2-8 CONDITIONAL STANDARD ERRORS OF MEASUREMENT FOR OVERALL AND CLAIM SCALE SCORES, GRADE 11
ELA/LITERACY 2015-2016 ADMINISTRATION
FIGURE 2-9 CONDITIONAL STANDARD ERRORS OF MEASUREMENT FOR OVERALL AND CLAIM SCALE SCORES, GRADE 3
MATHEMATICS 2015-2016 (NOTE: CLAIM2 REFERS TO COMBINED CLAIMS 2 AND 4)
FIGURE 2-10 CONDITIONAL STANDARD ERRORS OF MEASUREMENT FOR OVERALL AND CLAIM SCALE SCORES, GRADE 4
MATHEMATICS 2015-2016 ADMINISTRATION (NOTE: CLAIM2 REFERS TO COMBINED CLAIMS 2 AND 4)
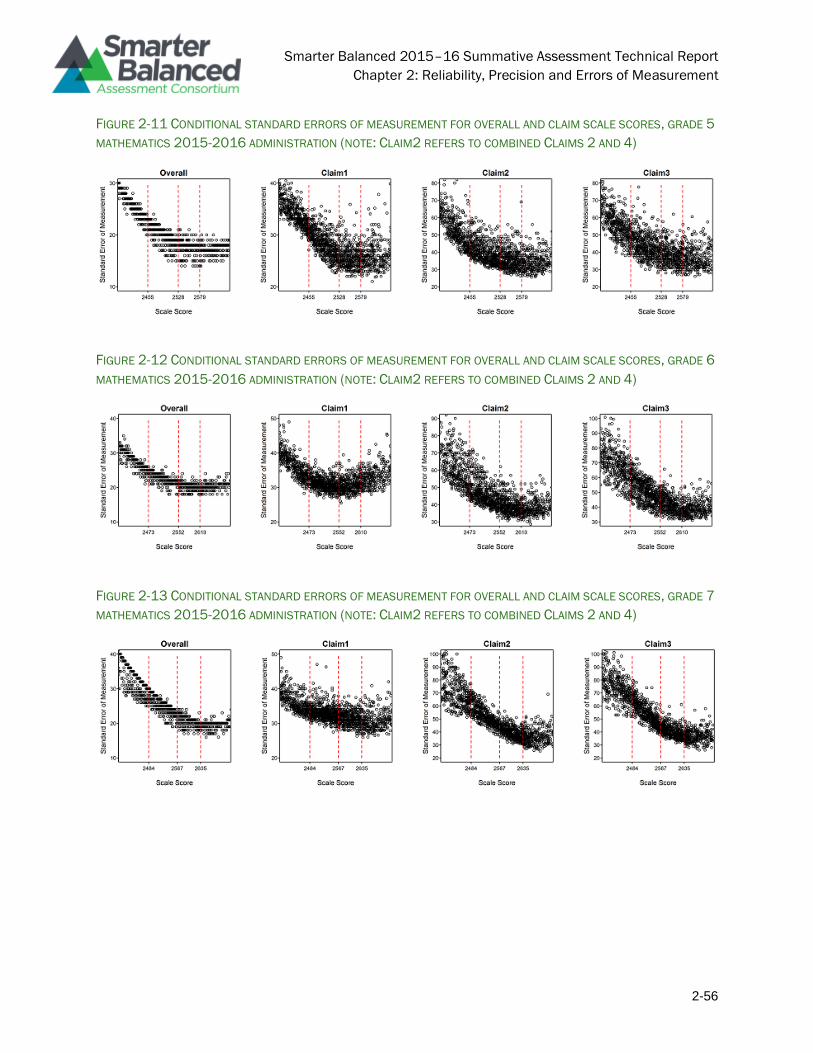
Smarter Balanced 2015–16 Summative Assessment Technical Report
Chapter 2: Reliability, Precision and Errors of Measurement
2-56
FIGURE 2-11 CONDITIONAL STANDARD ERRORS OF MEASUREMENT FOR OVERALL AND CLAIM SCALE SCORES, GRADE 5
MATHEMATICS 2015-2016 ADMINISTRATION (NOTE: CLAIM2 REFERS TO COMBINED CLAIMS 2 AND 4)
FIGURE 2-12 CONDITIONAL STANDARD ERRORS OF MEASUREMENT FOR OVERALL AND CLAIM SCALE SCORES, GRADE 6
MATHEMATICS 2015-2016 ADMINISTRATION (NOTE: CLAIM2 REFERS TO COMBINED CLAIMS 2 AND 4)
FIGURE 2-13 CONDITIONAL STANDARD ERRORS OF MEASUREMENT FOR OVERALL AND CLAIM SCALE SCORES, GRADE 7
MATHEMATICS 2015-2016 ADMINISTRATION (NOTE: CLAIM2 REFERS TO COMBINED CLAIMS 2 AND 4)
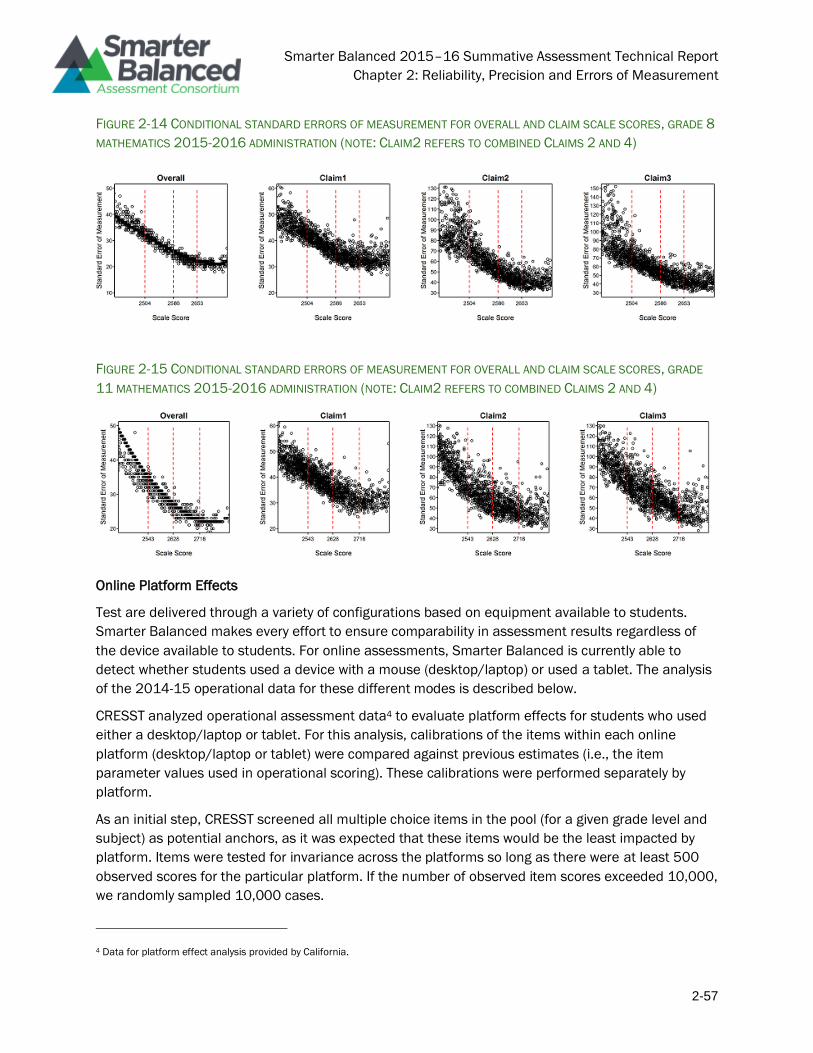
Smarter Balanced 2015–16 Summative Assessment Technical Report
Chapter 2: Reliability, Precision and Errors of Measurement
2-57
FIGURE 2-14 CONDITIONAL STANDARD ERRORS OF MEASUREMENT FOR OVERALL AND CLAIM SCALE SCORES, GRADE 8
MATHEMATICS 2015-2016 ADMINISTRATION (NOTE: CLAIM2 REFERS TO COMBINED CLAIMS 2 AND 4)
FIGURE 2-15 CONDITIONAL STANDARD ERRORS OF MEASUREMENT FOR OVERALL AND CLAIM SCALE SCORES, GRADE
11 MATHEMATICS 2015-2016 ADMINISTRATION (NOTE: CLAIM2 REFERS TO COMBINED CLAIMS 2 AND 4)
Online Platform Effects
Test are delivered through a variety of configurations based on equipment available to students.
Smarter Balanced makes every effort to ensure comparability in assessment results regardless of
the device available to students. For online assessments, Smarter Balanced is currently able to
detect whether students used a device with a mouse (desktop/laptop) or used a tablet. The analysis
of the 2014-15 operational data for these different modes is described below.
CRESST analyzed operational assessment data4 to evaluate platform effects for students who used
either a desktop/laptop or tablet. For this analysis, calibrations of the items within each online
platform (desktop/laptop or tablet) were compared against previous estimates (i.e., the item
parameter values used in operational scoring). These calibrations were performed separately by
platform.
As an initial step, CRESST screened all multiple choice items in the pool (for a given grade level and
subject) as potential anchors, as it was expected that these items would be the least impacted by
platform. Items were tested for invariance across the platforms so long as there were at least 500
observed scores for the particular platform. If the number of observed item scores exceeded 10,000,
we randomly sampled 10,000 cases.
4 Data for platform effect analysis provided by California.
Smarter Balanced 2015–16 Summative Assessment Technical Report
Chapter 2: Reliability, Precision and Errors of Measurement
2-58
Likelihood ratio tests provided a formal evaluation of the null hypothesis that platform-specific item
parameters were exactly equal to the previously specified values. However, this test tends to be
quite sensitive (rejecting the null hypothesis for the majority of items). Accordingly, the weighted
absolute area between expected score curves (wABC; see, e.g., Stucky, Edelen, & Chandra, 2015)
was used as our primary criterion for judging the severity of differential item functioning across
platforms.
Multiple choice items with wABC>0.10 were rejected as anchor items, while those with wABC≤0.10
were retained. In all calibrations, the latent variable mean and variance were freely estimated
(because the group of individuals administered a particular item cannot be assumed to be
representative of the population, due to adaptive item selection). Results of this screening of
candidate anchors are summarized in Table 2-61 and Table 2-62. The vast majority of multiple
choice items tested were retained as anchors.
After screening the multiple choice items to obtain a final set of anchors, CRESST proceeded with the
calibration of all non-anchor items (i.e., the multiple choice items rejected as anchors, as well as
items of any other type) for which a minimum of 500 scores were available. Due to differences in
platform use, more items could be tested (calibrated) for desktop/laptop than for tablet. Results of
the analyses are summarized in Tables Table 2-61 (ELA/literacy) and Table 2-62 (Mathematics)
below. Not all items in the pools could be evaluated. However, among those that were tested, the
vast majority of items had very small wABC values, suggesting minimal differences in item
functioning across the platforms. Specifically, across grades, subjects, and platforms, less than 1%
of items showed wABC>0.20, except for grade 11 ELA/literacy tablets (for which 3% of the items had
wABC>0.20). These results suggest that items functioned similarly across platforms.
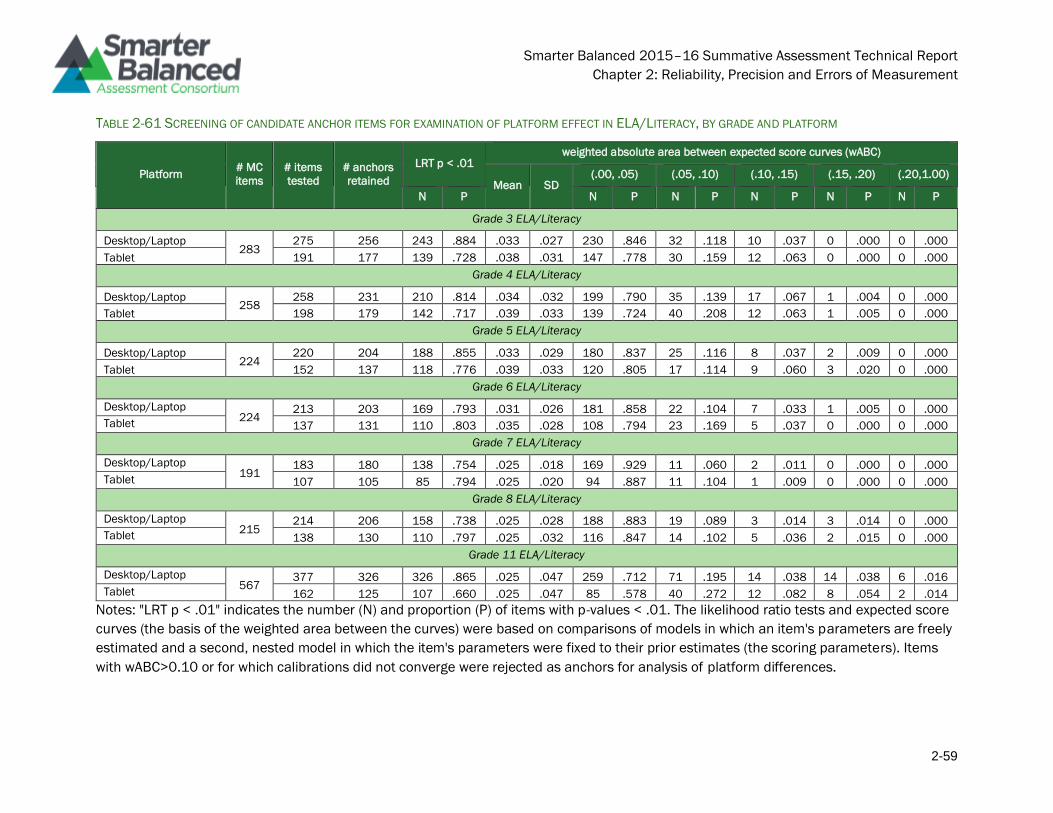
Smarter Balanced 2015–16 Summative Assessment Technical Report
Chapter 2: Reliability, Precision and Errors of Measurement
2-59
TABLE 2-61 SCREENING OF CANDIDATE ANCHOR ITEMS FOR EXAMINATION OF PLATFORM EFFECT IN ELA/LITERACY, BY GRADE AND PLATFORM
Platform # MC
items
# items
tested
# anchors
retained
LRT p < .01 weighted absolute area between expected score curves (wABC)
Mean SD (.00, .05) (.05, .10) (.10, .15) (.15, .20) (.20,1.00)
N P N P N P N P N P N P
Grade 3 ELA/Literacy
Desktop/Laptop 283
275 256 243 .884 .033 .027 230 .846 32 .118 10 .037 0 .000 0 .000
Tablet 191 177 139 .728 .038 .031 147 .778 30 .159 12 .063 0 .000 0 .000
Grade 4 ELA/Literacy
Desktop/Laptop 258
258 231 210 .814 .034 .032 199 .790 35 .139 17 .067 1 .004 0 .000
Tablet 198 179 142 .717 .039 .033 139 .724 40 .208 12 .063 1 .005 0 .000
Grade 5 ELA/Literacy
Desktop/Laptop 224
220 204 188 .855 .033 .029 180 .837 25 .116 8 .037 2 .009 0 .000
Tablet 152 137 118 .776 .039 .033 120 .805 17 .114 9 .060 3 .020 0 .000
Grade 6 ELA/Literacy
Desktop/Laptop 224
213 203 169 .793 .031 .026 181 .858 22 .104 7 .033 1 .005 0 .000
Tablet 137 131 110 .803 .035 .028 108 .794 23 .169 5 .037 0 .000 0 .000
Grade 7 ELA/Literacy
Desktop/Laptop 191
183 180 138 .754 .025 .018 169 .929 11 .060 2 .011 0 .000 0 .000
Tablet 107 105 85 .794 .025 .020 94 .887 11 .104 1 .009 0 .000 0 .000
Grade 8 ELA/Literacy
Desktop/Laptop 215
214 206 158 .738 .025 .028 188 .883 19 .089 3 .014 3 .014 0 .000
Tablet 138 130 110 .797 .025 .032 116 .847 14 .102 5 .036 2 .015 0 .000
Grade 11 ELA/Literacy
Desktop/Laptop 567
377 326 326 .865 .025 .047 259 .712 71 .195 14 .038 14 .038 6 .016
Tablet 162 125 107 .660 .025 .047 85 .578 40 .272 12 .082 8 .054 2 .014
Notes: "LRT p < .01" indicates the number (N) and proportion (P) of items with p-values < .01. The likelihood ratio tests and expected score
curves (the basis of the weighted area between the curves) were based on comparisons of models in which an item's parameters are freely
estimated and a second, nested model in which the item's parameters were fixed to their prior estimates (the scoring parameters). Items
with wABC>0.10 or for which calibrations did not converge were rejected as anchors for analysis of platform differences.
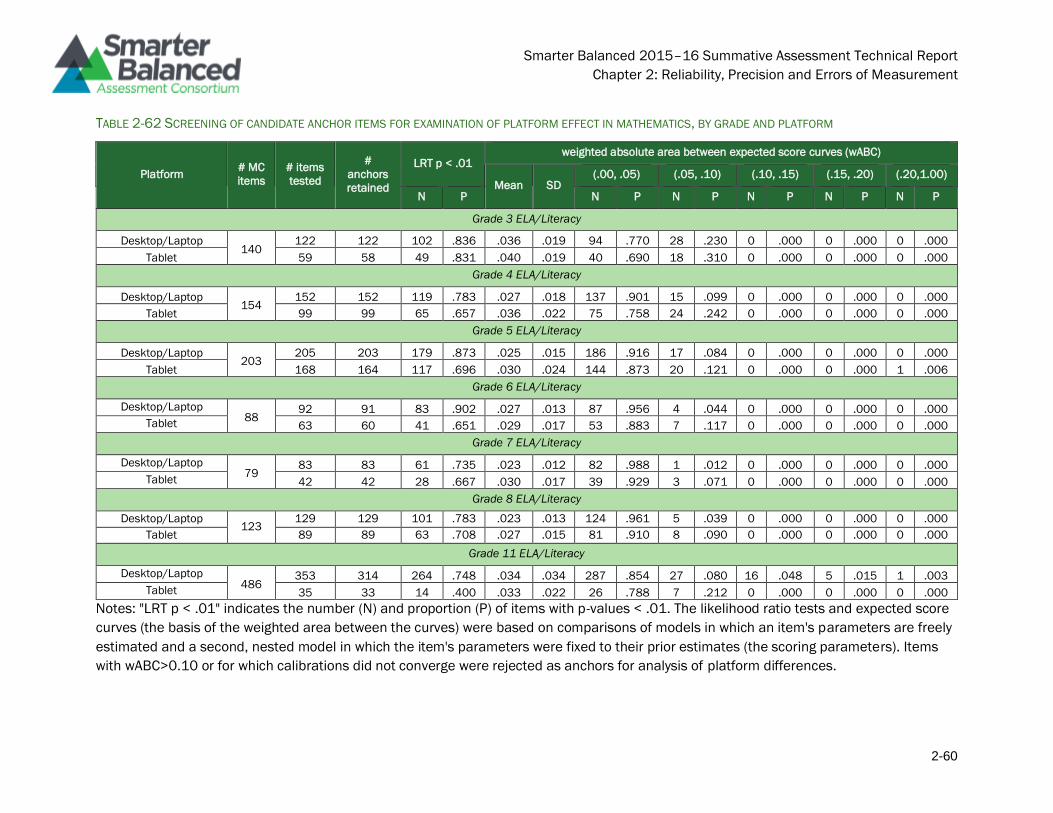
Smarter Balanced 2015–16 Summative Assessment Technical Report
Chapter 2: Reliability, Precision and Errors of Measurement
2-60
TABLE 2-62 SCREENING OF CANDIDATE ANCHOR ITEMS FOR EXAMINATION OF PLATFORM EFFECT IN MATHEMATICS, BY GRADE AND PLATFORM
Platform # MC
items
# items
tested
#
anchors
retained
LRT p < .01 weighted absolute area between expected score curves (wABC)
Mean SD (.00, .05) (.05, .10) (.10, .15) (.15, .20) (.20,1.00)
N P N P N P N P N P N P
Grade 3 ELA/Literacy
Desktop/Laptop 140
122 122 102 .836 .036 .019 94 .770 28 .230 0 .000 0 .000 0 .000
Tablet 59 58 49 .831 .040 .019 40 .690 18 .310 0 .000 0 .000 0 .000
Grade 4 ELA/Literacy
Desktop/Laptop 154
152 152 119 .783 .027 .018 137 .901 15 .099 0 .000 0 .000 0 .000
Tablet 99 99 65 .657 .036 .022 75 .758 24 .242 0 .000 0 .000 0 .000
Grade 5 ELA/Literacy
Desktop/Laptop 203
205 203 179 .873 .025 .015 186 .916 17 .084 0 .000 0 .000 0 .000
Tablet 168 164 117 .696 .030 .024 144 .873 20 .121 0 .000 0 .000 1 .006
Grade 6 ELA/Literacy
Desktop/Laptop 88
92 91 83 .902 .027 .013 87 .956 4 .044 0 .000 0 .000 0 .000
Tablet 63 60 41 .651 .029 .017 53 .883 7 .117 0 .000 0 .000 0 .000
Grade 7 ELA/Literacy
Desktop/Laptop 79
83 83 61 .735 .023 .012 82 .988 1 .012 0 .000 0 .000 0 .000
Tablet 42 42 28 .667 .030 .017 39 .929 3 .071 0 .000 0 .000 0 .000
Grade 8 ELA/Literacy
Desktop/Laptop 123
129 129 101 .783 .023 .013 124 .961 5 .039 0 .000 0 .000 0 .000
Tablet 89 89 63 .708 .027 .015 81 .910 8 .090 0 .000 0 .000 0 .000
Grade 11 ELA/Literacy
Desktop/Laptop 486
353 314 264 .748 .034 .034 287 .854 27 .080 16 .048 5 .015 1 .003
Tablet 35 33 14 .400 .033 .022 26 .788 7 .212 0 .000 0 .000 0 .000
Notes: "LRT p < .01" indicates the number (N) and proportion (P) of items with p-values < .01. The likelihood ratio tests and expected score
curves (the basis of the weighted area between the curves) were based on comparisons of models in which an item's parameters are freely
estimated and a second, nested model in which the item's parameters were fixed to their prior estimates (the scoring parameters). Items
with wABC>0.10 or for which calibrations did not converge were rejected as anchors for analysis of platform differences.
Smarter Balanced 2015–16 Summative Assessment Technical Report
Chapter 2 Addendum
2-61
References
American Institutes for Research (2014a). Smarter Balanced scoring specification: 2014-2015
administration. Los Angeles, CA: Smarter Balanced Assessment Consortium.
American Institutes for Research. (2014b). Testing procedures for adaptive item-selection algorithm.
Los Angeles, CA: Smarter Balanced Assessment Consortium. Retrieved from
http://www.smarterbalanced.org/assessments/development/additional-technical-
documentation/
Cohen, J. & Albright, L. (2014). Smarter Balanced adaptive item selection algorithm design report.
Los Angeles, CA: Smarter Balanced Assessment Consortium. Retrieved from
http://www.smarterapp.org/specs/AdaptiveAlgorithm.html
Edelen, M. O., Stucky, B. D., & Chandra, A. (2015). Quantifying ‘problematic’ DIF within an IRT
framework: Application to a cancer stigma index. Quality of Life Research, 24(1), 95-103.
National Center for Research on Evaluation, Standards, & Student Testing. (2015a). Simulation-
based evaluation of the smarter balanced summative assessments. Los Angeles, CA:
Smarter Balanced Assessment Consortium. Retrieved from
http://www.smarterbalanced.org/assessments/development/additional-technical-
documentation/
National Center for Research on Evaluation, Standards, & Student Testing. (2015b). Initial report on
the calibration of paper and pencil forms. Los Angeles, CA: Smarter Balanced Assessment
Consortium. Retrieved from
http://www.smarterbalanced.org/assessments/development/additional-technical-
documentation/
National Center for Research on Evaluation, Standards, & Student Testing. (2016). Simulation-based
evaluation of the 2014-2015 smarter balanced summative assessments: accommodated
item pools. Los Angeles, CA: Smarter Balanced Assessment Consortium. Retrieved from
http://www.smarterbalanced.org/assessments/development/additional-technical-
documentation/
Smarter Balanced 2015–16 Summative Assessment Technical Report
Chapter 3: Test Fairness
3-1
Chapter 3: Test Fairness
Smarter Balanced 2015–16 Summative Assessment Technical Report
Chapter 3: Test Fairness
3-2
Introduction
The Smarter Balanced Assessment Consortium (Smarter Balanced) has designed the assessment
system to provide all eligible students with a fair assessment and equitable opportunity to participate
in the Smarter Balanced Assessment. Ensuring test fairness is a fundamental part of validity, starting
with test design, and is an important feature built into each step of the test development process,
such as item writing, test administration, and scoring. The 2014 Standards for Educational and
Psychological Testing (AERA, APA, & NCME, 2014, p. 49) state, “The term fairness has no single
technical meaning, and is used in many ways in public discourse.” It also suggests that fairness to all
individuals in the intended population is an overriding and fundamental validity concern. As
indicated in the Standards for Educational and Psychological Testing (2014, p. 63), “The central
idea of fairness in testing is to identify and remove construct-irrelevant barriers to maximal
performance for any examinee.”
The Smarter Balanced system is designed to provide a valid, reliable, and fair measure of student
achievement based on the Common Core State Standards5 (CCSS). The validity and fairness of the
measures of student achievement are influenced by a multitude of factors; central among them are:
• a clear definition of the construct—the knowledge, skills, and abilities—that are intended to
be measured,
• the development of items and tasks that are explicitly designed to assess the construct that
is the target of measurement,
• delivery of items and tasks that enable students to demonstrate their achievement of the
construct
• capture and scoring of responses to those items and tasks.
Smarter Balanced uses several processes to address reliability, validity, and fairness. The fairness
construct is defined in the CCSS which were developed during a state-led effort that was launched in
2009 by state leaders, including governors and state commissioners of education from 48 states,
two territories and the District of Columbia, through their membership in the National Governors
Association Center for Best Practices (NGA Center) and the Council of Chief State School Officers
(CCSSO). The CCSS is a set of high-quality academic standards in mathematics and English
language arts/literacy (ELA/literacy) that outline what a student should know and be able to do at
the end of each grade. The standards were created to ensure that all students graduate from high
school with the skills and knowledge necessary for post-secondary success. The CCSS have been
adopted by all Consortium members. The Smarter Balanced Content Specifications for the
Summative Assessment of the CCSS for English Language Arts/Literacy and the Smarter Balanced
Content Specifications for the Summative Assessment of the CCSS for Mathematics, developed by
Smarter Balanced (2015a; 2015b), define the knowledge, skills, and abilities to be assessed and
their relationship to the CCSS. In doing so, these documents describe the major constructs—
identified as “Claims”—within ELA/literacy and mathematics for which evidence of student
achievement is gathered and which forms the basis for reporting student performance. Each claim is
5 http://www.corestandards.org/
Smarter Balanced 2015–16 Summative Assessment Technical Report
Chapter 3: Test Fairness
3-3
accompanied by a set of assessment targets that provide more detail about the range of content and
Depth of Knowledge levels. The targets serve as the building blocks of test blueprints. Much of the
evidence presented in this chapter pertains to fairness to students during the testing process and
design elements and procedures that serve to minimize measurement bias (i.e., DIF). Fairness in
item and test design processes and the design of accessibility supports (i.e., universal tools,
designated supports and accommodations) in content development are also addressed.
Definitions for Validity, Bias, Sensitivity, and Fairness.
Some key concepts for the ensuing discussion concern validity, bias, and fairness and are described
as follows.
Validity. Validity is the extent to which the inferences and actions made based on test scores are
appropriate and backed by evidence (Messick, 1989). It constitutes the central notion underlying the
development, administration and scoring of a test, as well as the uses and interpretations of test
scores. Validation is the process of accumulating evidence to support each proposed score
interpretation or use. Evidence in support of validity is extensively discussed in Chapter 2.
Attention to bias and sensitivity in test development. According to the Standards for Educational and
Psychological Testing, bias is “construct underrepresentation or construct-irrelevant components of
tests scores that differentially affect the performance of different groups of test takers and
consequently the reliability/precision and validity of interpretations and uses of their test scores.”
(AERA, APA, & NCME, 2014, p. 216). “Sensitivity” refers to an awareness of the need to avoid explicit
bias in assessment. In common usage, reviews of tests for bias and sensitivity help ensure that test
items and stimuli are fair for various groups of test takers, (AERA, APA, & NCME, 2014, p. 64).
The goal of fairness in assessment is to assure that test materials are as free as possible from
unnecessary barriers to the success of diverse groups of students. Smarter Balanced developed the
Bias and Sensitivity Guidelines (ETS, 2012) to help ensure that the assessments are fair for all
groups of test takers, despite differences in characteristics including, but not limited to, disability
status, ethnic group, gender, regional background, native language, race, religion, sexual orientation,
and socioeconomic status. Unnecessary barriers can be reduced by following some fundamental
rules:
• measuring only knowledge or skills that are relevant to the intended construct
• not angering, offending, upsetting, or otherwise distracting test takers, and
• treating all groups of people with appropriate respect in test materials.
These rules help ensure that the test content is fair for test takers as well as acceptable to the many
stakeholders and constituent groups within Smarter Balanced member organizations. The more
typical view is that bias and sensitivity guidelines apply primarily to the review of test items. However,
fairness must be considered in all phases of test development and use. Smarter Balanced strongly
relied on the Bias and Sensitivity Guidelines in the development of the Smarter Balanced
assessments, particularly in item writing and review. Items must comply with the Bias and Sensitivity
Guidelines in order to be included in the Smarter Balanced assessments. Use of the Guidelines will
help the Smarter Balanced assessments comply with Chapter 3, Standard 3.2 of the Standards for
Smarter Balanced 2015–16 Summative Assessment Technical Report
Chapter 3: Test Fairness
3-4
Educational and Psychological Testing. Standard 3.2 states that “Test developers are responsible for
developing tests that measure the intended construct and for minimizing the potential for tests‘
being affected by construct-irrelevant characteristics such as linguistic, communicative, cognitive,
cultural, physical or other characteristics.” (AERA, APA, & NCME, 2014, p. 64).
Smarter Balanced assessments were developed using the principles of evidence-centered design
(ECD). ECD requires a chain of evidence-based reasoning that links test performance to the Claims
made about test takers. Fair assessments are essential to the implementation of ECD. If test items
are not fair, then the evidence they provide means different things for different groups of students.
Under those circumstances, the Claims cannot be equally supported for all test takers, which is a
threat to validity. As part of the validation process, all items are reviewed for bias and sensitivity
using the Bias and Sensitivity Guidelines prior to being presented to students. This helps ensure
that item responses reflect only knowledge of the intended content domain, are free of offensive or
distracting material and portray all groups in a respectful manner. When the guidelines are followed,
item responses provide evidence that supports assessment claims.
The Smarter Balanced Accessibility and Accommodations Framework
Smarter Balanced has built a framework of accessibility for all students, including English Language
Learners (ELLs), students with disabilities, and ELLs with disabilities, but not limited to those groups.
Three resources—the Smarter Balanced Item Specifications (2015c), the Smarter Balanced Usability,
Accessibility, and Accommodations Guidelines (2014b), and the Smarter Balanced Bias and
Sensitivity Guidelines (ETS, 2012)—are used to guide the development of items and tasks to ensure
that they accurately measure the targeted constructs. Recognizing the diverse characteristics and
needs of students who participate in the Smarter Balanced assessments, the states worked together
through the Smarter Balanced Test Administration and Student Access Work Group to develop an
Accessibility and Accommodations Framework (2014a) that guided the Consortium as it worked to
reach agreement on the specific universal tools, designated supports, and accommodations
available for the assessments. This work also incorporated research and practical lessons learned
through Universal Design, accessibility tools, and accommodations (Thompson, Johnstone, &
Thurlow, 2002).
In the process of developing its next-generation assessments to measure students’ knowledge and
skills as they progress toward college and career readiness, Smarter Balanced recognized that the
validity of assessment results depends on each student having appropriate universal tools,
designated supports, and/or accommodations when needed, based on the constructs being
measured by the assessment. The Smarter Balanced Assessment System uses technology intended
to deliver assessments that meet the needs of individual students. Online/electronic delivery of the
assessments helps ensure that students are administered a test individualized to meet their needs
while still measuring the same construct. During the administration of tests, items and tasks are
delivered using a variety of accessibility resources and accommodations that can be administered to
students automatically based on their individual profiles. Accessibility resources include but are not
limited to foreground and background color flexibility, tactile presentation of content (e.g., braille),
and translated presentation of assessment content in signed form and selected spoken languages.
Smarter Balanced 2015–16 Summative Assessment Technical Report
Chapter 3: Test Fairness
3-5
One of Smarter Balanced's main goals was to adopt a common set of accessibility resources and
accommodations. As a starting point, Smarter Balanced surveyed all members to determine their
past practices. From these data, Smarter Balanced used a deliberative analysis strategy as
described in Accommodations for English Language Learners and Students with Disabilities: A
Research-Based Decision Algorithm (Abedi & Ewers, 2013) to determine which accessibility
resources should be made available during the assessment and whether access to these resources
should be moderated by an adult. As a result, some accessibility resources that states traditionally
had identified as accommodations, were instead embedded in the test or otherwise incorporated
into the Smarter Balanced assessments as universal tools. Other resources were not incorporated
into the assessment because access to these resources were not grounded in research. The final list
of accessibility resources and the recommended use of the resources can be found in the Usability
Accessibility and Accommodations Guidelines (2014b, pp. 6-20).
A fundamental goal was to design an assessment that is accessible for all students, regardless of
English language proficiency, disability, or other individual circumstances. The three components of
the Accessibility and Accommodations Framework are designed to meet that need. The intent was to
ensure that the following steps were achieved for Smarter Balanced.
• Design and develop items and tasks to ensure that all students have access to the items and
tasks designed to measure the targeted constructs. In addition, deliver items, tasks, and the
collection of student responses in a way that maximizes validity for each student.
• Adopt the conceptual model embodied in the Accessibility and Accommodations Framework
that describes accessibility resources of digitally delivered items/tasks and acknowledges
the need for some adult-monitored accommodations. The model also characterizes
accessibility resources as a continuum ranging from those available to all students to ones
that are implemented under adult supervision available only to those students with a
documented need.
• Implement the use of an individualized and systematic needs profile for students, or
Individual Student Assessment Accessibility Profile (ISAAP), that promotes the provision of
appropriate access and tools for each student. Smarter created an ISAAP process that helps
education teams systematically select the most appropriate accessibility resources for each
student and the ISAAP tool, which helps teams note the accessibility resources chosen.
The conceptual framework that serves as the basis underlying the usability, accessibility, and
accommodations is shown in Figure 3-1. This figure portrays several aspects of the Smarter
Balanced assessment resources—universal tools (available for all students), designated supports
(available when indicated by an adult or team), and accommodations as documented in an
Individualized Education Program (IEP) or 504 plan. It also displays the additive and sequentially
inclusive nature of these three aspects. Universal tools are available to all students, including those
receiving designated supports and those receiving accommodations. Designated supports are
available only to students who have been identified as needing these resources (as well as those
students for whom the need is documented). Accommodations are available only to those students
with documentation of the need through a formal plan (e.g., IEP, 504). Those students also may
access designated supports and universal tools.
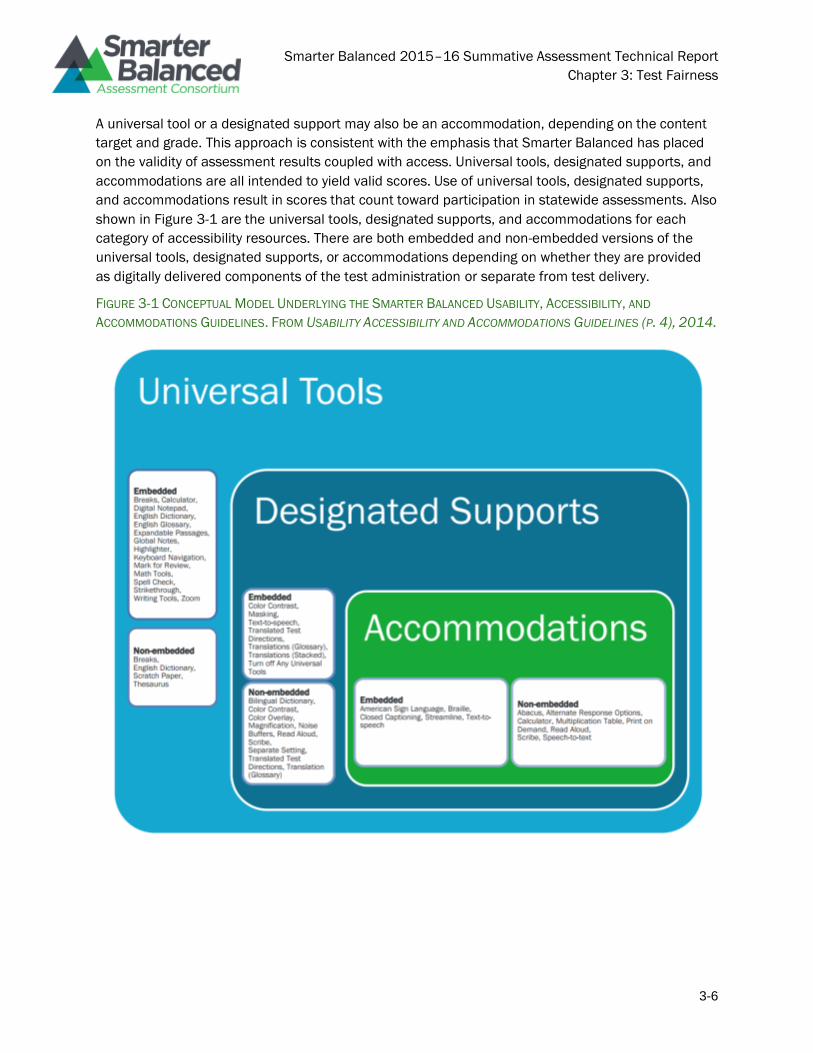
Smarter Balanced 2015–16 Summative Assessment Technical Report
Chapter 3: Test Fairness
3-6
A universal tool or a designated support may also be an accommodation, depending on the content
target and grade. This approach is consistent with the emphasis that Smarter Balanced has placed
on the validity of assessment results coupled with access. Universal tools, designated supports, and
accommodations are all intended to yield valid scores. Use of universal tools, designated supports,
and accommodations result in scores that count toward participation in statewide assessments. Also
shown in Figure 3-1 are the universal tools, designated supports, and accommodations for each
category of accessibility resources. There are both embedded and non-embedded versions of the
universal tools, designated supports, or accommodations depending on whether they are provided
as digitally delivered components of the test administration or separate from test delivery.
FIGURE 3-1 CONCEPTUAL MODEL UNDERLYING THE SMARTER BALANCED USABILITY, ACCESSIBILITY, AND
ACCOMMODATIONS GUIDELINES. FROM USABILITY ACCESSIBILITY AND ACCOMMODATIONS GUIDELINES (P. 4), 2014.
Smarter Balanced 2015–16 Summative Assessment Technical Report
Chapter 3: Test Fairness
3-7
Meeting the Needs of Traditionally Underrepresented Populations.
The policy decision was to make accessibility resources available to all students based on need
rather than eligibility status or student subgroup categorical designation. This reflects a belief among
Consortium states that unnecessarily restricting access to accessibility resources threatens the
validity of the assessment results and places students under undue stress and frustration.
Additionally, accommodations are available for students who qualify for them. The Consortium
utilizes a needs-based approach to providing accessibility resources. A description as to how this
benefits ELLs, students with disabilities, and ELLs with disabilities is presented here.
How the Framework Meets Needs of Students Who Are ELLs.
Students who are ELLs have needs that are unique from those students with disabilities, including
language-related disabilities. The needs of ELLs are not the result of a language-related disability,
but instead are specific to the student’s current level of English language proficiency. The needs of
students who are ELLs are diverse and are influenced by the interaction of several factors, including
their current level of English language proficiency, their prior exposure to academic content and
language in their native language, the languages to which they are exposed outside of school, the
length of time they have participated in the U.S. education system, and the language(s) in which
academic content is presented in the classroom. Given the unique background and needs of each
student, the conceptual framework is designed to focus on students as individuals and to provide
several accessibility resources that can be combined in a variety of ways. Some of these digital tools,
such as using a highlighter to highlight key information and an audio presentation of test navigation
features, are available to all students, including those at various stages of English language
development. Other tools, such as the audio presentation of items and glossary definitions in
English, may also be assigned to any student, including those at various stages of English language
development. Still other tools, such as embedded glossaries that present translations of construct
irrelevant terms, are intended for those students whose prior language experiences would allow
them to benefit from translations into another spoken language. Collectively, the conceptual
framework for usability, accessibility, and accommodations embraces a variety of accessibility
resources that have been designed to meet the needs of students at various stages in their English
language development.
How the Framework Meets Needs of Students with Disabilities.
Federal law requires that students with disabilities who have a documented need receive
accommodations that address those needs, and that they participate in assessments. The intent of
the law is to ensure that all students have appropriate access to instructional materials and are held
to the same high standards. When students are assessed, the law ensures that students receive
appropriate accommodations during testing so they can appropriately demonstrate what they know
and can do so that their achievement is measured accurately.
The Accessibility and Accommodations Framework addresses the needs of students with disabilities
in three ways. First, it provides for the use of digital test items that are purposefully designed to
contain multiple forms of the item, each developed to address a specific access need. By allowing
the delivery of a given access form of an item to be tailored based on each student’s access need,
Smarter Balanced 2015–16 Summative Assessment Technical Report
Chapter 3: Test Fairness
3-8
the Framework fulfills the intent of federal accommodation legislation. Embedding universal
accessibility digital tools, however, addresses only a portion of the access needs required by many
students with disabilities. Second, by embedding accessibility resources in the digital test delivery
system, additional access needs are met. This approach fulfills the intent of the law for many, but
not all, students with disabilities, by allowing the accessibility resources to be activated for students
based on their needs. Third, by allowing for a wide variety of digital and locally provided
accommodations (including physical arrangements), the Framework addresses a spectrum of
accessibility resources appropriate for math and ELA/literacy assessment. Collectively, the
Framework adheres to federal regulations by allowing a combination of universal design principles,
universal tools, designated supports and accommodations to be embedded in a digital delivery
system and through local administration assigned and provided based on individual student needs.
Therefore, a student who is both an ELL and a student with a disability benefits from the system,
because they may be eligible to have access to resources from any of the 3 categories as necessary
to create an assessment tailored to their individual need.
The Individual Student Assessment Accessibility Profile (ISAAP).
Typical practice frequently required schools and educators to document, a priori, the need for
specific student accommodations and then to document the use of those accommodations after the
assessment. For example, most programs require schools to document a student’s need for a large-
print version of a test for delivery to the school. Following the test administration, the school
documented (often by bubbling in information on an answer sheet) which of the accommodations, if
any, a given student received, whether the student actually used the large-print form, and whether
any other accommodations, such as extended time, were provided. Traditionally, many programs
have focused only on those students who have received accommodations and thus may consider an
accommodation report as documenting accessibility needs. The documentation of need and use
establishes a student’s accessibility needs for assessment.
For most students, universal digital tools will be available by default in the Smarter Balanced test
delivery system and need not be documented. These tools can be deactivated if they create an
unnecessary distraction for the student. Other embedded accessibility resources that are available
for any student needing them must be documented prior to assessment. To capture specific student
accessibility needs, the Smarter Balanced Assessment System has established an individual student
assessment accessibility profile (ISAAP). The ISAAP Tool is designed to facilitate selection of the
universal tools, designated supports and accommodations that match student access needs for the
Smarter Balanced assessments, as supported by the Smarter Balanced Usability, Accessibility, and
Accommodations Guidelines. The ISAAP Tool6 should be used in conjunction with the Smarter
Balanced Usability, Accessibility and Accommodations Guidelines and state regulations and policies
related to assessment accessibility as a part of the ISAAP process. For students requiring one or
more accessibility resource, schools will be able to document this need prior to test administration.
Furthermore, the ISAAP can include information about universal tools that may need to be eliminated
for a given student. By documenting need prior to test administration, a digital delivery system will be
able to activate the specified options when the student logs in to an assessment. In this way, the
6 http://52.11.155.96/static/isaap/index.html
Smarter Balanced 2015–16 Summative Assessment Technical Report
Chapter 3: Test Fairness
3-9
profile permits school-level personnel to focus on each individual student, documenting the
accessibility resources required for valid assessment of that student in a way that is efficient to
manage.
The conceptual framework shown in Figure 3-1 provides a structure that assists in identifying which
accessibility resources should be made available for each student. In addition, the conceptual
framework is designed to differentiate between universal tools available to all students and
accessibility resources that must be assigned before the administration of the assessment.
Consistent with recommendations from Shafer and Rivera (2011), Thurlow, Quenemoen, and
Lazarus (2011), Fedorchak (2012), and Russell (2011), Smarter Balanced is encouraging school-
level personnel to use a team approach to make decisions concerning each student’s ISAAP. Gaining
input from individuals with multiple perspectives, including the student, will likely result in
appropriate decisions about the assignment of accessibility resources. Consistent with these
recommendations avoidance of selecting too many accessibility resources for a student. The use of
too many unneeded accessibility resources can decrease student performance.
The team approach encouraged by Smarter Balanced does not require the formation of a new
decision-making team, and the structure of teams can vary widely depending on the background and
needs of a student. A locally convened student support team can potentially create the ISAAP. For
most students who do not require accessibility tools or accommodations, an initial decision by a
teacher may be confirmed by a second person (potentially the student). In contrast, for a student
who is an English language learner and has been identified with one or more disabilities, the IEP
team should include the English language development specialist who works with the student, along
with other required IEP team members and the student, as appropriate. The composition of teams is
not being defined by Smarter Balanced; it is under the control of each school and is subject to state
and Federal requirements.
Usability, Accessibility, and Accommodations Guidelines: Intended Audience and Recommended
Applications.
Smarter Balanced has developed Usability, Accessibility, and Accommodations Guidelines (UAAG)
that are intended for school-level personnel and decision-making teams, particularly Individualized
Education Program (IEP) teams, as they prepare for and implement the Smarter Balanced
assessment. The UAAG provide information for classroom teachers, English development educators,
special education teachers, and related services personnel to use in selecting and administering
universal tools, designated supports, and accommodations for those students who need them. The
UAAG are also intended for assessment staff and administrators who oversee the decisions that are
made in instruction and assessment. The Smarter Balanced UAAG emphasize an individualized
approach to the implementation of assessment practices for those students who have diverse needs
and participate in large-scale content assessments. This document focuses on universal tools,
designated supports, and accommodations for the Smarter Balanced content assessments of
ELA/literacy and mathematics. At the same time, it supports important instructional decisions about
accessibility for students who participate in the Smarter Balanced assessments. It recognizes the
critical connection between accessibility in instruction and accessibility during assessment. The
UAAG are also incorporated into the Smarter Balanced Test Administration Manuals.
Smarter Balanced 2015–16 Summative Assessment Technical Report
Chapter 3: Test Fairness
3-10
According to the UAAG (2014b, p. 2), all eligible students (including students with disabilities, ELLs,
and ELLs with disabilities) should participate in the assessments. In addition, the performance of all
students who take the assessment are measured with the same criteria. Specifically, all students
enrolled in grades 3 to 8 and 11 are required to participate in the Smarter Balanced mathematics
assessment except students with the most significant cognitive disabilities who meet the criteria for
the mathematics alternate assessment based on alternate achievement standards (approximately
1% or less of the student population).
All students enrolled in grades 3 to 8 and 11 are required to participate in the Smarter Balanced
English language/literacy assessment except:
• students with the most significant cognitive disabilities who meet the criteria for the English
language/literacy alternate assessment based on alternate achievement standards
(approximately 1% or fewer of the student population), and
• ELLs who are enrolled for the first year in a U.S. school. These students will participate in
their state’s English language proficiency assessment.
Federal laws governing student participation in statewide assessments include the Elementary and
Secondary Education Act (ESEA)—reauthorized as the No Child Left Behind Act (NCLB) of 2001, the
Individuals with Disabilities Education Improvement Act of 2004 (IDEA), and Section 504 of the
Rehabilitation Act of 1973 (reauthorized in 2008).
Since the Smarter Balanced assessment is based on the CCSS, the universal tools, designated
supports, and accommodations that are appropriate for the Smarter Balanced assessment may be
different from those that state programs utilized previously. For the summative assessments, state
participants can only make available to students the universal tools, designated supports, and
accommodations consistent with the Smarter Balanced UAAG. According to the UAAG (2014b p. 1),
when the implementation or use of the universal tool, designated support, or accommodation is in
conflict with a member state’s law, regulation, or policy, a state may elect not to make it available to
students.
The Smarter Balanced universal tools, designated supports, and accommodations currently available
for the Smarter Balanced assessments have been prescribed. The specific universal tools,
designated supports, and accommodations approved by Smarter Balanced may undergo change if
additional tools, supports, or accommodations are identified for the assessment based on state
experience or research findings. The Consortium has established a standing committee, including
members from Consortium and staff, that reviews suggested additional universal tools, designated
supports, and accommodations to determine if changes are warranted. Proposed changes to the list
of universal tools, designated supports, and accommodations are brought to consortium members
for review, input, and vote for approval. Furthermore, states may issue temporary approvals (i.e., one
summative assessment administration) for individual, unique student accommodations. It is
expected that states will evaluate formal requests for unique accommodations and determine
whether the request poses a threat to the measurement of the construct. Upon issuing temporary
approval, the petitioning state can send documentation of the approval to the Consortium. The
Consortium will consider all state-approved temporary accommodations as part of the annual
Consortium accommodations review process. The Consortium will provide to member states a list of
Smarter Balanced 2015–16 Summative Assessment Technical Report
Chapter 3: Test Fairness
3-11
the temporary accommodations issued by states that are not Consortium-approved
accommodations.
Guidelines for Accessibility for English Language Learners.
In addition to the use of Universal Design features, Smarter Balanced has built a framework of
accessibility for all students, including English Language Learners (ELLs) that were established in the
Smarter Balanced Guidelines for Accessibility for English Language Learners (Young, Pitoniak, King,
& Ayad, 2012). ELLs have not yet acquired complete proficiency in English. For ELLs, the most
significant accessibility issue concerns the nature of the language used in the assessments. The use
of language that is not fully accessible can be regarded as a source of invalidity that affects the
resulting test score interpretations by introducing construct-irrelevant variance. Although there are
many validity issues related to the assessment of ELLs, the main threat to validity when assessing
content knowledge stems from language factors that are not relevant to the construct of interest.
The goal of these ELL guidelines was to minimize factors that are thought to contribute to such
construct-irrelevant variance. Adherence to these guidelines helped ensure that, to the greatest
extent possible, the Smarter Balanced assessments administered to ELLs measure the intended
targets. The ELL Guidelines were intended primarily to inform Smarter Balanced assessment
developers or other educational practitioners, including content specialists and testing coordinators.
For assessments, an important distinction is between content-related language that is the target of
instruction versus language that is not content-related. For example, the use of words with specific
technical meaning, such as “slope” when used in algebra or “population” when used in biology,
should be used to assess content knowledge for all students. In contrast, greater caution should be
exercised when including words that are not directly related to the domain. ELLs may have had
cultural and social experiences that differ from those of other students. Caution should be exercised
in assuming that ELLs have the same degree of familiarity with concepts or objects occurring in
situational contexts. The recommendation was to use contexts or objects based on classroom or
school experiences rather than ones that are based outside of school. For example, in constructing
mathematics items, it is preferable to use common school objects, such as books and pencils, rather
than objects in the home, such as kitchen appliances, to reduce the potential for construct-irrelevant
variance associated with a test item. When the construct of interest includes a language component,
the decisions regarding the proper use of language becomes more nuanced. If the construct
assessed is the ability to explain a mathematical concept, then the decisions depend on how the
construct is defined. If the construct includes the use of specific language skills, such as the ability
to explain a concept in an innovative context, then it is appropriate to assess these skills. In
ELA\/literacy, there is greater uncertainty as to item development approaches that faithfully reflect
the construct while avoiding language inaccessible for ELLs. The decisions of what best constitutes
an item can rely on the content standards, definition of the construct, and the interpretation of the
claims and assessment targets. For example, if interpreting the meanings in a literary text is the skill
assessed, then using the original source materials is acceptable. However, the test item itself—as
distinct from the passage or stimulus—should be written so that the task presented to a student is
clearly defined using accessible language. Since ELLs taking Smarter Balanced content assessments
likely have a range of English proficiency skills, it is also important to consider the accessibility needs
across the entire spectrum of proficiency. Since ELLs by definition have not attained complete
Smarter Balanced 2015–16 Summative Assessment Technical Report
Chapter 3: Test Fairness
3-12
proficiency in English, the major consideration in developing items is ensuring that the language
used is as accessible as possible. The use of accessible language does not guarantee that construct-
irrelevant variance will be eliminated, but it is the best strategy for helping ensure valid scores for
ELLs and for other students as well.
Using clear and accessible language is a key strategy that minimizes construct-irrelevant variance in
items. Language that is part of the construct being measured should not be simplified. For non-
content-specific text, the language of presentation should be as clear and as simple as is practical.
The following guidelines for the use of accessible language were proposed as guidance in the
development of test items. This guidance was not intended to violate other principles of good item
construction. From the ELL Guidelines (Young, Pitoniak, King, & Ayad, 2012, pp. 2-3), some general
principles for the use of accessible language were proposed as follows.
• Design test directions to maximize clarity and minimize the potential for confusion.
• Use vocabulary widely accessible to all students, and avoid unfamiliar vocabulary not directly
related to the construct (August, Carlo, & Snow, 2005; Bailey, Huang, Shin, Farnsworth, &
Butler, 2007).
• Avoid the use of syntax or vocabulary that is above the test’s target grade level (Borgioli,
2008). The test item should be written at a vocabulary level no higher than the target grade
level, and preferably at a slightly lower grade level, to ensure that all students understand
the task presented (Young, 2008).
• Keep sentence structures as simple as is possible while expressing the intended meaning. In
general, ELLs find a series of simpler, shorter sentences to be more accessible than longer,
more complex sentences (Pitoniak, Young, Martiniello, King, Buteux, & Ginsburgh, 2009).
• Consider the impact of cognates (words with a common etymological origin) when developing
items and false cognates. These are word pairs or phrases that appear to have the same
meaning in two or more languages, but do not. Spanish and English share many cognates,
and because the large majority of ELLs speak Spanish as their first language (nationally,
more than 75%), the presence of cognates can inadvertently confuse students and alter the
skills being assessed by an item. Examples of false cognates include: billion (the correct
Spanish word is millones; not billón, which means trillion); deception (engaño; not decepción,
which means disappointment); large (grande; not largo, which means long); library
(biblioteca; not librería, which means bookstore ).
• Do not use cultural references or idiomatic expressions (such as “being on the ball”) that are
not equally familiar to all students (Bernhardt, 2005).
• Avoid sentence structures that may be confusing or difficult to follow, such as the use of
passive voice or sentences with multiple clauses (Abedi & Lord, 2001; Forster & Olbrei,
1973; Schachter, 1983).
• Do not use syntax that may be confusing or ambiguous, such as using negation or double
negatives in constructing test items (Abedi, 2006; Cummins, Kintsch, Reusser, & Weimer,
1988).
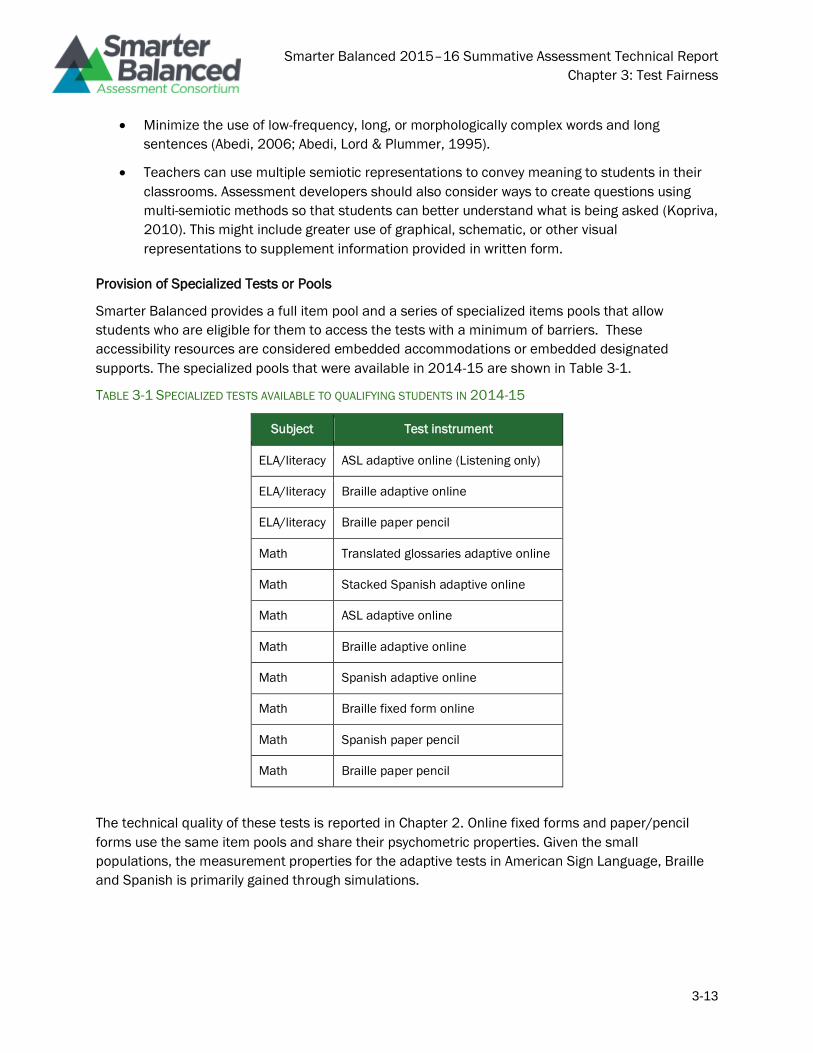
Smarter Balanced 2015–16 Summative Assessment Technical Report
Chapter 3: Test Fairness
3-13
• Minimize the use of low-frequency, long, or morphologically complex words and long
sentences (Abedi, 2006; Abedi, Lord & Plummer, 1995).
• Teachers can use multiple semiotic representations to convey meaning to students in their
classrooms. Assessment developers should also consider ways to create questions using
multi-semiotic methods so that students can better understand what is being asked (Kopriva,
2010). This might include greater use of graphical, schematic, or other visual
representations to supplement information provided in written form.
Provision of Specialized Tests or Pools
Smarter Balanced provides a full item pool and a series of specialized items pools that allow
students who are eligible for them to access the tests with a minimum of barriers. These
accessibility resources are considered embedded accommodations or embedded designated
supports. The specialized pools that were available in 2014-15 are shown in Table 3-1.
TABLE 3-1 SPECIALIZED TESTS AVAILABLE TO QUALIFYING STUDENTS IN 2014-15
Subject Test instrument
ELA/literacy ASL adaptive online (Listening only)
ELA/literacy Braille adaptive online
ELA/literacy Braille paper pencil
Math Translated glossaries adaptive online
Math Stacked Spanish adaptive online
Math ASL adaptive online
Math Braille adaptive online
Math Spanish adaptive online
Math Braille fixed form online
Math Spanish paper pencil
Math Braille paper pencil
The technical quality of these tests is reported in Chapter 2. Online fixed forms and paper/pencil
forms use the same item pools and share their psychometric properties. Given the small
populations, the measurement properties for the adaptive tests in American Sign Language, Braille
and Spanish is primarily gained through simulations.
Smarter Balanced 2015–16 Summative Assessment Technical Report
Chapter 3: Test Fairness
3-14
Fairness as a Lack of Measurement Bias: Differential Item Functioning Analyses
As part of the validity evidence from internal structure, differential item functioning (DIF) analyses
were conducted on items using data from the 2014 field test. This section presents the evidence to
support the frameworks’ claims. DIF analyses are used to identify those items for which identifiable
groups of students (e.g., males, females) with the same underlying level of ability have different
probabilities of answering an item correctly or obtaining a given score level. Students data are
aggregated according to the reported subgroups (e.g. ethnicity, gender, English Language
Proficiency, etc.) for DIF analyses. Students in each subgroup are then ranked relative to their total
test score (conditioning on ability). Students in the focal group (e.g., females) are then compared to
students in the reference group (e.g., males) relative to their performance on individual items. It is
part of the Smarter Balanced framework to have ongoing study and review of findings to inform
iterative, data-driven decisions.
If items are more difficult for some groups of students than for other groups of students, the items
may not necessarily be unfair. For example, if an item were intended to measure the ability to
comprehend a reading passage in English, score differences between groups based on real
differences in comprehension of English would be valid and, therefore, fair. As Cole and Zieky (2001,
p. 375) noted, “If the members of the measurement community currently agree on any aspect of
fairness, it is that score differences alone are not proof of bias.” Fairness does not require that all
groups have the same average item score. Evaluations of validity include examination of differences
in responses for groups of students matched on overall ability. An item would be unfair if the source
of the difficulty were not a valid aspect of the item. For example, an item would be unfair if members
of a group of test takers were distracted by an aspect of the item that they found highly offensive. If
the difference in difficulty reflected real and relevant differences in the group’s level of mastery of
the tested CCSS, the item could be considered fair.
Differential Item Functioning (DIF) Analyses for the Calibration Item Pool
Differential item functioning (DIF) analyses were performed on the items during field testing. DIF
analyses are used to identify those items that identify groups of students (e.g., males versus
females) with the same underlying level of ability that have different probabilities of answering an
item correctly. To perform a DIF analysis, student data are aggregated according to the reported
subgroups (e.g., ethnicity, gender, etc.). Students in each subgroup are then ranked relative to their
total test score (conditioning on ability). Item performance from the focal group to be examined (e.g.,
females) is compared conditionally based on ability with the reference group (e.g., males). The
definitions for the focal and references groups used are given in Table 3-2. A DIF analysis asks, “If
we compare focal-group and reference-group students of the same overall ability (as indicated by
their performance on the full test), are any test items appreciably more difficult for one group
compared with another group?” DIF in this context is viewed as only an indicator of possible bias.
DIF statistics are used to identify items that are functioning differentially. Subsequent reviews by
content experts and bias/sensitivity committees are required to determine the source and meaning
of performance differences. If the item is differentially more difficult for an identifiable subgroup
when conditioned on ability, it may be measuring something different from the intended construct.
However, it is important to recognize that DIF-flagged items might be related to actual differences in
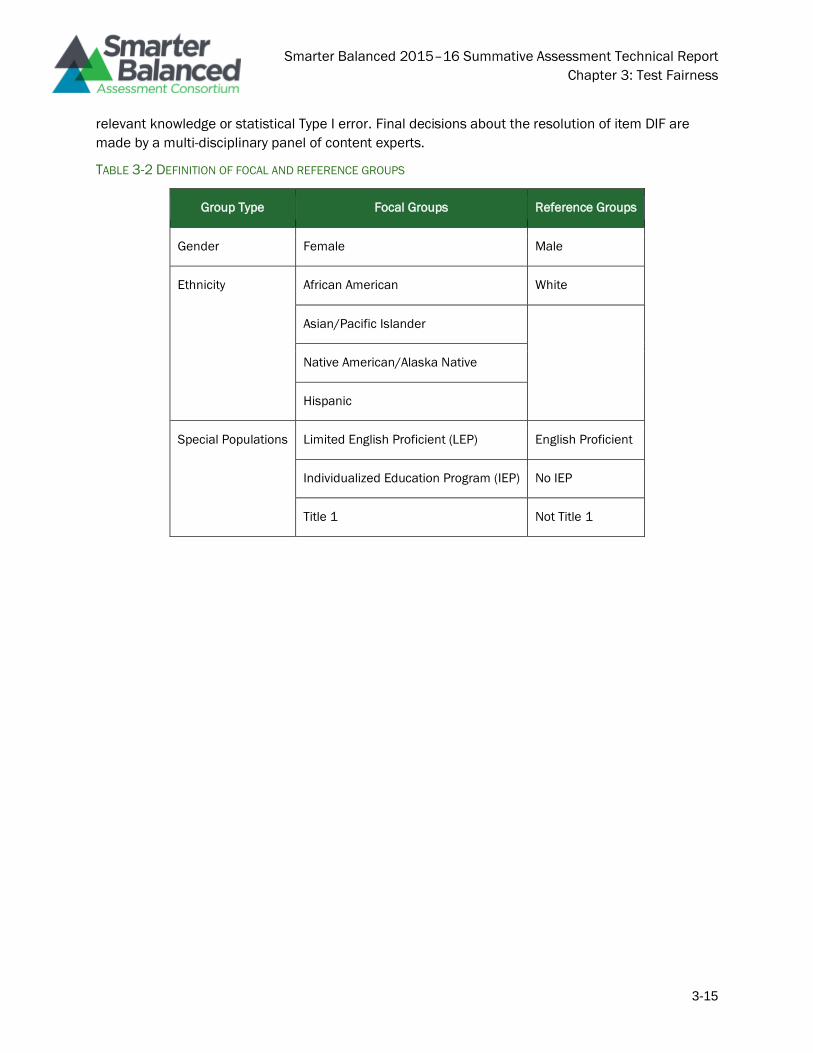
Smarter Balanced 2015–16 Summative Assessment Technical Report
Chapter 3: Test Fairness
3-15
relevant knowledge or statistical Type I error. Final decisions about the resolution of item DIF are
made by a multi-disciplinary panel of content experts.
TABLE 3-2 DEFINITION OF FOCAL AND REFERENCE GROUPS
Group Type Focal Groups Reference Groups
Gender Female Male
Ethnicity African American White
Asian/Pacific Islander
Native American/Alaska Native
Hispanic
Special Populations Limited English Proficient (LEP) English Proficient
Individualized Education Program (IEP) No IEP
Title 1 Not Title 1
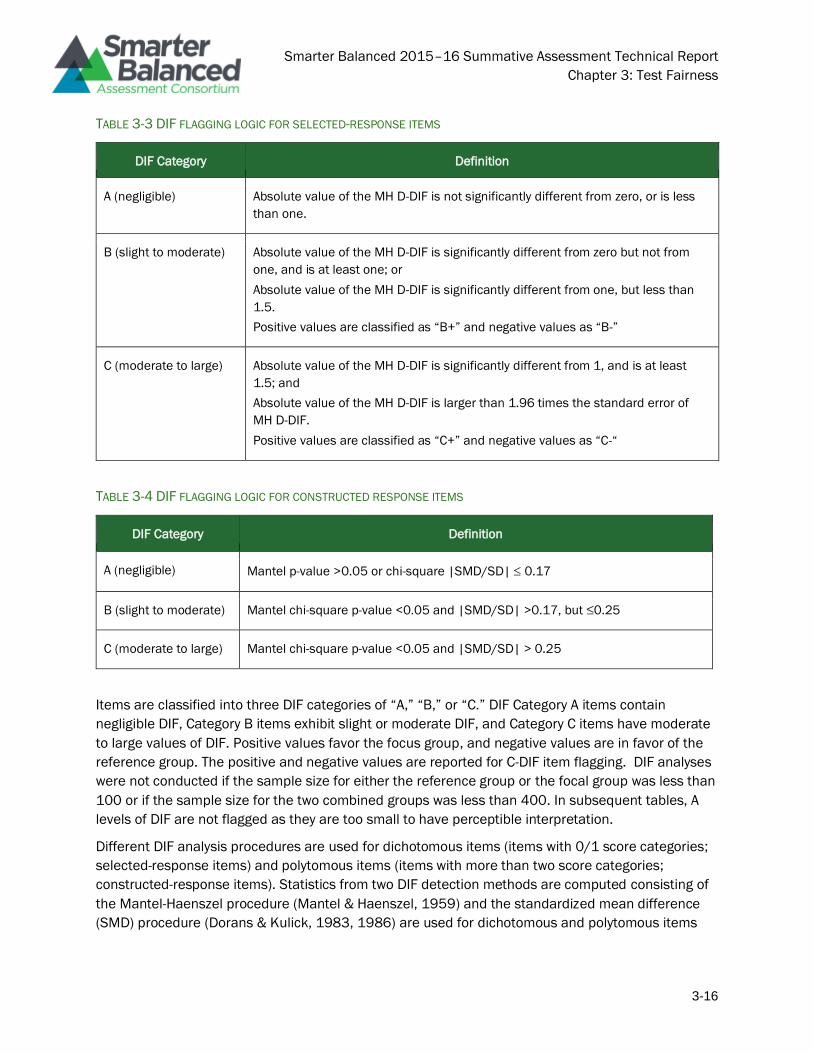
Smarter Balanced 2015–16 Summative Assessment Technical Report
Chapter 3: Test Fairness
3-16
TABLE 3-3 DIF FLAGGING LOGIC FOR SELECTED-RESPONSE ITEMS
DIF Category Definition
A (negligible) Absolute value of the MH D-DIF is not significantly different from zero, or is less
than one.
B (slight to moderate) Absolute value of the MH D-DIF is significantly different from zero but not from
one, and is at least one; or
Absolute value of the MH D-DIF is significantly different from one, but less than
1.5.
Positive values are classified as “B+” and negative values as “B-”
C (moderate to large) Absolute value of the MH D-DIF is significantly different from 1, and is at least
1.5; and
Absolute value of the MH D-DIF is larger than 1.96 times the standard error of
MH D-DIF.
Positive values are classified as “C+” and negative values as “C-“
TABLE 3-4 DIF FLAGGING LOGIC FOR CONSTRUCTED RESPONSE ITEMS
DIF Category Definition
A (negligible) Mantel p-value >0.05 or chi-square |SMD/SD| 0.17
B (slight to moderate) Mantel chi-square p-value <0.05 and |SMD/SD| >0.17, but ≤0.25
C (moderate to large) Mantel chi-square p-value <0.05 and |SMD/SD| > 0.25
Items are classified into three DIF categories of “A,” “B,” or “C.” DIF Category A items contain
negligible DIF, Category B items exhibit slight or moderate DIF, and Category C items have moderate
to large values of DIF. Positive values favor the focus group, and negative values are in favor of the
reference group. The positive and negative values are reported for C-DIF item flagging. DIF analyses
were not conducted if the sample size for either the reference group or the focal group was less than
100 or if the sample size for the two combined groups was less than 400. In subsequent tables, A
levels of DIF are not flagged as they are too small to have perceptible interpretation.
Different DIF analysis procedures are used for dichotomous items (items with 0/1 score categories;
selected-response items) and polytomous items (items with more than two score categories;
constructed-response items). Statistics from two DIF detection methods are computed consisting of
the Mantel-Haenszel procedure (Mantel & Haenszel, 1959) and the standardized mean difference
(SMD) procedure (Dorans & Kulick, 1983, 1986) are used for dichotomous and polytomous items
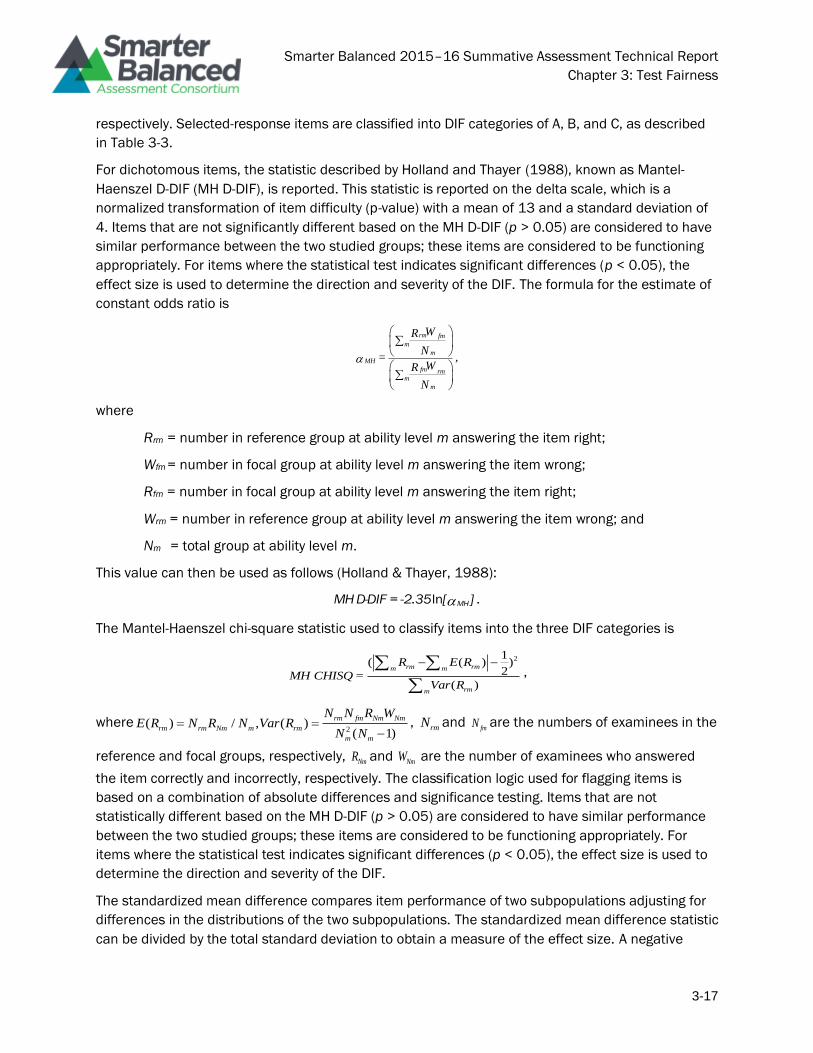
Smarter Balanced 2015–16 Summative Assessment Technical Report
Chapter 3: Test Fairness
3-17
respectively. Selected-response items are classified into DIF categories of A, B, and C, as described
in Table 3-3.
For dichotomous items, the statistic described by Holland and Thayer (1988), known as Mantel-
Haenszel D-DIF (MH D-DIF), is reported. This statistic is reported on the delta scale, which is a
normalized transformation of item difficulty (p-value) with a mean of 13 and a standard deviation of
4. Items that are not significantly different based on the MH D-DIF (p > 0.05) are considered to have
similar performance between the two studied groups; these items are considered to be functioning
appropriately. For items where the statistical test indicates significant differences (p < 0.05), the
effect size is used to determine the direction and severity of the DIF. The formula for the estimate of
constant odds ratio is
rm fm
m
m
MH
fm rmm
m
WR
N= ,
WR
N
where
Rrm = number in reference group at ability level m answering the item right;
Wfm = number in focal group at ability level m answering the item wrong;
Rfm = number in focal group at ability level m answering the item right;
Wrm = number in reference group at ability level m answering the item wrong; and
Nm = total group at ability level m.
This value can then be used as follows (Holland & Thayer, 1988):
- ln MHMH D-DIF = 2.35 [ ] .
The Mantel-Haenszel chi-square statistic used to classify items into the three DIF categories is
21( ( ) )
2
( )
rm rmm m
rmm
R E R
MH CHISQ =Var R
,
where2
( ) / , ( )( 1)
rm fm Nm Nm
rm rm Nm m rm
m m
N N R WE R N R N Var R
N N
, rmN and
fmN are the numbers of examinees in the
reference and focal groups, respectively, NmR and NmW are the number of examinees who answered
the item correctly and incorrectly, respectively. The classification logic used for flagging items is
based on a combination of absolute differences and significance testing. Items that are not
statistically different based on the MH D-DIF (p > 0.05) are considered to have similar performance
between the two studied groups; these items are considered to be functioning appropriately. For
items where the statistical test indicates significant differences (p < 0.05), the effect size is used to
determine the direction and severity of the DIF.
The standardized mean difference compares item performance of two subpopulations adjusting for
differences in the distributions of the two subpopulations. The standardized mean difference statistic
can be divided by the total standard deviation to obtain a measure of the effect size. A negative
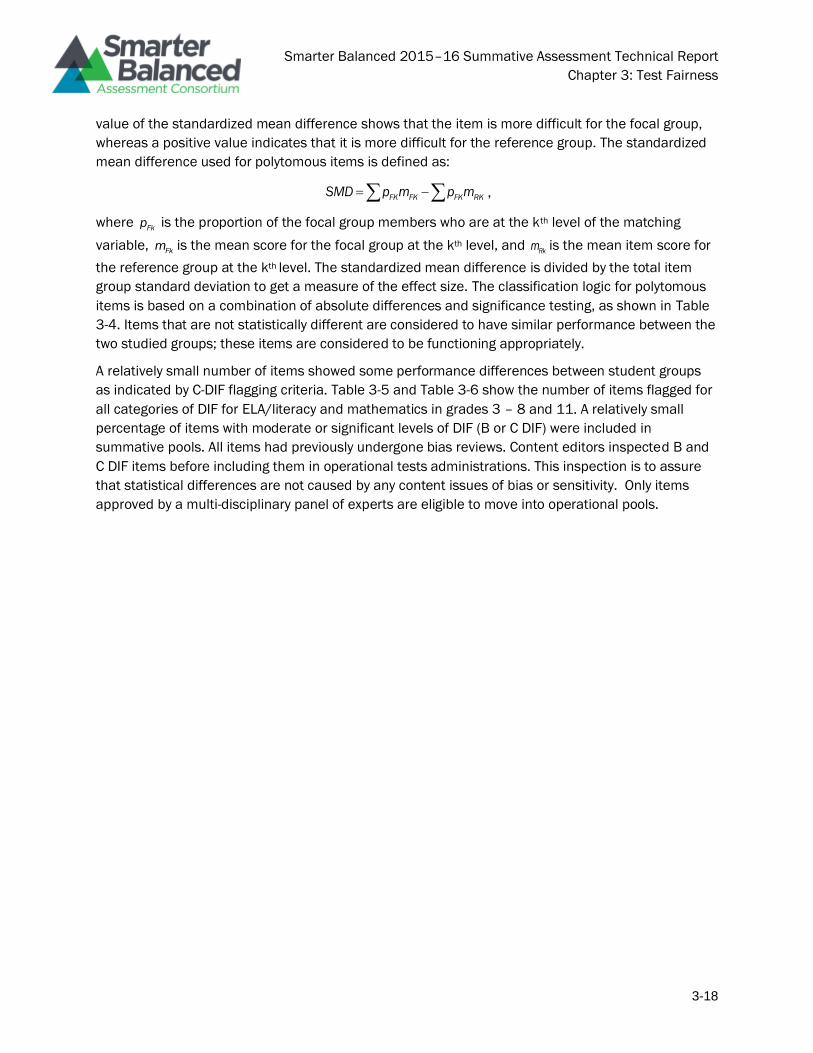
Smarter Balanced 2015–16 Summative Assessment Technical Report
Chapter 3: Test Fairness
3-18
value of the standardized mean difference shows that the item is more difficult for the focal group,
whereas a positive value indicates that it is more difficult for the reference group. The standardized
mean difference used for polytomous items is defined as:
FK FK FK RKSMD p m p m ,
where Fk
p is the proportion of the focal group members who are at the kth level of the matching
variable, Fk
m is the mean score for the focal group at the kth level, and Rk
m is the mean item score for
the reference group at the kth level. The standardized mean difference is divided by the total item
group standard deviation to get a measure of the effect size. The classification logic for polytomous
items is based on a combination of absolute differences and significance testing, as shown in Table
3-4. Items that are not statistically different are considered to have similar performance between the
two studied groups; these items are considered to be functioning appropriately.
A relatively small number of items showed some performance differences between student groups
as indicated by C-DIF flagging criteria. Table 3-5 and Table 3-6 show the number of items flagged for
all categories of DIF for ELA/literacy and mathematics in grades 3 – 8 and 11. A relatively small
percentage of items with moderate or significant levels of DIF (B or C DIF) were included in
summative pools. All items had previously undergone bias reviews. Content editors inspected B and
C DIF items before including them in operational tests administrations. This inspection is to assure
that statistical differences are not caused by any content issues of bias or sensitivity. Only items
approved by a multi-disciplinary panel of experts are eligible to move into operational pools.
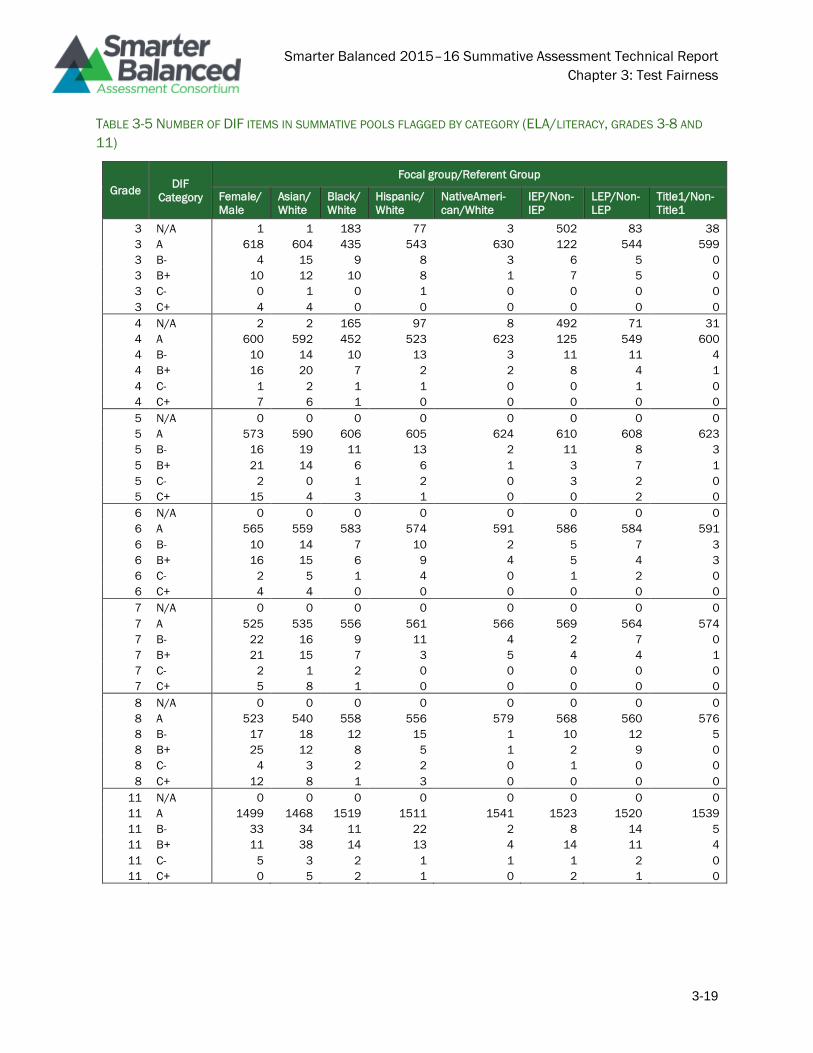
Smarter Balanced 2015–16 Summative Assessment Technical Report
Chapter 3: Test Fairness
3-19
TABLE 3-5 NUMBER OF DIF ITEMS IN SUMMATIVE POOLS FLAGGED BY CATEGORY (ELA/LITERACY, GRADES 3-8 AND
11)
Grade DIF
Category
Focal group/Referent Group
Female/
Male
Asian/
White
Black/
White
Hispanic/
White
NativeAmeri-
can/White
IEP/Non-
IEP
LEP/Non-
LEP
Title1/Non-
Title1
3 N/A 1 1 183 77 3 502 83 38
3 A 618 604 435 543 630 122 544 599
3 B- 4 15 9 8 3 6 5 0
3 B+ 10 12 10 8 1 7 5 0
3 C- 0 1 0 1 0 0 0 0
3 C+ 4 4 0 0 0 0 0 0
4 N/A 2 2 165 97 8 492 71 31
4 A 600 592 452 523 623 125 549 600
4 B- 10 14 10 13 3 11 11 4
4 B+ 16 20 7 2 2 8 4 1
4 C- 1 2 1 1 0 0 1 0
4 C+ 7 6 1 0 0 0 0 0
5 N/A 0 0 0 0 0 0 0 0
5 A 573 590 606 605 624 610 608 623
5 B- 16 19 11 13 2 11 8 3
5 B+ 21 14 6 6 1 3 7 1
5 C- 2 0 1 2 0 3 2 0
5 C+ 15 4 3 1 0 0 2 0
6 N/A 0 0 0 0 0 0 0 0
6 A 565 559 583 574 591 586 584 591
6 B- 10 14 7 10 2 5 7 3
6 B+ 16 15 6 9 4 5 4 3
6 C- 2 5 1 4 0 1 2 0
6 C+ 4 4 0 0 0 0 0 0
7 N/A 0 0 0 0 0 0 0 0
7 A 525 535 556 561 566 569 564 574
7 B- 22 16 9 11 4 2 7 0
7 B+ 21 15 7 3 5 4 4 1
7 C- 2 1 2 0 0 0 0 0
7 C+ 5 8 1 0 0 0 0 0
8 N/A 0 0 0 0 0 0 0 0
8 A 523 540 558 556 579 568 560 576
8 B- 17 18 12 15 1 10 12 5
8 B+ 25 12 8 5 1 2 9 0
8 C- 4 3 2 2 0 1 0 0
8 C+ 12 8 1 3 0 0 0 0
11 N/A 0 0 0 0 0 0 0 0
11 A 1499 1468 1519 1511 1541 1523 1520 1539
11 B- 33 34 11 22 2 8 14 5
11 B+ 11 38 14 13 4 14 11 4
11 C- 5 3 2 1 1 1 2 0
11 C+ 0 5 2 1 0 2 1 0
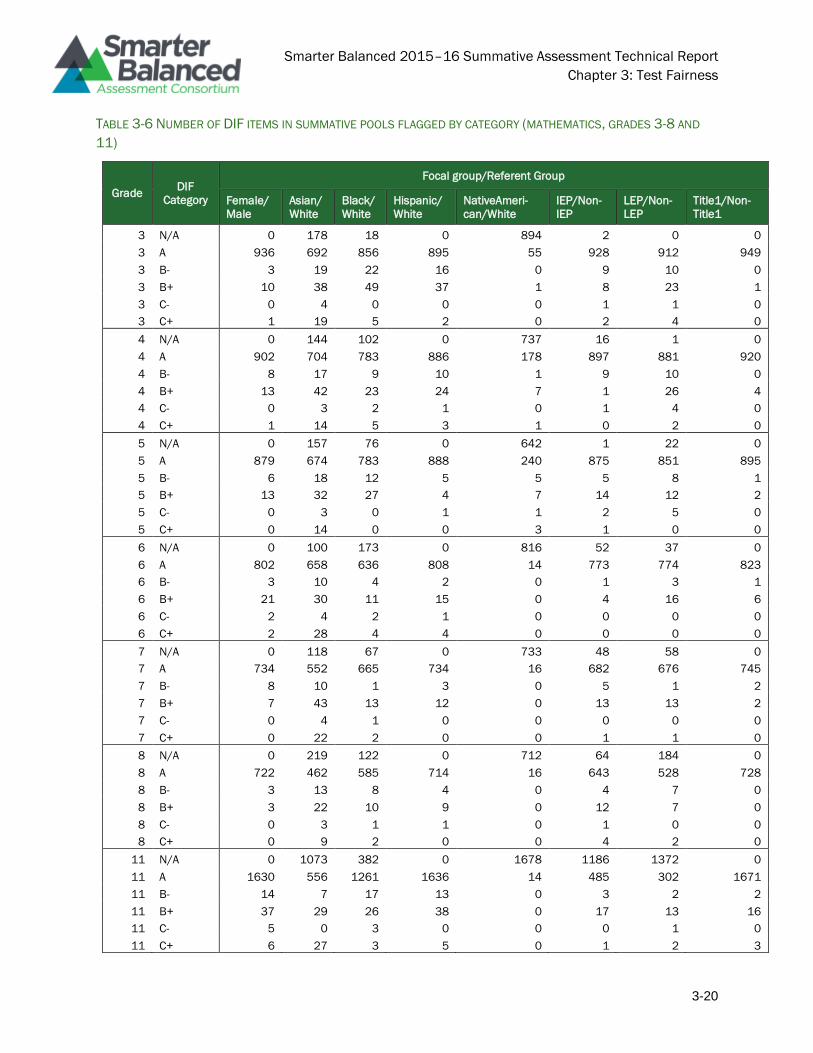
Smarter Balanced 2015–16 Summative Assessment Technical Report
Chapter 3: Test Fairness
3-20
TABLE 3-6 NUMBER OF DIF ITEMS IN SUMMATIVE POOLS FLAGGED BY CATEGORY (MATHEMATICS, GRADES 3-8 AND
11)
Grade DIF
Category
Focal group/Referent Group
Female/
Male
Asian/
White
Black/
White
Hispanic/
White
NativeAmeri-
can/White
IEP/Non-
IEP
LEP/Non-
LEP
Title1/Non-
Title1
3 N/A 0 178 18 0 894 2 0 0
3 A 936 692 856 895 55 928 912 949
3 B- 3 19 22 16 0 9 10 0
3 B+ 10 38 49 37 1 8 23 1
3 C- 0 4 0 0 0 1 1 0
3 C+ 1 19 5 2 0 2 4 0
4 N/A 0 144 102 0 737 16 1 0
4 A 902 704 783 886 178 897 881 920
4 B- 8 17 9 10 1 9 10 0
4 B+ 13 42 23 24 7 1 26 4
4 C- 0 3 2 1 0 1 4 0
4 C+ 1 14 5 3 1 0 2 0
5 N/A 0 157 76 0 642 1 22 0
5 A 879 674 783 888 240 875 851 895
5 B- 6 18 12 5 5 5 8 1
5 B+ 13 32 27 4 7 14 12 2
5 C- 0 3 0 1 1 2 5 0
5 C+ 0 14 0 0 3 1 0 0
6 N/A 0 100 173 0 816 52 37 0
6 A 802 658 636 808 14 773 774 823
6 B- 3 10 4 2 0 1 3 1
6 B+ 21 30 11 15 0 4 16 6
6 C- 2 4 2 1 0 0 0 0
6 C+ 2 28 4 4 0 0 0 0
7 N/A 0 118 67 0 733 48 58 0
7 A 734 552 665 734 16 682 676 745
7 B- 8 10 1 3 0 5 1 2
7 B+ 7 43 13 12 0 13 13 2
7 C- 0 4 1 0 0 0 0 0
7 C+ 0 22 2 0 0 1 1 0
8 N/A 0 219 122 0 712 64 184 0
8 A 722 462 585 714 16 643 528 728
8 B- 3 13 8 4 0 4 7 0
8 B+ 3 22 10 9 0 12 7 0
8 C- 0 3 1 1 0 1 0 0
8 C+ 0 9 2 0 0 4 2 0
11 N/A 0 1073 382 0 1678 1186 1372 0
11 A 1630 556 1261 1636 14 485 302 1671
11 B- 14 7 17 13 0 3 2 2
11 B+ 37 29 26 38 0 17 13 16
11 C- 5 0 3 0 0 0 1 0
11 C+ 6 27 3 5 0 1 2 3
Smarter Balanced 2015–16 Summative Assessment Technical Report
Chapter 3: Test Fairness
3-21
Note: In February, 2016, the Consortium’s Technical Advisory Committee suggested that these
criteria may be too conservative. Based on this advice, the Consortium may loosen its thresholds for
determining DIF. Any such change will be reported in subsequent technical manuals.
Test Fairness and Implications for Ongoing Research
There are many features of the Smarter Balanced assessments that support equitable assessment
across all groups of students. The assessments are developed using the principles of evidence-
centered design and universal test design. Test accommodations are provided for students with
disabilities, and language-tools and supports were developed for ELLs. The Consortium developed a
set of guidelines to facilitate accessibility to the assessments. In addition to these general
accessibility guidelines embedded in the conceptual framework, procedures for item writing and
reviewing and guidelines for creating audio, sign language, and tactile versions of the items were
implemented. Smarter Balanced developed guidelines for item development that aim toward
reducing construct-irrelevant language complexities for English language learners (Young, Pitoniak,
King, & Ayad, 2012) and comprehensive guidelines for bias and sensitivity (ETS, 2012), and a rubric
specifically geared towards scoring language complexity (Cook & MacDonald, 2013). In addition,
measurement bias was investigated using DIF methods. This evidence underscores the commitment
to fair and equitable assessment for all students, regardless of their gender, cultural heritage,
disability status, native language, and other characteristics. Irrespective of these proactive
development activities designed to promote equitable assessments, further validity evidence that
the assessments are fair for all groups of students should be provided. To evaluate the degree to
which the Smarter Balanced assessments are fulfilling the purpose of valid, reliable, and fair
information that is equitable for all students, several types of additional evidence are recommended
based on the relevant types listed in the AERA, APA, & NCME (2014) Standards. Validity studies are
described here as well as ones that can be addressed in the ongoing research agenda for Smarter
Balanced .
Smarter Balanced 2015–16 Summative Assessment Technical Report
Chapter 3: Test Fairness
3-22
References
Abedi, J., & Ewers, N (2013). Accommodations for English language learners and students with
disabilities: A research-based decision algorithm. Available from
https://portal.smarterbalanced.org/library/en/v1.0/accommodations-for-english-language-
learners-and-students-with-disabilities-a-research-based-decision-algorithm.pdf
Abedi, J., & Lord, C. (2001). The language factor in mathematics tests. Applied Measurement in
Education, 14, 219-234.
Abedi, J., Lord, C., & Plummer, J. (1995). Language background as a variable in NAEP mathematics
performance (CSE Technical Report 429). Los Angeles: University of California, National
Center for Research on Evaluation, Standards, and Student Testing.
American Educational Research Association, American Psychological Association, & National Council
on Measurement in Education. (2014). Standards for Educational and Psychological Testing.
Washington, DC: American Psychological Association.
August, D., Carlo, M., Dressler, C., & Snow, C. (2005). The critical role of vocabulary development for
English language learners. Learning Disability Research and Practice, 20(1), 50-57.
Bailey, A. L., Huang, B. H., Shin, H W., Farnsworth, T., & Butler, F. A., (2007) Developing academic
English language proficiency prototypes for 5th grade reading: Psychometric and linguistic
profiles of tasks (CSE Technical Report 727). Los Angeles: University of California, National
Center for Research on Evaluation, Standards, and Student Testing.
Bernhardt, E. (2005). Progress and procrastination in second language reading. Annual Review of
Applied Linguistics, 25, 133–150.
Borgioli, G. (2008). Equity for English language learners in mathematics classrooms. Teaching
Children Mathematics, 15, 185-191.
Cole, N.S., & Zieky, M. J. (2001). The New Faces of Fairness. Journal of Educational Measurement.
38, 4.
Cook, H.G. & McDonald, R. (2013). Tool to Evaluate Language Complexity of Test Items. Wisconsin
Center for Education Research. Retrieved from http://wcer.wisc.edu/docs/working-
papers/Working_Paper_No_2013_05.pdf
Cummins, D. D., Kintsch, W., Reusser, K., & Weimer, R. (1988). The role of understanding in solving
word problems. Cognitive Psychology, 20, 405-438.
Dorans, N. J., & Kulick, E. (1983). Assessing unexpected differential item performance of female
candidates on SAT and TSWE forms administered in December 1977: An application of the
standardization approach (Research Report No. RR-83-09). Princeton, NJ: Educational
Testing Service
Dorans, N. J., & Kulick, E. (1986). Demonstrating the utility of the standardization approach to
assessing unexpected differential item performance on the Scholastic Aptitude Test. Journal
of Educational Measurement, 23, 355–368.
Smarter Balanced 2015–16 Summative Assessment Technical Report
Chapter 3: Test Fairness
3-23
ETS. (2012). Smarter Balanced Assessment Consortium: Bias and Sensitivity Guidelines. Princeton,
NJ: ETS. Retrieved from http://www.smarterbalanced.org/wp-
content/uploads/2015/08/BiasandSensitivityGuidelines.pdf
Fedorchak, G. (2012). Access by design—Implications for equity and excellence in education. Draft
paper prepared for the Smarter Balanced Assessment Consortium.
Forster, K. I. & Olbrei, I. (1973). Semantic heuristics and syntactic trial. Cognition, 2, 319-347.
Kopriva, R. (2010, September). Building on student strengths or how to test ELs against challenging
math (and science) standards when they don’t have the English yet. Common Core State
Standards Implementation Conference.
Mantel N. & Haenszel, W. 1959. Statistical aspects of the analysis of data from retrospective studies
of disease. Journal of the National Cancer Institute, 22, 719-748
Messick, S. (1989). Validity. In R. L. Linn (Ed.), Educational Measurement. Washington, DC: American
Council on Education.
Pitoniak, M., Young, J. W., Martiniello, M., King, T., Buteux, A., & Ginsburgh, M. (2009). Guidelines for
the assessment of English language learners. Princeton, NJ: Educational Testing Service.
Russell, M. (2011). Digital Test Delivery: Empowering Accessible Test Design to Increase Test Validity
for All Students. Paper prepared for Arabella Advisors.
Schachter, P. (1983). On syntactic categories. Bloomington, IN: Indiana University Linguistics Club.
Shafer W., L., & Rivera, C. (2011). Are EL needs being defined appropriately for the next generation
of computer-based tests? AccELLerate, 3(2), 12–14.
Smarter Balanced Assessment Consortium. (2014a). Accessibility and Accommodations Framework.
Retrieved from http://www.smarterbalanced.org/wp-
content/uploads/2015/09/Accessibility-and-Accommodations-Framework.pdf
Smarter Balanced Assessment Consortium. (2014b, November 5). Usability, Accessibility, and
Accommodations Guidelines.
Smarter Balanced Assessment Consortium. (2015a). Content specifications for the summative
assessment of the common core state standards for English language arts and literacy in
history/social studies, science, and technical subjects. Retrieved from
https://portal.smarterbalanced.org/library/en/english-language-artsliteracy-content-
specifications.pdf
Smarter Balanced Assessment Consortium. (2015b). Content specifications for the summative
assessment of the common core state standards for mathematics. Retrieved from
https://portal.smarterbalanced.org/library/en/english-language-artsliteracy-content-
specifications.pdf
Smarter Balanced Assessment Consortium. (2015c). Item and task specifications. Retrieved from
http://www.smarterbalanced.org/assessments/development/
Smarter Balanced 2015–16 Summative Assessment Technical Report
Chapter 3: Test Fairness
3-24
Thompson, S. J., Johnstone, C. J., & Thurlow, M. L. (2002). Universal Design Applied to Large Scale
Assessments. Minneapolis, MN: University of Minnesota, National Center on Educational
Outcomes.
Thurlow, M. L., Quenemoen, R. F., & Lazarus, S. S. (2011). Meeting the Needs of Special Education
Students: Recommendations for the Race to the Top Consortia and States. Paper prepared
for Arabella Advisors.
Young, J., Pitoniak, M. J., King, T. C., & Ayad, E. (2012). Smarter Balanced Assessment Consortium:
Guidelines for Accessibility for English Language Learners. Retrieved from
http://www.smarterbalanced.org/wp-
content/uploads/2015/08/GuidelinesforAccessibilityforELL.pdf
Young, J. W. (2008, December). Ensuring valid content tests for English language learners. R&D
Connections, No. 8. Princeton, NJ: Educational Testing Service.
Smarter Balanced 2015–16 Summative Assessment Technical Report
Chapter 4: Test Design
4-1
Chapter 4: Test Design
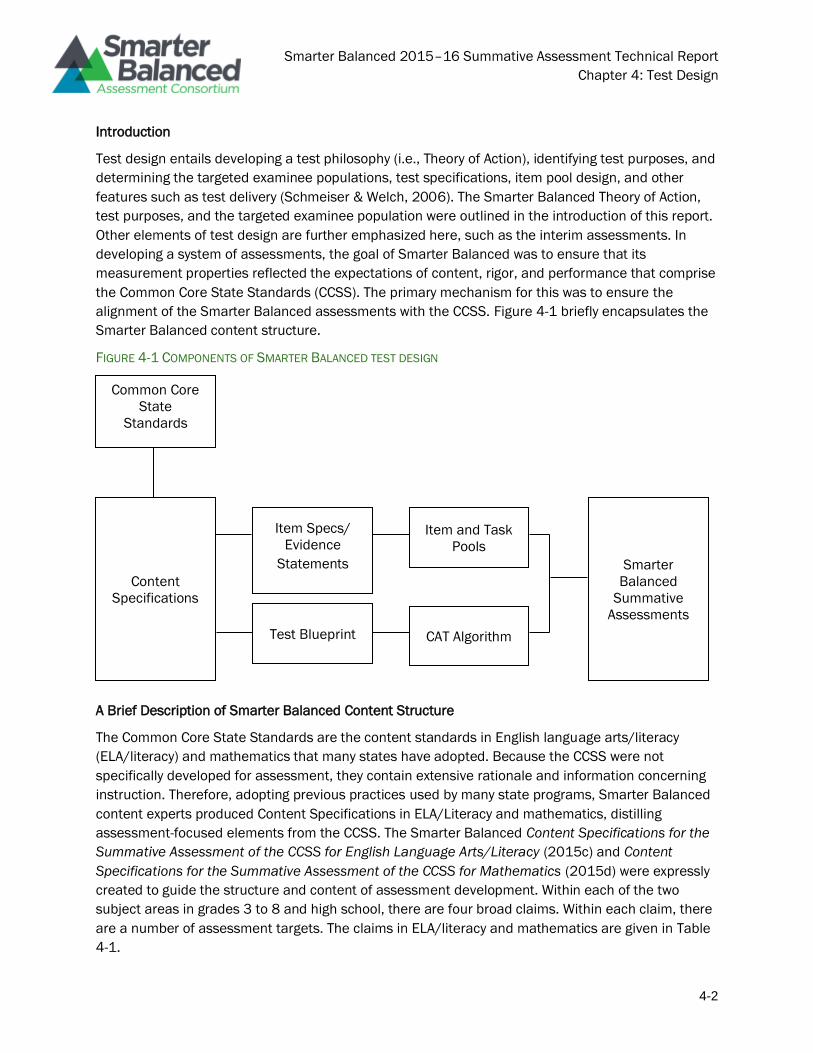
Smarter Balanced 2015–16 Summative Assessment Technical Report
Chapter 4: Test Design
4-2
Introduction
Test design entails developing a test philosophy (i.e., Theory of Action), identifying test purposes, and
determining the targeted examinee populations, test specifications, item pool design, and other
features such as test delivery (Schmeiser & Welch, 2006). The Smarter Balanced Theory of Action,
test purposes, and the targeted examinee population were outlined in the introduction of this report.
Other elements of test design are further emphasized here, such as the interim assessments. In
developing a system of assessments, the goal of Smarter Balanced was to ensure that its
measurement properties reflected the expectations of content, rigor, and performance that comprise
the Common Core State Standards (CCSS). The primary mechanism for this was to ensure the
alignment of the Smarter Balanced assessments with the CCSS. Figure 4-1 briefly encapsulates the
Smarter Balanced content structure.
FIGURE 4-1 COMPONENTS OF SMARTER BALANCED TEST DESIGN
A Brief Description of Smarter Balanced Content Structure
The Common Core State Standards are the content standards in English language arts/literacy
(ELA/literacy) and mathematics that many states have adopted. Because the CCSS were not
specifically developed for assessment, they contain extensive rationale and information concerning
instruction. Therefore, adopting previous practices used by many state programs, Smarter Balanced
content experts produced Content Specifications in ELA/Literacy and mathematics, distilling
assessment-focused elements from the CCSS. The Smarter Balanced Content Specifications for the
Summative Assessment of the CCSS for English Language Arts/Literacy (2015c) and Content
Specifications for the Summative Assessment of the CCSS for Mathematics (2015d) were expressly
created to guide the structure and content of assessment development. Within each of the two
subject areas in grades 3 to 8 and high school, there are four broad claims. Within each claim, there
are a number of assessment targets. The claims in ELA/literacy and mathematics are given in Table
4-1.
Common Core
State
Standards
Content
Specifications
Item Specs/
Evidence
Statements
Test Blueprint CAT Algorithm
Item and Task
Pools
Smarter
Balanced
Summative
Assessments
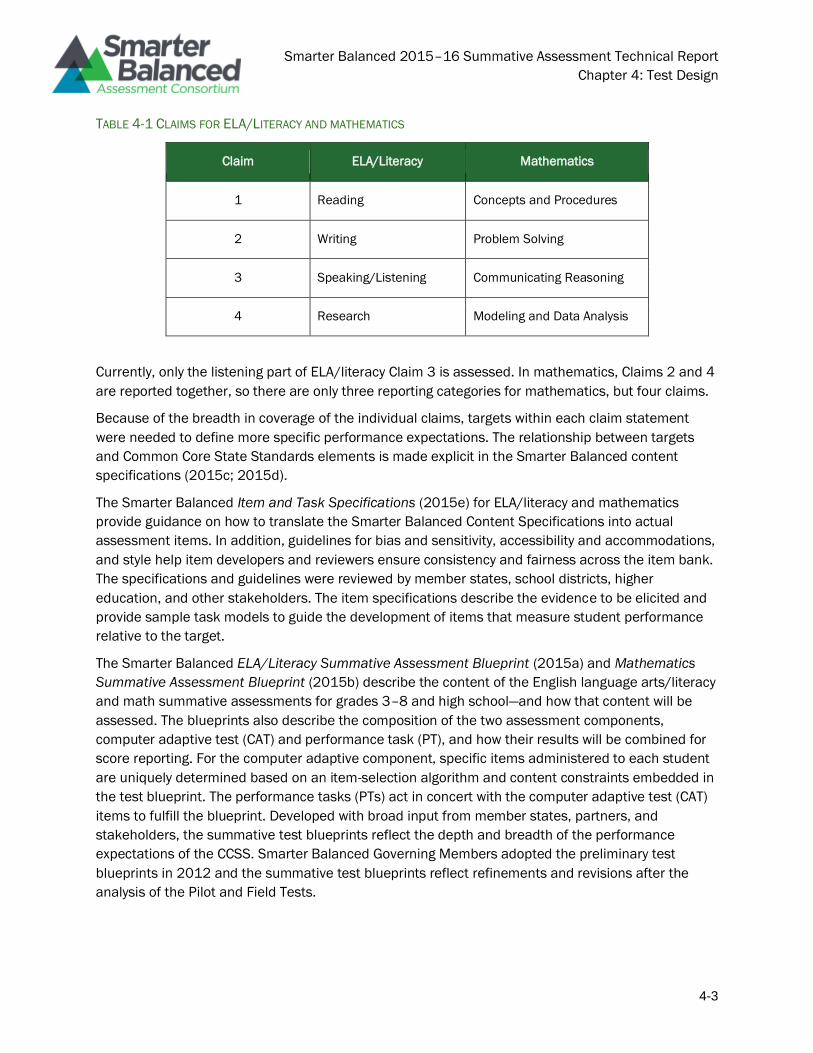
Smarter Balanced 2015–16 Summative Assessment Technical Report
Chapter 4: Test Design
4-3
TABLE 4-1 CLAIMS FOR ELA/LITERACY AND MATHEMATICS
Claim ELA/Literacy Mathematics
1 Reading Concepts and Procedures
2 Writing Problem Solving
3 Speaking/Listening Communicating Reasoning
4 Research Modeling and Data Analysis
Currently, only the listening part of ELA/literacy Claim 3 is assessed. In mathematics, Claims 2 and 4
are reported together, so there are only three reporting categories for mathematics, but four claims.
Because of the breadth in coverage of the individual claims, targets within each claim statement
were needed to define more specific performance expectations. The relationship between targets
and Common Core State Standards elements is made explicit in the Smarter Balanced content
specifications (2015c; 2015d).
The Smarter Balanced Item and Task Specifications (2015e) for ELA/literacy and mathematics
provide guidance on how to translate the Smarter Balanced Content Specifications into actual
assessment items. In addition, guidelines for bias and sensitivity, accessibility and accommodations,
and style help item developers and reviewers ensure consistency and fairness across the item bank.
The specifications and guidelines were reviewed by member states, school districts, higher
education, and other stakeholders. The item specifications describe the evidence to be elicited and
provide sample task models to guide the development of items that measure student performance
relative to the target.
The Smarter Balanced ELA/Literacy Summative Assessment Blueprint (2015a) and Mathematics
Summative Assessment Blueprint (2015b) describe the content of the English language arts/literacy
and math summative assessments for grades 3–8 and high school—and how that content will be
assessed. The blueprints also describe the composition of the two assessment components,
computer adaptive test (CAT) and performance task (PT), and how their results will be combined for
score reporting. For the computer adaptive component, specific items administered to each student
are uniquely determined based on an item-selection algorithm and content constraints embedded in
the test blueprint. The performance tasks (PTs) act in concert with the computer adaptive test (CAT)
items to fulfill the blueprint. Developed with broad input from member states, partners, and
stakeholders, the summative test blueprints reflect the depth and breadth of the performance
expectations of the CCSS. Smarter Balanced Governing Members adopted the preliminary test
blueprints in 2012 and the summative test blueprints reflect refinements and revisions after the
analysis of the Pilot and Field Tests.
Smarter Balanced 2015–16 Summative Assessment Technical Report
Chapter 4: Test Design
4-4
Synopsis of Assessment System Components
The summative assessment for each content area consists of two parts: a CAT and a PT. The PT is
administered on a computer but is not computer adaptive. The summative assessment is
administered according to the guidance provided in the Smarter Balanced State Procedures Manual
(2014). The summative assessment scores
• accurately describe student achievement and can describe growth of student learning as
part of program evaluation and school, district, and state accountability systems;
• provide valid, reliable, and fair measures of students’ progress toward, and attainment of,
the knowledge and skills required to be college- and career-ready;
• Measure the breadth and depth of the CCSS across the full spectrum of student ability by
incorporating a variety of item types (including items and tasks scored by expert raters) that
are supported by a comprehensive set of accessibility resources;
• capitalize on the strengths of computer adaptive testing—efficient and precise measurement
across the full range of student achievement; and
• utilize performance tasks to provide a measure of the student’s ability to integrate
knowledge and skills.
Evidence-Centered Design in Constructing Smarter Balanced Assessments
Evidence-centered design (ECD) is an approach to the creation of educational assessments in terms
of reasoning about evidence (arguments) concerning the intended constructs. The ECD begins with
identification of claims, or inference users want to make concerning student achievement. Evidence
needed to support those claims is then specified, and finally, items/tasks capable of eliciting that
information are designed (Mislevy, Steinberg, & Almond, 2003). Explicit attention is paid to the
potential influence of unintended constructs. ECD accomplishes this in two ways. The first is by
incorporating an overarching conception of assessment as an argument from imperfect evidence.
This argument makes explicit the claims (the inferences that one intends to make based on scores)
and the nature of the evidence that supports those claims (Hansen & Mislevy, 2008; Mislevy &
Haertel, 2006). The second is by distinguishing the activities and structures involved in the
assessment enterprise in order to exemplify an assessment argument in operational processes. By
making the underlying evidentiary argument more explicit, the framework makes operational
elements more amenable to examination, sharing, and refinement. Making the argument more
explicit also helps designers meet diverse assessment needs caused by changing technological,
social, and legal environments (Hansen & Mislevy, 2008; Zhang, Haertel, Javitz, Mislevy, Murray, &
Wasson, 2009). The ECD process entails five types of activities. The layers focus in turn on the
identification of the substantive domain to be assessed; the assessment argument; the structure of
assessment elements such as tasks, rubrics, and psychometric models; the implementation of these
elements; and the way they function in an operational assessment, as described below. For Smarter
Balanced, a subset of the general ECD elements was used.
• Domain Analysis. In this first layer, domain analysis involves determining the specific content
to be included in the assessment. Smarter Balanced uses the Common Core State Standards
Smarter Balanced 2015–16 Summative Assessment Technical Report
Chapter 4: Test Design
4-5
as its content domain for mathematics and ELA/literacy. Domain analysis was conducted by
the developers of the CCSSs, who first developed college- and career-readiness standards, to
address what students are expected to know and be able to do by the time they graduate
from high school. This was followed by development of the K-12 standards, which address
expectations for students in elementary through high school.
• Domain Modeling. In domain modeling, a high-level description of the overall components of
the assessment is created and documented. For Smarter Balanced, the components
include computer-adaptive summative and interim assessments in mathematics and
ELA/literacy. The domain framework was developed by organizing the CCSS into domain
areas that form the structure of test blueprints and reporting categories. This overall
structure was created in the course of Smarter Balanced content specification development.
• The Conceptual Assessment Framework. Next, the conceptual assessment framework is
developed. For Smarter Balanced, this step was accomplished in developing the Smarter
Balanced content specifications, which identify major claim structure, targets within claims,
and the relationship of those elements to underlying content of the CCSS. In this step, the
knowledge, skills, and abilities to be assessed (i.e. intended constructs, targets of
assessment), the evidence that needs to be collected, and the features of the tasks that will
elicit the evidence are specified in detail. Ancillary constructs that may be required to
respond correctly to an assessment task but are not the intended target of the assessment
are also specified (e.g., reading skills in a mathematics examination). By identifying any
ancillary knowledge, skills, and abilities (KSAs), construct-irrelevant variance can be
identified a priori and minimized during item and task development—potential barriers
created by the ancillary KSAs can be removed or their effects minimized through the
provision of appropriate access features. The item and task specifications describe the
evidence required to support claims about the assessment targets and also identify any
ancillary constructs.
• Implementation. This layer involves the development of the assessment items or tasks using
the specifications created in the conceptual assessment framework just described. In
addition, scoring rubrics are created and the scoring process is specified. Smarter Balanced
items, performance tasks, and associated scoring rubrics were developed starting in the
spring of 2012.
• Delivery. In this final layer, the processes for the assessment administration and reporting
are created. The delivery system describes the adaptive algorithm, collection of student
evidence, task assembly, and presentation models required for the assessment and how
they function together. The ECD elements chosen lead to the best evaluation of the construct
for the intended test purposes. Test delivery and test scoring are discussed below.
Test Blueprints
Test specifications and blueprints define the knowledge, skills, and abilities intended to be
measured on each student’s test event. A blueprint also specifies how skills are sampled from a set
of content standards (i.e., the CCSS). Other important factors such as Depth of Knowledge (DOK) are
Smarter Balanced 2015–16 Summative Assessment Technical Report
Chapter 4: Test Design
4-6
also specified. Specifically, a test blueprint is a formal document that guides the development and
assembly of an assessment by explicating the following types of essential information:
• content (claims and assessment targets) that is included for each assessed subject and
grade, across various levels of the system (student, classroom, school, district, state);
• the relative emphasis or weighting of different content strata (e.g., claims) if there is any
weighting beyond the proportions of items and points;
• the relative emphasis of content standards generally indicated as the number of items or
percentage of points per claim and assessment target;
• item types used or required, which communicate to item developers how to measure each
claim and assessment target, and to teachers and students about learning expectations; and
• Depth of Knowledge (DOK), indicating the complexity of item types for each claim and
assessment target.
The test blueprint is an essential guide for both assessment developers and for curriculum and
instruction. For assessment developers, the blueprint and related test-specification documents
define how the test will ensure coverage of the full breadth and depth of content and how it will
maintain fidelity to the intent of the CCSS on which the Smarter Balanced assessment is based. Full
content alignment is necessary in order to ensure that educational stakeholders can make valid,
reliable, and unbiased inferences about student, classroom, school, and state performance. At the
instructional level, the test blueprint provides a guide to the relative importance of competing
content demands and suggests how the content is demonstrated, as indicated by item type and
depth-of-knowledge. In summary, an assessment blueprint provides clear development
specifications for test developers and signals to the broader education community both the full
complexity of the CCSS and how performance on these standards are substantiated.
Part of the innovative aspect of the Smarter Balanced assessments is that the test blueprints
sample the content domain using both a computer adaptive component (CAT) and a performance
task (PT). The test blueprints can be inspected to determine the contribution of the CAT and PT
components in a grade and content area toward the construct intended to be measured. Another
aspect of the assessments is the provision of a variety of both machine-scored and human-scored
item types. The contribution of these item types is specified in the Smarter Balanced test blueprints.
In February 2015, the Governing Members of the Smarter Balanced Assessment Consortium
adopted blueprints for the summative assessments of mathematics and ELA/literacy for grades 3 to
8 and high school. These were fully implemented in the 2014-15 school year. The complete
blueprints details for each grade and content area (Smarter Balanced, 2015a; Smarter Balanced,
2015b).
The summative assessment is composed of the CAT and PT components. Responses from both
components are combined to cover the test blueprint in a grade and content area and are used to
produce the overall and claim scale scores. Figure 4-2 is a conceptual diagram of how claims are
distributed across the adaptive and performance task parts of the tests.
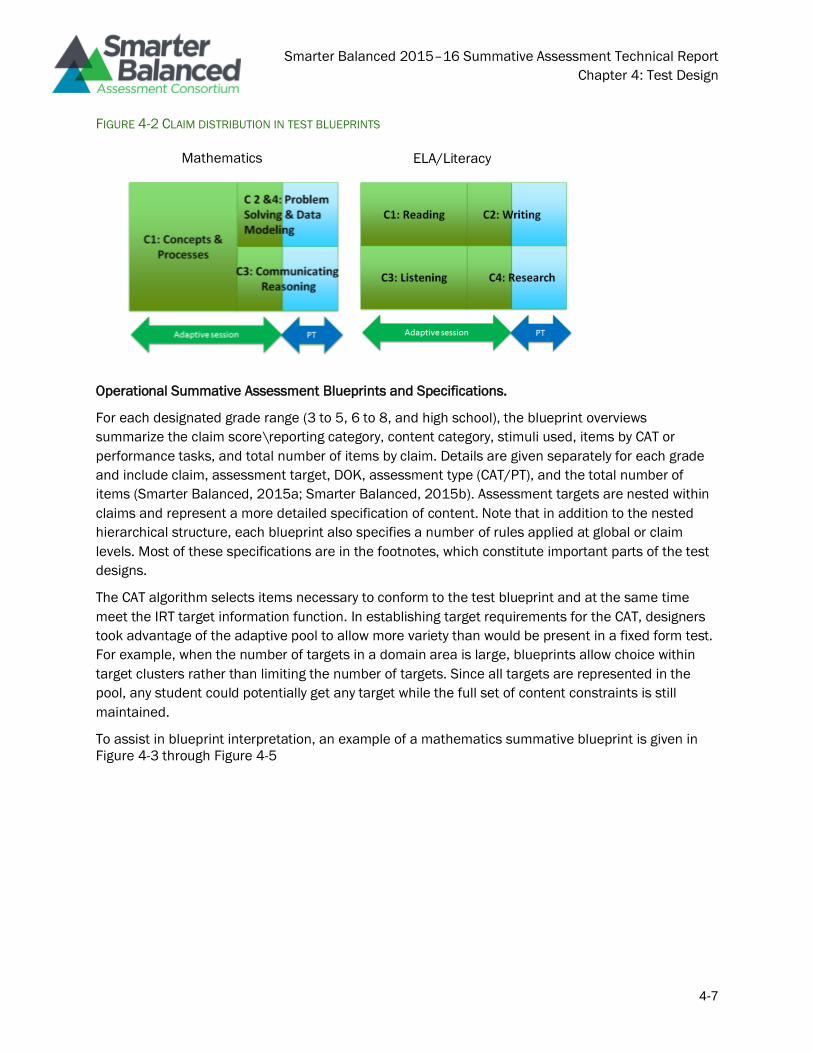
Smarter Balanced 2015–16 Summative Assessment Technical Report
Chapter 4: Test Design
4-7
FIGURE 4-2 CLAIM DISTRIBUTION IN TEST BLUEPRINTS
Operational Summative Assessment Blueprints and Specifications.
For each designated grade range (3 to 5, 6 to 8, and high school), the blueprint overviews
summarize the claim score\reporting category, content category, stimuli used, items by CAT or
performance tasks, and total number of items by claim. Details are given separately for each grade
and include claim, assessment target, DOK, assessment type (CAT/PT), and the total number of
items (Smarter Balanced, 2015a; Smarter Balanced, 2015b). Assessment targets are nested within
claims and represent a more detailed specification of content. Note that in addition to the nested
hierarchical structure, each blueprint also specifies a number of rules applied at global or claim
levels. Most of these specifications are in the footnotes, which constitute important parts of the test
designs.
The CAT algorithm selects items necessary to conform to the test blueprint and at the same time
meet the IRT target information function. In establishing target requirements for the CAT, designers
took advantage of the adaptive pool to allow more variety than would be present in a fixed form test.
For example, when the number of targets in a domain area is large, blueprints allow choice within
target clusters rather than limiting the number of targets. Since all targets are represented in the
pool, any student could potentially get any target while the full set of content constraints is still
maintained.
To assist in blueprint interpretation, an example of a mathematics summative blueprint is given in
Figure 4-3 through Figure 4-5
Mathematics ELA/Literacy
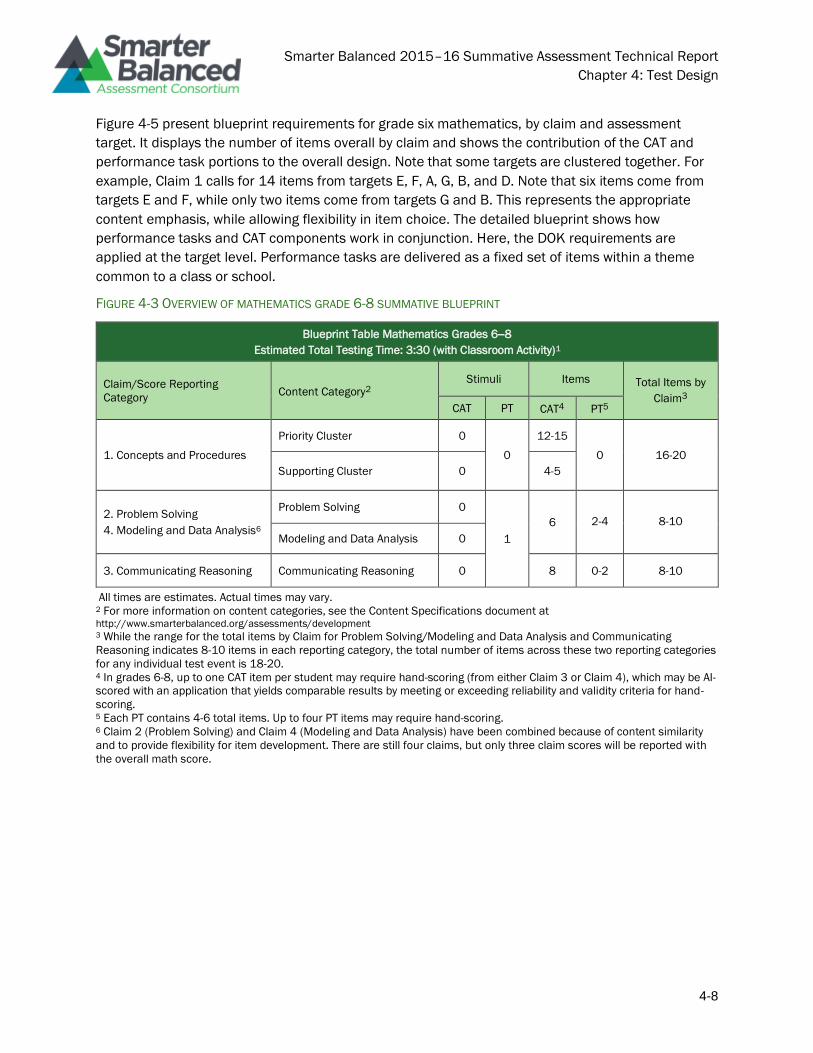
Smarter Balanced 2015–16 Summative Assessment Technical Report
Chapter 4: Test Design
4-8
Figure 4-5 present blueprint requirements for grade six mathematics, by claim and assessment
target. It displays the number of items overall by claim and shows the contribution of the CAT and
performance task portions to the overall design. Note that some targets are clustered together. For
example, Claim 1 calls for 14 items from targets E, F, A, G, B, and D. Note that six items come from
targets E and F, while only two items come from targets G and B. This represents the appropriate
content emphasis, while allowing flexibility in item choice. The detailed blueprint shows how
performance tasks and CAT components work in conjunction. Here, the DOK requirements are
applied at the target level. Performance tasks are delivered as a fixed set of items within a theme
common to a class or school.
FIGURE 4-3 OVERVIEW OF MATHEMATICS GRADE 6-8 SUMMATIVE BLUEPRINT
Blueprint Table Mathematics Grades 6–8
Estimated Total Testing Time: 3:30 (with Classroom Activity)1
Claim/Score Reporting
Category Content Category2
Stimuli Items Total Items by
Claim3
CAT PT CAT4 PT5
1. Concepts and Procedures
Priority Cluster 0
0
12-15
0 16-20
Supporting Cluster 0 4-5
2. Problem Solving
4. Modeling and Data Analysis6
Problem Solving 0
1
6 2-4 8-10
Modeling and Data Analysis 0
3. Communicating Reasoning Communicating Reasoning 0 8 0-2 8-10
All times are estimates. Actual times may vary. 2 For more information on content categories, see the Content Specifications document at http://www.smarterbalanced.org/assessments/development 3 While the range for the total items by Claim for Problem Solving/Modeling and Data Analysis and Communicating
Reasoning indicates 8-10 items in each reporting category, the total number of items across these two reporting categories
for any individual test event is 18-20. 4 In grades 6-8, up to one CAT item per student may require hand-scoring (from either Claim 3 or Claim 4), which may be AI-
scored with an application that yields comparable results by meeting or exceeding reliability and validity criteria for hand-
scoring. 5 Each PT contains 4-6 total items. Up to four PT items may require hand-scoring. 6 Claim 2 (Problem Solving) and Claim 4 (Modeling and Data Analysis) have been combined because of content similarity
and to provide flexibility for item development. There are still four claims, but only three claim scores will be reported with
the overall math score.
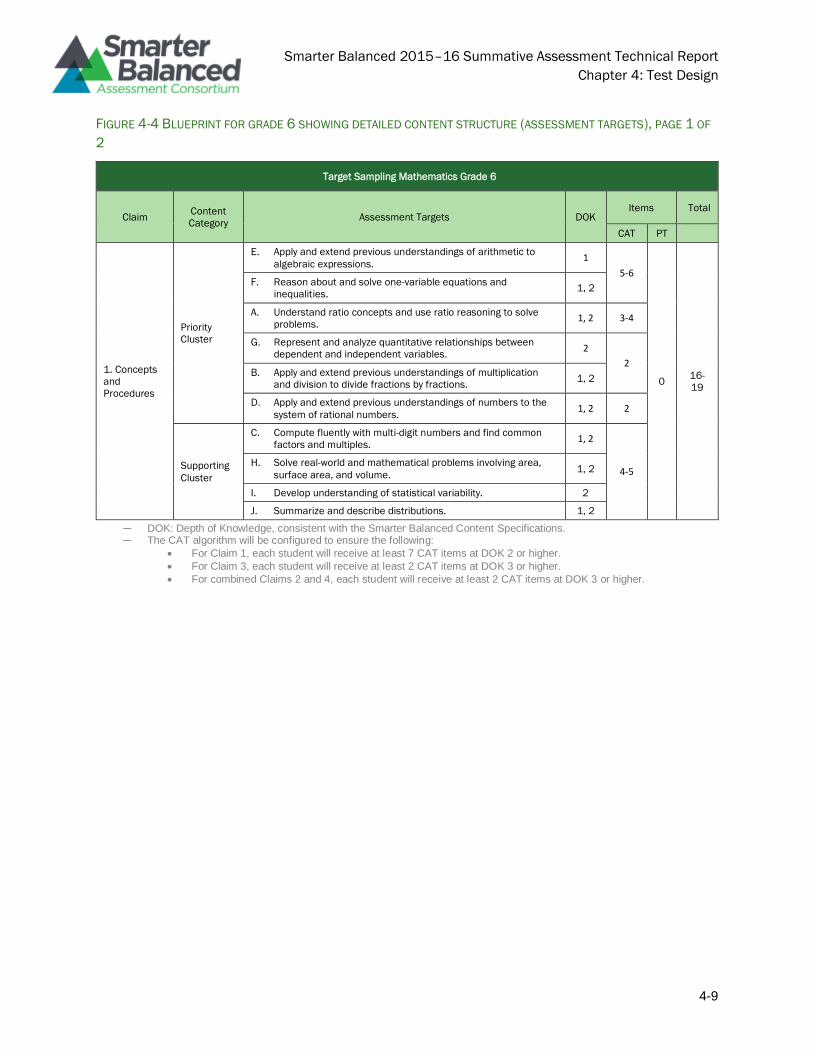
Smarter Balanced 2015–16 Summative Assessment Technical Report
Chapter 4: Test Design
4-9
FIGURE 4-4 BLUEPRINT FOR GRADE 6 SHOWING DETAILED CONTENT STRUCTURE (ASSESSMENT TARGETS), PAGE 1 OF
2
Target Sampling Mathematics Grade 6
Claim Content
Category Assessment Targets DOK
Items Total
CAT PT
1. Concepts
and
Procedures
Priority
Cluster
E. Apply and extend previous understandings of arithmetic to
algebraic expressions. 1
5-6
0 16-
19
F. Reason about and solve one-variable equations and
inequalities. 1, 2
A. Understand ratio concepts and use ratio reasoning to solve
problems. 1, 2 3-4
G. Represent and analyze quantitative relationships between
dependent and independent variables. 2
2 B. Apply and extend previous understandings of multiplication
and division to divide fractions by fractions. 1, 2
D. Apply and extend previous understandings of numbers to the
system of rational numbers. 1, 2 2
Supporting
Cluster
C. Compute fluently with multi-digit numbers and find common
factors and multiples. 1, 2
4-5 H. Solve real-world and mathematical problems involving area,
surface area, and volume. 1, 2
I. Develop understanding of statistical variability. 2
J. Summarize and describe distributions. 1, 2
─ DOK: Depth of Knowledge, consistent with the Smarter Balanced Content Specifications. ─ The CAT algorithm will be configured to ensure the following:
• For Claim 1, each student will receive at least 7 CAT items at DOK 2 or higher.
• For Claim 3, each student will receive at least 2 CAT items at DOK 3 or higher.
• For combined Claims 2 and 4, each student will receive at least 2 CAT items at DOK 3 or higher.
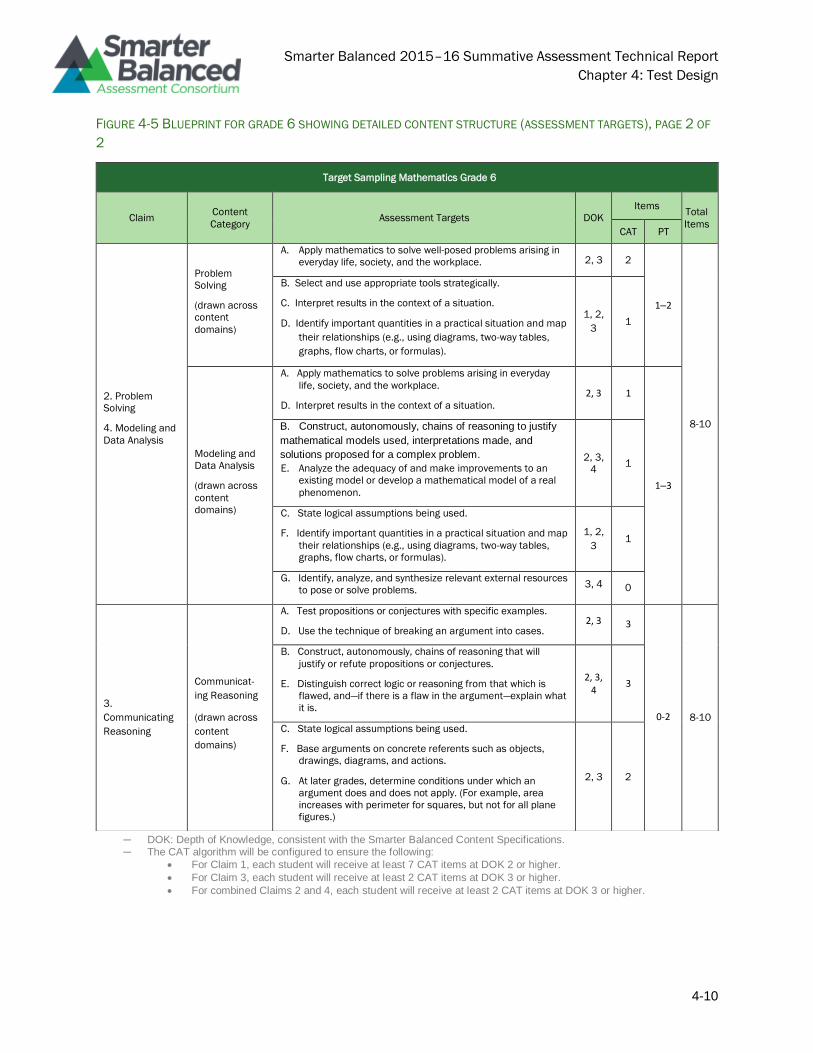
Smarter Balanced 2015–16 Summative Assessment Technical Report
Chapter 4: Test Design
4-10
FIGURE 4-5 BLUEPRINT FOR GRADE 6 SHOWING DETAILED CONTENT STRUCTURE (ASSESSMENT TARGETS), PAGE 2 OF
2
─ DOK: Depth of Knowledge, consistent with the Smarter Balanced Content Specifications. ─ The CAT algorithm will be configured to ensure the following:
• For Claim 1, each student will receive at least 7 CAT items at DOK 2 or higher.
• For Claim 3, each student will receive at least 2 CAT items at DOK 3 or higher.
• For combined Claims 2 and 4, each student will receive at least 2 CAT items at DOK 3 or higher.
Target Sampling Mathematics Grade 6
Claim Content
Category Assessment Targets DOK
Items Total
Items CAT PT
2. Problem
Solving
4. Modeling and
Data Analysis
Problem
Solving
(drawn across
content
domains)
A. Apply mathematics to solve well-posed problems arising in
everyday life, society, and the workplace. 2, 3 2
1–2
8-10
B. Select and use appropriate tools strategically.
C. Interpret results in the context of a situation.
D. Identify important quantities in a practical situation and map
their relationships (e.g., using diagrams, two-way tables,
graphs, flow charts, or formulas).
1, 2,
3 1
Modeling and
Data Analysis
(drawn across
content
domains)
A. Apply mathematics to solve problems arising in everyday
life, society, and the workplace.
D. Interpret results in the context of a situation.
2, 3 1
1–3
B. Construct, autonomously, chains of reasoning to justify
mathematical models used, interpretations made, and
solutions proposed for a complex problem.
E. Analyze the adequacy of and make improvements to an
existing model or develop a mathematical model of a real
phenomenon.
2, 3,
4 1
C. State logical assumptions being used.
F. Identify important quantities in a practical situation and map
their relationships (e.g., using diagrams, two-way tables,
graphs, flow charts, or formulas).
1, 2,
3 1
G. Identify, analyze, and synthesize relevant external resources
to pose or solve problems. 3, 4 0
3.
Communicating
Reasoning
Communicat-
ing Reasoning
(drawn across
content
domains)
A. Test propositions or conjectures with specific examples.
D. Use the technique of breaking an argument into cases. 2, 3 3
0-2 8-10
B. Construct, autonomously, chains of reasoning that will
justify or refute propositions or conjectures.
E. Distinguish correct logic or reasoning from that which is
flawed, and—if there is a flaw in the argument—explain what
it is.
2, 3, 4
3
C. State logical assumptions being used.
F. Base arguments on concrete referents such as objects,
drawings, diagrams, and actions.
G. At later grades, determine conditions under which an
argument does and does not apply. (For example, area
increases with perimeter for squares, but not for all plane
figures.)
2, 3 2
Smarter Balanced 2015–16 Summative Assessment Technical Report
Chapter 4: Test Design
4-11
CAT and Performance Task Test Components
Part of the Smarter Balanced Theory of Action is to leverage appropriate technology and innovation.
The use of CAT methodologies helps ensure that students across the range of proficiency have an
assessment experience with items well targeted to their skill level. Adaptive testing allows average-,
very low-, and very high-performing students to stay engaged in the assessment because they
respond to items specifically targeted to their skill level. Non-adaptive performance tasks measure a
student’s ability to integrate knowledge and skills across multiple standards. No order is imposed on
the components; either the CAT or PT portion can be administered to students first.
CAT tests are more efficient in that they provide a higher level of score precision than fixed form tests
with the same number of items. For the CAT component, there are both content constraints (e.g., a
long reading passage in ELA/literacy must be administered) as well as psychometric criteria that
must be optimized for each student. Performance tasks are intended to measure multiple standards
in a coherent task that requires use of integrated skill sets. Performance tasks measure capacities
such as essay writing, research skills, and complex analysis, which are not as easy to assess with
individual, discrete items. Several performance tasks are associated with a common theme. A theme
is assigned to school for each grade and the performance tasks within the theme are randomly
distributed within the grade.
Adaptive Test Design and Algorithm Overview
Automated test assembly for a CAT depends on a number of factors to produce optimal tests. These
depend on the quality of the item bank, reasonableness of the test constraints and precision targets,
and the degree to which content or other qualitative attributes of items are salient and can be
defined as constraints.
For the operational test, an item-level, fully adaptive test component was administered in
ELA/literacy and mathematics. The adaptive part delivers blueprints in a manner that efficiently
minimizes measurement error and maximizes information. Smarter Balanced provides a specific CAT
delivery engine, but states may choose to use other engines as long as they can deliver a conforming
test blueprint with a minimum degree of error, avoid item over- or under-exposure, and provide the
design features specified by Smarter Balanced. This section outlines some of the design features for
the operational adaptive test component.
Early in the development process, Consortium members determined that students should be allowed
to go back to earlier questions, review their answers and revise their answers if necessary. This has
implications for test design and delivery. If a student takes a test over the course of two or more
days, answers from previous days cannot be changed. In mathematics, some items permit the use of
a calculator, while others forbid calculator use. Mathematics tests are consequently divided into two
sections, one for non-calculator items, and one that permits calculator use. Students can change
answers within sections but not across different test sections.
This section describes the adaptive algorithm design for the Smarter Balanced Test Delivery System.
To assert the administration of comparable tests, members must adopt an algorithm that delivers
the published blueprint. Three potential scenarios through which this could be accomplished are
listed below:
Smarter Balanced 2015–16 Summative Assessment Technical Report
Chapter 4: Test Design
4-12
• Members may deliver Smarter Balanced assessments using the open source software for
both the test delivery system and adaptive algorithm.
• Members may use the open source software for one component and a service provider
solution for the other (e.g., open source test delivery system, and a vendor’s algorithm that
can be appropriately configured).
• Members may use service provider solutions for both components, provided that in concert,
they can deliver the published blueprint as expected.
This section describes the method used in the Smarter Balanced system to satisfy the blueprint and
provide optimal precision. The implementation described here is released under the Creative
Commons Attribution Only, No Derivatives license. This document is a summary with supplemental
explanations and examples of explicit functionality found in the separate, Smarter Balanced
Adaptive Item Selection Algorithm Design Report by Jon Cohen and Larry Albright (2014). Interested
readers can refer to the more detailed document for more technical information and specific
formulas the algorithm employs.
In general, an adaptive algorithm is the method used to carry out a blueprint design by acting on an
item pool. The algorithm finds the items expected to compose the best test for each student,
selecting items from the pool that match blueprint demands while using information from a student’s
responses to find the most accurate score. The blueprint describes in detail the content and other
attributes for each student’s test. Both the algorithm and items in the pool must support blueprints
in order to deliver accurate, efficient tests.
Item attributes specified in blueprints and needed to run the algorithm include depth of knowledge,
response type, scoring type, common stimulus membership and mathematical domain. All items in
the bank must have complete information about these elements available to algorithm software.
The minimum and maximum number of items in each element is specified in the adaptive software,
serving as a constraint to balance aspects such as blueprint coverage with test length. Each element
can be given weights used in the selection process that affects test delivery. By allowing for the
specification of weights, the general algorithm can be customized for varying conditions of
population and pool distribution. This function can help assure that a test best matches the purpose
for which it is designed. For example, weights can be shifted to emphasize measurement precision or
content coverage, depending on policy priorities. Final weights were established during the last
stages of test design when all item parameters were known and simulation results were available.
Item measurement data: In addition to the blueprint attributes listed above, each item has a set of
parameters that provide measurement information. The purpose of the algorithm is to satisfy the
content blueprint while providing the most accurate student score, in the most efficient manner. In
measurement terms, the most information is obtained when the difficulty of the item is close to the
functional level of the student. At the beginning of the test, item difficulty and discriminating power
are known, and student ability is unknown. The job of the algorithm is to find out the student’s ability
in the content area being assessed.
Smarter Balanced 2015–16 Summative Assessment Technical Report
Chapter 4: Test Design
4-13
Test Operation Walkthrough
Preparation: The system must have in place a sufficient item pool with the full set of parameters and
metadata. Smarter pools contain all items for the intended grade level and items from adjacent
grades that address on-grade content. Items from upper grades address content the student has
had an opportunity to learn. Items from lower grades are screened for age-appropriateness. Initially,
the pool is filtered to include only items that were assigned to the examinee’s grade. Under certain
circumstances (described below) the filter is dropped and items assigned to an adjacent grade
(higher or lower, depending on the student’s performance) are added if the content they represent is
also appropriate for the examinee’s grade. The adaptive engine needs to be populated with all
hierarchical and content elements, including the minimum and maximum number of items allowed
for each facet of the blueprint.
Initialization. Adaptive tests require methods for avoiding overuse of items. In the 2014-15
summative tests, the algorithm was configured to choose each test’s initial item randomly from the
pool. The initial claim is chosen at random as long as passages and hand-scored items are not
presented first. The algorithm then cycles through the claims.
Item selection. The initialization and selection processes control underuse and overuse of items, also
known as exposure control. Exposure control enhances item security, discouraging copying and
cheating by presenting a variety of items. It also leads to more efficient pool use, assuring that all
items developed to cover the content are used. Rather than choosing the single best item for
initialization and selection, which would cause some items to be used repeatedly and others rarely or
never, the algorithm selects randomly from targeted sets of items. To prevent overuse of highly
discriminating items, the discrimination (a) parameter is not taken into account in selection ranking.
The optimal size of the first content-based set and the subsequent subset, which takes information
into account, was determined through simulation with actual pool parameters.
Once the initial item response has been given, the selection process is launched and will be
repeated for every subsequent response. The software uses the set of weights described earlier to
determine a group of items with the best match to the blueprint, excluding items from target groups
that have reached the maximum number of items specified in the blueprint and items previously
seen by the examinee. When this mini pool (subset of items) has been chosen, information value is
calculated for each item using the current student ability estimate and known item parameters.
Overall item value is calculated using both information and content data. The item set is then sorted
according to overall value and a set of the most preferred items are identified. The item to be
administered is chosen randomly from within this set. After each response to a machine-scored
item, the student ability estimate is updated. The selection procedure is then repeated until the
blueprint has been satisfied. Students can go back and change their answers within a test segment.
When this occurs for machine-scored items, the ongoing student score estimate is updated with the
new response.
Note that blueprints call for the administration of human-scored items during the adaptive part of the
test. The blueprints specify that these items may be AI scored with an application that yields
comparable results by meeting or exceeding reliability and validity criteria for hand-scoring. These
Smarter Balanced 2015–16 Summative Assessment Technical Report
Chapter 4: Test Design
4-14
items are chosen based on their information value just like machine-scored items. However, the
adaptive engine is designed to work asynchronously from hand-scoring. Because the response to the
item is not immediately scored, the adaptive engine proceeds using the most recent estimate of
student ability and selects the next item accordingly.
The algorithm proceeds in this manner until a percentage of the test (coverage in mathematics, 61%;
ELA/literacy, 62%.) has been administered, sampling items from all claim areas. At this point the
distance of the estimated score from the college content readiness cut score is evaluated. This is
Level 3 as defined in the Smarter Balanced Achievement Level Setting Final Report (2015f), If there
is a determination that the student is in either Level 1 or Level 4 as defined by the Achievement
Level Setting Report, the item pool is expanded to include items from no more than two adjacent
grades in either direction. In grade 3, the expansion includes items from adjacent upper grades only;
in grade 11 only adjacent lower grades are included. Items from adjacent grades have been
screened for appropriateness by content experts to assure that they represent the content of the
target grade. For the remainder of the test, both on-grade and off-grade items can be administered.
The item with the best content and measurement characteristics is chosen from the pool. When a
determination of being in Level 1 or level 4 cannot be made, the test continues with on-grade items.
The algorithm delivers the remainder of the blueprint until termination.
Termination: The test ends when the blueprint has been met. At that point, student machine-scored
responses are retained.
Test Scoring: The method of combining item level scores to produce test scores and sub-scores is
presented in detail in the Smarter Balanced Scoring Specification document (AIR, 2014). Scores are
calculated using maximum likelihood estimation (MLE) applied at the overall and sub-score levels.
No special weights for claims, item types or performance tasks are applied. Desired domain
representations is achieved by content proportions in the blueprints.
Item and Task Development
In order to build a summative assessment that measured the intended claims, the Consortium’s test
development cycle was iterative, involving experts from various education-related fields, and was
based on assessment-related research and best practices.
Item and Task Specifications
The item and task specifications bridge the span from the content specifications and Achievement
Levels to the assessment itself. While the content specifications established the Consortium’s claims
and the types of evidence or targets, that would need to be collected in order to support these
claims, more specificity was needed in order to develop items and tasks that measured the claims.
The first iteration of the item and task specifications was developed in 2011. In early 2012, the
Consortium held a series of showcases where the contractors introduced the item and task
specifications and collected feedback from member states. Using this feedback, the item and tasks
specifications were revised during the first quarter of 2012.
Using the revised item and task specifications, a small set of items was developed and administered
in fall 2012 during a small-scale trial. This provided the Consortium with the first opportunity to
Smarter Balanced 2015–16 Summative Assessment Technical Report
Chapter 4: Test Design
4-15
administer and score the new item types. During the small-scale trials, the Consortium also
conducted cognitive laboratories to better understand how students respond to various types of
items (AIR, 2013). The cognitive laboratories used a think-aloud methodology in which students
speak their thoughts while working on a test item. The item and task specifications were again
revised based on the findings of the cognitive laboratories and the small-scale trial. These revised
specifications were used to develop items for the 2013 pilot test, and they were again revised based
on 2013 pilot test results and subsequent review by content experts.
The Smarter Balanced Item and Task Specifications (2015e) are designed to ensure that
assessment items measure the assessment’s claims. Indeed, the purpose of item and task
specifications is to define the characteristics of items and tasks that will provide evidence to support
one or more claims. To do this, the item and task specifications delineate types of evidence that
should be elicited for each claim within a grade level. Then, they provide explicit guidance on how to
write items in order to elicit the desired evidence.
Item and task specifications provide guidelines on how to create items specific to each claim and
assessment target through the use of task models. In mathematics a task model provides a
description of an item/task’s key features. These task models describe the knowledge, skills, and
processes being measured by each of the item types aligned to particular targets. In addition, task
models sometimes provide examples of plausible distractors. Exemplar items are provided within
every task model. In ELA/literacy these functions are carried out through item specifications.
Task models were developed for each grade level and target to delineate the expectations of
knowledge and skill to be included on test questions in each grade. In addition, both ELA/literacy
and mathematics item and stimulus specifications provide guidance about grade appropriateness of
task and stimulus materials (the materials that a student must refer to in working on a test
question). The task and stimulus models also provide information on characteristics of stimuli or
activities to avoid because they are not germane to the knowledge, skill, or process being measured.
This is important because it underscores the Consortium’s efforts to use universal design principles
to develop items that are accessible to the widest range of students possible. As the name
suggests, the concept of universal design aims to create items that accurately measure the
assessment target for all students. At the same time, universal design recognizes that one solution
rarely works for all students. Instead, this framework acknowledges “the need for alternatives to suit
many different people.” (Rose & Meyer, 2000, p. 4).
To facilitate the application of universal design principles, item writers are trained to consider the full
range of students who may answer a test question. A simple example of this is the use of vocabulary
that is expected to be known by all third-grade students versus only those third-grade students who
play basketball. Almost all third-grade students are familiar with activities (e.g., recess) that happen
during their school day, while only a subset of these students will be familiar with basketball terms
like “double dribble,” “layup,” “zone defense,” or “full-court press.”
Item specifications discuss accessibility issues unique to the creation of items for a particular claim
and/or assessment target. Accessibility issues concern supports that various groups of students may
need to access item content. By considering the supports that may be needed for each item, item
writers are able to create items that can be adapted to a variety of needs.
Smarter Balanced 2015–16 Summative Assessment Technical Report
Chapter 4: Test Design
4-16
The use of universal design principles allows the Consortium to collect evidence on the widest
possible range of students. By writing items that adhere to item and task specifications, the
Consortium is assured that assessments measure the claims and assessment targets established in
content specifications as well as the knowledge, skills, and processes found in the CCSS for all
students for whom the assessment is appropriate.
Performance Task Design
The Race to the Top Assessment Program Application for the Smarter Balanced Assessment
Consortium (2010) highlights the importance of performance tasks to “provide a measure of the
student’s ability to integrate knowledge and skills across multiple standards—a key component of
college and career readiness” (p. 42). The development of an assessment system that fulfills this
goal necessitates an understanding of how the world is changing and what skills are required to
compete in an increasingly global economy. Research suggests that measuring college and career
readiness will increasingly require the use of performance-based assessments (Fadel, Honey, &
Pasnik, 2007).
A key component of college and career readiness is the ability to integrate knowledge and skills
across multiple content standards. Smarter Balanced derives inferences concerning this ability
through performance tasks. Performance assessments are intended to represent students’
competence in applying the knowledge and cognitive skills needed to solve substantive, meaningful
problems. Performance assessments give students opportunities to demonstrate their ability to find,
organize, or use information to solve problems, undertake research, frame and conduct
investigations, analyze and synthesize data, and apply learning to novel situations.
A Smarter Balanced performance task involves interaction of students with stimulus materials
and/or engagement in a problem solution, ultimately leading to an exhibition of the students’
application of knowledge and skills. Stimuli include a variety of information forms (e.g., readings,
video clips, data), as well as an assignment or problem situation. As shown in the test blueprints,
performance tasks are an integral part of the Smarter Balanced test design. When a performance
task is assigned and given in its entirety, it fulfills a specific role in the test blueprint for a grade and
content area. Performance tasks are intended to challenge students in applying their knowledge and
skills to complex, contextually rich problems. These activities are meant to measure capacities such
as depth of understanding, writing or research skills, mathematical modeling and complex analysis.
They consist of collections of questions and activities coherently connected to a single scenario. The
performance tasks are administered online via computer (not computer adaptive) and require one to
two class periods to complete.
Performance tasks were constructed so they can be delivered effectively in the school/classroom
environment (Dana and Tippins, 1993). Requirements for task specifications included, but were not
limited to, pre-assessment classroom activities, materials and technology needs, and allotted time
for assessment. Performance tasks adhere to specifications used by item writers to develop new
tasks that focus on different content but are comparable in contribution to the blueprint.
All Smarter Balanced performance tasks consist of three basic components: stimulus presentation,
information processing, and scorable product(s) or performance(s). “Information processing” means
student interactions with the stimulus materials and their content. It could include note taking, data
Smarter Balanced 2015–16 Summative Assessment Technical Report
Chapter 4: Test Design
4-17
generation, and any other activities that increase students’ understanding of the stimulus content or
the assignment. All activities within a task must have a rationale for inclusion (e.g., to increase
understanding, for scaffolding, as early steps in product creation or for product creation).
In ELA/literacy, each performance task comprises a targeted research effort in which students read
sources and respond to two to three research items, followed by an essay. During the research
component, students may take notes to which they may later refer. Students then write a full essay
drawing from source material and research notes. Claim level results in writing and research are
based on both CAT and performance task item responses.
In mathematics, each performance task comprises a set of stimulus materials and a follow-up item
set consisting of six items in Claims 2, 3, and 4. These are combined with CAT items in Claims 2, 3
and 4 to satisfy the blueprint and create a Claim 3 score and a combined Claim 2 and 4 score.
Performance tasks address an integrated scenario in middle and high school and a common theme
in grades 3 to 5.
The Item/task Pool Specification
An item pool refers to a collection of test questions (known as items) that supports the test blueprint
for a particular content area and grade. The Consortium took multiple steps to ensure the quality of
the items in our item pool. Building on the ongoing process of developing item/task specifications
and test blueprints, the Consortium used an iterative process for creating and revising each item as
well as the collection of items. The Consortium tested items and refined its approach to item
development through three steps: small-scale tryouts, a large pilot test, and a large field test. Details
of the pilot and field tests are found in the Smarter Balanced 2013 - 2014 Technical Report (2016).
During each phase, the Consortium used cognitive laboratories to understand the strategies that
students used to respond to the items. By incorporating this tiered and iterative approach, the item
and task specifications that guided the development of the final operational pool were improved
based on lessons learned during tryouts.
Using test blueprints, measurement experts specified the number and distribution of items to be
written. Pools of items/tasks were written specifically to support proportions of items and intended
difficulty distribution in the operational blueprint. Teachers were integrally involved in the creation of
the item/task pool from beginning to end. Some participated in the processes described in the flow
charts that appear in the Appendix A. Others developed items through a rigorous item writing
process, and yet others reviewed the items for accuracy and appropriateness of the content
knowledge and skill level required to respond to the items. Teams of content experts reviewed items
for potential issues of bias in favor of or against any demographic group of students, and for
accessibility for students with disabilities and English language learners. Content, bias, and
accessibility reviews were conducted prior to administration to any students. Following pilot and field
test administrations, items were again reviewed if pilot or field test data indicated a potential
problem. Finally, teachers participated in range finding and scoring of constructed-response
items/tasks to ensure that the items/tasks could be properly scored given their scoring rubrics.
In this section, we will examine the primary role that educators played in creating the field-test item
pool by writing, reviewing, and scoring items. This section will end by examining the current
composition of the item pool.
Smarter Balanced 2015–16 Summative Assessment Technical Report
Chapter 4: Test Design
4-18
Item Writing
The Consortium worked with educators throughout the test development cycle to develop items.
Prior to the spring 2013 pilot test, the Consortium engaged 136 educators in K-12 and higher
education from 19 member states to write items. Prior to the spring 2014 field test, 184 educators
in K-12 and higher education from 16 member states participated in item writing. All K-12
participants:
• Were certified/licensed to teach ELA/literacy and/or mathematics in a K-12 public school;
• Were currently teaching in a public school within a Smarter Balanced Governing State;
• Had taught ELA/literacy and/or mathematics in grades 3 through 8 and/or high school within
the past three years (second-grade teachers were also recruited to participate in the
development of grade 3 items and/or tasks);
• Had previously reviewed part or all of the CCSS for the content area for which they were
writing items and/or performance tasks;
• Submitted a statement of interest that described their interest in developing Smarter
Balanced items and/or performance tasks as well as their qualifications for doing so;
• Completed training and achieved qualifications through the certification process.
Qualifications for Higher Education Faculty included:
• Current employment with, or recent retirement from, a college or university located within a
Smarter Balanced Member State;
• Having taught developmental and/or entry-level courses in English, composition,
mathematics, statistics or a related discipline within the last 3 years;
• Having previously reviewed part or all of the CCSS for the content area in which they are
interested in writing items and/or performance tasks;
• Completing training and achieving qualifications through the certification process.
The selected educators were trained on the Consortium’s content specifications, the item and task
specifications, and ELA/literacy stimulus specifications, as well as the item authoring system in
which the items were developed. In addition, professional item writers and the Consortium held
regular meetings to provide direction and feedback to the educators. Educators, state partners, and
assessment vendors developed the items in the Consortium’s item pool.
Training
Educators participated in a series of facilitated, online webinars in order to qualify as item writers. To
facilitate participation, the Consortium scheduled multiple sessions in different time zones, including
evening sessions. In addition to the facilitated sessions, the Consortium provided training modules
that covered background on the Consortium, assessment design principles, and detailed information
about item and performance task development. All modules were available in three formats: a
Smarter Balanced 2015–16 Summative Assessment Technical Report
Chapter 4: Test Design
4-19
PowerPoint presentation with notes, a streaming presentation with narration that could be viewed
online, and a downloadable audio/video presentation.
The item writers were specifically trained on the Consortium’s content and item specifications,
stimulus specifications, sensitivity and bias guidelines, and general accessibility guidelines. Training
on these specifications and guidelines helped ensure that item writers were trained to write items
that allowed the widest possible range of students to demonstrate their knowledge, skills, and
cognitive processes with regard to the content. This meant that item writers needed to understand
the content for which they were writing items as well as accessibility and sensitivity issues that might
hinder students’ ability to answer an item. Item writers were also trained to be aware of issues that
might unintentionally bias an item for or against a particular group.
Educator Participation
Consistent with the Consortium process, educators were the primary developers of items. The active
involvement of educators was critical to the success of the item writing activities. Educators engage
with students on a daily basis, and they understand the ways in which students can demonstrate
their knowledge. Their involvement in item writing helped ensure that the assessment system is
accurate and efficient, and provides valid evidence of student learning.
State-Managed Item Development
The Consortium invited member states to participate in a separate effort to write items. This
voluntary effort, known as State-Managed Item Development, was conducted to build the capacity of
states to write items and to support the overall sustainability of the Consortium. To this end, six
states (HI, ID, MI, WA, WV, and WY) participated in the state-managed field test item development
opportunity. During this opportunity, educators within the six states developed approximately 3,100
items in mathematics and ELA/literacy across grades 3 through 8 and high school. These items were
not operational in the Smarter Balanced 2015 summative assessments but were included as
embedded field test items.
Item Reviews
Once items were written, groups of educators reviewed items prior to their pilot test administration in
spring 2013 and their field test administration in spring 2014. Items that met technical quality
criteria from the pilot test were again reviewed prior to their use in the spring 2014 field test.
Accessibility, Bias/Sensitivity, and Content Reviews
Panels of educators reviewed all items, performance tasks, and item stimuli for accessibility,
bias/sensitivity, and content. Item stimuli refer to the reading passages used on the ELA/literacy
assessments or the figures and graphics used on the mathematics assessments. Prior to the spring
2013 pilot test, 122 ELA/literacy educators and 106 mathematics educators reviewed items and
performance tasks for accessibility, bias/sensitivity, or content, and 60 educators reviewed the
ELA/literacy stimuli. Prior to the spring 2014 field test, 107 ELA/literacy educators and 157
mathematics educators from 14 states reviewed items and performance, and 95 educators from 13
states reviewed the ELA/literacy stimuli.
Smarter Balanced 2015–16 Summative Assessment Technical Report
Chapter 4: Test Design
4-20
The educator qualifications for the accessibility, bias/sensitivity, and content reviews were the same
as the educator qualifications for item writing except that participants were not required to submit a
statement of interest. In addition, it was preferred (but not required) that educators have previous
experience reviewing items, tasks, and/or stimuli.
During the accessibility reviews, panelists identified issues that may negatively affect a student’s
ability to access stimuli, items, or performance tasks, or to elicit valid evidence about an assessment
target. During the bias and sensitivity review, panelists identified content in stimuli, items, or
performance tasks that may negatively affect a student’s ability to produce a correct response
because of their background. The content review focused on developmental appropriateness and
alignment of stimuli, items, and performance tasks to the content specifications and appropriate
depths of knowledge. Panelists in the content review also checked the accuracy of the content,
answer keys, and scoring materials. Items flagged for accessibility, bias/sensitivity, and/or content
concerns were either revised to address the issues identified by the panelists or removed from the
item pool.
Details about the item development process in ELA/literacy and mathematics are found in Appendix
A. These are the steps each item goes through before it can be presented to students.
Field Testing
When all of the developmental reviews had been conducted, items that passed data review became
part of the 2014 Field Test. Details of the field test can be found in Chapters 7, 8 and 9 of the 2014
Technical Manual. Briefly, the field test was a comprehensive test that both established subject
matter scales and provided item statistics and parameters.
Item Scoring
For those items that could not be machine scored, the Consortium engaged 102 participants from
20 states in range finding activities for those items requiring human scoring following the spring
2013 pilot. After the spring 2014 field test, 104 educators participated in range finding. Range
finding improves the consistency and validity of scoring for the assessment. During range finding,
educators focused on the performance tasks for mathematics and ELA/literacy. The participants
reviewed student responses against item rubrics, validated the rubrics’ accuracy, and selected the
anchor papers that would be used by scorers during operational scoring of test items. In
mathematics, educators also reviewed constructed response items for grades 7, 8, and high school.
The educator qualifications for range finding were the same as the educator qualifications for item
writing, except that participants were not required to submit a statement of interest. In addition, it
was preferred (but not required) that educators had previous range finding experience.
To verify correct scoring for machine-scored items, a rubric validation activity was conducted. For
multiple choice items, this is a simple key check. For other item types, such as grid interaction items
(drag-and-drop), matching tables or equation entry, the procedure involves looking at a sample of
student raw responses (screen coordinates or keystrokes) and assuring that the raw response was
scored correctly. In the course of this process, reviewers may find unexpected responses that
require adjustment of the scoring procedure to account for a wider response range. Item scoring
software is then changed accordingly.
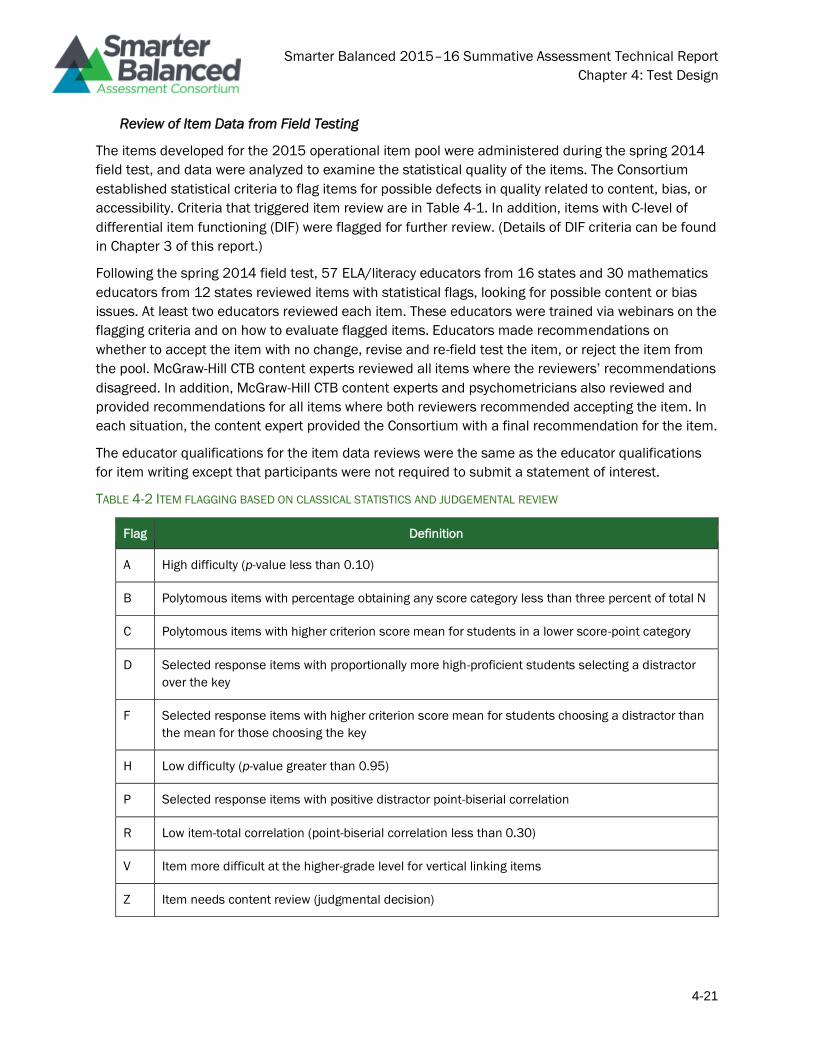
Smarter Balanced 2015–16 Summative Assessment Technical Report
Chapter 4: Test Design
4-21
Review of Item Data from Field Testing
The items developed for the 2015 operational item pool were administered during the spring 2014
field test, and data were analyzed to examine the statistical quality of the items. The Consortium
established statistical criteria to flag items for possible defects in quality related to content, bias, or
accessibility. Criteria that triggered item review are in Table 4-1. In addition, items with C-level of
differential item functioning (DIF) were flagged for further review. (Details of DIF criteria can be found
in Chapter 3 of this report.)
Following the spring 2014 field test, 57 ELA/literacy educators from 16 states and 30 mathematics
educators from 12 states reviewed items with statistical flags, looking for possible content or bias
issues. At least two educators reviewed each item. These educators were trained via webinars on the
flagging criteria and on how to evaluate flagged items. Educators made recommendations on
whether to accept the item with no change, revise and re-field test the item, or reject the item from
the pool. McGraw-Hill CTB content experts reviewed all items where the reviewers’ recommendations
disagreed. In addition, McGraw-Hill CTB content experts and psychometricians also reviewed and
provided recommendations for all items where both reviewers recommended accepting the item. In
each situation, the content expert provided the Consortium with a final recommendation for the item.
The educator qualifications for the item data reviews were the same as the educator qualifications
for item writing except that participants were not required to submit a statement of interest.
TABLE 4-2 ITEM FLAGGING BASED ON CLASSICAL STATISTICS AND JUDGEMENTAL REVIEW
Flag Definition
A High difficulty (p-value less than 0.10)
B Polytomous items with percentage obtaining any score category less than three percent of total N
C Polytomous items with higher criterion score mean for students in a lower score-point category
D Selected response items with proportionally more high-proficient students selecting a distractor
over the key
F Selected response items with higher criterion score mean for students choosing a distractor than
the mean for those choosing the key
H Low difficulty (p-value greater than 0.95)
P Selected response items with positive distractor point-biserial correlation
R Low item-total correlation (point-biserial correlation less than 0.30)
V Item more difficult at the higher-grade level for vertical linking items
Z Item needs content review (judgmental decision)
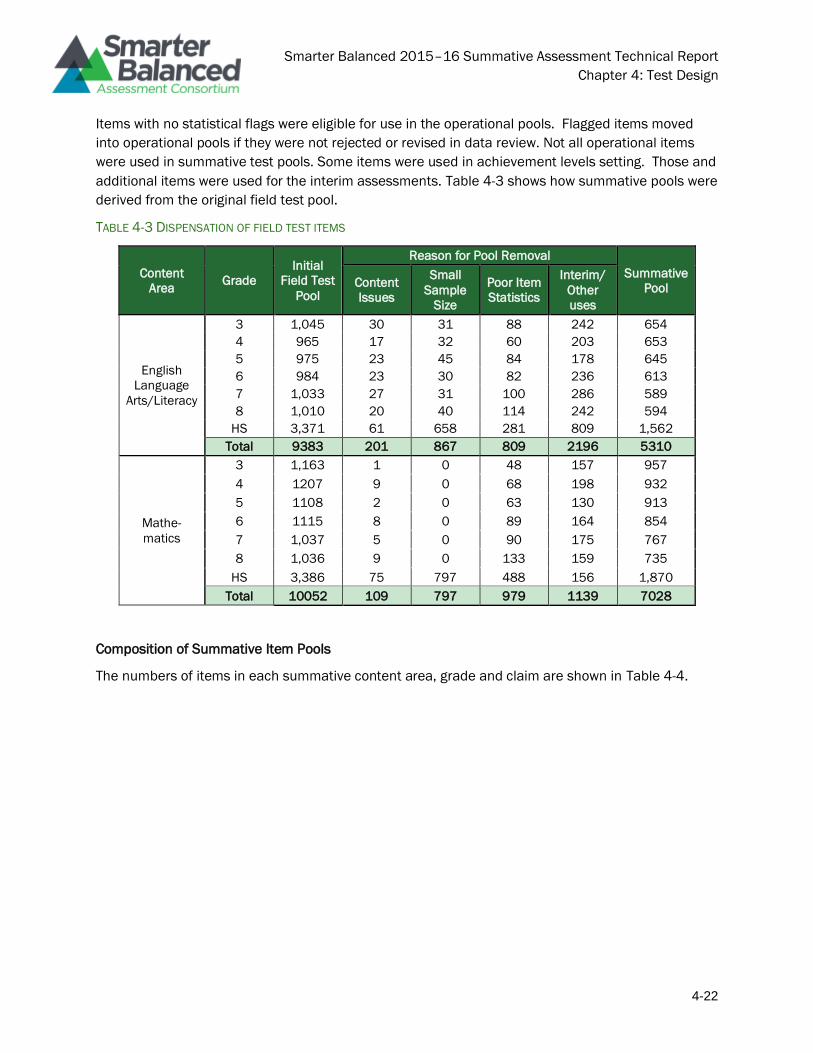
Smarter Balanced 2015–16 Summative Assessment Technical Report
Chapter 4: Test Design
4-22
Items with no statistical flags were eligible for use in the operational pools. Flagged items moved
into operational pools if they were not rejected or revised in data review. Not all operational items
were used in summative test pools. Some items were used in achievement levels setting. Those and
additional items were used for the interim assessments. Table 4-3 shows how summative pools were
derived from the original field test pool.
TABLE 4-3 DISPENSATION OF FIELD TEST ITEMS
Content
Area Grade
Initial
Field Test
Pool
Reason for Pool Removal
Summative
Pool Content
Issues
Small
Sample
Size
Poor Item
Statistics
Interim/
Other
uses
English
Language
Arts/Literacy
3 1,045 30 31 88 242 654
4 965 17 32 60 203 653
5 975 23 45 84 178 645
6 984 23 30 82 236 613
7 1,033 27 31 100 286 589
8 1,010 20 40 114 242 594
HS 3,371 61 658 281 809 1,562
Total 9383 201 867 809 2196 5310
Mathe-
matics
3 1,163 1 0 48 157 957
4 1207 9 0 68 198 932
5 1108 2 0 63 130 913
6 1115 8 0 89 164 854
7 1,037 5 0 90 175 767
8 1,036 9 0 133 159 735
HS 3,386 75 797 488 156 1,870
Total 10052 109 797 979 1139 7028
Composition of Summative Item Pools
The numbers of items in each summative content area, grade and claim are shown in Table 4-4.
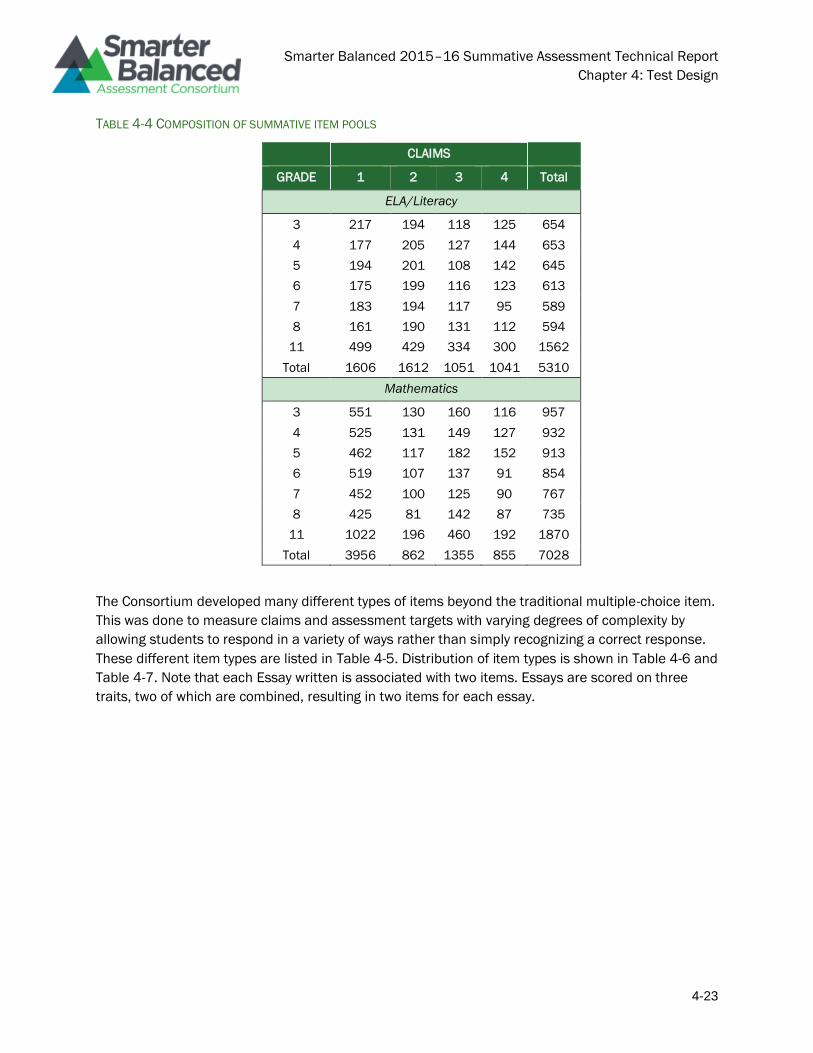
Smarter Balanced 2015–16 Summative Assessment Technical Report
Chapter 4: Test Design
4-23
TABLE 4-4 COMPOSITION OF SUMMATIVE ITEM POOLS
CLAIMS
GRADE 1 2 3 4 Total
ELA/Literacy
3 217 194 118 125 654
4 177 205 127 144 653
5 194 201 108 142 645
6 175 199 116 123 613
7 183 194 117 95 589
8 161 190 131 112 594
11 499 429 334 300 1562
Total 1606 1612 1051 1041 5310
Mathematics
3 551 130 160 116 957
4 525 131 149 127 932
5 462 117 182 152 913
6 519 107 137 91 854
7 452 100 125 90 767
8 425 81 142 87 735
11 1022 196 460 192 1870
Total 3956 862 1355 855 7028
The Consortium developed many different types of items beyond the traditional multiple-choice item.
This was done to measure claims and assessment targets with varying degrees of complexity by
allowing students to respond in a variety of ways rather than simply recognizing a correct response.
These different item types are listed in Table 4-5. Distribution of item types is shown in Table 4-6 and
Table 4-7. Note that each Essay written is associated with two items. Essays are scored on three
traits, two of which are combined, resulting in two items for each essay.
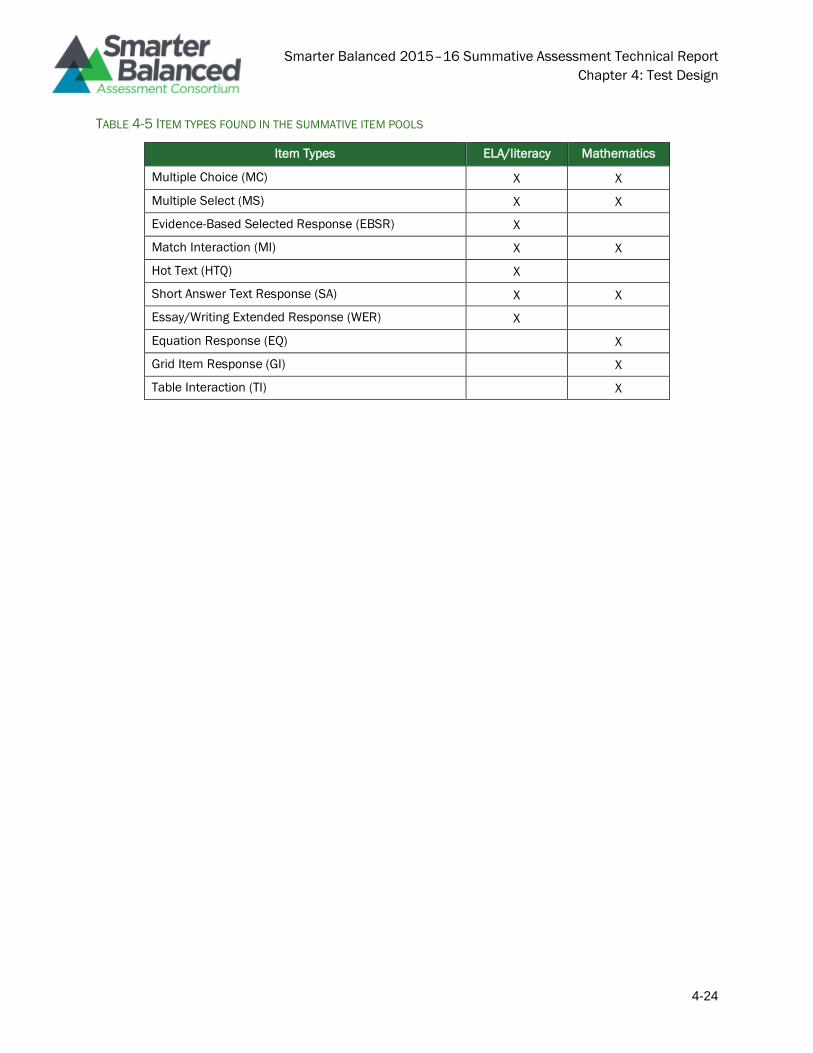
Smarter Balanced 2015–16 Summative Assessment Technical Report
Chapter 4: Test Design
4-24
TABLE 4-5 ITEM TYPES FOUND IN THE SUMMATIVE ITEM POOLS
Item Types ELA/literacy Mathematics
Multiple Choice (MC) X X
Multiple Select (MS) X X
Evidence-Based Selected Response (EBSR) X
Match Interaction (MI) X X
Hot Text (HTQ) X
Short Answer Text Response (SA) X X
Essay/Writing Extended Response (WER) X
Equation Response (EQ) X
Grid Item Response (GI) X
Table Interaction (TI) X
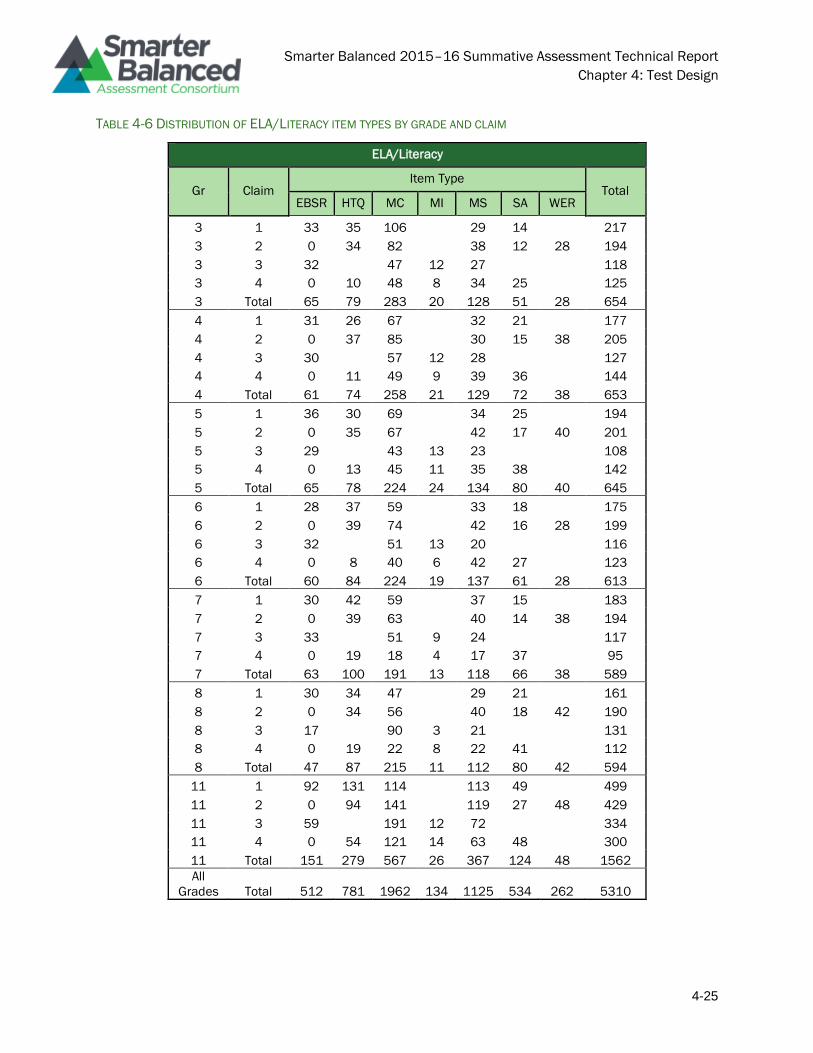
Smarter Balanced 2015–16 Summative Assessment Technical Report
Chapter 4: Test Design
4-25
TABLE 4-6 DISTRIBUTION OF ELA/LITERACY ITEM TYPES BY GRADE AND CLAIM
ELA/Literacy
Gr Claim Item Type
Total EBSR HTQ MC MI MS SA WER
3 1 33 35 106 29 14 217
3 2 0 34 82 38 12 28 194
3 3 32 47 12 27 118
3 4 0 10 48 8 34 25 125
3 Total 65 79 283 20 128 51 28 654
4 1 31 26 67 32 21 177
4 2 0 37 85 30 15 38 205
4 3 30 57 12 28 127
4 4 0 11 49 9 39 36 144
4 Total 61 74 258 21 129 72 38 653
5 1 36 30 69 34 25 194
5 2 0 35 67 42 17 40 201
5 3 29 43 13 23 108
5 4 0 13 45 11 35 38 142
5 Total 65 78 224 24 134 80 40 645
6 1 28 37 59 33 18 175
6 2 0 39 74 42 16 28 199
6 3 32 51 13 20 116
6 4 0 8 40 6 42 27 123
6 Total 60 84 224 19 137 61 28 613
7 1 30 42 59 37 15 183
7 2 0 39 63 40 14 38 194
7 3 33 51 9 24 117
7 4 0 19 18 4 17 37 95
7 Total 63 100 191 13 118 66 38 589
8 1 30 34 47 29 21 161
8 2 0 34 56 40 18 42 190
8 3 17 90 3 21 131
8 4 0 19 22 8 22 41 112
8 Total 47 87 215 11 112 80 42 594
11 1 92 131 114 113 49 499
11 2 0 94 141 119 27 48 429
11 3 59 191 12 72 334
11 4 0 54 121 14 63 48 300
11 Total 151 279 567 26 367 124 48 1562 All
Grades Total 512 781 1962 134 1125 534 262 5310
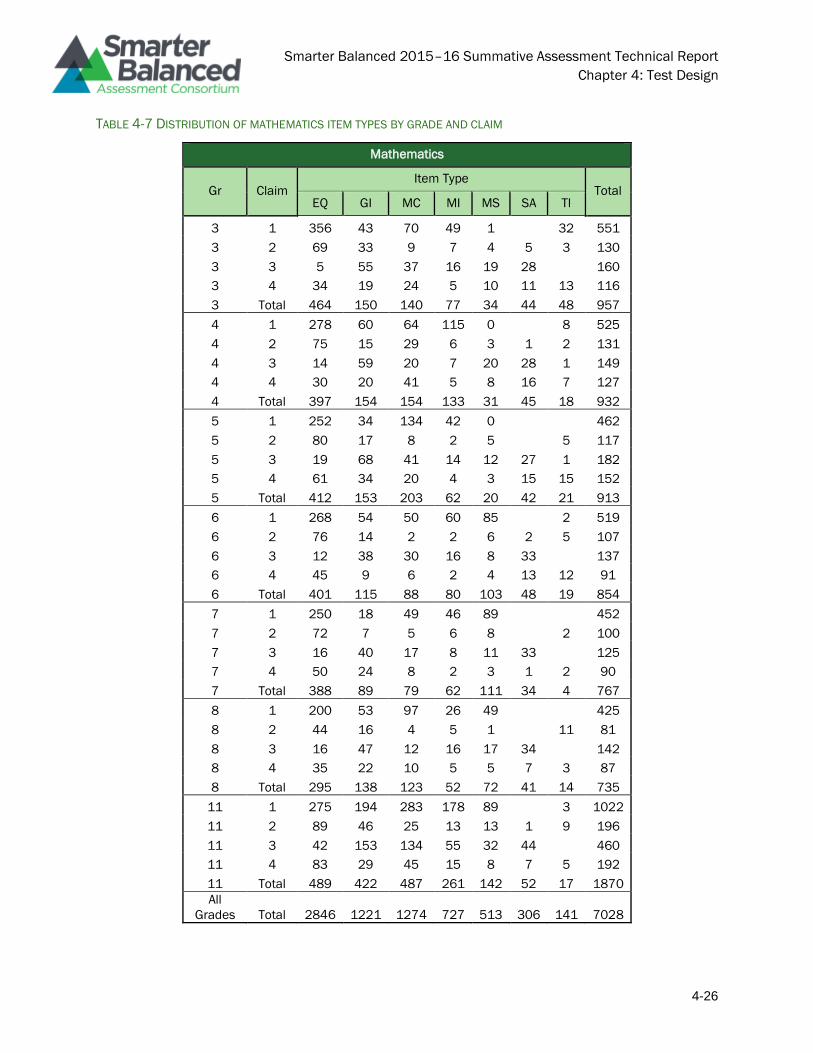
Smarter Balanced 2015–16 Summative Assessment Technical Report
Chapter 4: Test Design
4-26
TABLE 4-7 DISTRIBUTION OF MATHEMATICS ITEM TYPES BY GRADE AND CLAIM
Mathematics
Gr Claim Item Type
Total EQ GI MC MI MS SA TI
3 1 356 43 70 49 1 32 551
3 2 69 33 9 7 4 5 3 130
3 3 5 55 37 16 19 28 160
3 4 34 19 24 5 10 11 13 116
3 Total 464 150 140 77 34 44 48 957
4 1 278 60 64 115 0 8 525
4 2 75 15 29 6 3 1 2 131
4 3 14 59 20 7 20 28 1 149
4 4 30 20 41 5 8 16 7 127
4 Total 397 154 154 133 31 45 18 932
5 1 252 34 134 42 0 462
5 2 80 17 8 2 5 5 117
5 3 19 68 41 14 12 27 1 182
5 4 61 34 20 4 3 15 15 152
5 Total 412 153 203 62 20 42 21 913
6 1 268 54 50 60 85 2 519
6 2 76 14 2 2 6 2 5 107
6 3 12 38 30 16 8 33 137
6 4 45 9 6 2 4 13 12 91
6 Total 401 115 88 80 103 48 19 854
7 1 250 18 49 46 89 452
7 2 72 7 5 6 8 2 100
7 3 16 40 17 8 11 33 125
7 4 50 24 8 2 3 1 2 90
7 Total 388 89 79 62 111 34 4 767
8 1 200 53 97 26 49 425
8 2 44 16 4 5 1 11 81
8 3 16 47 12 16 17 34 142
8 4 35 22 10 5 5 7 3 87
8 Total 295 138 123 52 72 41 14 735
11 1 275 194 283 178 89 3 1022
11 2 89 46 25 13 13 1 9 196
11 3 42 153 134 55 32 44 460
11 4 83 29 45 15 8 7 5 192
11 Total 489 422 487 261 142 52 17 1870 All
Grades Total 2846 1221 1274 727 513 306 141 7028
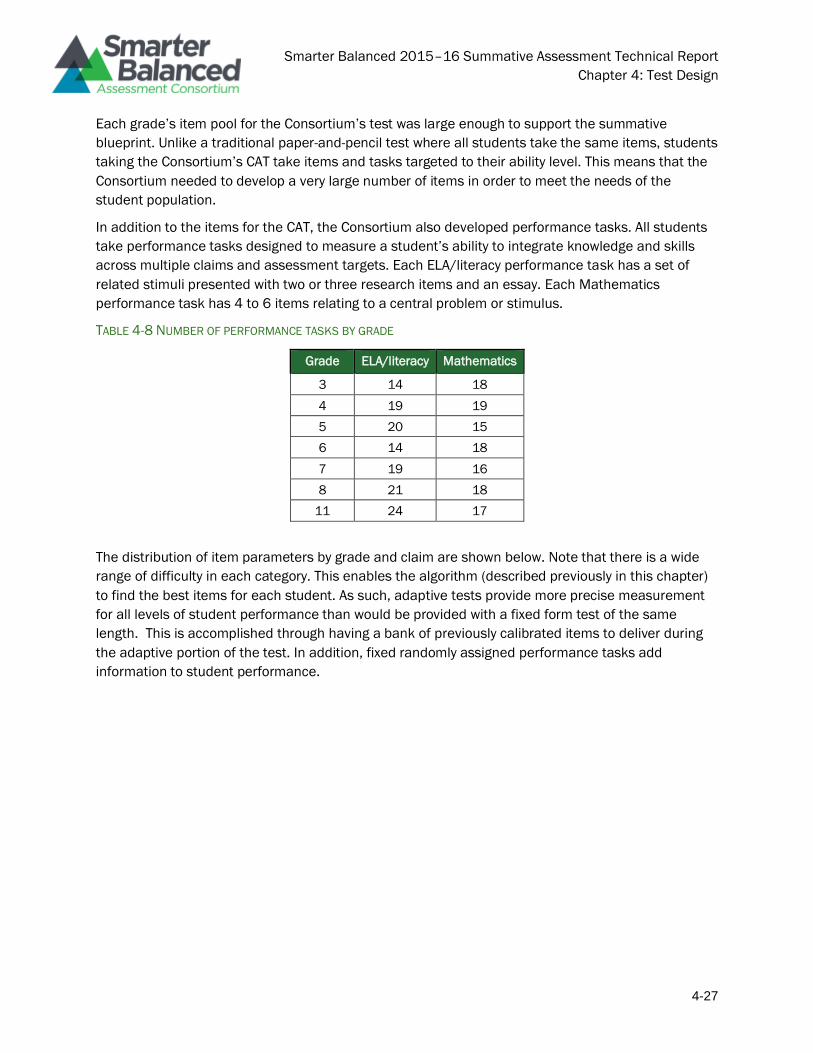
Smarter Balanced 2015–16 Summative Assessment Technical Report
Chapter 4: Test Design
4-27
Each grade’s item pool for the Consortium’s test was large enough to support the summative
blueprint. Unlike a traditional paper-and-pencil test where all students take the same items, students
taking the Consortium’s CAT take items and tasks targeted to their ability level. This means that the
Consortium needed to develop a very large number of items in order to meet the needs of the
student population.
In addition to the items for the CAT, the Consortium also developed performance tasks. All students
take performance tasks designed to measure a student’s ability to integrate knowledge and skills
across multiple claims and assessment targets. Each ELA/literacy performance task has a set of
related stimuli presented with two or three research items and an essay. Each Mathematics
performance task has 4 to 6 items relating to a central problem or stimulus.
TABLE 4-8 NUMBER OF PERFORMANCE TASKS BY GRADE
Grade ELA/literacy Mathematics
3 14 18
4 19 19
5 20 15
6 14 18
7 19 16
8 21 18
11 24 17
The distribution of item parameters by grade and claim are shown below. Note that there is a wide
range of difficulty in each category. This enables the algorithm (described previously in this chapter)
to find the best items for each student. As such, adaptive tests provide more precise measurement
for all levels of student performance than would be provided with a fixed form test of the same
length. This is accomplished through having a bank of previously calibrated items to deliver during
the adaptive portion of the test. In addition, fixed randomly assigned performance tasks add
information to student performance.
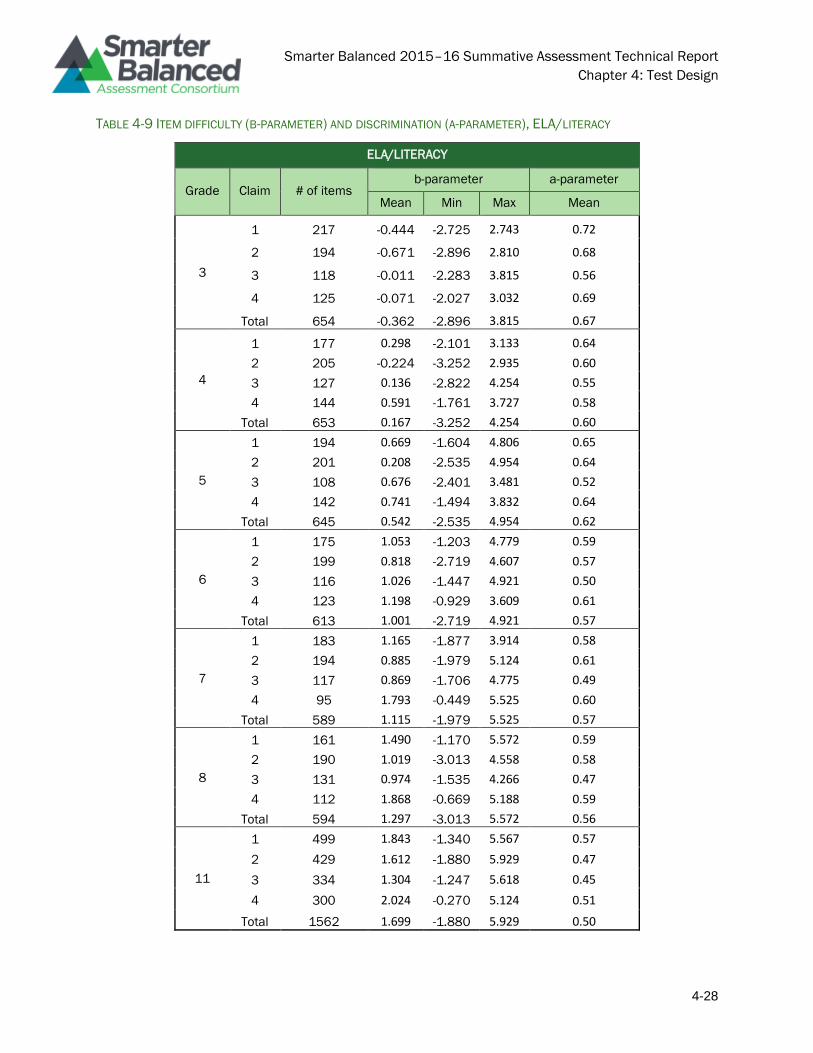
Smarter Balanced 2015–16 Summative Assessment Technical Report
Chapter 4: Test Design
4-28
TABLE 4-9 ITEM DIFFICULTY (B-PARAMETER) AND DISCRIMINATION (A-PARAMETER), ELA/LITERACY
ELA/LITERACY
Grade Claim # of items b-parameter a-parameter
Mean Min Max Mean
3
1 217 -0.444 -2.725 2.743 0.72
2 194 -0.671 -2.896 2.810 0.68
3 118 -0.011 -2.283 3.815 0.56
4 125 -0.071 -2.027 3.032 0.69
Total 654 -0.362 -2.896 3.815 0.67
4
1 177 0.298 -2.101 3.133 0.64
2 205 -0.224 -3.252 2.935 0.60
3 127 0.136 -2.822 4.254 0.55
4 144 0.591 -1.761 3.727 0.58
Total 653 0.167 -3.252 4.254 0.60
5
1 194 0.669 -1.604 4.806 0.65
2 201 0.208 -2.535 4.954 0.64
3 108 0.676 -2.401 3.481 0.52
4 142 0.741 -1.494 3.832 0.64
Total 645 0.542 -2.535 4.954 0.62
6
1 175 1.053 -1.203 4.779 0.59
2 199 0.818 -2.719 4.607 0.57
3 116 1.026 -1.447 4.921 0.50
4 123 1.198 -0.929 3.609 0.61
Total 613 1.001 -2.719 4.921 0.57
7
1 183 1.165 -1.877 3.914 0.58
2 194 0.885 -1.979 5.124 0.61
3 117 0.869 -1.706 4.775 0.49
4 95 1.793 -0.449 5.525 0.60
Total 589 1.115 -1.979 5.525 0.57
8
1 161 1.490 -1.170 5.572 0.59
2 190 1.019 -3.013 4.558 0.58
3 131 0.974 -1.535 4.266 0.47
4 112 1.868 -0.669 5.188 0.59
Total 594 1.297 -3.013 5.572 0.56
11
1 499 1.843 -1.340 5.567 0.57
2 429 1.612 -1.880 5.929 0.47
3 334 1.304 -1.247 5.618 0.45
4 300 2.024 -0.270 5.124 0.51
Total 1562 1.699 -1.880 5.929 0.50
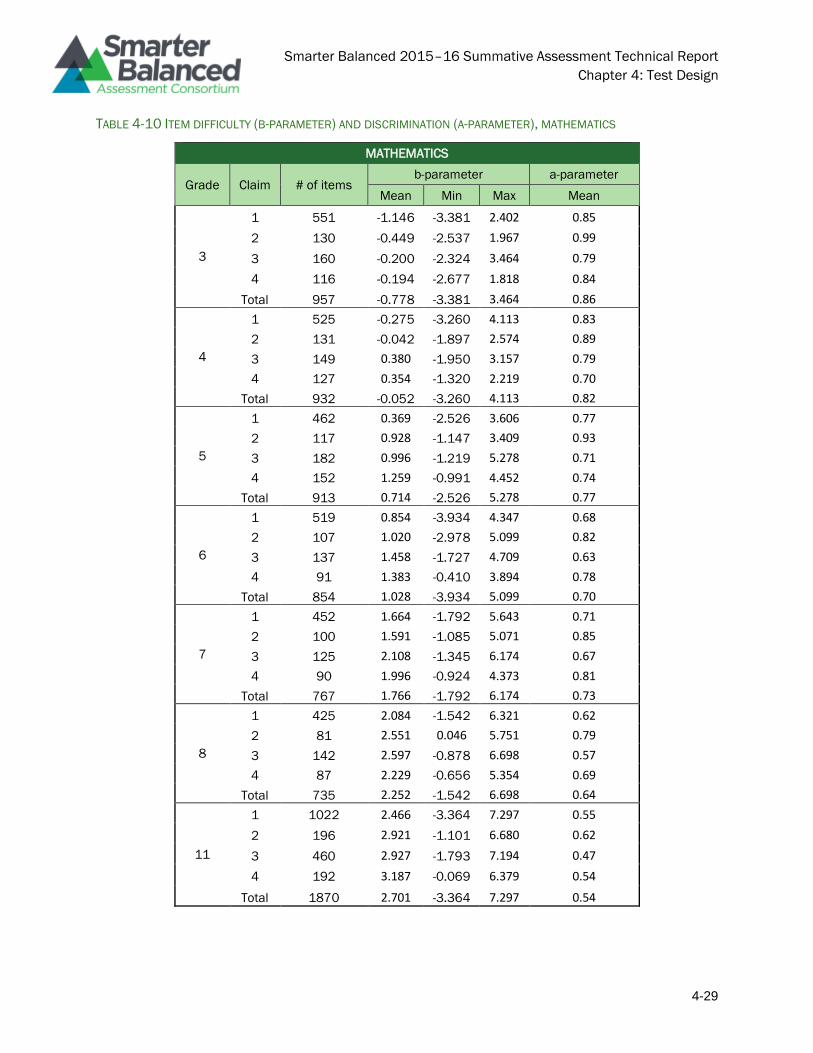
Smarter Balanced 2015–16 Summative Assessment Technical Report
Chapter 4: Test Design
4-29
TABLE 4-10 ITEM DIFFICULTY (B-PARAMETER) AND DISCRIMINATION (A-PARAMETER), MATHEMATICS
MATHEMATICS
Grade Claim # of items b-parameter a-parameter
Mean Min Max Mean
3
1 551 -1.146 -3.381 2.402 0.85
2 130 -0.449 -2.537 1.967 0.99
3 160 -0.200 -2.324 3.464 0.79
4 116 -0.194 -2.677 1.818 0.84
Total 957 -0.778 -3.381 3.464 0.86
4
1 525 -0.275 -3.260 4.113 0.83
2 131 -0.042 -1.897 2.574 0.89
3 149 0.380 -1.950 3.157 0.79
4 127 0.354 -1.320 2.219 0.70
Total 932 -0.052 -3.260 4.113 0.82
5
1 462 0.369 -2.526 3.606 0.77
2 117 0.928 -1.147 3.409 0.93
3 182 0.996 -1.219 5.278 0.71
4 152 1.259 -0.991 4.452 0.74
Total 913 0.714 -2.526 5.278 0.77
6
1 519 0.854 -3.934 4.347 0.68
2 107 1.020 -2.978 5.099 0.82
3 137 1.458 -1.727 4.709 0.63
4 91 1.383 -0.410 3.894 0.78
Total 854 1.028 -3.934 5.099 0.70
7
1 452 1.664 -1.792 5.643 0.71
2 100 1.591 -1.085 5.071 0.85
3 125 2.108 -1.345 6.174 0.67
4 90 1.996 -0.924 4.373 0.81
Total 767 1.766 -1.792 6.174 0.73
8
1 425 2.084 -1.542 6.321 0.62
2 81 2.551 0.046 5.751 0.79
3 142 2.597 -0.878 6.698 0.57
4 87 2.229 -0.656 5.354 0.69
Total 735 2.252 -1.542 6.698 0.64
11
1 1022 2.466 -3.364 7.297 0.55
2 196 2.921 -1.101 6.680 0.62
3 460 2.927 -1.793 7.194 0.47
4 192 3.187 -0.069 6.379 0.54
Total 1870 2.701 -3.364 7.297 0.54
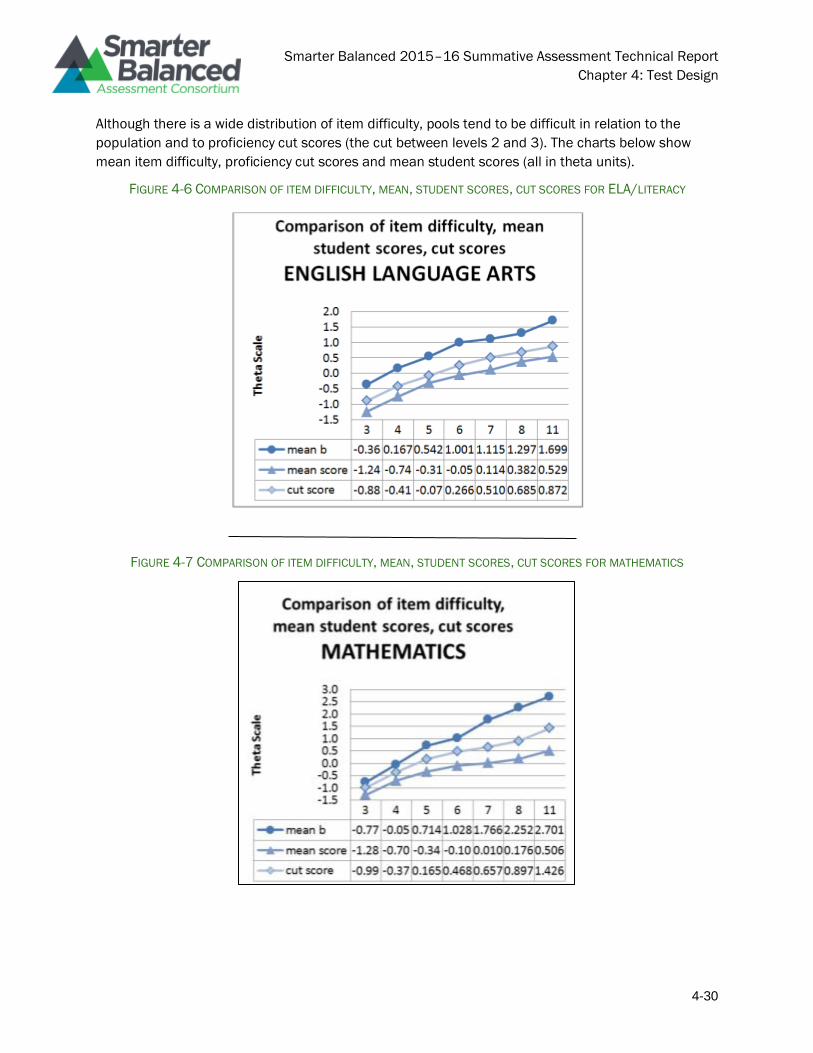
Smarter Balanced 2015–16 Summative Assessment Technical Report
Chapter 4: Test Design
4-30
Although there is a wide distribution of item difficulty, pools tend to be difficult in relation to the
population and to proficiency cut scores (the cut between levels 2 and 3). The charts below show
mean item difficulty, proficiency cut scores and mean student scores (all in theta units).
FIGURE 4-6 COMPARISON OF ITEM DIFFICULTY, MEAN, STUDENT SCORES, CUT SCORES FOR ELA/LITERACY
FIGURE 4-7 COMPARISON OF ITEM DIFFICULTY, MEAN, STUDENT SCORES, CUT SCORES FOR MATHEMATICS
Smarter Balanced 2015–16 Summative Assessment Technical Report
Chapter 4: Test Design
4-31
Content Alignment
In developing a system of assessments, Smarter Balanced is committed to ensuring that its
measurement reflects the expectations of content, rigor, and performance that correspond to the
CCSS. To that end, Smarter Balanced designed item specifications to demonstrate alignment
through methodologies that reflect ECD theory. According to Webb (2002), “Alignment of
expectations for student learning and assessments for measuring students’ attainment of these
expectations is an essential attribute for an effective standards-based education system.” DeMauro
(2004) states, “Alignment activities . . . should be the guiding principle of test design, and item
alignment studies should be sources of validity documentation, as should any studies of test
content.” Test content alignment is at the core of content validity and consequential validity
(Martone & Sireci, 2009). Content alignment addresses the appropriateness of inferences drawn
from test results concerning “how well all policy elements [e.g., expectations and assessments]
guide instruction and, ultimately, impact student learning” (Webb, 1997). Since Consortium states
have adopted the CCSS in ELA/literacy and mathematics, it was imperative that Smarter Balanced
conduct the appropriate alignment studies. Accordingly, the Consortium contracted with the Human
Resources Research Organization to conduct an alignment study (HumRRO, 2014).
Webb (1997) identified several categories of criteria for judging content alignment. The Smarter
Balanced alignment study describes how well the Smarter Balanced tests address expectations
embodied in the Smarter Balanced content specifications and the CCSS. Test content alignment is at
the core of content validity and consequential validity (Martone and Sireci, 2009). Because of the
high stakes associated with statewide testing and the need to communicate learning goals during
the NCLB era, attention was directed at test alignment in addition to individual item alignment. The
emphasis on test content in alignment and validity studies is understandable. After all, a test is a
small sampling of items from a much larger universe of possible items/tasks representing a very
broad domain. For inferences from test results to be justifiable, that sample of items has to be an
adequate representation of the broad domain, providing strong evidence to support claims based on
the test results.
Assessment is always constrained to some extent by time and resources. Items and tasks that
require extensive time (performance tasks and text responses), items that require expensive scoring,
and items that require a lot of computer bandwidth (videos, animations) must be limited and chosen
carefully. Smarter Balanced content experts carefully scrutinized each blueprint to assure optimal
content coverage and prudent use of time and resources. In general, the Smarter Balanced
blueprints represent content sampling proportions that reflect intended emphasis in instruction and
mastery at each grade level. Specifications for numbers of items by claim, assessment target, depth-
of-knowledge, and item type demonstrate the desired proportions within test delivery constraints.
The blueprints were subject to state approval through a formal vote.
The alignment study conducted for the Consortium (HumRRO, 2014) discusses alignment among
elements of content standards, content specifications, item specifications, and blueprints. The study
itself is extensive, but its overall finding is that the Smarter Balanced summative tests and
supporting item pools exceed levels of DOK representation recommended by Webb. The analysis is
done with test blueprint, item and test specifications and item pools.
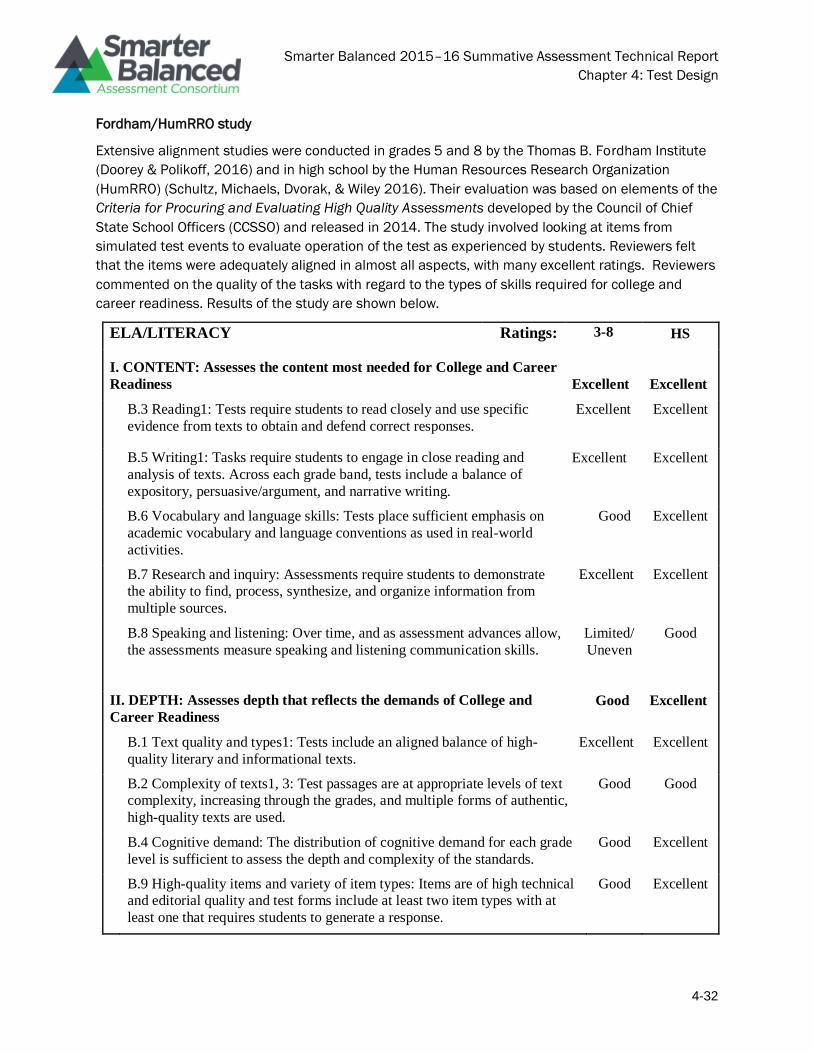
Smarter Balanced 2015–16 Summative Assessment Technical Report
Chapter 4: Test Design
4-32
Fordham/HumRRO study
Extensive alignment studies were conducted in grades 5 and 8 by the Thomas B. Fordham Institute
(Doorey & Polikoff, 2016) and in high school by the Human Resources Research Organization
(HumRRO) (Schultz, Michaels, Dvorak, & Wiley 2016). Their evaluation was based on elements of the
Criteria for Procuring and Evaluating High Quality Assessments developed by the Council of Chief
State School Officers (CCSSO) and released in 2014. The study involved looking at items from
simulated test events to evaluate operation of the test as experienced by students. Reviewers felt
that the items were adequately aligned in almost all aspects, with many excellent ratings. Reviewers
commented on the quality of the tasks with regard to the types of skills required for college and
career readiness. Results of the study are shown below.
ELA/LITERACY Ratings: 3-8 HS
I. CONTENT: Assesses the content most needed for College and Career
Readiness
Excellent Excellent
B.3 Reading1: Tests require students to read closely and use specific
evidence from texts to obtain and defend correct responses. Excellent Excellent
B.5 Writing1: Tasks require students to engage in close reading and
analysis of texts. Across each grade band, tests include a balance of
expository, persuasive/argument, and narrative writing.
Excellent Excellent
B.6 Vocabulary and language skills: Tests place sufficient emphasis on
academic vocabulary and language conventions as used in real-world
activities.
Good Excellent
B.7 Research and inquiry: Assessments require students to demonstrate
the ability to find, process, synthesize, and organize information from
multiple sources.
Excellent Excellent
B.8 Speaking and listening: Over time, and as assessment advances allow,
the assessments measure speaking and listening communication skills.
Limited/
Uneven Good
II. DEPTH: Assesses depth that reflects the demands of College and
Career Readiness Good Excellent
B.1 Text quality and types1: Tests include an aligned balance of high-
quality literary and informational texts. Excellent Excellent
B.2 Complexity of texts1, 3: Test passages are at appropriate levels of text
complexity, increasing through the grades, and multiple forms of authentic,
high-quality texts are used.
Good Good
B.4 Cognitive demand: The distribution of cognitive demand for each grade
level is sufficient to assess the depth and complexity of the standards. Good Excellent
B.9 High-quality items and variety of item types: Items are of high technical
and editorial quality and test forms include at least two item types with at
least one that requires students to generate a response.
Good Excellent
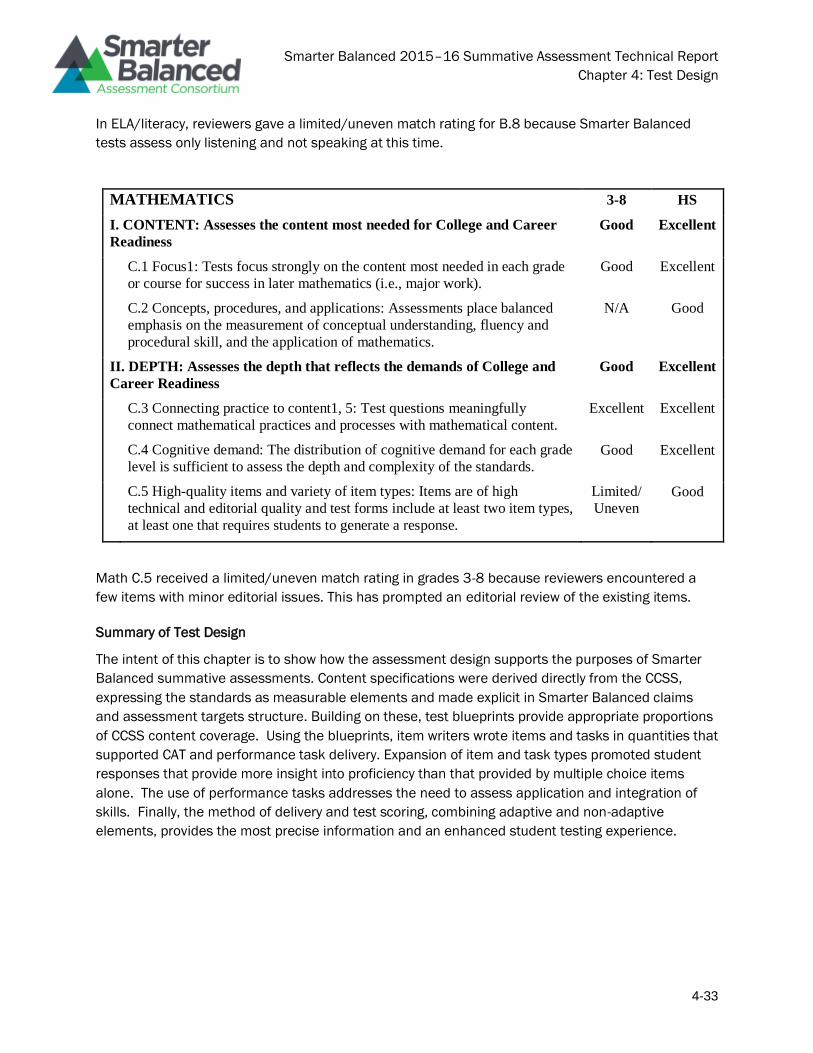
Smarter Balanced 2015–16 Summative Assessment Technical Report
Chapter 4: Test Design
4-33
In ELA/literacy, reviewers gave a limited/uneven match rating for B.8 because Smarter Balanced
tests assess only listening and not speaking at this time.
MATHEMATICS 3-8 HS
I. CONTENT: Assesses the content most needed for College and Career
Readiness Good Excellent
C.1 Focus1: Tests focus strongly on the content most needed in each grade
or course for success in later mathematics (i.e., major work). Good Excellent
C.2 Concepts, procedures, and applications: Assessments place balanced
emphasis on the measurement of conceptual understanding, fluency and
procedural skill, and the application of mathematics.
N/A Good
II. DEPTH: Assesses the depth that reflects the demands of College and
Career Readiness Good Excellent
C.3 Connecting practice to content1, 5: Test questions meaningfully
connect mathematical practices and processes with mathematical content. Excellent Excellent
C.4 Cognitive demand: The distribution of cognitive demand for each grade
level is sufficient to assess the depth and complexity of the standards. Good Excellent
C.5 High-quality items and variety of item types: Items are of high
technical and editorial quality and test forms include at least two item types,
at least one that requires students to generate a response.
Limited/
Uneven Good
Math C.5 received a limited/uneven match rating in grades 3-8 because reviewers encountered a
few items with minor editorial issues. This has prompted an editorial review of the existing items.
Summary of Test Design
The intent of this chapter is to show how the assessment design supports the purposes of Smarter
Balanced summative assessments. Content specifications were derived directly from the CCSS,
expressing the standards as measurable elements and made explicit in Smarter Balanced claims
and assessment targets structure. Building on these, test blueprints provide appropriate proportions
of CCSS content coverage. Using the blueprints, item writers wrote items and tasks in quantities that
supported CAT and performance task delivery. Expansion of item and task types promoted student
responses that provide more insight into proficiency than that provided by multiple choice items
alone. The use of performance tasks addresses the need to assess application and integration of
skills. Finally, the method of delivery and test scoring, combining adaptive and non-adaptive
elements, provides the most precise information and an enhanced student testing experience.
Smarter Balanced 2015–16 Summative Assessment Technical Report
Chapter 4: Test Design
4-34
References
American Institutes for Research (2013). Cognitive Laboratories Technical Report. Los Angeles, CA:
Smarter Balanced Assessment Consortium.
American Institutes for Research (2014). Smarter Balanced scoring specification: 2014–2015
Administration. Los Angeles, CA: Smarter Balanced Assessment Consortium.
Cohen, J. & Albright, L. (2014). Smarter Balanced adaptive item selection algorithm design report.
Retrieved from http://www.smarterapp.org/specs/AdaptiveAlgorithm.html
Council of Chief State School Officers (2014). Criteria for procuring and evaluating high quality
assessments.
Dana, T. M., & Tippins, D. J. (1993). Considering alternative assessment for middle level learners.
Middle School Journal, 25, 3-5.
DeMauro, G. E. (2004). Test alignment considerations for the meaning of testing. Paper presented at
the CCSSO Annual Conference on Large Scale Assessment, Boston, MA.
Doorey, N., & Polikoff, M. (2016). Evaluating the content and quality of next generation
assessments. Washington DC: Thomas B. Fordham Institute.
Fadel, C., Honey, M., & Pasnik, S. (2007, May). Assessment in the age of innovation. Education
Week. May 18, 2007. Retrieved on July 2, 2012 from
http://www.edweek.org/ew/articles/2007/05/23/38fadel.h26.html?print=1
Hansen, E. G. and Mislevy, R. J. (2008), Design patterns for improving accessibility for test takers
with disabilities. ETS Research Report Series, 2008: i–32. doi: 10.1002/j.2333-
8504.2008.tb02135.x
HumRRO. (2015). Smarter Balanced Assessment Consortium Alignment Study Report. Los Angeles,
CA. Smarter Balanced Assessment Consortium.
Martone, A., & Sireci, S. G. (2009). Evaluating alignment between curriculum, assessment, and
instruction. Review of Educational Research, 79, 1-76.
Mislevy R., & Haertel G., (2006). Implications of evidence-centered design for educational testing.
Menlo Park, CA: SRI International.
Mislevy, R.J., Steinberg, L.S., & Almond, R.G. (2003). On the structure of educational assessments.
Measurement: Interdisciplinary Research and Perspectives, 1, 3-67.
Reckase, M. D. (2003). Item pool design for computerized adaptive tests. Paper presented at the
National Council on Measurement in Education, Chicago, IL.
Rose, D., & Meyer, A. (2000). Universal design for learning, associate editor column. Journal of
Special Education Technology 15 (1): 1-12.
Schmeiser, C. B., & Welch, C. J. (2006). Test Development. In R. L. Brennan (Ed.) Educational
Measurement, 4th Edition (307-353). Washington, DC: American Council on Education.
Schultz, S. R., Michaels, H. R., Dvorak, R. N., & Wiley, C. R. H. (2016). Evaluating the content and
quality of next generation high school assessments. Alexandria, VA: HumRRO.
Smarter Balanced Assessment Consortium (2010, June 23). Race to the Top Assessment Program
Application for New grants: Comprehensive Assessment Systems, CFDA Number: 84.395B.
OMB Control Number 1810-0699.
Smarter Balanced 2015–16 Summative Assessment Technical Report
Chapter 4: Test Design
4-35
Smarter Balanced Assessment Consortium. (2014). State procedures manual. Los Angeles, CA:
Smarter Balanced Assessment Consortium.
Smarter Balanced Assessment Consortium. (2015a). ELA/Literacy summative assessment blueprint.
Retrieved from https://portal.smarterbalanced.org/library/en/english-language-artsliteracy-
content-specifications.pdf
Smarter Balanced Assessment Consortium. (2015b). Mathematics summative assessment
blueprint. Retrieved from
http://www.smarterbalanced.org/assessments/development/additional-technical-
documentation/
Smarter Balanced Assessment Consortium. (2015c). Content specifications for the summative
assessment of the common core state standards for English language arts and literacy in
history/social studies, science, and technical subjects. Retrieved from
http://www.smarterbalanced.org/wp-content/uploads/2015/08/ELA_Content_Specs.pdf
Smarter Balanced Assessment Consortium. (2015d). Content specifications for the summative
assessment of the common core state standards for mathematics. Retrieved from
http://www.smarterbalanced.org/wp-content/uploads/2015/08/Mathematics-Content-
Specifications.pdf
Smarter Balanced Assessment Consortium. (2015e). Item and task specifications. Retrieved from
http://www.smarterbalanced.org/assessments/development/
Smarter Balanced Assessment Consortium. (2015f). Achievement level setting final report. Retrieved
from http://www.smarterbalanced.org/assessments/development/additional-technical-
documentation/
Smarter Balanced Asssessment Consortium. (2016). 2013-2014 Technical Report. Retrieved from
http://www.smarterbalanced.org/wp-content/uploads/2015/08/2013-
14_Technical_Report.pdf
van der Linden, W. J. (2005). Linear models for optimal test design. New York: Springer.
Webb, N. L. (1997a, April). Criteria for alignment of expectations and assessments in mathematics
and science education. Research Monograph No. 6. Washington, DC: Council of Chief State
School Officers.
Webb, N. L. (March 28, 2002) Depth-of-Knowledge Levels for Four Content Areas, unpublished
paper.
Zhang, T., Haertel, G., Javitz, H., Mislevy, R., Murray, E., & Wasson, J. (2009). A Design Pattern for a
Spelling Bee Assessment for Students with Disabilities. A paper presented at the annual
conference of the American Psychological Association, Montreal, Canada.
Smarter Balanced 2015–16 Summative Assessment Technical Report
Chapter 5: Scores, Scales and Norms
5-1
Chapter 5: Scores, Scales and
Norms
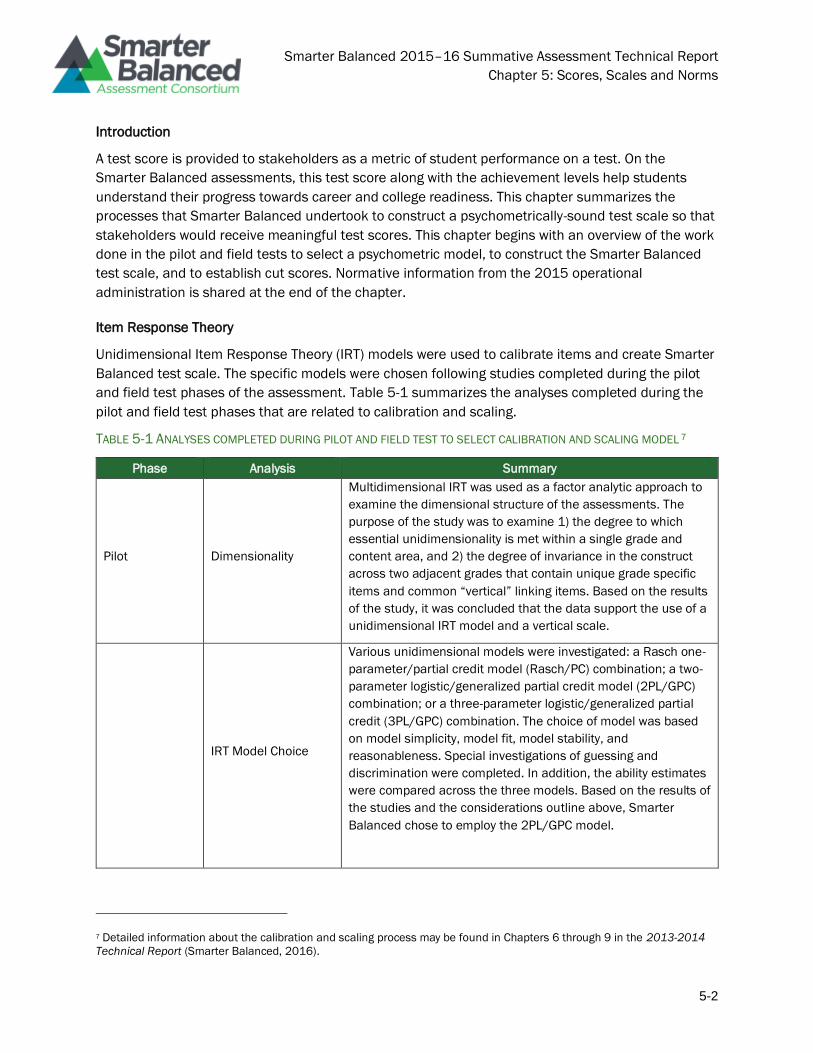
Smarter Balanced 2015–16 Summative Assessment Technical Report
Chapter 5: Scores, Scales and Norms
5-2
Introduction
A test score is provided to stakeholders as a metric of student performance on a test. On the
Smarter Balanced assessments, this test score along with the achievement levels help students
understand their progress towards career and college readiness. This chapter summarizes the
processes that Smarter Balanced undertook to construct a psychometrically-sound test scale so that
stakeholders would receive meaningful test scores. This chapter begins with an overview of the work
done in the pilot and field tests to select a psychometric model, to construct the Smarter Balanced
test scale, and to establish cut scores. Normative information from the 2015 operational
administration is shared at the end of the chapter.
Item Response Theory
Unidimensional Item Response Theory (IRT) models were used to calibrate items and create Smarter
Balanced test scale. The specific models were chosen following studies completed during the pilot
and field test phases of the assessment. Table 5-1 summarizes the analyses completed during the
pilot and field test phases that are related to calibration and scaling.
TABLE 5-1 ANALYSES COMPLETED DURING PILOT AND FIELD TEST TO SELECT CALIBRATION AND SCALING MODEL 7
Phase Analysis Summary
Pilot Dimensionality
Multidimensional IRT was used as a factor analytic approach to
examine the dimensional structure of the assessments. The
purpose of the study was to examine 1) the degree to which
essential unidimensionality is met within a single grade and
content area, and 2) the degree of invariance in the construct
across two adjacent grades that contain unique grade specific
items and common “vertical” linking items. Based on the results
of the study, it was concluded that the data support the use of a
unidimensional IRT model and a vertical scale.
IRT Model Choice
Various unidimensional models were investigated: a Rasch one-
parameter/partial credit model (Rasch/PC) combination; a two-
parameter logistic/generalized partial credit model (2PL/GPC)
combination; or a three-parameter logistic/generalized partial
credit (3PL/GPC) combination. The choice of model was based
on model simplicity, model fit, model stability, and
reasonableness. Special investigations of guessing and
discrimination were completed. In addition, the ability estimates
were compared across the three models. Based on the results of
the studies and the considerations outline above, Smarter
Balanced chose to employ the 2PL/GPC model.
7 Detailed information about the calibration and scaling process may be found in Chapters 6 through 9 in the 2013-2014
Technical Report (Smarter Balanced, 2016).
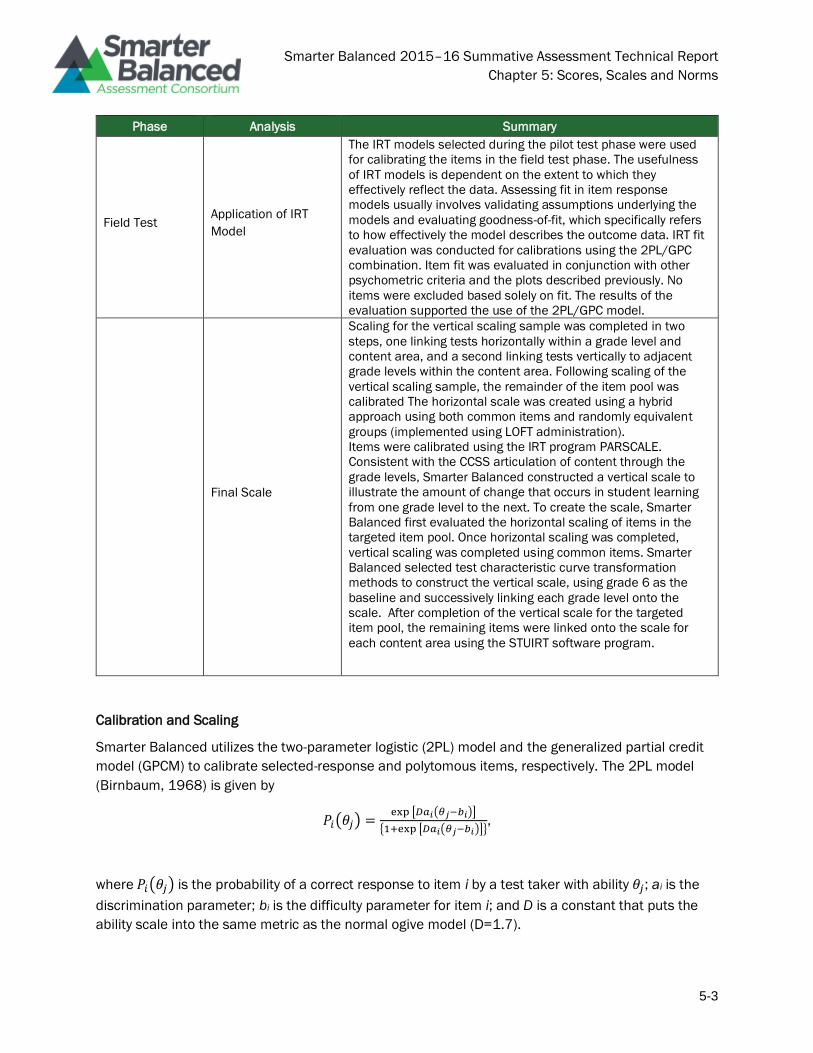
Smarter Balanced 2015–16 Summative Assessment Technical Report
Chapter 5: Scores, Scales and Norms
5-3
Phase Analysis Summary
Field Test Application of IRT
Model
The IRT models selected during the pilot test phase were used
for calibrating the items in the field test phase. The usefulness
of IRT models is dependent on the extent to which they
effectively reflect the data. Assessing fit in item response
models usually involves validating assumptions underlying the
models and evaluating goodness-of-fit, which specifically refers
to how effectively the model describes the outcome data. IRT fit
evaluation was conducted for calibrations using the 2PL/GPC
combination. Item fit was evaluated in conjunction with other
psychometric criteria and the plots described previously. No
items were excluded based solely on fit. The results of the
evaluation supported the use of the 2PL/GPC model.
Final Scale
Scaling for the vertical scaling sample was completed in two
steps, one linking tests horizontally within a grade level and
content area, and a second linking tests vertically to adjacent
grade levels within the content area. Following scaling of the
vertical scaling sample, the remainder of the item pool was
calibrated The horizontal scale was created using a hybrid
approach using both common items and randomly equivalent
groups (implemented using LOFT administration).
Items were calibrated using the IRT program PARSCALE.
Consistent with the CCSS articulation of content through the
grade levels, Smarter Balanced constructed a vertical scale to
illustrate the amount of change that occurs in student learning
from one grade level to the next. To create the scale, Smarter
Balanced first evaluated the horizontal scaling of items in the
targeted item pool. Once horizontal scaling was completed,
vertical scaling was completed using common items. Smarter
Balanced selected test characteristic curve transformation
methods to construct the vertical scale, using grade 6 as the
baseline and successively linking each grade level onto the
scale. After completion of the vertical scale for the targeted
item pool, the remaining items were linked onto the scale for
each content area using the STUIRT software program.
Calibration and Scaling
Smarter Balanced utilizes the two-parameter logistic (2PL) model and the generalized partial credit
model (GPCM) to calibrate selected-response and polytomous items, respectively. The 2PL model
(Birnbaum, 1968) is given by
𝑃𝑖(𝜃𝑗) =exp [𝐷𝑎𝑖(𝜃𝑗−𝑏𝑖)]
{1+exp [𝐷𝑎𝑖(𝜃𝑗−𝑏𝑖)]},
where 𝑃𝑖(𝜃𝑗) is the probability of a correct response to item i by a test taker with ability 𝜃𝑗; ai is the
discrimination parameter; bi is the difficulty parameter for item i; and D is a constant that puts the
ability scale into the same metric as the normal ogive model (D=1.7).
Smarter Balanced 2015–16 Summative Assessment Technical Report
Chapter 5: Scores, Scales and Norms
5-4
For constructed-response items, the generalized partial credit model (GPCM; Muraki, 1992) or partial
credit model (PCM; Masters, 1982) is employed. The generalized partial credit model is given by
𝑃𝑖ℎ(𝜃𝑗) =exp ∑ [𝐷𝑎𝑖(𝜃𝑗−𝑏𝑖+𝑑𝑖𝑣)]ℎ
𝑣=1
∑ exp[∑ 𝐷𝑎𝑖(𝜃𝑗−𝑏𝑖+𝑑𝑖𝑣)𝑐𝑣=1 ]
𝑛𝑖𝑐=1
,
where 𝑃𝑖ℎ(𝜃𝑗) is the probability of examinee j obtaining a score of h on item i; ni is the number of
item score categories; bi is the item location parameter; div is the category parameter for item i,
category v; and D is a scaling constant given previously.
PARSCALE (Muraki & Bock, 2003) was used for the IRT calibrations. PARSCALE is a multipurpose
program that implements a variety of IRT models associated with mixed-item formats and associated
statistics. The psychometric properties of PARSCALE are well known, and it can efficiently and
accurately calibrate large data sets such as those of Smarter Balanced assessments. The program
implements marginal maximum likelihood (MML) estimation techniques for items and MLE
estimation of theta.
Vertical Scale
The IRT scaling for Smarter Balanced was performed in two steps. The first step was used to
establish the horizontal and vertical scales that were used to set achievement levels. In the first
step, items were initially scaled horizontally, where items in a single grade and content area were
concurrently (i.e., simultaneously) calibrated. The vertical linking was accomplished using common
items administered across grades (e.g., the same items given in 3rd and 4th grades) and then
placing consecutive grades onto the vertical scale. In the second horizontal calibration step, the
remaining, and much larger, item pool (containing non-common items, each administered only to
one grade) was scaled using the items from the first phase as linking/common items. For detailed
description of the methods used in vertical scaling, see Chapter 9 of the 2013-2014 Technical
Report (Smarter Balanced, 2016).
Transforming the Theta Metric to the Scale Score
The results from the calibration are in a theta metric. These results are transformed onto a four-digit
scale that is more meaningful for stakeholders. The equation for this transformation is:
Scale score = (logit * slope) + intercept
Table 5-2 shows the slope and intercept for ELA/literacy and mathematics.
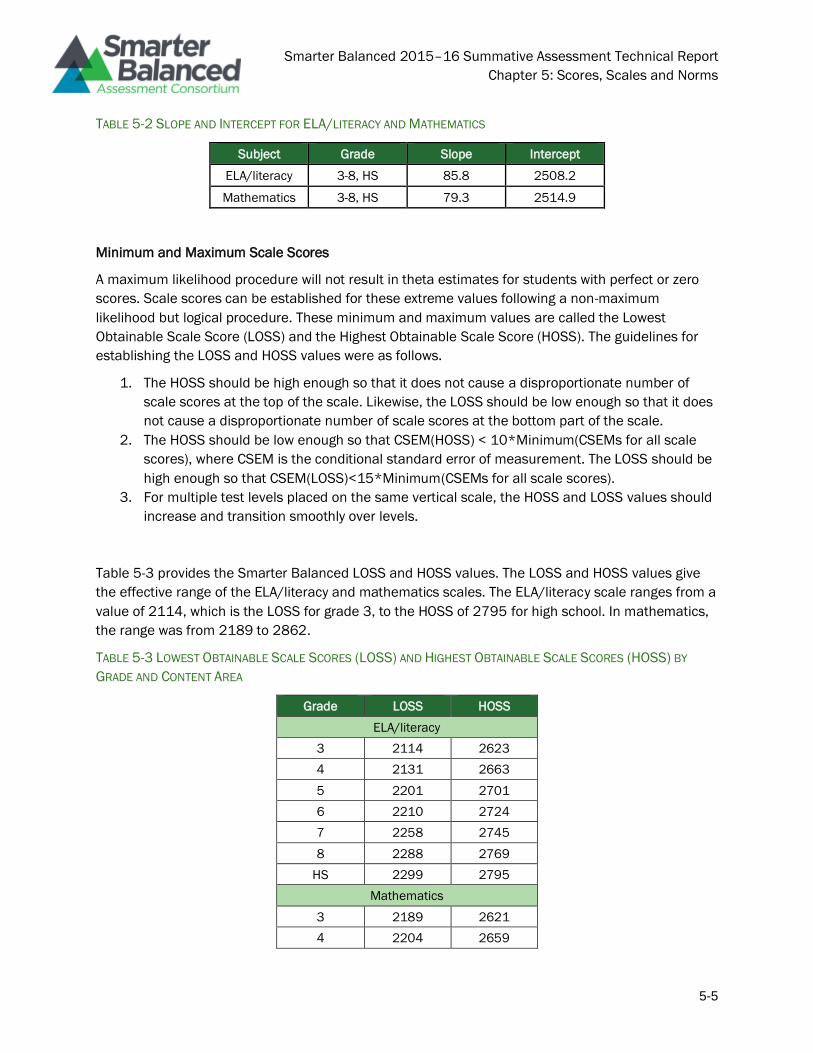
Smarter Balanced 2015–16 Summative Assessment Technical Report
Chapter 5: Scores, Scales and Norms
5-5
TABLE 5-2 SLOPE AND INTERCEPT FOR ELA/LITERACY AND MATHEMATICS
Subject Grade Slope Intercept
ELA/literacy 3-8, HS 85.8 2508.2
Mathematics 3-8, HS 79.3 2514.9
Minimum and Maximum Scale Scores
A maximum likelihood procedure will not result in theta estimates for students with perfect or zero
scores. Scale scores can be established for these extreme values following a non-maximum
likelihood but logical procedure. These minimum and maximum values are called the Lowest
Obtainable Scale Score (LOSS) and the Highest Obtainable Scale Score (HOSS). The guidelines for
establishing the LOSS and HOSS values were as follows.
1. The HOSS should be high enough so that it does not cause a disproportionate number of
scale scores at the top of the scale. Likewise, the LOSS should be low enough so that it does
not cause a disproportionate number of scale scores at the bottom part of the scale.
2. The HOSS should be low enough so that CSEM(HOSS) < 10*Minimum(CSEMs for all scale
scores), where CSEM is the conditional standard error of measurement. The LOSS should be
high enough so that CSEM(LOSS)<15*Minimum(CSEMs for all scale scores).
3. For multiple test levels placed on the same vertical scale, the HOSS and LOSS values should
increase and transition smoothly over levels.
Table 5-3 provides the Smarter Balanced LOSS and HOSS values. The LOSS and HOSS values give
the effective range of the ELA/literacy and mathematics scales. The ELA/literacy scale ranges from a
value of 2114, which is the LOSS for grade 3, to the HOSS of 2795 for high school. In mathematics,
the range was from 2189 to 2862.
TABLE 5-3 LOWEST OBTAINABLE SCALE SCORES (LOSS) AND HIGHEST OBTAINABLE SCALE SCORES (HOSS) BY
GRADE AND CONTENT AREA
Grade LOSS HOSS
ELA/literacy
3 2114 2623
4 2131 2663
5 2201 2701
6 2210 2724
7 2258 2745
8 2288 2769
HS 2299 2795
Mathematics
3 2189 2621
4 2204 2659
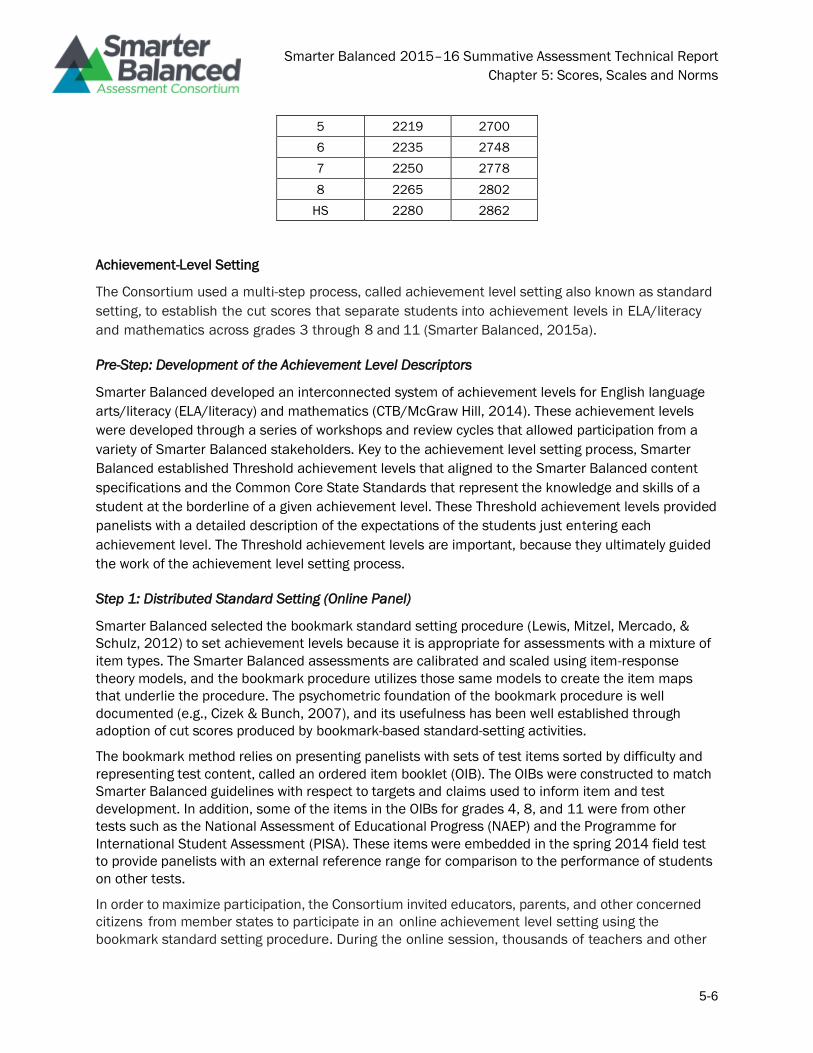
Smarter Balanced 2015–16 Summative Assessment Technical Report
Chapter 5: Scores, Scales and Norms
5-6
5 2219 2700
6 2235 2748
7 2250 2778
8 2265 2802
HS 2280 2862
Achievement-Level Setting
The Consortium used a multi-step process, called achievement level setting also known as standard
setting, to establish the cut scores that separate students into achievement levels in ELA/literacy
and mathematics across grades 3 through 8 and 11 (Smarter Balanced, 2015a).
Pre-Step: Development of the Achievement Level Descriptors
Smarter Balanced developed an interconnected system of achievement levels for English language
arts/literacy (ELA/literacy) and mathematics (CTB/McGraw Hill, 2014). These achievement levels
were developed through a series of workshops and review cycles that allowed participation from a
variety of Smarter Balanced stakeholders. Key to the achievement level setting process, Smarter
Balanced established Threshold achievement levels that aligned to the Smarter Balanced content
specifications and the Common Core State Standards that represent the knowledge and skills of a
student at the borderline of a given achievement level. These Threshold achievement levels provided
panelists with a detailed description of the expectations of the students just entering each
achievement level. The Threshold achievement levels are important, because they ultimately guided
the work of the achievement level setting process.
Step 1: Distributed Standard Setting (Online Panel)
Smarter Balanced selected the bookmark standard setting procedure (Lewis, Mitzel, Mercado, &
Schulz, 2012) to set achievement levels because it is appropriate for assessments with a mixture of
item types. The Smarter Balanced assessments are calibrated and scaled using item-response
theory models, and the bookmark procedure utilizes those same models to create the item maps
that underlie the procedure. The psychometric foundation of the bookmark procedure is well
documented (e.g., Cizek & Bunch, 2007), and its usefulness has been well established through
adoption of cut scores produced by bookmark-based standard-setting activities.
The bookmark method relies on presenting panelists with sets of test items sorted by difficulty and
representing test content, called an ordered item booklet (OIB). The OIBs were constructed to match
Smarter Balanced guidelines with respect to targets and claims used to inform item and test
development. In addition, some of the items in the OIBs for grades 4, 8, and 11 were from other
tests such as the National Assessment of Educational Progress (NAEP) and the Programme for
International Student Assessment (PISA). These items were embedded in the spring 2014 field test
to provide panelists with an external reference range for comparison to the performance of students
on other tests.
In order to maximize participation, the Consortium invited educators, parents, and other concerned
citizens from member states to participate in an online achievement level setting using the
bookmark standard setting procedure. During the online session, thousands of teachers and other

Smarter Balanced 2015–16 Summative Assessment Technical Report
Chapter 5: Scores, Scales and Norms
5-7
interested parties independently reviewed test questions and recommended the level of performance
required for students to be considered on-track toward college and career readiness. In other
words, the online panel only made recommendations in regard to Level 3.
The concept of an online panel is an innovation introduced to address the scale of the Smarter
Balanced project and its number and variety of stakeholders. In addition to allowing wider
achievement level setting participation, the online panel approach promotes deeper understanding
of the content standards and Smarter Balanced assessments. The cut score recommended by the
online panels were presented during the in-person workshop.
Step 2: In-Person Panel
The in-person panel allowed teams of educators and other stakeholders nominated by member states
to deliberate and recommend cut scores for all four achievement levels: Level 1, Level 2, Level 3, and
Level 4. The in-person panel engaged in the bookmark standard setting procedure using the same
ordered item booklets (OIBs) reviewed by the online panel. Separate grade-level panels for each
content area, consisting of approximately 30 members each, were convened to recommend cut
scores for ELA/literacy and mathematics. Member states nominated all panelists, which included
teachers and administrators, higher education faculty, business and community leaders, and
parents
The in-person panels participated in three rounds of discussion and bookmark placements. In Round
1, panelists studied the items in the OIB and made recommendations. In Round 2, panelists were
shown the cut scores from the online standard setting, engaged in small group discussions, and
made recommendations. In Round 3, panelists were shown various forms of impact data
(percentage of students in each achievement level), engaged in large group discussions, and made
recommendations
For the in-person achievement level setting, the process was field tested and revised based on field
test evidence. In addition, panelists were asked to provide feedback on their experience with the
activities used to set cut scores. The vast majority of panelists (over 90%) agreed that the activities
of the workshop (e.g., training and practice exercises, taking the practice test, engaging in
discussions) were useful to their understanding of the process.
Step 3: Cross-Grade Review (Vertical Articulation Committee)
Following the in-person achievement level setting, a subset consisting primarily of educators from the
in-person panels met to review the achievement levels recommended during the in-person
achievement level setting (Step 2). Separate cross-grade panels were convened for ELA/literacy and
for mathematics. The purpose of the cross-grade review was to ensure that the achievement levels
were appropriately aligned across grades and would accurately reflect student progress from year
to year. The panelists at the cross-grade review examined the earlier recommendations and
suggested changes that would improve cross-grade alignment of the achievement level. For the
vertical articulation panel, the process was field tested and revised based on field test evidence.
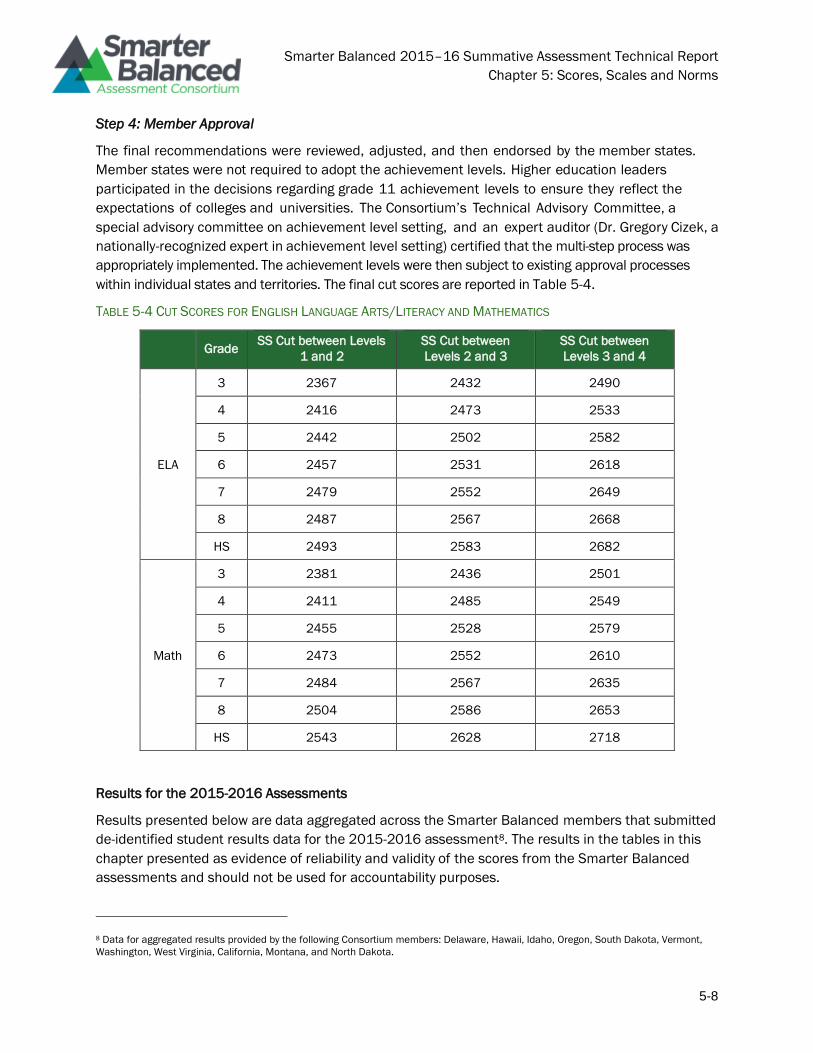
Smarter Balanced 2015–16 Summative Assessment Technical Report
Chapter 5: Scores, Scales and Norms
5-8
Step 4: Member Approval
The final recommendations were reviewed, adjusted, and then endorsed by the member states.
Member states were not required to adopt the achievement levels. Higher education leaders
participated in the decisions regarding grade 11 achievement levels to ensure they reflect the
expectations of colleges and universities. The Consortium’s Technical Advisory Committee, a
special advisory committee on achievement level setting, and an expert auditor (Dr. Gregory Cizek, a
nationally-recognized expert in achievement level setting) certified that the multi-step process was
appropriately implemented. The achievement levels were then subject to existing approval processes
within individual states and territories. The final cut scores are reported in Table 5-4.
TABLE 5-4 CUT SCORES FOR ENGLISH LANGUAGE ARTS/LITERACY AND MATHEMATICS
Grade SS Cut between Levels
1 and 2
SS Cut between
Levels 2 and 3
SS Cut between
Levels 3 and 4
ELA
3 2367 2432 2490
4 2416 2473 2533
5 2442 2502 2582
6 2457 2531 2618
7 2479 2552 2649
8 2487 2567 2668
HS 2493 2583 2682
Math
3 2381 2436 2501
4 2411 2485 2549
5 2455 2528 2579
6 2473 2552 2610
7 2484 2567 2635
8 2504 2586 2653
HS 2543 2628 2718
Results for the 2015-2016 Assessments
Results presented below are data aggregated across the Smarter Balanced members that submitted
de-identified student results data for the 2015-2016 assessment8. The results in the tables in this
chapter presented as evidence of reliability and validity of the scores from the Smarter Balanced
assessments and should not be used for accountability purposes.
8 Data for aggregated results provided by the following Consortium members: Delaware, Hawaii, Idaho, Oregon, South Dakota, Vermont,
Washington, West Virginia, California, Montana, and North Dakota.
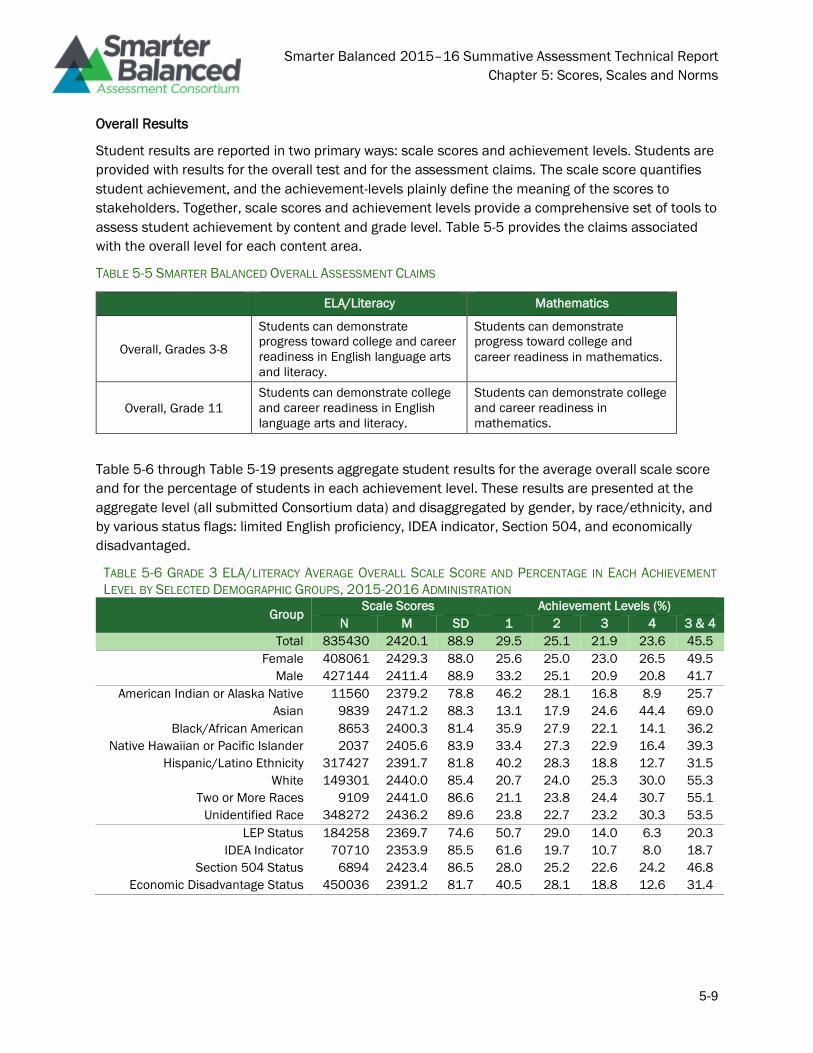
Smarter Balanced 2015–16 Summative Assessment Technical Report
Chapter 5: Scores, Scales and Norms
5-9
Overall Results
Student results are reported in two primary ways: scale scores and achievement levels. Students are
provided with results for the overall test and for the assessment claims. The scale score quantifies
student achievement, and the achievement-levels plainly define the meaning of the scores to
stakeholders. Together, scale scores and achievement levels provide a comprehensive set of tools to
assess student achievement by content and grade level. Table 5-5 provides the claims associated
with the overall level for each content area.
TABLE 5-5 SMARTER BALANCED OVERALL ASSESSMENT CLAIMS
ELA/Literacy Mathematics
Overall, Grades 3-8
Students can demonstrate
progress toward college and career
readiness in English language arts
and literacy.
Students can demonstrate
progress toward college and
career readiness in mathematics.
Overall, Grade 11
Students can demonstrate college
and career readiness in English
language arts and literacy.
Students can demonstrate college
and career readiness in
mathematics.
Table 5-6 through Table 5-19 presents aggregate student results for the average overall scale score
and for the percentage of students in each achievement level. These results are presented at the
aggregate level (all submitted Consortium data) and disaggregated by gender, by race/ethnicity, and
by various status flags: limited English proficiency, IDEA indicator, Section 504, and economically
disadvantaged.
TABLE 5-6 GRADE 3 ELA/LITERACY AVERAGE OVERALL SCALE SCORE AND PERCENTAGE IN EACH ACHIEVEMENT
LEVEL BY SELECTED DEMOGRAPHIC GROUPS, 2015-2016 ADMINISTRATION
Group Scale Scores Achievement Levels (%)
N M SD 1 2 3 4 3 & 4
Total 835430 2420.1 88.9 29.5 25.1 21.9 23.6 45.5
Female 408061 2429.3 88.0 25.6 25.0 23.0 26.5 49.5
Male 427144 2411.4 88.9 33.2 25.1 20.9 20.8 41.7
American Indian or Alaska Native 11560 2379.2 78.8 46.2 28.1 16.8 8.9 25.7
Asian 9839 2471.2 88.3 13.1 17.9 24.6 44.4 69.0
Black/African American 8653 2400.3 81.4 35.9 27.9 22.1 14.1 36.2
Native Hawaiian or Pacific Islander 2037 2405.6 83.9 33.4 27.3 22.9 16.4 39.3
Hispanic/Latino Ethnicity 317427 2391.7 81.8 40.2 28.3 18.8 12.7 31.5
White 149301 2440.0 85.4 20.7 24.0 25.3 30.0 55.3
Two or More Races 9109 2441.0 86.6 21.1 23.8 24.4 30.7 55.1
Unidentified Race 348272 2436.2 89.6 23.8 22.7 23.2 30.3 53.5
LEP Status 184258 2369.7 74.6 50.7 29.0 14.0 6.3 20.3
IDEA Indicator 70710 2353.9 85.5 61.6 19.7 10.7 8.0 18.7
Section 504 Status 6894 2423.4 86.5 28.0 25.2 22.6 24.2 46.8
Economic Disadvantage Status 450036 2391.2 81.7 40.5 28.1 18.8 12.6 31.4
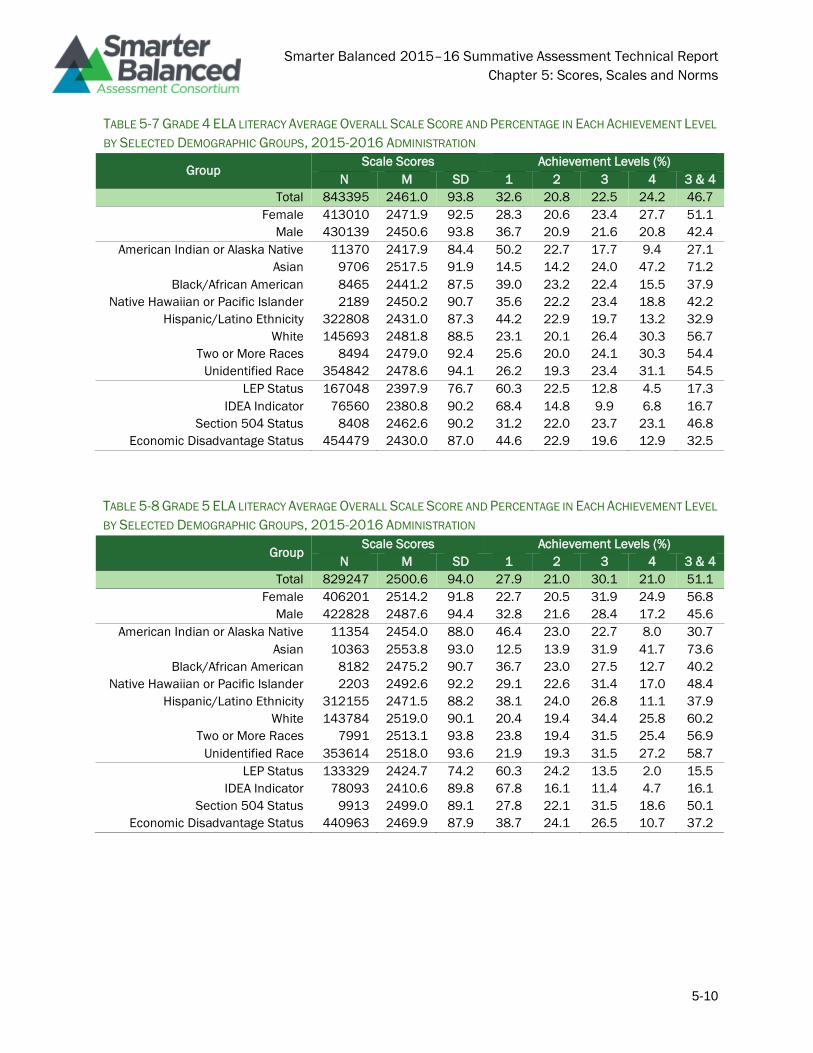
Smarter Balanced 2015–16 Summative Assessment Technical Report
Chapter 5: Scores, Scales and Norms
5-10
TABLE 5-7 GRADE 4 ELA LITERACY AVERAGE OVERALL SCALE SCORE AND PERCENTAGE IN EACH ACHIEVEMENT LEVEL
BY SELECTED DEMOGRAPHIC GROUPS, 2015-2016 ADMINISTRATION
Group Scale Scores Achievement Levels (%)
N M SD 1 2 3 4 3 & 4
Total 843395 2461.0 93.8 32.6 20.8 22.5 24.2 46.7
Female 413010 2471.9 92.5 28.3 20.6 23.4 27.7 51.1
Male 430139 2450.6 93.8 36.7 20.9 21.6 20.8 42.4
American Indian or Alaska Native 11370 2417.9 84.4 50.2 22.7 17.7 9.4 27.1
Asian 9706 2517.5 91.9 14.5 14.2 24.0 47.2 71.2
Black/African American 8465 2441.2 87.5 39.0 23.2 22.4 15.5 37.9
Native Hawaiian or Pacific Islander 2189 2450.2 90.7 35.6 22.2 23.4 18.8 42.2
Hispanic/Latino Ethnicity 322808 2431.0 87.3 44.2 22.9 19.7 13.2 32.9
White 145693 2481.8 88.5 23.1 20.1 26.4 30.3 56.7
Two or More Races 8494 2479.0 92.4 25.6 20.0 24.1 30.3 54.4
Unidentified Race 354842 2478.6 94.1 26.2 19.3 23.4 31.1 54.5
LEP Status 167048 2397.9 76.7 60.3 22.5 12.8 4.5 17.3
IDEA Indicator 76560 2380.8 90.2 68.4 14.8 9.9 6.8 16.7
Section 504 Status 8408 2462.6 90.2 31.2 22.0 23.7 23.1 46.8
Economic Disadvantage Status 454479 2430.0 87.0 44.6 22.9 19.6 12.9 32.5
TABLE 5-8 GRADE 5 ELA LITERACY AVERAGE OVERALL SCALE SCORE AND PERCENTAGE IN EACH ACHIEVEMENT LEVEL
BY SELECTED DEMOGRAPHIC GROUPS, 2015-2016 ADMINISTRATION
Group Scale Scores Achievement Levels (%)
N M SD 1 2 3 4 3 & 4
Total 829247 2500.6 94.0 27.9 21.0 30.1 21.0 51.1
Female 406201 2514.2 91.8 22.7 20.5 31.9 24.9 56.8
Male 422828 2487.6 94.4 32.8 21.6 28.4 17.2 45.6
American Indian or Alaska Native 11354 2454.0 88.0 46.4 23.0 22.7 8.0 30.7
Asian 10363 2553.8 93.0 12.5 13.9 31.9 41.7 73.6
Black/African American 8182 2475.2 90.7 36.7 23.0 27.5 12.7 40.2
Native Hawaiian or Pacific Islander 2203 2492.6 92.2 29.1 22.6 31.4 17.0 48.4
Hispanic/Latino Ethnicity 312155 2471.5 88.2 38.1 24.0 26.8 11.1 37.9
White 143784 2519.0 90.1 20.4 19.4 34.4 25.8 60.2
Two or More Races 7991 2513.1 93.8 23.8 19.4 31.5 25.4 56.9
Unidentified Race 353614 2518.0 93.6 21.9 19.3 31.5 27.2 58.7
LEP Status 133329 2424.7 74.2 60.3 24.2 13.5 2.0 15.5
IDEA Indicator 78093 2410.6 89.8 67.8 16.1 11.4 4.7 16.1
Section 504 Status 9913 2499.0 89.1 27.8 22.1 31.5 18.6 50.1
Economic Disadvantage Status 440963 2469.9 87.9 38.7 24.1 26.5 10.7 37.2

Smarter Balanced 2015–16 Summative Assessment Technical Report
Chapter 5: Scores, Scales and Norms
5-11
TABLE 5-9 GRADE 6 ELA LITERACY AVERAGE OVERALL SCALE SCORE AND PERCENTAGE IN EACH ACHIEVEMENT
LEVEL BY SELECTED DEMOGRAPHIC GROUPS, 2015-2016 ADMINISTRATION
Group Scale Scores Achievement Levels (%)
N M SD 1 2 3 4 3 & 4
Total 824815 2522.2 94.5 25.2 26.5 31.7 16.6 48.3
Female 403351 2536.5 91.5 19.9 25.8 34.2 20.1 54.3
Male 421240 2508.4 95.4 30.2 27.3 29.2 13.3 42.5
American Indian or Alaska Native 11172 2479.9 86.6 40.2 30.7 23.2 5.9 29.1
Asian 10448 2576.0 92.8 10.9 17.0 36.2 35.9 72.1
Black/African American 7896 2498.2 90.3 32.0 30.5 28.5 9.1 37.6
Native Hawaiian or Pacific Islander 2024 2509.4 89.3 28.1 29.2 31.3 11.5 42.8
Hispanic/Latino Ethnicity 302232 2493.9 88.7 33.8 30.9 27.4 8.0 35.4
White 144189 2540.9 88.7 17.4 25.5 37.1 19.9 57.0
Two or More Races 13271 2525.9 91.7 22.6 27.3 33.8 16.3 50.1
Unidentified Race 358275 2537.7 95.3 21.1 23.6 33.2 22.2 55.4
LEP Status 107629 2437.4 75.5 60.2 29.1 9.7 1.0 10.7
IDEA Indicator 74366 2425.4 86.8 66.6 21.6 9.4 2.4 11.8
Section 504 Status 11225 2523.1 87.9 22.9 29.7 32.9 14.5 47.4
Economic Disadvantage Status 429804 2491.8 88.9 35.0 30.5 26.6 7.9 34.5
TABLE 5-10 GRADE 7 ELA LITERACY AVERAGE OVERALL SCALE SCORE AND PERCENTAGE IN EACH ACHIEVEMENT
LEVEL BY SELECTED DEMOGRAPHIC GROUPS, 2015-2016 ADMINISTRATION
Group Scale Scores Achievement Levels (%)
N M SD 1 2 3 4 3 & 4
Total 818921 2545.8 97.8 25.7 24.8 34.0 15.6 49.6
Female 400284 2561.5 94.5 20.0 23.9 37.2 18.9 56.1
Male 418445 2530.8 98.6 31.1 25.6 30.9 12.4 43.3
American Indian or Alaska Native 10984 2503.1 91.7 41.0 27.3 26.2 5.6 31.8
Asian 10431 2605.6 96.4 11.0 14.7 38.5 35.9 74.4
Black/African American 7780 2519.3 94.5 34.2 26.8 30.6 8.5 39.1
Native Hawaiian or Pacific Islander 1907 2530.2 93.5 29.9 26.7 33.8 9.6 43.4
Hispanic/Latino Ethnicity 296186 2514.9 91.5 35.5 28.7 28.6 7.3 35.9
White 142782 2566.6 92.5 17.8 23.0 40.0 19.2 59.2
Two or More Races 12595 2550.0 97.7 24.1 24.4 35.2 16.3 51.5
Unidentified Race 360365 2562.1 98.0 20.8 22.6 36.1 20.5 56.6
LEP Status 88627 2448.0 73.7 67.5 24.0 7.9 0.7 8.6
IDEA Indicator 71425 2446.2 84.5 68.7 19.7 9.6 2.0 11.6
Section 504 Status 12192 2546.8 90.7 23.6 27.7 34.9 13.8 48.7
Economic Disadvantage Status 418645 2513.2 91.9 36.3 28.5 28.0 7.2 35.2
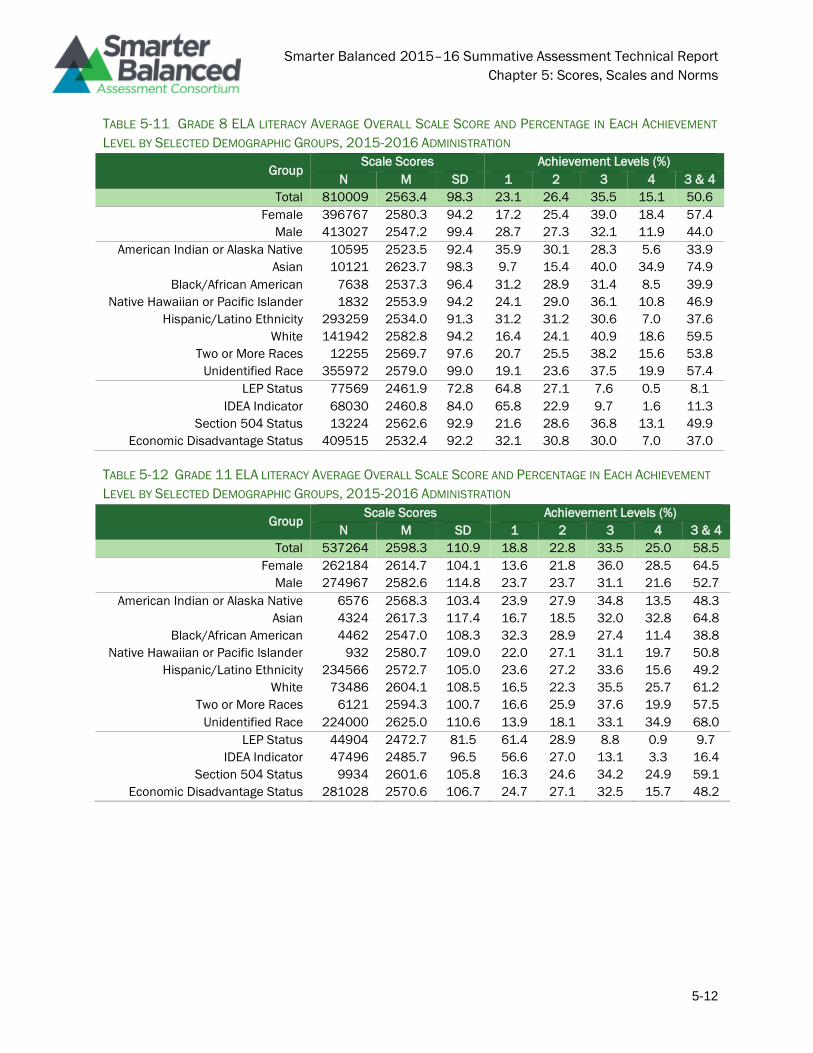
Smarter Balanced 2015–16 Summative Assessment Technical Report
Chapter 5: Scores, Scales and Norms
5-12
TABLE 5-11 GRADE 8 ELA LITERACY AVERAGE OVERALL SCALE SCORE AND PERCENTAGE IN EACH ACHIEVEMENT
LEVEL BY SELECTED DEMOGRAPHIC GROUPS, 2015-2016 ADMINISTRATION
Group Scale Scores Achievement Levels (%)
N M SD 1 2 3 4 3 & 4
Total 810009 2563.4 98.3 23.1 26.4 35.5 15.1 50.6
Female 396767 2580.3 94.2 17.2 25.4 39.0 18.4 57.4
Male 413027 2547.2 99.4 28.7 27.3 32.1 11.9 44.0
American Indian or Alaska Native 10595 2523.5 92.4 35.9 30.1 28.3 5.6 33.9
Asian 10121 2623.7 98.3 9.7 15.4 40.0 34.9 74.9
Black/African American 7638 2537.3 96.4 31.2 28.9 31.4 8.5 39.9
Native Hawaiian or Pacific Islander 1832 2553.9 94.2 24.1 29.0 36.1 10.8 46.9
Hispanic/Latino Ethnicity 293259 2534.0 91.3 31.2 31.2 30.6 7.0 37.6
White 141942 2582.8 94.2 16.4 24.1 40.9 18.6 59.5
Two or More Races 12255 2569.7 97.6 20.7 25.5 38.2 15.6 53.8
Unidentified Race 355972 2579.0 99.0 19.1 23.6 37.5 19.9 57.4
LEP Status 77569 2461.9 72.8 64.8 27.1 7.6 0.5 8.1
IDEA Indicator 68030 2460.8 84.0 65.8 22.9 9.7 1.6 11.3
Section 504 Status 13224 2562.6 92.9 21.6 28.6 36.8 13.1 49.9
Economic Disadvantage Status 409515 2532.4 92.2 32.1 30.8 30.0 7.0 37.0
TABLE 5-12 GRADE 11 ELA LITERACY AVERAGE OVERALL SCALE SCORE AND PERCENTAGE IN EACH ACHIEVEMENT
LEVEL BY SELECTED DEMOGRAPHIC GROUPS, 2015-2016 ADMINISTRATION
Group Scale Scores Achievement Levels (%)
N M SD 1 2 3 4 3 & 4
Total 537264 2598.3 110.9 18.8 22.8 33.5 25.0 58.5
Female 262184 2614.7 104.1 13.6 21.8 36.0 28.5 64.5
Male 274967 2582.6 114.8 23.7 23.7 31.1 21.6 52.7
American Indian or Alaska Native 6576 2568.3 103.4 23.9 27.9 34.8 13.5 48.3
Asian 4324 2617.3 117.4 16.7 18.5 32.0 32.8 64.8
Black/African American 4462 2547.0 108.3 32.3 28.9 27.4 11.4 38.8
Native Hawaiian or Pacific Islander 932 2580.7 109.0 22.0 27.1 31.1 19.7 50.8
Hispanic/Latino Ethnicity 234566 2572.7 105.0 23.6 27.2 33.6 15.6 49.2
White 73486 2604.1 108.5 16.5 22.3 35.5 25.7 61.2
Two or More Races 6121 2594.3 100.7 16.6 25.9 37.6 19.9 57.5
Unidentified Race 224000 2625.0 110.6 13.9 18.1 33.1 34.9 68.0
LEP Status 44904 2472.7 81.5 61.4 28.9 8.8 0.9 9.7
IDEA Indicator 47496 2485.7 96.5 56.6 27.0 13.1 3.3 16.4
Section 504 Status 9934 2601.6 105.8 16.3 24.6 34.2 24.9 59.1
Economic Disadvantage Status 281028 2570.6 106.7 24.7 27.1 32.5 15.7 48.2
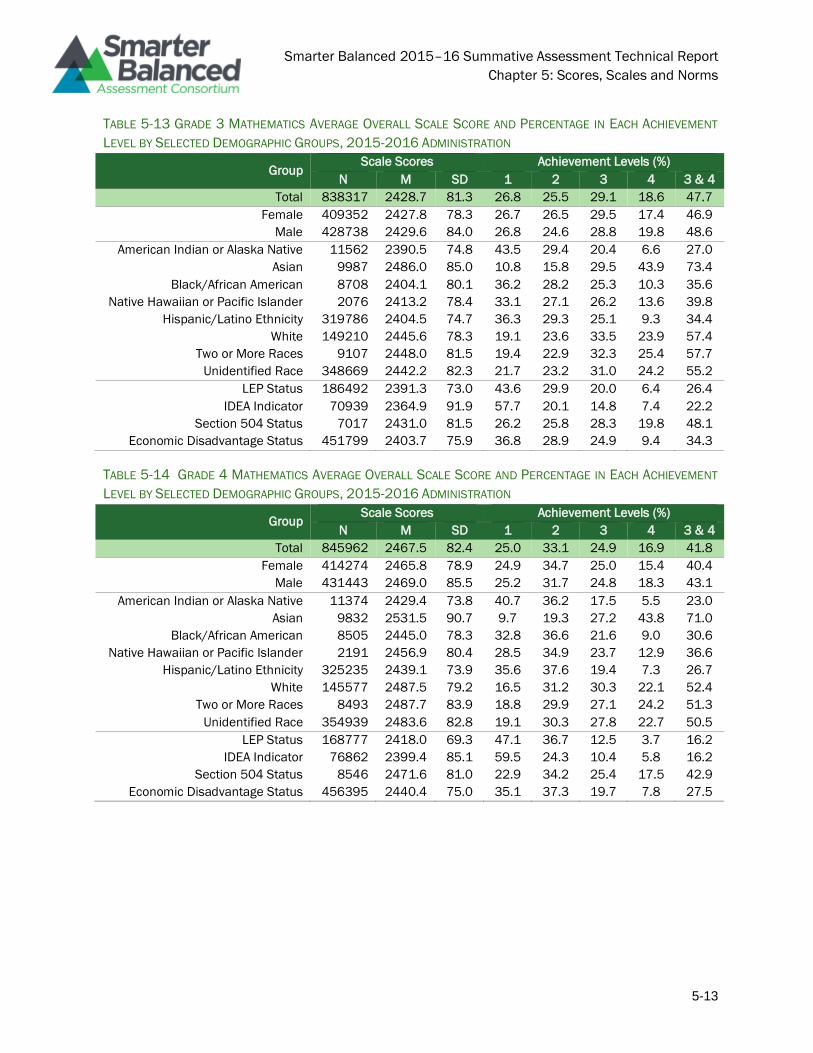
Smarter Balanced 2015–16 Summative Assessment Technical Report
Chapter 5: Scores, Scales and Norms
5-13
TABLE 5-13 GRADE 3 MATHEMATICS AVERAGE OVERALL SCALE SCORE AND PERCENTAGE IN EACH ACHIEVEMENT
LEVEL BY SELECTED DEMOGRAPHIC GROUPS, 2015-2016 ADMINISTRATION
Group Scale Scores Achievement Levels (%)
N M SD 1 2 3 4 3 & 4
Total 838317 2428.7 81.3 26.8 25.5 29.1 18.6 47.7
Female 409352 2427.8 78.3 26.7 26.5 29.5 17.4 46.9
Male 428738 2429.6 84.0 26.8 24.6 28.8 19.8 48.6
American Indian or Alaska Native 11562 2390.5 74.8 43.5 29.4 20.4 6.6 27.0
Asian 9987 2486.0 85.0 10.8 15.8 29.5 43.9 73.4
Black/African American 8708 2404.1 80.1 36.2 28.2 25.3 10.3 35.6
Native Hawaiian or Pacific Islander 2076 2413.2 78.4 33.1 27.1 26.2 13.6 39.8
Hispanic/Latino Ethnicity 319786 2404.5 74.7 36.3 29.3 25.1 9.3 34.4
White 149210 2445.6 78.3 19.1 23.6 33.5 23.9 57.4
Two or More Races 9107 2448.0 81.5 19.4 22.9 32.3 25.4 57.7
Unidentified Race 348669 2442.2 82.3 21.7 23.2 31.0 24.2 55.2
LEP Status 186492 2391.3 73.0 43.6 29.9 20.0 6.4 26.4
IDEA Indicator 70939 2364.9 91.9 57.7 20.1 14.8 7.4 22.2
Section 504 Status 7017 2431.0 81.5 26.2 25.8 28.3 19.8 48.1
Economic Disadvantage Status 451799 2403.7 75.9 36.8 28.9 24.9 9.4 34.3
TABLE 5-14 GRADE 4 MATHEMATICS AVERAGE OVERALL SCALE SCORE AND PERCENTAGE IN EACH ACHIEVEMENT
LEVEL BY SELECTED DEMOGRAPHIC GROUPS, 2015-2016 ADMINISTRATION
Group Scale Scores Achievement Levels (%)
N M SD 1 2 3 4 3 & 4
Total 845962 2467.5 82.4 25.0 33.1 24.9 16.9 41.8
Female 414274 2465.8 78.9 24.9 34.7 25.0 15.4 40.4
Male 431443 2469.0 85.5 25.2 31.7 24.8 18.3 43.1
American Indian or Alaska Native 11374 2429.4 73.8 40.7 36.2 17.5 5.5 23.0
Asian 9832 2531.5 90.7 9.7 19.3 27.2 43.8 71.0
Black/African American 8505 2445.0 78.3 32.8 36.6 21.6 9.0 30.6
Native Hawaiian or Pacific Islander 2191 2456.9 80.4 28.5 34.9 23.7 12.9 36.6
Hispanic/Latino Ethnicity 325235 2439.1 73.9 35.6 37.6 19.4 7.3 26.7
White 145577 2487.5 79.2 16.5 31.2 30.3 22.1 52.4
Two or More Races 8493 2487.7 83.9 18.8 29.9 27.1 24.2 51.3
Unidentified Race 354939 2483.6 82.8 19.1 30.3 27.8 22.7 50.5
LEP Status 168777 2418.0 69.3 47.1 36.7 12.5 3.7 16.2
IDEA Indicator 76862 2399.4 85.1 59.5 24.3 10.4 5.8 16.2
Section 504 Status 8546 2471.6 81.0 22.9 34.2 25.4 17.5 42.9
Economic Disadvantage Status 456395 2440.4 75.0 35.1 37.3 19.7 7.8 27.5
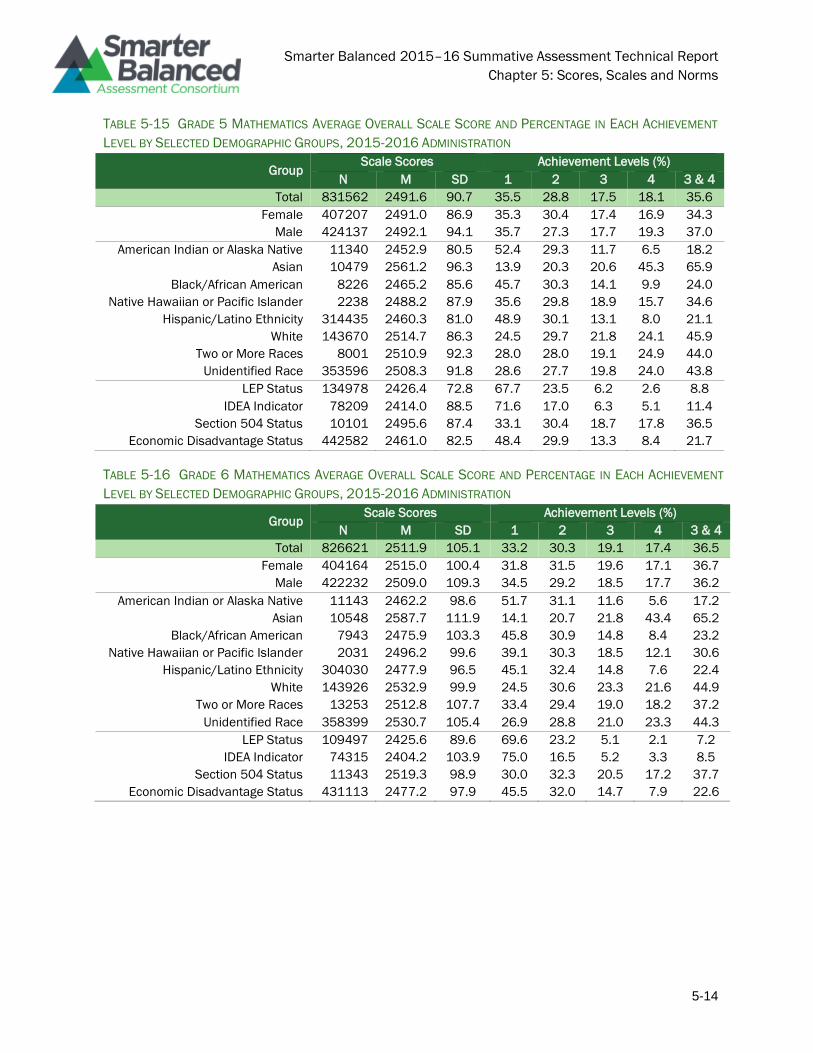
Smarter Balanced 2015–16 Summative Assessment Technical Report
Chapter 5: Scores, Scales and Norms
5-14
TABLE 5-15 GRADE 5 MATHEMATICS AVERAGE OVERALL SCALE SCORE AND PERCENTAGE IN EACH ACHIEVEMENT
LEVEL BY SELECTED DEMOGRAPHIC GROUPS, 2015-2016 ADMINISTRATION
Group Scale Scores Achievement Levels (%)
N M SD 1 2 3 4 3 & 4
Total 831562 2491.6 90.7 35.5 28.8 17.5 18.1 35.6
Female 407207 2491.0 86.9 35.3 30.4 17.4 16.9 34.3
Male 424137 2492.1 94.1 35.7 27.3 17.7 19.3 37.0
American Indian or Alaska Native 11340 2452.9 80.5 52.4 29.3 11.7 6.5 18.2
Asian 10479 2561.2 96.3 13.9 20.3 20.6 45.3 65.9
Black/African American 8226 2465.2 85.6 45.7 30.3 14.1 9.9 24.0
Native Hawaiian or Pacific Islander 2238 2488.2 87.9 35.6 29.8 18.9 15.7 34.6
Hispanic/Latino Ethnicity 314435 2460.3 81.0 48.9 30.1 13.1 8.0 21.1
White 143670 2514.7 86.3 24.5 29.7 21.8 24.1 45.9
Two or More Races 8001 2510.9 92.3 28.0 28.0 19.1 24.9 44.0
Unidentified Race 353596 2508.3 91.8 28.6 27.7 19.8 24.0 43.8
LEP Status 134978 2426.4 72.8 67.7 23.5 6.2 2.6 8.8
IDEA Indicator 78209 2414.0 88.5 71.6 17.0 6.3 5.1 11.4
Section 504 Status 10101 2495.6 87.4 33.1 30.4 18.7 17.8 36.5
Economic Disadvantage Status 442582 2461.0 82.5 48.4 29.9 13.3 8.4 21.7
TABLE 5-16 GRADE 6 MATHEMATICS AVERAGE OVERALL SCALE SCORE AND PERCENTAGE IN EACH ACHIEVEMENT
LEVEL BY SELECTED DEMOGRAPHIC GROUPS, 2015-2016 ADMINISTRATION
Group Scale Scores Achievement Levels (%)
N M SD 1 2 3 4 3 & 4
Total 826621 2511.9 105.1 33.2 30.3 19.1 17.4 36.5
Female 404164 2515.0 100.4 31.8 31.5 19.6 17.1 36.7
Male 422232 2509.0 109.3 34.5 29.2 18.5 17.7 36.2
American Indian or Alaska Native 11143 2462.2 98.6 51.7 31.1 11.6 5.6 17.2
Asian 10548 2587.7 111.9 14.1 20.7 21.8 43.4 65.2
Black/African American 7943 2475.9 103.3 45.8 30.9 14.8 8.4 23.2
Native Hawaiian or Pacific Islander 2031 2496.2 99.6 39.1 30.3 18.5 12.1 30.6
Hispanic/Latino Ethnicity 304030 2477.9 96.5 45.1 32.4 14.8 7.6 22.4
White 143926 2532.9 99.9 24.5 30.6 23.3 21.6 44.9
Two or More Races 13253 2512.8 107.7 33.4 29.4 19.0 18.2 37.2
Unidentified Race 358399 2530.7 105.4 26.9 28.8 21.0 23.3 44.3
LEP Status 109497 2425.6 89.6 69.6 23.2 5.1 2.1 7.2
IDEA Indicator 74315 2404.2 103.9 75.0 16.5 5.2 3.3 8.5
Section 504 Status 11343 2519.3 98.9 30.0 32.3 20.5 17.2 37.7
Economic Disadvantage Status 431113 2477.2 97.9 45.5 32.0 14.7 7.9 22.6
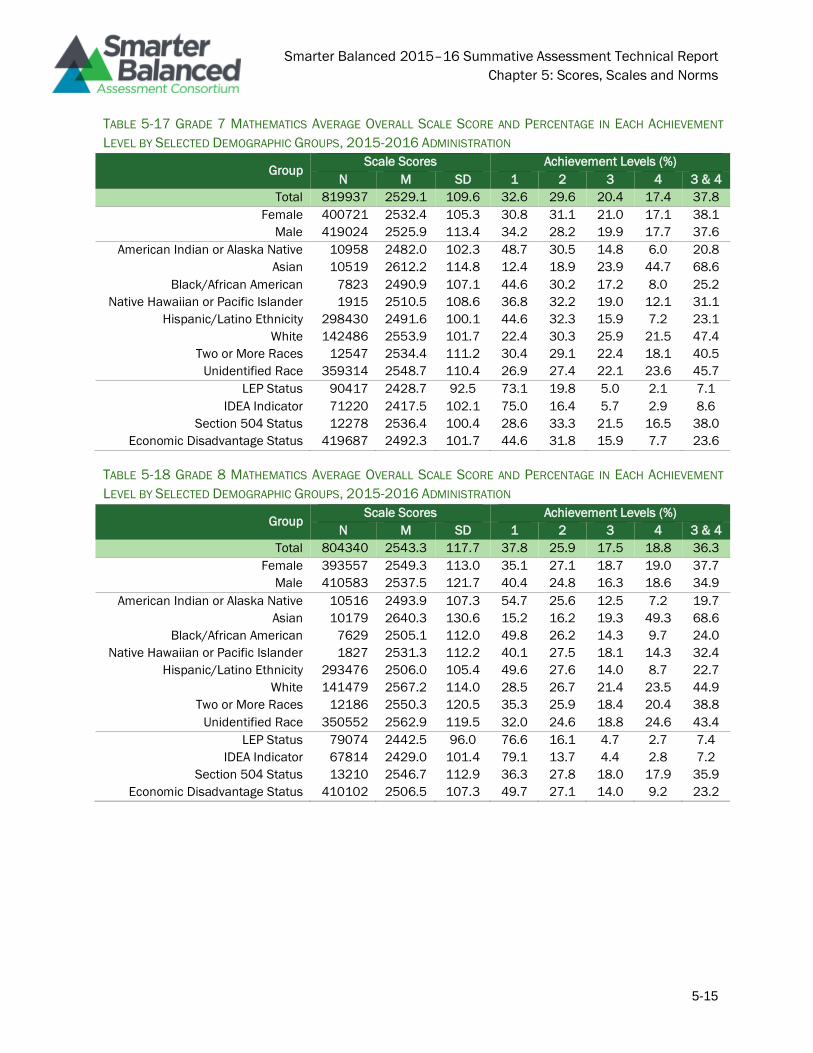
Smarter Balanced 2015–16 Summative Assessment Technical Report
Chapter 5: Scores, Scales and Norms
5-15
TABLE 5-17 GRADE 7 MATHEMATICS AVERAGE OVERALL SCALE SCORE AND PERCENTAGE IN EACH ACHIEVEMENT
LEVEL BY SELECTED DEMOGRAPHIC GROUPS, 2015-2016 ADMINISTRATION
Group Scale Scores Achievement Levels (%)
N M SD 1 2 3 4 3 & 4
Total 819937 2529.1 109.6 32.6 29.6 20.4 17.4 37.8
Female 400721 2532.4 105.3 30.8 31.1 21.0 17.1 38.1
Male 419024 2525.9 113.4 34.2 28.2 19.9 17.7 37.6
American Indian or Alaska Native 10958 2482.0 102.3 48.7 30.5 14.8 6.0 20.8
Asian 10519 2612.2 114.8 12.4 18.9 23.9 44.7 68.6
Black/African American 7823 2490.9 107.1 44.6 30.2 17.2 8.0 25.2
Native Hawaiian or Pacific Islander 1915 2510.5 108.6 36.8 32.2 19.0 12.1 31.1
Hispanic/Latino Ethnicity 298430 2491.6 100.1 44.6 32.3 15.9 7.2 23.1
White 142486 2553.9 101.7 22.4 30.3 25.9 21.5 47.4
Two or More Races 12547 2534.4 111.2 30.4 29.1 22.4 18.1 40.5
Unidentified Race 359314 2548.7 110.4 26.9 27.4 22.1 23.6 45.7
LEP Status 90417 2428.7 92.5 73.1 19.8 5.0 2.1 7.1
IDEA Indicator 71220 2417.5 102.1 75.0 16.4 5.7 2.9 8.6
Section 504 Status 12278 2536.4 100.4 28.6 33.3 21.5 16.5 38.0
Economic Disadvantage Status 419687 2492.3 101.7 44.6 31.8 15.9 7.7 23.6
TABLE 5-18 GRADE 8 MATHEMATICS AVERAGE OVERALL SCALE SCORE AND PERCENTAGE IN EACH ACHIEVEMENT
LEVEL BY SELECTED DEMOGRAPHIC GROUPS, 2015-2016 ADMINISTRATION
Group Scale Scores Achievement Levels (%)
N M SD 1 2 3 4 3 & 4
Total 804340 2543.3 117.7 37.8 25.9 17.5 18.8 36.3
Female 393557 2549.3 113.0 35.1 27.1 18.7 19.0 37.7
Male 410583 2537.5 121.7 40.4 24.8 16.3 18.6 34.9
American Indian or Alaska Native 10516 2493.9 107.3 54.7 25.6 12.5 7.2 19.7
Asian 10179 2640.3 130.6 15.2 16.2 19.3 49.3 68.6
Black/African American 7629 2505.1 112.0 49.8 26.2 14.3 9.7 24.0
Native Hawaiian or Pacific Islander 1827 2531.3 112.2 40.1 27.5 18.1 14.3 32.4
Hispanic/Latino Ethnicity 293476 2506.0 105.4 49.6 27.6 14.0 8.7 22.7
White 141479 2567.2 114.0 28.5 26.7 21.4 23.5 44.9
Two or More Races 12186 2550.3 120.5 35.3 25.9 18.4 20.4 38.8
Unidentified Race 350552 2562.9 119.5 32.0 24.6 18.8 24.6 43.4
LEP Status 79074 2442.5 96.0 76.6 16.1 4.7 2.7 7.4
IDEA Indicator 67814 2429.0 101.4 79.1 13.7 4.4 2.8 7.2
Section 504 Status 13210 2546.7 112.9 36.3 27.8 18.0 17.9 35.9
Economic Disadvantage Status 410102 2506.5 107.3 49.7 27.1 14.0 9.2 23.2
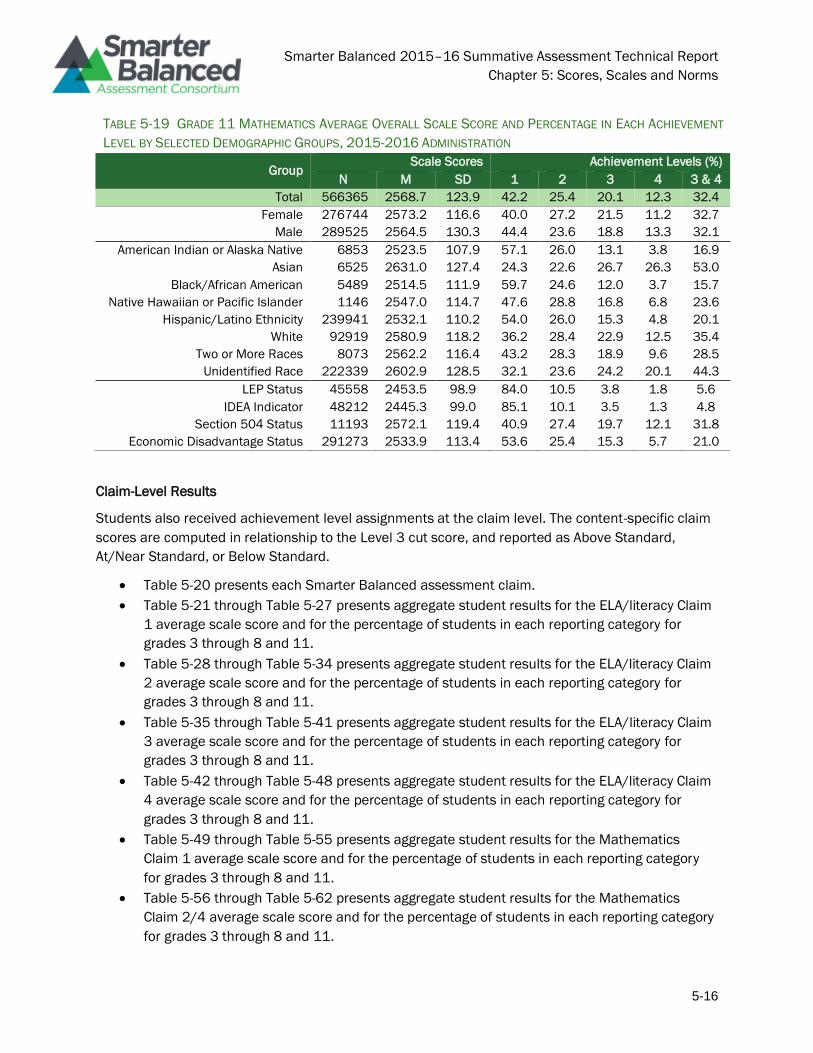
Smarter Balanced 2015–16 Summative Assessment Technical Report
Chapter 5: Scores, Scales and Norms
5-16
TABLE 5-19 GRADE 11 MATHEMATICS AVERAGE OVERALL SCALE SCORE AND PERCENTAGE IN EACH ACHIEVEMENT
LEVEL BY SELECTED DEMOGRAPHIC GROUPS, 2015-2016 ADMINISTRATION
Group Scale Scores Achievement Levels (%)
N M SD 1 2 3 4 3 & 4
Total 566365 2568.7 123.9 42.2 25.4 20.1 12.3 32.4
Female 276744 2573.2 116.6 40.0 27.2 21.5 11.2 32.7
Male 289525 2564.5 130.3 44.4 23.6 18.8 13.3 32.1
American Indian or Alaska Native 6853 2523.5 107.9 57.1 26.0 13.1 3.8 16.9
Asian 6525 2631.0 127.4 24.3 22.6 26.7 26.3 53.0
Black/African American 5489 2514.5 111.9 59.7 24.6 12.0 3.7 15.7
Native Hawaiian or Pacific Islander 1146 2547.0 114.7 47.6 28.8 16.8 6.8 23.6
Hispanic/Latino Ethnicity 239941 2532.1 110.2 54.0 26.0 15.3 4.8 20.1
White 92919 2580.9 118.2 36.2 28.4 22.9 12.5 35.4
Two or More Races 8073 2562.2 116.4 43.2 28.3 18.9 9.6 28.5
Unidentified Race 222339 2602.9 128.5 32.1 23.6 24.2 20.1 44.3
LEP Status 45558 2453.5 98.9 84.0 10.5 3.8 1.8 5.6
IDEA Indicator 48212 2445.3 99.0 85.1 10.1 3.5 1.3 4.8
Section 504 Status 11193 2572.1 119.4 40.9 27.4 19.7 12.1 31.8
Economic Disadvantage Status 291273 2533.9 113.4 53.6 25.4 15.3 5.7 21.0
Claim-Level Results
Students also received achievement level assignments at the claim level. The content-specific claim
scores are computed in relationship to the Level 3 cut score, and reported as Above Standard,
At/Near Standard, or Below Standard.
• Table 5-20 presents each Smarter Balanced assessment claim.
• Table 5-21 through Table 5-27 presents aggregate student results for the ELA/literacy Claim
1 average scale score and for the percentage of students in each reporting category for
grades 3 through 8 and 11.
• Table 5-28 through Table 5-34 presents aggregate student results for the ELA/literacy Claim
2 average scale score and for the percentage of students in each reporting category for
grades 3 through 8 and 11.
• Table 5-35 through Table 5-41 presents aggregate student results for the ELA/literacy Claim
3 average scale score and for the percentage of students in each reporting category for
grades 3 through 8 and 11.
• Table 5-42 through Table 5-48 presents aggregate student results for the ELA/literacy Claim
4 average scale score and for the percentage of students in each reporting category for
grades 3 through 8 and 11.
• Table 5-49 through Table 5-55 presents aggregate student results for the Mathematics
Claim 1 average scale score and for the percentage of students in each reporting category
for grades 3 through 8 and 11.
• Table 5-56 through Table 5-62 presents aggregate student results for the Mathematics
Claim 2/4 average scale score and for the percentage of students in each reporting category
for grades 3 through 8 and 11.
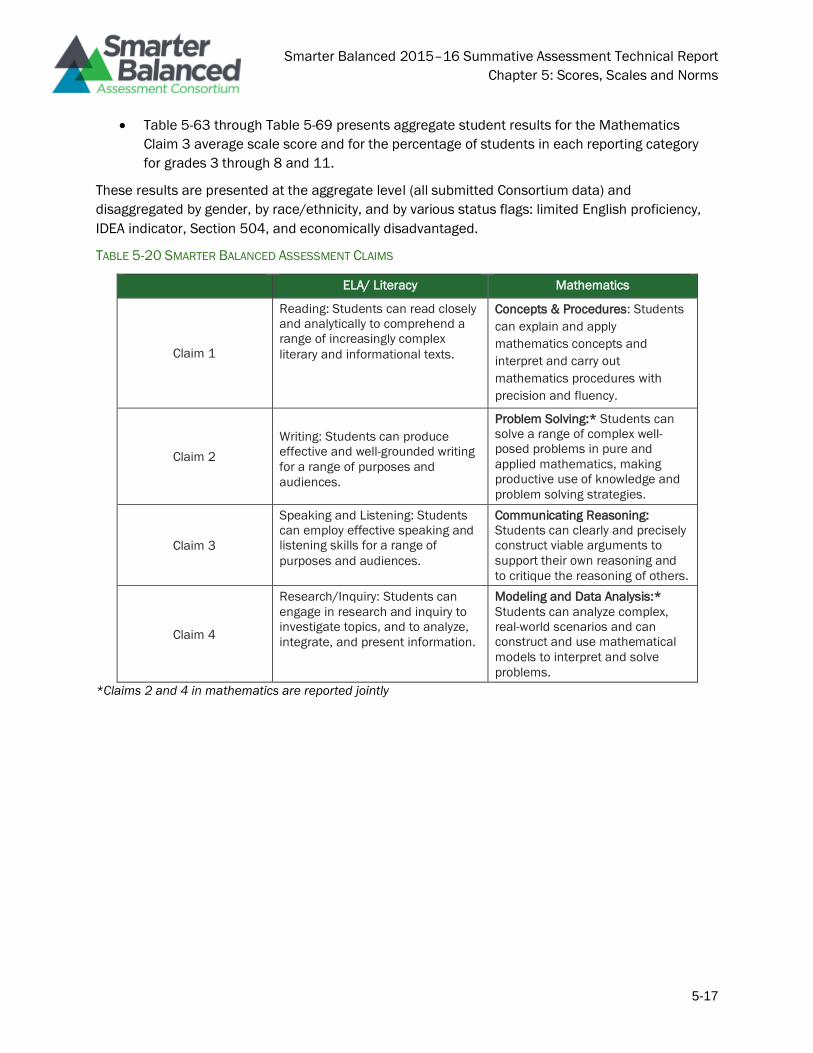
Smarter Balanced 2015–16 Summative Assessment Technical Report
Chapter 5: Scores, Scales and Norms
5-17
• Table 5-63 through Table 5-69 presents aggregate student results for the Mathematics
Claim 3 average scale score and for the percentage of students in each reporting category
for grades 3 through 8 and 11.
These results are presented at the aggregate level (all submitted Consortium data) and
disaggregated by gender, by race/ethnicity, and by various status flags: limited English proficiency,
IDEA indicator, Section 504, and economically disadvantaged.
TABLE 5-20 SMARTER BALANCED ASSESSMENT CLAIMS
ELA/ Literacy Mathematics
Claim 1
Reading: Students can read closely
and analytically to comprehend a
range of increasingly complex
literary and informational texts.
Concepts & Procedures: Students
can explain and apply
mathematics concepts and
interpret and carry out
mathematics procedures with
precision and fluency.
Claim 2
Writing: Students can produce
effective and well-grounded writing
for a range of purposes and
audiences.
Problem Solving:* Students can
solve a range of complex well-
posed problems in pure and
applied mathematics, making
productive use of knowledge and
problem solving strategies.
Claim 3
Speaking and Listening: Students
can employ effective speaking and
listening skills for a range of
purposes and audiences.
Communicating Reasoning:
Students can clearly and precisely
construct viable arguments to
support their own reasoning and
to critique the reasoning of others.
Claim 4
Research/Inquiry: Students can
engage in research and inquiry to
investigate topics, and to analyze,
integrate, and present information.
Modeling and Data Analysis:*
Students can analyze complex,
real-world scenarios and can
construct and use mathematical
models to interpret and solve
problems.
*Claims 2 and 4 in mathematics are reported jointly
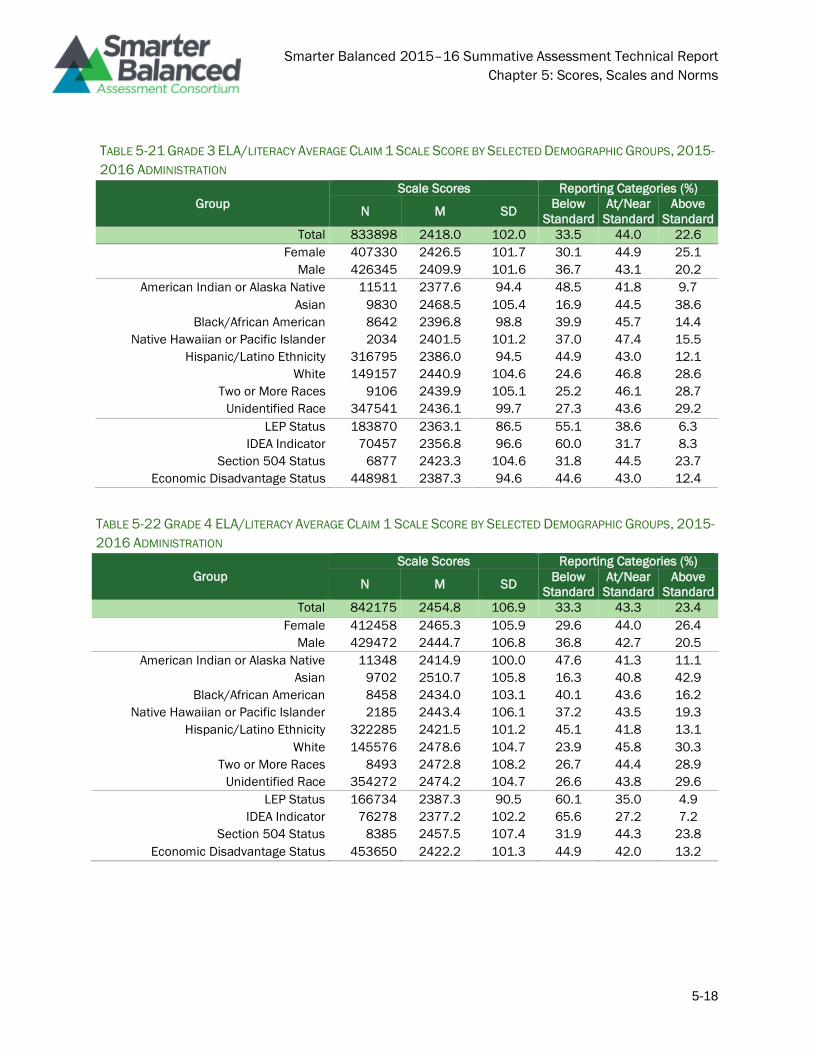
Smarter Balanced 2015–16 Summative Assessment Technical Report
Chapter 5: Scores, Scales and Norms
5-18
TABLE 5-21 GRADE 3 ELA/LITERACY AVERAGE CLAIM 1 SCALE SCORE BY SELECTED DEMOGRAPHIC GROUPS, 2015-
2016 ADMINISTRATION
Group
Scale Scores Reporting Categories (%)
N M SD Below
Standard
At/Near
Standard
Above
Standard
Total 833898 2418.0 102.0 33.5 44.0 22.6
Female 407330 2426.5 101.7 30.1 44.9 25.1
Male 426345 2409.9 101.6 36.7 43.1 20.2
American Indian or Alaska Native 11511 2377.6 94.4 48.5 41.8 9.7
Asian 9830 2468.5 105.4 16.9 44.5 38.6
Black/African American 8642 2396.8 98.8 39.9 45.7 14.4
Native Hawaiian or Pacific Islander 2034 2401.5 101.2 37.0 47.4 15.5
Hispanic/Latino Ethnicity 316795 2386.0 94.5 44.9 43.0 12.1
White 149157 2440.9 104.6 24.6 46.8 28.6
Two or More Races 9106 2439.9 105.1 25.2 46.1 28.7
Unidentified Race 347541 2436.1 99.7 27.3 43.6 29.2
LEP Status 183870 2363.1 86.5 55.1 38.6 6.3
IDEA Indicator 70457 2356.8 96.6 60.0 31.7 8.3
Section 504 Status 6877 2423.3 104.6 31.8 44.5 23.7
Economic Disadvantage Status 448981 2387.3 94.6 44.6 43.0 12.4
TABLE 5-22 GRADE 4 ELA/LITERACY AVERAGE CLAIM 1 SCALE SCORE BY SELECTED DEMOGRAPHIC GROUPS, 2015-
2016 ADMINISTRATION
Group
Scale Scores Reporting Categories (%)
N M SD Below
Standard
At/Near
Standard
Above
Standard
Total 842175 2454.8 106.9 33.3 43.3 23.4
Female 412458 2465.3 105.9 29.6 44.0 26.4
Male 429472 2444.7 106.8 36.8 42.7 20.5
American Indian or Alaska Native 11348 2414.9 100.0 47.6 41.3 11.1
Asian 9702 2510.7 105.8 16.3 40.8 42.9
Black/African American 8458 2434.0 103.1 40.1 43.6 16.2
Native Hawaiian or Pacific Islander 2185 2443.4 106.1 37.2 43.5 19.3
Hispanic/Latino Ethnicity 322285 2421.5 101.2 45.1 41.8 13.1
White 145576 2478.6 104.7 23.9 45.8 30.3
Two or More Races 8493 2472.8 108.2 26.7 44.4 28.9
Unidentified Race 354272 2474.2 104.7 26.6 43.8 29.6
LEP Status 166734 2387.3 90.5 60.1 35.0 4.9
IDEA Indicator 76278 2377.2 102.2 65.6 27.2 7.2
Section 504 Status 8385 2457.5 107.4 31.9 44.3 23.8
Economic Disadvantage Status 453650 2422.2 101.3 44.9 42.0 13.2

Smarter Balanced 2015–16 Summative Assessment Technical Report
Chapter 5: Scores, Scales and Norms
5-19
TABLE 5-23 GRADE 5 ELA/LITERACY AVERAGE CLAIM 1 SCALE SCORE BY SELECTED DEMOGRAPHIC GROUPS, 2015-
2016 ADMINISTRATION
Group
Scale Scores Reporting Categories (%)
N M SD Below
Standard
At/Near
Standard
Above
Standard
Total 828263 2489.4 108.1 32.1 43.4 24.5
Female 405734 2502.4 106.1 27.3 44.6 28.1
Male 422311 2476.8 108.6 36.7 42.2 21.1
American Indian or Alaska Native 11333 2445.8 108.3 47.1 40.6 12.3
Asian 10361 2543.4 109.4 15.9 40.9 43.2
Black/African American 8171 2462.9 112.2 40.6 41.6 17.7
Native Hawaiian or Pacific Islander 2202 2482.5 112.9 33.8 43.7 22.5
Hispanic/Latino Ethnicity 311729 2456.3 102.0 43.4 42.8 13.8
White 143703 2511.4 110.0 23.8 45.0 31.3
Two or More Races 7987 2501.3 114.8 27.7 43.6 28.7
Unidentified Race 353163 2508.9 104.5 25.7 43.5 30.8
LEP Status 133120 2409.7 88.1 64.1 32.3 3.6
IDEA Indicator 77867 2405.4 101.6 66.7 26.6 6.6
Section 504 Status 9896 2487.6 108.0 32.0 44.5 23.5
Economic Disadvantage Status 440329 2457.0 102.6 43.2 42.7 14.1
TABLE 5-24 GRADE 6 ELA/LITERACY AVERAGE CLAIM 1 SCALE SCORE BY SELECTED DEMOGRAPHIC GROUPS, 2015-
2016 ADMINISTRATION
Group
Scale Scores Reporting Categories (%)
N M SD Below
Standard
At/Near
Standard
Above
Standard
Total 823204 2499.7 115.6 33.4 47.7 18.9
Female 402652 2511.2 112.3 29.0 50.1 20.9
Male 420330 2488.8 117.5 37.6 45.4 17.0
American Indian or Alaska Native 11135 2455.5 113.2 48.1 43.3 8.6
Asian 10439 2555.3 117.4 17.4 47.4 35.2
Black/African American 7887 2467.3 119.8 43.1 45.2 11.7
Native Hawaiian or Pacific Islander 2022 2481.0 119.8 39.1 46.6 14.3
Hispanic/Latino Ethnicity 301554 2464.6 108.6 44.7 45.7 9.6
White 144063 2520.7 116.5 25.7 50.5 23.8
Two or More Races 13252 2503.0 118.8 31.5 49.3 19.2
Unidentified Race 357505 2520.4 112.8 27.0 48.6 24.4
LEP Status 107317 2406.6 93.6 69.0 29.3 1.7
IDEA Indicator 74035 2404.3 105.6 69.5 26.7 3.7
Section 504 Status 11192 2501.3 114.1 31.9 49.7 18.4
Economic Disadvantage Status 428782 2465.6 109.9 44.5 45.3 10.2

Smarter Balanced 2015–16 Summative Assessment Technical Report
Chapter 5: Scores, Scales and Norms
5-20
TABLE 5-25 GRADE 7 ELA/LITERACY AVERAGE CLAIM 1 SCALE SCORE BY SELECTED DEMOGRAPHIC GROUPS, 2015-
2016 ADMINISTRATION
Group
Scale Scores Reporting Categories (%)
N M SD Below
Standard
At/Near
Standard
Above
Standard
Total 816899 2537.3 113.5 29.5 47.0 23.5
Female 399342 2551.1 110.4 24.6 48.8 26.7
Male 417365 2524.1 114.8 34.3 45.3 20.4
American Indian or Alaska Native 10926 2493.1 111.5 44.0 44.2 11.8
Asian 10424 2595.8 118.5 15.1 43.2 41.8
Black/African American 7759 2504.8 117.2 39.0 46.1 14.9
Native Hawaiian or Pacific Islander 1898 2514.1 116.1 35.7 47.9 16.4
Hispanic/Latino Ethnicity 295203 2500.9 107.2 41.2 45.7 13.1
White 142617 2558.8 115.6 22.3 48.8 28.9
Two or More Races 12573 2540.2 118.6 27.7 48.6 23.7
Unidentified Race 359550 2558.0 109.1 22.9 47.7 29.5
LEP Status 88261 2435.5 87.0 68.9 29.1 2.0
IDEA Indicator 71031 2439.3 100.0 67.2 28.2 4.5
Section 504 Status 12152 2538.7 112.3 28.2 49.5 22.3
Economic Disadvantage Status 417275 2501.9 107.6 40.7 46.0 13.3
TABLE 5-26 GRADE 8 ELA/LITERACY AVERAGE CLAIM 1 SCALE SCORE BY SELECTED DEMOGRAPHIC GROUPS, 2015-
2016 ADMINISTRATION
Group
Scale Scores Reporting Categories (%)
N M SD Below
Standard
At/Near
Standard
Above
Standard
Total 807779 2559.7 109.9 28.0 45.8 26.3
Female 395734 2572.9 106.7 23.3 47.1 29.6
Male 411850 2547.1 111.5 32.4 44.5 23.1
American Indian or Alaska Native 10521 2519.9 108.4 40.6 44.7 14.7
Asian 10108 2615.8 111.2 13.6 40.4 46.0
Black/African American 7621 2529.7 110.6 37.3 45.2 17.5
Native Hawaiian or Pacific Islander 1830 2546.2 108.8 29.9 49.1 21.0
Hispanic/Latino Ethnicity 292181 2526.5 103.3 38.0 46.8 15.2
White 141759 2579.5 108.2 21.1 46.4 32.5
Two or More Races 12222 2565.1 111.4 25.5 47.1 27.4
Unidentified Race 355049 2578.6 108.6 22.4 45.1 32.5
LEP Status 77164 2456.2 85.6 68.2 29.8 2.0
IDEA Indicator 67598 2460.2 97.5 66.4 28.8 4.8
Section 504 Status 13168 2559.1 107.3 27.5 47.1 25.4
Economic Disadvantage Status 408082 2527.6 104.9 37.9 46.2 15.9

Smarter Balanced 2015–16 Summative Assessment Technical Report
Chapter 5: Scores, Scales and Norms
5-21
TABLE 5-27 GRADE 11 ELA/LITERACY AVERAGE CLAIM 1 SCALE SCORE BY SELECTED DEMOGRAPHIC GROUPS,
2015-2016 ADMINISTRATION
Group
Scale Scores Reporting Categories (%)
N M SD Below
Standard
At/Near
Standard
Above
Standard
Total 534185 2591.1 119.2 19.9 51.1 29.0
Female 260785 2601.5 114.2 16.4 52.6 31.0
Male 273301 2581.2 123.0 23.3 49.7 27.0
American Indian or Alaska Native 6513 2567.0 119.9 24.6 54.7 20.7
Asian 4306 2607.6 135.7 19.2 45.8 35.0
Black/African American 4440 2543.4 127.0 32.3 50.3 17.3
Native Hawaiian or Pacific Islander 926 2569.1 130.1 24.7 51.0 24.3
Hispanic/Latino Ethnicity 232927 2564.3 112.5 25.1 55.4 19.5
White 73263 2604.3 125.7 17.3 49.6 33.1
Two or More Races 6088 2588.8 119.0 18.6 54.7 26.7
Unidentified Race 222827 2616.7 116.7 14.8 47.2 37.9
LEP Status 44433 2469.3 92.4 58.4 39.8 1.8
IDEA Indicator 46916 2491.9 109.5 50.9 42.4 6.7
Section 504 Status 9848 2602.6 116.3 16.9 51.2 32.0
Economic Disadvantage Status 279054 2563.3 114.4 25.8 54.6 19.7
TABLE 5-28 GRADE 3 ELA/LITERACY AVERAGE CLAIM 2 SCALE SCORE BY SELECTED DEMOGRAPHIC GROUPS, 2015-
2016 ADMINISTRATION
Group
Scale Scores Reporting Categories (%)
N M SD Below
Standard
At/Near
Standard
Above
Standard
Total 833898 2411.9 102.6 32.6 44.6 22.7
Female 407330 2424.3 101.2 28.2 45.4 26.4
Male 426345 2400.0 102.5 36.9 43.8 19.2
American Indian or Alaska Native 11511 2368.8 94.2 48.2 42.8 9.0
Asian 9830 2469.6 104.7 15.4 41.2 43.4
Black/African American 8642 2394.1 96.1 37.5 47.3 15.1
Native Hawaiian or Pacific Islander 2034 2402.1 98.3 34.5 48.8 16.8
Hispanic/Latino Ethnicity 316795 2383.6 97.2 42.3 44.6 13.2
White 149157 2432.9 98.5 23.5 48.7 27.8
Two or More Races 9106 2435.4 99.5 23.6 47.6 28.8
Unidentified Race 347541 2426.9 103.1 28.3 42.9 28.7
LEP Status 183870 2361.2 92.5 52.0 40.4 7.5
IDEA Indicator 70457 2337.0 103.5 63.0 29.6 7.4
Section 504 Status 6877 2413.9 97.5 30.9 47.6 21.5
Economic Disadvantage Status 448981 2382.5 97.4 43.0 43.9 13.1

Smarter Balanced 2015–16 Summative Assessment Technical Report
Chapter 5: Scores, Scales and Norms
5-22
TABLE 5-29 GRADE 4 ELA/LITERACY AVERAGE CLAIM 2 SCALE SCORE BY SELECTED DEMOGRAPHIC GROUPS, 2015-
2016 ADMINISTRATION
Group
Scale Scores Reporting Categories (%)
N M SD Below
Standard
At/Near
Standard
Above
Standard
Total 842175 2459.8 105.5 31.3 45.9 22.8
Female 412458 2475.9 103.3 25.8 46.8 27.4
Male 429472 2444.3 105.3 36.6 45.1 18.3
American Indian or Alaska Native 11348 2414.1 97.9 47.0 43.9 9.1
Asian 9702 2526.8 110.5 13.3 39.8 46.9
Black/African American 8458 2442.6 102.4 35.2 48.2 16.5
Native Hawaiian or Pacific Islander 2185 2454.0 105.4 31.4 49.0 19.7
Hispanic/Latino Ethnicity 322285 2430.6 99.4 40.4 46.5 13.0
White 145576 2481.5 102.3 22.0 50.0 28.0
Two or More Races 8493 2482.5 106.6 23.6 46.7 29.7
Unidentified Race 354272 2475.7 105.4 27.3 43.9 28.8
LEP Status 166734 2397.1 92.2 54.8 39.9 5.3
IDEA Indicator 76278 2371.9 106.2 65.4 28.4 6.3
Section 504 Status 8385 2459.6 99.7 30.1 49.3 20.6
Economic Disadvantage Status 453650 2428.8 99.8 41.7 45.5 12.8
TABLE 5-30 GRADE 5 ELA/LITERACY AVERAGE CLAIM 2 SCALE SCORE BY SELECTED DEMOGRAPHIC GROUPS, 2015-
2016 ADMINISTRATION
Group
Scale Scores Reporting Categories (%)
N M SD Below
Standard
At/Near
Standard
Above
Standard
Total 828263 2499.7 106.8 29.0 44.3 26.7
Female 405734 2518.6 104.2 22.8 44.6 32.5
Male 422311 2481.5 106.0 34.9 44.0 21.1
American Indian or Alaska Native 11333 2447.3 102.0 47.2 41.7 11.2
Asian 10361 2560.3 112.0 13.4 38.2 48.4
Black/African American 8171 2473.5 104.9 36.8 45.0 18.1
Native Hawaiian or Pacific Islander 2202 2495.5 107.2 28.8 47.0 24.2
Hispanic/Latino Ethnicity 311729 2471.9 101.0 37.6 45.5 16.9
White 143703 2518.0 105.7 22.0 46.2 31.7
Two or More Races 7987 2514.5 109.2 24.1 44.8 31.1
Unidentified Race 353163 2515.6 106.1 24.4 42.8 32.8
LEP Status 133120 2424.1 90.5 57.2 37.9 4.9
IDEA Indicator 77867 2400.9 104.4 67.5 26.2 6.4
Section 504 Status 9896 2496.7 101.6 29.2 46.8 24.1
Economic Disadvantage Status 440329 2468.7 101.1 38.9 45.0 16.2

Smarter Balanced 2015–16 Summative Assessment Technical Report
Chapter 5: Scores, Scales and Norms
5-23
TABLE 5-31 GRADE 6 ELA/LITERACY AVERAGE CLAIM 2 SCALE SCORE BY SELECTED DEMOGRAPHIC GROUPS, 2015-
2016 ADMINISTRATION
Group
Scale Scores Reporting Categories (%)
N M SD Below
Standard
At/Near
Standard
Above
Standard
Total 823204 2519.6 104.7 30.9 45.6 23.4
Female 402652 2538.1 101.1 24.5 46.6 28.8
Male 420330 2501.8 104.9 37.1 44.7 18.3
American Indian or Alaska Native 11135 2476.0 99.7 46.6 43.5 9.9
Asian 10439 2578.2 105.6 14.3 41.6 44.2
Black/African American 7887 2497.3 103.4 37.8 47.0 15.3
Native Hawaiian or Pacific Islander 2022 2511.2 101.7 32.6 48.3 19.1
Hispanic/Latino Ethnicity 301554 2492.6 98.9 39.3 47.1 13.5
White 144063 2540.0 100.7 23.0 49.2 27.9
Two or More Races 13252 2522.9 104.5 29.4 47.6 23.0
Unidentified Race 357505 2533.0 105.5 27.3 43.2 29.5
LEP Status 107317 2435.0 90.7 64.6 32.8 2.6
IDEA Indicator 74035 2417.5 101.9 71.2 25.0 3.8
Section 504 Status 11192 2519.2 97.4 29.7 50.0 20.4
Economic Disadvantage Status 428782 2489.0 100.0 41.3 45.5 13.2
TABLE 5-32 GRADE 7 ELA/LITERACY AVERAGE CLAIM 2 SCALE SCORE BY SELECTED DEMOGRAPHIC GROUPS, 2015-
2016 ADMINISTRATION
Group
Scale Scores Reporting Categories (%)
N M SD Below
Standard
At/Near
Standard
Above
Standard
Total 816899 2544.2 111.7 27.5 46.4 26.1
Female 399342 2565.2 107.2 20.9 46.9 32.2
Male 417365 2524.1 112.2 33.8 46.0 20.2
American Indian or Alaska Native 10926 2498.2 110.4 42.2 45.0 12.7
Asian 10424 2611.6 113.2 11.8 38.2 50.0
Black/African American 7759 2518.8 112.7 35.1 47.3 17.6
Native Hawaiian or Pacific Islander 1898 2534.0 109.4 29.0 49.4 21.7
Hispanic/Latino Ethnicity 295203 2517.1 104.5 34.8 49.3 15.9
White 142617 2567.1 107.6 20.0 48.0 32.0
Two or More Races 12573 2548.8 115.8 26.2 46.5 27.3
Unidentified Race 359550 2556.1 113.8 24.7 43.8 31.5
LEP Status 88261 2446.0 94.7 63.4 34.0 2.5
IDEA Indicator 71031 2439.4 103.1 67.0 28.8 4.2
Section 504 Status 12152 2544.3 103.6 26.6 49.8 23.6
Economic Disadvantage Status 417275 2512.1 107.0 36.9 47.7 15.4

Smarter Balanced 2015–16 Summative Assessment Technical Report
Chapter 5: Scores, Scales and Norms
5-24
TABLE 5-33 GRADE 8 ELA/LITERACY AVERAGE CLAIM 2 SCALE SCORE BY SELECTED DEMOGRAPHIC GROUPS, 2015-
2016 ADMINISTRATION
Group
Scale Scores Reporting Categories (%)
N M SD Below
Standard
At/Near
Standard
Above
Standard
Total 807779 2561.4 111.6 28.6 46.9 24.4
Female 395734 2584.3 106.7 21.4 47.8 30.8
Male 411850 2539.4 111.8 35.6 46.1 18.3
American Indian or Alaska Native 10521 2515.2 111.2 42.7 45.4 11.9
Asian 10108 2626.4 119.5 13.1 39.9 47.0
Black/African American 7621 2532.4 118.0 36.7 46.0 17.3
Native Hawaiian or Pacific Islander 1830 2552.5 112.6 29.0 50.3 20.7
Hispanic/Latino Ethnicity 292181 2534.0 104.7 36.0 49.1 14.9
White 141759 2581.0 113.2 21.6 48.5 29.9
Two or More Races 12222 2563.7 118.4 27.1 47.2 25.6
Unidentified Race 355049 2575.0 111.0 25.6 44.9 29.5
LEP Status 77164 2457.5 91.4 67.9 30.2 1.8
IDEA Indicator 67598 2449.3 103.0 70.1 26.6 3.4
Section 504 Status 13168 2559.0 107.0 28.2 50.1 21.7
Economic Disadvantage Status 408082 2530.1 106.3 37.9 47.7 14.4
TABLE 5-34 GRADE 11 ELA/LITERACY AVERAGE CLAIM 2 SCALE SCORE BY SELECTED DEMOGRAPHIC GROUPS,
2015-2016 ADMINISTRATION
Group
Scale Scores Reporting Categories (%)
N M SD Below
Standard
At/Near
Standard
Above
Standard
Total 534185 2596.1 129.1 21.6 44.6 33.8
Female 260785 2619.3 120.5 15.6 44.6 39.8
Male 273301 2573.9 133.2 27.4 44.5 28.1
American Indian or Alaska Native 6513 2555.9 127.0 28.0 52.4 19.6
Asian 4306 2615.1 142.6 18.4 41.6 39.9
Black/African American 4440 2532.6 137.0 35.7 47.9 16.4
Native Hawaiian or Pacific Islander 926 2576.9 130.0 24.6 47.9 27.4
Hispanic/Latino Ethnicity 232927 2568.4 122.8 27.1 48.9 24.1
White 73263 2599.5 131.0 19.0 47.7 33.3
Two or More Races 6088 2584.5 122.9 20.5 53.3 26.3
Unidentified Race 222827 2625.9 127.3 16.3 39.1 44.6
LEP Status 44433 2459.5 105.5 62.7 34.7 2.7
IDEA Indicator 46916 2466.2 116.2 60.7 34.1 5.2
Section 504 Status 9848 2593.9 122.4 20.2 48.6 31.2
Economic Disadvantage Status 279054 2565.5 125.7 28.3 47.8 23.9
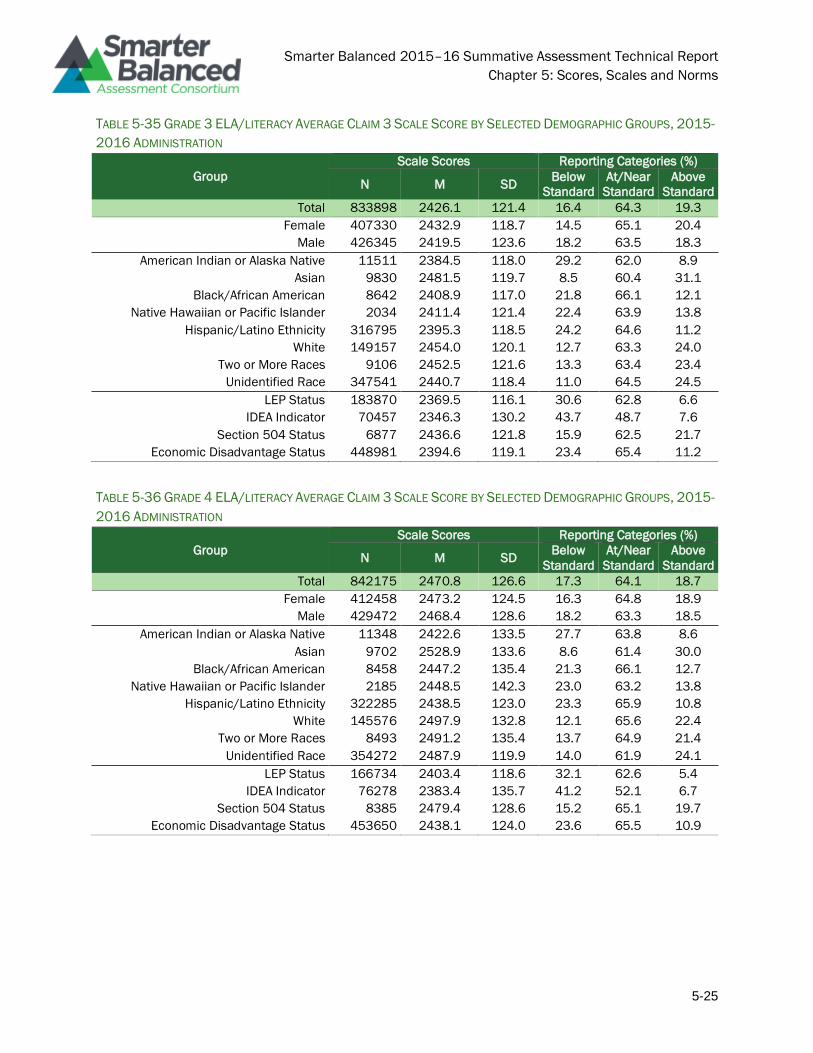
Smarter Balanced 2015–16 Summative Assessment Technical Report
Chapter 5: Scores, Scales and Norms
5-25
TABLE 5-35 GRADE 3 ELA/LITERACY AVERAGE CLAIM 3 SCALE SCORE BY SELECTED DEMOGRAPHIC GROUPS, 2015-
2016 ADMINISTRATION
Group
Scale Scores Reporting Categories (%)
N M SD Below
Standard
At/Near
Standard
Above
Standard
Total 833898 2426.1 121.4 16.4 64.3 19.3
Female 407330 2432.9 118.7 14.5 65.1 20.4
Male 426345 2419.5 123.6 18.2 63.5 18.3
American Indian or Alaska Native 11511 2384.5 118.0 29.2 62.0 8.9
Asian 9830 2481.5 119.7 8.5 60.4 31.1
Black/African American 8642 2408.9 117.0 21.8 66.1 12.1
Native Hawaiian or Pacific Islander 2034 2411.4 121.4 22.4 63.9 13.8
Hispanic/Latino Ethnicity 316795 2395.3 118.5 24.2 64.6 11.2
White 149157 2454.0 120.1 12.7 63.3 24.0
Two or More Races 9106 2452.5 121.6 13.3 63.4 23.4
Unidentified Race 347541 2440.7 118.4 11.0 64.5 24.5
LEP Status 183870 2369.5 116.1 30.6 62.8 6.6
IDEA Indicator 70457 2346.3 130.2 43.7 48.7 7.6
Section 504 Status 6877 2436.6 121.8 15.9 62.5 21.7
Economic Disadvantage Status 448981 2394.6 119.1 23.4 65.4 11.2
TABLE 5-36 GRADE 4 ELA/LITERACY AVERAGE CLAIM 3 SCALE SCORE BY SELECTED DEMOGRAPHIC GROUPS, 2015-
2016 ADMINISTRATION
Group
Scale Scores Reporting Categories (%)
N M SD Below
Standard
At/Near
Standard
Above
Standard
Total 842175 2470.8 126.6 17.3 64.1 18.7
Female 412458 2473.2 124.5 16.3 64.8 18.9
Male 429472 2468.4 128.6 18.2 63.3 18.5
American Indian or Alaska Native 11348 2422.6 133.5 27.7 63.8 8.6
Asian 9702 2528.9 133.6 8.6 61.4 30.0
Black/African American 8458 2447.2 135.4 21.3 66.1 12.7
Native Hawaiian or Pacific Islander 2185 2448.5 142.3 23.0 63.2 13.8
Hispanic/Latino Ethnicity 322285 2438.5 123.0 23.3 65.9 10.8
White 145576 2497.9 132.8 12.1 65.6 22.4
Two or More Races 8493 2491.2 135.4 13.7 64.9 21.4
Unidentified Race 354272 2487.9 119.9 14.0 61.9 24.1
LEP Status 166734 2403.4 118.6 32.1 62.6 5.4
IDEA Indicator 76278 2383.4 135.7 41.2 52.1 6.7
Section 504 Status 8385 2479.4 128.6 15.2 65.1 19.7
Economic Disadvantage Status 453650 2438.1 124.0 23.6 65.5 10.9

Smarter Balanced 2015–16 Summative Assessment Technical Report
Chapter 5: Scores, Scales and Norms
5-26
TABLE 5-37 GRADE 5 ELA/LITERACY AVERAGE CLAIM 3 SCALE SCORE BY SELECTED DEMOGRAPHIC GROUPS, 2015-
2016 ADMINISTRATION
Group
Scale Scores Reporting Categories (%)
N M SD Below
Standard
At/Near
Standard
Above
Standard
Total 828263 2490.3 129.4 18.6 62.2 19.2
Female 405734 2495.0 128.1 17.3 62.5 20.2
Male 422311 2485.7 130.6 19.9 61.9 18.1
American Indian or Alaska Native 11333 2439.5 133.4 30.6 60.8 8.6
Asian 10361 2543.5 136.3 9.7 57.5 32.7
Black/African American 8171 2457.6 140.5 25.9 62.2 11.9
Native Hawaiian or Pacific Islander 2202 2474.7 140.8 21.8 63.2 14.9
Hispanic/Latino Ethnicity 311729 2455.4 126.5 26.3 62.8 10.8
White 143703 2511.7 133.2 13.6 64.3 22.1
Two or More Races 7987 2503.1 136.5 16.1 62.9 21.0
Unidentified Race 353163 2511.8 122.5 13.9 61.0 25.1
LEP Status 133120 2403.2 116.6 40.9 55.9 3.2
IDEA Indicator 77867 2391.0 132.2 47.6 47.1 5.3
Section 504 Status 9896 2494.7 129.3 17.2 64.4 18.4
Economic Disadvantage Status 440329 2455.0 126.9 26.2 63.0 10.8
TABLE 5-38 GRADE 6 ELA/LITERACY AVERAGE CLAIM 3 SCALE SCORE BY SELECTED DEMOGRAPHIC GROUPS, 2015-
2016 ADMINISTRATION
Group
Scale Scores Reporting Categories (%)
N M SD Below
Standard
At/Near
Standard
Above
Standard
Total 823204 2535.2 129.5 16.7 66.0 17.3
Female 402652 2545.3 127.0 14.5 66.7 18.9
Male 420330 2525.5 131.1 18.9 65.4 15.7
American Indian or Alaska Native 11135 2491.9 137.6 25.8 65.7 8.5
Asian 10439 2597.0 146.9 8.0 64.1 27.9
Black/African American 7887 2512.8 142.1 20.7 67.9 11.4
Native Hawaiian or Pacific Islander 2022 2521.2 140.3 18.8 68.6 12.6
Hispanic/Latino Ethnicity 301554 2505.0 125.6 21.8 68.2 10.1
White 144063 2563.5 140.6 11.5 68.3 20.2
Two or More Races 13252 2547.8 141.5 14.4 68.2 17.4
Unidentified Race 357505 2548.3 121.4 14.6 63.5 22.0
LEP Status 107317 2441.7 119.3 39.2 58.1 2.8
IDEA Indicator 74035 2427.6 132.5 45.4 50.6 4.1
Section 504 Status 11192 2545.6 129.8 13.8 69.2 16.9
Economic Disadvantage Status 428782 2503.7 127.1 22.6 67.2 10.2

Smarter Balanced 2015–16 Summative Assessment Technical Report
Chapter 5: Scores, Scales and Norms
5-27
TABLE 5-39 GRADE 7 ELA/LITERACY AVERAGE CLAIM 3 SCALE SCORE BY SELECTED DEMOGRAPHIC GROUPS, 2015-
2016 ADMINISTRATION
Group
Scale Scores Reporting Categories (%)
N M SD Below
Standard
At/Near
Standard
Above
Standard
Total 816899 2552.4 127.1 18.6 64.5 16.9
Female 399342 2560.3 125.4 16.5 65.0 18.4
Male 417365 2544.7 128.3 20.5 64.0 15.5
American Indian or Alaska Native 10926 2508.9 133.5 27.5 63.8 8.7
Asian 10424 2607.8 135.2 9.0 62.7 28.3
Black/African American 7759 2526.3 137.5 23.5 65.2 11.4
Native Hawaiian or Pacific Islander 1898 2531.8 135.6 21.5 65.4 13.1
Hispanic/Latino Ethnicity 295203 2517.5 122.6 25.5 64.7 9.8
White 142617 2581.4 134.2 12.3 66.5 21.2
Two or More Races 12573 2560.7 138.5 16.7 65.8 17.6
Unidentified Race 359550 2568.7 120.2 15.5 63.7 20.8
LEP Status 88261 2445.9 109.3 47.6 50.3 2.1
IDEA Indicator 71031 2448.1 121.2 47.1 49.4 3.5
Section 504 Status 12152 2562.2 124.5 15.0 67.9 17.2
Economic Disadvantage Status 417275 2517.2 123.7 25.9 64.3 9.7
TABLE 5-40 GRADE 8 ELA/LITERACY AVERAGE CLAIM 3 SCALE SCORE BY SELECTED DEMOGRAPHIC GROUPS, 2015-
2016 ADMINISTRATION
Group
Scale Scores Reporting Categories (%)
N M SD Below
Standard
At/Near
Standard
Above
Standard
Total 807779 2566.8 124.3 18.7 64.6 16.7
Female 395734 2577.6 120.1 15.4 66.4 18.2
Male 411850 2556.4 127.3 21.8 62.9 15.3
American Indian or Alaska Native 10521 2529.1 130.4 26.5 64.7 8.8
Asian 10108 2626.2 136.4 8.3 63.3 28.3
Black/African American 7621 2545.1 134.3 22.6 66.0 11.3
Native Hawaiian or Pacific Islander 1830 2554.6 134.2 19.5 67.4 13.1
Hispanic/Latino Ethnicity 292181 2536.5 117.0 24.3 66.5 9.2
White 141759 2592.4 131.7 12.4 67.8 19.8
Two or More Races 12222 2578.8 133.8 15.1 67.8 17.1
Unidentified Race 355049 2580.6 120.8 16.6 61.9 21.5
LEP Status 77164 2460.4 105.2 50.1 48.2 1.7
IDEA Indicator 67598 2465.2 119.2 48.5 48.3 3.2
Section 504 Status 13168 2574.8 124.4 15.9 67.3 16.7
Economic Disadvantage Status 408082 2535.1 119.5 25.2 65.4 9.4

Smarter Balanced 2015–16 Summative Assessment Technical Report
Chapter 5: Scores, Scales and Norms
5-28
TABLE 5-41 GRADE 11 ELA/LITERACY AVERAGE CLAIM 3 SCALE SCORE BY SELECTED DEMOGRAPHIC GROUPS,
2015-2016 ADMINISTRATION
Group
Scale Scores Reporting Categories (%)
N M SD Below
Standard
At/Near
Standard
Above
Standard
Total 534185 2593.2 135.4 16.7 62.5 20.7
Female 260785 2603.1 130.3 13.6 64.6 21.8
Male 273301 2583.7 139.4 19.7 60.5 19.7
American Indian or Alaska Native 6513 2566.1 143.6 21.0 65.6 13.4
Asian 4306 2613.4 156.9 15.6 58.4 26.0
Black/African American 4440 2548.2 146.2 26.2 62.3 11.6
Native Hawaiian or Pacific Islander 926 2571.4 148.5 21.4 63.9 14.7
Hispanic/Latino Ethnicity 232927 2569.4 129.4 20.6 64.9 14.5
White 73263 2602.4 151.0 15.6 62.4 21.9
Two or More Races 6088 2594.5 143.0 14.6 66.9 18.5
Unidentified Race 222827 2616.9 130.8 12.6 60.2 27.2
LEP Status 44433 2471.8 108.3 49.4 49.0 1.6
IDEA Indicator 46916 2489.2 124.5 44.6 51.0 4.4
Section 504 Status 9848 2601.2 135.0 14.9 63.3 21.9
Economic Disadvantage Status 279054 2566.7 131.6 21.4 64.3 14.3
TABLE 5-42 GRADE 3 ELA/LITERACY AVERAGE CLAIM 4 SCALE SCORE BY SELECTED DEMOGRAPHIC GROUPS, 2015-
2016 ADMINISTRATION
Group
Scale Scores Reporting Categories (%)
N M SD Below
Standard
At/Near
Standard
Above
Standard
Total 833898 2411.5 119.4 27.2 48.8 24.0
Female 407330 2420.3 117.9 24.3 49.5 26.2
Male 426345 2403.0 120.3 30.0 48.1 21.9
American Indian or Alaska Native 11511 2367.1 110.6 40.0 49.7 10.4
Asian 9830 2470.5 115.7 12.1 46.1 41.7
Black/African American 8642 2387.7 115.5 32.9 51.0 16.1
Native Hawaiian or Pacific Islander 2034 2394.5 115.2 31.2 51.4 17.4
Hispanic/Latino Ethnicity 316795 2383.1 115.5 35.1 49.9 15.0
White 149157 2431.0 115.4 19.8 52.2 28.0
Two or More Races 9106 2434.0 117.0 20.7 49.6 29.7
Unidentified Race 347541 2427.5 119.5 23.5 46.5 30.0
LEP Status 183870 2360.5 110.2 42.9 47.9 9.3
IDEA Indicator 70457 2345.3 116.6 51.2 39.5 9.3
Section 504 Status 6877 2413.9 117.6 26.0 50.6 23.5
Economic Disadvantage Status 448981 2381.3 115.2 36.0 49.3 14.7

Smarter Balanced 2015–16 Summative Assessment Technical Report
Chapter 5: Scores, Scales and Norms
5-29
TABLE 5-43 GRADE 4 ELA/LITERACY AVERAGE CLAIM 4 SCALE SCORE BY SELECTED DEMOGRAPHIC GROUPS, 2015-
2016 ADMINISTRATION
Group
Scale Scores Reporting Categories (%)
N M SD Below
Standard
At/Near
Standard
Above
Standard
Total 842175 2449.8 123.9 26.6 50.6 22.8
Female 412458 2459.7 123.1 23.9 50.7 25.4
Male 429472 2440.2 124.0 29.3 50.5 20.2
American Indian or Alaska Native 11348 2400.4 117.8 39.4 51.0 9.6
Asian 9702 2510.4 120.2 11.4 48.5 40.1
Black/African American 8458 2425.7 120.7 30.8 54.4 14.8
Native Hawaiian or Pacific Islander 2185 2439.0 119.6 26.5 56.6 16.9
Hispanic/Latino Ethnicity 322285 2419.9 121.0 34.5 51.2 14.3
White 145576 2468.4 119.7 18.6 55.9 25.5
Two or More Races 8493 2466.7 122.7 20.3 53.6 26.0
Unidentified Race 354272 2468.0 122.6 23.1 48.0 28.9
LEP Status 166734 2384.4 113.3 46.4 47.1 6.5
IDEA Indicator 76278 2367.4 122.3 54.3 38.2 7.5
Section 504 Status 8385 2449.7 122.7 24.2 54.8 21.0
Economic Disadvantage Status 453650 2417.4 120.4 35.5 50.8 13.7
TABLE 5-44 GRADE 5 ELA/LITERACY AVERAGE CLAIM 4 SCALE SCORE BY SELECTED DEMOGRAPHIC GROUPS, 2015-
2016 ADMINISTRATION
Group
Scale Scores Reporting Categories (%)
N M SD Below
Standard
At/Near
Standard
Above
Standard
Total 828263 2513.0 115.3 16.2 53.0 30.8
Female 405734 2526.2 112.1 13.2 52.0 34.8
Male 422311 2500.3 116.9 19.1 54.0 26.9
American Indian or Alaska Native 11333 2465.1 111.0 29.8 55.1 15.2
Asian 10361 2570.3 111.6 7.9 42.2 49.9
Black/African American 8171 2490.3 110.7 22.1 56.3 21.6
Native Hawaiian or Pacific Islander 2202 2504.4 111.3 19.0 55.3 25.7
Hispanic/Latino Ethnicity 311729 2487.9 112.0 22.1 56.1 21.8
White 143703 2532.3 108.9 12.7 52.5 34.9
Two or More Races 7987 2528.3 113.0 14.5 51.7 33.8
Unidentified Race 353163 2526.3 116.4 12.4 50.9 36.7
LEP Status 133120 2437.8 104.3 35.7 56.3 8.0
IDEA Indicator 77867 2422.5 114.8 45.7 45.2 9.1
Section 504 Status 9896 2512.6 108.6 15.8 56.4 27.8
Economic Disadvantage Status 440329 2483.4 113.3 22.7 56.7 20.6
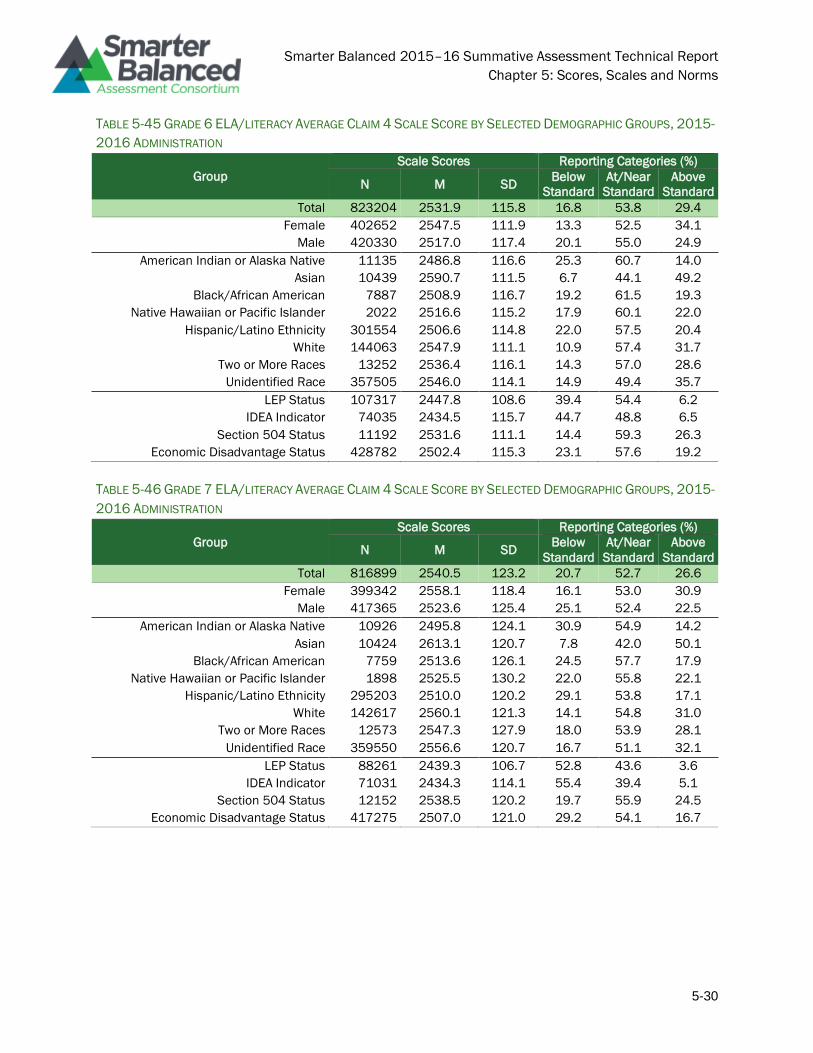
Smarter Balanced 2015–16 Summative Assessment Technical Report
Chapter 5: Scores, Scales and Norms
5-30
TABLE 5-45 GRADE 6 ELA/LITERACY AVERAGE CLAIM 4 SCALE SCORE BY SELECTED DEMOGRAPHIC GROUPS, 2015-
2016 ADMINISTRATION
Group
Scale Scores Reporting Categories (%)
N M SD Below
Standard
At/Near
Standard
Above
Standard
Total 823204 2531.9 115.8 16.8 53.8 29.4
Female 402652 2547.5 111.9 13.3 52.5 34.1
Male 420330 2517.0 117.4 20.1 55.0 24.9
American Indian or Alaska Native 11135 2486.8 116.6 25.3 60.7 14.0
Asian 10439 2590.7 111.5 6.7 44.1 49.2
Black/African American 7887 2508.9 116.7 19.2 61.5 19.3
Native Hawaiian or Pacific Islander 2022 2516.6 115.2 17.9 60.1 22.0
Hispanic/Latino Ethnicity 301554 2506.6 114.8 22.0 57.5 20.4
White 144063 2547.9 111.1 10.9 57.4 31.7
Two or More Races 13252 2536.4 116.1 14.3 57.0 28.6
Unidentified Race 357505 2546.0 114.1 14.9 49.4 35.7
LEP Status 107317 2447.8 108.6 39.4 54.4 6.2
IDEA Indicator 74035 2434.5 115.7 44.7 48.8 6.5
Section 504 Status 11192 2531.6 111.1 14.4 59.3 26.3
Economic Disadvantage Status 428782 2502.4 115.3 23.1 57.6 19.2
TABLE 5-46 GRADE 7 ELA/LITERACY AVERAGE CLAIM 4 SCALE SCORE BY SELECTED DEMOGRAPHIC GROUPS, 2015-
2016 ADMINISTRATION
Group
Scale Scores Reporting Categories (%)
N M SD Below
Standard
At/Near
Standard
Above
Standard
Total 816899 2540.5 123.2 20.7 52.7 26.6
Female 399342 2558.1 118.4 16.1 53.0 30.9
Male 417365 2523.6 125.4 25.1 52.4 22.5
American Indian or Alaska Native 10926 2495.8 124.1 30.9 54.9 14.2
Asian 10424 2613.1 120.7 7.8 42.0 50.1
Black/African American 7759 2513.6 126.1 24.5 57.7 17.9
Native Hawaiian or Pacific Islander 1898 2525.5 130.2 22.0 55.8 22.1
Hispanic/Latino Ethnicity 295203 2510.0 120.2 29.1 53.8 17.1
White 142617 2560.1 121.3 14.1 54.8 31.0
Two or More Races 12573 2547.3 127.9 18.0 53.9 28.1
Unidentified Race 359550 2556.6 120.7 16.7 51.1 32.1
LEP Status 88261 2439.3 106.7 52.8 43.6 3.6
IDEA Indicator 71031 2434.3 114.1 55.4 39.4 5.1
Section 504 Status 12152 2538.5 120.2 19.7 55.9 24.5
Economic Disadvantage Status 417275 2507.0 121.0 29.2 54.1 16.7

Smarter Balanced 2015–16 Summative Assessment Technical Report
Chapter 5: Scores, Scales and Norms
5-31
TABLE 5-47 GRADE 8 ELA/LITERACY AVERAGE CLAIM 4 SCALE SCORE BY SELECTED DEMOGRAPHIC GROUPS, 2015-
2016 ADMINISTRATION
Group
Scale Scores Reporting Categories (%)
N M SD Below
Standard
At/Near
Standard
Above
Standard
Total 807779 2560.1 123.8 20.3 53.2 26.5
Female 395734 2580.2 118.9 15.4 53.0 31.6
Male 411850 2540.8 125.4 25.1 53.4 21.5
American Indian or Alaska Native 10521 2519.4 124.6 30.5 54.3 15.2
Asian 10108 2636.1 123.3 8.3 40.3 51.3
Black/African American 7621 2533.5 128.0 27.1 53.3 19.6
Native Hawaiian or Pacific Islander 1830 2553.8 126.0 21.2 55.0 23.8
Hispanic/Latino Ethnicity 292181 2530.6 119.8 27.9 54.6 17.5
White 141759 2577.7 124.7 15.8 53.0 31.2
Two or More Races 12222 2572.5 128.5 18.1 52.6 29.4
Unidentified Race 355049 2576.1 121.3 16.1 52.5 31.5
LEP Status 77164 2457.3 104.2 52.5 43.9 3.6
IDEA Indicator 67598 2452.4 109.8 55.9 39.5 4.6
Section 504 Status 13168 2555.1 121.3 20.8 55.1 24.1
Economic Disadvantage Status 408082 2528.5 121.2 28.1 54.7 17.2
TABLE 5-48 GRADE 11 ELA/LITERACY AVERAGE CLAIM 4 SCALE SCORE BY SELECTED DEMOGRAPHIC GROUPS,
2015-2016 ADMINISTRATION
Group
Scale Scores Reporting Categories (%)
N M SD Below
Standard
At/Near
Standard
Above
Standard
Total 534185 2602.2 136.0 14.9 49.1 36.1
Female 260785 2621.9 128.3 11.0 47.8 41.1
Male 273301 2583.4 140.3 18.5 50.2 31.2
American Indian or Alaska Native 6513 2572.7 144.5 18.1 56.3 25.7
Asian 4306 2632.0 148.0 11.4 43.2 45.4
Black/African American 4440 2542.4 151.0 25.4 53.8 20.8
Native Hawaiian or Pacific Islander 926 2591.3 149.8 16.3 51.2 32.5
Hispanic/Latino Ethnicity 232927 2581.0 133.1 18.0 53.5 28.5
White 73263 2601.3 145.2 14.2 50.4 35.4
Two or More Races 6088 2605.1 140.4 13.0 52.7 34.3
Unidentified Race 222827 2627.0 130.6 11.4 43.8 44.8
LEP Status 44433 2478.8 119.2 41.2 53.6 5.3
IDEA Indicator 46916 2485.5 127.2 39.8 52.4 7.8
Section 504 Status 9848 2600.5 133.9 14.2 51.4 34.4
Economic Disadvantage Status 279054 2577.8 135.6 18.8 53.1 28.1

Smarter Balanced 2015–16 Summative Assessment Technical Report
Chapter 5: Scores, Scales and Norms
5-32
TABLE 5-49 GRADE 3 MATHEMATICS AVERAGE CLAIM 1 SCALE SCORE BY SELECTED DEMOGRAPHIC GROUPS,
2015-2016 ADMINISTRATION
Group
Scale Scores Reporting Categories (%)
N M SD Below
Standard
At/Near
Standard
Above
Standard
Total 837721 2431.1 86.5 34.0 34.7 31.3
Female 409070 2429.4 82.9 34.5 35.8 29.7
Male 428424 2432.8 89.8 33.6 33.6 32.9
American Indian or Alaska Native 11522 2391.0 80.5 52.3 33.8 13.9
Asian 9976 2493.0 93.5 14.1 27.4 58.5
Black/African American 8693 2405.9 87.9 44.3 35.4 20.3
Native Hawaiian or Pacific Islander 2073 2416.0 83.9 39.8 35.8 24.4
Hispanic/Latino Ethnicity 319616 2407.6 80.0 44.1 36.1 19.9
White 149106 2447.0 84.5 25.9 36.3 37.8
Two or More Races 9105 2450.6 88.2 25.3 34.9 39.7
Unidentified Race 348384 2444.2 87.5 28.9 32.9 38.3
LEP Status 186383 2395.3 79.2 51.3 33.6 15.1
IDEA Indicator 70817 2364.2 98.9 63.6 23.1 13.3
Section 504 Status 7012 2432.4 86.9 33.4 35.6 31.0
Economic Disadvantage Status 451419 2406.2 81.5 44.8 35.4 19.8
TABLE 5-50 GRADE 4 MATHEMATICS AVERAGE CLAIM 1 SCALE SCORE BY SELECTED DEMOGRAPHIC GROUPS,
2015-2016 ADMINISTRATION
Group
Scale Scores Reporting Categories (%)
N M SD Below
Standard
At/Near
Standard
Above
Standard
Total 845567 2468.4 88.1 41.1 31.8 27.1
Female 414090 2465.7 83.9 42.3 32.8 24.9
Male 431232 2471.1 91.9 40.0 30.8 29.1
American Indian or Alaska Native 11353 2429.8 80.0 58.8 29.6 11.5
Asian 9828 2538.6 100.0 17.2 26.5 56.3
Black/African American 8496 2447.3 85.7 49.1 33.5 17.4
Native Hawaiian or Pacific Islander 2188 2460.4 87.8 43.5 34.2 22.3
Hispanic/Latino Ethnicity 325116 2440.4 79.5 54.1 31.3 14.6
White 145502 2490.1 85.6 29.6 36.3 34.1
Two or More Races 8486 2491.7 90.8 31.0 33.5 35.4
Unidentified Race 354766 2483.3 88.7 34.6 30.6 34.8
LEP Status 168704 2419.5 76.1 66.1 25.3 8.6
IDEA Indicator 76779 2397.9 93.7 72.1 18.1 9.8
Section 504 Status 8539 2474.4 87.0 38.8 33.7 27.5
Economic Disadvantage Status 456172 2441.0 81.2 53.7 31.0 15.3

Smarter Balanced 2015–16 Summative Assessment Technical Report
Chapter 5: Scores, Scales and Norms
5-33
TABLE 5-51 GRADE 5 MATHEMATICS AVERAGE CLAIM 1 SCALE SCORE BY SELECTED DEMOGRAPHIC GROUPS,
2015-2016 ADMINISTRATION
Group
Scale Scores Reporting Categories (%)
N M SD Below
Standard
At/Near
Standard
Above
Standard
Total 831108 2493.5 96.2 46.7 29.6 23.7
Female 407023 2491.7 91.8 47.8 30.5 21.7
Male 423867 2495.2 100.3 45.7 28.6 25.6
American Indian or Alaska Native 11316 2454.5 86.8 64.2 25.7 10.1
Asian 10475 2569.1 107.4 20.3 28.1 51.7
Black/African American 8219 2467.5 92.4 57.2 28.4 14.4
Native Hawaiian or Pacific Islander 2238 2492.0 94.8 45.2 33.1 21.7
Hispanic/Latino Ethnicity 314286 2462.8 86.7 60.5 27.4 12.1
White 143584 2516.5 92.6 35.8 33.6 30.6
Two or More Races 8000 2514.0 100.0 38.2 31.0 30.9
Unidentified Race 353394 2509.4 97.5 39.6 30.0 30.5
LEP Status 134894 2430.6 81.1 76.1 18.9 5.0
IDEA Indicator 78110 2414.4 96.6 78.3 14.7 7.1
Section 504 Status 10090 2497.6 93.0 45.3 30.8 23.9
Economic Disadvantage Status 442330 2463.1 88.7 60.1 27.3 12.6
TABLE 5-52 GRADE 6 MATHEMATICS AVERAGE CLAIM 1 SCALE SCORE BY SELECTED DEMOGRAPHIC GROUPS,
2015-2016 ADMINISTRATION
Group
Scale Scores Reporting Categories (%)
N M SD Below
Standard
At/Near
Standard
Above
Standard
Total 825844 2513.7 112.4 44.9 32.4 22.7
Female 403820 2517.7 107.4 43.6 33.6 22.8
Male 421799 2509.8 116.8 46.1 31.2 22.7
American Indian or Alaska Native 11106 2460.6 107.8 64.3 27.4 8.3
Asian 10542 2595.6 125.0 20.2 30.8 49.0
Black/African American 7933 2475.4 113.7 58.4 29.4 12.2
Native Hawaiian or Pacific Islander 2029 2496.9 109.1 50.4 33.6 16.0
Hispanic/Latino Ethnicity 303772 2479.2 104.7 58.1 29.9 12.0
White 143822 2533.4 108.3 35.7 37.7 26.5
Two or More Races 13234 2512.9 117.3 45.0 32.6 22.4
Unidentified Race 358021 2533.2 111.7 37.9 32.5 29.6
LEP Status 109357 2425.4 98.7 79.9 16.3 3.8
IDEA Indicator 74157 2401.8 112.4 82.1 13.2 4.7
Section 504 Status 11318 2520.2 106.9 42.4 35.4 22.2
Economic Disadvantage Status 430665 2478.3 106.0 58.4 29.6 12.1

Smarter Balanced 2015–16 Summative Assessment Technical Report
Chapter 5: Scores, Scales and Norms
5-34
TABLE 5-53 GRADE 7 MATHEMATICS AVERAGE CLAIM 1 SCALE SCORE BY SELECTED DEMOGRAPHIC GROUPS,
2015-2016 ADMINISTRATION
Group
Scale Scores Reporting Categories (%)
N M SD Below
Standard
At/Near
Standard
Above
Standard
Total 819032 2531.4 114.8 44.0 31.2 24.8
Female 400319 2534.1 109.7 43.2 32.5 24.3
Male 418521 2528.8 119.4 44.8 30.0 25.2
American Indian or Alaska Native 10905 2483.4 109.4 59.6 29.8 10.7
Asian 10508 2619.8 127.3 18.5 27.2 54.2
Black/African American 7806 2491.9 114.9 56.2 30.3 13.5
Native Hawaiian or Pacific Islander 1909 2512.5 116.5 48.0 33.4 18.6
Hispanic/Latino Ethnicity 298093 2494.3 105.1 57.3 30.0 12.7
White 142360 2555.6 108.3 32.0 38.2 29.8
Two or More Races 12530 2536.1 118.2 40.6 34.1 25.3
Unidentified Race 358928 2550.9 115.4 38.3 29.5 32.2
LEP Status 90287 2429.9 99.3 82.9 13.2 4.0
IDEA Indicator 71053 2417.6 109.6 81.9 13.4 4.7
Section 504 Status 12256 2538.6 105.3 40.2 36.4 23.4
Economic Disadvantage Status 419171 2494.6 107.4 57.2 29.5 13.3
TABLE 5-54 GRADE 8 MATHEMATICS AVERAGE CLAIM 1 SCALE SCORE BY SELECTED DEMOGRAPHIC GROUPS,
2015-2016 ADMINISTRATION
Group
Scale Scores Reporting Categories (%)
N M SD Below
Standard
At/Near
Standard
Above
Standard
Total 803196 2543.8 125.4 45.3 30.3 24.4
Female 393015 2549.7 120.9 42.9 32.0 25.1
Male 409984 2538.1 129.4 47.6 28.7 23.7
American Indian or Alaska Native 10460 2491.6 116.5 61.9 27.5 10.6
Asian 10172 2646.0 143.3 19.2 25.5 55.3
Black/African American 7611 2502.3 123.6 57.3 28.7 14.0
Native Hawaiian or Pacific Islander 1827 2531.4 124.7 47.2 33.6 19.2
Hispanic/Latino Ethnicity 292983 2507.0 113.8 57.0 29.4 13.5
White 141354 2565.7 123.3 35.9 35.2 28.9
Two or More Races 12157 2549.7 130.4 42.4 32.1 25.5
Unidentified Race 350056 2563.7 126.6 39.8 29.3 30.9
LEP Status 78907 2442.8 105.6 80.5 14.9 4.6
IDEA Indicator 67608 2428.1 109.7 82.5 13.3 4.2
Section 504 Status 13182 2546.7 121.0 44.2 32.7 23.1
Economic Disadvantage Status 409428 2506.8 115.6 57.3 28.9 13.9

Smarter Balanced 2015–16 Summative Assessment Technical Report
Chapter 5: Scores, Scales and Norms
5-35
TABLE 5-55 GRADE 11 MATHEMATICS AVERAGE CLAIM 1 SCALE SCORE BY SELECTED DEMOGRAPHIC GROUPS,
2015-2016 ADMINISTRATION
Group
Scale Scores Reporting Categories (%)
N M SD Below
Standard
At/Near
Standard
Above
Standard
Total 565002 2570.0 128.5 48.6 30.5 20.9
Female 276135 2576.0 121.5 46.3 32.8 20.9
Male 288771 2564.2 134.6 50.7 28.3 20.9
American Indian or Alaska Native 6819 2518.9 114.2 66.4 25.6 8.1
Asian 6503 2632.5 134.4 30.1 31.5 38.4
Black/African American 5457 2514.0 119.8 66.5 25.6 7.9
Native Hawaiian or Pacific Islander 1141 2545.2 120.0 55.4 31.7 12.9
Hispanic/Latino Ethnicity 239413 2534.0 115.8 60.2 28.7 11.1
White 92558 2577.0 122.8 45.4 33.9 20.7
Two or More Races 8037 2558.9 122.2 52.3 31.5 16.2
Unidentified Race 221941 2605.6 132.3 37.4 31.2 31.4
LEP Status 45386 2453.1 108.0 86.1 10.3 3.6
IDEA Indicator 47954 2442.9 106.7 87.9 9.5 2.6
Section 504 Status 11150 2571.0 123.0 48.7 31.6 19.7
Economic Disadvantage Status 290574 2535.2 119.0 59.9 28.1 12.0
TABLE 5-56 GRADE 3 MATHEMATICS AVERAGE CLAIM 2/4 SCALE SCORE BY SELECTED DEMOGRAPHIC GROUPS,
2015-2016 ADMINISTRATION
Group
Scale Scores Reporting Categories (%)
N M SD Below
Standard
At/Near
Standard
Above
Standard
Total 837721 2418.4 98.5 23.3 50.9 25.9
Female 409070 2417.6 96.6 23.2 51.9 24.9
Male 428424 2419.2 100.2 23.3 49.9 26.8
American Indian or Alaska Native 11522 2382.7 93.4 29.8 58.1 12.1
Asian 9976 2485.3 102.1 7.8 40.2 52.0
Black/African American 8693 2398.5 97.2 26.1 56.3 17.6
Native Hawaiian or Pacific Islander 2073 2410.0 97.9 23.3 55.0 21.7
Hispanic/Latino Ethnicity 319616 2389.9 93.3 35.2 50.1 14.6
White 149106 2442.2 95.9 14.0 52.6 33.3
Two or More Races 9105 2443.9 99.4 14.3 51.2 34.5
Unidentified Race 348384 2432.5 97.2 16.6 51.1 32.2
LEP Status 186383 2373.5 92.1 41.0 48.8 10.1
IDEA Indicator 70817 2357.2 104.3 51.4 37.5 11.1
Section 504 Status 7012 2424.8 99.2 22.3 50.1 27.7
Economic Disadvantage Status 451419 2390.7 94.4 33.0 51.8 15.1

Smarter Balanced 2015–16 Summative Assessment Technical Report
Chapter 5: Scores, Scales and Norms
5-36
TABLE 5-57 GRADE 4 MATHEMATICS AVERAGE CLAIM 2/4 SCALE SCORE BY SELECTED DEMOGRAPHIC GROUPS,
2015-2016 ADMINISTRATION
Group
Scale Scores Reporting Categories (%)
N M SD Below
Standard
At/Near
Standard
Above
Standard
Total 845567 2460.1 99.2 30.1 47.7 22.2
Female 414090 2459.6 96.6 29.9 48.9 21.2
Male 431232 2460.6 101.6 30.4 46.5 23.2
American Indian or Alaska Native 11353 2421.5 89.8 46.9 43.1 10.0
Asian 9828 2529.1 105.6 13.6 35.9 50.5
Black/African American 8496 2436.8 94.6 39.8 45.7 14.5
Native Hawaiian or Pacific Islander 2188 2450.2 93.2 34.8 46.6 18.6
Hispanic/Latino Ethnicity 325116 2425.9 95.6 43.0 46.4 10.6
White 145502 2481.1 94.4 23.1 47.2 29.7
Two or More Races 8486 2480.9 100.2 24.7 44.9 30.5
Unidentified Race 354766 2481.0 94.6 21.6 49.5 29.0
LEP Status 168704 2401.2 93.4 54.1 40.5 5.5
IDEA Indicator 76779 2386.5 104.5 62.8 29.5 7.6
Section 504 Status 8539 2461.9 99.1 30.0 47.6 22.4
Economic Disadvantage Status 456172 2430.5 94.9 41.0 47.2 11.8
TABLE 5-58 GRADE 5 MATHEMATICS AVERAGE CLAIM 2/4 SCALE SCORE BY SELECTED DEMOGRAPHIC GROUPS,
2015-2016 ADMINISTRATION
Group
Scale Scores Reporting Categories (%)
N M SD Below
Standard
At/Near
Standard
Above
Standard
Total 831108 2472.7 121.2 37.0 44.2 18.8
Female 407023 2473.7 118.3 36.7 45.0 18.3
Male 423867 2471.7 124.0 37.2 43.4 19.4
American Indian or Alaska Native 11316 2439.3 102.8 53.0 40.1 6.9
Asian 10475 2555.4 115.4 16.8 42.1 41.0
Black/African American 8219 2453.1 106.4 47.5 42.7 9.8
Native Hawaiian or Pacific Islander 2238 2476.7 107.6 39.3 45.4 15.3
Hispanic/Latino Ethnicity 314286 2435.5 116.2 53.2 37.9 9.0
White 143584 2505.4 108.1 28.0 49.4 22.6
Two or More Races 8000 2500.6 113.4 30.9 46.5 22.6
Unidentified Race 353394 2490.2 121.9 26.6 47.9 25.5
LEP Status 134894 2389.8 111.9 70.1 27.0 2.9
IDEA Indicator 78110 2386.2 120.6 73.1 21.7 5.2
Section 504 Status 10090 2480.3 115.9 36.5 45.2 18.3
Economic Disadvantage Status 442330 2437.0 116.8 50.6 40.2 9.2

Smarter Balanced 2015–16 Summative Assessment Technical Report
Chapter 5: Scores, Scales and Norms
5-37
TABLE 5-59 GRADE 6 MATHEMATICS AVERAGE CLAIM 2/4 SCALE SCORE BY SELECTED DEMOGRAPHIC GROUPS,
2015-2016 ADMINISTRATION
Group
Scale Scores Reporting Categories (%)
N M SD Below
Standard
At/Near
Standard
Above
Standard
Total 825844 2499.1 125.0 32.0 49.7 18.4
Female 403820 2500.6 121.8 31.2 50.9 17.9
Male 421799 2497.7 128.0 32.7 48.5 18.8
American Indian or Alaska Native 11106 2456.0 114.3 43.9 48.7 7.4
Asian 10542 2581.6 129.9 14.0 43.6 42.5
Black/African American 7933 2467.6 118.9 41.5 48.7 9.8
Native Hawaiian or Pacific Islander 2029 2489.4 117.2 33.8 52.3 13.9
Hispanic/Latino Ethnicity 303772 2462.0 118.3 46.5 45.0 8.5
White 143822 2526.7 118.9 23.0 53.6 23.4
Two or More Races 13234 2507.2 124.1 29.1 51.5 19.4
Unidentified Race 358021 2517.6 124.6 23.6 52.4 24.1
LEP Status 109357 2404.2 114.9 66.3 31.2 2.4
IDEA Indicator 74157 2388.0 123.6 72.1 24.2 3.7
Section 504 Status 11318 2508.4 119.3 30.3 51.2 18.5
Economic Disadvantage Status 430665 2461.7 119.8 44.4 46.7 8.8
TABLE 5-60 GRADE 7 MATHEMATICS AVERAGE CLAIM 2/4 SCALE SCORE BY SELECTED DEMOGRAPHIC GROUPS,
2015-2016 ADMINISTRATION
Group
Scale Scores Reporting Categories (%)
N M SD Below
Standard
At/Near
Standard
Above
Standard
Total 819032 2508.5 136.6 30.7 48.6 20.7
Female 400319 2511.1 134.7 29.7 49.6 20.7
Male 418521 2506.0 138.5 31.7 47.7 20.6
American Indian or Alaska Native 10905 2463.0 129.0 41.3 50.4 8.3
Asian 10508 2605.6 131.4 10.5 42.1 47.4
Black/African American 7806 2478.6 131.4 36.3 52.8 10.9
Native Hawaiian or Pacific Islander 1909 2500.5 131.1 29.6 55.9 14.5
Hispanic/Latino Ethnicity 298093 2467.6 125.6 44.5 45.7 9.8
White 142360 2539.5 126.9 20.3 54.4 25.4
Two or More Races 12530 2520.6 136.9 26.1 52.0 21.9
Unidentified Race 358928 2527.8 140.5 23.8 49.0 27.2
LEP Status 90287 2400.8 116.8 66.6 30.7 2.7
IDEA Indicator 71053 2397.1 122.5 70.4 25.6 3.9
Section 504 Status 12256 2519.9 126.6 27.3 52.7 20.1
Economic Disadvantage Status 419171 2468.2 128.1 42.5 47.3 10.2

Smarter Balanced 2015–16 Summative Assessment Technical Report
Chapter 5: Scores, Scales and Norms
5-38
TABLE 5-61 GRADE 8 MATHEMATICS AVERAGE CLAIM 2/4 SCALE SCORE BY SELECTED DEMOGRAPHIC GROUPS,
2015-2016 ADMINISTRATION
Group
Scale Scores Reporting Categories (%)
N M SD Below
Standard
At/Near
Standard
Above
Standard
Total 803196 2515.3 152.4 27.9 52.8 19.3
Female 393015 2519.3 150.2 26.5 54.1 19.4
Male 409984 2511.4 154.4 29.3 51.5 19.2
American Indian or Alaska Native 10460 2484.3 129.6 39.2 52.4 8.4
Asian 10172 2636.8 150.3 11.3 40.3 48.4
Black/African American 7611 2494.6 134.6 36.1 53.3 10.6
Native Hawaiian or Pacific Islander 1827 2524.9 131.9 28.9 55.3 15.8
Hispanic/Latino Ethnicity 292983 2469.1 143.5 37.7 52.8 9.6
White 141354 2556.4 134.7 21.3 55.4 23.3
Two or More Races 12157 2541.6 140.7 25.5 54.0 20.5
Unidentified Race 350056 2534.3 155.9 22.7 52.2 25.1
LEP Status 78907 2400.1 129.8 56.9 40.5 2.6
IDEA Indicator 67608 2402.3 129.7 60.6 36.3 3.1
Section 504 Status 13182 2524.9 145.5 26.4 54.3 19.4
Economic Disadvantage Status 409428 2473.1 144.0 36.8 53.2 10.0
TABLE 5-62 GRADE 11 MATHEMATICS AVERAGE CLAIM 2/4 SCALE SCORE BY SELECTED DEMOGRAPHIC GROUPS,
2015-2016 ADMINISTRATION
Group
Scale Scores Reporting Categories (%)
N M SD Below
Standard
At/Near
Standard
Above
Standard
Total 565002 2543.2 155.1 33.0 51.4 15.6
Female 276135 2543.3 149.8 32.0 53.7 14.3
Male 288771 2543.1 160.0 33.9 49.3 16.8
American Indian or Alaska Native 6819 2512.3 145.3 37.7 56.2 6.1
Asian 6503 2625.3 157.1 15.2 53.9 30.9
Black/African American 5457 2504.4 146.5 38.3 56.0 5.7
Native Hawaiian or Pacific Islander 1141 2536.9 150.1 30.6 59.2 10.3
Hispanic/Latino Ethnicity 239413 2500.8 142.9 42.7 49.9 7.3
White 92558 2569.9 153.6 24.3 58.6 17.0
Two or More Races 8037 2551.6 152.1 28.4 58.4 13.2
Unidentified Race 221941 2576.6 156.7 26.5 50.0 23.6
LEP Status 45386 2420.7 128.1 66.1 31.8 2.1
IDEA Indicator 47954 2421.9 129.5 65.7 32.2 2.1
Section 504 Status 11150 2551.3 154.4 30.4 53.2 16.4
Economic Disadvantage Status 290574 2504.3 146.1 41.9 49.9 8.2

Smarter Balanced 2015–16 Summative Assessment Technical Report
Chapter 5: Scores, Scales and Norms
5-39
TABLE 5-63 GRADE 3 MATHEMATICS AVERAGE CLAIM 3 SCALE SCORE BY SELECTED DEMOGRAPHIC GROUPS,
2015-2016 ADMINISTRATION
Group
Scale Scores Reporting Categories (%)
N M SD Below
Standard
At/Near
Standard
Above
Standard
Total 837721 2422.7 95.9 20.7 52.8 26.5
Female 409070 2423.5 93.5 19.9 54.0 26.1
Male 428424 2421.9 98.1 21.4 51.6 27.0
American Indian or Alaska Native 11522 2382.1 87.9 43.4 45.1 11.4
Asian 9976 2476.5 96.6 13.1 38.0 48.9
Black/African American 8693 2395.0 88.6 37.3 47.5 15.2
Native Hawaiian or Pacific Islander 2073 2400.8 89.5 35.2 46.3 18.5
Hispanic/Latino Ethnicity 319616 2396.2 91.9 27.4 56.9 15.7
White 149106 2440.7 90.0 20.1 47.8 32.1
Two or More Races 9105 2441.7 92.8 20.3 47.0 32.7
Unidentified Race 348384 2438.1 96.1 14.7 51.8 33.5
LEP Status 186383 2380.8 90.7 32.5 56.3 11.2
IDEA Indicator 70817 2362.5 99.8 47.2 41.6 11.2
Section 504 Status 7012 2425.0 95.3 22.7 50.5 26.8
Economic Disadvantage Status 451419 2395.8 91.8 28.0 56.3 15.7
TABLE 5-64 GRADE 4 MATHEMATICS AVERAGE CLAIM 3 SCALE SCORE BY SELECTED DEMOGRAPHIC GROUPS,
2015-2016 ADMINISTRATION
Group
Scale Scores Reporting Categories (%)
N M SD Below
Standard
At/Near
Standard
Above
Standard
Total 845567 2460.8 97.4 27.6 49.6 22.8
Female 414090 2460.4 95.0 27.2 50.9 21.8
Male 431232 2461.1 99.7 28.0 48.4 23.6
American Indian or Alaska Native 11353 2421.1 90.3 47.8 43.3 9.0
Asian 9828 2524.5 103.1 14.3 39.6 46.1
Black/African American 8496 2436.3 90.3 41.5 46.4 12.1
Native Hawaiian or Pacific Islander 2188 2446.7 94.8 37.5 47.3 15.3
Hispanic/Latino Ethnicity 325116 2432.1 89.6 39.9 47.9 12.2
White 145502 2483.2 92.7 23.1 49.4 27.5
Two or More Races 8486 2481.4 97.0 25.9 46.4 27.7
Unidentified Race 354766 2476.2 99.1 18.3 51.7 30.0
LEP Status 168704 2409.6 86.0 49.3 44.3 6.4
IDEA Indicator 76779 2396.9 94.3 61.4 30.6 8.0
Section 504 Status 8539 2465.5 94.7 28.7 49.0 22.3
Economic Disadvantage Status 456172 2432.3 91.1 38.3 49.4 12.3

Smarter Balanced 2015–16 Summative Assessment Technical Report
Chapter 5: Scores, Scales and Norms
5-40
TABLE 5-65 GRADE 5 MATHEMATICS AVERAGE CLAIM 3 SCALE SCORE BY SELECTED DEMOGRAPHIC GROUPS,
2015-2016 ADMINISTRATION
Group
Scale Scores Reporting Categories (%)
N M SD Below
Standard
At/Near
Standard
Above
Standard
Total 831108 2482.4 107.5 34.7 47.0 18.2
Female 407023 2483.5 105.0 34.2 48.1 17.7
Male 423867 2481.4 110.0 35.3 46.0 18.7
American Indian or Alaska Native 11316 2439.5 100.0 57.4 35.0 7.6
Asian 10475 2552.8 107.3 18.6 36.9 44.5
Black/African American 8219 2454.2 99.4 50.3 39.1 10.6
Native Hawaiian or Pacific Islander 2238 2476.3 101.8 42.1 41.5 16.4
Hispanic/Latino Ethnicity 314286 2448.5 100.6 47.8 43.9 8.3
White 143584 2509.0 99.2 29.0 45.8 25.3
Two or More Races 8000 2503.5 104.4 32.5 42.1 25.4
Unidentified Race 353394 2500.2 108.4 25.7 50.8 23.5
LEP Status 134894 2411.8 93.2 63.5 33.7 2.8
IDEA Indicator 78110 2405.3 102.8 69.6 25.2 5.1
Section 504 Status 10090 2485.9 104.0 35.3 46.5 18.2
Economic Disadvantage Status 442330 2449.7 101.2 47.0 44.2 8.8
TABLE 5-66 GRADE 6 MATHEMATICS AVERAGE CLAIM 3 SCALE SCORE BY SELECTED DEMOGRAPHIC GROUPS,
2015-2016 ADMINISTRATION
Group
Scale Scores Reporting Categories (%)
N M SD Below
Standard
At/Near
Standard
Above
Standard
Total 825844 2505.5 117.4 28.2 53.4 18.5
Female 403820 2508.0 114.5 27.0 54.6 18.3
Male 421799 2503.1 120.1 29.2 52.1 18.6
American Indian or Alaska Native 11106 2453.6 111.2 55.1 37.8 7.1
Asian 10542 2580.5 120.0 17.7 38.6 43.7
Black/African American 7933 2468.4 111.5 49.7 40.5 9.8
Native Hawaiian or Pacific Islander 2029 2487.2 111.5 43.8 43.4 12.8
Hispanic/Latino Ethnicity 303772 2471.8 108.1 38.2 53.0 8.7
White 143822 2527.8 110.9 28.9 47.3 23.7
Two or More Races 13234 2507.8 116.6 37.0 43.4 19.6
Unidentified Race 358021 2523.8 119.9 19.1 56.9 24.0
LEP Status 109357 2423.1 99.3 55.2 42.6 2.2
IDEA Indicator 74157 2410.6 107.4 66.7 29.6 3.8
Section 504 Status 11318 2514.2 111.1 28.2 52.8 18.9
Economic Disadvantage Status 430665 2470.8 109.8 38.2 52.7 9.0

Smarter Balanced 2015–16 Summative Assessment Technical Report
Chapter 5: Scores, Scales and Norms
5-41
TABLE 5-67 GRADE 7 MATHEMATICS AVERAGE CLAIM 3 SCALE SCORE BY SELECTED DEMOGRAPHIC GROUPS,
2015-2016 ADMINISTRATION
Group
Scale Scores Reporting Categories (%)
N M SD Below
Standard
At/Near
Standard
Above
Standard
Total 819032 2520.2 125.9 25.1 54.0 20.9
Female 400319 2525.9 122.2 23.0 55.8 21.1
Male 418521 2514.8 129.2 27.1 52.3 20.6
American Indian or Alaska Native 10905 2468.8 119.8 47.4 43.5 9.1
Asian 10508 2601.9 129.4 14.3 37.0 48.7
Black/African American 7806 2476.1 121.2 45.0 43.9 11.1
Native Hawaiian or Pacific Islander 1909 2492.3 127.3 40.2 44.7 15.1
Hispanic/Latino Ethnicity 298093 2483.5 117.1 35.4 54.4 10.2
White 142360 2546.7 118.1 23.0 49.7 27.3
Two or More Races 12530 2524.3 128.4 30.8 46.0 23.2
Unidentified Race 358928 2538.7 127.9 17.4 56.2 26.5
LEP Status 90287 2422.9 109.8 54.6 42.5 2.9
IDEA Indicator 71053 2413.1 113.6 65.6 30.4 4.0
Section 504 Status 12256 2525.8 119.5 25.0 54.1 20.9
Economic Disadvantage Status 419171 2483.6 118.7 34.7 54.6 10.6
TABLE 5-68 GRADE 8 MATHEMATICS AVERAGE CLAIM 3 SCALE SCORE BY SELECTED DEMOGRAPHIC GROUPS,
2015-2016 ADMINISTRATION
Group
Scale Scores Reporting Categories (%)
N M SD Below
Standard
At/Near
Standard
Above
Standard
Total 803196 2536.6 133.5 20.7 59.3 19.9
Female 393015 2543.6 129.6 18.5 60.9 20.6
Male 409984 2529.8 136.8 22.8 57.8 19.3
American Indian or Alaska Native 10460 2483.8 122.7 21.5 69.2 9.3
Asian 10172 2629.7 145.1 4.5 45.9 49.6
Black/African American 7611 2500.3 121.2 11.8 76.7 11.5
Native Hawaiian or Pacific Islander 1827 2515.4 125.3 11.5 73.1 15.4
Hispanic/Latino Ethnicity 292983 2500.5 121.3 31.6 58.7 9.7
White 141354 2562.5 129.8 8.4 63.7 27.8
Two or More Races 12157 2542.9 133.8 11.8 65.3 22.9
Unidentified Race 350056 2554.5 136.9 17.4 58.0 24.6
LEP Status 78907 2440.7 113.4 46.6 50.4 3.0
IDEA Indicator 67608 2430.9 113.0 51.1 45.7 3.2
Section 504 Status 13182 2538.1 130.9 20.1 59.9 20.0
Economic Disadvantage Status 409428 2500.2 123.7 29.2 60.4 10.4
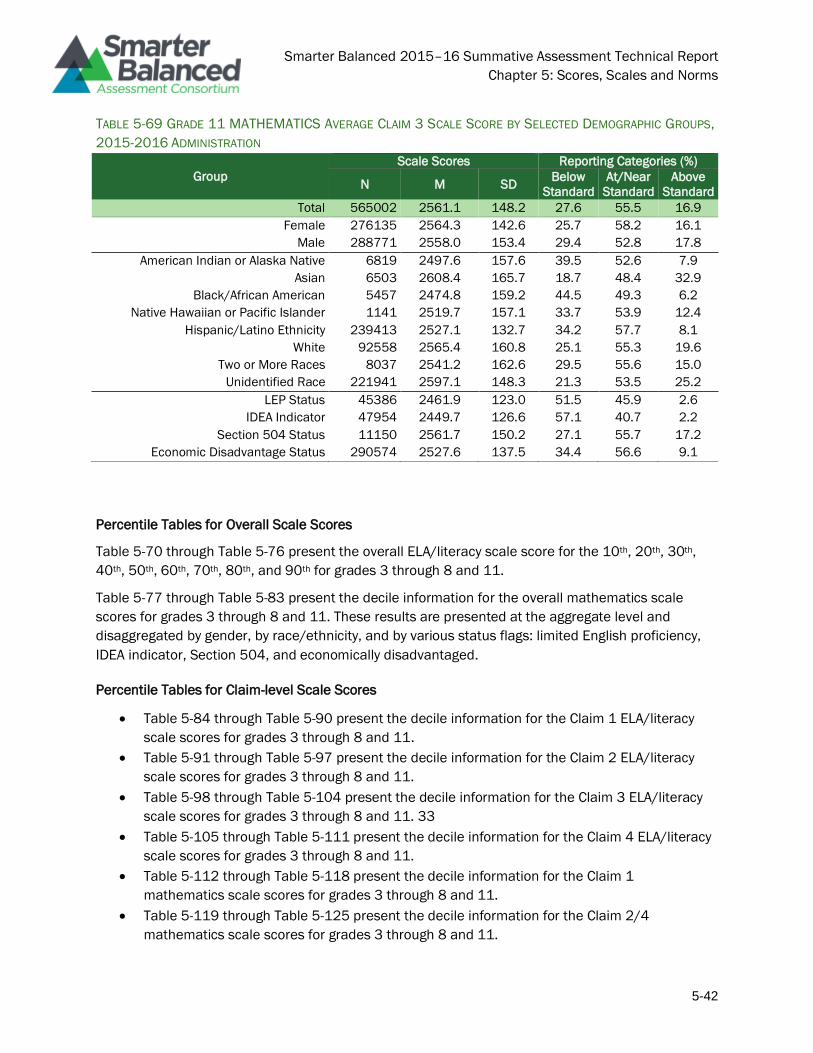
Smarter Balanced 2015–16 Summative Assessment Technical Report
Chapter 5: Scores, Scales and Norms
5-42
TABLE 5-69 GRADE 11 MATHEMATICS AVERAGE CLAIM 3 SCALE SCORE BY SELECTED DEMOGRAPHIC GROUPS,
2015-2016 ADMINISTRATION
Group
Scale Scores Reporting Categories (%)
N M SD Below
Standard
At/Near
Standard
Above
Standard
Total 565002 2561.1 148.2 27.6 55.5 16.9
Female 276135 2564.3 142.6 25.7 58.2 16.1
Male 288771 2558.0 153.4 29.4 52.8 17.8
American Indian or Alaska Native 6819 2497.6 157.6 39.5 52.6 7.9
Asian 6503 2608.4 165.7 18.7 48.4 32.9
Black/African American 5457 2474.8 159.2 44.5 49.3 6.2
Native Hawaiian or Pacific Islander 1141 2519.7 157.1 33.7 53.9 12.4
Hispanic/Latino Ethnicity 239413 2527.1 132.7 34.2 57.7 8.1
White 92558 2565.4 160.8 25.1 55.3 19.6
Two or More Races 8037 2541.2 162.6 29.5 55.6 15.0
Unidentified Race 221941 2597.1 148.3 21.3 53.5 25.2
LEP Status 45386 2461.9 123.0 51.5 45.9 2.6
IDEA Indicator 47954 2449.7 126.6 57.1 40.7 2.2
Section 504 Status 11150 2561.7 150.2 27.1 55.7 17.2
Economic Disadvantage Status 290574 2527.6 137.5 34.4 56.6 9.1
Percentile Tables for Overall Scale Scores
Table 5-70 through Table 5-76 present the overall ELA/literacy scale score for the 10th, 20th, 30th,
40th, 50th, 60th, 70th, 80th, and 90th for grades 3 through 8 and 11.
Table 5-77 through Table 5-83 present the decile information for the overall mathematics scale
scores for grades 3 through 8 and 11. These results are presented at the aggregate level and
disaggregated by gender, by race/ethnicity, and by various status flags: limited English proficiency,
IDEA indicator, Section 504, and economically disadvantaged.
Percentile Tables for Claim-level Scale Scores
• Table 5-84 through Table 5-90 present the decile information for the Claim 1 ELA/literacy
scale scores for grades 3 through 8 and 11.
• Table 5-91 through Table 5-97 present the decile information for the Claim 2 ELA/literacy
scale scores for grades 3 through 8 and 11.
• Table 5-98 through Table 5-104 present the decile information for the Claim 3 ELA/literacy
scale scores for grades 3 through 8 and 11. 33
• Table 5-105 through Table 5-111 present the decile information for the Claim 4 ELA/literacy
scale scores for grades 3 through 8 and 11.
• Table 5-112 through Table 5-118 present the decile information for the Claim 1
mathematics scale scores for grades 3 through 8 and 11.
• Table 5-119 through Table 5-125 present the decile information for the Claim 2/4
mathematics scale scores for grades 3 through 8 and 11.
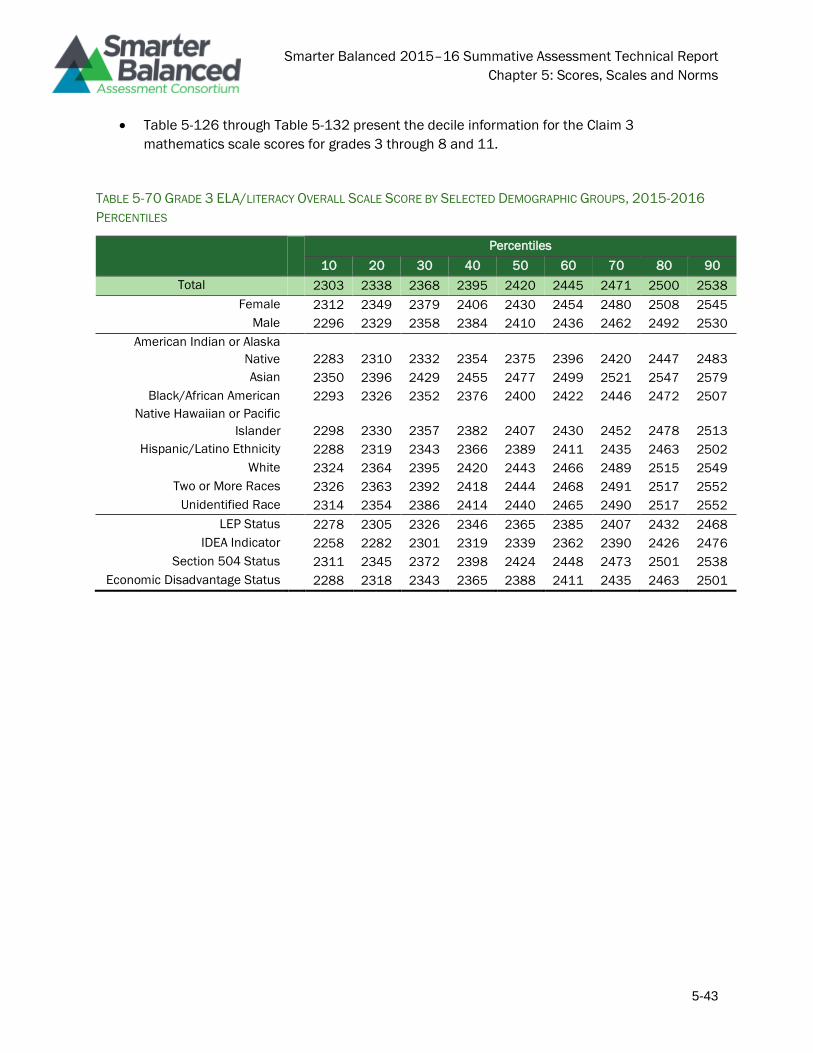
Smarter Balanced 2015–16 Summative Assessment Technical Report
Chapter 5: Scores, Scales and Norms
5-43
• Table 5-126 through Table 5-132 present the decile information for the Claim 3
mathematics scale scores for grades 3 through 8 and 11.
TABLE 5-70 GRADE 3 ELA/LITERACY OVERALL SCALE SCORE BY SELECTED DEMOGRAPHIC GROUPS, 2015-2016
PERCENTILES
Percentiles
10 20 30 40 50 60 70 80 90
Total 2303 2338 2368 2395 2420 2445 2471 2500 2538
Female 2312 2349 2379 2406 2430 2454 2480 2508 2545
Male 2296 2329 2358 2384 2410 2436 2462 2492 2530
American Indian or Alaska
Native
2283 2310 2332 2354 2375 2396 2420 2447 2483
Asian 2350 2396 2429 2455 2477 2499 2521 2547 2579
Black/African American 2293 2326 2352 2376 2400 2422 2446 2472 2507
Native Hawaiian or Pacific
Islander
2298 2330 2357 2382 2407 2430 2452 2478 2513
Hispanic/Latino Ethnicity 2288 2319 2343 2366 2389 2411 2435 2463 2502
White 2324 2364 2395 2420 2443 2466 2489 2515 2549
Two or More Races 2326 2363 2392 2418 2444 2468 2491 2517 2552
Unidentified Race 2314 2354 2386 2414 2440 2465 2490 2517 2552
LEP Status 2278 2305 2326 2346 2365 2385 2407 2432 2468
IDEA Indicator 2258 2282 2301 2319 2339 2362 2390 2426 2476
Section 504 Status 2311 2345 2372 2398 2424 2448 2473 2501 2538
Economic Disadvantage Status 2288 2318 2343 2365 2388 2411 2435 2463 2501

Smarter Balanced 2015–16 Summative Assessment Technical Report
Chapter 5: Scores, Scales and Norms
5-44
TABLE 5-71 GRADE 4 ELA/LITERACY OVERALL SCALE SCORE BY SELECTED DEMOGRAPHIC GROUPS, 2015-2016
PERCENTILES
Percentiles
10 20 30 40 50 60 70 80 90
Total 2335 2375 2408 2436 2464 2490 2516 2545 2583
Female 2347 2388 2420 2449 2475 2501 2526 2555 2591
Male 2326 2364 2395 2425 2452 2479 2506 2535 2573
American Indian or Alaska
Native
2310 2342 2367 2392 2415 2440 2465 2493 2529
Asian 2388 2442 2476 2504 2526 2548 2571 2596 2626
Black/African American 2326 2362 2391 2418 2443 2468 2491 2518 2553
Native Hawaiian or Pacific
Islander
2328 2369 2400 2428 2455 2480 2503 2528 2564
Hispanic/Latino Ethnicity 2318 2352 2380 2405 2430 2454 2480 2509 2546
White 2359 2404 2437 2464 2488 2511 2533 2559 2592
Two or More Races 2352 2395 2430 2458 2484 2508 2533 2561 2596
Unidentified Race 2349 2392 2427 2457 2485 2510 2535 2563 2599
LEP Status 2302 2332 2354 2374 2394 2415 2437 2464 2500
IDEA Indicator 2279 2304 2325 2345 2366 2390 2421 2458 2509
Section 504 Status 2343 2381 2412 2439 2465 2489 2514 2542 2580
Economic Disadvantage Status 2318 2351 2378 2404 2429 2454 2479 2508 2545

Smarter Balanced 2015–16 Summative Assessment Technical Report
Chapter 5: Scores, Scales and Norms
5-45
TABLE 5-72 GRADE 5 ELA/LITERACY OVERALL SCALE SCORE BY SELECTED DEMOGRAPHIC GROUPS, 2015-2016
PERCENTILES
Percentiles
10 20 30 40 50 60 70 80 90
Total 2375 2415 2448 2477 2504 2530 2556 2584 2621
Female 2391 2432 2464 2493 2519 2543 2568 2595 2632
Male 2364 2402 2433 2462 2490 2517 2543 2572 2610
American Indian or Alaska
Native
2345 2376 2401 2426 2451 2476 2503 2532 2571
Asian 2425 2478 2515 2541 2564 2585 2607 2633 2664
Black/African American 2357 2395 2423 2450 2476 2502 2528 2554 2592
Native Hawaiian or Pacific
Islander
2371 2409 2444 2470 2497 2524 2545 2572 2610
Hispanic/Latino Ethnicity 2358 2394 2421 2446 2471 2496 2522 2550 2587
White 2396 2440 2474 2502 2526 2549 2571 2597 2631
Two or More Races 2384 2427 2464 2493 2519 2543 2569 2596 2631
Unidentified Race 2389 2434 2467 2498 2524 2550 2574 2601 2637
LEP Status 2332 2363 2385 2404 2422 2441 2462 2487 2522
IDEA Indicator 2306 2336 2359 2379 2399 2421 2448 2484 2536
Section 504 Status 2381 2419 2447 2475 2502 2526 2550 2577 2614
Economic Disadvantage Status 2357 2392 2419 2444 2469 2494 2520 2548 2585
TABLE 5-73 GRADE 6 ELA/LITERACY OVERALL SCALE SCORE BY SELECTED DEMOGRAPHIC GROUPS, 2015-2016
PERCENTILES
Percentiles
10 20 30 40 50 60 70 80 90
Total 2396 2438 2471 2500 2526 2552 2578 2606 2642
Female 2414 2456 2489 2516 2541 2566 2591 2617 2652
Male 2382 2424 2456 2484 2511 2537 2564 2594 2631
American Indian or Alaska
Native
2369 2404 2432 2456 2480 2504 2528 2554 2593
Asian 2450 2502 2537 2563 2586 2608 2630 2653 2684
Black/African American 2379 2419 2450 2477 2501 2525 2550 2577 2613
Native Hawaiian or Pacific
Islander
2391 2431 2462 2487 2512 2537 2560 2587 2625
Hispanic/Latino Ethnicity 2377 2417 2447 2472 2496 2519 2544 2572 2608
White 2422 2466 2498 2523 2546 2569 2592 2617 2650
Two or More Races 2403 2447 2479 2506 2531 2554 2578 2606 2641
Unidentified Race 2407 2452 2487 2518 2546 2571 2596 2623 2656
LEP Status 2342 2374 2397 2418 2437 2456 2477 2501 2534
IDEA Indicator 2321 2353 2376 2397 2418 2440 2465 2496 2541
Section 504 Status 2408 2447 2477 2501 2525 2547 2571 2599 2636
Economic Disadvantage Status 2375 2414 2443 2469 2493 2517 2542 2571 2607

Smarter Balanced 2015–16 Summative Assessment Technical Report
Chapter 5: Scores, Scales and Norms
5-46
TABLE 5-74 GRADE 7 ELA/LITERACY OVERALL SCALE SCORE BY SELECTED DEMOGRAPHIC GROUPS, 2015-2016
PERCENTILES
Percentiles
10 20 30 40 50 60 70 80 90
Total 2413 2458 2493 2523 2550 2577 2604 2633 2671
Female 2432 2478 2512 2541 2567 2592 2617 2645 2681
Male 2399 2441 2475 2505 2533 2561 2589 2620 2659
American Indian or Alaska
Native
2383 2421 2450 2476 2502 2528 2556 2585 2624
Asian 2472 2529 2566 2592 2617 2639 2661 2687 2719
Black/African American 2395 2434 2466 2494 2523 2549 2574 2603 2640
Native Hawaiian or Pacific
Islander
2406 2445 2479 2506 2536 2559 2582 2612 2646
Hispanic/Latino Ethnicity 2394 2433 2463 2491 2516 2541 2567 2596 2634
White 2440 2487 2521 2549 2574 2597 2620 2646 2680
Two or More Races 2417 2464 2498 2527 2555 2582 2606 2636 2673
Unidentified Race 2426 2474 2511 2542 2569 2596 2622 2650 2686
LEP Status 2358 2386 2407 2426 2444 2463 2484 2509 2544
IDEA Indicator 2348 2376 2397 2416 2436 2457 2482 2514 2561
Section 504 Status 2427 2466 2497 2524 2548 2573 2597 2626 2665
Economic Disadvantage Status 2392 2431 2461 2488 2514 2539 2565 2595 2633
TABLE 5-75 GRADE 8 ELA/LITERACY OVERALL SCALE SCORE BY SELECTED DEMOGRAPHIC GROUPS, 2015-2016
PERCENTILES
Percentiles
10 20 30 40 50 60 70 80 90
Total 2430 2475 2509 2540 2568 2595 2622 2650 2688
Female 2453 2497 2530 2559 2586 2611 2635 2662 2699
Male 2414 2457 2491 2521 2549 2578 2606 2637 2676
American Indian or Alaska
Native
2403 2440 2471 2498 2523 2549 2577 2606 2644
Asian 2488 2547 2583 2610 2635 2656 2678 2704 2739
Black/African American 2410 2451 2483 2511 2540 2566 2595 2624 2660
Native Hawaiian or Pacific
Islander
2430 2470 2507 2536 2558 2585 2608 2636 2670
Hispanic/Latino Ethnicity 2413 2453 2483 2510 2535 2560 2587 2615 2652
White 2454 2501 2536 2565 2591 2614 2638 2664 2698
Two or More Races 2439 2484 2519 2549 2577 2601 2626 2653 2691
Unidentified Race 2442 2490 2526 2558 2587 2613 2639 2667 2704
LEP Status 2372 2400 2422 2441 2459 2477 2497 2521 2557
IDEA Indicator 2362 2390 2412 2433 2452 2473 2497 2528 2575
Section 504 Status 2440 2481 2512 2540 2566 2591 2616 2643 2681
Economic Disadvantage Status 2411 2450 2480 2507 2533 2559 2586 2615 2652

Smarter Balanced 2015–16 Summative Assessment Technical Report
Chapter 5: Scores, Scales and Norms
5-47
TABLE 5-76 GRADE 11 ELA/LITERACY OVERALL SCALE SCORE BY SELECTED DEMOGRAPHIC GROUPS, 2015-2016
PERCENTILES
Percentiles
10 20 30 40 50 60 70 80 90
Total 2442 2498 2541 2577 2609 2638 2666 2698 2737
Female 2469 2524 2564 2597 2625 2651 2677 2707 2745
Male 2422 2476 2519 2557 2591 2623 2654 2687 2729
American Indian or Alaska
Native
2426 2475 2516 2549 2578 2606 2631 2659 2695
Asian 2449 2512 2563 2601 2632 2661 2689 2720 2758
Black/African American 2402 2448 2486 2518 2548 2579 2610 2644 2689
Native Hawaiian or Pacific
Islander
2422 2482 2526 2556 2587 2621 2645 2681 2718
Hispanic/Latino Ethnicity 2427 2477 2517 2550 2580 2608 2636 2666 2706
White 2452 2511 2553 2587 2616 2643 2669 2698 2735
Two or More Races 2457 2509 2546 2575 2603 2627 2653 2681 2719
Unidentified Race 2464 2528 2575 2611 2641 2668 2695 2724 2761
LEP Status 2372 2403 2426 2447 2468 2489 2513 2542 2581
IDEA Indicator 2370 2403 2428 2452 2476 2501 2531 2567 2617
Section 504 Status 2455 2510 2548 2580 2609 2637 2666 2697 2735
Economic Disadvantage Status 2423 2473 2512 2546 2577 2606 2635 2666 2707
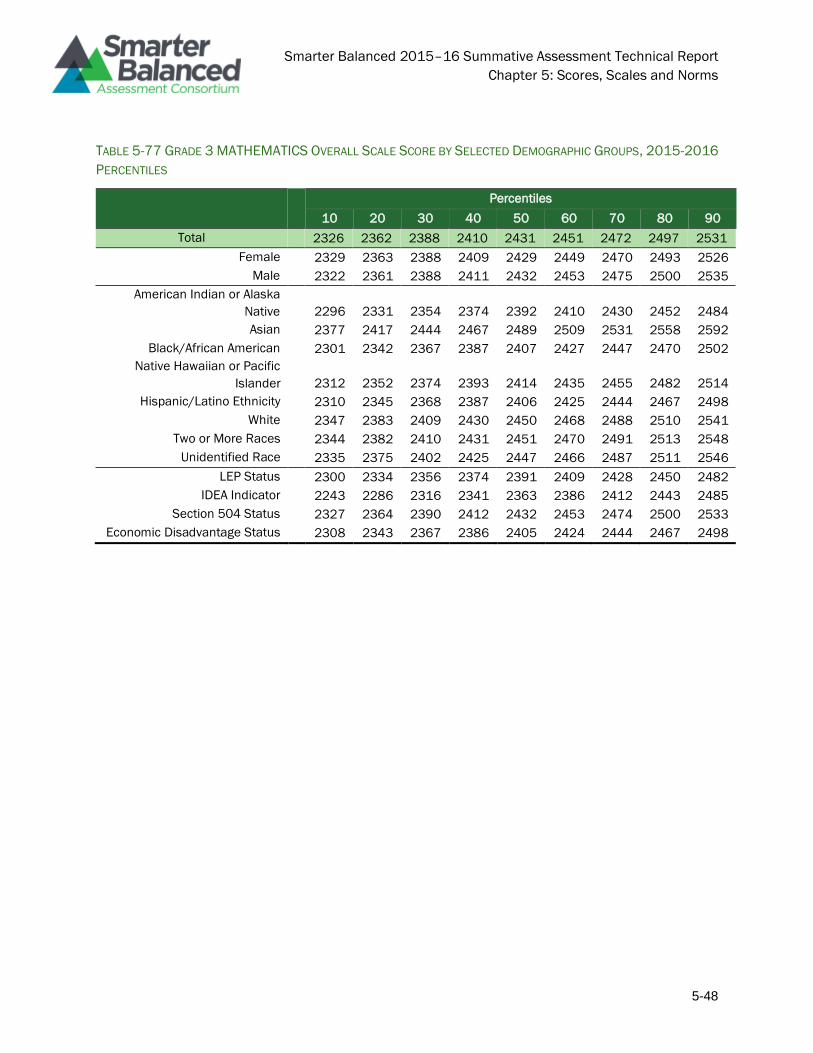
Smarter Balanced 2015–16 Summative Assessment Technical Report
Chapter 5: Scores, Scales and Norms
5-48
TABLE 5-77 GRADE 3 MATHEMATICS OVERALL SCALE SCORE BY SELECTED DEMOGRAPHIC GROUPS, 2015-2016
PERCENTILES
Percentiles
10 20 30 40 50 60 70 80 90
Total 2326 2362 2388 2410 2431 2451 2472 2497 2531
Female 2329 2363 2388 2409 2429 2449 2470 2493 2526
Male 2322 2361 2388 2411 2432 2453 2475 2500 2535
American Indian or Alaska
Native
2296 2331 2354 2374 2392 2410 2430 2452 2484
Asian 2377 2417 2444 2467 2489 2509 2531 2558 2592
Black/African American 2301 2342 2367 2387 2407 2427 2447 2470 2502
Native Hawaiian or Pacific
Islander
2312 2352 2374 2393 2414 2435 2455 2482 2514
Hispanic/Latino Ethnicity 2310 2345 2368 2387 2406 2425 2444 2467 2498
White 2347 2383 2409 2430 2450 2468 2488 2510 2541
Two or More Races 2344 2382 2410 2431 2451 2470 2491 2513 2548
Unidentified Race 2335 2375 2402 2425 2447 2466 2487 2511 2546
LEP Status 2300 2334 2356 2374 2391 2409 2428 2450 2482
IDEA Indicator 2243 2286 2316 2341 2363 2386 2412 2443 2485
Section 504 Status 2327 2364 2390 2412 2432 2453 2474 2500 2533
Economic Disadvantage Status 2308 2343 2367 2386 2405 2424 2444 2467 2498

Smarter Balanced 2015–16 Summative Assessment Technical Report
Chapter 5: Scores, Scales and Norms
5-49
TABLE 5-78 GRADE 4 MATHEMATICS OVERALL SCALE SCORE BY SELECTED DEMOGRAPHIC GROUPS, 2015-2016
PERCENTILES
Percentiles
10 20 30 40 50 60 70 80 90
Total 2362 2397 2423 2446 2467 2489 2512 2539 2575
Female 2365 2398 2422 2444 2465 2486 2508 2534 2569
Male 2359 2396 2423 2447 2469 2492 2515 2543 2580
American Indian or Alaska
Native
2336 2365 2389 2409 2428 2447 2469 2492 2525
Asian 2412 2456 2487 2513 2535 2557 2580 2605 2640
Black/African American 2344 2380 2404 2426 2445 2466 2486 2511 2544
Native Hawaiian or Pacific
Islander
2354 2389 2415 2436 2456 2478 2499 2524 2559
Hispanic/Latino Ethnicity 2346 2377 2399 2419 2437 2457 2477 2501 2536
White 2385 2422 2448 2469 2489 2509 2530 2554 2587
Two or More Races 2379 2415 2443 2467 2487 2509 2533 2560 2596
Unidentified Race 2375 2413 2440 2465 2486 2507 2530 2556 2590
LEP Status 2334 2361 2381 2399 2415 2432 2451 2474 2507
IDEA Indicator 2299 2329 2351 2370 2390 2412 2437 2469 2516
Section 504 Status 2370 2402 2427 2448 2469 2491 2513 2540 2578
Economic Disadvantage Status 2346 2377 2400 2420 2439 2458 2479 2503 2538
TABLE 5-79 GRADE 5 MATHEMATICS OVERALL SCALE SCORE BY SELECTED DEMOGRAPHIC GROUPS, 2015-2016
PERCENTILES
Percentiles
10 20 30 40 50 60 70 80 90
Total 2376 2412 2440 2466 2491 2516 2543 2572 2610
Female 2381 2415 2441 2465 2489 2513 2539 2568 2606
Male 2370 2408 2438 2466 2493 2519 2547 2576 2614
American Indian or Alaska
Native
2354 2385 2408 2429 2450 2471 2495 2523 2560
Asian 2431 2480 2515 2543 2568 2590 2614 2641 2677
Black/African American 2357 2392 2419 2441 2464 2487 2512 2540 2578
Native Hawaiian or Pacific
Islander
2373 2408 2438 2465 2492 2514 2539 2566 2601
Hispanic/Latino Ethnicity 2360 2392 2415 2436 2457 2479 2503 2531 2568
White 2401 2441 2470 2495 2518 2541 2564 2589 2622
Two or More Races 2390 2429 2461 2489 2512 2538 2564 2592 2627
Unidentified Race 2387 2427 2458 2486 2512 2537 2562 2591 2625
LEP Status 2339 2369 2389 2406 2422 2439 2459 2484 2521
IDEA Indicator 2311 2342 2365 2385 2404 2424 2449 2484 2536
Section 504 Status 2383 2420 2447 2472 2496 2519 2544 2572 2608
Economic Disadvantage Status 2359 2391 2415 2436 2458 2480 2505 2533 2570
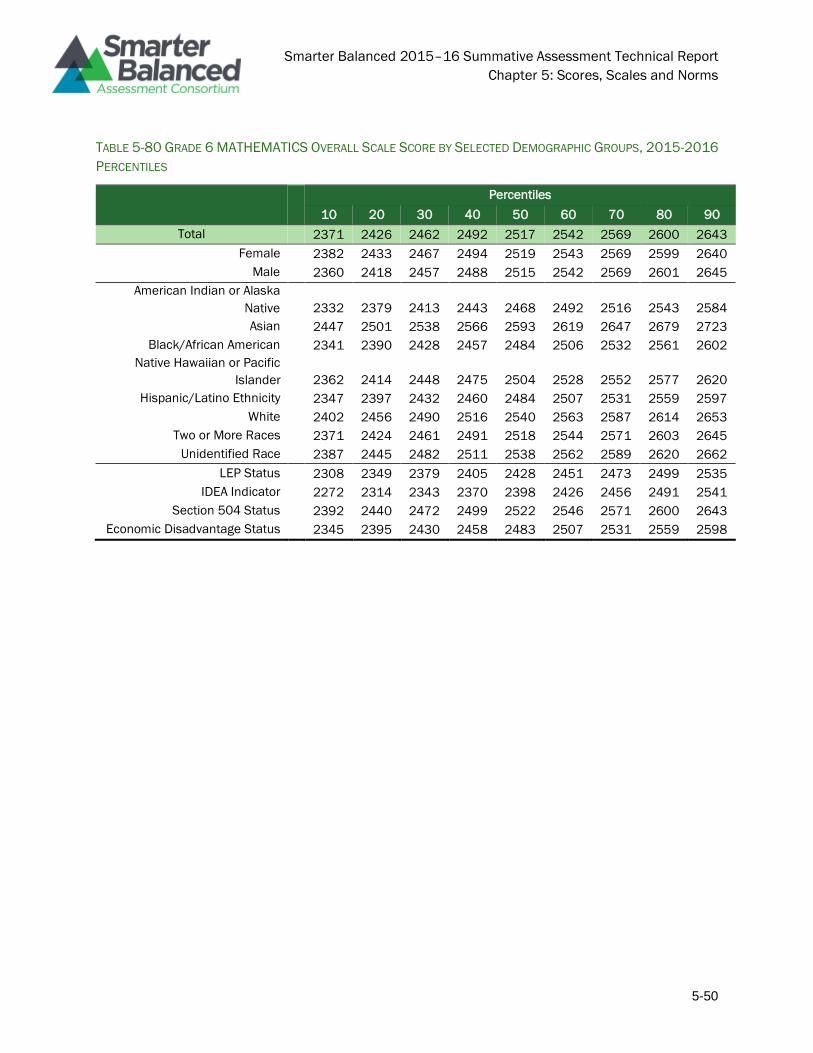
Smarter Balanced 2015–16 Summative Assessment Technical Report
Chapter 5: Scores, Scales and Norms
5-50
TABLE 5-80 GRADE 6 MATHEMATICS OVERALL SCALE SCORE BY SELECTED DEMOGRAPHIC GROUPS, 2015-2016
PERCENTILES
Percentiles
10 20 30 40 50 60 70 80 90
Total 2371 2426 2462 2492 2517 2542 2569 2600 2643
Female 2382 2433 2467 2494 2519 2543 2569 2599 2640
Male 2360 2418 2457 2488 2515 2542 2569 2601 2645
American Indian or Alaska
Native
2332 2379 2413 2443 2468 2492 2516 2543 2584
Asian 2447 2501 2538 2566 2593 2619 2647 2679 2723
Black/African American 2341 2390 2428 2457 2484 2506 2532 2561 2602
Native Hawaiian or Pacific
Islander
2362 2414 2448 2475 2504 2528 2552 2577 2620
Hispanic/Latino Ethnicity 2347 2397 2432 2460 2484 2507 2531 2559 2597
White 2402 2456 2490 2516 2540 2563 2587 2614 2653
Two or More Races 2371 2424 2461 2491 2518 2544 2571 2603 2645
Unidentified Race 2387 2445 2482 2511 2538 2562 2589 2620 2662
LEP Status 2308 2349 2379 2405 2428 2451 2473 2499 2535
IDEA Indicator 2272 2314 2343 2370 2398 2426 2456 2491 2541
Section 504 Status 2392 2440 2472 2499 2522 2546 2571 2600 2643
Economic Disadvantage Status 2345 2395 2430 2458 2483 2507 2531 2559 2598

Smarter Balanced 2015–16 Summative Assessment Technical Report
Chapter 5: Scores, Scales and Norms
5-51
TABLE 5-81 GRADE 7 MATHEMATICS OVERALL SCALE SCORE BY SELECTED DEMOGRAPHIC GROUPS, 2015-2016
PERCENTILES
Percentiles
10 20 30 40 50 60 70 80 90
Total 2380 2436 2475 2507 2533 2561 2590 2624 2669
Female 2391 2444 2480 2510 2536 2561 2590 2623 2667
Male 2370 2427 2468 2502 2531 2560 2590 2625 2671
American Indian or Alaska
Native
2346 2390 2428 2459 2487 2515 2540 2569 2610
Asian 2461 2525 2563 2593 2621 2647 2674 2704 2748
Black/African American 2346 2396 2438 2469 2498 2526 2552 2583 2623
Native Hawaiian or Pacific
Islander
2357 2415 2460 2492 2520 2542 2569 2601 2647
Hispanic/Latino Ethnicity 2355 2403 2440 2470 2498 2522 2546 2577 2619
White 2417 2473 2511 2537 2560 2584 2610 2639 2678
Two or More Races 2381 2439 2482 2515 2541 2568 2596 2627 2672
Unidentified Race 2398 2455 2494 2525 2554 2583 2613 2646 2689
LEP Status 2314 2349 2376 2400 2425 2449 2475 2505 2546
IDEA Indicator 2296 2329 2355 2379 2405 2434 2465 2504 2556
Section 504 Status 2404 2453 2488 2515 2538 2562 2588 2622 2665
Economic Disadvantage Status 2355 2403 2440 2470 2498 2523 2548 2579 2621
TABLE 5-82 GRADE 8 MATHEMATICS OVERALL SCALE SCORE BY SELECTED DEMOGRAPHIC GROUPS, 2015-2016
PERCENTILES
Percentiles
10 20 30 40 50 60 70 80 90
Total 2392 2441 2478 2510 2541 2573 2608 2647 2699
Female 2404 2452 2487 2518 2547 2579 2611 2648 2697
Male 2382 2431 2469 2502 2534 2567 2604 2645 2700
American Indian or Alaska
Native 2360 2405 2437 2465 2491 2518 2550 2584 2633
Asian 2467 2531 2579 2618 2650 2682 2713 2748 2797
Black/African American 2364 2410 2445 2476 2504 2533 2564 2602 2651
Native Hawaiian or Pacific
Islander 2387 2437 2473 2503 2532 2562 2594 2625 2676
Hispanic/Latino Ethnicity 2371 2416 2450 2478 2504 2531 2560 2596 2644
White 2419 2472 2509 2540 2570 2600 2631 2665 2711
Two or More Races 2396 2448 2486 2518 2550 2582 2616 2654 2704
Unidentified Race 2406 2457 2496 2530 2563 2597 2632 2670 2721
LEP Status 2326 2364 2391 2415 2437 2459 2484 2515 2565
IDEA Indicator 2308 2346 2373 2396 2419 2443 2471 2507 2561
Section 504 Status 2403 2452 2486 2514 2543 2573 2605 2644 2696
Economic Disadvantage Status 2370 2415 2448 2477 2504 2531 2562 2598 2647

Smarter Balanced 2015–16 Summative Assessment Technical Report
Chapter 5: Scores, Scales and Norms
5-52
TABLE 5-83 GRADE 11 MATHEMATICS OVERALL SCALE SCORE BY SELECTED DEMOGRAPHIC GROUPS, 2015-
2016 PERCENTILES
Percentiles
10 20 30 40 50 60 70 80 90
Total 2408 2459 2498 2535 2569 2602 2636 2677 2732
Female 2422 2471 2508 2543 2575 2605 2637 2675 2725
Male 2395 2448 2489 2526 2563 2599 2635 2680 2739
American Indian or Alaska
Native
2388 2433 2464 2492 2521 2551 2581 2615 2663
Asian 2463 2523 2567 2605 2639 2672 2704 2741 2789
Black/African American 2375 2421 2455 2484 2515 2544 2574 2610 2657
Native Hawaiian or Pacific
Islander
2402 2450 2489 2518 2548 2578 2609 2643 2694
Hispanic/Latino Ethnicity 2390 2436 2470 2500 2530 2562 2593 2628 2676
White 2426 2481 2521 2555 2585 2614 2644 2682 2732
Two or More Races 2414 2463 2499 2532 2564 2592 2623 2658 2715
Unidentified Race 2429 2488 2534 2574 2609 2642 2678 2718 2769
LEP Status 2337 2375 2400 2423 2444 2466 2491 2524 2581
IDEA Indicator 2327 2366 2392 2414 2436 2458 2484 2518 2575
Section 504 Status 2420 2470 2506 2540 2571 2601 2634 2675 2730
Economic Disadvantage Status 2389 2435 2470 2500 2531 2563 2595 2631 2683
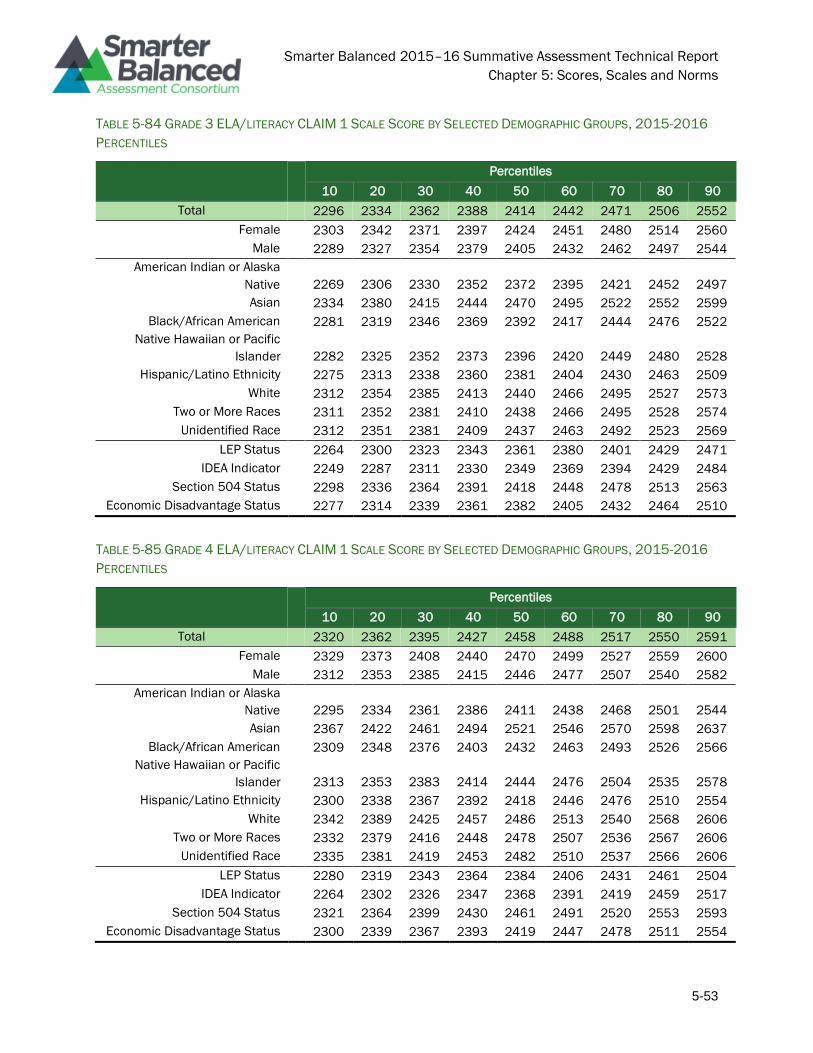
Smarter Balanced 2015–16 Summative Assessment Technical Report
Chapter 5: Scores, Scales and Norms
5-53
TABLE 5-84 GRADE 3 ELA/LITERACY CLAIM 1 SCALE SCORE BY SELECTED DEMOGRAPHIC GROUPS, 2015-2016
PERCENTILES
Percentiles
10 20 30 40 50 60 70 80 90
Total 2296 2334 2362 2388 2414 2442 2471 2506 2552
Female 2303 2342 2371 2397 2424 2451 2480 2514 2560
Male 2289 2327 2354 2379 2405 2432 2462 2497 2544
American Indian or Alaska
Native
2269 2306 2330 2352 2372 2395 2421 2452 2497
Asian 2334 2380 2415 2444 2470 2495 2522 2552 2599
Black/African American 2281 2319 2346 2369 2392 2417 2444 2476 2522
Native Hawaiian or Pacific
Islander
2282 2325 2352 2373 2396 2420 2449 2480 2528
Hispanic/Latino Ethnicity 2275 2313 2338 2360 2381 2404 2430 2463 2509
White 2312 2354 2385 2413 2440 2466 2495 2527 2573
Two or More Races 2311 2352 2381 2410 2438 2466 2495 2528 2574
Unidentified Race 2312 2351 2381 2409 2437 2463 2492 2523 2569
LEP Status 2264 2300 2323 2343 2361 2380 2401 2429 2471
IDEA Indicator 2249 2287 2311 2330 2349 2369 2394 2429 2484
Section 504 Status 2298 2336 2364 2391 2418 2448 2478 2513 2563
Economic Disadvantage Status 2277 2314 2339 2361 2382 2405 2432 2464 2510
TABLE 5-85 GRADE 4 ELA/LITERACY CLAIM 1 SCALE SCORE BY SELECTED DEMOGRAPHIC GROUPS, 2015-2016
PERCENTILES
Percentiles
10 20 30 40 50 60 70 80 90
Total 2320 2362 2395 2427 2458 2488 2517 2550 2591
Female 2329 2373 2408 2440 2470 2499 2527 2559 2600
Male 2312 2353 2385 2415 2446 2477 2507 2540 2582
American Indian or Alaska
Native
2295 2334 2361 2386 2411 2438 2468 2501 2544
Asian 2367 2422 2461 2494 2521 2546 2570 2598 2637
Black/African American 2309 2348 2376 2403 2432 2463 2493 2526 2566
Native Hawaiian or Pacific
Islander
2313 2353 2383 2414 2444 2476 2504 2535 2578
Hispanic/Latino Ethnicity 2300 2338 2367 2392 2418 2446 2476 2510 2554
White 2342 2389 2425 2457 2486 2513 2540 2568 2606
Two or More Races 2332 2379 2416 2448 2478 2507 2536 2567 2606
Unidentified Race 2335 2381 2419 2453 2482 2510 2537 2566 2606
LEP Status 2280 2319 2343 2364 2384 2406 2431 2461 2504
IDEA Indicator 2264 2302 2326 2347 2368 2391 2419 2459 2517
Section 504 Status 2321 2364 2399 2430 2461 2491 2520 2553 2593
Economic Disadvantage Status 2300 2339 2367 2393 2419 2447 2478 2511 2554

Smarter Balanced 2015–16 Summative Assessment Technical Report
Chapter 5: Scores, Scales and Norms
5-54
TABLE 5-86 GRADE 5 ELA/LITERACY CLAIM 1 SCALE SCORE BY SELECTED DEMOGRAPHIC GROUPS, 2015-2016
PERCENTILES
Percentiles
10 20 30 40 50 60 70 80 90
Total 2353 2397 2431 2462 2493 2522 2552 2584 2627
Female 2366 2411 2447 2478 2507 2535 2563 2595 2636
Male 2342 2385 2417 2447 2477 2508 2539 2573 2616
American Indian or Alaska
Native
2320 2363 2393 2418 2444 2472 2502 2537 2582
Asian 2401 2455 2496 2526 2552 2578 2603 2632 2671
Black/African American 2330 2375 2405 2433 2464 2494 2524 2560 2603
Native Hawaiian or Pacific
Islander
2346 2390 2424 2453 2486 2516 2545 2577 2620
Hispanic/Latino Ethnicity 2331 2373 2402 2428 2455 2482 2512 2545 2588
White 2372 2420 2458 2491 2520 2546 2573 2603 2643
Two or More Races 2360 2406 2445 2478 2509 2537 2566 2598 2641
Unidentified Race 2371 2417 2454 2487 2516 2543 2570 2601 2642
LEP Status 2303 2344 2369 2390 2409 2429 2452 2480 2521
IDEA Indicator 2288 2330 2357 2378 2398 2419 2446 2483 2541
Section 504 Status 2353 2395 2430 2461 2492 2520 2549 2581 2624
Economic Disadvantage Status 2332 2373 2402 2429 2455 2483 2513 2546 2589
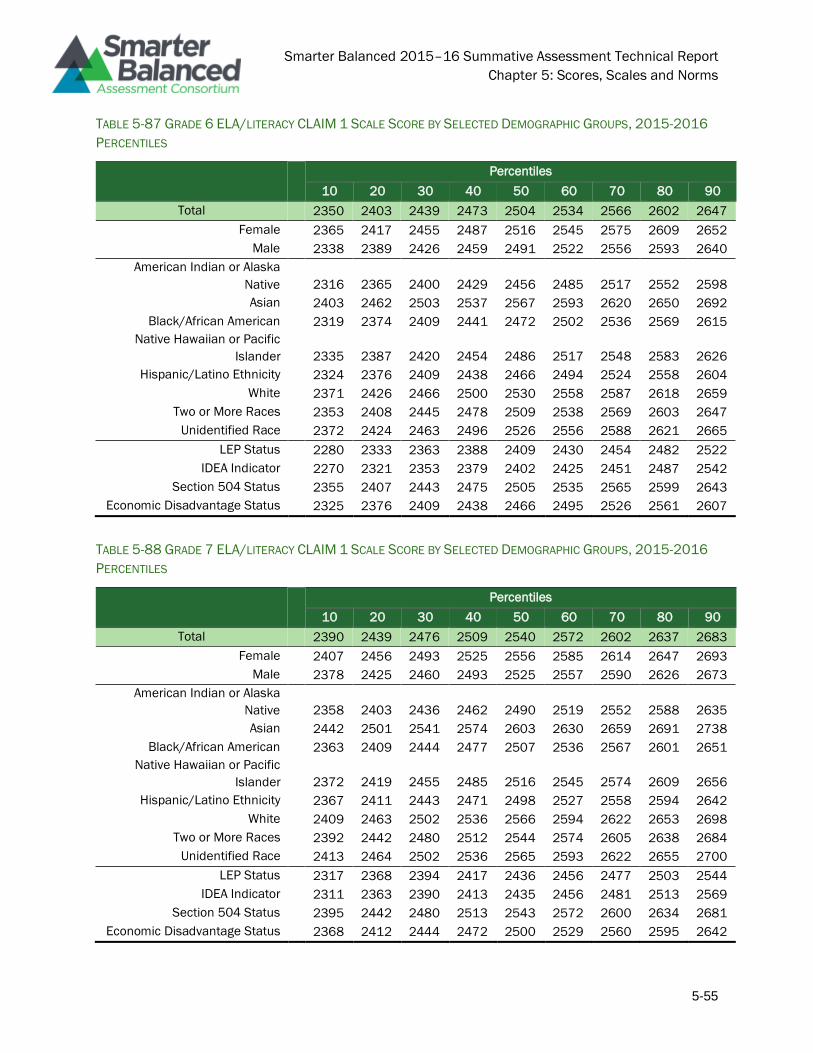
Smarter Balanced 2015–16 Summative Assessment Technical Report
Chapter 5: Scores, Scales and Norms
5-55
TABLE 5-87 GRADE 6 ELA/LITERACY CLAIM 1 SCALE SCORE BY SELECTED DEMOGRAPHIC GROUPS, 2015-2016
PERCENTILES
Percentiles
10 20 30 40 50 60 70 80 90
Total 2350 2403 2439 2473 2504 2534 2566 2602 2647
Female 2365 2417 2455 2487 2516 2545 2575 2609 2652
Male 2338 2389 2426 2459 2491 2522 2556 2593 2640
American Indian or Alaska
Native
2316 2365 2400 2429 2456 2485 2517 2552 2598
Asian 2403 2462 2503 2537 2567 2593 2620 2650 2692
Black/African American 2319 2374 2409 2441 2472 2502 2536 2569 2615
Native Hawaiian or Pacific
Islander
2335 2387 2420 2454 2486 2517 2548 2583 2626
Hispanic/Latino Ethnicity 2324 2376 2409 2438 2466 2494 2524 2558 2604
White 2371 2426 2466 2500 2530 2558 2587 2618 2659
Two or More Races 2353 2408 2445 2478 2509 2538 2569 2603 2647
Unidentified Race 2372 2424 2463 2496 2526 2556 2588 2621 2665
LEP Status 2280 2333 2363 2388 2409 2430 2454 2482 2522
IDEA Indicator 2270 2321 2353 2379 2402 2425 2451 2487 2542
Section 504 Status 2355 2407 2443 2475 2505 2535 2565 2599 2643
Economic Disadvantage Status 2325 2376 2409 2438 2466 2495 2526 2561 2607
TABLE 5-88 GRADE 7 ELA/LITERACY CLAIM 1 SCALE SCORE BY SELECTED DEMOGRAPHIC GROUPS, 2015-2016
PERCENTILES
Percentiles
10 20 30 40 50 60 70 80 90
Total 2390 2439 2476 2509 2540 2572 2602 2637 2683
Female 2407 2456 2493 2525 2556 2585 2614 2647 2693
Male 2378 2425 2460 2493 2525 2557 2590 2626 2673
American Indian or Alaska
Native
2358 2403 2436 2462 2490 2519 2552 2588 2635
Asian 2442 2501 2541 2574 2603 2630 2659 2691 2738
Black/African American 2363 2409 2444 2477 2507 2536 2567 2601 2651
Native Hawaiian or Pacific
Islander
2372 2419 2455 2485 2516 2545 2574 2609 2656
Hispanic/Latino Ethnicity 2367 2411 2443 2471 2498 2527 2558 2594 2642
White 2409 2463 2502 2536 2566 2594 2622 2653 2698
Two or More Races 2392 2442 2480 2512 2544 2574 2605 2638 2684
Unidentified Race 2413 2464 2502 2536 2565 2593 2622 2655 2700
LEP Status 2317 2368 2394 2417 2436 2456 2477 2503 2544
IDEA Indicator 2311 2363 2390 2413 2435 2456 2481 2513 2569
Section 504 Status 2395 2442 2480 2513 2543 2572 2600 2634 2681
Economic Disadvantage Status 2368 2412 2444 2472 2500 2529 2560 2595 2642

Smarter Balanced 2015–16 Summative Assessment Technical Report
Chapter 5: Scores, Scales and Norms
5-56
TABLE 5-89 GRADE 8 ELA/LITERACY CLAIM 1 SCALE SCORE BY SELECTED DEMOGRAPHIC GROUPS, 2015-2016
PERCENTILES
Percentiles
10 20 30 40 50 60 70 80 90
Total 2416 2465 2501 2534 2565 2594 2623 2656 2700
Female 2433 2482 2518 2549 2578 2606 2634 2666 2709
Male 2402 2450 2486 2519 2551 2582 2613 2646 2690
American Indian or Alaska
Native
2383 2431 2464 2493 2522 2551 2579 2613 2657
Asian 2471 2529 2568 2597 2624 2650 2676 2705 2748
Black/African American 2392 2440 2473 2503 2532 2563 2592 2625 2667
Native Hawaiian or Pacific
Islander
2405 2460 2496 2527 2554 2576 2606 2639 2679
Hispanic/Latino Ethnicity 2394 2439 2472 2500 2527 2555 2584 2616 2659
White 2437 2490 2529 2561 2589 2615 2641 2669 2708
Two or More Races 2424 2474 2510 2542 2572 2599 2627 2658 2700
Unidentified Race 2434 2484 2523 2556 2586 2615 2643 2675 2718
LEP Status 2341 2388 2415 2437 2457 2477 2498 2524 2563
IDEA Indicator 2333 2383 2411 2434 2456 2478 2504 2537 2588
Section 504 Status 2419 2467 2504 2537 2566 2593 2620 2652 2692
Economic Disadvantage Status 2393 2439 2472 2501 2528 2556 2586 2619 2663
TABLE 5-90 GRADE 11 ELA/LITERACY CLAIM 1 SCALE SCORE BY SELECTED DEMOGRAPHIC GROUPS, 2015-2016
PERCENTILES
Percentiles
10 20 30 40 50 60 70 80 90
Total 2432 2489 2531 2566 2598 2629 2660 2696 2744
Female 2450 2506 2545 2578 2608 2637 2667 2701 2748
Male 2417 2474 2517 2554 2588 2620 2653 2690 2740
American Indian or Alaska
Native
2414 2472 2510 2543 2574 2603 2632 2668 2713
Asian 2433 2490 2539 2580 2618 2649 2682 2721 2772
Black/African American 2389 2442 2480 2512 2544 2577 2613 2652 2700
Native Hawaiian or Pacific
Islander
2408 2465 2507 2539 2572 2606 2644 2680 2724
Hispanic/Latino Ethnicity 2414 2469 2507 2539 2569 2598 2628 2662 2707
White 2442 2503 2546 2581 2613 2643 2673 2708 2755
Two or More Races 2437 2496 2534 2565 2594 2624 2654 2685 2731
Unidentified Race 2456 2518 2562 2597 2628 2657 2688 2722 2769
LEP Status 2342 2392 2423 2448 2471 2492 2517 2545 2586
IDEA Indicator 2353 2401 2434 2462 2486 2513 2544 2581 2637
Section 504 Status 2448 2504 2544 2579 2608 2639 2669 2705 2752
Economic Disadvantage Status 2411 2466 2505 2538 2568 2597 2628 2662 2709

Smarter Balanced 2015–16 Summative Assessment Technical Report
Chapter 5: Scores, Scales and Norms
5-57
TABLE 5-91 GRADE 3 ELA/LITERACY CLAIM 2 SCALE SCORE BY SELECTED DEMOGRAPHIC GROUPS, 2015-2016
PERCENTILES
Percentiles
10 20 30 40 50 60 70 80 90
Total 2280 2325 2360 2389 2415 2441 2468 2499 2542
Female 2293 2339 2374 2402 2428 2453 2480 2510 2552
Male 2269 2314 2347 2376 2403 2429 2457 2487 2530
American Indian or Alaska
Native
2252 2293 2321 2346 2370 2393 2418 2447 2485
Asian 2335 2387 2421 2449 2475 2498 2523 2552 2597
Black/African American 2270 2313 2345 2372 2398 2421 2446 2475 2513
Native Hawaiian or Pacific
Islander
2281 2321 2354 2381 2408 2431 2456 2483 2519
Hispanic/Latino Ethnicity 2260 2303 2334 2361 2386 2411 2436 2465 2506
White 2306 2353 2386 2413 2437 2461 2485 2513 2553
Two or More Races 2309 2354 2386 2414 2440 2464 2488 2515 2558
Unidentified Race 2291 2338 2374 2405 2433 2459 2486 2516 2558
LEP Status 2245 2287 2315 2340 2363 2386 2410 2438 2477
IDEA Indicator 2210 2254 2282 2307 2332 2358 2388 2424 2473
Section 504 Status 2290 2333 2364 2393 2417 2441 2467 2495 2536
Economic Disadvantage Status 2259 2302 2332 2360 2385 2410 2435 2465 2505
TABLE 5-92 GRADE 4 ELA/LITERACY CLAIM 2 SCALE SCORE BY SELECTED DEMOGRAPHIC GROUPS, 2015-2016
PERCENTILES
Percentiles
10 20 30 40 50 60 70 80 90
Total 2326 2372 2406 2434 2461 2488 2517 2549 2596
Female 2344 2390 2423 2451 2478 2504 2532 2564 2611
Male 2311 2357 2390 2419 2446 2472 2500 2533 2579
American Indian or Alaska
Native
2295 2336 2364 2391 2415 2440 2466 2495 2535
Asian 2386 2438 2474 2505 2532 2556 2583 2615 2660
Black/African American 2316 2362 2393 2421 2444 2470 2497 2528 2566
Native Hawaiian or Pacific
Islander
2321 2372 2402 2431 2458 2482 2508 2539 2579
Hispanic/Latino Ethnicity 2305 2350 2381 2408 2433 2458 2483 2513 2555
White 2352 2399 2432 2459 2484 2509 2535 2564 2606
Two or More Races 2347 2394 2428 2457 2484 2511 2539 2571 2616
Unidentified Race 2339 2386 2420 2450 2478 2506 2535 2569 2616
LEP Status 2282 2324 2353 2377 2399 2422 2446 2473 2510
IDEA Indicator 2244 2288 2318 2343 2367 2393 2422 2458 2509
Section 504 Status 2336 2378 2408 2434 2457 2483 2511 2542 2585
Economic Disadvantage Status 2304 2347 2378 2405 2430 2455 2482 2512 2554

Smarter Balanced 2015–16 Summative Assessment Technical Report
Chapter 5: Scores, Scales and Norms
5-58
TABLE 5-93 GRADE 5 ELA/LITERACY CLAIM 2 SCALE SCORE BY SELECTED DEMOGRAPHIC GROUPS, 2015-2016
PERCENTILES
Percentiles
10 20 30 40 50 60 70 80 90
Total 2363 2408 2443 2474 2503 2530 2559 2591 2638
Female 2384 2429 2464 2495 2522 2548 2576 2608 2655
Male 2347 2392 2424 2454 2483 2511 2540 2572 2617
American Indian or Alaska
Native
2324 2365 2396 2420 2446 2473 2501 2533 2576
Asian 2416 2473 2511 2541 2565 2590 2617 2649 2692
Black/African American 2343 2389 2420 2447 2475 2503 2531 2562 2603
Native Hawaiian or Pacific
Islander
2360 2405 2441 2474 2503 2528 2555 2584 2625
Hispanic/Latino Ethnicity 2344 2387 2418 2446 2473 2500 2527 2558 2601
White 2383 2430 2466 2496 2523 2548 2573 2603 2646
Two or More Races 2373 2420 2459 2490 2519 2545 2573 2606 2650
Unidentified Race 2376 2423 2460 2491 2520 2547 2576 2610 2657
LEP Status 2310 2351 2379 2402 2424 2447 2471 2500 2538
IDEA Indicator 2273 2318 2347 2372 2395 2419 2447 2484 2538
Section 504 Status 2368 2408 2440 2470 2497 2523 2551 2583 2627
Economic Disadvantage Status 2341 2384 2415 2443 2470 2497 2524 2555 2597
TABLE 5-94 GRADE 6 ELA/LITERACY CLAIM 2 SCALE SCORE BY SELECTED DEMOGRAPHIC GROUPS, 2015-2016
PERCENTILES
Percentiles
10 20 30 40 50 60 70 80 90
Total 2384 2434 2470 2498 2524 2549 2576 2608 2651
Female 2407 2456 2490 2517 2542 2567 2593 2624 2666
Male 2366 2416 2451 2480 2507 2532 2559 2590 2633
American Indian or Alaska
Native
2352 2397 2428 2455 2480 2504 2529 2556 2598
Asian 2443 2500 2533 2560 2584 2607 2631 2661 2702
Black/African American 2367 2414 2449 2478 2504 2527 2552 2581 2622
Native Hawaiian or Pacific
Islander
2387 2432 2463 2492 2517 2540 2566 2596 2634
Hispanic/Latino Ethnicity 2365 2413 2447 2474 2499 2521 2545 2573 2614
White 2413 2461 2495 2521 2544 2568 2592 2621 2662
Two or More Races 2392 2439 2474 2503 2528 2551 2577 2608 2649
Unidentified Race 2393 2444 2480 2512 2540 2566 2593 2625 2667
LEP Status 2315 2363 2393 2418 2441 2463 2485 2510 2543
IDEA Indicator 2285 2335 2368 2394 2418 2443 2469 2501 2544
Section 504 Status 2395 2441 2473 2498 2521 2544 2569 2598 2642
Economic Disadvantage Status 2361 2408 2441 2469 2494 2518 2543 2571 2613
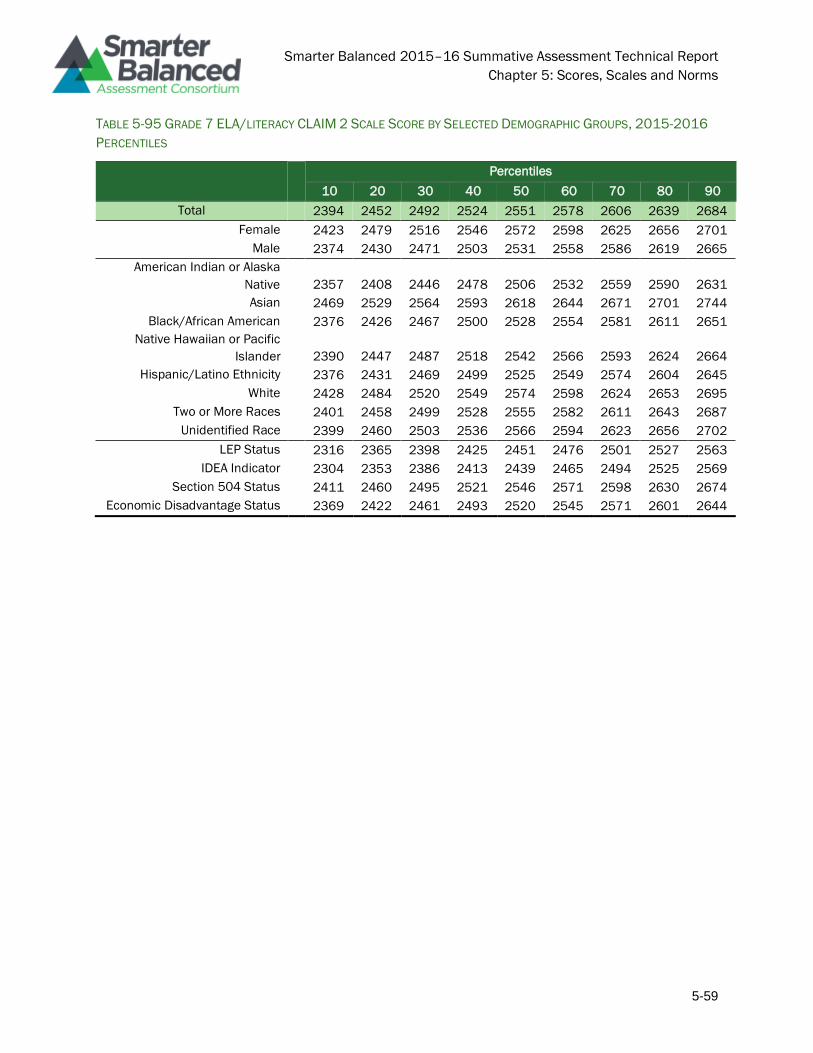
Smarter Balanced 2015–16 Summative Assessment Technical Report
Chapter 5: Scores, Scales and Norms
5-59
TABLE 5-95 GRADE 7 ELA/LITERACY CLAIM 2 SCALE SCORE BY SELECTED DEMOGRAPHIC GROUPS, 2015-2016
PERCENTILES
Percentiles
10 20 30 40 50 60 70 80 90
Total 2394 2452 2492 2524 2551 2578 2606 2639 2684
Female 2423 2479 2516 2546 2572 2598 2625 2656 2701
Male 2374 2430 2471 2503 2531 2558 2586 2619 2665
American Indian or Alaska
Native
2357 2408 2446 2478 2506 2532 2559 2590 2631
Asian 2469 2529 2564 2593 2618 2644 2671 2701 2744
Black/African American 2376 2426 2467 2500 2528 2554 2581 2611 2651
Native Hawaiian or Pacific
Islander
2390 2447 2487 2518 2542 2566 2593 2624 2664
Hispanic/Latino Ethnicity 2376 2431 2469 2499 2525 2549 2574 2604 2645
White 2428 2484 2520 2549 2574 2598 2624 2653 2695
Two or More Races 2401 2458 2499 2528 2555 2582 2611 2643 2687
Unidentified Race 2399 2460 2503 2536 2566 2594 2623 2656 2702
LEP Status 2316 2365 2398 2425 2451 2476 2501 2527 2563
IDEA Indicator 2304 2353 2386 2413 2439 2465 2494 2525 2569
Section 504 Status 2411 2460 2495 2521 2546 2571 2598 2630 2674
Economic Disadvantage Status 2369 2422 2461 2493 2520 2545 2571 2601 2644

Smarter Balanced 2015–16 Summative Assessment Technical Report
Chapter 5: Scores, Scales and Norms
5-60
TABLE 5-96 GRADE 8 ELA/LITERACY CLAIM 2 SCALE SCORE BY SELECTED DEMOGRAPHIC GROUPS, 2015-2016
PERCENTILES
Percentiles
10 20 30 40 50 60 70 80 90
Total 2416 2469 2506 2537 2565 2593 2622 2656 2704
Female 2446 2496 2532 2561 2588 2615 2643 2676 2722
Male 2392 2447 2484 2515 2543 2571 2600 2634 2681
American Indian or Alaska
Native
2374 2427 2462 2492 2519 2546 2575 2607 2652
Asian 2480 2538 2576 2606 2633 2659 2687 2719 2765
Black/African American 2382 2438 2479 2510 2540 2567 2597 2630 2675
Native Hawaiian or Pacific
Islander
2410 2469 2505 2532 2560 2585 2614 2645 2685
Hispanic/Latino Ethnicity 2396 2449 2484 2512 2538 2564 2591 2622 2665
White 2438 2493 2530 2560 2587 2613 2641 2673 2716
Two or More Races 2415 2473 2510 2540 2569 2597 2627 2659 2704
Unidentified Race 2427 2481 2519 2551 2579 2608 2638 2673 2721
LEP Status 2330 2380 2413 2440 2462 2484 2507 2533 2569
IDEA Indicator 2309 2361 2396 2425 2451 2475 2501 2532 2578
Section 504 Status 2424 2472 2506 2534 2561 2588 2615 2647 2693
Economic Disadvantage Status 2391 2443 2479 2507 2533 2560 2587 2619 2663
TABLE 5-97 GRADE 11 ELA/LITERACY CLAIM 2 SCALE SCORE BY SELECTED DEMOGRAPHIC GROUPS, 2015-2016
PERCENTILES
Percentiles
10 20 30 40 50 60 70 80 90
Total 2418 2488 2536 2574 2607 2639 2672 2711 2766
Female 2457 2521 2564 2598 2629 2658 2690 2728 2782
Male 2388 2459 2509 2548 2584 2617 2652 2692 2747
American Indian or Alaska
Native
2388 2458 2505 2542 2573 2602 2627 2657 2699
Asian 2422 2508 2559 2597 2628 2660 2693 2726 2780
Black/African American 2351 2424 2475 2512 2546 2577 2609 2643 2693
Native Hawaiian or Pacific
Islander
2405 2474 2524 2559 2591 2622 2649 2682 2722
Hispanic/Latino Ethnicity 2397 2464 2510 2546 2578 2608 2639 2675 2725
White 2430 2502 2548 2583 2613 2640 2669 2702 2750
Two or More Races 2428 2493 2535 2567 2595 2622 2648 2680 2728
Unidentified Race 2446 2520 2569 2607 2641 2674 2708 2747 2795
LEP Status 2299 2359 2400 2433 2461 2490 2520 2551 2595
IDEA Indicator 2299 2358 2400 2434 2465 2495 2528 2564 2615
Section 504 Status 2431 2496 2536 2572 2601 2630 2663 2699 2753
Economic Disadvantage Status 2391 2458 2505 2541 2574 2606 2638 2675 2726
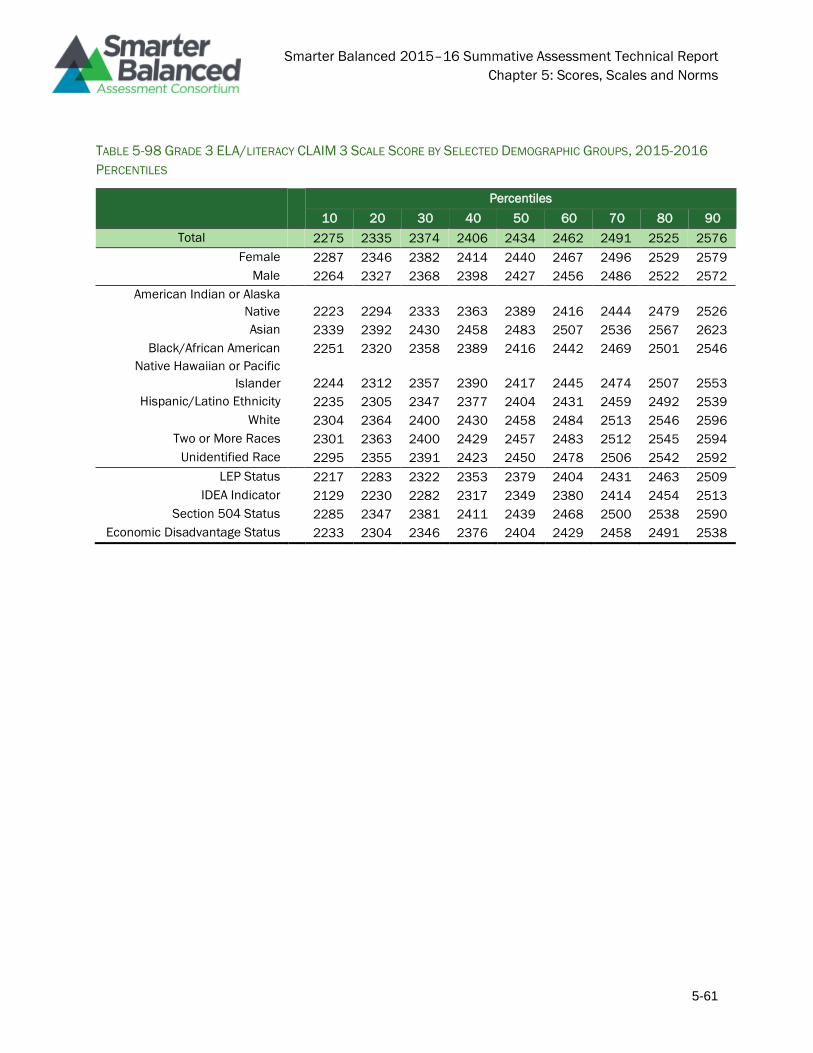
Smarter Balanced 2015–16 Summative Assessment Technical Report
Chapter 5: Scores, Scales and Norms
5-61
TABLE 5-98 GRADE 3 ELA/LITERACY CLAIM 3 SCALE SCORE BY SELECTED DEMOGRAPHIC GROUPS, 2015-2016
PERCENTILES
Percentiles
10 20 30 40 50 60 70 80 90
Total 2275 2335 2374 2406 2434 2462 2491 2525 2576
Female 2287 2346 2382 2414 2440 2467 2496 2529 2579
Male 2264 2327 2368 2398 2427 2456 2486 2522 2572
American Indian or Alaska
Native
2223 2294 2333 2363 2389 2416 2444 2479 2526
Asian 2339 2392 2430 2458 2483 2507 2536 2567 2623
Black/African American 2251 2320 2358 2389 2416 2442 2469 2501 2546
Native Hawaiian or Pacific
Islander
2244 2312 2357 2390 2417 2445 2474 2507 2553
Hispanic/Latino Ethnicity 2235 2305 2347 2377 2404 2431 2459 2492 2539
White 2304 2364 2400 2430 2458 2484 2513 2546 2596
Two or More Races 2301 2363 2400 2429 2457 2483 2512 2545 2594
Unidentified Race 2295 2355 2391 2423 2450 2478 2506 2542 2592
LEP Status 2217 2283 2322 2353 2379 2404 2431 2463 2509
IDEA Indicator 2129 2230 2282 2317 2349 2380 2414 2454 2513
Section 504 Status 2285 2347 2381 2411 2439 2468 2500 2538 2590
Economic Disadvantage Status 2233 2304 2346 2376 2404 2429 2458 2491 2538

Smarter Balanced 2015–16 Summative Assessment Technical Report
Chapter 5: Scores, Scales and Norms
5-62
TABLE 5-99 GRADE 4 ELA/LITERACY CLAIM 3 SCALE SCORE BY SELECTED DEMOGRAPHIC GROUPS, 2015-2016
PERCENTILES
Percentiles
10 20 30 40 50 60 70 80 90
Total 2307 2369 2411 2444 2477 2507 2541 2579 2638
Female 2315 2374 2414 2447 2479 2508 2542 2579 2638
Male 2300 2364 2407 2442 2475 2506 2540 2579 2639
American Indian or Alaska
Native
2255 2321 2361 2396 2427 2457 2489 2530 2583
Asian 2362 2429 2471 2499 2531 2558 2593 2634 2694
Black/African American 2279 2346 2387 2420 2451 2480 2512 2551 2611
Native Hawaiian or Pacific
Islander
2273 2339 2384 2423 2455 2489 2523 2559 2619
Hispanic/Latino Ethnicity 2278 2339 2380 2412 2442 2475 2504 2543 2596
White 2336 2396 2436 2471 2499 2531 2562 2604 2662
Two or More Races 2325 2387 2427 2461 2494 2527 2558 2598 2656
Unidentified Race 2332 2391 2433 2467 2496 2527 2558 2596 2653
LEP Status 2243 2309 2347 2379 2408 2436 2467 2500 2551
IDEA Indicator 2207 2267 2315 2348 2381 2415 2452 2496 2561
Section 504 Status 2319 2378 2417 2451 2483 2511 2547 2590 2645
Economic Disadvantage Status 2278 2339 2379 2412 2441 2474 2503 2542 2596

Smarter Balanced 2015–16 Summative Assessment Technical Report
Chapter 5: Scores, Scales and Norms
5-63
TABLE 5-100 GRADE 5 ELA/LITERACY CLAIM 3 SCALE SCORE BY SELECTED DEMOGRAPHIC GROUPS, 2015-2016
PERCENTILES
Percentiles
10 20 30 40 50 60 70 80 90
Total 2315 2384 2427 2464 2498 2532 2566 2603 2654
Female 2325 2389 2434 2471 2505 2537 2570 2607 2657
Male 2308 2378 2421 2459 2492 2526 2561 2600 2651
American Indian or Alaska
Native
2259 2333 2373 2406 2441 2475 2512 2555 2609
Asian 2368 2439 2483 2523 2555 2586 2616 2651 2701
Black/African American 2264 2342 2393 2430 2467 2500 2533 2574 2628
Native Hawaiian or Pacific
Islander
2284 2367 2409 2445 2479 2516 2550 2592 2645
Hispanic/Latino Ethnicity 2276 2346 2392 2426 2459 2491 2526 2567 2620
White 2341 2407 2450 2487 2521 2553 2584 2620 2670
Two or More Races 2329 2396 2441 2477 2512 2543 2578 2615 2667
Unidentified Race 2344 2411 2454 2490 2524 2553 2585 2620 2669
LEP Status 2242 2298 2342 2377 2404 2434 2464 2500 2554
IDEA Indicator 2206 2259 2321 2350 2388 2420 2456 2504 2570
Section 504 Status 2330 2389 2433 2470 2501 2531 2567 2606 2658
Economic Disadvantage Status 2276 2346 2392 2427 2459 2491 2525 2566 2618
TABLE 5-101 GRADE 6 ELA/LITERACY CLAIM 3 SCALE SCORE BY SELECTED DEMOGRAPHIC GROUPS, 2015-2016
PERCENTILES
Percentiles
10 20 30 40 50 60 70 80 90
Total 2369 2433 2473 2508 2540 2571 2606 2645 2706
Female 2382 2445 2486 2517 2552 2581 2616 2654 2712
Male 2351 2422 2461 2499 2530 2562 2597 2634 2697
American Indian or Alaska
Native
2315 2381 2430 2460 2497 2527 2562 2603 2659
Asian 2426 2488 2528 2563 2597 2626 2662 2707 2775
Black/African American 2330 2405 2448 2490 2518 2552 2583 2623 2683
Native Hawaiian or Pacific
Islander
2338 2415 2457 2496 2524 2555 2586 2628 2686
Hispanic/Latino Ethnicity 2331 2404 2446 2482 2510 2542 2573 2613 2667
White 2391 2454 2499 2532 2563 2594 2627 2670 2724
Two or More Races 2373 2440 2484 2516 2549 2580 2616 2656 2718
Unidentified Race 2389 2449 2491 2523 2557 2585 2620 2659 2719
LEP Status 2284 2337 2383 2418 2447 2475 2505 2542 2591
IDEA Indicator 2223 2314 2355 2391 2428 2457 2496 2538 2599
Section 504 Status 2383 2445 2486 2516 2548 2578 2613 2652 2715
Economic Disadvantage Status 2331 2403 2445 2478 2508 2540 2571 2611 2665

Smarter Balanced 2015–16 Summative Assessment Technical Report
Chapter 5: Scores, Scales and Norms
5-64
TABLE 5-102 GRADE 7 ELA/LITERACY CLAIM 3 SCALE SCORE BY SELECTED DEMOGRAPHIC GROUPS, 2015-2016
PERCENTILES
Percentiles
10 20 30 40 50 60 70 80 90
Total 2382 2445 2488 2523 2557 2589 2624 2663 2722
Female 2396 2456 2497 2532 2565 2596 2631 2670 2729
Male 2375 2437 2479 2516 2550 2582 2616 2656 2716
American Indian or Alaska
Native
2345 2406 2443 2479 2511 2541 2577 2616 2671
Asian 2441 2504 2546 2580 2611 2642 2673 2712 2774
Black/African American 2355 2422 2461 2496 2530 2561 2595 2638 2695
Native Hawaiian or Pacific
Islander
2369 2429 2468 2501 2531 2566 2597 2643 2702
Hispanic/Latino Ethnicity 2354 2415 2456 2487 2518 2550 2585 2624 2680
White 2419 2476 2517 2552 2584 2614 2649 2688 2745
Two or More Races 2387 2454 2493 2530 2561 2593 2630 2670 2729
Unidentified Race 2407 2467 2511 2545 2576 2608 2641 2680 2738
LEP Status 2303 2352 2386 2421 2445 2472 2500 2535 2587
IDEA Indicator 2281 2345 2381 2416 2443 2473 2507 2547 2607
Section 504 Status 2407 2461 2499 2533 2564 2596 2629 2666 2726
Economic Disadvantage Status 2354 2415 2455 2486 2518 2550 2583 2623 2679

Smarter Balanced 2015–16 Summative Assessment Technical Report
Chapter 5: Scores, Scales and Norms
5-65
TABLE 5-103 GRADE 8 ELA/LITERACY CLAIM 3 SCALE SCORE BY SELECTED DEMOGRAPHIC GROUPS, 2015-2016
PERCENTILES
Percentiles
10 20 30 40 50 60 70 80 90
Total 2404 2465 2506 2540 2570 2601 2633 2672 2731
Female 2422 2480 2519 2551 2580 2609 2641 2679 2738
Male 2390 2450 2493 2528 2559 2590 2625 2664 2723
American Indian or Alaska
Native
2369 2429 2469 2501 2532 2561 2593 2629 2685
Asian 2465 2524 2563 2594 2624 2652 2686 2728 2791
Black/African American 2384 2443 2486 2519 2550 2580 2612 2646 2705
Native Hawaiian or Pacific
Islander
2398 2454 2492 2528 2557 2585 2621 2663 2716
Hispanic/Latino Ethnicity 2382 2440 2479 2511 2540 2568 2598 2635 2687
White 2435 2493 2531 2563 2592 2622 2654 2692 2751
Two or More Races 2421 2480 2517 2550 2579 2608 2639 2679 2738
Unidentified Race 2417 2479 2521 2555 2586 2617 2650 2689 2750
LEP Status 2311 2367 2405 2436 2461 2488 2516 2547 2592
IDEA Indicator 2302 2361 2402 2434 2463 2492 2525 2562 2617
Section 504 Status 2418 2474 2514 2546 2575 2605 2637 2675 2737
Economic Disadvantage Status 2378 2438 2476 2509 2538 2567 2597 2634 2687
TABLE 5-104 GRADE 11 ELA/LITERACY CLAIM 3 SCALE SCORE BY SELECTED DEMOGRAPHIC GROUPS, 2015-
2016 PERCENTILES
Percentiles
10 20 30 40 50 60 70 80 90
Total 2409 2476 2523 2562 2599 2636 2674 2718 2778
Female 2428 2492 2537 2575 2610 2644 2680 2722 2780
Male 2394 2461 2508 2549 2588 2626 2667 2713 2776
American Indian or Alaska
Native
2389 2451 2497 2534 2567 2602 2637 2682 2742
Asian 2416 2482 2536 2576 2616 2655 2694 2741 2806
Black/African American 2368 2429 2474 2515 2551 2584 2622 2665 2728
Native Hawaiian or Pacific
Islander
2382 2449 2506 2542 2577 2608 2647 2687 2742
Hispanic/Latino Ethnicity 2395 2456 2500 2537 2571 2606 2643 2687 2747
White 2410 2482 2530 2570 2607 2643 2680 2722 2783
Two or More Races 2423 2484 2524 2561 2594 2628 2664 2709 2768
Unidentified Race 2433 2504 2552 2593 2629 2665 2702 2744 2795
LEP Status 2322 2377 2411 2441 2468 2495 2525 2561 2614
IDEA Indicator 2324 2381 2418 2451 2482 2513 2548 2591 2655
Section 504 Status 2421 2487 2534 2571 2607 2643 2680 2724 2784
Economic Disadvantage Status 2390 2452 2496 2533 2568 2603 2641 2684 2746
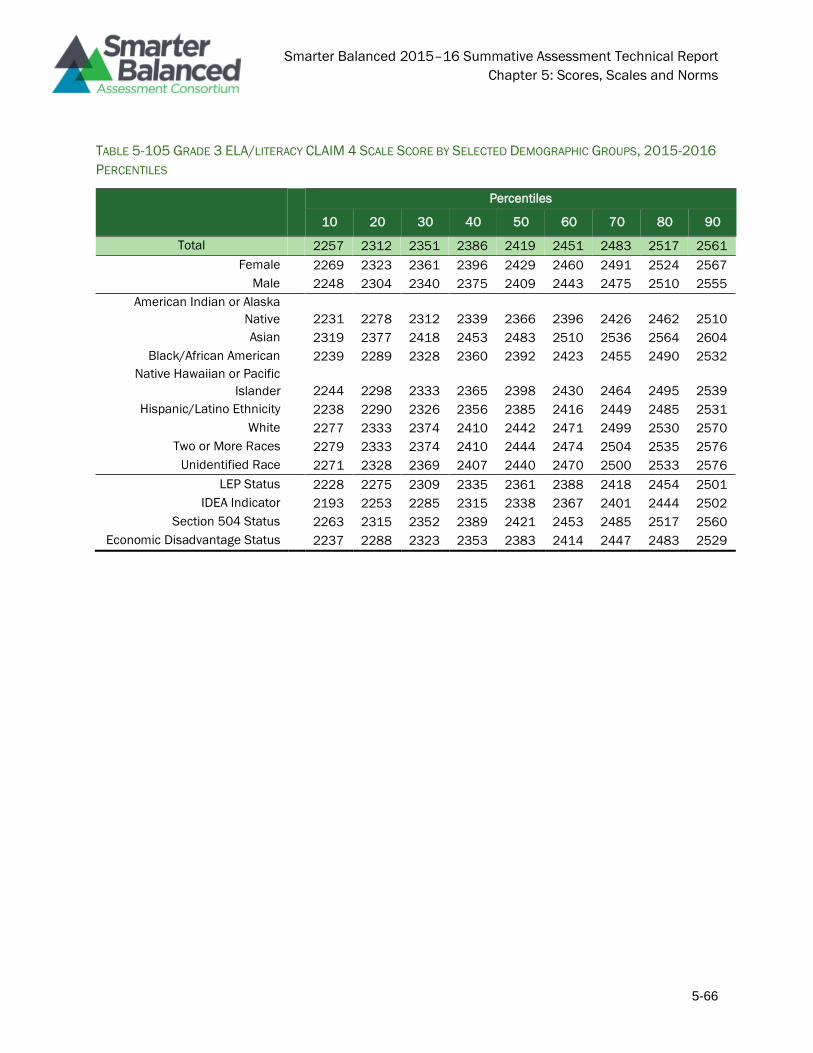
Smarter Balanced 2015–16 Summative Assessment Technical Report
Chapter 5: Scores, Scales and Norms
5-66
TABLE 5-105 GRADE 3 ELA/LITERACY CLAIM 4 SCALE SCORE BY SELECTED DEMOGRAPHIC GROUPS, 2015-2016
PERCENTILES
Percentiles
10 20 30 40 50 60 70 80 90
Total 2257 2312 2351 2386 2419 2451 2483 2517 2561
Female 2269 2323 2361 2396 2429 2460 2491 2524 2567
Male 2248 2304 2340 2375 2409 2443 2475 2510 2555
American Indian or Alaska
Native
2231 2278 2312 2339 2366 2396 2426 2462 2510
Asian 2319 2377 2418 2453 2483 2510 2536 2564 2604
Black/African American 2239 2289 2328 2360 2392 2423 2455 2490 2532
Native Hawaiian or Pacific
Islander
2244 2298 2333 2365 2398 2430 2464 2495 2539
Hispanic/Latino Ethnicity 2238 2290 2326 2356 2385 2416 2449 2485 2531
White 2277 2333 2374 2410 2442 2471 2499 2530 2570
Two or More Races 2279 2333 2374 2410 2444 2474 2504 2535 2576
Unidentified Race 2271 2328 2369 2407 2440 2470 2500 2533 2576
LEP Status 2228 2275 2309 2335 2361 2388 2418 2454 2501
IDEA Indicator 2193 2253 2285 2315 2338 2367 2401 2444 2502
Section 504 Status 2263 2315 2352 2389 2421 2453 2485 2517 2560
Economic Disadvantage Status 2237 2288 2323 2353 2383 2414 2447 2483 2529

Smarter Balanced 2015–16 Summative Assessment Technical Report
Chapter 5: Scores, Scales and Norms
5-67
TABLE 5-106 GRADE 4 ELA/LITERACY CLAIM 4 SCALE SCORE BY SELECTED DEMOGRAPHIC GROUPS, 2015-2016
PERCENTILES
Percentiles
10 20 30 40 50 60 70 80 90
Total 2283 2345 2387 2425 2460 2493 2525 2559 2603
Female 2296 2355 2398 2437 2471 2504 2534 2568 2611
Male 2274 2336 2377 2413 2448 2482 2515 2550 2595
American Indian or Alaska
Native
2255 2303 2340 2373 2403 2434 2468 2504 2549
Asian 2350 2419 2462 2495 2524 2550 2577 2605 2647
Black/African American 2264 2330 2367 2400 2431 2463 2498 2531 2573
Native Hawaiian or Pacific
Islander
2280 2341 2383 2415 2447 2479 2508 2539 2585
Hispanic/Latino Ethnicity 2261 2322 2357 2391 2424 2457 2491 2527 2573
White 2310 2371 2415 2451 2482 2510 2537 2567 2607
Two or More Races 2300 2365 2409 2447 2479 2509 2539 2570 2609
Unidentified Race 2306 2363 2406 2447 2482 2514 2544 2577 2620
LEP Status 2249 2291 2331 2358 2386 2415 2445 2481 2528
IDEA Indicator 2224 2263 2306 2334 2362 2392 2428 2472 2532
Section 504 Status 2284 2349 2391 2427 2460 2491 2521 2553 2599
Economic Disadvantage Status 2260 2320 2355 2389 2421 2454 2488 2524 2569
TABLE 5-107 GRADE 5 ELA/LITERACY CLAIM 4 SCALE SCORE BY SELECTED DEMOGRAPHIC GROUPS, 2015-2016
PERCENTILES
Percentiles
10 20 30 40 50 60 70 80 90
Total 2361 2419 2460 2493 2523 2551 2580 2611 2656
Female 2381 2436 2475 2507 2536 2563 2590 2622 2666
Male 2348 2407 2445 2479 2510 2538 2568 2600 2644
American Indian or Alaska
Native
2326 2373 2410 2441 2468 2496 2526 2559 2603
Asian 2430 2485 2523 2553 2577 2601 2626 2656 2701
Black/African American 2344 2402 2439 2468 2495 2522 2552 2583 2625
Native Hawaiian or Pacific
Islander
2358 2414 2452 2483 2511 2536 2564 2594 2638
Hispanic/Latino Ethnicity 2344 2400 2435 2466 2495 2522 2551 2583 2627
White 2393 2446 2483 2513 2539 2565 2591 2620 2662
Two or More Races 2380 2438 2476 2508 2537 2563 2589 2619 2664
Unidentified Race 2371 2433 2475 2510 2540 2568 2596 2626 2672
LEP Status 2306 2355 2393 2417 2443 2467 2493 2524 2566
IDEA Indicator 2271 2335 2364 2397 2421 2449 2479 2517 2571
Section 504 Status 2375 2425 2463 2491 2518 2544 2571 2605 2647
Economic Disadvantage Status 2341 2395 2430 2462 2490 2518 2547 2579 2623

Smarter Balanced 2015–16 Summative Assessment Technical Report
Chapter 5: Scores, Scales and Norms
5-68
TABLE 5-108 GRADE 6 ELA/LITERACY CLAIM 4 SCALE SCORE BY SELECTED DEMOGRAPHIC GROUPS, 2015-2016
PERCENTILES
Percentiles
10 20 30 40 50 60 70 80 90
Total 2377 2438 2480 2515 2546 2574 2601 2631 2669
Female 2399 2459 2500 2533 2562 2588 2613 2641 2680
Male 2361 2422 2463 2498 2530 2559 2588 2618 2656
American Indian or Alaska
Native
2337 2397 2437 2470 2498 2525 2554 2584 2624
Asian 2449 2510 2549 2577 2602 2625 2649 2676 2714
Black/African American 2358 2421 2463 2495 2523 2549 2576 2604 2642
Native Hawaiian or Pacific
Islander
2369 2427 2468 2500 2530 2556 2583 2614 2651
Hispanic/Latino Ethnicity 2352 2413 2454 2487 2518 2547 2575 2606 2645
White 2407 2467 2505 2535 2561 2585 2609 2635 2673
Two or More Races 2389 2449 2491 2522 2550 2575 2601 2629 2667
Unidentified Race 2393 2452 2496 2532 2562 2590 2616 2644 2682
LEP Status 2301 2360 2398 2427 2454 2480 2508 2540 2582
IDEA Indicator 2277 2341 2379 2411 2438 2467 2497 2532 2581
Section 504 Status 2386 2446 2486 2516 2543 2569 2595 2623 2662
Economic Disadvantage Status 2350 2410 2449 2482 2512 2541 2571 2602 2642
TABLE 5-109 GRADE 7 ELA/LITERACY CLAIM 4 SCALE SCORE BY SELECTED DEMOGRAPHIC GROUPS, 2015-2016
PERCENTILES
Percentiles
10 20 30 40 50 60 70 80 90
Total 2369 2435 2482 2521 2554 2586 2615 2647 2691
Female 2394 2461 2506 2543 2573 2601 2629 2659 2700
Male 2348 2414 2460 2499 2535 2568 2601 2635 2679
American Indian or Alaska
Native
2331 2393 2433 2471 2505 2537 2570 2604 2647
Asian 2457 2530 2572 2602 2627 2650 2676 2703 2745
Black/African American 2339 2411 2455 2495 2528 2557 2589 2620 2661
Native Hawaiian or Pacific
Islander
2345 2419 2468 2508 2541 2570 2603 2635 2675
Hispanic/Latino Ethnicity 2341 2405 2447 2485 2520 2552 2584 2617 2659
White 2398 2465 2510 2546 2576 2602 2629 2658 2698
Two or More Races 2371 2446 2493 2531 2563 2593 2621 2652 2691
Unidentified Race 2387 2456 2500 2539 2572 2602 2631 2663 2705
LEP Status 2283 2344 2383 2413 2439 2467 2496 2531 2579
IDEA Indicator 2272 2336 2371 2403 2430 2460 2492 2532 2586
Section 504 Status 2375 2437 2482 2519 2551 2580 2609 2640 2681
Economic Disadvantage Status 2339 2402 2444 2482 2515 2548 2580 2615 2658
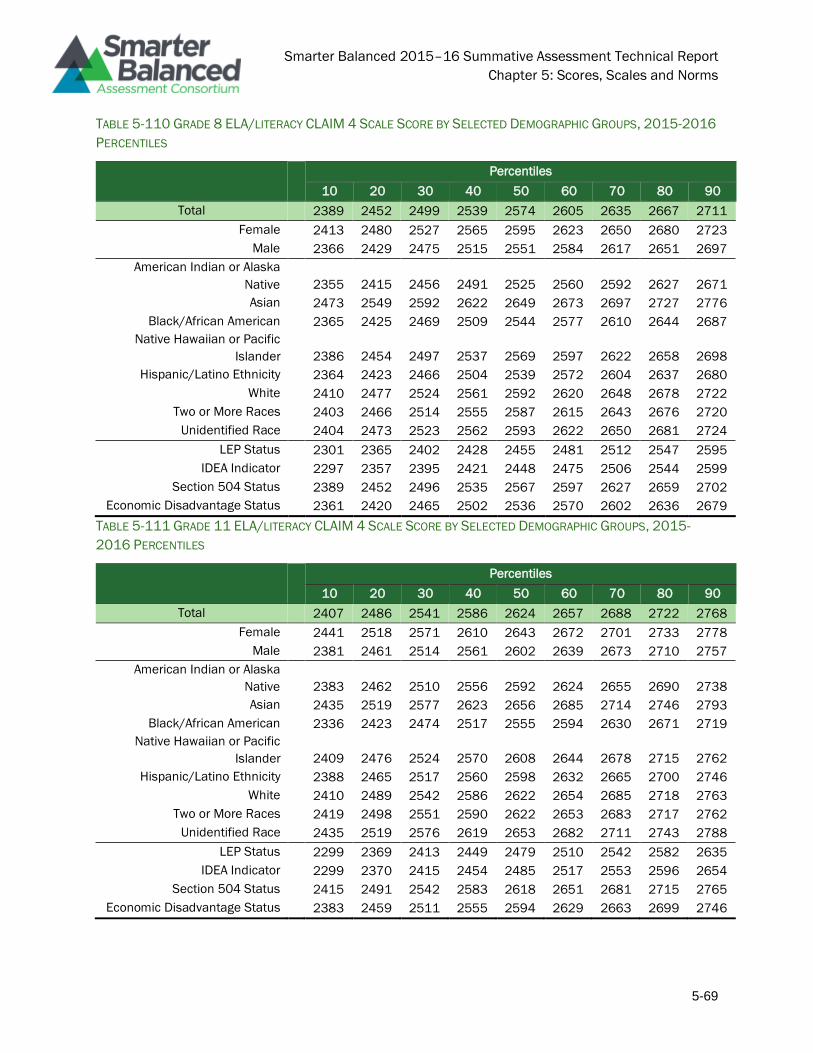
Smarter Balanced 2015–16 Summative Assessment Technical Report
Chapter 5: Scores, Scales and Norms
5-69
TABLE 5-110 GRADE 8 ELA/LITERACY CLAIM 4 SCALE SCORE BY SELECTED DEMOGRAPHIC GROUPS, 2015-2016
PERCENTILES
Percentiles
10 20 30 40 50 60 70 80 90
Total 2389 2452 2499 2539 2574 2605 2635 2667 2711
Female 2413 2480 2527 2565 2595 2623 2650 2680 2723
Male 2366 2429 2475 2515 2551 2584 2617 2651 2697
American Indian or Alaska
Native
2355 2415 2456 2491 2525 2560 2592 2627 2671
Asian 2473 2549 2592 2622 2649 2673 2697 2727 2776
Black/African American 2365 2425 2469 2509 2544 2577 2610 2644 2687
Native Hawaiian or Pacific
Islander
2386 2454 2497 2537 2569 2597 2622 2658 2698
Hispanic/Latino Ethnicity 2364 2423 2466 2504 2539 2572 2604 2637 2680
White 2410 2477 2524 2561 2592 2620 2648 2678 2722
Two or More Races 2403 2466 2514 2555 2587 2615 2643 2676 2720
Unidentified Race 2404 2473 2523 2562 2593 2622 2650 2681 2724
LEP Status 2301 2365 2402 2428 2455 2481 2512 2547 2595
IDEA Indicator 2297 2357 2395 2421 2448 2475 2506 2544 2599
Section 504 Status 2389 2452 2496 2535 2567 2597 2627 2659 2702
Economic Disadvantage Status 2361 2420 2465 2502 2536 2570 2602 2636 2679
TABLE 5-111 GRADE 11 ELA/LITERACY CLAIM 4 SCALE SCORE BY SELECTED DEMOGRAPHIC GROUPS, 2015-
2016 PERCENTILES
Percentiles
10 20 30 40 50 60 70 80 90
Total 2407 2486 2541 2586 2624 2657 2688 2722 2768
Female 2441 2518 2571 2610 2643 2672 2701 2733 2778
Male 2381 2461 2514 2561 2602 2639 2673 2710 2757
American Indian or Alaska
Native
2383 2462 2510 2556 2592 2624 2655 2690 2738
Asian 2435 2519 2577 2623 2656 2685 2714 2746 2793
Black/African American 2336 2423 2474 2517 2555 2594 2630 2671 2719
Native Hawaiian or Pacific
Islander
2409 2476 2524 2570 2608 2644 2678 2715 2762
Hispanic/Latino Ethnicity 2388 2465 2517 2560 2598 2632 2665 2700 2746
White 2410 2489 2542 2586 2622 2654 2685 2718 2763
Two or More Races 2419 2498 2551 2590 2622 2653 2683 2717 2762
Unidentified Race 2435 2519 2576 2619 2653 2682 2711 2743 2788
LEP Status 2299 2369 2413 2449 2479 2510 2542 2582 2635
IDEA Indicator 2299 2370 2415 2454 2485 2517 2553 2596 2654
Section 504 Status 2415 2491 2542 2583 2618 2651 2681 2715 2765
Economic Disadvantage Status 2383 2459 2511 2555 2594 2629 2663 2699 2746
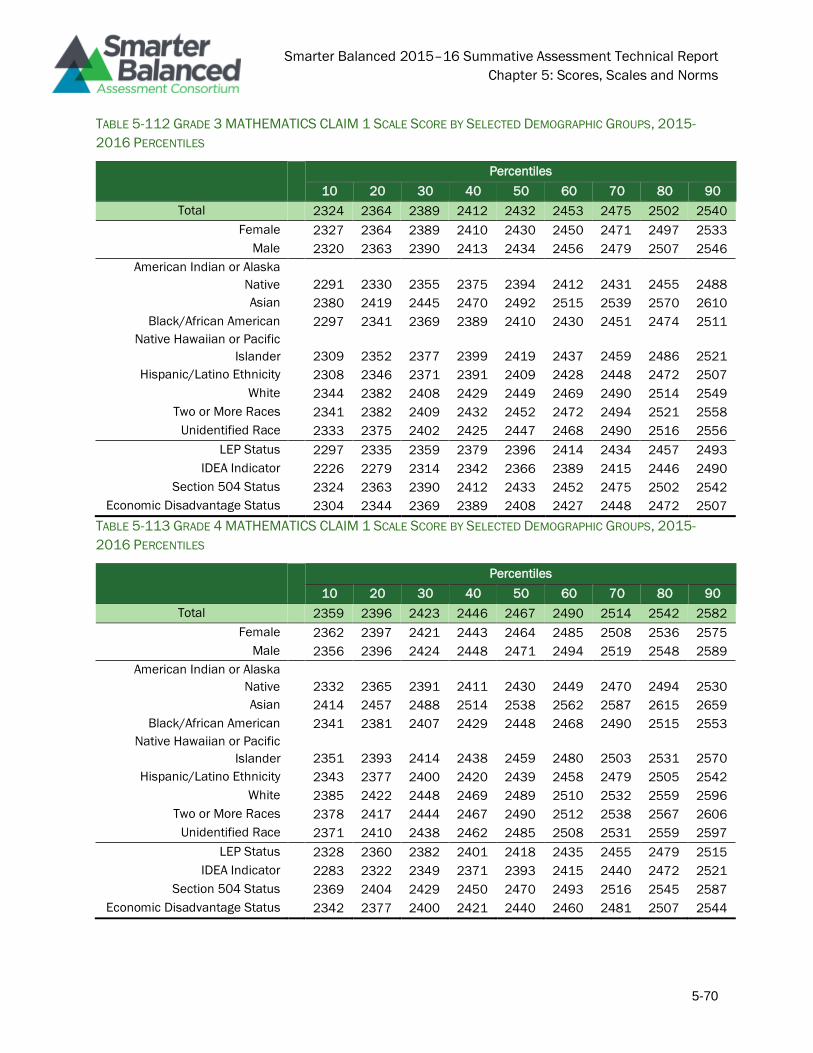
Smarter Balanced 2015–16 Summative Assessment Technical Report
Chapter 5: Scores, Scales and Norms
5-70
TABLE 5-112 GRADE 3 MATHEMATICS CLAIM 1 SCALE SCORE BY SELECTED DEMOGRAPHIC GROUPS, 2015-
2016 PERCENTILES
Percentiles
10 20 30 40 50 60 70 80 90
Total 2324 2364 2389 2412 2432 2453 2475 2502 2540
Female 2327 2364 2389 2410 2430 2450 2471 2497 2533
Male 2320 2363 2390 2413 2434 2456 2479 2507 2546
American Indian or Alaska
Native
2291 2330 2355 2375 2394 2412 2431 2455 2488
Asian 2380 2419 2445 2470 2492 2515 2539 2570 2610
Black/African American 2297 2341 2369 2389 2410 2430 2451 2474 2511
Native Hawaiian or Pacific
Islander
2309 2352 2377 2399 2419 2437 2459 2486 2521
Hispanic/Latino Ethnicity 2308 2346 2371 2391 2409 2428 2448 2472 2507
White 2344 2382 2408 2429 2449 2469 2490 2514 2549
Two or More Races 2341 2382 2409 2432 2452 2472 2494 2521 2558
Unidentified Race 2333 2375 2402 2425 2447 2468 2490 2516 2556
LEP Status 2297 2335 2359 2379 2396 2414 2434 2457 2493
IDEA Indicator 2226 2279 2314 2342 2366 2389 2415 2446 2490
Section 504 Status 2324 2363 2390 2412 2433 2452 2475 2502 2542
Economic Disadvantage Status 2304 2344 2369 2389 2408 2427 2448 2472 2507
TABLE 5-113 GRADE 4 MATHEMATICS CLAIM 1 SCALE SCORE BY SELECTED DEMOGRAPHIC GROUPS, 2015-
2016 PERCENTILES
Percentiles
10 20 30 40 50 60 70 80 90
Total 2359 2396 2423 2446 2467 2490 2514 2542 2582
Female 2362 2397 2421 2443 2464 2485 2508 2536 2575
Male 2356 2396 2424 2448 2471 2494 2519 2548 2589
American Indian or Alaska
Native
2332 2365 2391 2411 2430 2449 2470 2494 2530
Asian 2414 2457 2488 2514 2538 2562 2587 2615 2659
Black/African American 2341 2381 2407 2429 2448 2468 2490 2515 2553
Native Hawaiian or Pacific
Islander
2351 2393 2414 2438 2459 2480 2503 2531 2570
Hispanic/Latino Ethnicity 2343 2377 2400 2420 2439 2458 2479 2505 2542
White 2385 2422 2448 2469 2489 2510 2532 2559 2596
Two or More Races 2378 2417 2444 2467 2490 2512 2538 2567 2606
Unidentified Race 2371 2410 2438 2462 2485 2508 2531 2559 2597
LEP Status 2328 2360 2382 2401 2418 2435 2455 2479 2515
IDEA Indicator 2283 2322 2349 2371 2393 2415 2440 2472 2521
Section 504 Status 2369 2404 2429 2450 2470 2493 2516 2545 2587
Economic Disadvantage Status 2342 2377 2400 2421 2440 2460 2481 2507 2544

Smarter Balanced 2015–16 Summative Assessment Technical Report
Chapter 5: Scores, Scales and Norms
5-71
TABLE 5-114 GRADE 5 MATHEMATICS CLAIM 1 SCALE SCORE BY SELECTED DEMOGRAPHIC GROUPS, 2015-
2016 PERCENTILES
Percentiles
10 20 30 40 50 60 70 80 90
Total 2372 2412 2441 2468 2494 2519 2546 2577 2617
Female 2377 2414 2442 2467 2491 2514 2540 2570 2611
Male 2367 2410 2441 2469 2497 2524 2552 2583 2622
American Indian or Alaska
Native
2350 2385 2410 2432 2453 2475 2498 2527 2566
Asian 2433 2484 2517 2545 2570 2595 2621 2651 2695
Black/African American 2352 2392 2421 2444 2467 2492 2517 2546 2585
Native Hawaiian or Pacific
Islander
2371 2414 2442 2471 2496 2519 2544 2572 2610
Hispanic/Latino Ethnicity 2355 2392 2418 2440 2461 2483 2508 2536 2576
White 2399 2440 2469 2495 2519 2543 2567 2594 2629
Two or More Races 2388 2431 2462 2489 2516 2541 2568 2598 2636
Unidentified Race 2382 2426 2458 2488 2513 2539 2565 2595 2633
LEP Status 2331 2367 2391 2410 2429 2448 2469 2495 2533
IDEA Indicator 2296 2336 2364 2387 2409 2431 2457 2491 2543
Section 504 Status 2381 2419 2448 2473 2496 2522 2548 2578 2617
Economic Disadvantage Status 2353 2390 2417 2440 2462 2485 2509 2538 2578
TABLE 5-115 GRADE 6 MATHEMATICS CLAIM 1 SCALE SCORE BY SELECTED DEMOGRAPHIC GROUPS, 2015-
2016 PERCENTILES
Percentiles
10 20 30 40 50 60 70 80 90
Total 2364 2423 2463 2493 2519 2545 2573 2606 2653
Female 2376 2431 2468 2496 2522 2547 2575 2606 2651
Male 2352 2414 2457 2489 2516 2543 2572 2606 2655
American Indian or Alaska
Native
2321 2374 2411 2442 2469 2494 2520 2548 2588
Asian 2445 2504 2538 2569 2595 2624 2656 2692 2746
Black/African American 2330 2386 2426 2457 2485 2510 2536 2568 2609
Native Hawaiian or Pacific
Islander
2357 2411 2450 2478 2503 2531 2557 2585 2625
Hispanic/Latino Ethnicity 2337 2392 2430 2460 2486 2510 2536 2566 2608
White 2395 2454 2489 2516 2540 2564 2589 2618 2661
Two or More Races 2362 2420 2460 2491 2518 2546 2575 2608 2653
Unidentified Race 2383 2444 2483 2512 2538 2566 2593 2627 2674
LEP Status 2292 2341 2374 2403 2429 2454 2478 2506 2546
IDEA Indicator 2248 2302 2338 2368 2397 2428 2460 2496 2547
Section 504 Status 2385 2436 2471 2499 2524 2549 2575 2605 2653
Economic Disadvantage Status 2336 2390 2429 2459 2485 2509 2535 2566 2608
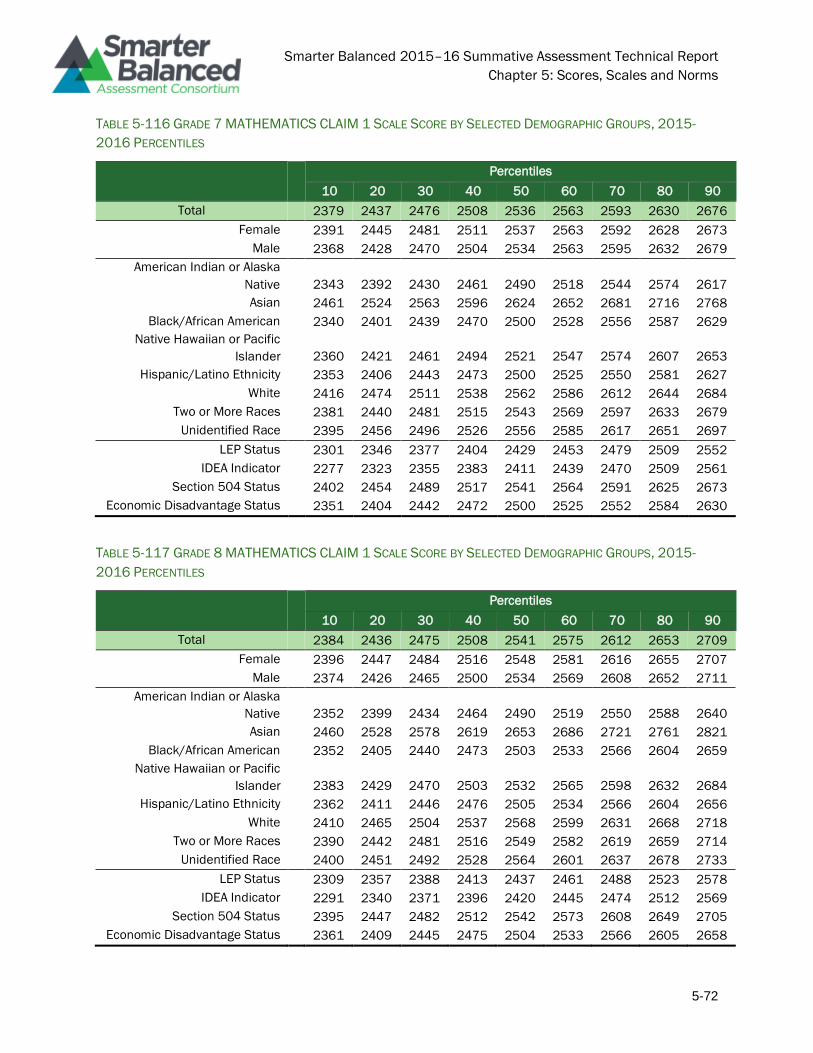
Smarter Balanced 2015–16 Summative Assessment Technical Report
Chapter 5: Scores, Scales and Norms
5-72
TABLE 5-116 GRADE 7 MATHEMATICS CLAIM 1 SCALE SCORE BY SELECTED DEMOGRAPHIC GROUPS, 2015-
2016 PERCENTILES
Percentiles
10 20 30 40 50 60 70 80 90
Total 2379 2437 2476 2508 2536 2563 2593 2630 2676
Female 2391 2445 2481 2511 2537 2563 2592 2628 2673
Male 2368 2428 2470 2504 2534 2563 2595 2632 2679
American Indian or Alaska
Native
2343 2392 2430 2461 2490 2518 2544 2574 2617
Asian 2461 2524 2563 2596 2624 2652 2681 2716 2768
Black/African American 2340 2401 2439 2470 2500 2528 2556 2587 2629
Native Hawaiian or Pacific
Islander
2360 2421 2461 2494 2521 2547 2574 2607 2653
Hispanic/Latino Ethnicity 2353 2406 2443 2473 2500 2525 2550 2581 2627
White 2416 2474 2511 2538 2562 2586 2612 2644 2684
Two or More Races 2381 2440 2481 2515 2543 2569 2597 2633 2679
Unidentified Race 2395 2456 2496 2526 2556 2585 2617 2651 2697
LEP Status 2301 2346 2377 2404 2429 2453 2479 2509 2552
IDEA Indicator 2277 2323 2355 2383 2411 2439 2470 2509 2561
Section 504 Status 2402 2454 2489 2517 2541 2564 2591 2625 2673
Economic Disadvantage Status 2351 2404 2442 2472 2500 2525 2552 2584 2630
TABLE 5-117 GRADE 8 MATHEMATICS CLAIM 1 SCALE SCORE BY SELECTED DEMOGRAPHIC GROUPS, 2015-
2016 PERCENTILES
Percentiles
10 20 30 40 50 60 70 80 90
Total 2384 2436 2475 2508 2541 2575 2612 2653 2709
Female 2396 2447 2484 2516 2548 2581 2616 2655 2707
Male 2374 2426 2465 2500 2534 2569 2608 2652 2711
American Indian or Alaska
Native
2352 2399 2434 2464 2490 2519 2550 2588 2640
Asian 2460 2528 2578 2619 2653 2686 2721 2761 2821
Black/African American 2352 2405 2440 2473 2503 2533 2566 2604 2659
Native Hawaiian or Pacific
Islander
2383 2429 2470 2503 2532 2565 2598 2632 2684
Hispanic/Latino Ethnicity 2362 2411 2446 2476 2505 2534 2566 2604 2656
White 2410 2465 2504 2537 2568 2599 2631 2668 2718
Two or More Races 2390 2442 2481 2516 2549 2582 2619 2659 2714
Unidentified Race 2400 2451 2492 2528 2564 2601 2637 2678 2733
LEP Status 2309 2357 2388 2413 2437 2461 2488 2523 2578
IDEA Indicator 2291 2340 2371 2396 2420 2445 2474 2512 2569
Section 504 Status 2395 2447 2482 2512 2542 2573 2608 2649 2705
Economic Disadvantage Status 2361 2409 2445 2475 2504 2533 2566 2605 2658

Smarter Balanced 2015–16 Summative Assessment Technical Report
Chapter 5: Scores, Scales and Norms
5-73
TABLE 5-118 GRADE 11 MATHEMATICS CLAIM 1 SCALE SCORE BY SELECTED DEMOGRAPHIC GROUPS, 2015-
2016 PERCENTILES
Percentiles
10 20 30 40 50 60 70 80 90
Total 2403 2459 2501 2537 2572 2605 2639 2680 2737
Female 2418 2471 2511 2546 2579 2610 2642 2680 2732
Male 2389 2447 2490 2528 2564 2599 2635 2681 2743
American Indian or Alaska
Native
2379 2429 2463 2491 2520 2546 2578 2613 2662
Asian 2459 2522 2566 2603 2638 2672 2707 2745 2798
Black/African American 2364 2419 2455 2488 2517 2548 2576 2612 2661
Native Hawaiian or Pacific
Islander
2389 2449 2488 2519 2547 2579 2607 2641 2693
Hispanic/Latino Ethnicity 2383 2434 2471 2504 2535 2566 2599 2634 2683
White 2422 2478 2518 2550 2579 2608 2641 2680 2732
Two or More Races 2408 2459 2497 2529 2558 2588 2619 2658 2717
Unidentified Race 2426 2490 2537 2577 2612 2645 2681 2722 2777
LEP Status 2318 2364 2396 2421 2444 2469 2497 2533 2593
IDEA Indicator 2305 2354 2386 2411 2435 2461 2489 2525 2581
Section 504 Status 2415 2469 2507 2540 2570 2600 2634 2675 2732
Economic Disadvantage Status 2382 2433 2471 2504 2535 2567 2600 2636 2689

Smarter Balanced 2015–16 Summative Assessment Technical Report
Chapter 5: Scores, Scales and Norms
5-74
TABLE 5-119 GRADE 3 MATHEMATICS CLAIM 2/4 SCALE SCORE BY SELECTED DEMOGRAPHIC GROUPS, 2015-
2016 PERCENTILES
Percentiles
10 20 30 40 50 60 70 80 90
Total 2293 2344 2377 2403 2427 2449 2472 2498 2534
Female 2296 2345 2377 2402 2425 2447 2470 2496 2531
Male 2289 2343 2377 2404 2428 2451 2474 2501 2537
American Indian or Alaska
Native
2258 2310 2343 2367 2390 2411 2433 2460 2495
Asian 2361 2407 2442 2467 2490 2511 2534 2563 2604
Black/African American 2270 2324 2358 2384 2408 2429 2452 2478 2512
Native Hawaiian or Pacific
Islander
2279 2337 2368 2392 2415 2438 2463 2490 2525
Hispanic/Latino Ethnicity 2266 2320 2351 2376 2398 2420 2442 2467 2500
White 2321 2371 2402 2428 2450 2471 2493 2517 2552
Two or More Races 2319 2370 2402 2427 2450 2472 2494 2520 2558
Unidentified Race 2309 2360 2393 2419 2443 2464 2486 2511 2546
LEP Status 2228 2305 2336 2360 2381 2402 2424 2449 2483
IDEA Indicator 2189 2270 2307 2335 2360 2385 2413 2446 2490
Section 504 Status 2298 2349 2382 2409 2432 2455 2478 2504 2540
Economic Disadvantage Status 2264 2320 2351 2377 2399 2421 2443 2468 2502
TABLE 5-120 GRADE 4 MATHEMATICS CLAIM 2/4 SCALE SCORE BY SELECTED DEMOGRAPHIC GROUPS, 2015-
2016 PERCENTILES
Percentiles
10 20 30 40 50 60 70 80 90
Total 2338 2386 2418 2443 2467 2490 2514 2541 2578
Female 2341 2388 2418 2443 2466 2488 2511 2538 2574
Male 2335 2383 2417 2443 2468 2492 2516 2544 2582
American Indian or Alaska
Native
2308 2350 2379 2403 2425 2447 2470 2497 2532
Asian 2400 2449 2483 2509 2533 2555 2579 2605 2647
Black/African American 2315 2362 2393 2420 2442 2464 2488 2514 2550
Native Hawaiian or Pacific
Islander
2333 2376 2408 2432 2454 2477 2501 2527 2563
Hispanic/Latino Ethnicity 2307 2356 2388 2413 2435 2456 2478 2504 2538
White 2361 2408 2440 2465 2488 2509 2531 2556 2590
Two or More Races 2356 2403 2436 2462 2486 2509 2533 2561 2597
Unidentified Race 2363 2410 2440 2465 2488 2510 2532 2559 2595
LEP Status 2267 2336 2365 2389 2410 2430 2451 2476 2510
IDEA Indicator 2204 2308 2341 2365 2389 2412 2439 2472 2519
Section 504 Status 2342 2389 2419 2445 2467 2490 2514 2541 2581
Economic Disadvantage Status 2314 2361 2392 2416 2438 2460 2482 2508 2542

Smarter Balanced 2015–16 Summative Assessment Technical Report
Chapter 5: Scores, Scales and Norms
5-75
TABLE 5-121 GRADE 5 MATHEMATICS CLAIM 2/4 SCALE SCORE BY SELECTED DEMOGRAPHIC GROUPS, 2015-
2016 PERCENTILES
Percentiles
10 20 30 40 50 60 70 80 90
Total 2220 2390 2428 2459 2486 2514 2542 2574 2613
Female 2273 2394 2431 2460 2486 2513 2541 2572 2611
Male 2220 2386 2426 2458 2487 2515 2543 2575 2615
American Indian or Alaska
Native
2314 2360 2392 2418 2444 2467 2493 2524 2568
Asian 2409 2464 2503 2537 2563 2588 2614 2644 2688
Black/African American 2321 2371 2404 2432 2457 2482 2508 2541 2585
Native Hawaiian or Pacific
Islander
2333 2387 2422 2454 2481 2508 2539 2573 2608
Hispanic/Latino Ethnicity 2219 2360 2398 2426 2451 2476 2501 2531 2571
White 2368 2421 2456 2485 2512 2538 2565 2594 2633
Two or More Races 2357 2412 2447 2477 2504 2533 2563 2595 2634
Unidentified Race 2220 2411 2450 2482 2509 2536 2562 2591 2626
LEP Status 2219 2219 2357 2387 2410 2432 2455 2481 2520
IDEA Indicator 2219 2219 2335 2372 2398 2422 2451 2486 2538
Section 504 Status 2334 2401 2436 2465 2491 2517 2542 2574 2614
Economic Disadvantage Status 2219 2358 2399 2427 2452 2477 2503 2533 2574
TABLE 5-122 GRADE 6 MATHEMATICS CLAIM 2/4 SCALE SCORE BY SELECTED DEMOGRAPHIC GROUPS, 2015-
2016 PERCENTILES
Percentiles
10 20 30 40 50 60 70 80 90
Total 2325 2407 2450 2484 2513 2540 2569 2601 2646
Female 2342 2411 2453 2485 2513 2540 2568 2600 2643
Male 2294 2401 2447 2482 2512 2541 2570 2603 2648
American Indian or Alaska
Native
2300 2364 2405 2436 2464 2490 2517 2550 2596
Asian 2418 2483 2525 2560 2591 2621 2649 2681 2727
Black/African American 2310 2374 2414 2446 2474 2503 2533 2568 2612
Native Hawaiian or Pacific
Islander
2342 2395 2435 2469 2497 2525 2554 2588 2632
Hispanic/Latino Ethnicity 2235 2373 2418 2450 2479 2505 2530 2559 2599
White 2371 2434 2475 2508 2537 2565 2593 2624 2665
Two or More Races 2346 2411 2451 2484 2512 2544 2575 2611 2655
Unidentified Race 2354 2426 2473 2505 2533 2560 2588 2619 2662
LEP Status 2235 2235 2358 2391 2421 2447 2473 2502 2541
IDEA Indicator 2235 2235 2306 2362 2393 2427 2459 2496 2547
Section 504 Status 2359 2420 2460 2492 2519 2545 2573 2604 2649
Economic Disadvantage Status 2235 2371 2416 2449 2477 2504 2531 2561 2601

Smarter Balanced 2015–16 Summative Assessment Technical Report
Chapter 5: Scores, Scales and Norms
5-76
TABLE 5-123 GRADE 7 MATHEMATICS CLAIM 2/4 SCALE SCORE BY SELECTED DEMOGRAPHIC GROUPS, 2015-
2016 PERCENTILES
Percentiles
10 20 30 40 50 60 70 80 90
Total 2256 2395 2449 2489 2525 2557 2589 2626 2672
Female 2288 2402 2454 2493 2528 2559 2591 2626 2671
Male 2250 2389 2445 2486 2522 2555 2589 2626 2673
American Indian or Alaska
Native
2293 2360 2402 2440 2474 2508 2541 2574 2616
Asian 2436 2516 2560 2591 2618 2644 2671 2705 2749
Black/African American 2302 2374 2419 2461 2496 2527 2559 2588 2628
Native Hawaiian or Pacific
Islander
2326 2397 2447 2487 2521 2548 2575 2605 2646
Hispanic/Latino Ethnicity 2250 2363 2410 2448 2480 2511 2543 2577 2622
White 2373 2443 2490 2527 2557 2584 2611 2640 2682
Two or More Races 2348 2411 2461 2502 2539 2569 2599 2630 2675
Unidentified Race 2250 2416 2475 2514 2549 2581 2613 2649 2693
LEP Status 2250 2250 2329 2373 2405 2433 2468 2504 2551
IDEA Indicator 2250 2250 2327 2367 2393 2424 2459 2502 2561
Section 504 Status 2346 2421 2467 2504 2533 2562 2591 2623 2669
Economic Disadvantage Status 2250 2359 2409 2449 2481 2513 2545 2580 2625
TABLE 5-124 GRADE 8 MATHEMATICS CLAIM 2/4 SCALE SCORE BY SELECTED DEMOGRAPHIC GROUPS, 2015-
2016 PERCENTILES
Percentiles
10 20 30 40 50 60 70 80 90
Total 2265 2367 2458 2499 2535 2569 2605 2646 2699
Female 2265 2386 2464 2505 2540 2573 2608 2647 2698
Male 2265 2349 2452 2493 2529 2565 2603 2645 2700
American Indian or Alaska
Native
2296 2377 2424 2462 2494 2523 2556 2593 2645
Asian 2445 2522 2571 2612 2648 2681 2714 2751 2808
Black/African American 2304 2384 2435 2474 2505 2537 2569 2605 2659
Native Hawaiian or Pacific
Islander
2353 2424 2468 2501 2535 2565 2600 2634 2684
Hispanic/Latino Ethnicity 2265 2265 2404 2460 2491 2524 2557 2594 2644
White 2379 2452 2498 2533 2565 2597 2630 2667 2717
Two or More Races 2354 2431 2480 2516 2550 2582 2617 2656 2712
Unidentified Race 2265 2401 2478 2524 2559 2594 2631 2669 2719
LEP Status 2265 2265 2265 2292 2415 2456 2485 2520 2565
IDEA Indicator 2265 2265 2265 2346 2410 2452 2482 2517 2569
Section 504 Status 2265 2417 2470 2507 2539 2573 2607 2647 2697
Economic Disadvantage Status 2265 2267 2411 2462 2495 2528 2560 2597 2648

Smarter Balanced 2015–16 Summative Assessment Technical Report
Chapter 5: Scores, Scales and Norms
5-77
TABLE 5-125 GRADE 11 MATHEMATICS CLAIM 2/4 SCALE SCORE BY SELECTED DEMOGRAPHIC GROUPS,
2015-2016 PERCENTILES
Percentiles
10 20 30 40 50 60 70 80 90
Total 2280 2414 2474 2515 2556 2595 2634 2678 2735
Female 2280 2424 2478 2518 2556 2594 2631 2673 2726
Male 2280 2404 2469 2512 2555 2596 2638 2684 2744
American Indian or Alaska
Native
2318 2402 2454 2494 2526 2559 2591 2630 2681
Asian 2428 2507 2560 2603 2642 2676 2711 2746 2796
Black/African American 2299 2395 2449 2487 2519 2552 2586 2625 2674
Native Hawaiian or Pacific
Islander
2343 2425 2475 2519 2551 2585 2618 2656 2710
Hispanic/Latino Ethnicity 2280 2346 2439 2478 2512 2548 2586 2627 2680
White 2373 2456 2507 2547 2583 2619 2654 2694 2748
Two or More Races 2357 2442 2493 2529 2565 2599 2634 2673 2727
Unidentified Race 2280 2452 2505 2553 2596 2635 2673 2714 2768
LEP Status 2280 2280 2280 2373 2431 2464 2493 2528 2585
IDEA Indicator 2280 2280 2297 2381 2430 2463 2494 2530 2586
Section 504 Status 2280 2432 2484 2524 2563 2601 2640 2684 2740
Economic Disadvantage Status 2280 2353 2440 2480 2515 2551 2590 2632 2687

Smarter Balanced 2015–16 Summative Assessment Technical Report
Chapter 5: Scores, Scales and Norms
5-78
TABLE 5-126 GRADE 3 MATHEMATICS CLAIM 3 SCALE SCORE BY SELECTED DEMOGRAPHIC GROUPS, 2015-
2016 PERCENTILES
Percentiles
10 20 30 40 50 60 70 80 90
Total 2296 2348 2380 2407 2430 2453 2476 2501 2537
Female 2301 2352 2383 2408 2431 2452 2474 2500 2535
Male 2291 2345 2378 2406 2430 2453 2477 2503 2540
American Indian or Alaska
Native
2261 2310 2340 2366 2388 2409 2431 2456 2488
Asian 2353 2402 2432 2458 2481 2502 2524 2549 2589
Black/African American 2273 2321 2353 2379 2401 2422 2444 2470 2503
Native Hawaiian or Pacific
Islander
2279 2326 2358 2381 2405 2426 2450 2477 2514
Hispanic/Latino Ethnicity 2273 2325 2357 2382 2404 2425 2447 2472 2506
White 2323 2372 2402 2426 2447 2467 2488 2512 2545
Two or More Races 2322 2371 2401 2426 2448 2468 2489 2514 2550
Unidentified Race 2313 2363 2397 2423 2447 2470 2492 2518 2553
LEP Status 2257 2309 2341 2366 2388 2409 2430 2455 2489
IDEA Indicator 2216 2277 2311 2339 2363 2388 2415 2447 2492
Section 504 Status 2301 2349 2381 2408 2431 2453 2476 2503 2540
Economic Disadvantage Status 2272 2324 2356 2381 2404 2425 2447 2472 2505
TABLE 5-127 GRADE 4 MATHEMATICS CLAIM 3 SCALE SCORE BY SELECTED DEMOGRAPHIC GROUPS, 2015-
2016 PERCENTILES
Percentiles
10 20 30 40 50 60 70 80 90
Total 2337 2384 2416 2442 2466 2490 2514 2542 2580
Female 2340 2386 2417 2442 2465 2488 2512 2539 2576
Male 2334 2382 2414 2442 2467 2491 2516 2545 2583
American Indian or Alaska
Native
2295 2346 2378 2404 2426 2448 2472 2497 2533
Asian 2394 2448 2479 2506 2529 2552 2576 2603 2643
Black/African American 2310 2360 2393 2419 2442 2464 2486 2512 2545
Native Hawaiian or Pacific
Islander
2318 2367 2403 2429 2452 2474 2498 2524 2560
Hispanic/Latino Ethnicity 2316 2362 2391 2415 2436 2458 2480 2506 2542
White 2362 2412 2442 2466 2488 2509 2531 2557 2593
Two or More Races 2358 2404 2436 2461 2485 2507 2531 2560 2600
Unidentified Race 2350 2401 2433 2461 2485 2509 2533 2559 2595
LEP Status 2297 2344 2372 2395 2414 2434 2454 2479 2513
IDEA Indicator 2275 2319 2349 2372 2394 2416 2441 2473 2520
Section 504 Status 2345 2391 2422 2445 2468 2490 2513 2542 2582
Economic Disadvantage Status 2314 2361 2391 2415 2437 2459 2481 2508 2543

Smarter Balanced 2015–16 Summative Assessment Technical Report
Chapter 5: Scores, Scales and Norms
5-79
TABLE 5-128 GRADE 5 MATHEMATICS CLAIM 3 SCALE SCORE BY SELECTED DEMOGRAPHIC GROUPS, 2015-
2016 PERCENTILES
Percentiles
10 20 30 40 50 60 70 80 90
Total 2341 2396 2431 2461 2488 2515 2543 2575 2616
Female 2347 2400 2434 2462 2488 2515 2543 2574 2614
Male 2336 2392 2428 2459 2488 2516 2545 2577 2618
American Indian or Alaska
Native
2306 2356 2391 2420 2447 2470 2497 2525 2563
Asian 2409 2471 2508 2538 2564 2587 2611 2638 2674
Black/African American 2318 2366 2405 2434 2460 2485 2510 2541 2580
Native Hawaiian or Pacific
Islander
2334 2383 2423 2455 2485 2509 2536 2564 2604
Hispanic/Latino Ethnicity 2323 2368 2402 2429 2453 2477 2503 2533 2575
White 2373 2431 2467 2494 2518 2541 2565 2591 2626
Two or More Races 2360 2417 2455 2486 2513 2538 2564 2591 2628
Unidentified Race 2360 2414 2450 2480 2509 2536 2564 2594 2634
LEP Status 2293 2339 2370 2395 2417 2438 2461 2486 2525
IDEA Indicator 2268 2324 2353 2379 2404 2427 2454 2487 2540
Section 504 Status 2349 2404 2438 2467 2492 2517 2543 2574 2614
Economic Disadvantage Status 2322 2369 2403 2430 2455 2479 2505 2535 2576
TABLE 5-129 GRADE 6 MATHEMATICS CLAIM 3 SCALE SCORE BY SELECTED DEMOGRAPHIC GROUPS, 2015-
2016 PERCENTILES
Percentiles
10 20 30 40 50 60 70 80 90
Total 2350 2411 2451 2484 2513 2542 2571 2605 2650
Female 2358 2417 2456 2487 2515 2542 2572 2604 2649
Male 2343 2405 2447 2480 2511 2541 2571 2605 2651
American Indian or Alaska
Native
2294 2357 2397 2434 2466 2491 2518 2546 2587
Asian 2423 2490 2529 2560 2589 2616 2644 2676 2720
Black/African American 2308 2369 2413 2450 2480 2506 2532 2563 2605
Native Hawaiian or Pacific
Islander
2327 2388 2435 2467 2498 2525 2551 2577 2618
Hispanic/Latino Ethnicity 2329 2383 2421 2451 2478 2505 2532 2564 2605
White 2375 2443 2482 2512 2538 2563 2588 2617 2658
Two or More Races 2347 2408 2454 2487 2516 2544 2572 2604 2649
Unidentified Race 2365 2429 2470 2504 2535 2563 2593 2626 2670
LEP Status 2274 2344 2376 2405 2430 2453 2478 2505 2543
IDEA Indicator 2243 2315 2353 2382 2411 2437 2465 2498 2548
Section 504 Status 2366 2427 2465 2495 2522 2547 2574 2605 2648
Economic Disadvantage Status 2322 2380 2420 2451 2479 2505 2532 2564 2605

Smarter Balanced 2015–16 Summative Assessment Technical Report
Chapter 5: Scores, Scales and Norms
5-80
TABLE 5-130 GRADE 7 MATHEMATICS CLAIM 3 SCALE SCORE BY SELECTED DEMOGRAPHIC GROUPS, 2015-
2016 PERCENTILES
Percentiles
10 20 30 40 50 60 70 80 90
Total 2339 2413 2461 2500 2534 2564 2594 2627 2673
Female 2356 2425 2472 2508 2540 2568 2596 2628 2672
Male 2326 2403 2452 2492 2528 2560 2591 2626 2673
American Indian or Alaska
Native
2279 2366 2410 2447 2479 2511 2542 2575 2618
Asian 2424 2502 2552 2587 2618 2646 2673 2704 2746
Black/African American 2280 2370 2414 2453 2482 2516 2549 2585 2628
Native Hawaiian or Pacific
Islander
2303 2376 2427 2467 2501 2535 2568 2606 2648
Hispanic/Latino Ethnicity 2307 2381 2424 2461 2495 2526 2555 2586 2626
White 2383 2454 2498 2531 2560 2587 2614 2645 2684
Two or More Races 2332 2416 2464 2503 2538 2568 2599 2634 2678
Unidentified Race 2361 2436 2484 2523 2555 2584 2613 2646 2692
LEP Status 2258 2314 2363 2394 2424 2453 2485 2521 2566
IDEA Indicator 2259 2297 2342 2376 2406 2438 2471 2512 2568
Section 504 Status 2365 2427 2471 2506 2537 2564 2594 2626 2671
Economic Disadvantage Status 2303 2380 2424 2461 2495 2526 2556 2587 2628
TABLE 5-131 GRADE 8 MATHEMATICS CLAIM 3 SCALE SCORE BY SELECTED DEMOGRAPHIC GROUPS, 2015-
2016 PERCENTILES
Percentiles
10 20 30 40 50 60 70 80 90
Total 2353 2427 2471 2509 2543 2575 2610 2651 2706
Female 2370 2438 2481 2518 2550 2582 2615 2654 2707
Male 2337 2417 2461 2500 2535 2569 2605 2648 2705
American Indian or Alaska
Native
2304 2379 2426 2453 2480 2516 2553 2592 2642
Asian 2426 2507 2567 2610 2645 2676 2708 2742 2792
Black/African American 2338 2395 2434 2464 2500 2537 2571 2609 2656
Native Hawaiian or Pacific
Islander
2353 2405 2446 2477 2514 2553 2588 2628 2676
Hispanic/Latino Ethnicity 2324 2401 2444 2478 2508 2536 2566 2601 2652
White 2385 2449 2495 2540 2575 2607 2639 2673 2717
Two or More Races 2361 2427 2465 2511 2550 2585 2618 2659 2707
Unidentified Race 2367 2443 2492 2528 2562 2597 2632 2674 2729
LEP Status 2265 2333 2381 2417 2446 2474 2503 2535 2580
IDEA Indicator 2265 2323 2367 2401 2432 2459 2488 2524 2575
Section 504 Status 2363 2430 2471 2510 2544 2577 2610 2650 2702
Economic Disadvantage Status 2316 2398 2442 2476 2507 2536 2567 2604 2655
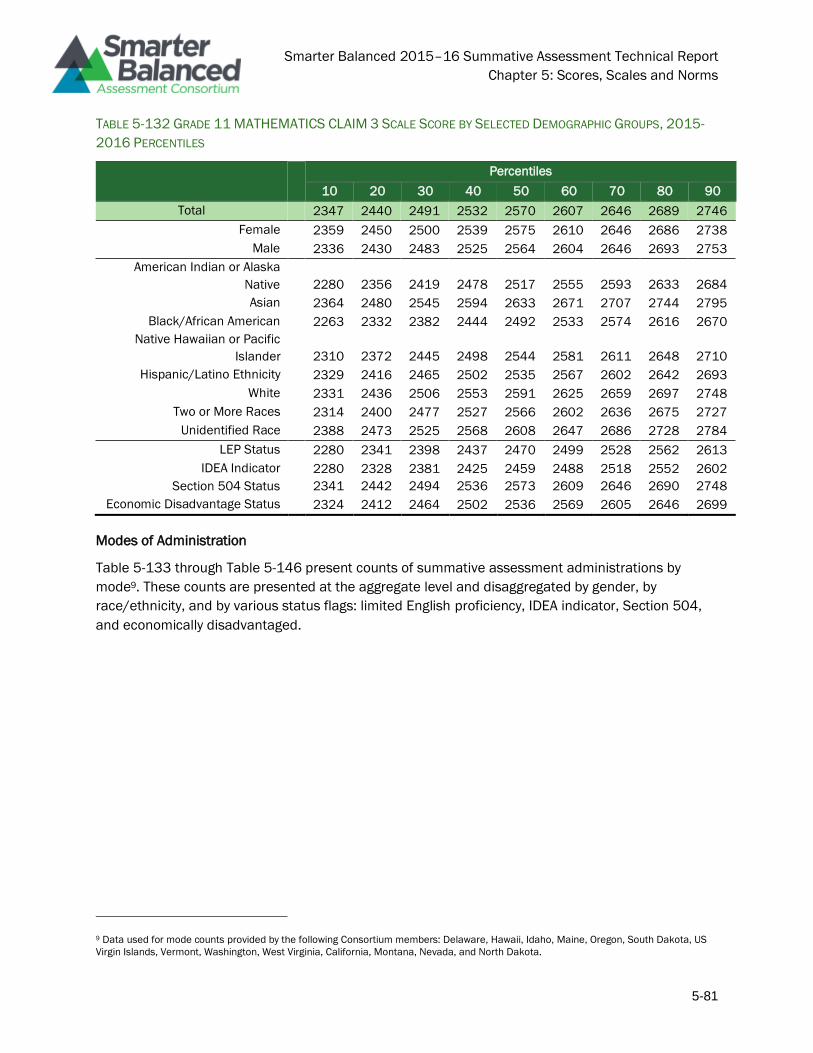
Smarter Balanced 2015–16 Summative Assessment Technical Report
Chapter 5: Scores, Scales and Norms
5-81
TABLE 5-132 GRADE 11 MATHEMATICS CLAIM 3 SCALE SCORE BY SELECTED DEMOGRAPHIC GROUPS, 2015-
2016 PERCENTILES
Percentiles
10 20 30 40 50 60 70 80 90
Total 2347 2440 2491 2532 2570 2607 2646 2689 2746
Female 2359 2450 2500 2539 2575 2610 2646 2686 2738
Male 2336 2430 2483 2525 2564 2604 2646 2693 2753
American Indian or Alaska
Native
2280 2356 2419 2478 2517 2555 2593 2633 2684
Asian 2364 2480 2545 2594 2633 2671 2707 2744 2795
Black/African American 2263 2332 2382 2444 2492 2533 2574 2616 2670
Native Hawaiian or Pacific
Islander
2310 2372 2445 2498 2544 2581 2611 2648 2710
Hispanic/Latino Ethnicity 2329 2416 2465 2502 2535 2567 2602 2642 2693
White 2331 2436 2506 2553 2591 2625 2659 2697 2748
Two or More Races 2314 2400 2477 2527 2566 2602 2636 2675 2727
Unidentified Race 2388 2473 2525 2568 2608 2647 2686 2728 2784
LEP Status 2280 2341 2398 2437 2470 2499 2528 2562 2613
IDEA Indicator 2280 2328 2381 2425 2459 2488 2518 2552 2602
Section 504 Status 2341 2442 2494 2536 2573 2609 2646 2690 2748
Economic Disadvantage Status 2324 2412 2464 2502 2536 2569 2605 2646 2699
Modes of Administration
Table 5-133 through Table 5-146 present counts of summative assessment administrations by
mode9. These counts are presented at the aggregate level and disaggregated by gender, by
race/ethnicity, and by various status flags: limited English proficiency, IDEA indicator, Section 504,
and economically disadvantaged.
9 Data used for mode counts provided by the following Consortium members: Delaware, Hawaii, Idaho, Maine, Oregon, South Dakota, US
Virgin Islands, Vermont, Washington, West Virginia, California, Montana, Nevada, and North Dakota.
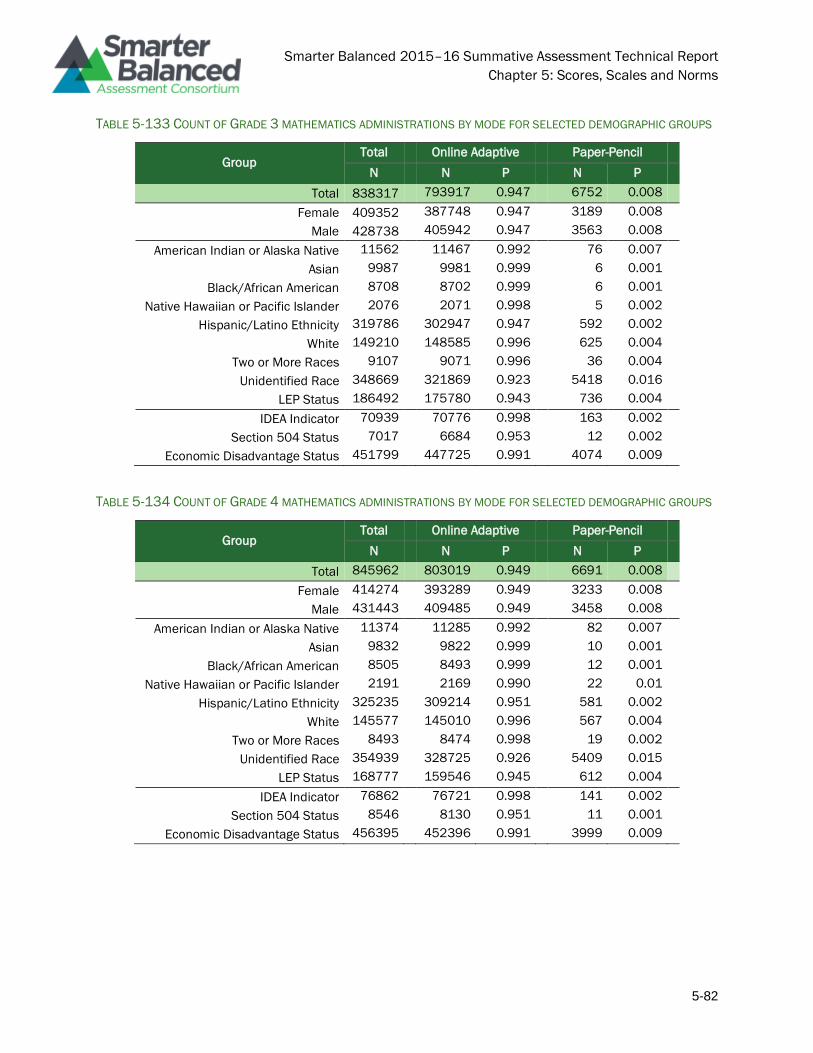
Smarter Balanced 2015–16 Summative Assessment Technical Report
Chapter 5: Scores, Scales and Norms
5-82
TABLE 5-133 COUNT OF GRADE 3 MATHEMATICS ADMINISTRATIONS BY MODE FOR SELECTED DEMOGRAPHIC GROUPS
Group Total Online Adaptive Paper-Pencil
N N P N P
Total 838317 793917 0.947 6752 0.008
Female 409352 387748 0.947 3189 0.008
Male 428738 405942 0.947 3563 0.008
American Indian or Alaska Native 11562 11467 0.992 76 0.007
Asian 9987 9981 0.999 6 0.001
Black/African American 8708 8702 0.999 6 0.001
Native Hawaiian or Pacific Islander 2076 2071 0.998 5 0.002
Hispanic/Latino Ethnicity 319786 302947 0.947 592 0.002
White 149210 148585 0.996 625 0.004
Two or More Races 9107 9071 0.996 36 0.004
Unidentified Race 348669 321869 0.923 5418 0.016
LEP Status 186492 175780 0.943 736 0.004
IDEA Indicator 70939 70776 0.998 163 0.002
Section 504 Status 7017 6684 0.953 12 0.002
Economic Disadvantage Status 451799 447725 0.991 4074 0.009
TABLE 5-134 COUNT OF GRADE 4 MATHEMATICS ADMINISTRATIONS BY MODE FOR SELECTED DEMOGRAPHIC GROUPS
Group Total Online Adaptive Paper-Pencil
N N P N P
Total 845962 803019 0.949 6691 0.008
Female 414274 393289 0.949 3233 0.008
Male 431443 409485 0.949 3458 0.008
American Indian or Alaska Native 11374 11285 0.992 82 0.007
Asian 9832 9822 0.999 10 0.001
Black/African American 8505 8493 0.999 12 0.001
Native Hawaiian or Pacific Islander 2191 2169 0.990 22 0.01
Hispanic/Latino Ethnicity 325235 309214 0.951 581 0.002
White 145577 145010 0.996 567 0.004
Two or More Races 8493 8474 0.998 19 0.002
Unidentified Race 354939 328725 0.926 5409 0.015
LEP Status 168777 159546 0.945 612 0.004
IDEA Indicator 76862 76721 0.998 141 0.002
Section 504 Status 8546 8130 0.951 11 0.001
Economic Disadvantage Status 456395 452396 0.991 3999 0.009

Smarter Balanced 2015–16 Summative Assessment Technical Report
Chapter 5: Scores, Scales and Norms
5-83
TABLE 5-135 COUNT OF GRADE 5 MATHEMATICS ADMINISTRATIONS BY MODE FOR SELECTED DEMOGRAPHIC GROUPS
Group Total Online Adaptive Paper-Pencil
N N P N P
Total 831562 789739 0.950 6334 0.008
Female 407207 386681 0.950 3103 0.008
Male 424137 402840 0.950 3231 0.008
American Indian or Alaska Native 11340 11254 0.992 73 0.006
Asian 10479 10469 0.999 10 0.001
Black/African American 8226 8212 0.998 14 0.002
Native Hawaiian or Pacific Islander 2238 2223 0.993 15 0.007
Hispanic/Latino Ethnicity 314435 298786 0.950 593 0.002
White 143670 143077 0.996 593 0.004
Two or More Races 8001 7976 0.997 25 0.003
Unidentified Race 353596 328156 0.928 5020 0.014
LEP Status 134978 128671 0.953 545 0.004
IDEA Indicator 78209 78038 0.998 171 0.002
Section 504 Status 10101 9566 0.947 18 0.002
Economic Disadvantage Status 442582 438806 0.991 3776 0.009
TABLE 5-136 COUNT OF GRADE 6 MATHEMATICS ADMINISTRATIONS BY MODE FOR SELECTED DEMOGRAPHIC GROUPS
Group Total Online Adaptive Paper-Pencil
N N P N P
Total 826621 784945 0.950 7019 0.008
Female 404164 383652 0.949 3472 0.009
Male 422232 401068 0.950 3547 0.008
American Indian or Alaska Native 11143 11069 0.993 50 0.004
Asian 10548 10534 0.999 14 0.001
Black/African American 7943 7912 0.996 31 0.004
Native Hawaiian or Pacific Islander 2031 2016 0.993 15 0.007
Hispanic/Latino Ethnicity 304030 288700 0.950 597 0.002
White 143926 143389 0.996 537 0.004
Two or More Races 13253 13237 0.999 16 0.001
Unidentified Race 358399 332731 0.928 5768 0.016
LEP Status 109497 104234 0.952 497 0.005
IDEA Indicator 74315 74208 0.999 107 0.001
Section 504 Status 11343 10711 0.944 15 0.001
Economic Disadvantage Status 431113 427050 0.991 4063 0.009

Smarter Balanced 2015–16 Summative Assessment Technical Report
Chapter 5: Scores, Scales and Norms
5-84
TABLE 5-137 COUNT OF GRADE 7 MATHEMATICS ADMINISTRATIONS BY MODE FOR SELECTED DEMOGRAPHIC GROUPS
Group Total Online Adaptive Paper-Pencil
N N P N P
Total 819937 778896 0.950 6570 0.008
Female 400721 380717 0.950 3207 0.008
Male 419024 397987 0.950 3363 0.008
American Indian or Alaska Native 10958 10889 0.994 40 0.004
Asian 10519 10509 0.999 10 0.001
Black/African American 7823 7796 0.997 27 0.003
Native Hawaiian or Pacific Islander 1915 1903 0.994 12 0.006
Hispanic/Latino Ethnicity 298430 283324 0.949 541 0.002
White 142486 141875 0.996 611 0.004
Two or More Races 12547 12533 0.999 14 0.001
Unidentified Race 359314 334107 0.930 5330 0.015
LEP Status 90417 85159 0.942 434 0.005
IDEA Indicator 71220 71104 0.998 116 0.002
Section 504 Status 12278 11612 0.946 24 0.002
Economic Disadvantage Status 419687 415957 0.991 3730 0.009
TABLE 5-138 COUNT OF GRADE 8 MATHEMATICS ADMINISTRATIONS BY MODE FOR SELECTED DEMOGRAPHIC GROUPS
Group Total Online Adaptive Paper-Pencil
N N P N P
Total 804340 769136 0.956 6580 0.008
Female 393557 376732 0.957 3246 0.008
Male 410583 392204 0.955 3334 0.008
American Indian or Alaska Native 10516 10465 0.995 29 0.003
Asian 10179 10173 0.999 6 0.001
Black/African American 7629 7617 0.998 12 0.002
Native Hawaiian or Pacific Islander 1827 1820 0.996 7 0.004
Hispanic/Latino Ethnicity 293476 279970 0.954 548 0.002
White 141479 140919 0.996 560 0.004
Two or More Races 12186 12176 0.999 10 0.001
Unidentified Race 350552 329483 0.940 5425 0.015
LEP Status 79074 73878 0.934 434 0.005
IDEA Indicator 67814 67712 0.998 102 0.002
Section 504 Status 13210 12636 0.957 18 0.001
Economic Disadvantage Status 410102 406402 0.991 3700 0.009
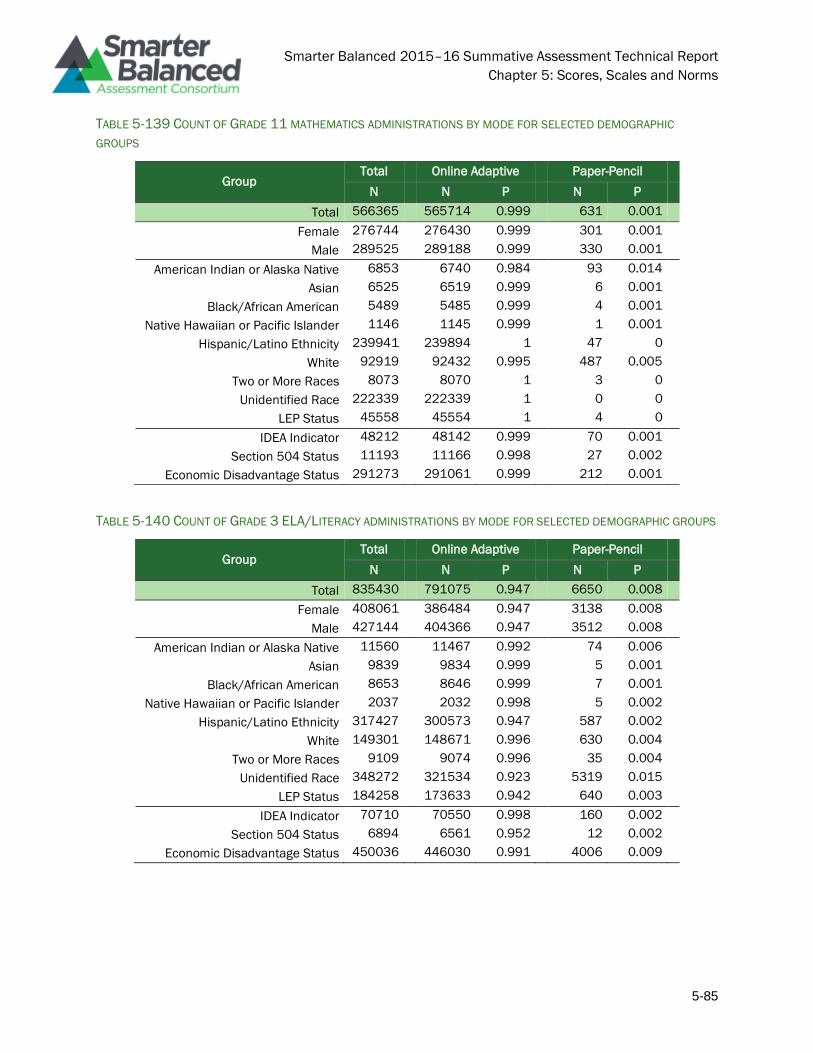
Smarter Balanced 2015–16 Summative Assessment Technical Report
Chapter 5: Scores, Scales and Norms
5-85
TABLE 5-139 COUNT OF GRADE 11 MATHEMATICS ADMINISTRATIONS BY MODE FOR SELECTED DEMOGRAPHIC
GROUPS
Group Total Online Adaptive Paper-Pencil
N N P N P
Total 566365 565714 0.999 631 0.001
Female 276744 276430 0.999 301 0.001
Male 289525 289188 0.999 330 0.001
American Indian or Alaska Native 6853 6740 0.984 93 0.014
Asian 6525 6519 0.999 6 0.001
Black/African American 5489 5485 0.999 4 0.001
Native Hawaiian or Pacific Islander 1146 1145 0.999 1 0.001
Hispanic/Latino Ethnicity 239941 239894 1 47 0
White 92919 92432 0.995 487 0.005
Two or More Races 8073 8070 1 3 0
Unidentified Race 222339 222339 1 0 0
LEP Status 45558 45554 1 4 0
IDEA Indicator 48212 48142 0.999 70 0.001
Section 504 Status 11193 11166 0.998 27 0.002
Economic Disadvantage Status 291273 291061 0.999 212 0.001
TABLE 5-140 COUNT OF GRADE 3 ELA/LITERACY ADMINISTRATIONS BY MODE FOR SELECTED DEMOGRAPHIC GROUPS
Group Total Online Adaptive Paper-Pencil
N N P N P
Total 835430 791075 0.947 6650 0.008
Female 408061 386484 0.947 3138 0.008
Male 427144 404366 0.947 3512 0.008
American Indian or Alaska Native 11560 11467 0.992 74 0.006
Asian 9839 9834 0.999 5 0.001
Black/African American 8653 8646 0.999 7 0.001
Native Hawaiian or Pacific Islander 2037 2032 0.998 5 0.002
Hispanic/Latino Ethnicity 317427 300573 0.947 587 0.002
White 149301 148671 0.996 630 0.004
Two or More Races 9109 9074 0.996 35 0.004
Unidentified Race 348272 321534 0.923 5319 0.015
LEP Status 184258 173633 0.942 640 0.003
IDEA Indicator 70710 70550 0.998 160 0.002
Section 504 Status 6894 6561 0.952 12 0.002
Economic Disadvantage Status 450036 446030 0.991 4006 0.009

Smarter Balanced 2015–16 Summative Assessment Technical Report
Chapter 5: Scores, Scales and Norms
5-86
TABLE 5-141 COUNT OF GRADE 4 ELA/LITERACY ADMINISTRATIONS BY MODE FOR SELECTED DEMOGRAPHIC GROUPS
Group Total Online Adaptive Paper-Pencil
N N P N P
Total 843395 800481 0.949 6596 0.008
Female 413010 392034 0.949 3190 0.008
Male 430139 408201 0.949 3406 0.008
American Indian or Alaska Native 11370 11279 0.992 84 0.007
Asian 9706 9698 0.999 8 0.001
Black/African American 8465 8452 0.998 13 0.002
Native Hawaiian or Pacific Islander 2189 2167 0.99 22 0.01
Hispanic/Latino Ethnicity 322808 306782 0.95 575 0.002
White 145693 145128 0.996 565 0.004
Two or More Races 8494 8477 0.998 17 0.002
Unidentified Race 354842 328659 0.926 5323 0.015
LEP Status 167048 157884 0.945 537 0.003
IDEA Indicator 76560 76426 0.998 134 0.002
Section 504 Status 8408 7991 0.95 11 0.001
Economic Disadvantage Status 454479 450544 0.991 3935 0.009
TABLE 5-142 COUNT OF GRADE 5 ELA/LITERACY ADMINISTRATIONS BY MODE FOR SELECTED DEMOGRAPHIC GROUPS
Group Total Online Adaptive Paper-Pencil
N N P N P
Total 829247 787492 0.950 6222 0.008
Female 406201 385696 0.950 3063 0.008
Male 422828 401578 0.950 3159 0.007
American Indian or Alaska Native 11354 11268 0.992 73 0.006
Asian 10363 10355 0.999 8 0.001
Black/African American 8182 8169 0.998 13 0.002
Native Hawaiian or Pacific Islander 2203 2188 0.993 15 0.007
Hispanic/Latino Ethnicity 312155 296513 0.950 575 0.002
White 143784 143198 0.996 586 0.004
Two or More Races 7991 7966 0.997 25 0.003
Unidentified Race 353614 328225 0.928 4936 0.014
LEP Status 133329 127097 0.953 467 0.004
IDEA Indicator 78093 77934 0.998 159 0.002
Section 504 Status 9913 9378 0.946 18 0.002
Economic Disadvantage Status 440963 437260 0.992 3703 0.008

Smarter Balanced 2015–16 Summative Assessment Technical Report
Chapter 5: Scores, Scales and Norms
5-87
TABLE 5-143 COUNT OF GRADE 6 ELA/LITERACY ADMINISTRATIONS BY MODE FOR SELECTED DEMOGRAPHIC GROUPS
Group Total Online Adaptive Paper-Pencil
N N P N P
Total 824815 783172 0.95 6932 0.008
Female 403351 382882 0.949 3418 0.008
Male 421240 400066 0.95 3514 0.008
American Indian or Alaska Native 11172 11098 0.993 50 0.004
Asian 10448 10435 0.999 13 0.001
Black/African American 7896 7865 0.996 31 0.004
Native Hawaiian or Pacific Islander 2024 2009 0.993 15 0.007
Hispanic/Latino Ethnicity 302232 286877 0.949 596 0.002
White 144189 143657 0.996 532 0.004
Two or More Races 13271 13254 0.999 17 0.001
Unidentified Race 358275 332660 0.929 5687 0.016
LEP Status 107629 102432 0.952 419 0.004
IDEA Indicator 74366 74262 0.999 104 0.001
Section 504 Status 11225 10591 0.944 16 0.001
Economic Disadvantage Status 429804 425803 0.991 4001 0.009
TABLE 5-144 COUNT OF GRADE 7 ELA/LITERACY ADMINISTRATIONS BY MODE FOR SELECTED DEMOGRAPHIC GROUPS
Group Total Online Adaptive Paper-Pencil
N N P N P
Total 818921 777440 0.949 6513 0.008
Female 400284 380103 0.95 3177 0.008
Male 418445 397145 0.949 3336 0.008
American Indian or Alaska Native 10984 10917 0.994 38 0.003
Asian 10431 10421 0.999 10 0.001
Black/African American 7780 7754 0.997 26 0.003
Native Hawaiian or Pacific Islander 1907 1894 0.993 13 0.007
Hispanic/Latino Ethnicity 296186 280995 0.949 541 0.002
White 142782 142174 0.996 608 0.004
Two or More Races 12595 12580 0.999 15 0.001
Unidentified Race 360365 334800 0.929 5276 0.015
LEP Status 88627 83431 0.941 362 0.004
IDEA Indicator 71425 71308 0.998 117 0.002
Section 504 Status 12192 11513 0.944 25 0.002
Economic Disadvantage Status 418645 414953 0.991 3692 0.009
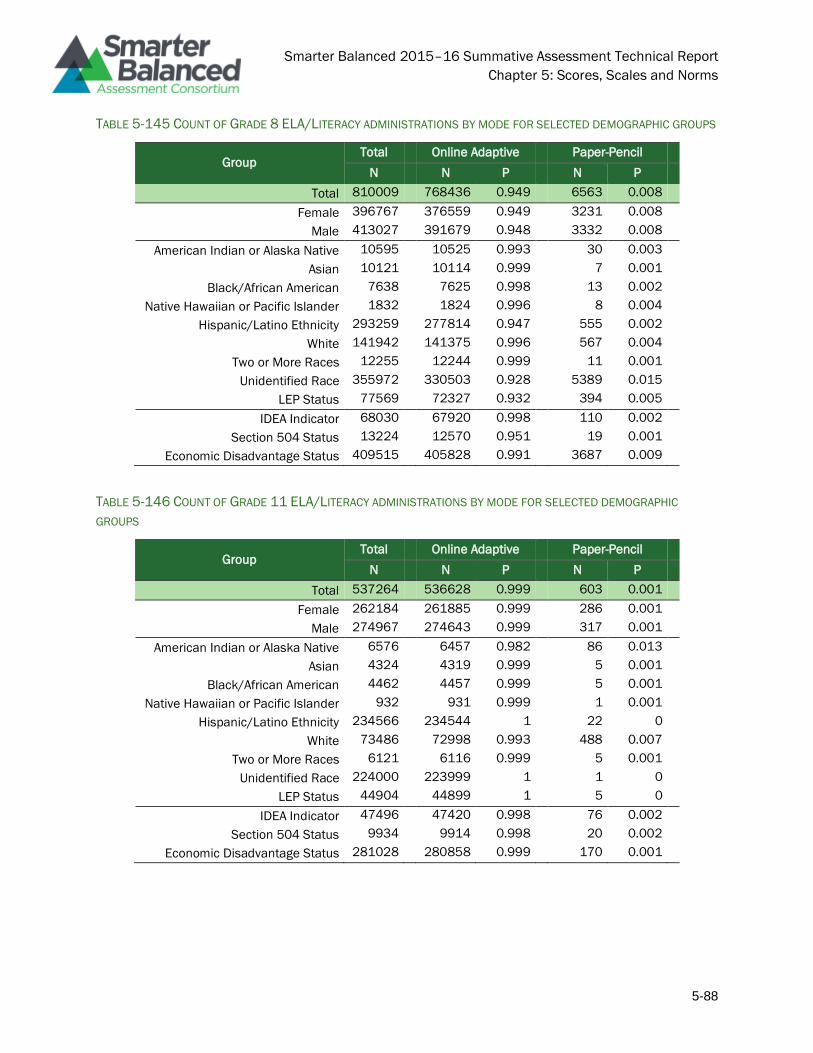
Smarter Balanced 2015–16 Summative Assessment Technical Report
Chapter 5: Scores, Scales and Norms
5-88
TABLE 5-145 COUNT OF GRADE 8 ELA/LITERACY ADMINISTRATIONS BY MODE FOR SELECTED DEMOGRAPHIC GROUPS
Group Total Online Adaptive Paper-Pencil
N N P N P
Total 810009 768436 0.949 6563 0.008
Female 396767 376559 0.949 3231 0.008
Male 413027 391679 0.948 3332 0.008
American Indian or Alaska Native 10595 10525 0.993 30 0.003
Asian 10121 10114 0.999 7 0.001
Black/African American 7638 7625 0.998 13 0.002
Native Hawaiian or Pacific Islander 1832 1824 0.996 8 0.004
Hispanic/Latino Ethnicity 293259 277814 0.947 555 0.002
White 141942 141375 0.996 567 0.004
Two or More Races 12255 12244 0.999 11 0.001
Unidentified Race 355972 330503 0.928 5389 0.015
LEP Status 77569 72327 0.932 394 0.005
IDEA Indicator 68030 67920 0.998 110 0.002
Section 504 Status 13224 12570 0.951 19 0.001
Economic Disadvantage Status 409515 405828 0.991 3687 0.009
TABLE 5-146 COUNT OF GRADE 11 ELA/LITERACY ADMINISTRATIONS BY MODE FOR SELECTED DEMOGRAPHIC
GROUPS
Group Total Online Adaptive Paper-Pencil
N N P N P
Total 537264 536628 0.999 603 0.001
Female 262184 261885 0.999 286 0.001
Male 274967 274643 0.999 317 0.001
American Indian or Alaska Native 6576 6457 0.982 86 0.013
Asian 4324 4319 0.999 5 0.001
Black/African American 4462 4457 0.999 5 0.001
Native Hawaiian or Pacific Islander 932 931 0.999 1 0.001
Hispanic/Latino Ethnicity 234566 234544 1 22 0
White 73486 72998 0.993 488 0.007
Two or More Races 6121 6116 0.999 5 0.001
Unidentified Race 224000 223999 1 1 0
LEP Status 44904 44899 1 5 0
IDEA Indicator 47496 47420 0.998 76 0.002
Section 504 Status 9934 9914 0.998 20 0.002
Economic Disadvantage Status 281028 280858 0.999 170 0.001
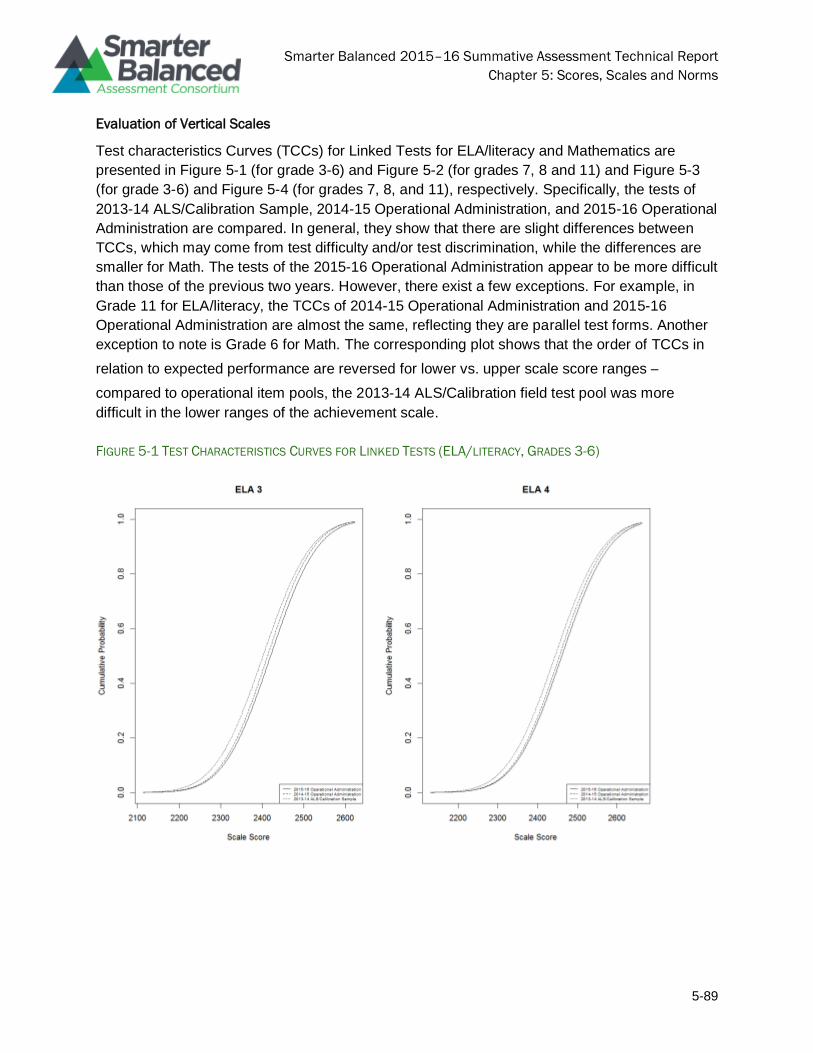
Smarter Balanced 2015–16 Summative Assessment Technical Report
Chapter 5: Scores, Scales and Norms
5-89
Evaluation of Vertical Scales
Test characteristics Curves (TCCs) for Linked Tests for ELA/literacy and Mathematics are
presented in Figure 5-1 (for grade 3-6) and Figure 5-2 (for grades 7, 8 and 11) and Figure 5-3
(for grade 3-6) and Figure 5-4 (for grades 7, 8, and 11), respectively. Specifically, the tests of
2013-14 ALS/Calibration Sample, 2014-15 Operational Administration, and 2015-16 Operational
Administration are compared. In general, they show that there are slight differences between
TCCs, which may come from test difficulty and/or test discrimination, while the differences are
smaller for Math. The tests of the 2015-16 Operational Administration appear to be more difficult
than those of the previous two years. However, there exist a few exceptions. For example, in
Grade 11 for ELA/literacy, the TCCs of 2014-15 Operational Administration and 2015-16
Operational Administration are almost the same, reflecting they are parallel test forms. Another
exception to note is Grade 6 for Math. The corresponding plot shows that the order of TCCs in
relation to expected performance are reversed for lower vs. upper scale score ranges –
compared to operational item pools, the 2013-14 ALS/Calibration field test pool was more
difficult in the lower ranges of the achievement scale.
FIGURE 5-1 TEST CHARACTERISTICS CURVES FOR LINKED TESTS (ELA/LITERACY, GRADES 3-6)
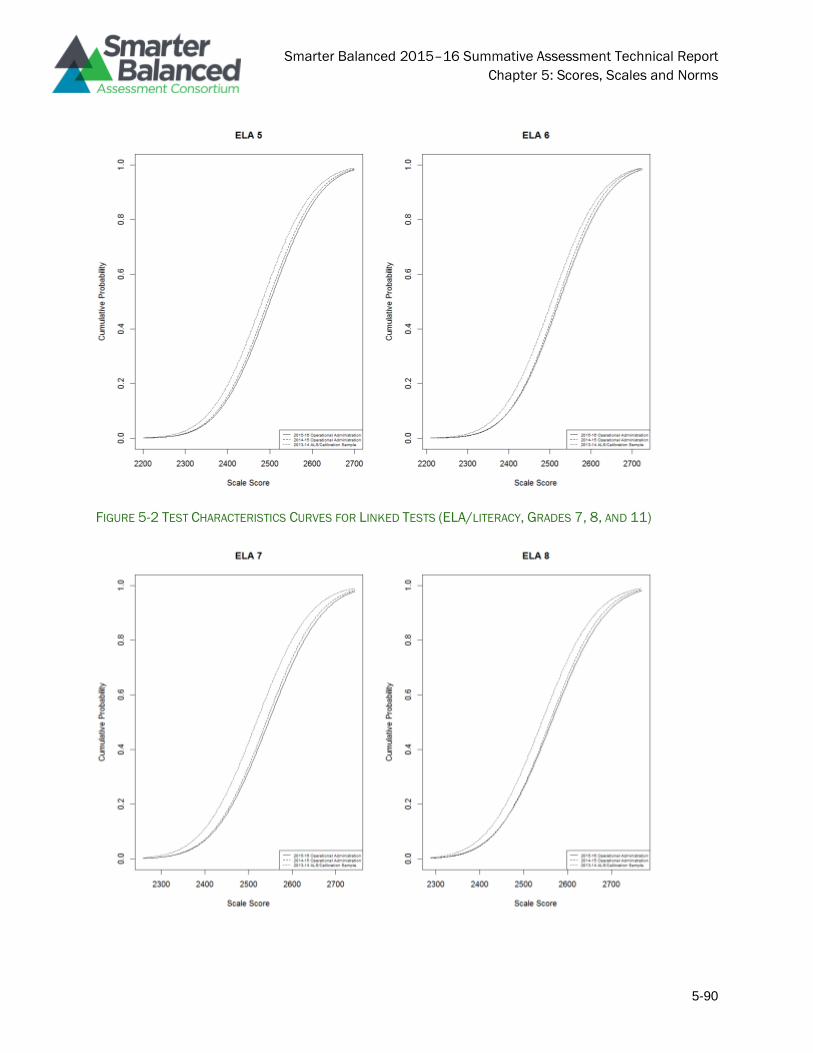
Smarter Balanced 2015–16 Summative Assessment Technical Report
Chapter 5: Scores, Scales and Norms
5-90
FIGURE 5-2 TEST CHARACTERISTICS CURVES FOR LINKED TESTS (ELA/LITERACY, GRADES 7, 8, AND 11)
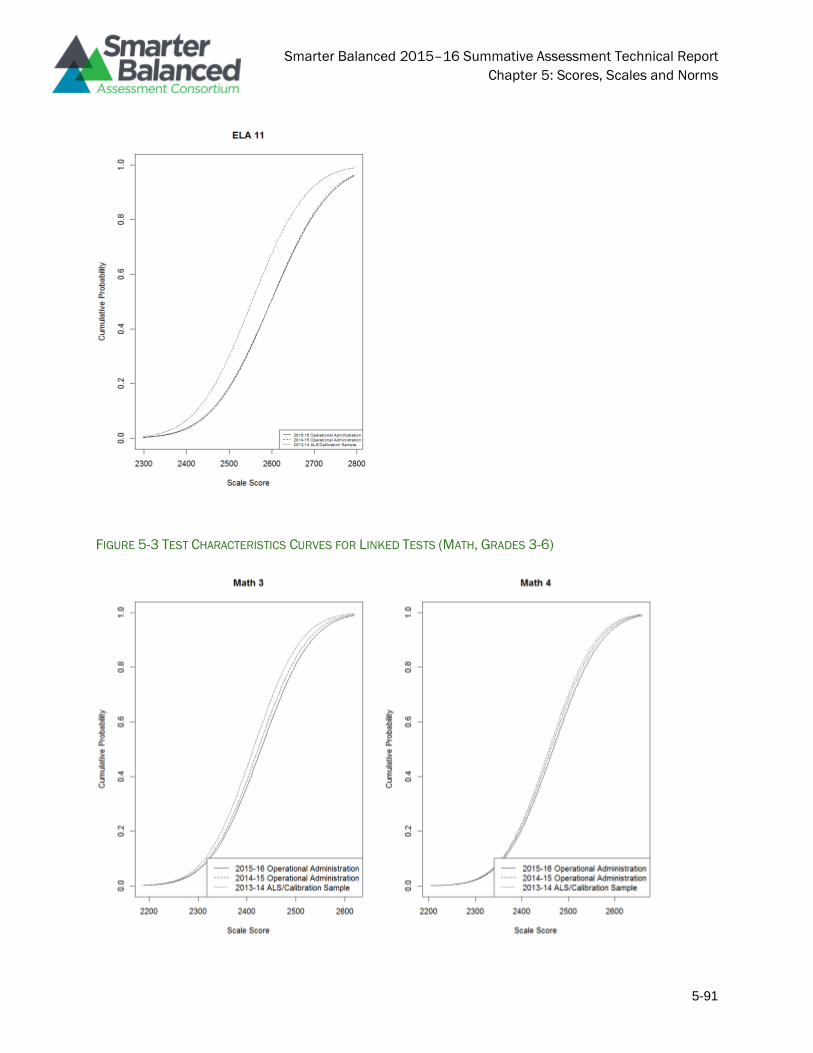
Smarter Balanced 2015–16 Summative Assessment Technical Report
Chapter 5: Scores, Scales and Norms
5-91
FIGURE 5-3 TEST CHARACTERISTICS CURVES FOR LINKED TESTS (MATH, GRADES 3-6)
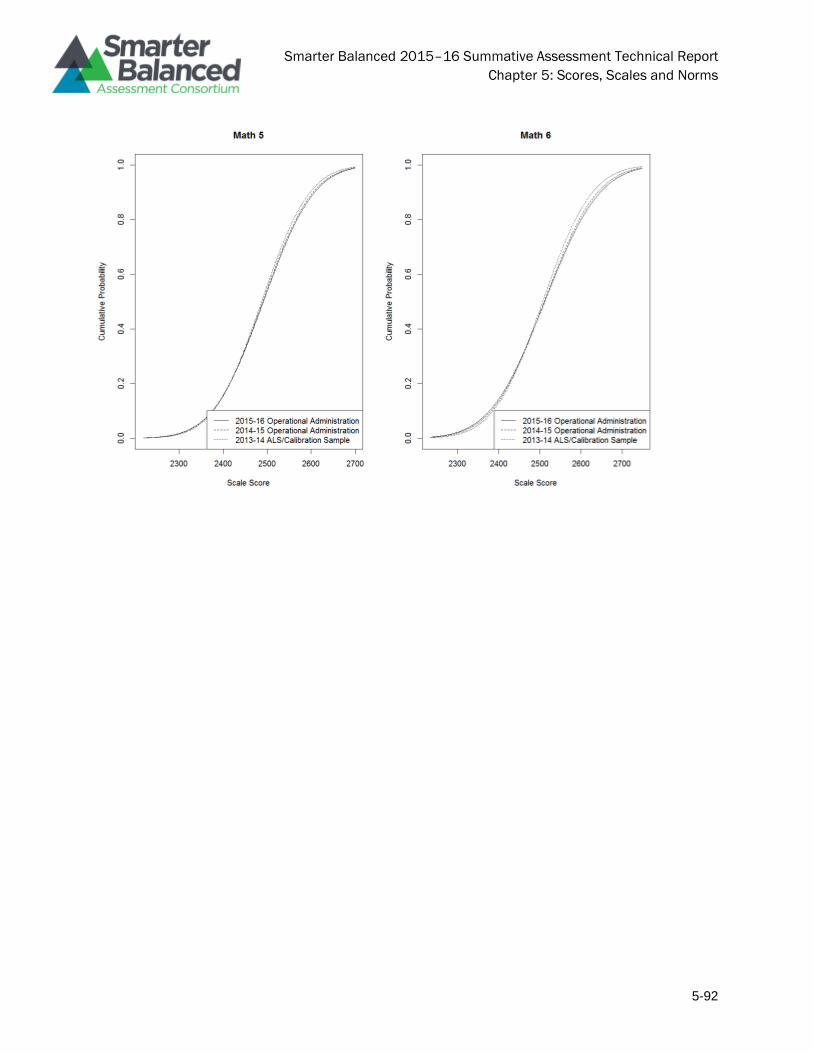
Smarter Balanced 2015–16 Summative Assessment Technical Report
Chapter 5: Scores, Scales and Norms
5-92
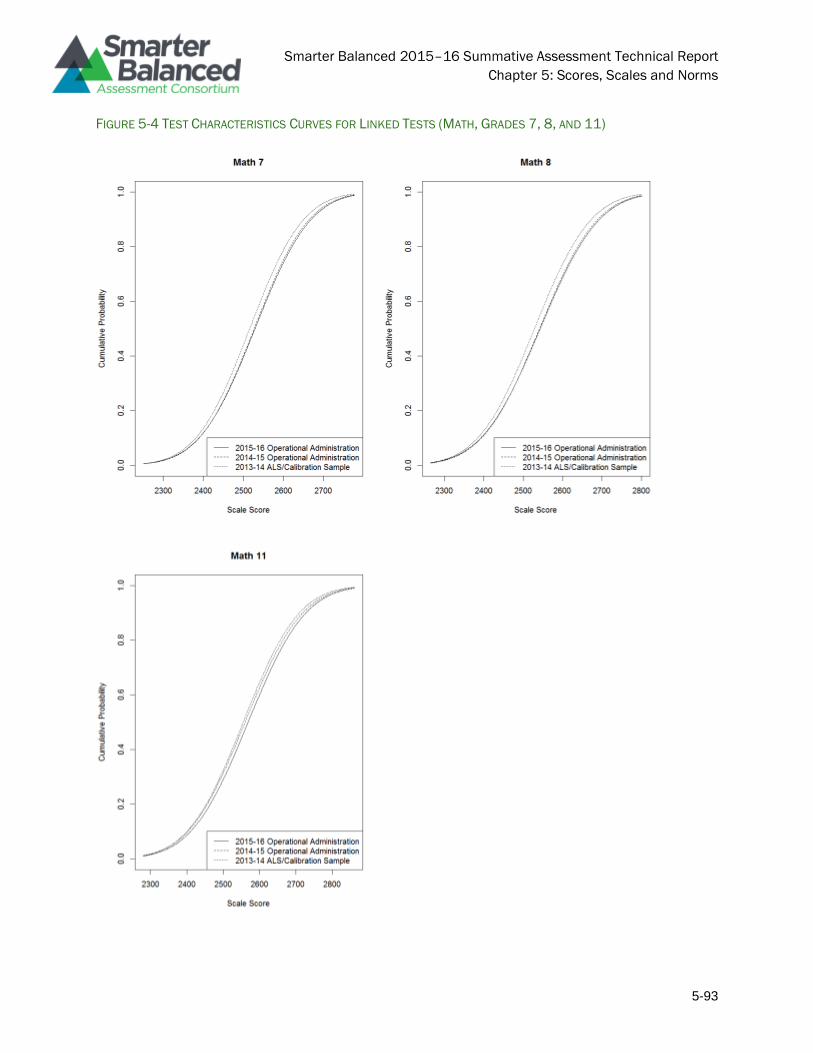
Smarter Balanced 2015–16 Summative Assessment Technical Report
Chapter 5: Scores, Scales and Norms
5-93
FIGURE 5-4 TEST CHARACTERISTICS CURVES FOR LINKED TESTS (MATH, GRADES 7, 8, AND 11)
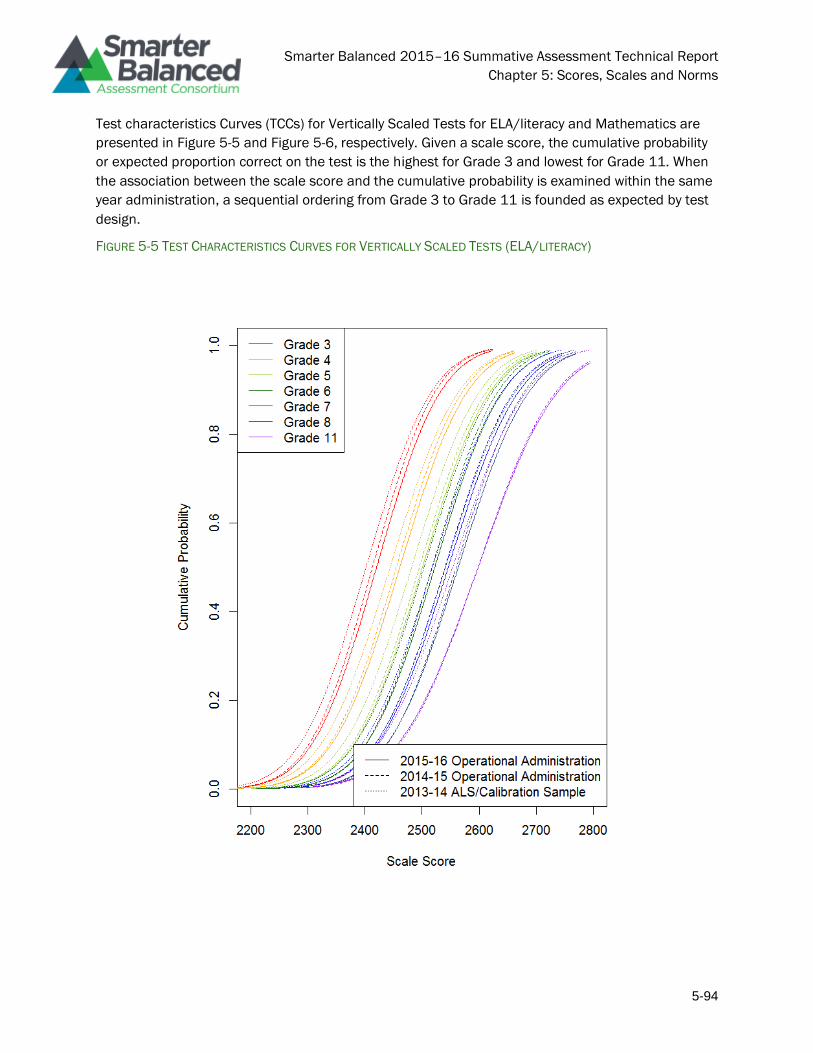
Smarter Balanced 2015–16 Summative Assessment Technical Report
Chapter 5: Scores, Scales and Norms
5-94
Test characteristics Curves (TCCs) for Vertically Scaled Tests for ELA/literacy and Mathematics are
presented in Figure 5-5 and Figure 5-6, respectively. Given a scale score, the cumulative probability
or expected proportion correct on the test is the highest for Grade 3 and lowest for Grade 11. When
the association between the scale score and the cumulative probability is examined within the same
year administration, a sequential ordering from Grade 3 to Grade 11 is founded as expected by test
design.
FIGURE 5-5 TEST CHARACTERISTICS CURVES FOR VERTICALLY SCALED TESTS (ELA/LITERACY)
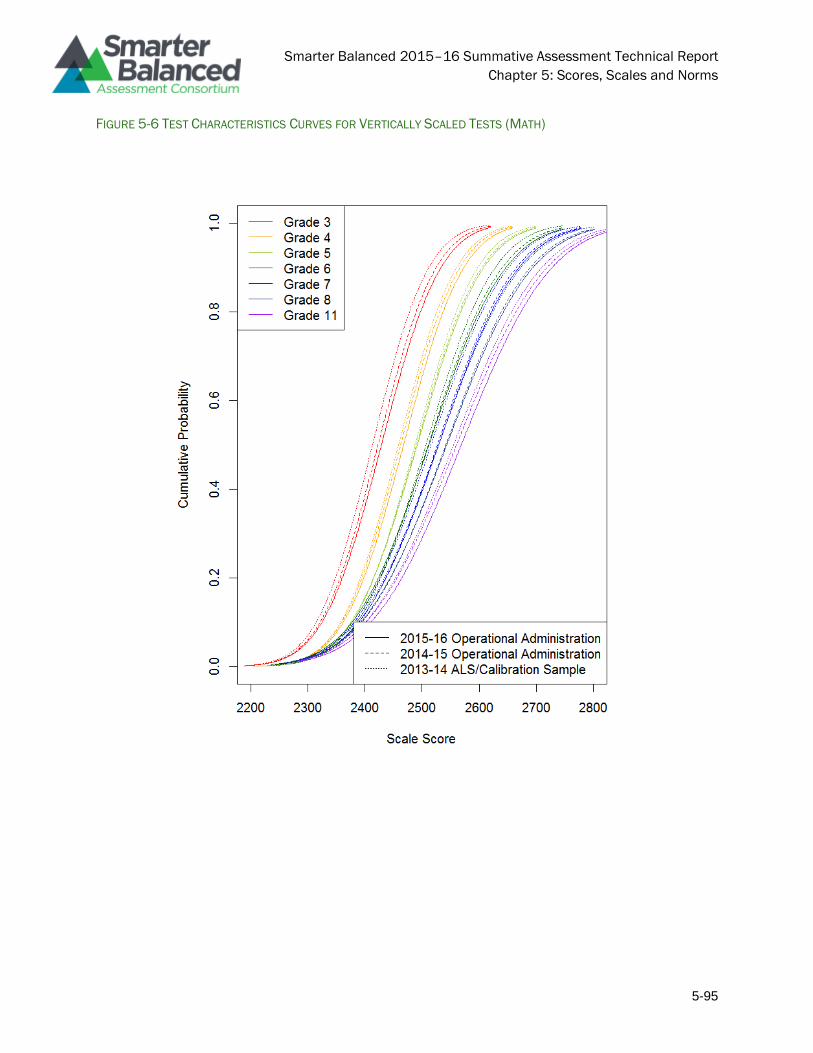
Smarter Balanced 2015–16 Summative Assessment Technical Report
Chapter 5: Scores, Scales and Norms
5-95
FIGURE 5-6 TEST CHARACTERISTICS CURVES FOR VERTICALLY SCALED TESTS (MATH)
Smarter Balanced 2015–16 Summative Assessment Technical Report
Chapter 5: Scores, Scales and Norms
5-96
References
Birnbaum, A. (1968). Some Latent trait models and their use in inferring an examinee’s ability.
pp. 395-479. In Lord, F. M. and Novick, M. R. Statistical Theories of Mental Test Scores.
Reading: Addison-Wesley.
Cizek, G. J. & Bunch, M. B. (2007). Standard setting: A guide to establishing and evaluating
performance standards on tests. Thousand Oaks, CA: Sage.
CTB/McGraw Hill. (2014). Technical report: Initial achievement level descriptors. Los Angeles, CA.
Smarter Balanced Assessment Consortium. Retrieved from:
http://www.smarterbalanced.org/assessments/development/additional-technical-
documentation/
Lewis, D. M., Mitzel, H. C., Mercado, R. L, & Schulz, E. M. (2012). The bookmark standard setting
procedure. In G. J. Cizek (Ed.), Setting Performance Standards: Foundations, Methods, and
Innovations. New York: Routledge.
Masters, G. (1982). A Rasch model for partial credit scoring. Psychometrika, 47, 149–174.
Muraki, E. (1992). A generalized partial credit model: Application of an EM algorithm. Applied
Psychological Measurement, 16, 159-176.
Muraki, E., & Bock, R. D. (2003). PARSCALE 4.1: IRT based item analysis and test scoring for rating-
scale data. Chicago, IL: Scientific Software International, Inc.
Smarter Balanced Assessment Consortium. (2015a, January 7). Achievement level setting final
report. Los Angeles, CA: Author.
Smarter Balanced Assessment Consortium. (2016, January 14). 2013-2014 Technical Report. Los
Angeles, CA: Author. Retrieved from http://www.smarterbalanced.org/wp-
content/uploads/2015/08/2013-14_Technical_Report.pdf
Smarter Balanced 2015–16 Summative Assessment Technical Report
Chapter 6: Test Administration
6-1
Chapter 6: Test Administration
Smarter Balanced 2015–16 Summative Assessment Technical Report
Chapter 6: Test Administration
6-2
Introduction
“The usefulness and interpretability of test scores require that a test be administered and scored
according to the developer’s instructions” (American Educational Research Association [AERA],
American Psychological Association [APA], & National Council on Measurement in Education [NCME],
2014, p. 111). Smarter Balanced created and disseminated a customizable test administration
manual (2014c) to ensure standardized test administration procedures and, thus, uniform test
administration conditions for all students in Smarter Balanced member states. This chapter
describes the customizable Smarter Balanced Online Test Administration Manual; presents
operational item exposure rates and blueprint fidelity; and shows results for the embedded field test,
including item scoring processes and inter-rater reliability of field tested items.
Test Administration
Students in Smarter Balanced member states participated in the 2015 test administration when a
specified percentage of the school year had occurred. Each state established a schedule for the
administration of the Smarter Balanced summative assessments using a testing window as defined
below:
Grades 3–8
• Testing shall not begin until at least sixty-six percent (66%) of a school’s annual instructional
days have been completed, and
• Testing may continue up to and including the last day of school.
Grade 11
• Testing shall not begin until at least eighty percent (80%) of a school’s annual instructional
days have been completed, and
• Testing may continue up to and including the last day of school.
States were allowed to establish more specific windows within the constraints of the Consortium-
defined windows described above. (Smarter Balanced, 2014c, p. 25)
Session Time
Table 2.1 presents the estimated testing times. These were provided within the Online Test
Administration Manual (Smarter Balanced, 2014c, pp. 25-26). The estimated times for each session
of each content area test provides sufficient time for students to attempt all items.
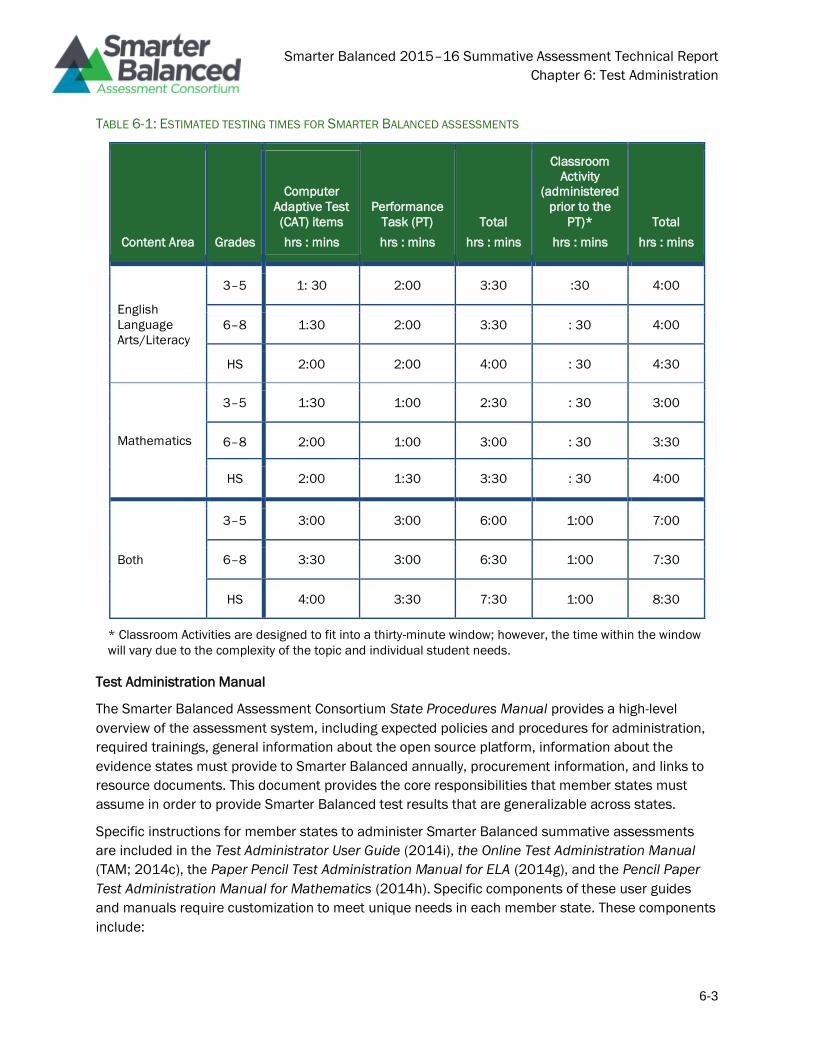
Smarter Balanced 2015–16 Summative Assessment Technical Report
Chapter 6: Test Administration
6-3
TABLE 6-1: ESTIMATED TESTING TIMES FOR SMARTER BALANCED ASSESSMENTS
Content Area Grades
Computer
Adaptive Test
(CAT) items
hrs : mins
Performance
Task (PT)
hrs : mins
Total
hrs : mins
Classroom
Activity
(administered
prior to the
PT)*
hrs : mins
Total
hrs : mins
English
Language
Arts/Literacy
3–5 1: 30 2:00 3:30 :30 4:00
6–8 1:30 2:00 3:30 : 30 4:00
HS 2:00 2:00 4:00 : 30 4:30
Mathematics
3–5 1:30 1:00 2:30 : 30 3:00
6–8 2:00 1:00 3:00 : 30 3:30
HS 2:00 1:30 3:30 : 30 4:00
Both
3–5 3:00 3:00 6:00 1:00 7:00
6–8 3:30 3:00 6:30 1:00 7:30
HS 4:00 3:30 7:30 1:00 8:30
* Classroom Activities are designed to fit into a thirty-minute window; however, the time within the window
will vary due to the complexity of the topic and individual student needs.
Test Administration Manual
The Smarter Balanced Assessment Consortium State Procedures Manual provides a high-level
overview of the assessment system, including expected policies and procedures for administration,
required trainings, general information about the open source platform, information about the
evidence states must provide to Smarter Balanced annually, procurement information, and links to
resource documents. This document provides the core responsibilities that member states must
assume in order to provide Smarter Balanced test results that are generalizable across states.
Specific instructions for member states to administer Smarter Balanced summative assessments
are included in the Test Administrator User Guide (2014i), the Online Test Administration Manual
(TAM; 2014c), the Paper Pencil Test Administration Manual for ELA (2014g), and the Pencil Paper
Test Administration Manual for Mathematics (2014h). Specific components of these user guides
and manuals require customization to meet unique needs in each member state. These components
include:
Smarter Balanced 2015–16 Summative Assessment Technical Report
Chapter 6: Test Administration
6-4
• Help Desk information
• Test expiration dates
• Administration and Registration Tools (ART) user roles
• State user roles
• Test security policy
• Links to where materials and modules are posted
• Test Security/Administration training policy
• Instructions for identifying and retrieving the Classroom Activity
• Role–specific checklists
The development of the Smarter Balanced test administration manuals were guided by the AERA,
APA, and NCME 2014 Standards. In regard to test administration, the Standards provide guidance to
test developers that the directions for test administration should be sufficiently clear to allow for
standardized implementation in a variety of conditions (see Standard 4.15). In addition, the
standards provide guidance that test developers should provide sufficient detail so that test takers
can respond to items and tasks in the manner intended by the test developer (see Standard 4.16).
Clear Directions to Ensure Uniform Administration
Smarter Balanced test administration manuals include instructions that clearly articulate various
aspects of the administration process. The TAM covers an extensive amount of material for events
that occur before, during, and after testing. In addition, the TAM points the user to training materials
that further provide detail and clarity to support reliable test administration by qualified test
administrators. The details provided in the TAM describe the general rules of online testing,
including; pause rules; scheduling tests; recommended order of test administration; classroom
activity information; assessment duration, timing, and sequencing information; and the
materials that the test administrator and students need for testing. All work together to ensure
uniform test administration conditions across Smarter Balanced member states.
Section 8 of the TAM provides an overview of the universal tools, designated supports, and
accommodations. All are further explicated in the Smarter Balanced Assessment Consortium
Usability, Accessibility, and Accommodations Guidelines and the Usability, Accessibility, and
Accommodations Implementation Guide (2014e).
Detailed Instructions for Test Takers
Section 10 of the TAM provides step-by-step instructions to test administrators (TA) on how to start a
test session, monitor a test session, and end a test session. Throughout the steps, Smarter Balanced
embedded scripts that TAs are instructed to read to students. Test administrators are instructed to
strictly adhere to scripts, use professional judgment when responding to student questions, and
refrain from reading test items, suggesting answers, or evaluating student work during testing. See
Section 10 of the online TAM for the script (Smarter Balanced, 2014c, pp. 37-45).
Smarter Balanced 2015–16 Summative Assessment Technical Report
Chapter 6: Test Administration
6-5
In addition, Smarter Balanced provides tutorials and practice tests 0F
10 for each content area to
familiarize students with how to navigate the online test delivery system and practice with the item
types and the functionality of the testing environment. Together with the detailed instructions, the
tutorials and practice tests assure that students are able to answer the items and tasks in the
manner intended by Smarter Balanced.
Responsibilities of Test Administrators
The AERA, APA, and NCME Standards (2014) also provide guidance to test administrators and test
users. Test administrators are guided to carefully follow the standardized procedures (Standard 6.1);
inform test takers of available accommodations (Standard 6.2); report changes or disruptions to the
standardized test administration (Standard 6.3); furnish a comfortable environment with minimal
distractions (Standard 6.4); provide appropriate instructions, practice, and other supports (Standard
6.5); and ensure the integrity of the test by eliminating opportunities for test taker malfeasance
(Standard 6.6). In addition, test users are responsible for test security at all times (Standard 6.7). To
align to these guidelines, the online TAM provides:
• careful direction to TAs to strictly adhere to the directions in the TAM;
• available universal tools, designated supports, and accommodations;
• requirements of the test environment, including student seating, providing a quiet
environment, and access to allowable universal tools, designated supports, and
accommodations;
• descriptions of testing improprieties, irregularities, and breaches.
Deviations from standardized online testing procedures (specifically testing irregularities and
improprieties are handled at the local and/or state level, per the guidelines in the Online TAM.
Depending on the nature and severity of the incident, a student’s test may be reset, invalidated,
reopened, or restored. All such incidents must be reported by authorized administrators at the local
level to the state level (Smarter Balanced, 2014c, pp. 15-20).
Tools, Designated Supports, and Accommodations
To enhance student access to the assessment content during test administration, Smarter Balanced
developed a conceptual model that included universal tools, designated supports, and
accommodations (2014e, p.4). Universal Tools are access features of the Smarter Balanced
assessment that are either provided as digitally-delivered components of the test delivery system
(embedded) or provided separately from the test delivery system (non-embedded). Universal tools
are available to all students based on student preference and selection. Embedded universal tools
include (but are not limited to) such features as a “pause” feature that allows the student to take a
break of 20 minutes or less during the assessment; a digital calculator that the student may access
by clicking on a calculator button; and a digital notepad. Non-embedded universal tools include (but
are not limited to) provision of an English dictionary for the full-write portion of the ELA/literacy
performance task and the provision of physical scratch paper for all content area tests.
10 http://www.smarterbalanced.org/assessments/practice-and-training-tests/
Smarter Balanced 2015–16 Summative Assessment Technical Report
Chapter 6: Test Administration
6-6
Designated supports for the Smarter Balanced assessments are embedded and non-embedded
features that are available for use by any student for whom the need has been indicated by an
educator or team of educators (along with the student and his/her parent/guardian) familiar with the
student’s instructional needs. Embedded designated supports include (but are not limited to) such
features as color contrast, which enables students to adjust background or font color; translated
test directions, translated glossaries, and stacked translations for mathematics items. Non-
embedded designated supports include (but are not limited to) provision of color overlays; printing
test content with different colors; use of magnification devices; and use of noise buffers.
Accommodations are changes in procedures or materials that increase equitable access during the
Smarter Balanced assessments. Students receiving accommodations must have a need for those
accommodations documented in an Individualized Education Program (IEP) or 504 accommodation
plan. Like universal tools and designated supports, accommodations may be either embedded or
non-embedded. Examples of embedded accommodations include (but are not limited to) closed
captioning and test content translated into American Sign Language (ASL) video. Non-embedded
accommodations include (but are not limited to) use of an abacus, print on demand, and use of an
external communication device (speech-to-text). Universal tools, designated supports, and
accommodations all yield valid scores that count as participation in assessments that meet the
requirements of ESEA when used in a manner consistent with the Smarter Balanced Usability,
Accessibility, and Accommodations Guidelines. A complete summary of all embedded and non-
embedded universal tools, designated supports, and accommodations is included in the Usability,
Accessibility, and Accommodations Guidelines.
Item Exposure Rates
Item exposure rates were obtained using online and adaptive test instances with valid scale scores
for which item data were available from the 2015-2016 summative administration. The exposure
rate for a given item is the proportion of test instances (in the grade and content area) on which the
item appeared.
Table 6-2 and Table 6-3 presents a summary of the item exposure results for ELA/literacy and
mathematics, respectively. Within each grade and component (CAT and PT), both tables present the
number of items in the operational pool (N), along with various descriptive statistics, including the
mean, standard deviation (SD), range (Min, Max), and median of the observed exposure rates. Table
6-2 shows that, on average, the same item appeared in 7% of the Grade 3 tests, or, in other words,
7% of Grade 3 examinees saw the same item. As a rule of thumb, Smarter Balanced attempts to
maintain a maximum exposure rate of 25% (i.e., 25% of examinees will see the same item). Table 6-
2 shows that the mean and median exposure rates for ELA/literacy items are well below 25%. Table
6-3 shows that the mean and median exposure rates for mathematics items are also well below
25%.
Table 6-4 and Table 6-5 provide further information about the exposure rate by showing the number
of items in the operational pool (N) and proportion of items with exposure rates falling into certain
ranges (bins with a width of 0.1), including those that were completely unexposed (Unused). Table
6-4 shows over 80% of ELA/literacy CAT items had item exposure rates between 0 and 20%. Also,
nearly all of the PT items had item exposure rates between 0 and 20%, while the rest were unused.
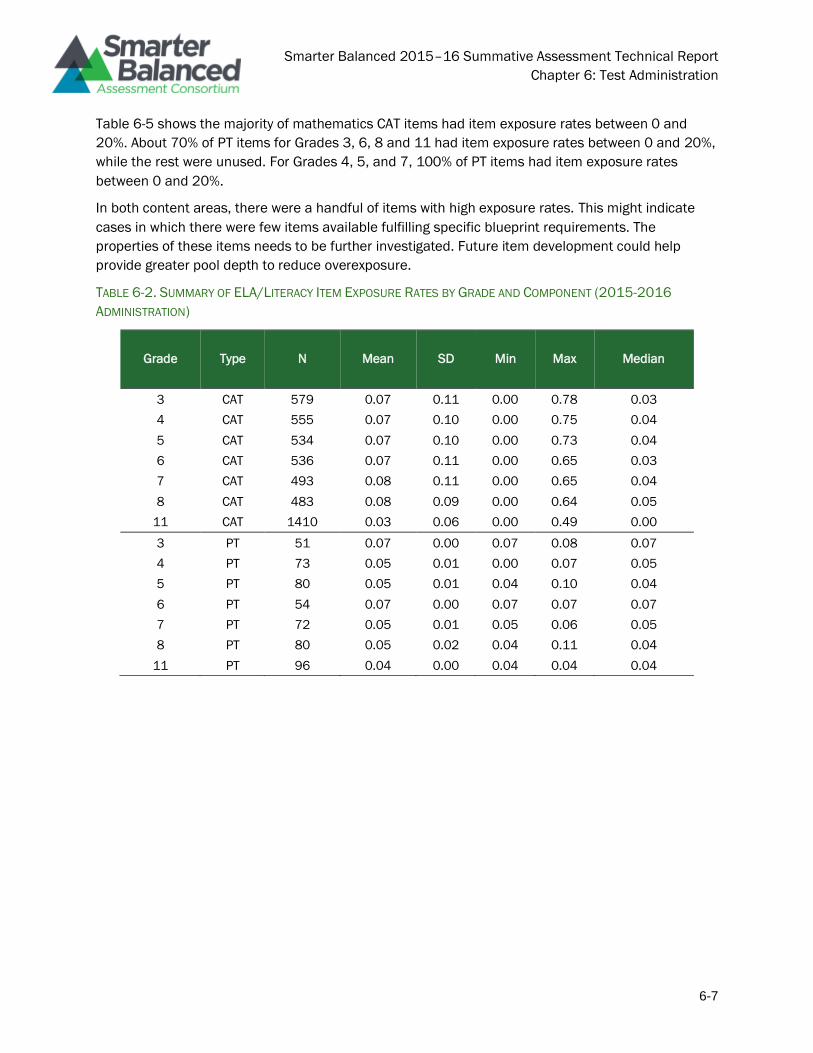
Smarter Balanced 2015–16 Summative Assessment Technical Report
Chapter 6: Test Administration
6-7
Table 6-5 shows the majority of mathematics CAT items had item exposure rates between 0 and
20%. About 70% of PT items for Grades 3, 6, 8 and 11 had item exposure rates between 0 and 20%,
while the rest were unused. For Grades 4, 5, and 7, 100% of PT items had item exposure rates
between 0 and 20%.
In both content areas, there were a handful of items with high exposure rates. This might indicate
cases in which there were few items available fulfilling specific blueprint requirements. The
properties of these items needs to be further investigated. Future item development could help
provide greater pool depth to reduce overexposure.
TABLE 6-2. SUMMARY OF ELA/LITERACY ITEM EXPOSURE RATES BY GRADE AND COMPONENT (2015-2016
ADMINISTRATION)
Grade Type N Mean SD Min Max Median
3 CAT 579 0.07 0.11 0.00 0.78 0.03
4 CAT 555 0.07 0.10 0.00 0.75 0.04
5 CAT 534 0.07 0.10 0.00 0.73 0.04
6 CAT 536 0.07 0.11 0.00 0.65 0.03
7 CAT 493 0.08 0.11 0.00 0.65 0.04
8 CAT 483 0.08 0.09 0.00 0.64 0.05
11 CAT 1410 0.03 0.06 0.00 0.49 0.00
3 PT 51 0.07 0.00 0.07 0.08 0.07
4 PT 73 0.05 0.01 0.00 0.07 0.05
5 PT 80 0.05 0.01 0.04 0.10 0.04
6 PT 54 0.07 0.00 0.07 0.07 0.07
7 PT 72 0.05 0.01 0.05 0.06 0.05
8 PT 80 0.05 0.02 0.04 0.11 0.04
11 PT 96 0.04 0.00 0.04 0.04 0.04
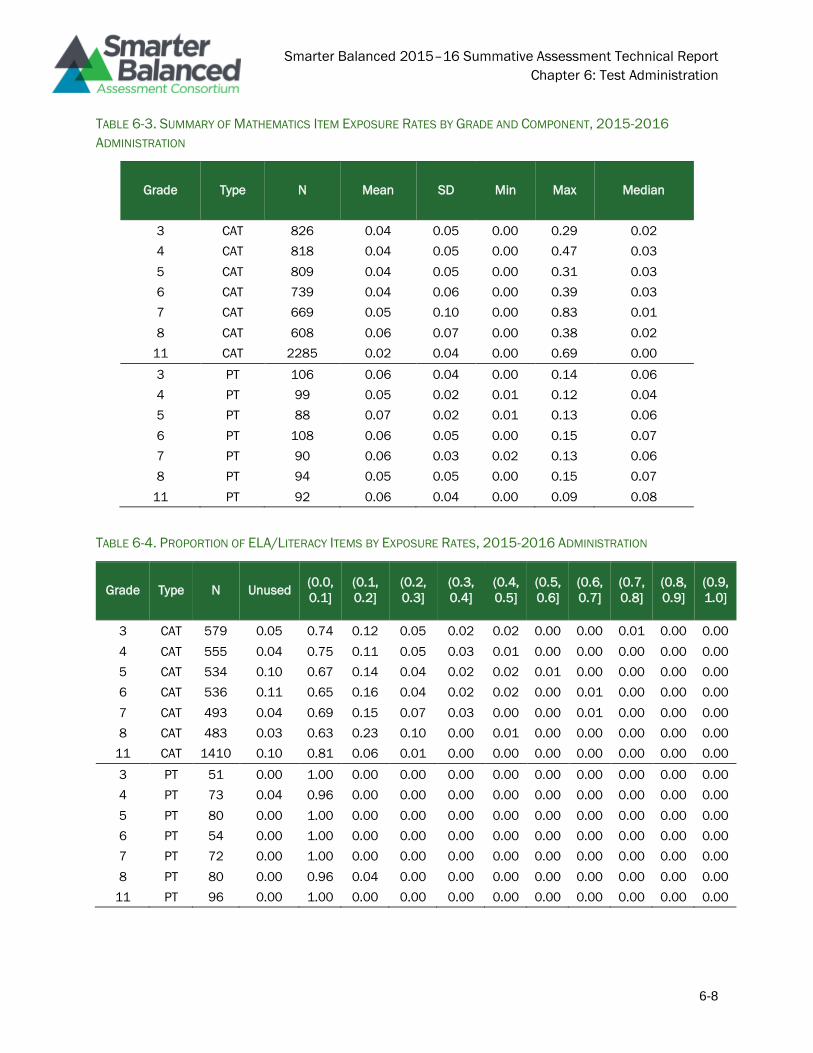
Smarter Balanced 2015–16 Summative Assessment Technical Report
Chapter 6: Test Administration
6-8
TABLE 6-3. SUMMARY OF MATHEMATICS ITEM EXPOSURE RATES BY GRADE AND COMPONENT, 2015-2016
ADMINISTRATION
Grade Type N Mean SD Min Max Median
3 CAT 826 0.04 0.05 0.00 0.29 0.02
4 CAT 818 0.04 0.05 0.00 0.47 0.03
5 CAT 809 0.04 0.05 0.00 0.31 0.03
6 CAT 739 0.04 0.06 0.00 0.39 0.03
7 CAT 669 0.05 0.10 0.00 0.83 0.01
8 CAT 608 0.06 0.07 0.00 0.38 0.02
11 CAT 2285 0.02 0.04 0.00 0.69 0.00
3 PT 106 0.06 0.04 0.00 0.14 0.06
4 PT 99 0.05 0.02 0.01 0.12 0.04
5 PT 88 0.07 0.02 0.01 0.13 0.06
6 PT 108 0.06 0.05 0.00 0.15 0.07
7 PT 90 0.06 0.03 0.02 0.13 0.06
8 PT 94 0.05 0.05 0.00 0.15 0.07
11 PT 92 0.06 0.04 0.00 0.09 0.08
TABLE 6-4. PROPORTION OF ELA/LITERACY ITEMS BY EXPOSURE RATES, 2015-2016 ADMINISTRATION
Grade Type N Unused (0.0,
0.1]
(0.1,
0.2]
(0.2,
0.3]
(0.3,
0.4]
(0.4,
0.5]
(0.5,
0.6]
(0.6,
0.7]
(0.7,
0.8]
(0.8,
0.9]
(0.9,
1.0]
3 CAT 579 0.05 0.74 0.12 0.05 0.02 0.02 0.00 0.00 0.01 0.00 0.00
4 CAT 555 0.04 0.75 0.11 0.05 0.03 0.01 0.00 0.00 0.00 0.00 0.00
5 CAT 534 0.10 0.67 0.14 0.04 0.02 0.02 0.01 0.00 0.00 0.00 0.00
6 CAT 536 0.11 0.65 0.16 0.04 0.02 0.02 0.00 0.01 0.00 0.00 0.00
7 CAT 493 0.04 0.69 0.15 0.07 0.03 0.00 0.00 0.01 0.00 0.00 0.00
8 CAT 483 0.03 0.63 0.23 0.10 0.00 0.01 0.00 0.00 0.00 0.00 0.00
11 CAT 1410 0.10 0.81 0.06 0.01 0.00 0.00 0.00 0.00 0.00 0.00 0.00
3 PT 51 0.00 1.00 0.00 0.00 0.00 0.00 0.00 0.00 0.00 0.00 0.00
4 PT 73 0.04 0.96 0.00 0.00 0.00 0.00 0.00 0.00 0.00 0.00 0.00
5 PT 80 0.00 1.00 0.00 0.00 0.00 0.00 0.00 0.00 0.00 0.00 0.00
6 PT 54 0.00 1.00 0.00 0.00 0.00 0.00 0.00 0.00 0.00 0.00 0.00
7 PT 72 0.00 1.00 0.00 0.00 0.00 0.00 0.00 0.00 0.00 0.00 0.00
8 PT 80 0.00 0.96 0.04 0.00 0.00 0.00 0.00 0.00 0.00 0.00 0.00
11 PT 96 0.00 1.00 0.00 0.00 0.00 0.00 0.00 0.00 0.00 0.00 0.00
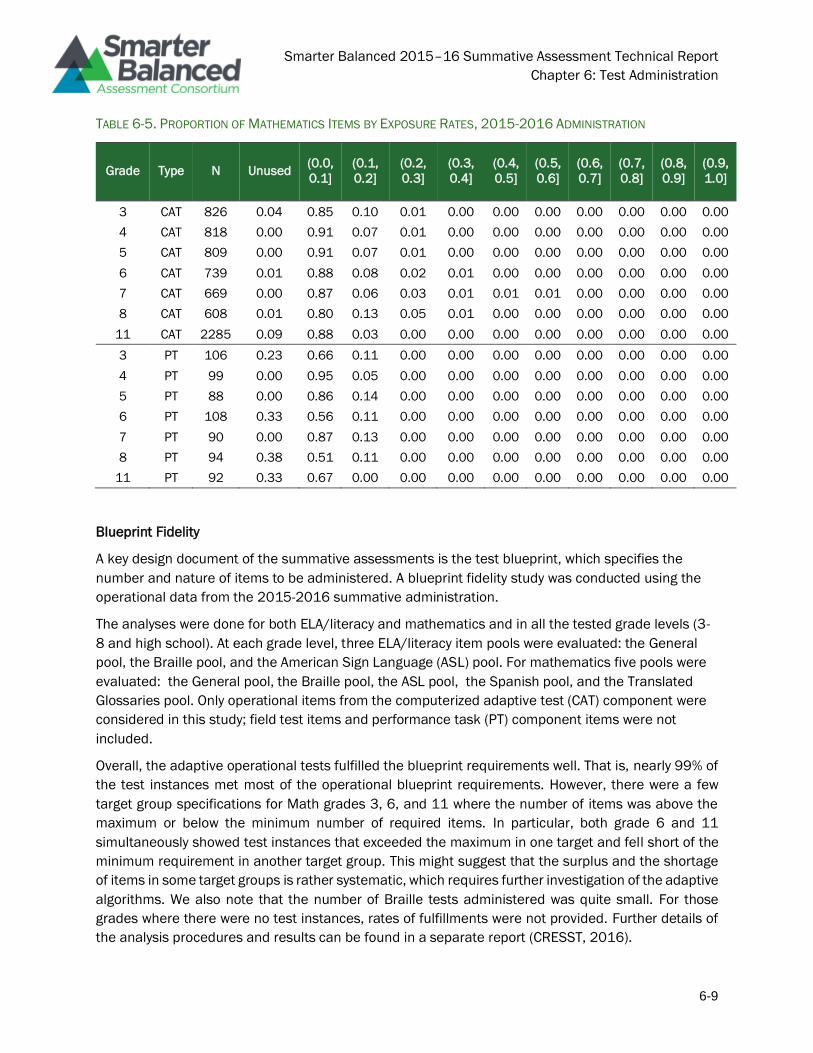
Smarter Balanced 2015–16 Summative Assessment Technical Report
Chapter 6: Test Administration
6-9
TABLE 6-5. PROPORTION OF MATHEMATICS ITEMS BY EXPOSURE RATES, 2015-2016 ADMINISTRATION
Grade Type N Unused (0.0,
0.1]
(0.1,
0.2]
(0.2,
0.3]
(0.3,
0.4]
(0.4,
0.5]
(0.5,
0.6]
(0.6,
0.7]
(0.7,
0.8]
(0.8,
0.9]
(0.9,
1.0]
3 CAT 826 0.04 0.85 0.10 0.01 0.00 0.00 0.00 0.00 0.00 0.00 0.00
4 CAT 818 0.00 0.91 0.07 0.01 0.00 0.00 0.00 0.00 0.00 0.00 0.00
5 CAT 809 0.00 0.91 0.07 0.01 0.00 0.00 0.00 0.00 0.00 0.00 0.00
6 CAT 739 0.01 0.88 0.08 0.02 0.01 0.00 0.00 0.00 0.00 0.00 0.00
7 CAT 669 0.00 0.87 0.06 0.03 0.01 0.01 0.01 0.00 0.00 0.00 0.00
8 CAT 608 0.01 0.80 0.13 0.05 0.01 0.00 0.00 0.00 0.00 0.00 0.00
11 CAT 2285 0.09 0.88 0.03 0.00 0.00 0.00 0.00 0.00 0.00 0.00 0.00
3 PT 106 0.23 0.66 0.11 0.00 0.00 0.00 0.00 0.00 0.00 0.00 0.00
4 PT 99 0.00 0.95 0.05 0.00 0.00 0.00 0.00 0.00 0.00 0.00 0.00
5 PT 88 0.00 0.86 0.14 0.00 0.00 0.00 0.00 0.00 0.00 0.00 0.00
6 PT 108 0.33 0.56 0.11 0.00 0.00 0.00 0.00 0.00 0.00 0.00 0.00
7 PT 90 0.00 0.87 0.13 0.00 0.00 0.00 0.00 0.00 0.00 0.00 0.00
8 PT 94 0.38 0.51 0.11 0.00 0.00 0.00 0.00 0.00 0.00 0.00 0.00
11 PT 92 0.33 0.67 0.00 0.00 0.00 0.00 0.00 0.00 0.00 0.00 0.00
Blueprint Fidelity
A key design document of the summative assessments is the test blueprint, which specifies the
number and nature of items to be administered. A blueprint fidelity study was conducted using the
operational data from the 2015-2016 summative administration.
The analyses were done for both ELA/literacy and mathematics and in all the tested grade levels (3-
8 and high school). At each grade level, three ELA/literacy item pools were evaluated: the General
pool, the Braille pool, and the American Sign Language (ASL) pool. For mathematics five pools were
evaluated: the General pool, the Braille pool, the ASL pool, the Spanish pool, and the Translated
Glossaries pool. Only operational items from the computerized adaptive test (CAT) component were
considered in this study; field test items and performance task (PT) component items were not
included.
Overall, the adaptive operational tests fulfilled the blueprint requirements well. That is, nearly 99% of
the test instances met most of the operational blueprint requirements. However, there were a few
target group specifications for Math grades 3, 6, and 11 where the number of items was above the
maximum or below the minimum number of required items. In particular, both grade 6 and 11
simultaneously showed test instances that exceeded the maximum in one target and fell short of the
minimum requirement in another target group. This might suggest that the surplus and the shortage
of items in some target groups is rather systematic, which requires further investigation of the adaptive
algorithms. We also note that the number of Braille tests administered was quite small. For those
grades where there were no test instances, rates of fulfillments were not provided. Further details of
the analysis procedures and results can be found in a separate report (CRESST, 2016).
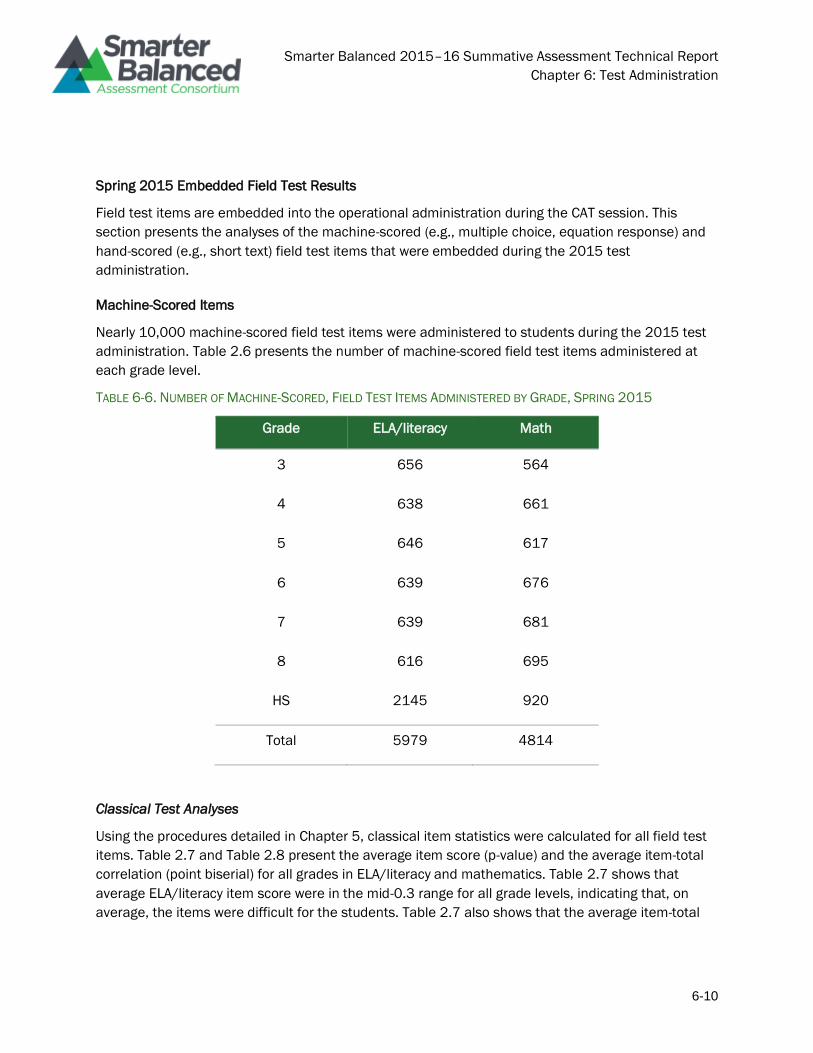
Smarter Balanced 2015–16 Summative Assessment Technical Report
Chapter 6: Test Administration
6-10
Spring 2015 Embedded Field Test Results
Field test items are embedded into the operational administration during the CAT session. This
section presents the analyses of the machine-scored (e.g., multiple choice, equation response) and
hand-scored (e.g., short text) field test items that were embedded during the 2015 test
administration.
Machine-Scored Items
Nearly 10,000 machine-scored field test items were administered to students during the 2015 test
administration. Table 2.6 presents the number of machine-scored field test items administered at
each grade level.
TABLE 6-6. NUMBER OF MACHINE-SCORED, FIELD TEST ITEMS ADMINISTERED BY GRADE, SPRING 2015
Grade ELA/literacy Math
3 656 564
4 638 661
5 646 617
6 639 676
7 639 681
8 616 695
HS 2145 920
Total 5979 4814
Classical Test Analyses
Using the procedures detailed in Chapter 5, classical item statistics were calculated for all field test
items. Table 2.7 and Table 2.8 present the average item score (p-value) and the average item-total
correlation (point biserial) for all grades in ELA/literacy and mathematics. Table 2.7 shows that
average ELA/literacy item score were in the mid-0.3 range for all grade levels, indicating that, on
average, the items were difficult for the students. Table 2.7 also shows that the average item-total
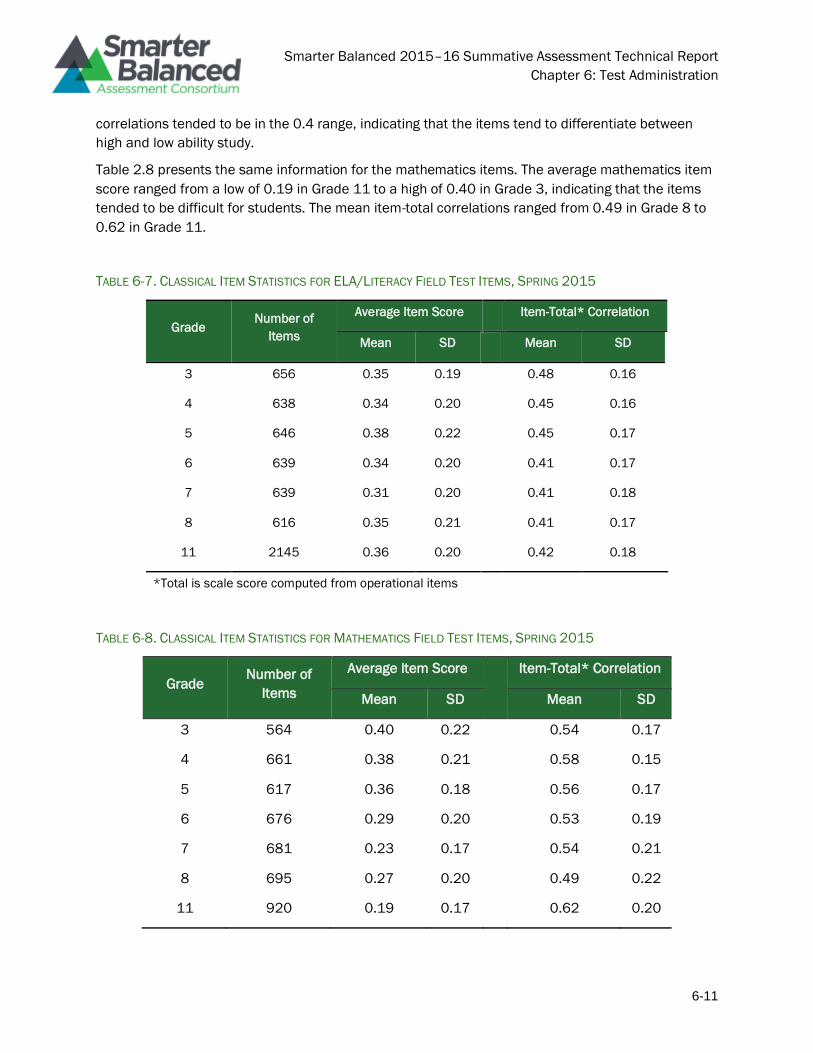
Smarter Balanced 2015–16 Summative Assessment Technical Report
Chapter 6: Test Administration
6-11
correlations tended to be in the 0.4 range, indicating that the items tend to differentiate between
high and low ability study.
Table 2.8 presents the same information for the mathematics items. The average mathematics item
score ranged from a low of 0.19 in Grade 11 to a high of 0.40 in Grade 3, indicating that the items
tended to be difficult for students. The mean item-total correlations ranged from 0.49 in Grade 8 to
0.62 in Grade 11.
TABLE 6-7. CLASSICAL ITEM STATISTICS FOR ELA/LITERACY FIELD TEST ITEMS, SPRING 2015
Grade Number of
Items
Average Item Score Item-Total* Correlation
Mean SD Mean SD
3 656 0.35 0.19 0.48 0.16
4 638 0.34 0.20 0.45 0.16
5 646 0.38 0.22 0.45 0.17
6 639 0.34 0.20 0.41 0.17
7 639 0.31 0.20 0.41 0.18
8 616 0.35 0.21 0.41 0.17
11 2145 0.36 0.20 0.42 0.18
*Total is scale score computed from operational items
TABLE 6-8. CLASSICAL ITEM STATISTICS FOR MATHEMATICS FIELD TEST ITEMS, SPRING 2015
Grade Number of
Items
Average Item Score
Item-Total* Correlation
Mean SD Mean SD
3 564 0.40 0.22 0.54 0.17
4 661 0.38 0.21 0.58 0.15
5 617 0.36 0.18 0.56 0.17
6 676 0.29 0.20 0.53 0.19
7 681 0.23 0.17 0.54 0.21
8 695 0.27 0.20 0.49 0.22
11 920 0.19 0.17 0.62 0.20
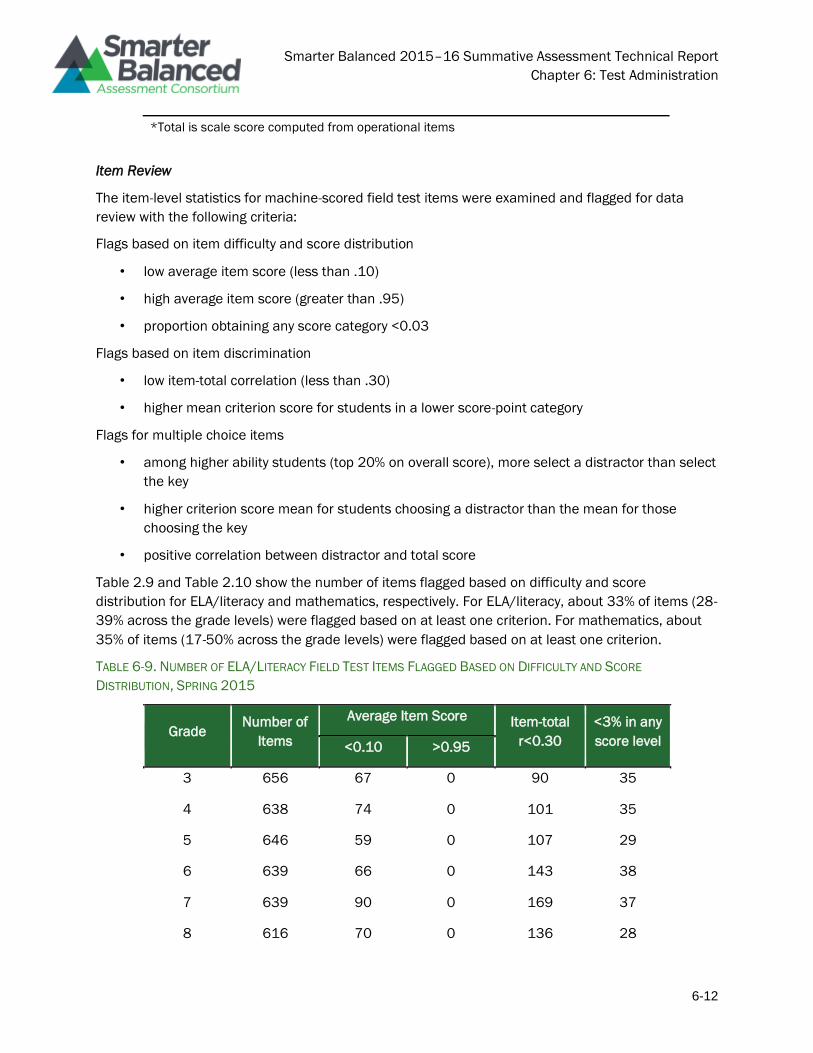
Smarter Balanced 2015–16 Summative Assessment Technical Report
Chapter 6: Test Administration
6-12
*Total is scale score computed from operational items
Item Review
The item-level statistics for machine-scored field test items were examined and flagged for data
review with the following criteria:
Flags based on item difficulty and score distribution
• low average item score (less than .10)
• high average item score (greater than .95)
• proportion obtaining any score category <0.03
Flags based on item discrimination
• low item-total correlation (less than .30)
• higher mean criterion score for students in a lower score-point category
Flags for multiple choice items
• among higher ability students (top 20% on overall score), more select a distractor than select
the key
• higher criterion score mean for students choosing a distractor than the mean for those
choosing the key
• positive correlation between distractor and total score
Table 2.9 and Table 2.10 show the number of items flagged based on difficulty and score
distribution for ELA/literacy and mathematics, respectively. For ELA/literacy, about 33% of items (28-
39% across the grade levels) were flagged based on at least one criterion. For mathematics, about
35% of items (17-50% across the grade levels) were flagged based on at least one criterion.
TABLE 6-9. NUMBER OF ELA/LITERACY FIELD TEST ITEMS FLAGGED BASED ON DIFFICULTY AND SCORE
DISTRIBUTION, SPRING 2015
Grade Number of
Items
Average Item Score Item-total
r<0.30
<3% in any
score level <0.10 >0.95
3 656 67 0 90 35
4 638 74 0 101 35
5 646 59 0 107 29
6 639 66 0 143 38
7 639 90 0 169 37
8 616 70 0 136 28
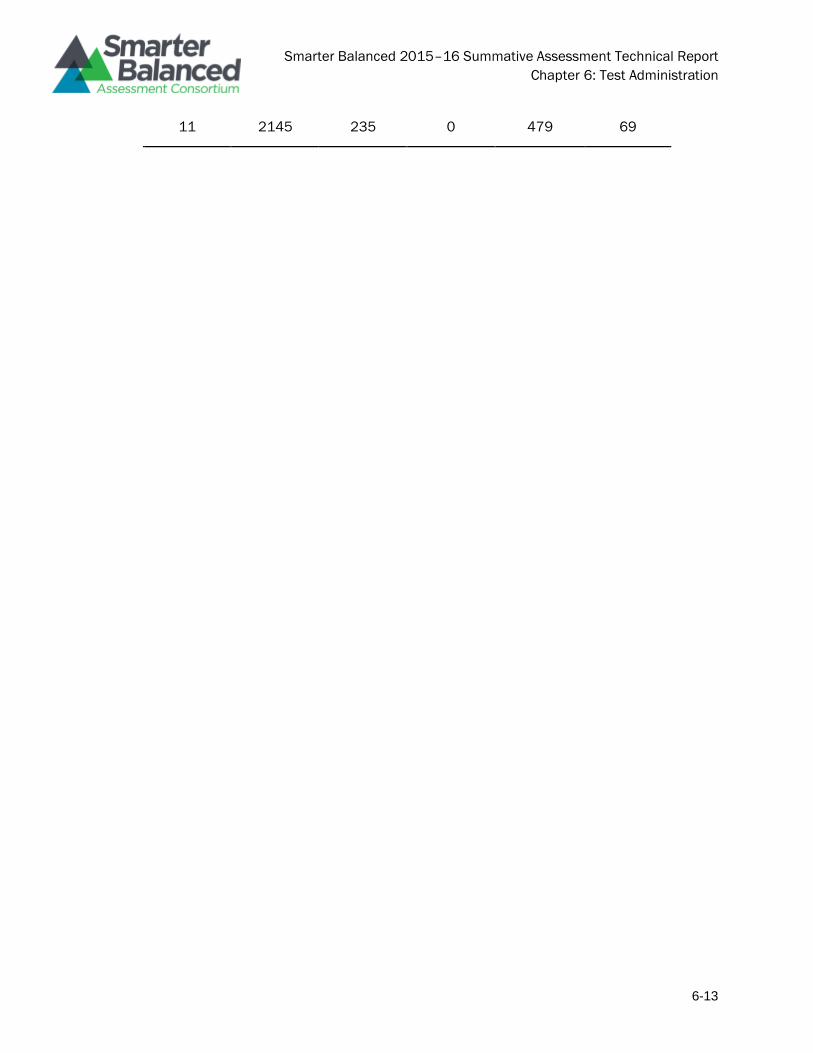
Smarter Balanced 2015–16 Summative Assessment Technical Report
Chapter 6: Test Administration
6-13
11 2145 235 0 479 69
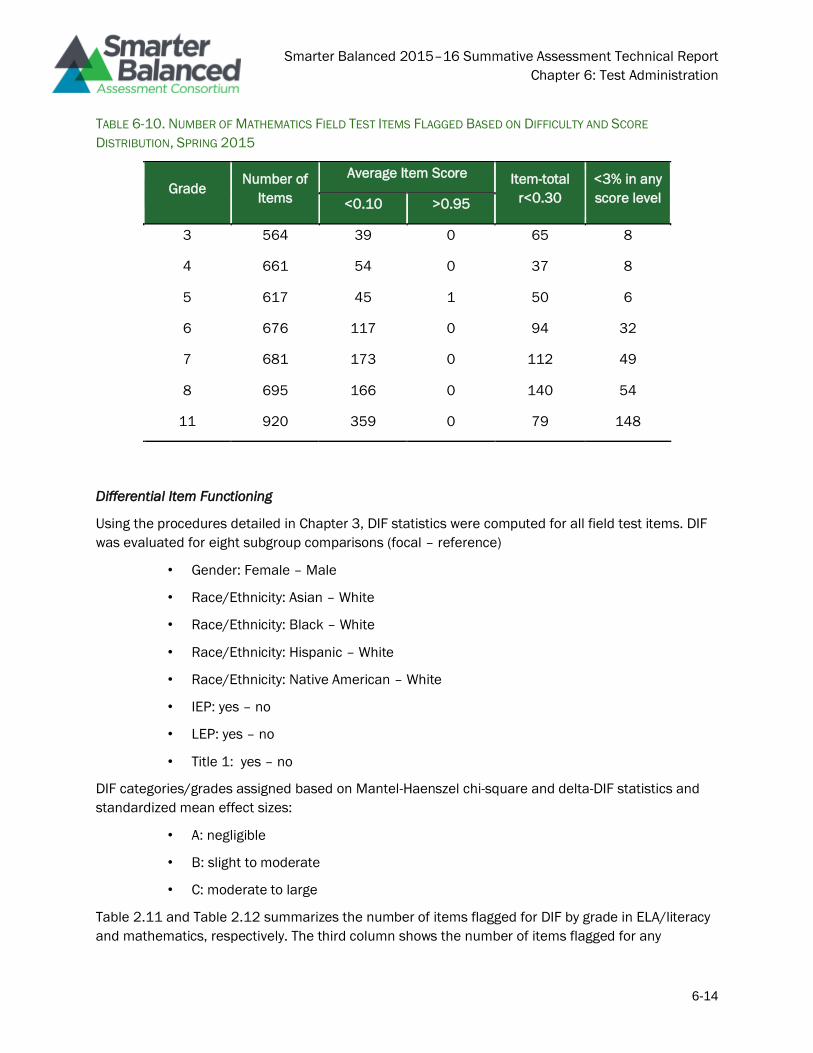
Smarter Balanced 2015–16 Summative Assessment Technical Report
Chapter 6: Test Administration
6-14
TABLE 6-10. NUMBER OF MATHEMATICS FIELD TEST ITEMS FLAGGED BASED ON DIFFICULTY AND SCORE
DISTRIBUTION, SPRING 2015
Grade Number of
Items
Average Item Score Item-total
r<0.30
<3% in any
score level <0.10 >0.95
3 564 39 0 65 8
4 661 54 0 37 8
5 617 45 1 50 6
6 676 117 0 94 32
7 681 173 0 112 49
8 695 166 0 140 54
11 920 359 0 79 148
Differential Item Functioning
Using the procedures detailed in Chapter 3, DIF statistics were computed for all field test items. DIF
was evaluated for eight subgroup comparisons (focal – reference)
• Gender: Female – Male
• Race/Ethnicity: Asian – White
• Race/Ethnicity: Black – White
• Race/Ethnicity: Hispanic – White
• Race/Ethnicity: Native American – White
• IEP: yes – no
• LEP: yes – no
• Title 1: yes – no
DIF categories/grades assigned based on Mantel-Haenszel chi-square and delta-DIF statistics and
standardized mean effect sizes:
• A: negligible
• B: slight to moderate
• C: moderate to large
Table 2.11 and Table 2.12 summarizes the number of items flagged for DIF by grade in ELA/literacy
and mathematics, respectively. The third column shows the number of items flagged for any
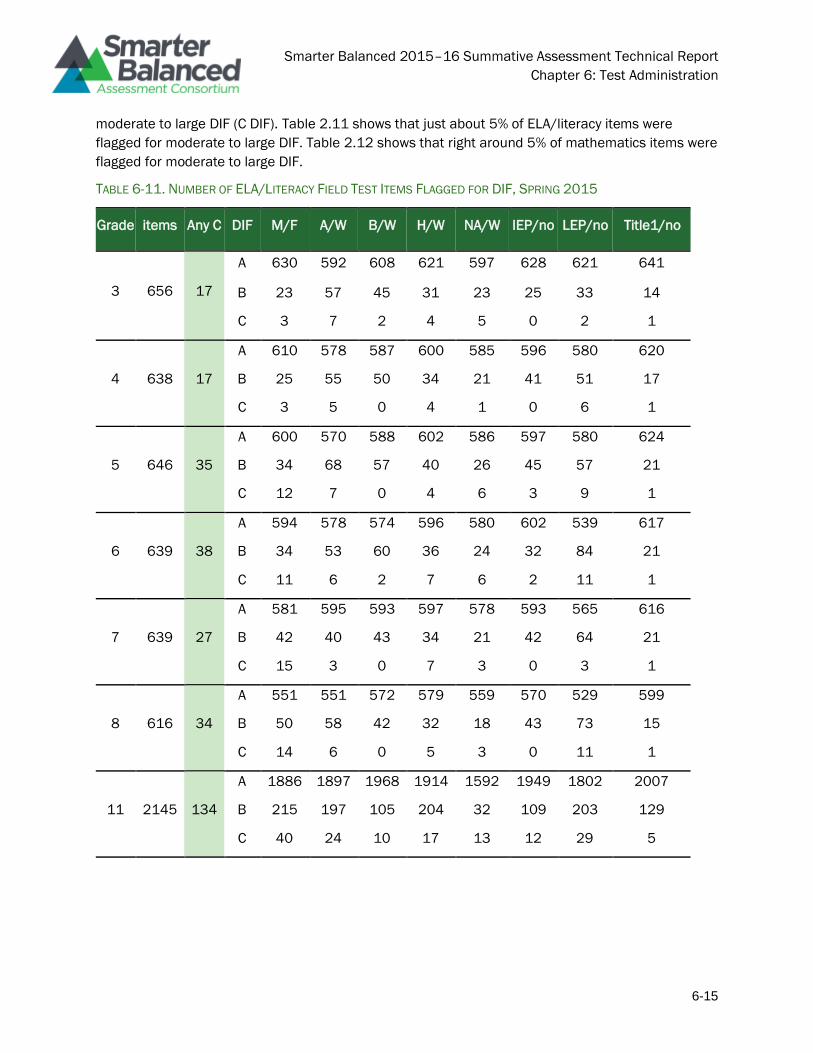
Smarter Balanced 2015–16 Summative Assessment Technical Report
Chapter 6: Test Administration
6-15
moderate to large DIF (C DIF). Table 2.11 shows that just about 5% of ELA/literacy items were
flagged for moderate to large DIF. Table 2.12 shows that right around 5% of mathematics items were
flagged for moderate to large DIF.
TABLE 6-11. NUMBER OF ELA/LITERACY FIELD TEST ITEMS FLAGGED FOR DIF, SPRING 2015
Grade items Any C DIF M/F A/W B/W H/W NA/W IEP/no LEP/no Title1/no
3 656 17
A 630 592 608 621 597 628 621 641
B 23 57 45 31 23 25 33 14
C 3 7 2 4 5 0 2 1
4 638 17
A 610 578 587 600 585 596 580 620
B 25 55 50 34 21 41 51 17
C 3 5 0 4 1 0 6 1
5 646 35
A 600 570 588 602 586 597 580 624
B 34 68 57 40 26 45 57 21
C 12 7 0 4 6 3 9 1
6 639 38
A 594 578 574 596 580 602 539 617
B 34 53 60 36 24 32 84 21
C 11 6 2 7 6 2 11 1
7 639 27
A 581 595 593 597 578 593 565 616
B 42 40 43 34 21 42 64 21
C 15 3 0 7 3 0 3 1
8 616 34
A 551 551 572 579 559 570 529 599
B 50 58 42 32 18 43 73 15
C 14 6 0 5 3 0 11 1
11 2145 134
A 1886 1897 1968 1914 1592 1949 1802 2007
B 215 197 105 204 32 109 203 129
C 40 24 10 17 13 12 29 5
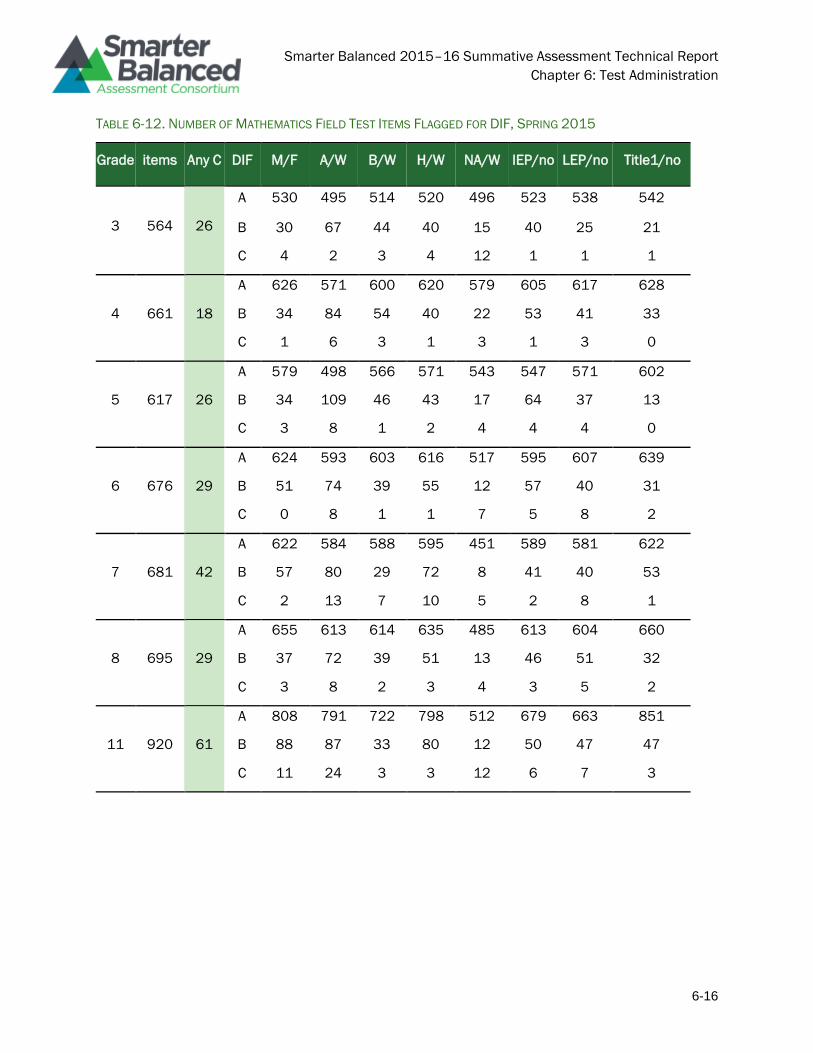
Smarter Balanced 2015–16 Summative Assessment Technical Report
Chapter 6: Test Administration
6-16
TABLE 6-12. NUMBER OF MATHEMATICS FIELD TEST ITEMS FLAGGED FOR DIF, SPRING 2015
Grade items Any C DIF M/F A/W B/W H/W NA/W IEP/no LEP/no Title1/no
3 564 26
A 530 495 514 520 496 523 538 542
B 30 67 44 40 15 40 25 21
C 4 2 3 4 12 1 1 1
4 661 18
A 626 571 600 620 579 605 617 628
B 34 84 54 40 22 53 41 33
C 1 6 3 1 3 1 3 0
5 617 26
A 579 498 566 571 543 547 571 602
B 34 109 46 43 17 64 37 13
C 3 8 1 2 4 4 4 0
6 676 29
A 624 593 603 616 517 595 607 639
B 51 74 39 55 12 57 40 31
C 0 8 1 1 7 5 8 2
7 681 42
A 622 584 588 595 451 589 581 622
B 57 80 29 72 8 41 40 53
C 2 13 7 10 5 2 8 1
8 695 29
A 655 613 614 635 485 613 604 660
B 37 72 39 51 13 46 51 32
C 3 8 2 3 4 3 5 2
11 920 61
A 808 791 722 798 512 679 663 851
B 88 87 33 80 12 50 47 47
C 11 24 3 3 12 6 7 3
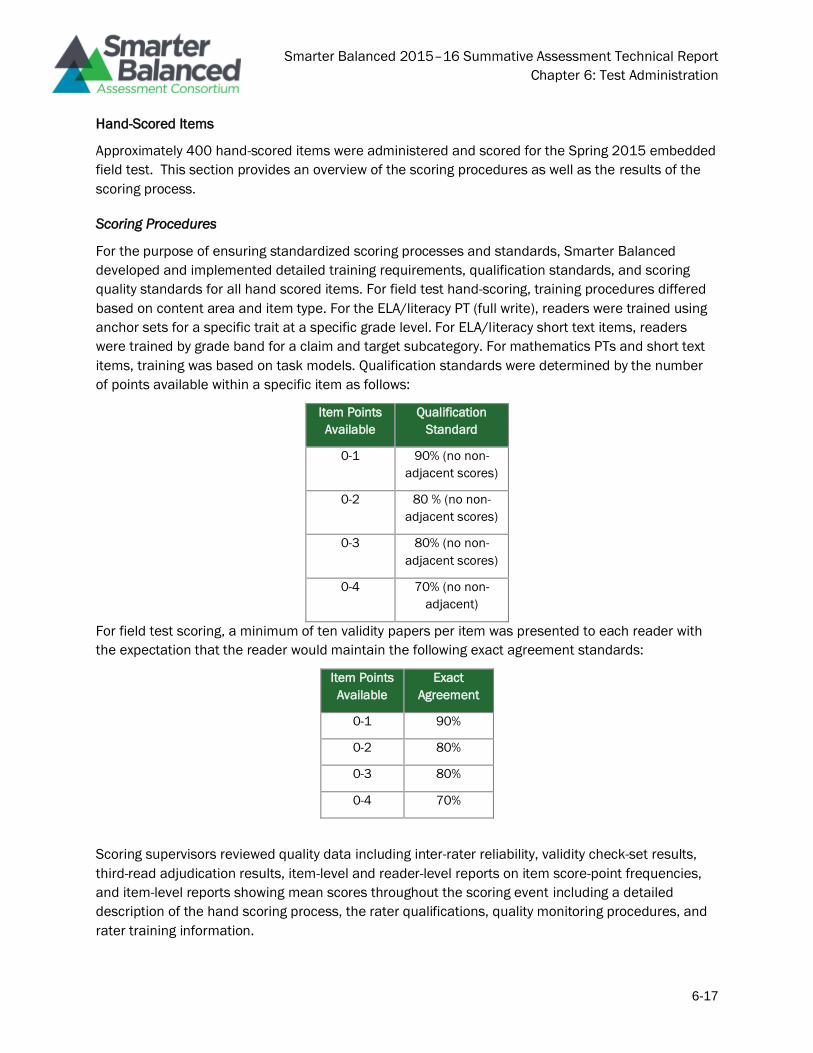
Smarter Balanced 2015–16 Summative Assessment Technical Report
Chapter 6: Test Administration
6-17
Hand-Scored Items
Approximately 400 hand-scored items were administered and scored for the Spring 2015 embedded
field test. This section provides an overview of the scoring procedures as well as the results of the
scoring process.
Scoring Procedures
For the purpose of ensuring standardized scoring processes and standards, Smarter Balanced
developed and implemented detailed training requirements, qualification standards, and scoring
quality standards for all hand scored items. For field test hand-scoring, training procedures differed
based on content area and item type. For the ELA/literacy PT (full write), readers were trained using
anchor sets for a specific trait at a specific grade level. For ELA/literacy short text items, readers
were trained by grade band for a claim and target subcategory. For mathematics PTs and short text
items, training was based on task models. Qualification standards were determined by the number
of points available within a specific item as follows:
Item Points
Available
Qualification
Standard
0-1 90% (no non-
adjacent scores)
0-2 80 % (no non-
adjacent scores)
0-3 80% (no non-
adjacent scores)
0-4 70% (no non-
adjacent)
For field test scoring, a minimum of ten validity papers per item was presented to each reader with
the expectation that the reader would maintain the following exact agreement standards:
Item Points
Available
Exact
Agreement
0-1 90%
0-2 80%
0-3 80%
0-4 70%
Scoring supervisors reviewed quality data including inter-rater reliability, validity check-set results,
third-read adjudication results, item-level and reader-level reports on item score-point frequencies,
and item-level reports showing mean scores throughout the scoring event including a detailed
description of the hand scoring process, the rater qualifications, quality monitoring procedures, and
rater training information.
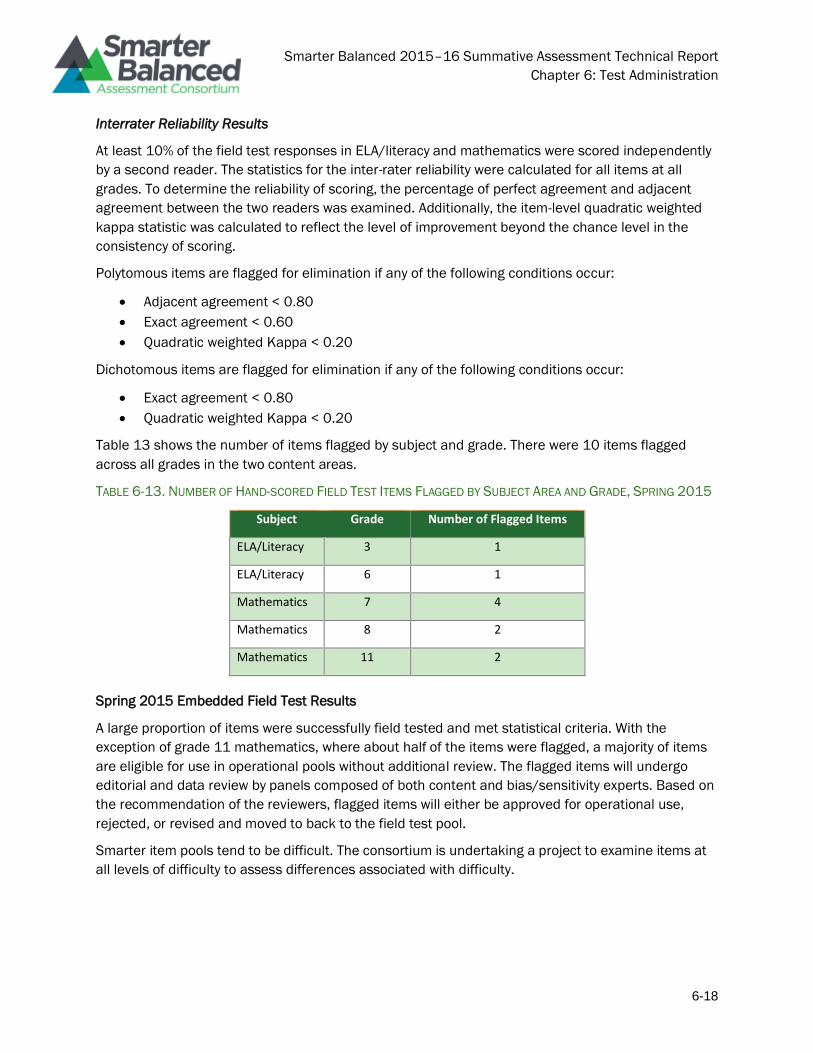
Smarter Balanced 2015–16 Summative Assessment Technical Report
Chapter 6: Test Administration
6-18
Interrater Reliability Results
At least 10% of the field test responses in ELA/literacy and mathematics were scored independently
by a second reader. The statistics for the inter-rater reliability were calculated for all items at all
grades. To determine the reliability of scoring, the percentage of perfect agreement and adjacent
agreement between the two readers was examined. Additionally, the item-level quadratic weighted
kappa statistic was calculated to reflect the level of improvement beyond the chance level in the
consistency of scoring.
Polytomous items are flagged for elimination if any of the following conditions occur:
• Adjacent agreement < 0.80
• Exact agreement < 0.60
• Quadratic weighted Kappa < 0.20
Dichotomous items are flagged for elimination if any of the following conditions occur:
• Exact agreement < 0.80
• Quadratic weighted Kappa < 0.20
Table 13 shows the number of items flagged by subject and grade. There were 10 items flagged
across all grades in the two content areas.
TABLE 6-13. NUMBER OF HAND-SCORED FIELD TEST ITEMS FLAGGED BY SUBJECT AREA AND GRADE, SPRING 2015
Subject Grade Number of Flagged Items
ELA/Literacy 3 1
ELA/Literacy 6 1
Mathematics 7 4
Mathematics 8 2
Mathematics 11 2
Spring 2015 Embedded Field Test Results
A large proportion of items were successfully field tested and met statistical criteria. With the
exception of grade 11 mathematics, where about half of the items were flagged, a majority of items
are eligible for use in operational pools without additional review. The flagged items will undergo
editorial and data review by panels composed of both content and bias/sensitivity experts. Based on
the recommendation of the reviewers, flagged items will either be approved for operational use,
rejected, or revised and moved to back to the field test pool.
Smarter item pools tend to be difficult. The consortium is undertaking a project to examine items at
all levels of difficulty to assess differences associated with difficulty.
Smarter Balanced 2015–16 Summative Assessment Technical Report
Chapter 6: Test Administration
6-19
References
American Educational Research Association, American Psychological Association, & National Council
on Measurement in Education. (2014). Standards for educational and psychological testing.
Washington, DC: American Educational Research Association.
National Center for Research on Evaluation, Standards, & Student Testing. (June 2016). Blueprint
Fidelity . Los Angeles, CA: Author.
Smarter Balanced Assessment Consortium. (2014c, August 25). Online, summative, test
administration manual: Test of English language arts/literacy and mathematics. Los
Angeles, CA: Author.
Smarter Balanced Assessment Consortium. (2014e, November 5). Usability, Accessibility, and
Accommodations Guidelines. Los Angeles, CA: Author.
Smarter Balanced Assessment Consortium. (2014g, December). English language arts summative
assessment: Paper-pencil test administration manual. Los Angeles, CA: Author.
Smarter Balanced Assessment Consortium. (2014h, December). Mathematics summative
assessment: Paper-pencil test administration manual. Los Angeles, CA: Author.
Smarter Balanced Assessment Consortium. (2014i). Test administrator user guide. Los Angeles, CA:
Author.
Smarter Balanced 2015–16 Summative Assessment Technical Report
Chapter 7: Reporting and Interpretation
7-1
Chapter 7: Reporting and
Interpretation
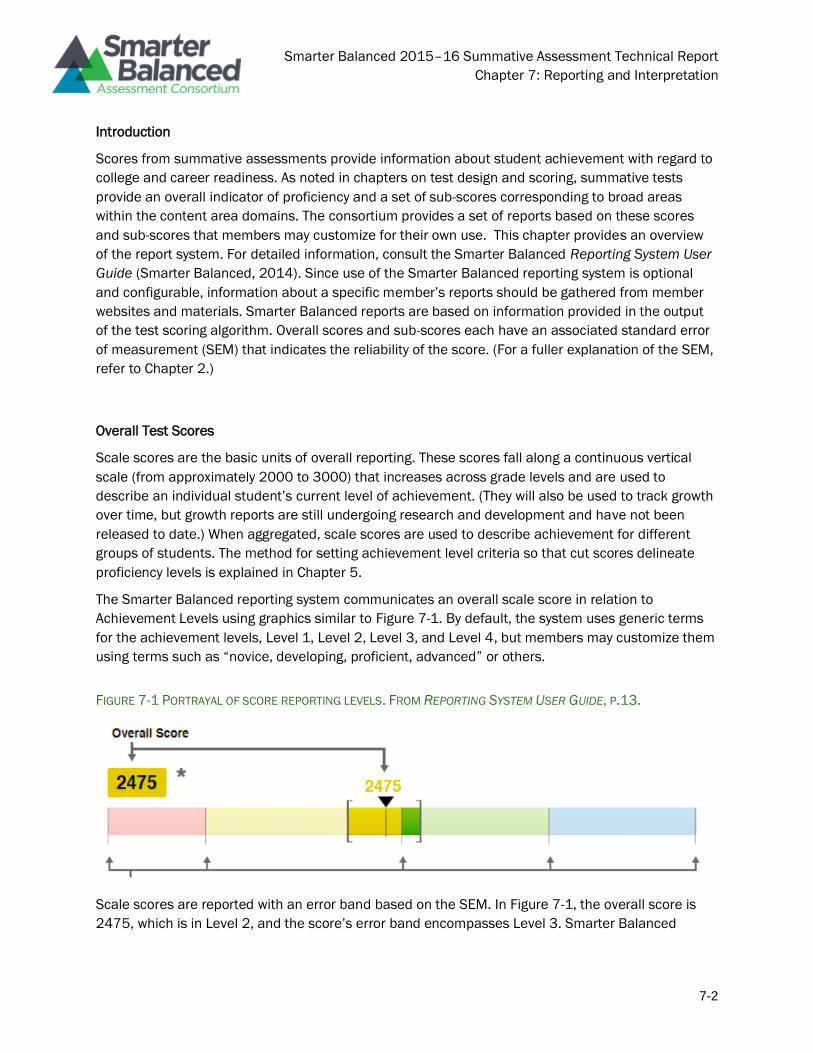
Smarter Balanced 2015–16 Summative Assessment Technical Report
Chapter 7: Reporting and Interpretation
7-2
Introduction
Scores from summative assessments provide information about student achievement with regard to
college and career readiness. As noted in chapters on test design and scoring, summative tests
provide an overall indicator of proficiency and a set of sub-scores corresponding to broad areas
within the content area domains. The consortium provides a set of reports based on these scores
and sub-scores that members may customize for their own use. This chapter provides an overview
of the report system. For detailed information, consult the Smarter Balanced Reporting System User
Guide (Smarter Balanced, 2014). Since use of the Smarter Balanced reporting system is optional
and configurable, information about a specific member’s reports should be gathered from member
websites and materials. Smarter Balanced reports are based on information provided in the output
of the test scoring algorithm. Overall scores and sub-scores each have an associated standard error
of measurement (SEM) that indicates the reliability of the score. (For a fuller explanation of the SEM,
refer to Chapter 2.)
Overall Test Scores
Scale scores are the basic units of overall reporting. These scores fall along a continuous vertical
scale (from approximately 2000 to 3000) that increases across grade levels and are used to
describe an individual student’s current level of achievement. (They will also be used to track growth
over time, but growth reports are still undergoing research and development and have not been
released to date.) When aggregated, scale scores are used to describe achievement for different
groups of students. The method for setting achievement level criteria so that cut scores delineate
proficiency levels is explained in Chapter 5.
The Smarter Balanced reporting system communicates an overall scale score in relation to
Achievement Levels using graphics similar to Figure 7-1. By default, the system uses generic terms
for the achievement levels, Level 1, Level 2, Level 3, and Level 4, but members may customize them
using terms such as “novice, developing, proficient, advanced” or others.
FIGURE 7-1 PORTRAYAL OF SCORE REPORTING LEVELS. FROM REPORTING SYSTEM USER GUIDE, P.13.
Scale scores are reported with an error band based on the SEM. In Figure 7-1, the overall score is
2475, which is in Level 2, and the score’s error band encompasses Level 3. Smarter Balanced
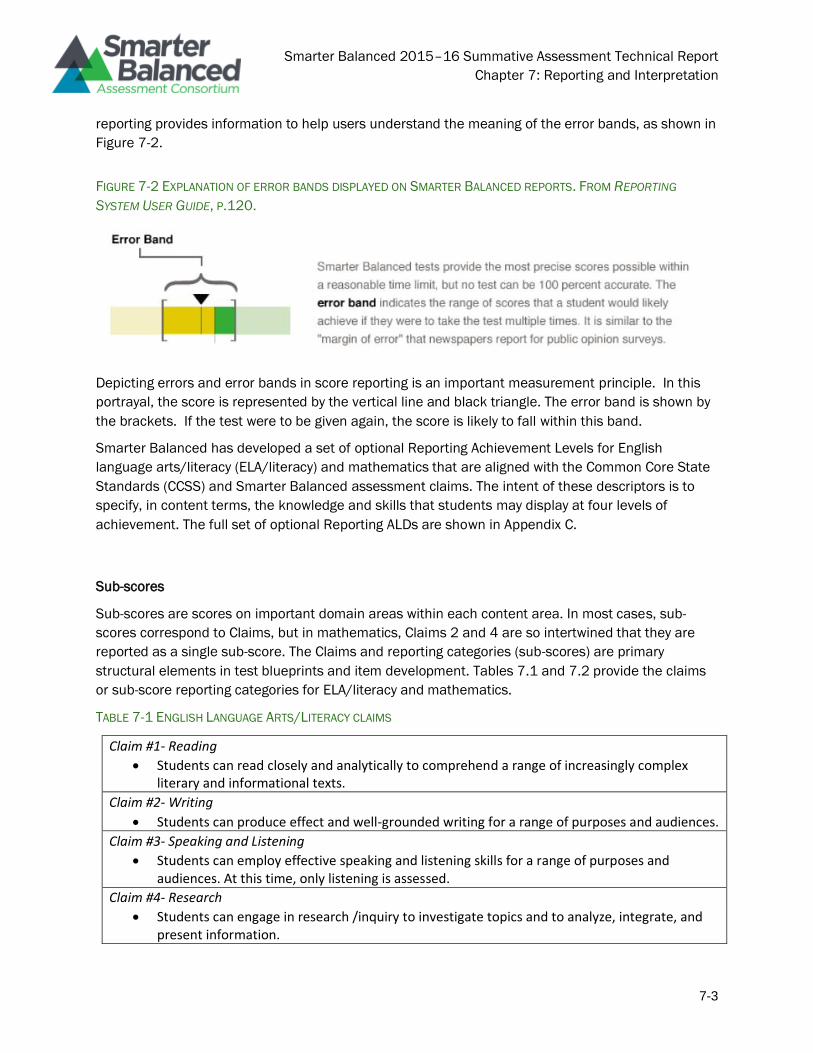
Smarter Balanced 2015–16 Summative Assessment Technical Report
Chapter 7: Reporting and Interpretation
7-3
reporting provides information to help users understand the meaning of the error bands, as shown in
Figure 7-2.
FIGURE 7-2 EXPLANATION OF ERROR BANDS DISPLAYED ON SMARTER BALANCED REPORTS. FROM REPORTING
SYSTEM USER GUIDE, P.120.
Depicting errors and error bands in score reporting is an important measurement principle. In this
portrayal, the score is represented by the vertical line and black triangle. The error band is shown by
the brackets. If the test were to be given again, the score is likely to fall within this band.
Smarter Balanced has developed a set of optional Reporting Achievement Levels for English
language arts/literacy (ELA/literacy) and mathematics that are aligned with the Common Core State
Standards (CCSS) and Smarter Balanced assessment claims. The intent of these descriptors is to
specify, in content terms, the knowledge and skills that students may display at four levels of
achievement. The full set of optional Reporting ALDs are shown in Appendix C.
Sub-scores
Sub-scores are scores on important domain areas within each content area. In most cases, sub-
scores correspond to Claims, but in mathematics, Claims 2 and 4 are so intertwined that they are
reported as a single sub-score. The Claims and reporting categories (sub-scores) are primary
structural elements in test blueprints and item development. Tables 7.1 and 7.2 provide the claims
or sub-score reporting categories for ELA/literacy and mathematics.
TABLE 7-1 ENGLISH LANGUAGE ARTS/LITERACY CLAIMS
Claim #1- Reading
• Students can read closely and analytically to comprehend a range of increasingly complex literary and informational texts.
Claim #2- Writing
• Students can produce effect and well-grounded writing for a range of purposes and audiences.
Claim #3- Speaking and Listening
• Students can employ effective speaking and listening skills for a range of purposes and audiences. At this time, only listening is assessed.
Claim #4- Research
• Students can engage in research /inquiry to investigate topics and to analyze, integrate, and present information.
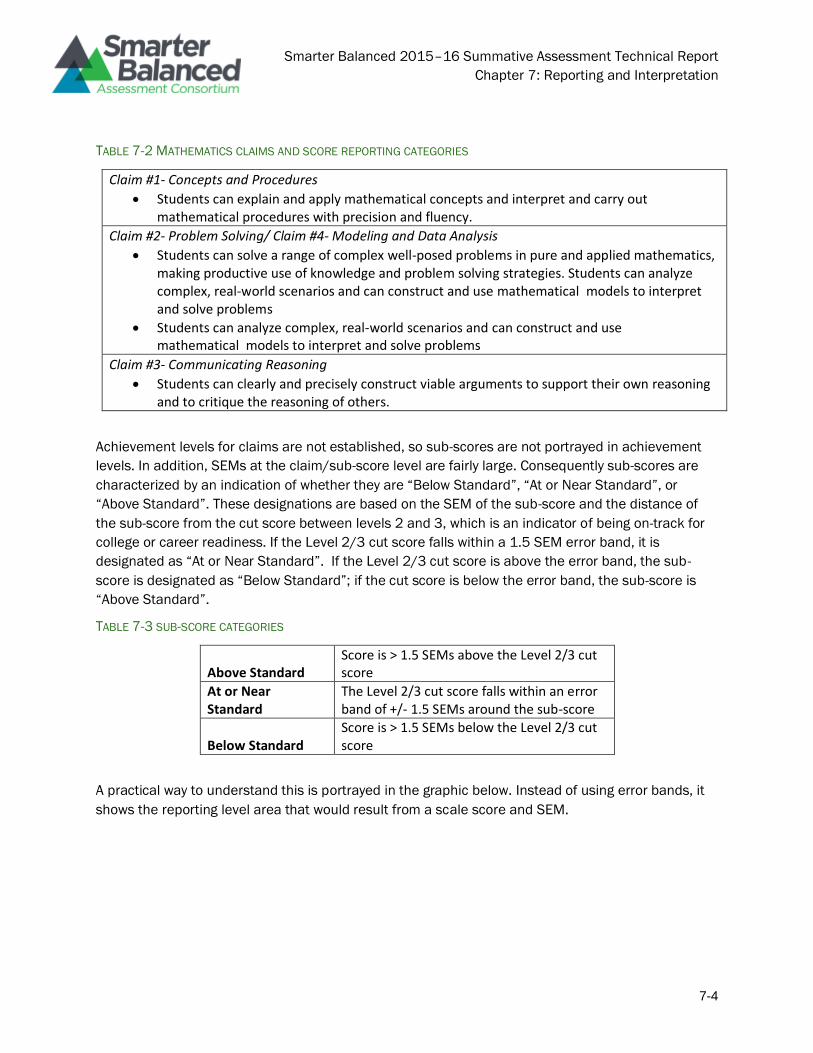
Smarter Balanced 2015–16 Summative Assessment Technical Report
Chapter 7: Reporting and Interpretation
7-4
TABLE 7-2 MATHEMATICS CLAIMS AND SCORE REPORTING CATEGORIES
Claim #1- Concepts and Procedures
• Students can explain and apply mathematical concepts and interpret and carry out mathematical procedures with precision and fluency.
Claim #2- Problem Solving/ Claim #4- Modeling and Data Analysis
• Students can solve a range of complex well-posed problems in pure and applied mathematics, making productive use of knowledge and problem solving strategies. Students can analyze complex, real-world scenarios and can construct and use mathematical models to interpret and solve problems
• Students can analyze complex, real-world scenarios and can construct and use mathematical models to interpret and solve problems
Claim #3- Communicating Reasoning
• Students can clearly and precisely construct viable arguments to support their own reasoning and to critique the reasoning of others.
Achievement levels for claims are not established, so sub-scores are not portrayed in achievement
levels. In addition, SEMs at the claim/sub-score level are fairly large. Consequently sub-scores are
characterized by an indication of whether they are “Below Standard”, “At or Near Standard”, or
“Above Standard”. These designations are based on the SEM of the sub-score and the distance of
the sub-score from the cut score between levels 2 and 3, which is an indicator of being on-track for
college or career readiness. If the Level 2/3 cut score falls within a 1.5 SEM error band, it is
designated as “At or Near Standard”. If the Level 2/3 cut score is above the error band, the sub-
score is designated as “Below Standard”; if the cut score is below the error band, the sub-score is
“Above Standard”.
TABLE 7-3 SUB-SCORE CATEGORIES
Above Standard Score is > 1.5 SEMs above the Level 2/3 cut score
At or Near Standard
The Level 2/3 cut score falls within an error band of +/- 1.5 SEMs around the sub-score
Below Standard Score is > 1.5 SEMs below the Level 2/3 cut score
A practical way to understand this is portrayed in the graphic below. Instead of using error bands, it
shows the reporting level area that would result from a scale score and SEM.
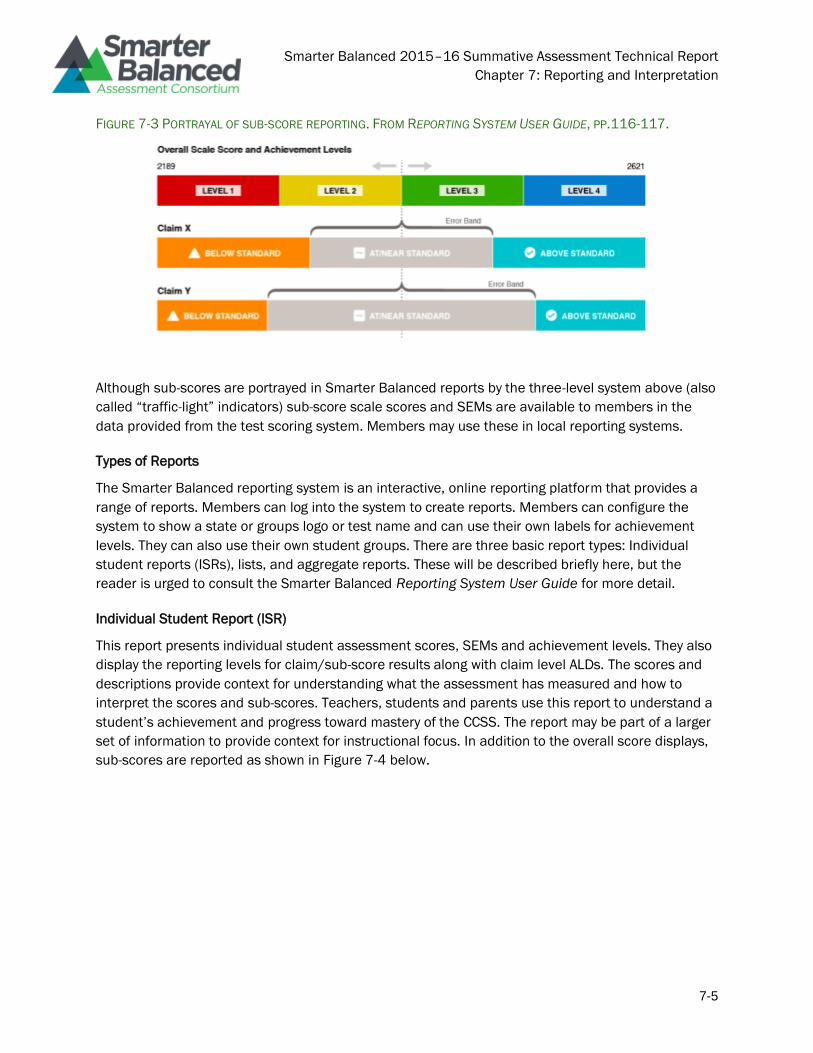
Smarter Balanced 2015–16 Summative Assessment Technical Report
Chapter 7: Reporting and Interpretation
7-5
FIGURE 7-3 PORTRAYAL OF SUB-SCORE REPORTING. FROM REPORTING SYSTEM USER GUIDE, PP.116-117.
Although sub-scores are portrayed in Smarter Balanced reports by the three-level system above (also
called “traffic-light” indicators) sub-score scale scores and SEMs are available to members in the
data provided from the test scoring system. Members may use these in local reporting systems.
Types of Reports
The Smarter Balanced reporting system is an interactive, online reporting platform that provides a
range of reports. Members can log into the system to create reports. Members can configure the
system to show a state or groups logo or test name and can use their own labels for achievement
levels. They can also use their own student groups. There are three basic report types: Individual
student reports (ISRs), lists, and aggregate reports. These will be described briefly here, but the
reader is urged to consult the Smarter Balanced Reporting System User Guide for more detail.
Individual Student Report (ISR)
This report presents individual student assessment scores, SEMs and achievement levels. They also
display the reporting levels for claim/sub-score results along with claim level ALDs. The scores and
descriptions provide context for understanding what the assessment has measured and how to
interpret the scores and sub-scores. Teachers, students and parents use this report to understand a
student’s achievement and progress toward mastery of the CCSS. The report may be part of a larger
set of information to provide context for instructional focus. In addition to the overall score displays,
sub-scores are reported as shown in Figure 7-4 below.
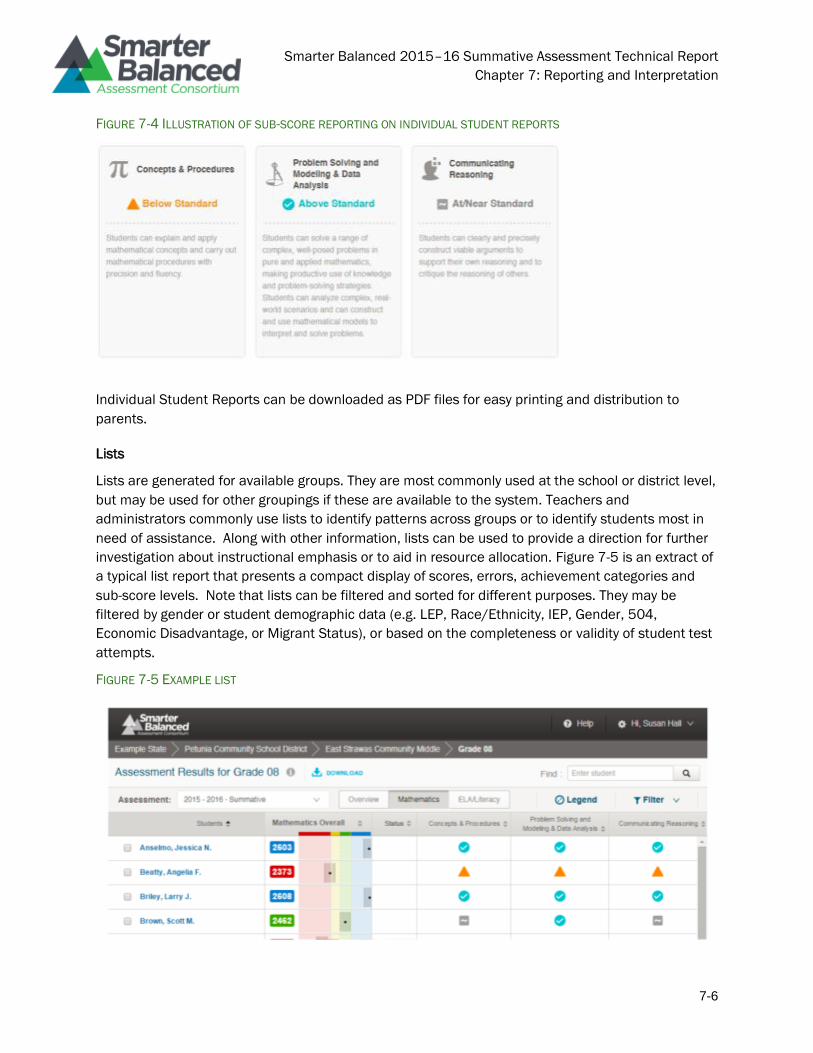
Smarter Balanced 2015–16 Summative Assessment Technical Report
Chapter 7: Reporting and Interpretation
7-6
FIGURE 7-4 ILLUSTRATION OF SUB-SCORE REPORTING ON INDIVIDUAL STUDENT REPORTS
Individual Student Reports can be downloaded as PDF files for easy printing and distribution to
parents.
Lists
Lists are generated for available groups. They are most commonly used at the school or district level,
but may be used for other groupings if these are available to the system. Teachers and
administrators commonly use lists to identify patterns across groups or to identify students most in
need of assistance. Along with other information, lists can be used to provide a direction for further
investigation about instructional emphasis or to aid in resource allocation. Figure 7-5 is an extract of
a typical list report that presents a compact display of scores, errors, achievement categories and
sub-score levels. Note that lists can be filtered and sorted for different purposes. They may be
filtered by gender or student demographic data (e.g. LEP, Race/Ethnicity, IEP, Gender, 504,
Economic Disadvantage, or Migrant Status), or based on the completeness or validity of student test
attempts.
FIGURE 7-5 EXAMPLE LIST
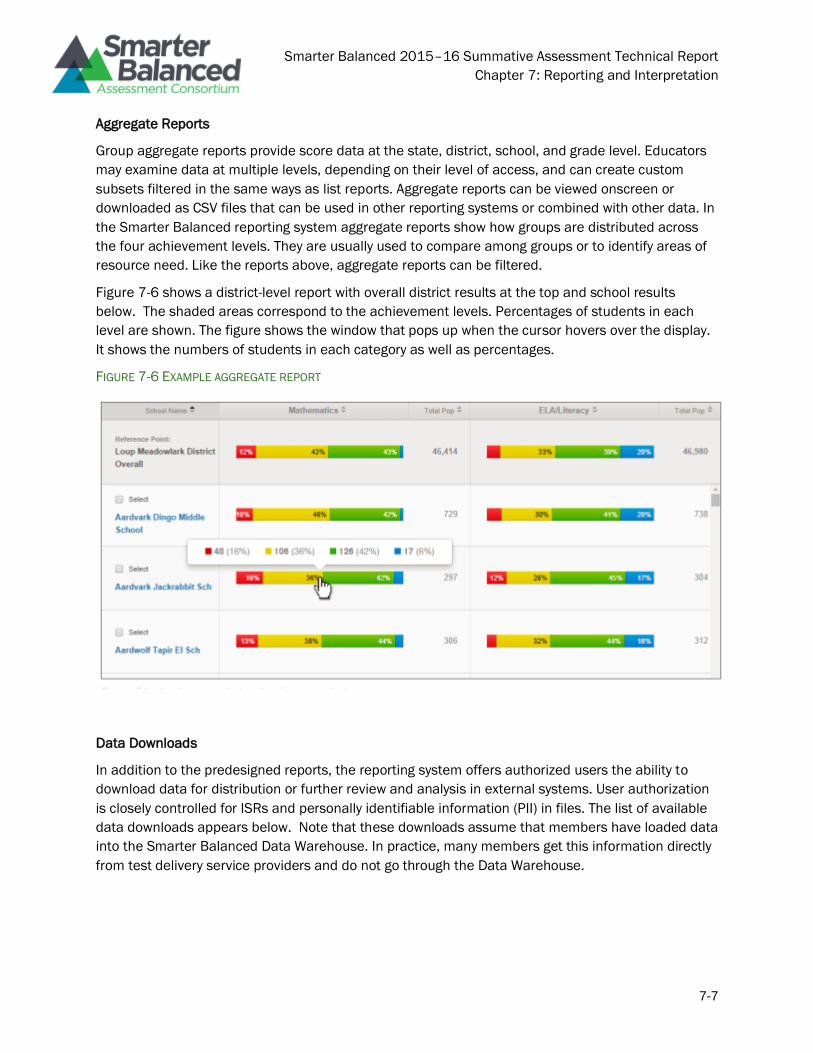
Smarter Balanced 2015–16 Summative Assessment Technical Report
Chapter 7: Reporting and Interpretation
7-7
Aggregate Reports
Group aggregate reports provide score data at the state, district, school, and grade level. Educators
may examine data at multiple levels, depending on their level of access, and can create custom
subsets filtered in the same ways as list reports. Aggregate reports can be viewed onscreen or
downloaded as CSV files that can be used in other reporting systems or combined with other data. In
the Smarter Balanced reporting system aggregate reports show how groups are distributed across
the four achievement levels. They are usually used to compare among groups or to identify areas of
resource need. Like the reports above, aggregate reports can be filtered.
Figure 7-6 shows a district-level report with overall district results at the top and school results
below. The shaded areas correspond to the achievement levels. Percentages of students in each
level are shown. The figure shows the window that pops up when the cursor hovers over the display.
It shows the numbers of students in each category as well as percentages.
FIGURE 7-6 EXAMPLE AGGREGATE REPORT
Data Downloads
In addition to the predesigned reports, the reporting system offers authorized users the ability to
download data for distribution or further review and analysis in external systems. User authorization
is closely controlled for ISRs and personally identifiable information (PII) in files. The list of available
data downloads appears below. Note that these downloads assume that members have loaded data
into the Smarter Balanced Data Warehouse. In practice, many members get this information directly
from test delivery service providers and do not go through the Data Warehouse.
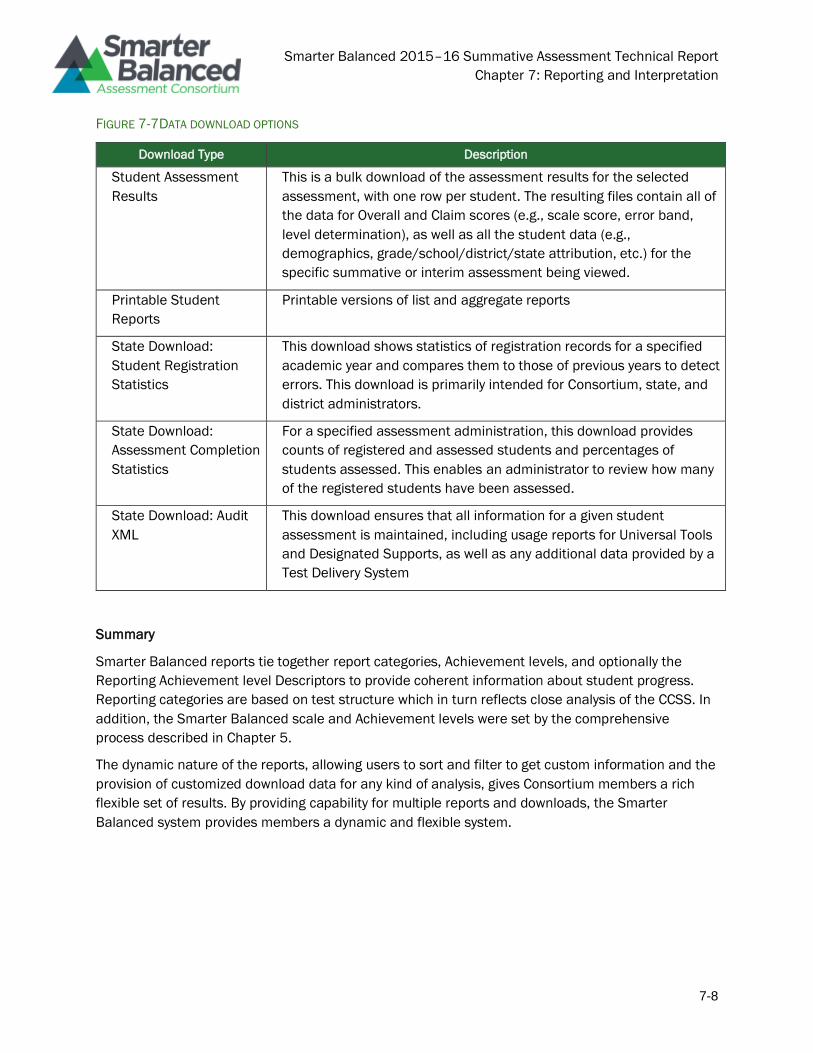
Smarter Balanced 2015–16 Summative Assessment Technical Report
Chapter 7: Reporting and Interpretation
7-8
FIGURE 7-7DATA DOWNLOAD OPTIONS
Download Type Description
Student Assessment
Results
This is a bulk download of the assessment results for the selected
assessment, with one row per student. The resulting files contain all of
the data for Overall and Claim scores (e.g., scale score, error band,
level determination), as well as all the student data (e.g.,
demographics, grade/school/district/state attribution, etc.) for the
specific summative or interim assessment being viewed.
Printable Student
Reports
Printable versions of list and aggregate reports
State Download:
Student Registration
Statistics
This download shows statistics of registration records for a specified
academic year and compares them to those of previous years to detect
errors. This download is primarily intended for Consortium, state, and
district administrators.
State Download:
Assessment Completion
Statistics
For a specified assessment administration, this download provides
counts of registered and assessed students and percentages of
students assessed. This enables an administrator to review how many
of the registered students have been assessed.
State Download: Audit
XML
This download ensures that all information for a given student
assessment is maintained, including usage reports for Universal Tools
and Designated Supports, as well as any additional data provided by a
Test Delivery System
Summary
Smarter Balanced reports tie together report categories, Achievement levels, and optionally the
Reporting Achievement level Descriptors to provide coherent information about student progress.
Reporting categories are based on test structure which in turn reflects close analysis of the CCSS. In
addition, the Smarter Balanced scale and Achievement levels were set by the comprehensive
process described in Chapter 5.
The dynamic nature of the reports, allowing users to sort and filter to get custom information and the
provision of customized download data for any kind of analysis, gives Consortium members a rich
flexible set of results. By providing capability for multiple reports and downloads, the Smarter
Balanced system provides members a dynamic and flexible system.
Smarter Balanced 2015–16 Summative Assessment Technical Report
Chapter 7: Reporting and Interpretation
7-9
References
Smarter Balanced Assessment Consortium. (2014f, November 14). Interpretation and Use of Scores
and Achievement Levels. Los3 Angeles, CA: Author. Retrieved from
https://www.smarterbalanced.org/wp-content/uploads/2015/08/Interpretation-and-Use-of-
Scores.pdf
Smarter Balanced Assessment Consortium. (2014, September 7). Reporting System User Guide. Los
Angeles, CA: Author. Retrieved from http://www.smarterapp.org/manuals/Reporting-
UserGuide.html
Smarter Balanced 2015–16 Summative Assessment Technical Report
Appendix A: Item Development Process
A-1
Appendix A: Item Development Process
The charts below outline the detailed process for stages of item development. They describe the
many checks and reviews each item receives before it is approved for field testing. Item content,
graphics, artwork, response processes and stimuli get extensive reviews. Items are also subject to
reviews for possible cultural bias or material that may distract some test takers because it is in an
area of sensitivity. Throughout the process there are checks to assure that items are accessible to
as many students as possible.
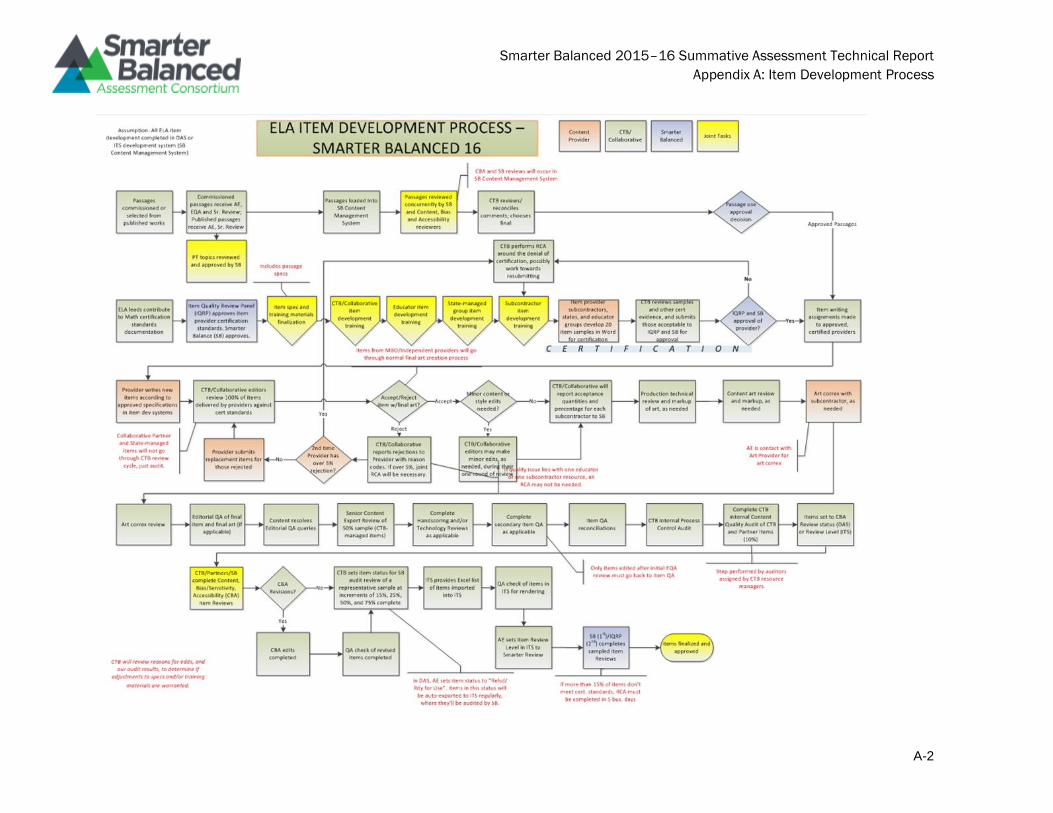
Smarter Balanced 2015–16 Summative Assessment Technical Report
Appendix A: Item Development Process
A-2
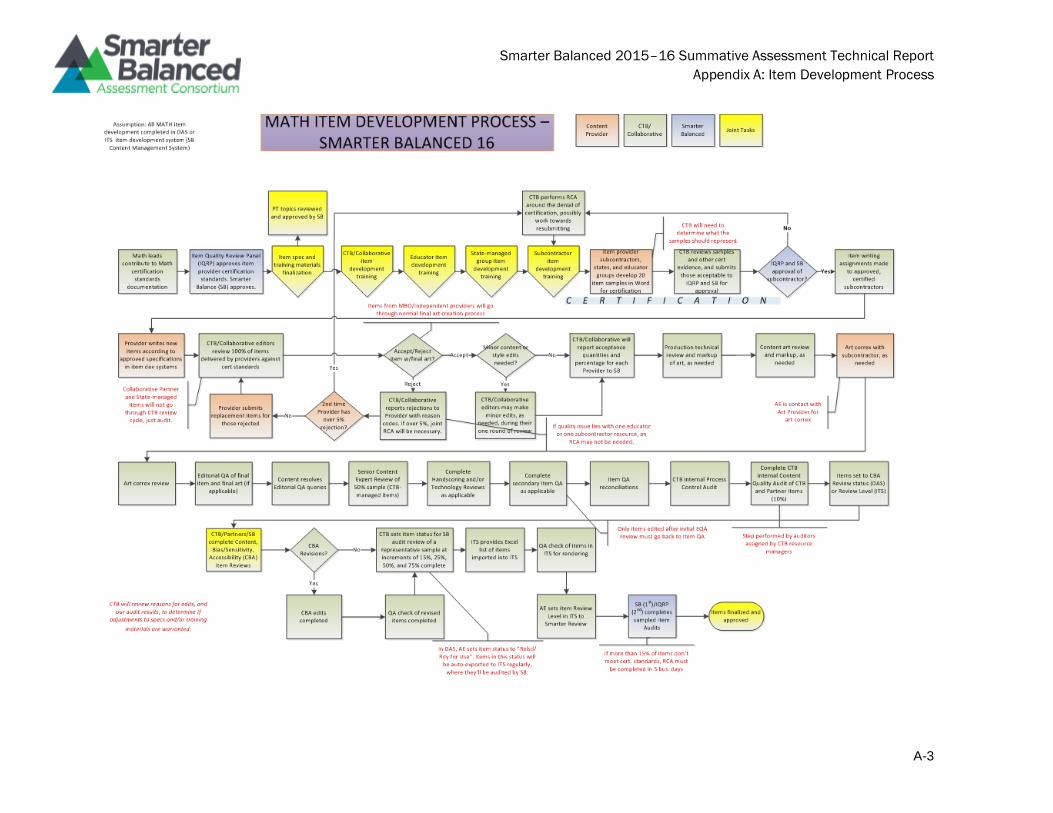
Smarter Balanced 2015–16 Summative Assessment Technical Report
Appendix A: Item Development Process
A-3
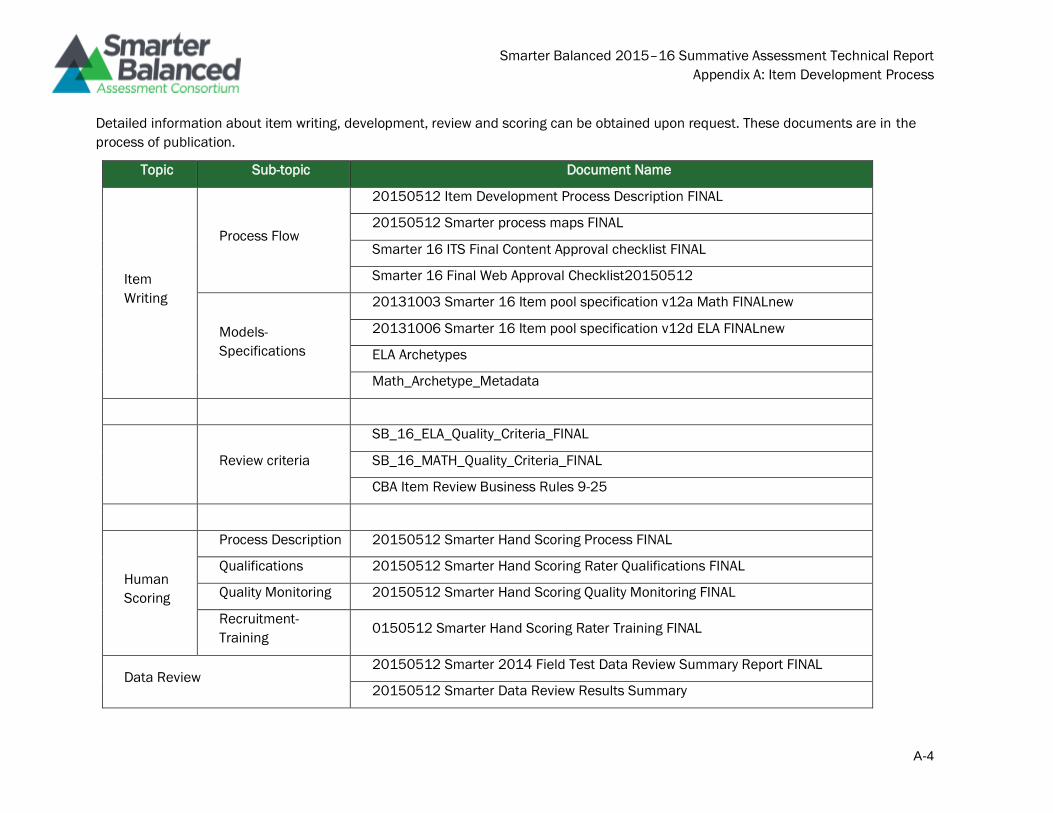
Smarter Balanced 2015–16 Summative Assessment Technical Report
Appendix A: Item Development Process
A-4
Detailed information about item writing, development, review and scoring can be obtained upon request. These documents are in the
process of publication.
Topic Sub-topic Document Name
Item
Writing
Process Flow
20150512 Item Development Process Description FINAL
20150512 Smarter process maps FINAL
Smarter 16 ITS Final Content Approval checklist FINAL
Smarter 16 Final Web Approval Checklist20150512
Models-
Specifications
20131003 Smarter 16 Item pool specification v12a Math FINALnew
20131006 Smarter 16 Item pool specification v12d ELA FINALnew
ELA Archetypes
Math_Archetype_Metadata
Review criteria
SB_16_ELA_Quality_Criteria_FINAL
SB_16_MATH_Quality_Criteria_FINAL
CBA Item Review Business Rules 9-25
Human
Scoring
Process Description 20150512 Smarter Hand Scoring Process FINAL
Qualifications 20150512 Smarter Hand Scoring Rater Qualifications FINAL
Quality Monitoring 20150512 Smarter Hand Scoring Quality Monitoring FINAL
Recruitment-
Training 0150512 Smarter Hand Scoring Rater Training FINAL
Data Review 20150512 Smarter 2014 Field Test Data Review Summary Report FINAL
20150512 Smarter Data Review Results Summary
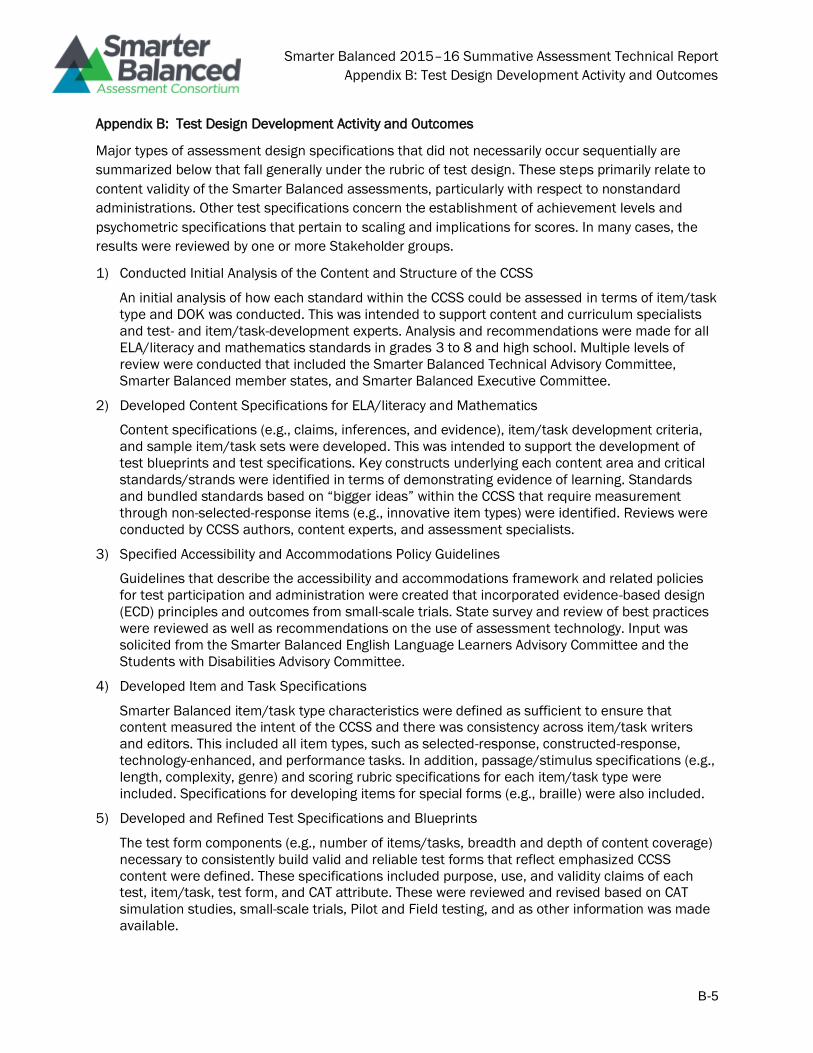
Smarter Balanced 2015–16 Summative Assessment Technical Report
Appendix B: Test Design Development Activity and Outcomes
B-5
Appendix B: Test Design Development Activity and Outcomes
Major types of assessment design specifications that did not necessarily occur sequentially are
summarized below that fall generally under the rubric of test design. These steps primarily relate to
content validity of the Smarter Balanced assessments, particularly with respect to nonstandard
administrations. Other test specifications concern the establishment of achievement levels and
psychometric specifications that pertain to scaling and implications for scores. In many cases, the
results were reviewed by one or more Stakeholder groups.
1) Conducted Initial Analysis of the Content and Structure of the CCSS
An initial analysis of how each standard within the CCSS could be assessed in terms of item/task
type and DOK was conducted. This was intended to support content and curriculum specialists
and test- and item/task-development experts. Analysis and recommendations were made for all
ELA/literacy and mathematics standards in grades 3 to 8 and high school. Multiple levels of
review were conducted that included the Smarter Balanced Technical Advisory Committee,
Smarter Balanced member states, and Smarter Balanced Executive Committee.
2) Developed Content Specifications for ELA/literacy and Mathematics
Content specifications (e.g., claims, inferences, and evidence), item/task development criteria,
and sample item/task sets were developed. This was intended to support the development of
test blueprints and test specifications. Key constructs underlying each content area and critical
standards/strands were identified in terms of demonstrating evidence of learning. Standards
and bundled standards based on “bigger ideas” within the CCSS that require measurement
through non-selected-response items (e.g., innovative item types) were identified. Reviews were
conducted by CCSS authors, content experts, and assessment specialists.
3) Specified Accessibility and Accommodations Policy Guidelines
Guidelines that describe the accessibility and accommodations framework and related policies
for test participation and administration were created that incorporated evidence-based design
(ECD) principles and outcomes from small-scale trials. State survey and review of best practices
were reviewed as well as recommendations on the use of assessment technology. Input was
solicited from the Smarter Balanced English Language Learners Advisory Committee and the
Students with Disabilities Advisory Committee.
4) Developed Item and Task Specifications
Smarter Balanced item/task type characteristics were defined as sufficient to ensure that
content measured the intent of the CCSS and there was consistency across item/task writers
and editors. This included all item types, such as selected-response, constructed-response,
technology-enhanced, and performance tasks. In addition, passage/stimulus specifications (e.g.,
length, complexity, genre) and scoring rubric specifications for each item/task type were
included. Specifications for developing items for special forms (e.g., braille) were also included.
5) Developed and Refined Test Specifications and Blueprints
The test form components (e.g., number of items/tasks, breadth and depth of content coverage)
necessary to consistently build valid and reliable test forms that reflect emphasized CCSS
content were defined. These specifications included purpose, use, and validity claims of each
test, item/task, test form, and CAT attribute. These were reviewed and revised based on CAT
simulation studies, small-scale trials, Pilot and Field testing, and as other information was made
available.
Smarter Balanced 2015–16 Summative Assessment Technical Report
Appendix B: Test Design Development Activity and Outcomes
B-6
6) Developed Initial Achievement Levels
Achievement expectations for mathematics and ELA/literacy were written in a manner that
students, educators, and parents could understand. Panelists were recruited, and panels
consisting of Institutes of Higher Education and a Cross-Consortia Technical Advisory Committee
were convened in order to define college and career readiness. A period for public comment and
various levels of review was implemented by the Smarter Balanced Technical Advisory
Committee and selected focus groups with the approval of Governing Members. These activities
were coordinated with the PARCC consortium.
7) Developed Item and Task Prototypes
Prototype items and tasks using accessibility and Universal Design principles were produced that
maximize fairness and minimize bias by using the principles of evidence-based design.
Recommendations were made on how best to measure standards for innovative item types (per
content specifications). This included prototypes for scoring guides, selected-response items,
constructed-response items, and performance tasks. These prototypes were annotated,
describing key features of items/tasks and scoring guides, passage/stimulus specifications (e.g.,
length, complexity, genre), and scoring rubric guidelines for each item/task type. Reviews,
feedback, and revisions were obtained from educator-focus groups and Stakeholders, Smarter
Balanced work groups, the Smarter Balanced English Language Learners Advisory Committee,
and the Students with Disabilities Advisory Committee.
8) Wrote Item and Performance Task Style Guide
The style guide specifies item/task formatting sufficient to ensure consistency of item/task
formatting and display. The style guide specified the font, treatment of emphasized
language/words (e.g., bold, italics), screen-display specifications, constraints on image size,
resolution, colors, and passage/stimulus display configuration. Comprehensive guidelines for
online and paper style requirements for all item types (e.g., selected-response, constructed-
response, technology-enhanced, performance tasks) were specified.
9) Developed Accessibility Guidelines for Item and Task Development
Guidelines were produced for item and task writing/editing that ensure accessibility of test
content that addressed all item types. Interoperability standards at the item and test level were
determined. Reviews, feedback, and revisions were based on educator-focus groups, Smarter
Balanced work groups, the Smarter Balanced English Language Learners Advisory Committee,
and the Students with Disabilities Advisory Committee.
10) Developed and Distributed Item/Task Writing Training Materials
Training materials were created that specified consistent use of item/task specifications, style
guides, accessibility guidelines, and best practices in item/task development (e.g., Universal
Design, bias and sensitivity concerns) that were sufficient to ensure valid and reliable
items/tasks that are free from bias and maximize accessibility to content. Training for item/task
writing and editing was developed as online modules that enabled writers and editors to receive
training remotely. Item writer and editor qualifications were established, and quality control
procedures to ensure item writers were adequately trained were implemented.
11) Reviewed State-Submitted Items and Tasks for Inclusion in Smarter Balanced Item Pool
State-submitted items/tasks were reviewed for inclusion in the Pilot and/or Field Test item bank
using the item bank/authoring system. This consisted of developing protocols for the submission
and collection of state-submitted items/tasks for potential use in Pilot or Field Tests. These items
were reviewed for item/task alignment, appropriateness (including access), and bias and
Smarter Balanced 2015–16 Summative Assessment Technical Report
Appendix B: Test Design Development Activity and Outcomes
B-7
sensitivity. Feedback was provided to states on the disposition of submitted items/tasks, and a
gap analysis was conducted to determine the item/task procurement needs.
12) Planned and Conducted Small-Scale Trials of New Item and Task Types
Small-scale trials of new item/task types were used to inform potential revision of item/task
specifications and style guides. Cognitive labs were conducted for new item/task types. Small-
scale trials reflected an iterative development process, such that recommended revisions were
evaluated as improvements became available.
13) Developed Automated-Scoring Approaches
The initial automated scoring methodology (e.g., regression, rules-based, or hybrid) was based on
information from the content specifications, item/task specifications, item/task prototypes, and
response data from the small-scale item/task trials. Reports documenting analysis were created,
and independent review of this information with recommendations was made. Consultation,
review, and approval of recommendations by the Smarter Balanced Technical Advisory
Committee were made.
14) Developed Smarter Balanced Item and Task Writing Participation Policies and Guidelines
Documentation of processes for Smarter Balanced member states and Stakeholders to be
involved in Smarter Balanced item/task writing activities (e.g., content and bias/sensitivity, data
review, Pilot Testing, Field Testing) was developed. Criteria for selecting committee members
(e.g., regional representation, expertise, experience) were also made.
15) Developed Content and Bias/Sensitivity Pilot Item and Task Review Materials
Methods for consistent training for content- and bias-review committees and for meeting logistics
guidelines were provided. Review committees were recruited consistent with Smarter Balanced
assessment participation policies.
16) Conducted Content and Bias/Sensitivity Reviews of Passages and Stimuli
Feedback from educators and other Stakeholders regarding passage/stimulus accuracy,
alignment, appropriateness, accessibility, conformance to passage/stimulus specifications and
style guides, and potential bias and sensitivity concerns was obtained. Educator feedback was
documented, and procedures for feedback-reconciliation review were made.
17) Conducted Content and Bias/Sensitivity Pilot and Field Item and Task Review Meetings
Feedback from educators and other Stakeholders regarding item/task accuracy, alignment,
appropriateness, accessibility, conformance to item/task specifications and style guides, and
potential bias and sensitivity concerns was obtained. Reviews included all aspects of
items/tasks (stem, answer choices, art, scoring rubrics) and statistical characteristics.
18) Developed Translation Framework and Specifications Languages
Definitions of item/task translation activities that ensure consistent and valid translation
processes consistent with Smarter Balanced policy were produced. Review and approval of this
process by the ELL Advisory Committee was made.
19) Translated Pilot and Field Test Items and Tasks into Identified Languages
Items/tasks translated into the specified languages were edited in sufficient quantity to support
both Pilot- and Field-testing and operational assessments. Items/tasks included a full array of
Smarter Balanced item types (selected-response, constructed-response, technology-enhanced,
performance tasks). Review for content and bias/sensitivity of item/tasks and passages/stimuli
was conducted.
Smarter Balanced 2015–16 Summative Assessment Technical Report
Appendix B: Test Design Development Activity and Outcomes
B-8
20) Developed Content and Bias/Sensitivity Field Test Item and Task Review Materials
Supporting materials that ensure consistent training for content- and bias-review committees
and meeting logistics guidelines were developed.
21) Revised Field Test Items and Tasks Based on Content and Bias/Sensitivity Committee Feedback
Fully revised items/tasks were available to be included on Field Test forms. Review panels were
identified and convened, and training of state-level staff to edit and improve items/tasks that
included all aspects of items/tasks (e.g., art, scoring rubrics) was conducted.
22) Developed Translation Framework and Specifications Languages
Definitions of item/task translation activities that ensured consistent and valid translation
processes consistent with Smarter Balanced policy were created and approved by the ELL
Advisory Committee.
23) Translated Pilot and Field Test Items and Tasks into Identified Languages
Translated items/tasks written by vendors, teachers, or provided through state submissions were
edited in sufficient quantity to support Pilot and Field Tests and operational assessment.
24) Developed Content and Bias/Sensitivity Field Test Item and Task Review Materials
Review materials that ensure consistent training for content- and bias-review committees and
meeting logistics guidelines were created. Feedback from educators and other Stakeholders
regarding item/task accuracy, alignment, appropriateness, accessibility, conformance to
item/task specifications and style guides, and potential bias and sensitivity concerns was
obtained.
25) Produced a Single Composite Score Based on the CAT and Performance Tasks
A dimensionality study was conducted to determine whether a single sale and composite score
could be produced or if separate scales for the CAT and performance task components should
be produced. Based on the Pilot Test, a dimensionality study was conducted and the results
presented to the Smarter Balanced Technical Advisory Committee. A unidimensional model was
chosen for the Smarter Balanced scales and tests.
26) Investigated Test Precision for the CAT Administrations
An investigation of targets was conducted for score precision in the case in which tests are
constructed dynamically from a pool of items and a set of rules must be established for the
adaptive algorithm. A number of supporting simulation studies were conducted. The findings
were used to inform subsequent test design for the operational CAT that was presented to the
Smarter Balanced Technical Advisory Committee.
27) Selected IRT Models for Scaling
Using the Pilot Test data, the characteristics of various IRT models for selected- and constructed-
response items were compared. The results of this study were presented to the Validation and
Psychometrics/Test Design Work Group and the Smarter Balanced Technical Advisory Committee
for comment. The two-parameter logistic (2-PL) model for selected-response and the
Generalized Partial Credit (GPC) Model for constructed-response were chosen as the scaling
models.
Smarter Balanced 2015–16 Summative Assessment Technical Report
Appendix C: Reporting Achievement Level Descriptors
C-1
Appendix C: Reporting Achievement Levels
Descriptors for Smarter Balanced achievement levels provided to Consortium members for the
2014-2015 test administration. Please note that members may choose to alter the descriptors or
name the four achievement levels.
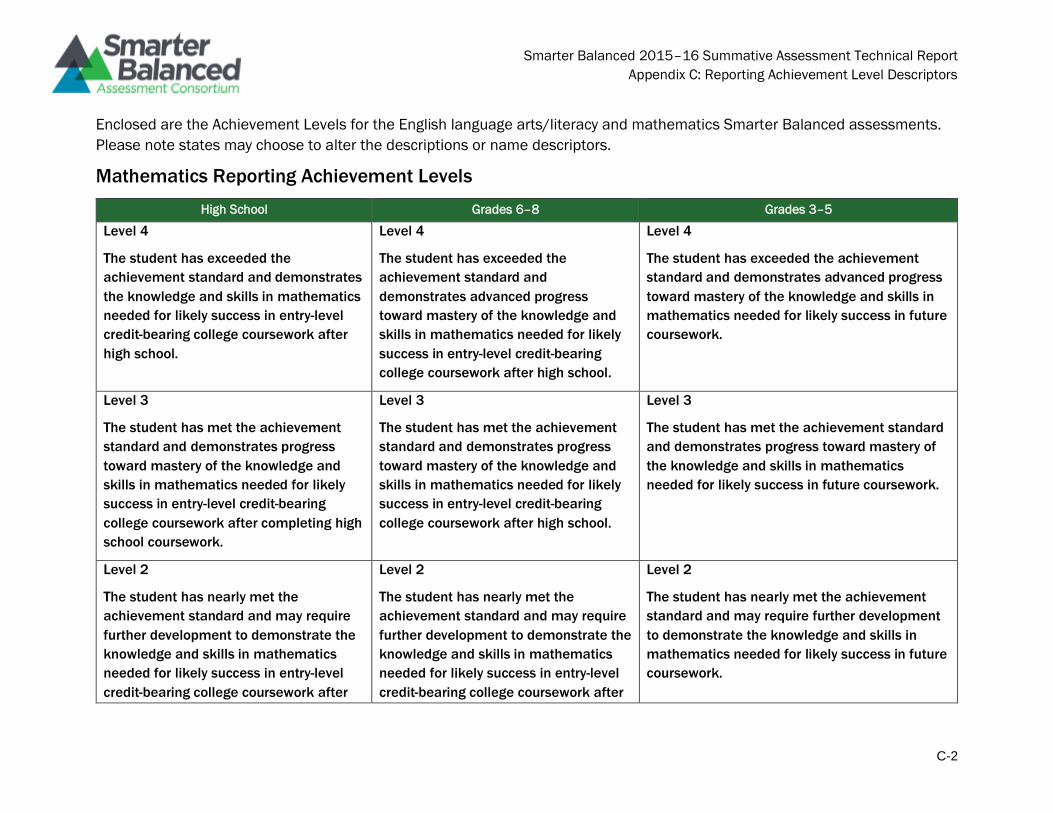
Smarter Balanced 2015–16 Summative Assessment Technical Report
Appendix C: Reporting Achievement Level Descriptors
C-2
Enclosed are the Achievement Levels for the English language arts/literacy and mathematics Smarter Balanced assessments.
Please note states may choose to alter the descriptions or name descriptors.
Mathematics Reporting Achievement Levels
High School Grades 6–8 Grades 3–5
Level 4
The student has exceeded the
achievement standard and demonstrates
the knowledge and skills in mathematics
needed for likely success in entry-level
credit-bearing college coursework after
high school.
Level 4
The student has exceeded the
achievement standard and
demonstrates advanced progress
toward mastery of the knowledge and
skills in mathematics needed for likely
success in entry-level credit-bearing
college coursework after high school.
Level 4
The student has exceeded the achievement
standard and demonstrates advanced progress
toward mastery of the knowledge and skills in
mathematics needed for likely success in future
coursework.
Level 3
The student has met the achievement
standard and demonstrates progress
toward mastery of the knowledge and
skills in mathematics needed for likely
success in entry-level credit-bearing
college coursework after completing high
school coursework.
Level 3
The student has met the achievement
standard and demonstrates progress
toward mastery of the knowledge and
skills in mathematics needed for likely
success in entry-level credit-bearing
college coursework after high school.
Level 3
The student has met the achievement standard
and demonstrates progress toward mastery of
the knowledge and skills in mathematics
needed for likely success in future coursework.
Level 2
The student has nearly met the
achievement standard and may require
further development to demonstrate the
knowledge and skills in mathematics
needed for likely success in entry-level
credit-bearing college coursework after
Level 2
The student has nearly met the
achievement standard and may require
further development to demonstrate the
knowledge and skills in mathematics
needed for likely success in entry-level
credit-bearing college coursework after
Level 2
The student has nearly met the achievement
standard and may require further development
to demonstrate the knowledge and skills in
mathematics needed for likely success in future
coursework.
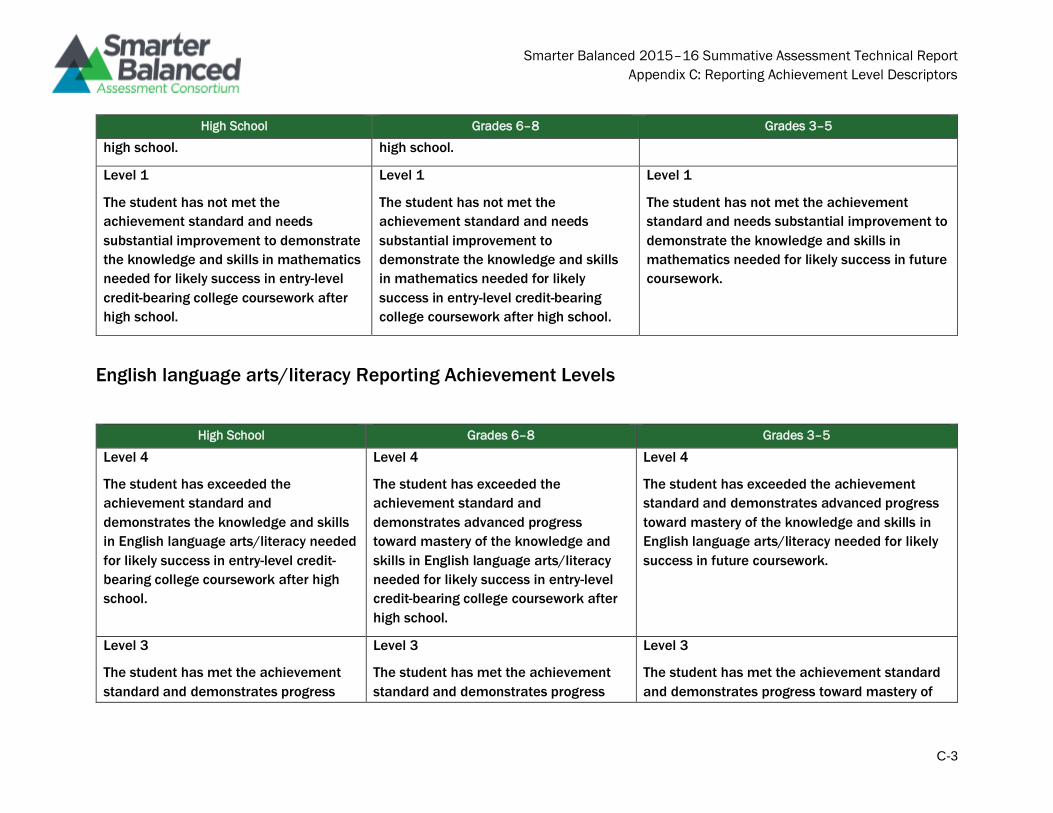
Smarter Balanced 2015–16 Summative Assessment Technical Report
Appendix C: Reporting Achievement Level Descriptors
C-3
High School Grades 6–8 Grades 3–5
high school. high school.
Level 1
The student has not met the
achievement standard and needs
substantial improvement to demonstrate
the knowledge and skills in mathematics
needed for likely success in entry-level
credit-bearing college coursework after
high school.
Level 1
The student has not met the
achievement standard and needs
substantial improvement to
demonstrate the knowledge and skills
in mathematics needed for likely
success in entry-level credit-bearing
college coursework after high school.
Level 1
The student has not met the achievement
standard and needs substantial improvement to
demonstrate the knowledge and skills in
mathematics needed for likely success in future
coursework.
English language arts/literacy Reporting Achievement Levels
High School Grades 6–8 Grades 3–5
Level 4
The student has exceeded the
achievement standard and
demonstrates the knowledge and skills
in English language arts/literacy needed
for likely success in entry-level credit-
bearing college coursework after high
school.
Level 4
The student has exceeded the
achievement standard and
demonstrates advanced progress
toward mastery of the knowledge and
skills in English language arts/literacy
needed for likely success in entry-level
credit-bearing college coursework after
high school.
Level 4
The student has exceeded the achievement
standard and demonstrates advanced progress
toward mastery of the knowledge and skills in
English language arts/literacy needed for likely
success in future coursework.
Level 3
The student has met the achievement
standard and demonstrates progress
Level 3
The student has met the achievement
standard and demonstrates progress
Level 3
The student has met the achievement standard
and demonstrates progress toward mastery of
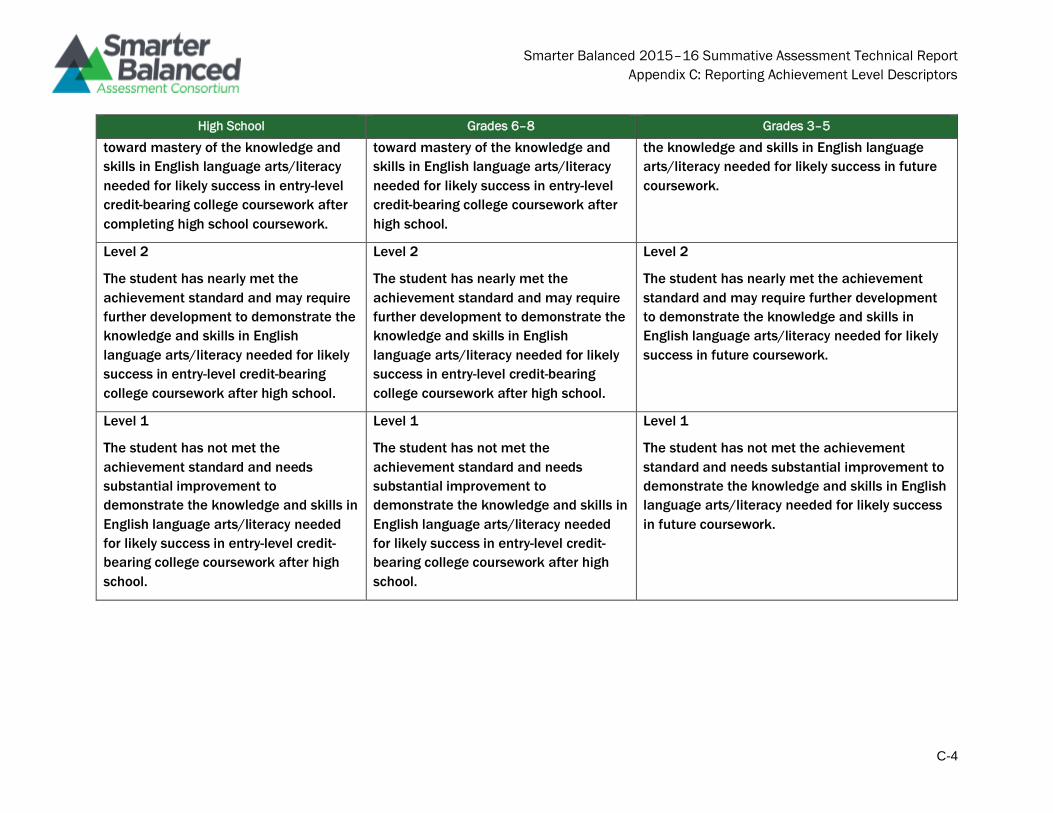
Smarter Balanced 2015–16 Summative Assessment Technical Report
Appendix C: Reporting Achievement Level Descriptors
C-4
High School Grades 6–8 Grades 3–5
toward mastery of the knowledge and
skills in English language arts/literacy
needed for likely success in entry-level
credit-bearing college coursework after
completing high school coursework.
toward mastery of the knowledge and
skills in English language arts/literacy
needed for likely success in entry-level
credit-bearing college coursework after
high school.
the knowledge and skills in English language
arts/literacy needed for likely success in future
coursework.
Level 2
The student has nearly met the
achievement standard and may require
further development to demonstrate the
knowledge and skills in English
language arts/literacy needed for likely
success in entry-level credit-bearing
college coursework after high school.
Level 2
The student has nearly met the
achievement standard and may require
further development to demonstrate the
knowledge and skills in English
language arts/literacy needed for likely
success in entry-level credit-bearing
college coursework after high school.
Level 2
The student has nearly met the achievement
standard and may require further development
to demonstrate the knowledge and skills in
English language arts/literacy needed for likely
success in future coursework.
Level 1
The student has not met the
achievement standard and needs
substantial improvement to
demonstrate the knowledge and skills in
English language arts/literacy needed
for likely success in entry-level credit-
bearing college coursework after high
school.
Level 1
The student has not met the
achievement standard and needs
substantial improvement to
demonstrate the knowledge and skills in
English language arts/literacy needed
for likely success in entry-level credit-
bearing college coursework after high
school.
Level 1
The student has not met the achievement
standard and needs substantial improvement to
demonstrate the knowledge and skills in English
language arts/literacy needed for likely success
in future coursework.