Embed Size (px)
Citation preview
SOCIAL IMPACT ASSESSMENT
As part of the
ENVIRONMENTAL IMPACT ASSESSMENT PROCESS
for the
PROPOSED TSHWANE STRENGTHENING PROJECT
DRAFT SCOPING REPORT
VOLUME 1:
EXPANSION OF THE VERVOERDBURG SUBSTATION
LOOP IN/OUT LINE FROM APOLLO-PLUTO TO VERWOERDBURG SUBSTATION
JUNE 2009
ii
Prepared by:
MasterQ Research
Reg. No.: 2003/002350/07
Contact person:
Ms Nonka Byker
Mobile: 082 940 3694
Telephone: 011 477 3265
Fax: 086 612 8122
Email: [email protected]
Postal address:
49 Muller Street
Yeoville
2198
iii
EXPERIENCE RECORD
This report was compiled by Ms Nonka Byker of MasterQ Research.
Ms Byker holds a B.Psych (Adult Mental Health) from the University of Pretoria and is a
social impact assessment specialist with approximately 3 years experience in this field.
She specialises in the assessment of potential social impacts, which includes the
collection and analysis of data and superimposing a proposed project on a baseline social
profile to determine the potential social impacts from which mitigation measures can be
developed. In total she has approximately 10 years experience in the social development
field, of which 7 years were spent as a public participation consultant. Ms Byker is
registered with the Health Professions Council of South Africa (HPCSA) and is a member
of the International Association for Impact Assessment South African Affiliate (IAIAsa).
Some of the linear Social Impact Assessments that Ms Byker has conducted on behalf of
MasterQ Research included, amongst others, the following projects:
• Social Impact Assessment for the proposed Thyspunt Integration Project (Client:
Eskom Generation/Transmission, Project Manager: SiVEST).
• Social Impact Assessment for the proposed Mokopane Integration Project (Client:
Eskom Generation/Transmission, Project Manager: Savannah Environmental).
• Social Impact Assessment for the proposed Steelpoort Integration Project (Client:
Eskom Generation/Transmission, Project Manager: Savannah Environmental)
• Social Impact Assessment for the proposed Mercury-Ferrum transmission power line
(Client: Eskom Transmission, Project Manager: Bohlweki Environmental)
• Social Impact Assessment for the proposed Ferrum-Garona transmission power line
(Client: Eskom Transmission, Project Manager: Bohlweki Environmental)
iv
DECLARATION OF INDEPENDENCE
The EIA regulations (1182 and 1183, as amended) states, amongst other, that an
independent consultant must be appointed to act on behalf of the client and to ensure
that the public participation process is managed properly. In this regard MasterQ
Research submits that it has:
• The necessary required expertise to conduct social impact assessments, including the
required knowledge and understanding of any guidelines or policies that are relevant
to the proposed activity;
• Undertaken all the work and associated studies in an objective and independent
manner, even if the findings of these studies are not favourable to the project
proponent;
• No vested financial interest in the proposed project or the outcome thereof, apart
from remuneration for the work undertaken under the auspices of the above-
mentioned regulations;
• No vested interest, including any conflicts of interest, in either the proposed project
or the studies conducted in respect of the proposed project, other than complying
with the required regulations; and
• Disclosed any material factors that may have the potential to influence the competent
authority’s decision and/or objectivity in terms of any reports, plans or documents
related to the proposed project as required by the regulations.
v
EXECUTIVE SUMMARY
Eskom has been mandated by the South African Government to provide reliable and
affordable electricity to the country. As generated electricity cannot be stored, the supply
should be used as it is generated, resulting in a stringent supply-demand situation. It is
believed that a reliable electricity supply is vital to support sustainable development in
South Africa.
The proposed Tshwane Strengthening Project involves a complex scope of works and for
this reason the project reporting process has been divided as follows:
• Volume 1 (this report): Contains the assessment of the proposed expansion of the
existing Verwoerdburg substation as well as the 2 (two) 400kV loop-in power lines
from the Apollo-Pluto transmission power line to the new expansions at the
Verwoerdburg substation.
• Volume 2: Contains the assessment of the construction and operation of the
proposed new Phoebus substation, extensions at the existing Kwagga substation, as
well as the proposed construction and operation of a new 400kV transmission power
line from the existing Kwagga substation to the new Phoebus substation over a
distance of approximately 30km.
This particular report only focuses on the applications under Volume 1 and details the
results of the Scoping Study as part of the Social Impact Assessment (SIA) specialist
study undertaken by MasterQ Research as part of the overall Environmental Impact
Assessment (EIA) process that is being undertaken by Savannah Environmental. A
separate Social Impact Assessment (SIA) Scoping Report has been compiled for the
Volume 2 applications. In terms of the Volume 1 applications, one (1) site has been
identified for the proposed expansion for the existing Verwoerdburg substation, and two
(2) route alternatives for the proposed 2x 400kV loop in and out power line from the
Apollo-Pluto transmission power line to and from the Verwoerdburg substation.
Vanclay (2002) defines a social impact assessment as:
“.. the process of analyzing (predicting, evaluating and reflecting) and managing the
intended and unintended consequences on the human environment of planned
interventions (policies, programmes, plans and projects) and any social change processes
invoked by those interventions so as to bring about a more sustainable and equitable
biophysical and human environment.”
In order to do a theoretically sound analysis of social impacts with high levels of
confidence, a thorough baseline assessment and projection is therefore necessary. The
social team made a clear distinction between change processes and impacts. Social
impacts refer to the impacts that are actually experienced by humans on physical and/or
vi
cognitive level. An impact variable is a change process and leads to impacts, e.g. an
increase in population or the presence of strangers are not regarded as impacts, but
rather change processes that lead to impacts such as a change in the perception about
the nature of the community.
The following change processes have been identified and discussed in this report:
• Geographical processes: land use patterns;
• Demographic processes: the number and composition of people;
• Economic processes: the way in which people make a living and the economic
activities in society;
• Institutional and Empowerment processes: the ability of people to be involved
and influence decision making processes; and the role, efficiency and operation of
governments and other organisations; and
• Socio-cultural processes: the way in which humans behave, interact and relate to
each other and their environment and the belief and value systems which guide these
interactions.
Please note: Due to the fact that only a small portion of the Apollo/Pluto-
Verwoerdburg turn-in and –out lines fall within the City of Tshwane (CoT), a
baseline profile of the CoT has not been included in this report. This report
therefore focuses on the Kungwini Local Municipality only. For a baseline profile
of the CoT, please refer to Volume 2.
Geographical Processes
Geographical processes relate to land use patterns and infrastructure in the area. This
section therefore describes the land use in the study area from a social perspective,
specifically in terms of settlement patterns and land use developments.
According to the KLM IDP, agriculture is the most dominant land use in the total district
area of Metsweding. Even though agriculture accounts for approximately 80% of the land
use in the district, it only contributed approximately 3.7% to the local economy1. The
bulk of production within the agriculture sector takes place on privately owned
commercial farms, notably farms around Bronkhorstspruit. The most significant farming
commodities are cattle and crop farming. In terms of crop farming, commodities include
maize, ground-nuts, sunflowers, cotton and sorghum. Vegetables are mostly produced on
subsistence farms, which are cultivated for private use or sometimes sold on the informal
market.
Mining is another important land use within the KLM, and includes the extracting and
beneficiating of minerals including solids, liquids and crude petroleum and gas. These
1 Kungwini Local Municipality Integrated Development Plan 2008/09

vii
minerals are extracted through underground and surface mining operations, as well as
quarries. The majority of mines within the KLM extract silica.
Geographical change processes refer to land use change as a result of the actual or
perceived changes in land use, whether it be on a temporary or permanent basis. The
proposed expansion at the substation and the construction and operation of the proposed
loop in/out power lines might lead to a change in the land use within the local area. The
assessment of a land use change process from a social perspective takes into account
how the proposed loop-in/-out power lines might affect the behaviour/lives of land
owners and/or land users. The following geographical change process is expected:
• Land acquisition and disposal, including availability of land.
Demographical Processes
Demographic processes relate to the number of people and composition of a community
and include an overview of the population size and the educational profile of the affected
communities.
The KLM covers an area of approximately 2 202km2 and in 2007 had a total population of
104 150 people. Compared to the population size of 2001, when the population stood at
approximately 160 752 people, this means that the population size within the KLM
decreased at an average rate of 9 434 people per annum or a total of 56 602 over the 6-
year period between 2001 and 2007. This population decrease also brought about a
change in the population density in the area from 73.0 persons per km2 in 2001 to 47.3
persons per km2 in 2007.
An overview of the educational profile for the KLM is provided in Figure 9. Overall it
would appear as if the area is characterised by a semi-skilled to skilled population, which
is reflected in the fact that, in 2007, only a small minority (less than one in every 10
persons) of the total population has had no form of formal education. This translates to a
significant reduction in the total population who has had no formal education from 2001,
when close on one in every 5 persons has had no education.
The construction and maintenance of the proposed substation and loop-in/-out power
lines, could lead to a temporary change in the number and composition of the population
within the affected local area, which in turn could lead to economic, land use, and socio-
cultural change processes. The following demographical change processes are expected:
• Population change; and
• In-migration of unemployed work seekers.
viii
Economical Processes
Economic processes relate to the way in which people make a living and the economic
activities within that society. The employment status within any given area gives an
indication of the economic stability of such an area and also serves as an indicator of
such an area’s general well-being.
The study area is characterised by a fairly high employment rate where the majority
(79.4%) of the working age population (excluding the not economically active
population) is formally employed. This is a significant increase from 2001, when less than
half (49.2%) of the economically active population were employed.
Overall it would therefore appear as if the economy of the study area is growing at a
steady pace. As economic industries are growing, more employment opportunities are
created thereby further reducing the unemployment rate, creating sources of income
which in turn leads to the creation of other opportunities such as further education, a
need for housing (which in turn creates further employment opportunities, both directly
and indirectly), etc.
Economic change processes relate to the changes brought about to the employment and
general economic profile of an area as a result of the introduction of any development.
For example, job opportunities might be created as a result of the construction and
maintenance of the proposed substation and loop-in/-out power lines. Employment
creates a source of income, which in turn enables the employed individual to access
services and a support mechanism for his/her family. The following economical change
processes are expected:
• Enhanced/reinforced economic equities;
• Change in employment equity of vulnerable groups; and
• Change in occupational opportunities.
Institutional and Empowerment Processes
Institutional and Empowerment processes relate to the role, efficiency and operation of
government sectors and other organisations within the area in terms of service delivery.
It also investigates the ability of people to engage in decision-making processes to such
an extent that they have an impact on the way in which decisions are made that would
concern them.
It would appear that, in general within the KLM, municipal services are sufficient and that
the municipal network would be able to sustain additional connections to the electricity
and water network. Sanitation and refuse services appears to be at a vulnerable stage,
which means that it can easily be overloaded and should be used with caution. However,
ix
as the study area borders on the CoT, it is likely that construction teams would make use
of services provided by the CoT.
Institutional and Empowerment Change Processes relate to way in which the proposed
project might change the face of service delivery in the area and how this change might
affect the quality of life of local residents. It furthermore assesses local residents’ ability
to negotiate such changes in a way that is mutually beneficial to both the project
proponent as well as the affected landowners. The following institutional and
empowerment change processes are expected:
• Change in community infrastructure; and
• Change in housing needs/demands (temporary).
Socio-Cultural Processes
Socio-cultural processes relate to the way in which humans behave, interact and relate to
each other and their environment, as well as the belief and value systems which guide
these interactions.
At the time of the study, not enough information was available to determine the level of
cultural and place attachment that residents have to the area surrounding the substation
and the loop-in/-out power lines.
Socio-cultural change processes that are associated with the construction and operation
of the proposed project include changes such as health and safety aspects and sense of
place. The concept of ‘health’ is not only limited to physical health (i.e. the absence of
ailments or illness), but also includes mental and social health. The following socio-
cultural change processes are expected:
• Dissimilarity in social practices;
• Alteration in family structure;
• Conflict;
• Safety and crime impacts; and
• A potential change in sense of place.
Conclusions
A preferred route alignment could not be determined during the scoping study as both
alignments affect the same portion of land. Both alignments are also located away from
surrounding residential areas at an average of 500m. In addition, the area is already
characterised by infrastructure of a similar nature, i.e. the existing Verwoerdburg
substation and a number of high voltage transmission power lines. It is therefore, at this
stage, not foreseen that additions to the Verwoerdburg substation or the construction
and operation of the two proposed turn-in and –out lines would yield significant negative
x
impacts to the surrounding social environment. Therefore, no issues emerged that can
be considered as fatal flaws and at this stage there are also not areas of great concern. It
is recommended that a brief SIA be conducted during the next phase to test the
assumptions made in this scoping report in respect of issues such as the expected land
use change, temporary influx of people to the area and the likelihood of the project
impacting on sense of place.
11
1. INTRODUCTION
Eskom has been mandated by the South African Government to provide reliable and
affordable electricity to the country. As generated electricity cannot be stored, the supply
should be used as it is generated, resulting in a stringent supply-demand situation. It is
believed that a reliable electricity supply is vital to support sustainable development in
South Africa.
The Eskom transmission network as it currently stands supply the Tshwane Metropolitan
Municipality area at three points, namely at the Kwagga, Njala and Verwoerdburg
substations. The reserve capacity at each of these access points are reviewed on an
annual basis and the latest results showed that Kwagga’s reserved capacity is 840MVA,
Njala is 650MVA and Verwoerdburg is 200MVA. Meter measurements taken during 2007
indicated that the maximum loading reached 920MVA at Kwagga, 700MVA at Njala and
208MVA at Verwoerdburg.
In addition, the Tshwane Metropolitan Municipality applied to Eskom Transmission and
Distribution for new supply points and a step load increase. These three parties agreed
on the 20-year load forecast for the City of Tshwane and concluded that the Eskom
transmission networks supplying the municipal area needs to be strengthened.
The proposed Tshwane Strengthening Project involves a complex scope of works and for
this reason the project reporting process has been divided as follows:
• Volume 1 (this report): Contains the assessment of the proposed expansion of the
existing Verwoerdburg substation as well as the 2 (two) 400kV loop-in power lines
from the Apollo-Pluto transmission power line to the new expansions at the
Verwoerdburg substation.
• Volume 2: Contains the assessment of the construction and operation of the
proposed new Phoebus substation, extensions at the existing Kwagga substation, as
well as the proposed construction and operation of a new 400kV transmission power
line from the existing Kwagga substation to the new Phoebus substation over a
distance of approximately 30km.
This particular report only focuses on the applications under Volume 1 and details the
results of the Scoping Study as part of the Social Impact Assessment (SIA) specialist
study undertaken by MasterQ Research as part of the overall Environmental Impact
Assessment (EIA) process that is being undertaken by Savannah Environmental. A
separate Social Impact Assessment (SIA) Scoping Report has been compiled for the
Volume 2 applications. In terms of the Volume 1 applications, one (1) site has been
identified for the proposed expansions at the existing Verwoerdburg substation, and two
(2) route alternatives for the proposed 2x 400kV loop in and out power line from the
Apollo-Pluto transmission power line to and from the Verwoerdburg substation.
12
The proposed construction and operation of the expansions at the substation as well as
the loop in and out lines as detailed above will be considered within the EIA studies. In
this instance, the EIA process consists of three phases, namely:
• Environmental Scoping Study (current phase);
• Environmental Impact Assessment; and
• Environmental Management Plan.
The first subsection below gives a definition of a SIA, followed by the objectives of the
study. The third subsection details the approach and methodology that were followed to
meet these objectives. This section is concluded with the assumptions and limitations of
the study.
1.1 Definition of a Social Impact Assessment
Vanclay (2002) defines a social impact assessment as:
“.. the process of analyzing (predicting, evaluating and reflecting) and managing the
intended and unintended consequences on the human environment of planned
interventions (policies, programmes, plans and projects) and any social change processes
invoked by those interventions so as to bring about a more sustainable and equitable
biophysical and human environment.”
In order to do a theoretically sound analysis of social impacts with high levels of
confidence, a thorough baseline assessment and projection is therefore necessary. The
social team made a clear distinction between change processes and impacts. Social
impacts refer to the impacts that are actually experienced by humans on physical and/or
cognitive level. An impact variable is a change process and leads to impacts, e.g. an
increase in population or the presence of strangers are not regarded as impacts, but
rather change processes that lead to impacts such as a change in the perception about
the nature of the community. Vanclay (2002) defines social impacts as:
“The consequences to human populations of any public or private actions (these include
policies, programmes, plans and/or projects) that alter the ways in which people live,
work, play, relate to one another, organise to meet their needs and generally live and
cope as members of society. These impacts are felt at various levels, including individual
level, family or household level, community, organisation or society level. Some social
impacts are felt by the body as physical reality, while other social impacts are perceptual
or emotional.”
Impacts are therefore the difference between the current and future development of the
affected human environment with vis-à-vis without the project.
13
1.2 Objectives of the Study
The overall business objective of the Scoping Phase is to identify issues and concerns in
order to focus the detailed assessment to follow in the EIA Phase, and to provide a
framework within which the assessment is to be undertaken. A number of secondary
objectives have been derived from the overall business objective and includes the
following:
• Gain an understanding of the proposed project, including the nature and timeframe of
the proposed activities;
• Assess the affected local area (settlements and institutions) in terms of:
* Geographic Processes: the land use pattern within the (affected) area;
* Demographic Processes: the number and composition of the local population;
* Economic Processes: the way in which people make a living and the economic
activities within a specific (affected) area;
* Institutional and Empowerment Processes: people’s ability to become
actively involved and influence the decision making process, and also the
efficiency and operation of local authorities and other significant organisations;
and
* Socio-Cultural Processes: the way in which humans interact and relate to
each other within the context of their environment, and how this interaction is
guided by value systems.
• Identify how these processes might change as a result of the proposed project;
• Identify all the potential impacts that may occur as a result of the change processes
brought about by the proposed project;
• Identify key issues and impacts of significance that would have to be addressed
during the EIA phase, which includes the identification of information gaps;
• Identify the alternative for the turn-in/-out power lines that would create change
processes with the least significant impacts, and which would then have to be
assessed in more detail during the EIA phase; and
• Describe the proposed studies for the Impact Assessment Phase that would ultimately
fill the identified information gaps and result in a detailed assessment of the potential
impacts.
The approach and methodology that were followed to fulfil the objectives of the Scoping
Phase are listed in section 1.3 below.
14
1.3 Approach and Methodology
The following procedures were implemented to meet the objectives of the study.
1.3.1 Data Collection
To obtain baseline information on the social conditions characterising the study area on
individual, community, institutional and organisational level in terms of current and
predicted future changes with and without the project, data collection methods took on
the following forms:
• An orientation site visit with the Eskom surveyors on 12 and 13 May 2009;
• A desktop study of Census 2001 and Community Survey 2007 data to determine any
significant social trends in the area;
• A desktop aerial study of the affected area through the use of Google Earth (2007);
• A desktop study of the Integrated Development Plan (IDP) of the affected Local
Municipality (Kungwini); and
• Relevant sections from the Spatial Development Frameworks (SDF) as summarised in
the IDP.
Information that was relevant to the project was identified and assessed from these
sources, and within the context of the pre-construction, construction, operational, and
decommissioning phases of the proposed project.
1.4 Limitations and Assumptions
• This study was carried out with the information available to the specialist at the time
of executing the study, within the available time frames and budget. The sources
consulted are not exhaustive and additional information which might strengthen
arguments or contradict information in this report and/or might exist.
• The specialists did endeavour to take an evidence-based approach in the compilation
of this report and did not intentionally exclude scientific information relevant to the
assessment.
• It was assumed that the motivation for, and the ensuing planning and feasibility
studies of the project were done with integrity, and that the information provided to
date by the project proponent, the independent environmental assessment
practitioner and the public participation consultant was accurate.
• Social sensitive areas have been identified through a desktop study making use of
Google Earth. The areas that have been marked are the social sensitive areas visible
to the social specialists at the time of the study, which are in proximity to the
substation expansion site and the loop-in/-out power line route alternatives. It is
15
possible that more social sensitive areas might be found during the Impact
Assessment Phase.
• The statistics that informed this report were primarily taken from Census 2001 and
the more recent Community Survey 2007 (CS). The comparative analyses of these
sets of data should only be regarded as an indication of broad trends in the area,
because of the South African Statistics Council’s (SASC) concerns about data integrity
in CS. The SASC was concerned about the following regarding CS:
* Institutional population is merely and approximation to 2001 numbers and not
new data;
* Unemployment in the Community Survey is higher and less reliable because of
questions that were asked differently;
* Grants do not match the (SASSA) data and should be interpreted with great
care;
* Income includes unreasonably high income for children – presumably
misinterpretation of the question, listing parents’ income for the child; and
* Distribution of households by province has very little congruence with the
General Household Survey or last census.
• A number of systematic errors were observed in the statistical data, which included:
* An underestimate of men relative to women;
* An underestimate of children younger than 10 years;
* An excess of those aged 85+, in particular among men;
* Missing women aged 20–34 from the Coloured population;
* Misdistribution of the population by province;
* Excess of people aged 10–24 in Western Cape and Gauteng;
* A shortfall of women aged 20–34 in Free State, KwaZulu-Natal and Limpopo.
The SASC states (2008): “In the absence of a comprehensive sampling frame, it is
difficult to determine whether the differences are due to sampling error, biases or the
reality that has changed beyond our expectations. There may be other variables that will
require similar warnings after further interrogation.”
The following section describes the project and study area and then proceeds to address
the objectives of the Scoping Phase.
16
2. PROJECT BACKGROUND
This section briefly assesses the information relevant to the study area and the project.
The first subsection provides a brief description of the proposed project and the route
corridor alternative sites, followed by a general overview of the study (a more detailed
baseline profile of the study area in terms of the identified social processes follows in
Section 3).
This section intends to address the following objective:
• Gain an understanding of the proposed project, including the nature and timeframe of
the proposed activities.
2.1 Project Overview
Eskom is proposing the construction and operation of a number of new substations and
transmission power lines under their City of Tshwane Electricity Supply Plan
Scheme (CTESPS) with the aim to reinforce the existing electricity supply to primarily
the Tshwane municipal area.
Under the CTESPS it is proposed that four new substations be constructed of which three
will be constructed by Eskom Generation and one by the City of Tshwane Metropolitan
Municipality. It is believed that these four new substations would meet Tshwane’s
electricity requirements and at the same time it would alleviate the pressure on the
existing Minerva and Apollo substations.
Phase 1 of the CTESPS includes the following infrastructural developments:
• The construction and operation of one (1) 400kV transmission power line between the
existing Kwagga substation and the new Phoebus substation over a distance of
approximately 30km;
• The construction and operation of the Phoebus substation and extensions at the
existing Kwagga substation; and
• The construction and operation of the Verwoerdburg substation as well as the
construction and operation of two (2) 400kV loop-in/-out power lines from the Apollo-
Pluto transmission power line to the new Verwoerdburg substation.
This report (Volume 1) will focus on the infrastructural developments associated with the
Verwoerdburg developments, which include the construction and operation of expansions
at the Verwoerdburg substation, as well the construction and operation of two 400kV
loop in and out lines from the Apollo-Pluto transmission power line to and from the
Verwoerdburg substation. The infrastructural developments associated with the Kwagga-
Phoebus development have been addressed in Volume 2.
17
2.2 Substation Expansion Site
The Verwoerdburg substation is located to the north-west of Doornkloof. Although this
substation is used to supply electricity to the City of Tshwane, it is located within the
Kungwini Local Municipality of the Metsweding District. The proposed expansions at the
Verwoerdburg substation will take place to the west of and adjacent to the existing
substation. The proposed expansion site in relation to the surrounding study area is
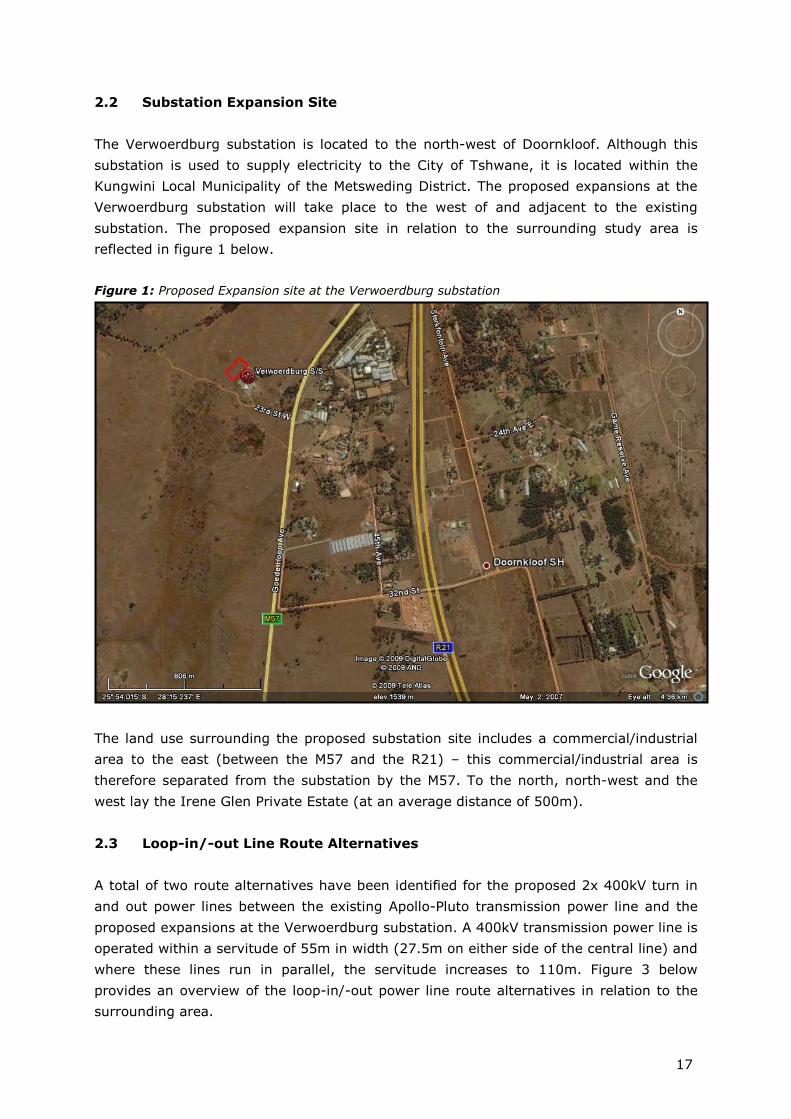
reflected in figure 1 below.
Figure 1: Proposed Expansion site at the Verwoerdburg substation
The land use surrounding the proposed substation site includes a commercial/industrial
area to the east (between the M57 and the R21) – this commercial/industrial area is
therefore separated from the substation by the M57. To the north, north-west and the
west lay the Irene Glen Private Estate (at an average distance of 500m).
2.3 Loop-in/-out Line Route Alternatives
A total of two route alternatives have been identified for the proposed 2x 400kV turn in
and out power lines between the existing Apollo-Pluto transmission power line and the
proposed expansions at the Verwoerdburg substation. A 400kV transmission power line is
operated within a servitude of 55m in width (27.5m on either side of the central line) and
where these lines run in parallel, the servitude increases to 110m. Figure 3 below
provides an overview of the loop-in/-out power line route alternatives in relation to the
surrounding area.
18
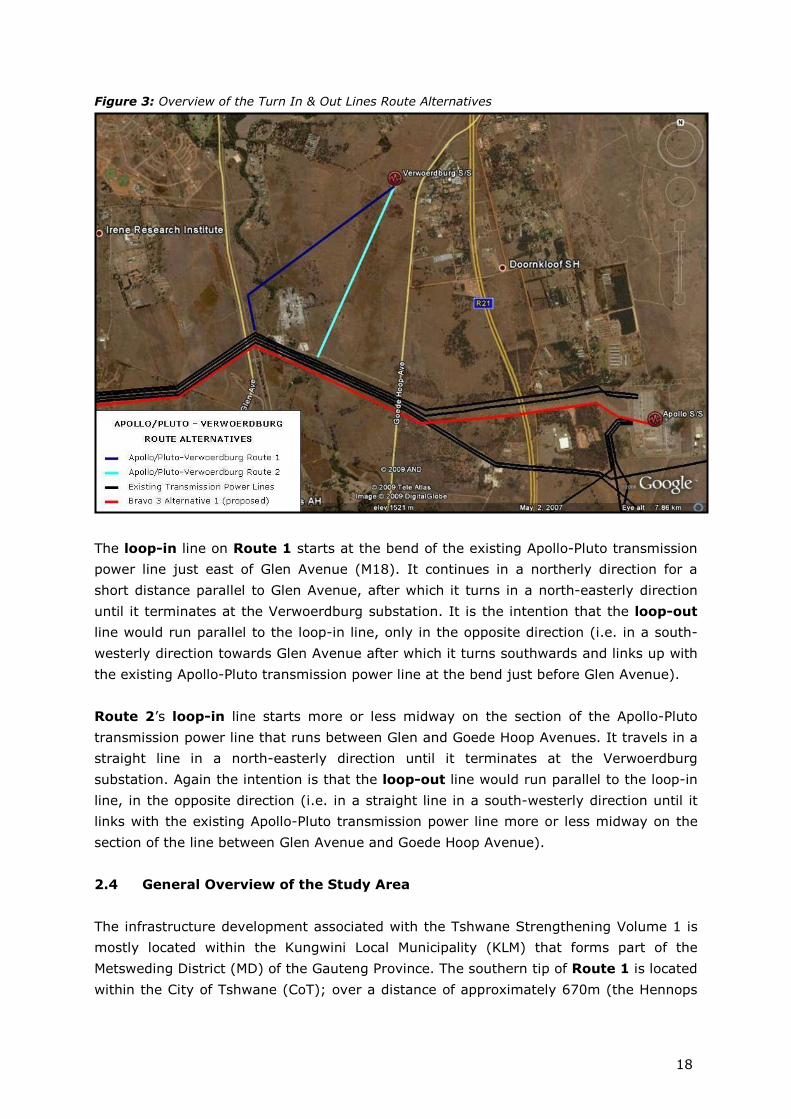
Figure 3: Overview of the Turn In & Out Lines Route Alternatives
The loop-in line on Route 1 starts at the bend of the existing Apollo-Pluto transmission
power line just east of Glen Avenue (M18). It continues in a northerly direction for a
short distance parallel to Glen Avenue, after which it turns in a north-easterly direction
until it terminates at the Verwoerdburg substation. It is the intention that the loop-out
line would run parallel to the loop-in line, only in the opposite direction (i.e. in a south-
westerly direction towards Glen Avenue after which it turns southwards and links up with
the existing Apollo-Pluto transmission power line at the bend just before Glen Avenue).
Route 2’s loop-in line starts more or less midway on the section of the Apollo-Pluto
transmission power line that runs between Glen and Goede Hoop Avenues. It travels in a
straight line in a north-easterly direction until it terminates at the Verwoerdburg
substation. Again the intention is that the loop-out line would run parallel to the loop-in
line, in the opposite direction (i.e. in a straight line in a south-westerly direction until it
links with the existing Apollo-Pluto transmission power line more or less midway on the
section of the line between Glen Avenue and Goede Hoop Avenue).
2.4 General Overview of the Study Area
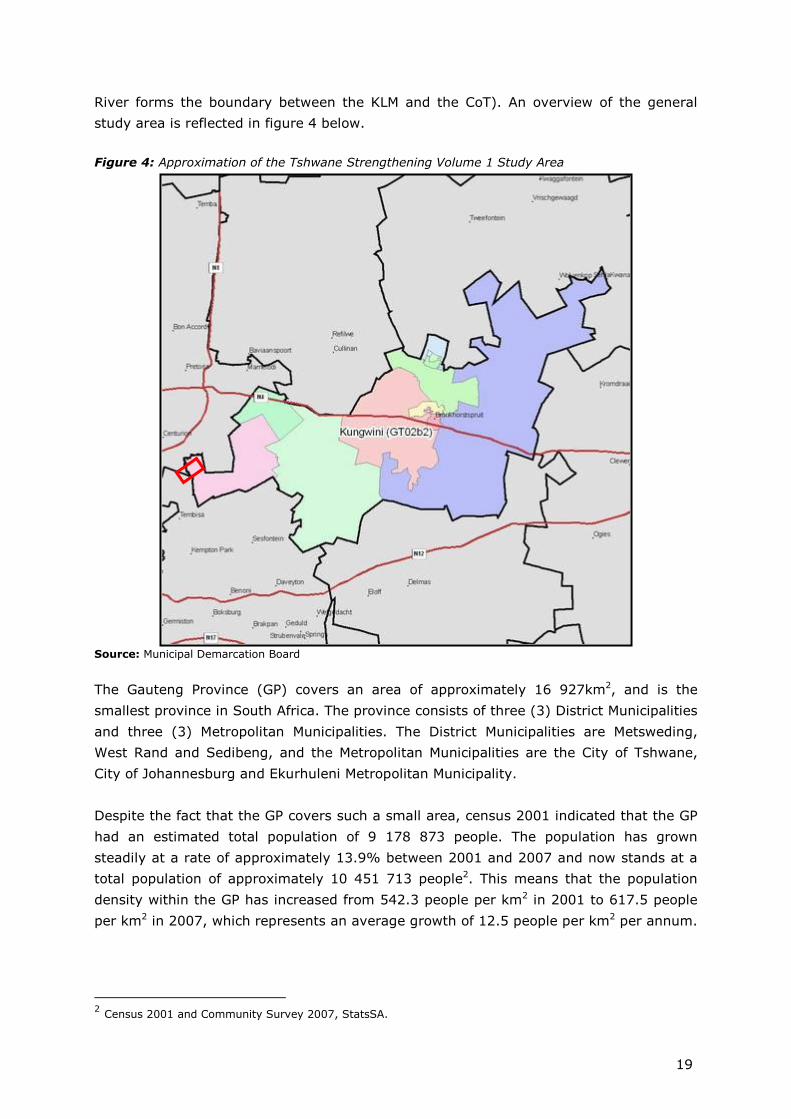
The infrastructure development associated with the Tshwane Strengthening Volume 1 is
mostly located within the Kungwini Local Municipality (KLM) that forms part of the
Metsweding District (MD) of the Gauteng Province. The southern tip of Route 1 is located
within the City of Tshwane (CoT); over a distance of approximately 670m (the Hennops
19
River forms the boundary between the KLM and the CoT). An overview of the general
study area is reflected in figure 4 below.
Figure 4: Approximation of the Tshwane Strengthening Volume 1 Study Area
Source: Municipal Demarcation Board
The Gauteng Province (GP) covers an area of approximately 16 927km2, and is the
smallest province in South Africa. The province consists of three (3) District Municipalities
and three (3) Metropolitan Municipalities. The District Municipalities are Metsweding,
West Rand and Sedibeng, and the Metropolitan Municipalities are the City of Tshwane,
City of Johannesburg and Ekurhuleni Metropolitan Municipality.
Despite the fact that the GP covers such a small area, census 2001 indicated that the GP
had an estimated total population of 9 178 873 people. The population has grown
steadily at a rate of approximately 13.9% between 2001 and 2007 and now stands at a
total population of approximately 10 451 713 people2. This means that the population
density within the GP has increased from 542.3 people per km2 in 2001 to 617.5 people
per km2 in 2007, which represents an average growth of 12.5 people per km2 per annum.
2 Census 2001 and Community Survey 2007, StatsSA.
20
Of all the provinces, Gauteng has a significantly higher population growth rate compared
to the overall South African growth rate, which slowed down to 6.4% since 20013.
An increase in population size and density pose challenges for the integrated
management of the natural, built and human environment. An increase in population will
put pressure on the conservation of the remaining biodiversity, ecosystems and natural
open spaces; the conservation of the cultural and historical heritage buildings, sustaining
open spaces and buildings in an aesthetically pleasing manner based on ecological
principals; and the maintenance of a healthy and safe environment for people which
promote individual and community well-being.
The Gauteng population density is indicative of the fact that the province is by and large
urbanised. According to Statistics South Africa (StatsSA) (2006), the urbanisation level in
Gauteng is estimated at around 96% (based on 2001 census data). In 2007 there were
approximately 3 175 579 households within Gauteng, which represents an increase of
16.1% from 2001’s total of 2 735 168 households. The number of households have
increased (at an average rate of 73 402 households per annum between 2001 and
2007), whilst at the same time the average household size within the province has
decreased by approximately 8.3% from 3.6 persons per household in 2001 to 3.3
persons per household in 2007. However, there are still large numbers of households in
the province living in either informal settlements, or living in “back yards” or traditional
housing, and supplying adequate housing to these people remains a challenge4. It was
estimated that the additional need for housing up to 2014-2015 amounted to 1.9 million
units5.
Migration contributes to the decrease in household size and the increase in household
numbers, as only members of families tend to migrate to cities, as opposed to whole
families. Households already resident in the cities are also splitting. The increase in
households is reason for concern, and the South African Cities Network estimated that by
2015, the GP could become a continuous urban extension, amounting to a population of
almost 15 million people6.
The Gauteng province as a whole has experienced a steady increase in the delivery of
municipal services between the years 2001 to 2007. The number of households that
make use of electricity for cooking, heating and lighting increased on average between 3-
6%, so that by far the majority of households in Gauteng make use of electricity as their
primary source of energy. In terms of other municipal services, such as refuse removal,
sanitation, and water services, again the majority of households in Gauteng enjoy such
services that are on par or above the minimum RDP standard.
3 Community Survey 2007, StatsSA. 4 Gauteng Province Growth and Development Strategy (GPGDS), 2005. 5 Landsberg, C (2005). City Case Study Report: City of Johannesburg.
6 Landsberg, C (2005). City Case Study Report: City of Johannesburg.
21
In terms of racial composition, the predominant population group in Gauteng is
represented by Black Africans (74.6% in 2001, which increased to 75.2% in 2007). This
increase represents a growth of approximately 12 580 additional Black African people per
annum within the province. This is followed by the White population group (19.9% in
2001, which decreased to 18.4% in 2007). It is not clear what lead to the respective
increases and decreases in the different population groups, but in general an increase in
a population size might be ascribed to factors such as urbanisation, a high birth rate and
a low mortality rate and a push/pull factor (e.g. people move away from rural areas in
search of better opportunities within urban areas). A decrease in a population size can
generally be ascribed to a low birth rate and high mortality rate and other factors such as
migration and emigration.
Close on three quarters (70.0%) of the total population within GP falls within the working
age group (which is defined as the ages between 15 and 64). This represents a decrease
of approximately 1.4% in the working age population of 2001. The population is young
(30.1% falls in the 20-34 age group) which has implications for housing needs. The
majority of this age group is unable to afford high cost housing, and do not necessarily
have jobs mainly due to lack of skills, education and job opportunities.
Gauteng is generally perceived as the ‘economic hub’ of South Africa. According to the
Gauteng Provincial Growth and Development Strategy 2005 (GPGDS), the Gauteng
Province account for 33% of South Africa’s Gross Domestic Product (GDP) and is the
largest sub-national African economy. Gauteng is also responsible for 49.6% of all
employee remuneration in the country and 52% of all turn-over of institutions. However,
the GPGDS (2005) states that there is an ever-increasing divide between the rich and
poor in the Province. The opportunities created to engage meaningfully in the economic
activities and growth of the Province have largely benefited those sectors of the society
that are generally financially secure and stable and who have the necessary skills, means
and resources to participate in the economy. There are still high levels of unemployment
with a resultant high level of poverty evident in the Province7. In this regard the GPGDS
(2005) lists basic literacy education of the segment of the population who has had no
education as one of the key issues that the province has to address. A rising in education
levels will contribute towards an increase in employment rates and a decrease in poverty
levels.
The Metsweding District Municipality (MDM) borders on the City of Tshwane Metropolitan
Municipality and is located some 45km east of the Pretoria CBD. To the north lies the
Waterberg District Municipality of the Limpopo Province, the Nkangala District
Municipality to the east, and the Ekurhuleni Metropolitan Municipality to the southwest.
The MDM consists of 2 local municipalities, namely the Nokeng Tsa Taemane and
Kungwini Local Municipalities. Of these two local municipalities, only the Kungwini Local
Municipality is relevant to the study area.
7 Gauteng Provincial Government, http://www.gpg.gov.za/docs/misc/gds/chap2.pdf
22
The MDM is located within the GP and covers an area of 4 063km2 and in 2001 had a
total population of 160 740 people at a population density of approximately 40 people
per km2. The total population decreased by 7 381 people over the 6 year period between
2001 and 2007 so that, according to Community Survey 2007, the total population stood
at 153 539 people in 2007. This means that the population density also decreased to
approximately 37.8 people per km2. The male population is slightly larger than the
female population, where, in 2007, 51.3% of the population was male. The predominant
population group is Black African (77.9%) followed by White (19.8%).
The baseline profiles for the local municipal areas have been discussed in detail in the
various subsections under Section 3.
23
3. CHANGE PROCESSES AND POTENTIAL IMPACTS
In order to address the overall objective of this study, it was necessary to compile a
detailed description of the study area. Each subsection first presents the baseline profile
(status quo) of the receiving environment in terms of the various social processes (i.e.
geographical, demographical, economical, institutional/empowerment, and socio-
cultural). It is believed that the baseline profile would be maintained to a large extent
(not taking into account variables outside of the project) in the event that a ‘no go’
option was implemented. Each subsection concludes with a table summarising how the
project is likely to change these baseline profiles, and the related impacts that could be
expected as a result of the project. This is followed by suggestions on how the
assessment of the potential impacts should be undertaken within the EIA Phase.
This section intends to address the following objectives:
• Assess the affected local area (settlements and institutions) in terms of:
* Geographic Processes: the land use pattern within the (affected) area;
* Demographic Processes: the number and composition of the local
population;
* Economic Processes: the way in which people make a living and the economic
activities within a specific (affected) area;
* Institutional and Empowerment Processes: people’s ability to become
actively involved and influence the decision making process, and also the
efficiency and operation of local authorities and other significant organisations;
and
* Socio-Cultural Processes: the way in which humans interact and relate to
each other within the context of their environment, and how this interaction is
guided by value systems.
• Identify how these processes might change as a result of the proposed project;
• Identify all the potential impacts that may occur as a result of the change processes
brought about by the proposed project;
• Identify key issues and impacts of significance that would have to be addressed
during the EIA phase, which includes the identification of information gaps;
• Identify the alternative route corridor(s) that would create change processes with
the least significant impacts, and which would then have to be assessed in more
detail during the EIA phase; and
• Describe the proposed studies for the Impact Assessment Phase that would
ultimately address the identified information gaps and result in a detailed
assessment of the potential impacts.
For the purposes of this scoping study the impact variables were categorised in terms of
change processes, as previously mentioned. A change process can be defined as
change that takes place within the receiving environment as a result of a direct or
indirect intervention. A potential impact follows as a result of the change process.
24
However, a change process can only result in an impact once it is experienced as such by
an individual/community on a physical and/or cognitive level.
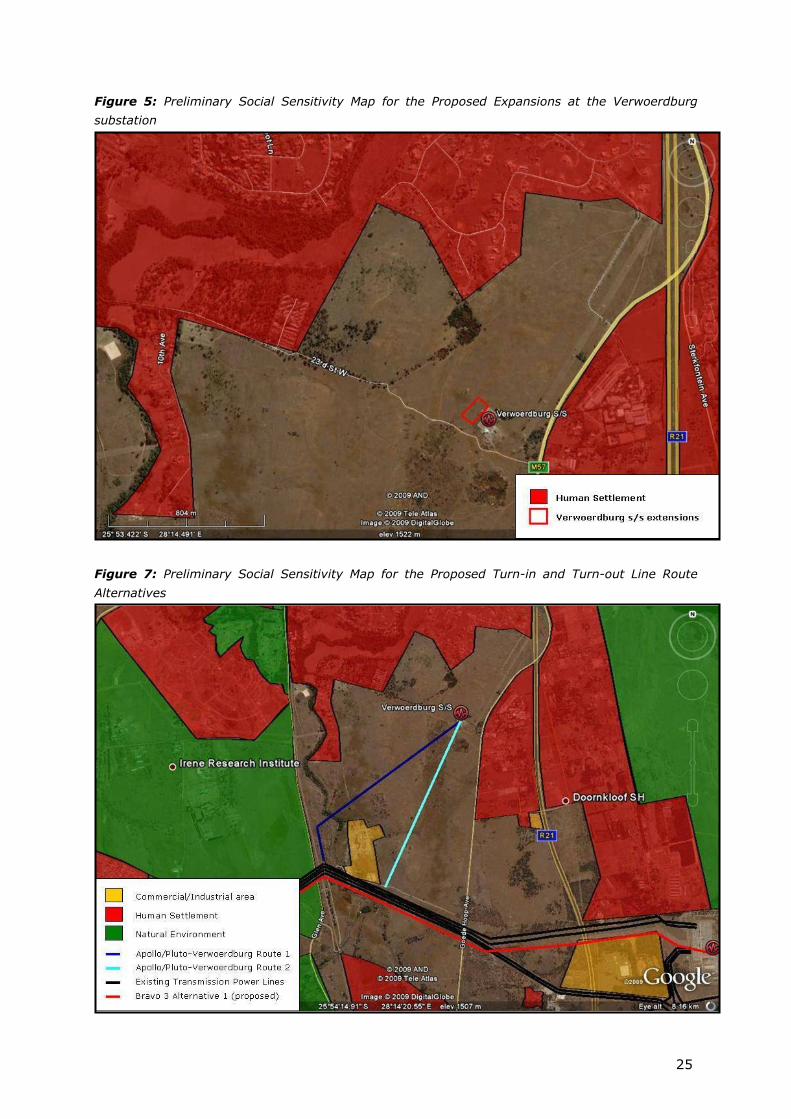
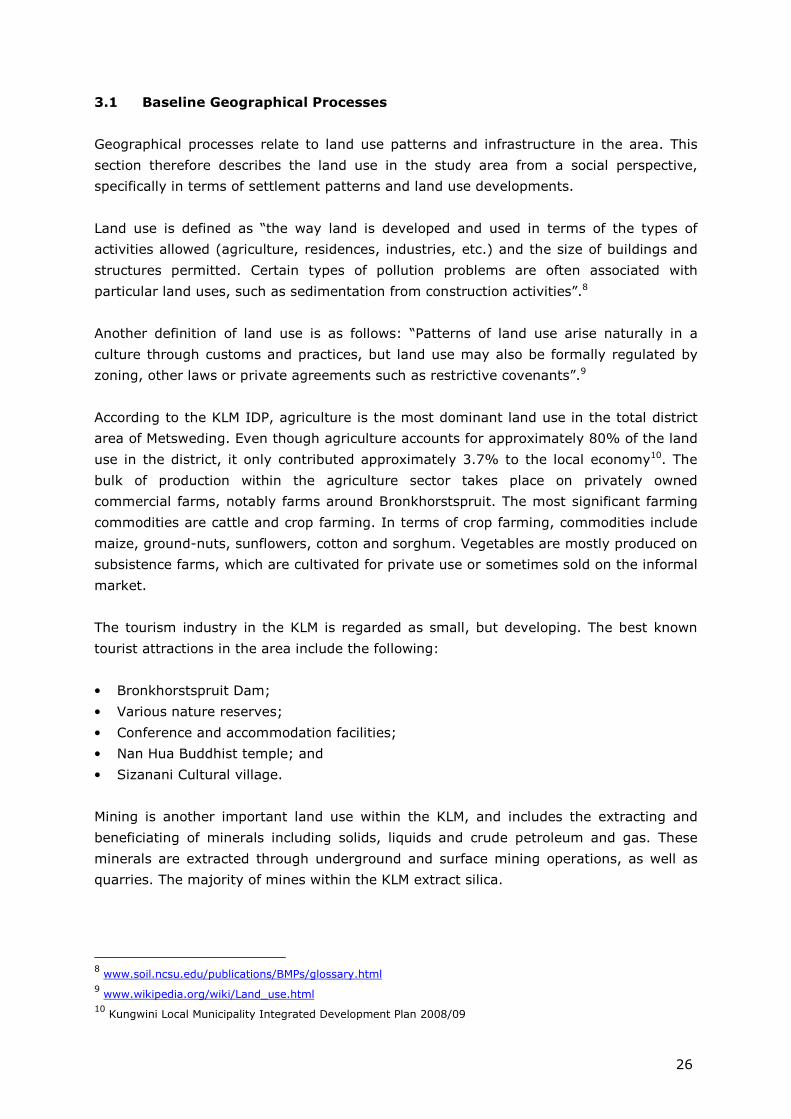
Figure 5 below provides an overview of the preliminary social sensitivity of the
Verwoerdburg substation site in relation to the surrounding area, whereas Figure 6
depicts a general overview of the preliminary social sensitivity of the proposed loop-in
and loop-out line route alternatives in relation to the surrounding areas. The social
sensitivity maps was developed based on a desktop study through the use of Google
Earth, where the social specialist endeavoured to identify social sensitive areas such as
residential areas (human settlement), commercial/industrial areas and nature reserves.
However, it should be noted that these were the areas visible to the social specialist at
the time of the study and therefore it is entirely possible that more areas of a social
sensitive nature might be found during the Impact Assessment phase.
Following on the respective social sensitivity maps, the various subsections discuss the
respective change processes and the potential impacts that could be experienced by the
receiving environment as a result of the construction and operation of the proposed
substation as well as the loop-in/out power lines. The categories of processes are as
follows:
• Demographic Processes: the number and composition of the local population;
• Geographic Processes: the land use pattern within the (affected) area;
• Economic Processes: the way in which people make a living and the economic
activities within a specific (affected) area;
• Institutional and Empowerment Processes: people’s ability to become actively
involved and influence the decision making process, and also the efficiency and
operation of local authorities and other significant organisations); and
• Socio-Cultural Processes: the way in which humans interact and relate to each
other within the context of their environment, and how this interaction is guided by
value systems.
Please note: Due to the fact that only a small portion of the Apollo/Pluto-
Verwoerdburg turn-in and –out lines fall within the City of Tshwane (CoT), a
baseline profile of the CoT has not been included in this report. This report
therefore focuses on the Kungwini Local Municipality. For a baseline profile of
the CoT, please refer to Volume 2.
25
Figure 5: Preliminary Social Sensitivity Map for the Proposed Expansions at the Verwoerdburg
substation
Figure 7: Preliminary Social Sensitivity Map for the Proposed Turn-in and Turn-out Line Route
Alternatives
26
3.1 Baseline Geographical Processes
Geographical processes relate to land use patterns and infrastructure in the area. This
section therefore describes the land use in the study area from a social perspective,
specifically in terms of settlement patterns and land use developments.
Land use is defined as “the way land is developed and used in terms of the types of
activities allowed (agriculture, residences, industries, etc.) and the size of buildings and
structures permitted. Certain types of pollution problems are often associated with
particular land uses, such as sedimentation from construction activities”.8
Another definition of land use is as follows: “Patterns of land use arise naturally in a
culture through customs and practices, but land use may also be formally regulated by
zoning, other laws or private agreements such as restrictive covenants”.9
According to the KLM IDP, agriculture is the most dominant land use in the total district
area of Metsweding. Even though agriculture accounts for approximately 80% of the land
use in the district, it only contributed approximately 3.7% to the local economy10. The
bulk of production within the agriculture sector takes place on privately owned
commercial farms, notably farms around Bronkhorstspruit. The most significant farming
commodities are cattle and crop farming. In terms of crop farming, commodities include
maize, ground-nuts, sunflowers, cotton and sorghum. Vegetables are mostly produced on
subsistence farms, which are cultivated for private use or sometimes sold on the informal
market.
The tourism industry in the KLM is regarded as small, but developing. The best known
tourist attractions in the area include the following:
• Bronkhorstspruit Dam;
• Various nature reserves;
• Conference and accommodation facilities;
• Nan Hua Buddhist temple; and
• Sizanani Cultural village.
Mining is another important land use within the KLM, and includes the extracting and
beneficiating of minerals including solids, liquids and crude petroleum and gas. These
minerals are extracted through underground and surface mining operations, as well as
quarries. The majority of mines within the KLM extract silica.
8 www.soil.ncsu.edu/publications/BMPs/glossary.html
9 www.wikipedia.org/wiki/Land_use.html 10 Kungwini Local Municipality Integrated Development Plan 2008/09
27
According to the KLM IDP, there is a total of 23 informal settlements within the KLM,
ranging in size from as small as 9 shacks to as large as 4 000 shacks per settlement.
3.2 Geographical Change Processes
Geographical change processes refer to land use change as a result of the actual or
perceived changes in land use, whether it be on a temporary or permanent basis. The
proposed expansion at the substation and the construction and operation of the proposed
loop-in/-out power line might lead to a change in the land use within the local area. The
assessment of a land use change process from a social perspective takes into account
how the proposed transmission power lines might affect the behaviour/lives of land
owners and/or land users.
3.2.1 Potential Impacts
Table 1 below provides an overview of the expected change processes as well as the
expected impacts that might occur as a result of the change processes taking place.
These potential impacts will be assessed in detail during the Impact Assessment phase.
28
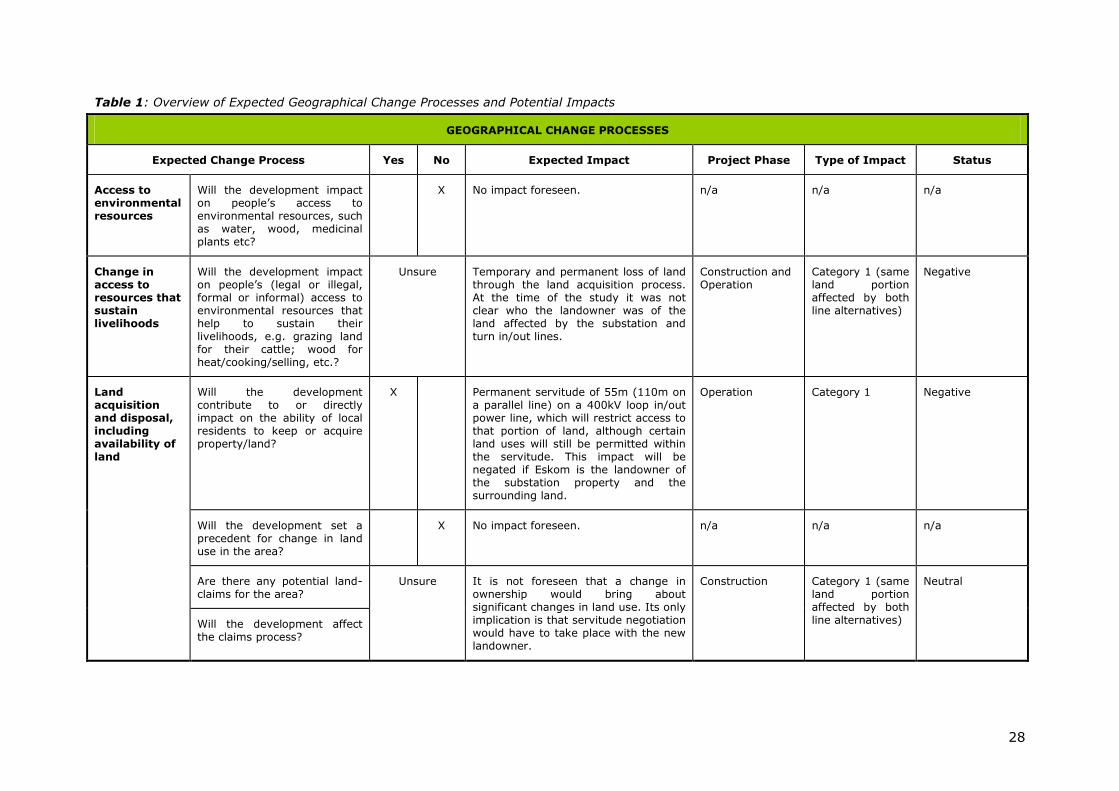
Table 1: Overview of Expected Geographical Change Processes and Potential Impacts
GEOGRAPHICAL CHANGE PROCESSES
Expected Change Process Yes No Expected Impact Project Phase Type of Impact Status
Access to environmental resources
Will the development impact on people’s access to environmental resources, such as water, wood, medicinal plants etc?
X No impact foreseen. n/a n/a n/a
Change in access to resources that sustain livelihoods
Will the development impact on people’s (legal or illegal, formal or informal) access to environmental resources that help to sustain their livelihoods, e.g. grazing land for their cattle; wood for heat/cooking/selling, etc.?
Unsure Temporary and permanent loss of land through the land acquisition process. At the time of the study it was not clear who the landowner was of the land affected by the substation and turn in/out lines.
Construction and Operation
Category 1 (same land portion affected by both line alternatives)
Negative
Land acquisition and disposal, including availability of land
Will the development contribute to or directly impact on the ability of local residents to keep or acquire property/land?
X Permanent servitude of 55m (110m on a parallel line) on a 400kV loop in/out power line, which will restrict access to that portion of land, although certain land uses will still be permitted within the servitude. This impact will be negated if Eskom is the landowner of the substation property and the surrounding land.
Operation Category 1 Negative
Will the development set a precedent for change in land use in the area?
X No impact foreseen. n/a n/a n/a
Are there any potential land-claims for the area?
Unsure It is not foreseen that a change in ownership would bring about significant changes in land use. Its only implication is that servitude negotiation would have to take place with the new landowner.
Construction Category 1 (same land portion affected by both line alternatives)
Neutral
Will the development affect the claims process?
29
3.2.2 Information Gaps
To fully assess the potential impacts as a result of geographical change processes, more
information is needed on the following aspects:
• Who the landowner is for the substation site as well as the surrounding land that will
be affected by the turn in/out line;
• The size and number of expected construction and operational vehicles as well as
which route(s) will be used to gain access to the various construction sites;
• Planned developments for the study area; and
• Whether or not any land claims exist on any of the land along the route alternatives.
3.3 Baseline Demographical Processes
Demographical processes relate to the number of people and the composition of a
community and include an overview of the population size, the race, age, gender and
educational profile of a population as well as household compositions.
Unless otherwise stated, the baseline social profile was compiled based on data obtained
from Census 2001 and the Community Survey (CS) 2007. It is important for readers to
note that CS data does not replace Census data, but that the CS is merely an attempt to
adjust measurements to a best estimate. In this regard, Statistics South Africa has
stated the following: “Any adjustment done [in CS 2007] has maintained the profiling of
the community in terms of the people and households while compensating and correcting
the undercounted bias by different projections on national, provincial and municipalities
level.”11 Therefore, please bear in mind that the following data should only be viewed as
indicative of the broad demographical trends within the area and not as a rigid
representation of the area.
3.3.1 Population
The KLM covers an area of approximately 2 202km2 and in 2007 had a total population of
104 150 people. Compared to the population size of 2001, when the population stood at
approximately 160 752 people, this means that the population size within the KLM
decreased at an average rate of 9 434 people per annum or a total of 56 602 over the 6-
year period between 2001 and 2007. This population decrease also brought about a
change in the population density in the area from 73.0 persons per km2 in 2001 to 47.3
persons per km2 in 2007.
11 Statistics South Africa: Community Survey 2007: Key Municipal Data: ix.
30
3.3.2 Race, Age and Gender
The predominant population groups in the KLM remained the same between 2001 and
2007 and are therefore still Black African (84.0%), followed by White (14.1%). The
female population group is slightly bigger than that of their male counterparts at 51.2%.
Two thirds (66.2%) of the total population of the KLM fall within the working age
category, which is defined by Statistics South Africa as the ages between 15 and 64.
3.3.3 Households
A household is defined as: “One or more people occupying a housing unit as their usual
place of residence. The occupants may be a single family, one person living alone, two or
more families living together, or any other group of related or unrelated people who
share living arrangements”.12
In 2001, the KLM had a total of 50 427 households which steadily decreased at a rate of
3 127 households per annum to a total of 31 666 households in 2007, at an average of
3.3 persons per household.
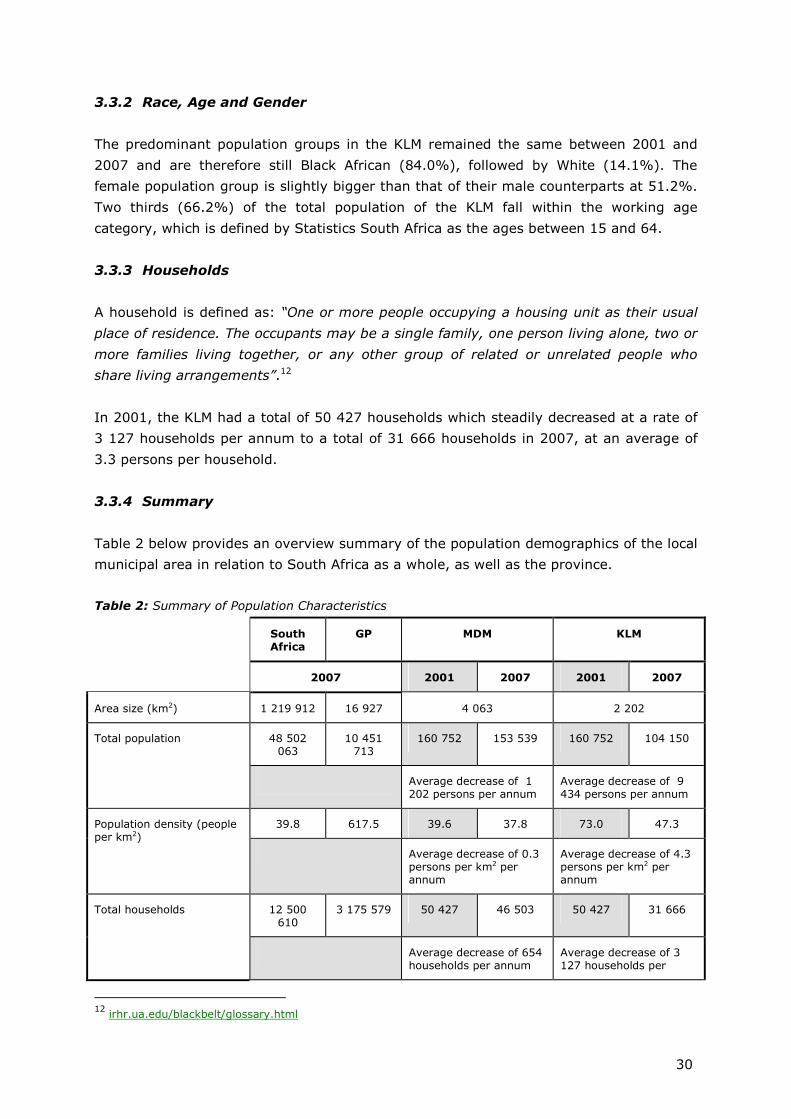
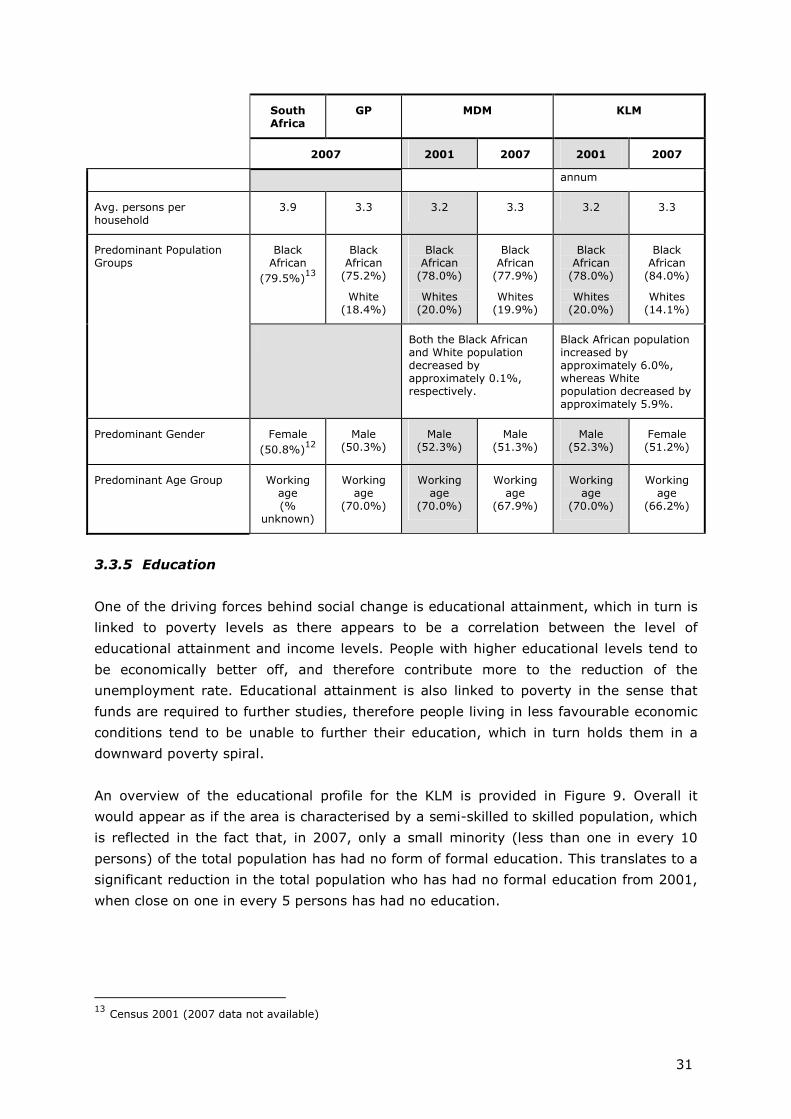
3.3.4 Summary
Table 2 below provides an overview summary of the population demographics of the local
municipal area in relation to South Africa as a whole, as well as the province.
Table 2: Summary of Population Characteristics
South Africa
GP MDM KLM
2007 2001 2007 2001 2007
Area size (km2) 1 219 912 16 927 4 063 2 202
Total population 48 502 063
10 451 713
160 752 153 539 160 752 104 150
Average decrease of 1 202 persons per annum
Average decrease of 9 434 persons per annum
Population density (people per km2)
39.8 617.5 39.6 37.8 73.0 47.3
Average decrease of 0.3 persons per km2 per annum
Average decrease of 4.3 persons per km2 per annum
Total households 12 500 610
3 175 579 50 427 46 503 50 427 31 666
Average decrease of 654 households per annum
Average decrease of 3 127 households per
12 irhr.ua.edu/blackbelt/glossary.html
31
South Africa
GP MDM KLM
2007 2001 2007 2001 2007
annum
Avg. persons per household
3.9 3.3 3.2 3.3 3.2 3.3
Predominant Population Groups
Black African
(79.5%)13
Black African
(75.2%)
White (18.4%)
Black African
(78.0%)
Whites (20.0%)
Black African
(77.9%)
Whites (19.9%)
Black African
(78.0%)
Whites (20.0%)
Black African
(84.0%)
Whites (14.1%)
Both the Black African and White population decreased by approximately 0.1%, respectively.
Black African population increased by approximately 6.0%, whereas White population decreased by approximately 5.9%.
Predominant Gender Female
(50.8%)12
Male (50.3%)
Male (52.3%)
Male (51.3%)
Male (52.3%)
Female (51.2%)
Predominant Age Group Working age (%
unknown)
Working age
(70.0%)
Working age
(70.0%)
Working age
(67.9%)
Working age
(70.0%)
Working age
(66.2%)
3.3.5 Education
One of the driving forces behind social change is educational attainment, which in turn is
linked to poverty levels as there appears to be a correlation between the level of
educational attainment and income levels. People with higher educational levels tend to
be economically better off, and therefore contribute more to the reduction of the
unemployment rate. Educational attainment is also linked to poverty in the sense that
funds are required to further studies, therefore people living in less favourable economic
conditions tend to be unable to further their education, which in turn holds them in a
downward poverty spiral.
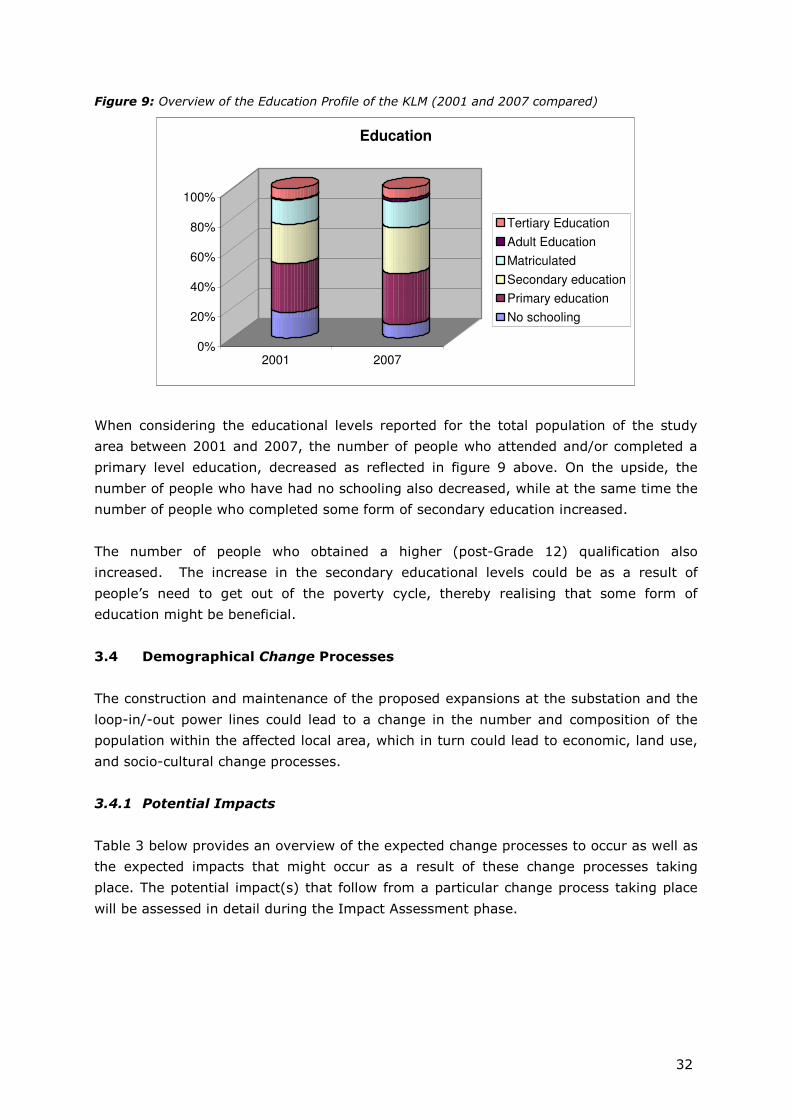
An overview of the educational profile for the KLM is provided in Figure 9. Overall it
would appear as if the area is characterised by a semi-skilled to skilled population, which
is reflected in the fact that, in 2007, only a small minority (less than one in every 10
persons) of the total population has had no form of formal education. This translates to a
significant reduction in the total population who has had no formal education from 2001,
when close on one in every 5 persons has had no education.
13 Census 2001 (2007 data not available)
32
Figure 9: Overview of the Education Profile of the KLM (2001 and 2007 compared)
0%
20%
40%
60%
80%
100%
2001 2007
Education
Tertiary Education
Adult Education
Matriculated
Secondary education
Primary education
No schooling
When considering the educational levels reported for the total population of the study
area between 2001 and 2007, the number of people who attended and/or completed a
primary level education, decreased as reflected in figure 9 above. On the upside, the
number of people who have had no schooling also decreased, while at the same time the
number of people who completed some form of secondary education increased.
The number of people who obtained a higher (post-Grade 12) qualification also
increased. The increase in the secondary educational levels could be as a result of
people’s need to get out of the poverty cycle, thereby realising that some form of
education might be beneficial.
3.4 Demographical Change Processes
The construction and maintenance of the proposed expansions at the substation and the
loop-in/-out power lines could lead to a change in the number and composition of the
population within the affected local area, which in turn could lead to economic, land use,
and socio-cultural change processes.
3.4.1 Potential Impacts
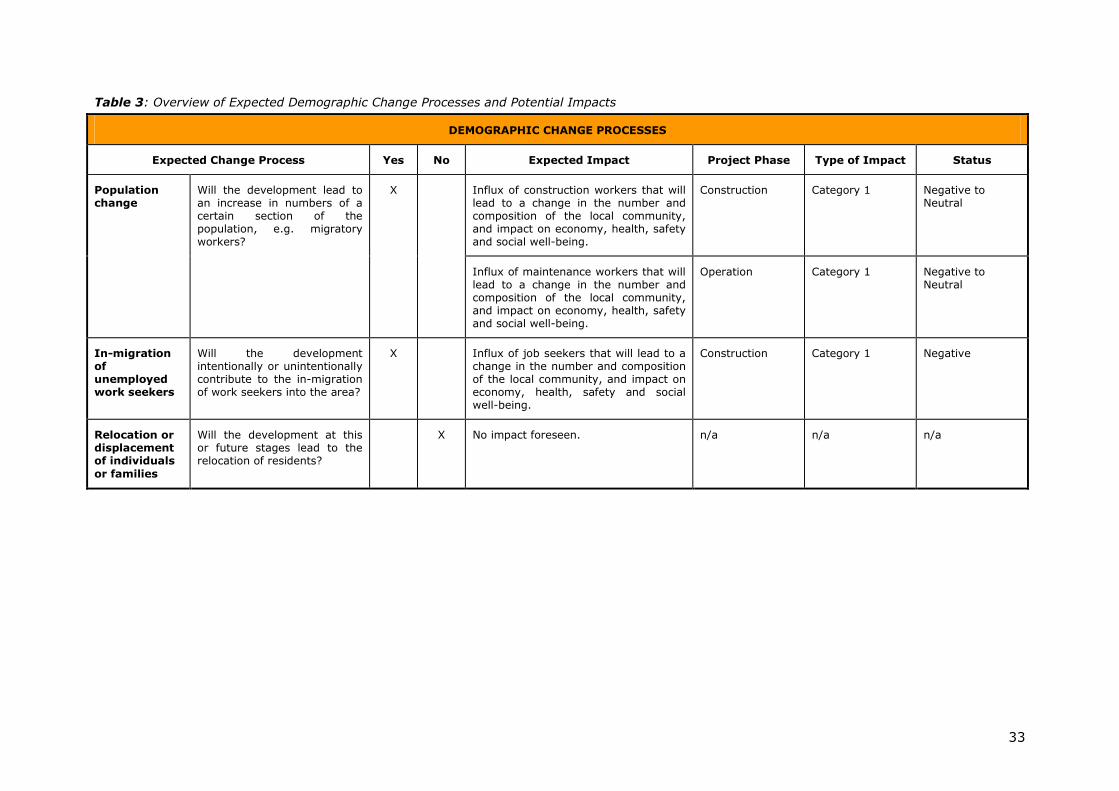
Table 3 below provides an overview of the expected change processes to occur as well as
the expected impacts that might occur as a result of these change processes taking
place. The potential impact(s) that follow from a particular change process taking place
will be assessed in detail during the Impact Assessment phase.
33
Table 3: Overview of Expected Demographic Change Processes and Potential Impacts
DEMOGRAPHIC CHANGE PROCESSES
Expected Change Process Yes No Expected Impact Project Phase Type of Impact Status
Population change
Will the development lead to an increase in numbers of a certain section of the population, e.g. migratory workers?
X
Influx of construction workers that will lead to a change in the number and composition of the local community, and impact on economy, health, safety and social well-being.
Construction Category 1 Negative to Neutral
Influx of maintenance workers that will lead to a change in the number and composition of the local community, and impact on economy, health, safety and social well-being.
Operation Category 1 Negative to Neutral
In-migration of unemployed work seekers
Will the development intentionally or unintentionally contribute to the in-migration of work seekers into the area?
X
Influx of job seekers that will lead to a change in the number and composition of the local community, and impact on economy, health, safety and social well-being.
Construction Category 1 Negative
Relocation or displacement of individuals
or families
Will the development at this or future stages lead to the relocation of residents?
X No impact foreseen. n/a n/a n/a
34
3.4.2 Information Gaps
To fully assess the potential impacts as a result of demographical change processes,
more information is needed on the following aspects:
• The expected population growth within the study area as a result of the HIV infection
rate;
• The construction processes and associated timeframes;
• The composition of the construction workforces in terms of size, skills levels, and
origin;
• The composition of the maintenance workforce and their activities;
• The number of local employment opportunities; and
• The expectations of the local communities in terms of employment opportunities.
3.5 Baseline Economical Processes
Economical processes relate to the way in which people make a living and the economic
activities within that society. The employment status within any given area gives an
indication of the economic stability of such an area and also serves as an indicator of
such an area’s general well-being.
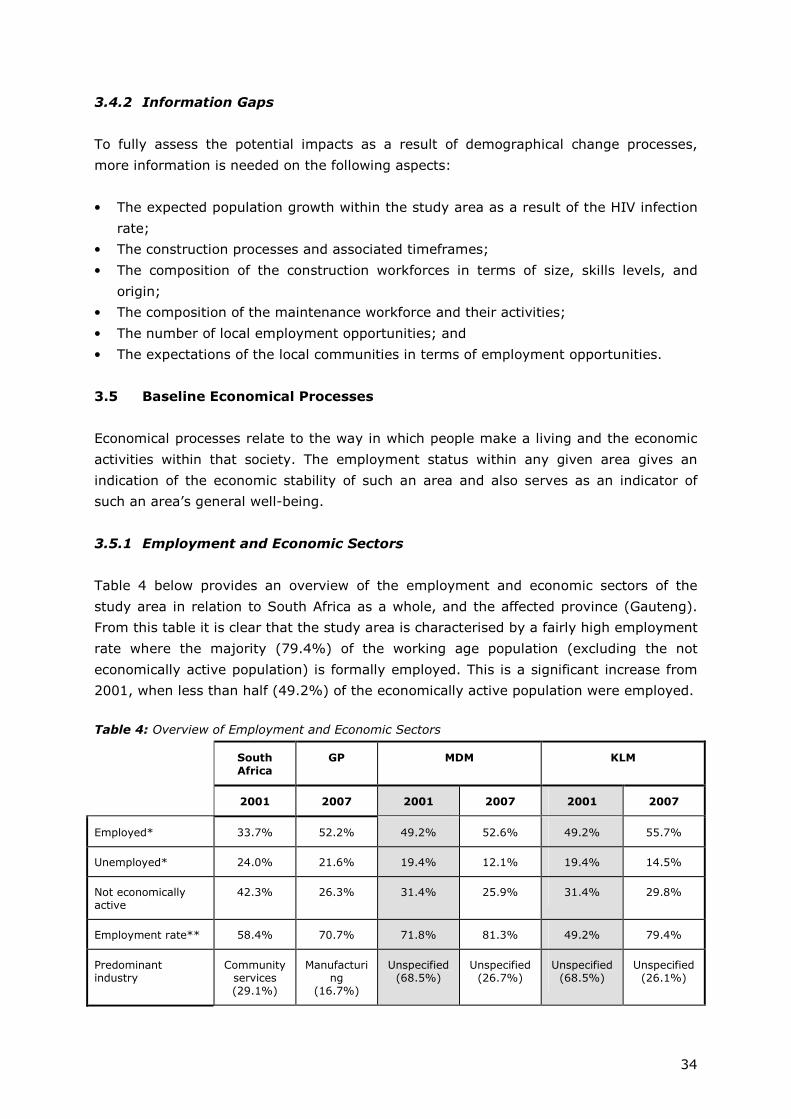
3.5.1 Employment and Economic Sectors
Table 4 below provides an overview of the employment and economic sectors of the
study area in relation to South Africa as a whole, and the affected province (Gauteng).
From this table it is clear that the study area is characterised by a fairly high employment
rate where the majority (79.4%) of the working age population (excluding the not
economically active population) is formally employed. This is a significant increase from
2001, when less than half (49.2%) of the economically active population were employed.
Table 4: Overview of Employment and Economic Sectors
South
Africa
GP MDM KLM
2001 2007 2001 2007 2001 2007
Employed* 33.7% 52.2% 49.2% 52.6% 49.2% 55.7%
Unemployed* 24.0% 21.6% 19.4% 12.1% 19.4% 14.5%
Not economically active
42.3% 26.3% 31.4% 25.9% 31.4% 29.8%
Employment rate** 58.4% 70.7% 71.8% 81.3% 49.2% 79.4%
Predominant industry
Community services (29.1%)
Manufacturing
(16.7%)
Unspecified (68.5%)
Unspecified (26.7%)
Unspecified (68.5%)
Unspecified (26.1%)
35
* This is the percentage employed/unemployed of the entire working age population and should not be read as
the unemployment rate, i.e. the not economically active population is included in this segment.
** In order to reflect a more accurate employment rate, the not economically active population has been
excluded from this segment.
Overall it would therefore appear as if the economy of the study area is growing at a
steady pace. As economic industries are growing, more employment opportunities are
created thereby further reducing the unemployment rate, creating sources of income
which in turn leads to the creation of other opportunities such as further education, a
need for housing (which in turn creates further employment opportunities, both directly
and indirectly), etc.
Despite the creation of job opportunities, there is a widening wage gap between the
higher income groups and lower income groups. It is therefore crucial for an economy to
grow at a pace faster than the rate at which the population is growing so that there will
be more resources available for each person. In addition, it creates new jobs at a rate
that will significantly reduce unemployment over time. Permanent employment in the
formal sector is probably the most important factor for sustainable improvement in the
standard of living, given the benefits associated with a permanent formal job.
3.5.2 Household and Personal Income
In 2001, more or less one in every 7 households in the KLM had no annual household
income. In addition, close on half (48.9%) of the households in Kungwini lived below the
acceptable minimum standard, which is nationally defined as an annual household
income of at least R20 000 per annum.
Unfortunately Community Survey 2007 did not include data on household incomes and
therefore this report also includes an overview on personal income (which was covered in
CS 2007) in an attempt to provide an overview of the baseline economic conditions of
individuals in the area.
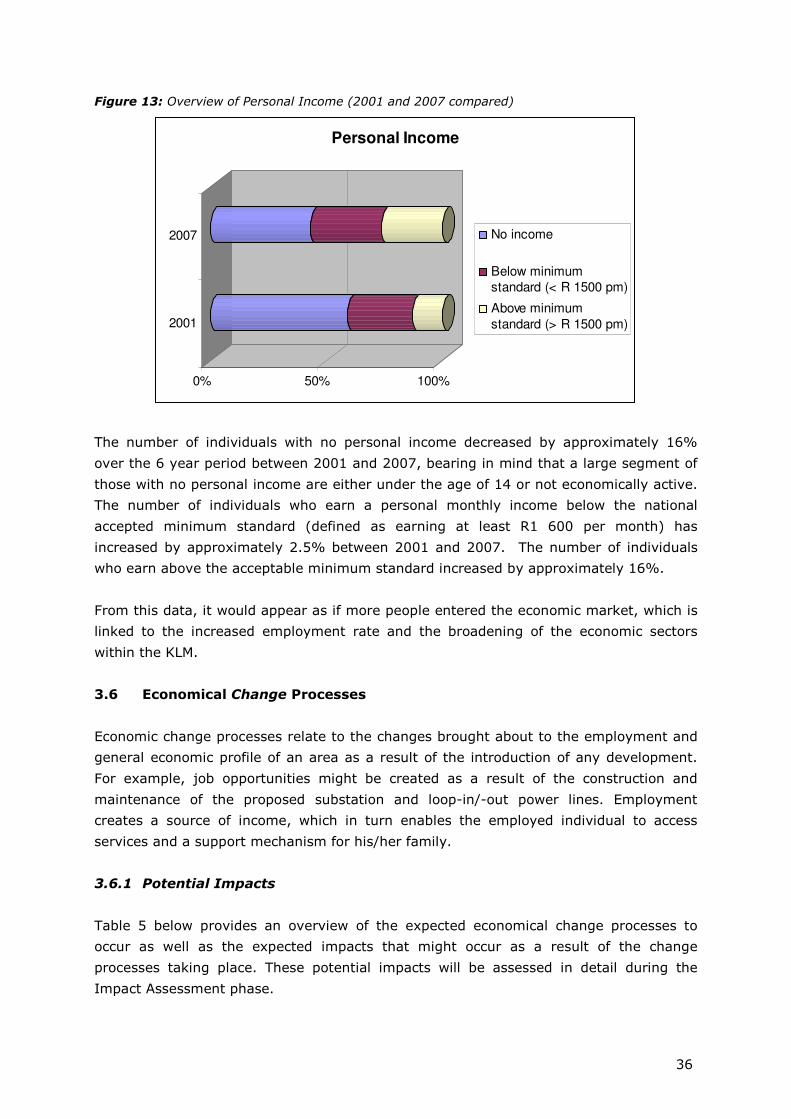
The graph below (Figure 13) provides a comparative overview of the personal income
levels of individuals within the working age category (15-65) in the study area between
2001 and 2007. However, it should be noted that the ‘no income’ category also includes
persons from the ‘not economically active’ population, who are therefore not only
unemployed, but who are also not actively seeking employment and therefore also would
not earn an income.
36
Figure 13: Overview of Personal Income (2001 and 2007 compared)
0% 50% 100%
2001
2007
Personal Income
No income
Below minimum
standard (< R 1500 pm)
Above minimum
standard (> R 1500 pm)
The number of individuals with no personal income decreased by approximately 16%
over the 6 year period between 2001 and 2007, bearing in mind that a large segment of
those with no personal income are either under the age of 14 or not economically active.
The number of individuals who earn a personal monthly income below the national
accepted minimum standard (defined as earning at least R1 600 per month) has
increased by approximately 2.5% between 2001 and 2007. The number of individuals
who earn above the acceptable minimum standard increased by approximately 16%.
From this data, it would appear as if more people entered the economic market, which is
linked to the increased employment rate and the broadening of the economic sectors
within the KLM.
3.6 Economical Change Processes
Economic change processes relate to the changes brought about to the employment and
general economic profile of an area as a result of the introduction of any development.
For example, job opportunities might be created as a result of the construction and
maintenance of the proposed substation and loop-in/-out power lines. Employment
creates a source of income, which in turn enables the employed individual to access
services and a support mechanism for his/her family.
3.6.1 Potential Impacts
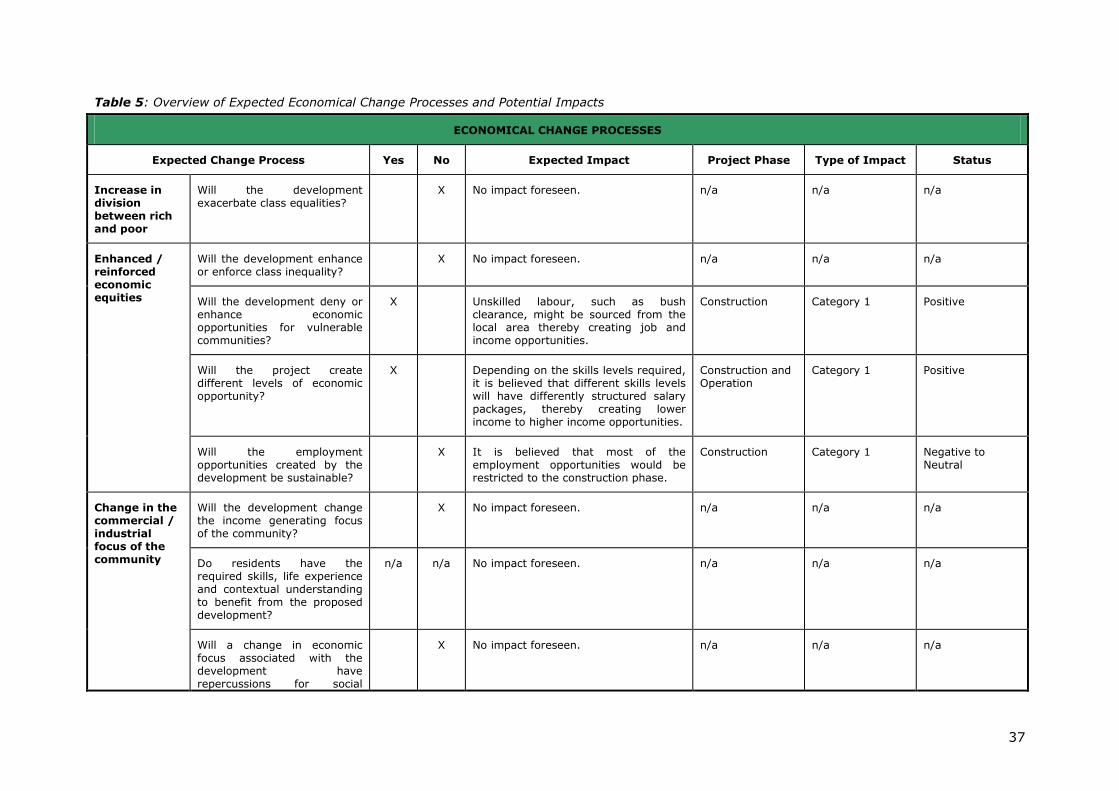
Table 5 below provides an overview of the expected economical change processes to
occur as well as the expected impacts that might occur as a result of the change
processes taking place. These potential impacts will be assessed in detail during the
Impact Assessment phase.
37
Table 5: Overview of Expected Economical Change Processes and Potential Impacts
ECONOMICAL CHANGE PROCESSES
Expected Change Process Yes No Expected Impact Project Phase Type of Impact Status
Increase in division between rich and poor
Will the development exacerbate class equalities?
X No impact foreseen. n/a n/a n/a
Enhanced / reinforced economic equities
Will the development enhance or enforce class inequality?
X No impact foreseen. n/a n/a n/a
Will the development deny or enhance economic opportunities for vulnerable communities?
X Unskilled labour, such as bush clearance, might be sourced from the local area thereby creating job and income opportunities.
Construction Category 1 Positive
Will the project create different levels of economic opportunity?
X Depending on the skills levels required, it is believed that different skills levels will have differently structured salary packages, thereby creating lower income to higher income opportunities.
Construction and Operation
Category 1 Positive
Will the employment opportunities created by the development be sustainable?
X It is believed that most of the employment opportunities would be restricted to the construction phase.
Construction Category 1 Negative to Neutral
Change in the commercial / industrial focus of the community
Will the development change the income generating focus of the community?
X No impact foreseen. n/a n/a n/a
Do residents have the required skills, life experience and contextual understanding to benefit from the proposed development?
n/a n/a No impact foreseen. n/a n/a n/a
Will a change in economic focus associated with the development have repercussions for social
X No impact foreseen. n/a n/a n/a
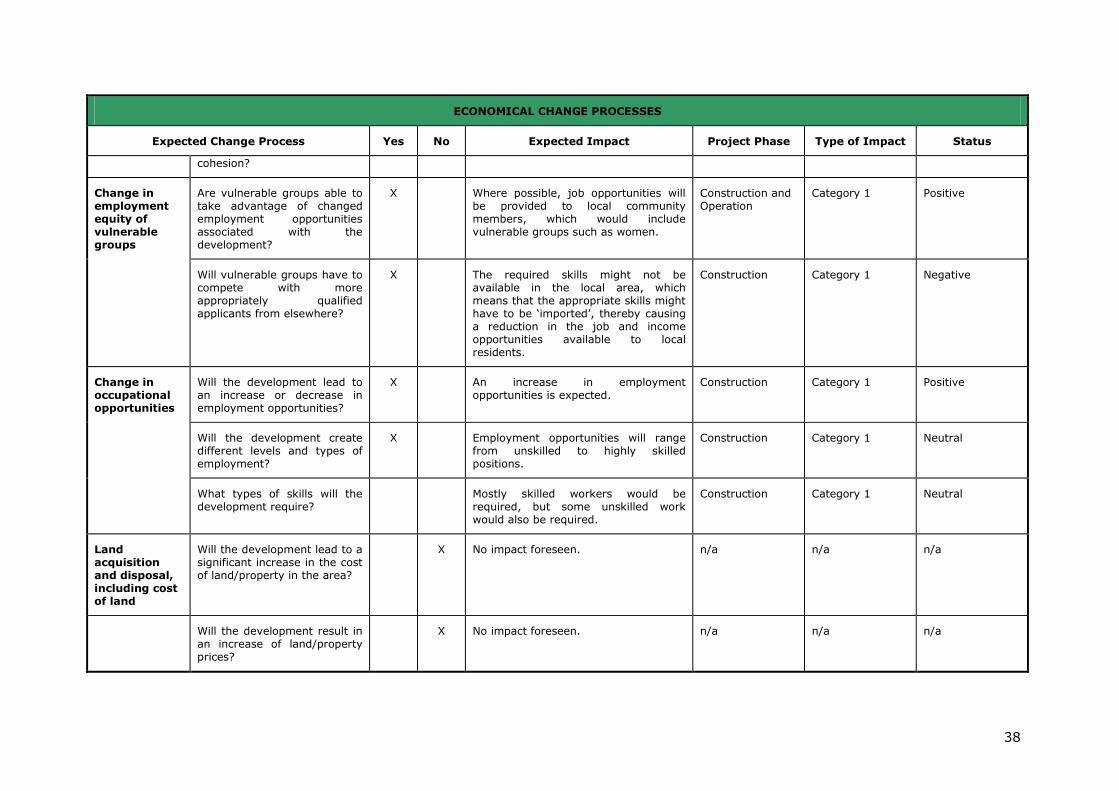
38
ECONOMICAL CHANGE PROCESSES
Expected Change Process Yes No Expected Impact Project Phase Type of Impact Status
cohesion?
Change in employment equity of vulnerable groups
Are vulnerable groups able to take advantage of changed employment opportunities associated with the development?
X Where possible, job opportunities will be provided to local community members, which would include vulnerable groups such as women.
Construction and Operation
Category 1 Positive
Will vulnerable groups have to compete with more appropriately qualified applicants from elsewhere?
X The required skills might not be available in the local area, which means that the appropriate skills might have to be ‘imported’, thereby causing a reduction in the job and income opportunities available to local residents.
Construction Category 1 Negative
Change in occupational opportunities
Will the development lead to an increase or decrease in employment opportunities?
X An increase in employment opportunities is expected.
Construction Category 1 Positive
Will the development create different levels and types of employment?
X Employment opportunities will range from unskilled to highly skilled positions.
Construction Category 1 Neutral
What types of skills will the development require?
Mostly skilled workers would be required, but some unskilled work would also be required.
Construction Category 1 Neutral
Land acquisition and disposal, including cost of land
Will the development lead to a significant increase in the cost of land/property in the area?
X No impact foreseen. n/a n/a n/a
Will the development result in an increase of land/property prices?
X No impact foreseen. n/a n/a n/a
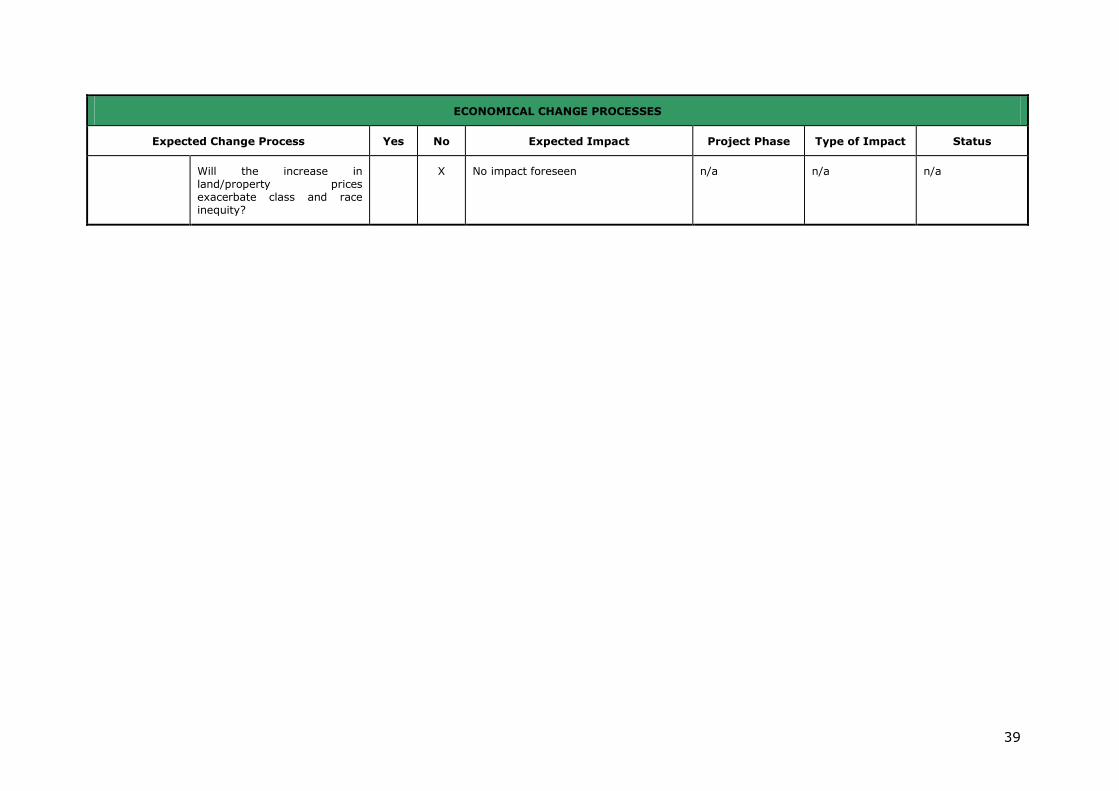
39
ECONOMICAL CHANGE PROCESSES
Expected Change Process Yes No Expected Impact Project Phase Type of Impact Status
Will the increase in land/property prices exacerbate class and race inequity?
X No impact foreseen n/a n/a n/a
40
3.6.2 Information Gaps
To fully assess the potential impacts as a result of economical change processes, more
information is needed on the following aspects:
• The negotiation process with private landowners in terms of land acquisition, e.g. how
compensation is calculated, when the process will take place, etc. If the land is owned
by Eskom, a negotiation process would not have to take place;
• The local employment opportunities that will be created, both direct and indirect
formal and informal job opportunities;
• If available, the average period of employment and an outline of a typical salary
package for unskilled labour.
3.7 Baseline Institutional and Empowerment Processes
Institutional and Empowerment processes relate to the role, efficiency and operation of
government sectors and other organisations within the area in terms of service delivery.
It also investigates the ability of people to engage in decision-making processes to such
an extent that they have an impact on the way in which decisions are made that would
concern them.
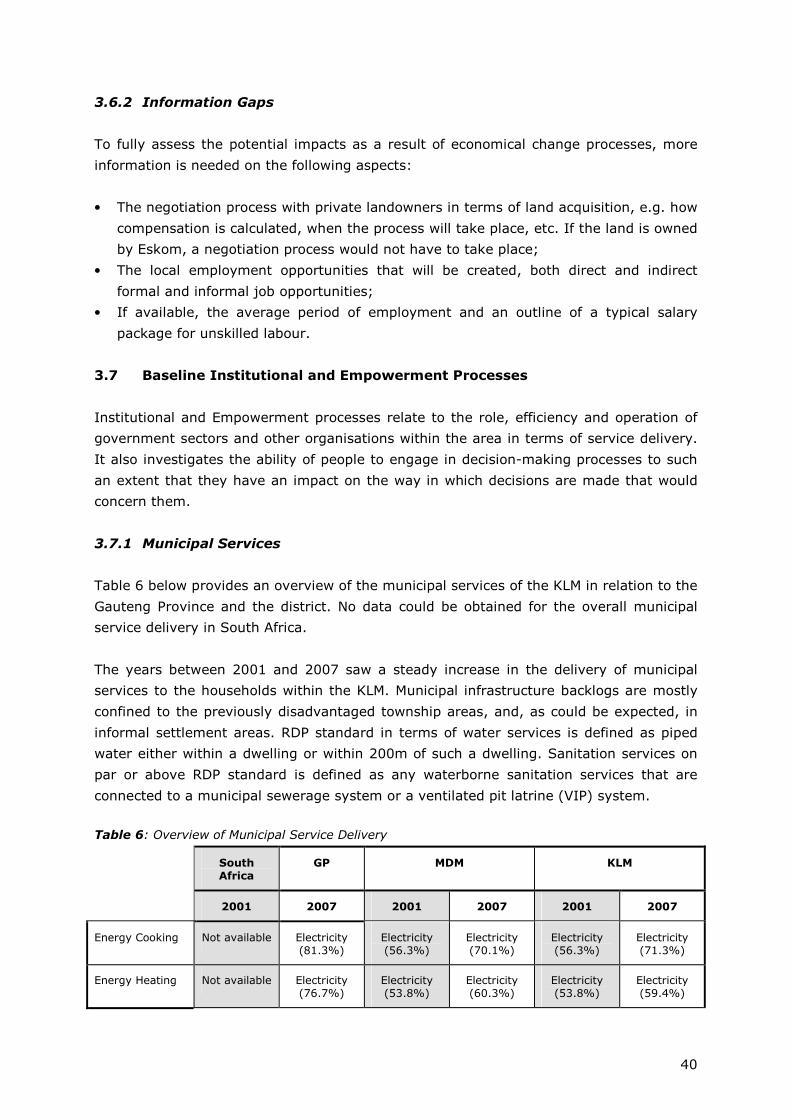
3.7.1 Municipal Services
Table 6 below provides an overview of the municipal services of the KLM in relation to the
Gauteng Province and the district. No data could be obtained for the overall municipal
service delivery in South Africa.
The years between 2001 and 2007 saw a steady increase in the delivery of municipal
services to the households within the KLM. Municipal infrastructure backlogs are mostly
confined to the previously disadvantaged township areas, and, as could be expected, in
informal settlement areas. RDP standard in terms of water services is defined as piped
water either within a dwelling or within 200m of such a dwelling. Sanitation services on
par or above RDP standard is defined as any waterborne sanitation services that are
connected to a municipal sewerage system or a ventilated pit latrine (VIP) system.
Table 6: Overview of Municipal Service Delivery
South Africa
GP MDM KLM
2001 2007 2001 2007 2001 2007
Energy Cooking Not available Electricity (81.3%)
Electricity (56.3%)
Electricity (70.1%)
Electricity (56.3%)
Electricity (71.3%)
Energy Heating Not available Electricity (76.7%)
Electricity (53.8%)
Electricity (60.3%)
Electricity (53.8%)
Electricity (59.4%)
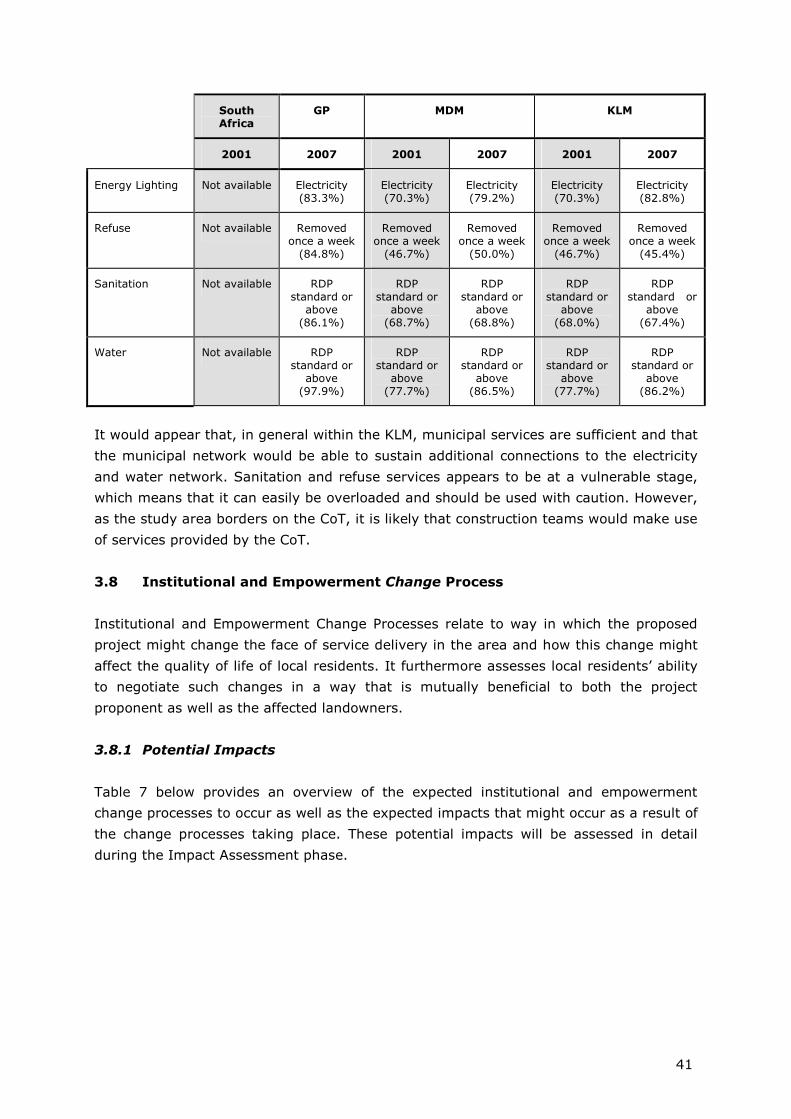
41
South Africa
GP MDM KLM
2001 2007 2001 2007 2001 2007
Energy Lighting Not available Electricity (83.3%)
Electricity (70.3%)
Electricity (79.2%)
Electricity (70.3%)
Electricity (82.8%)
Refuse Not available Removed once a week
(84.8%)
Removed once a week
(46.7%)
Removed once a week
(50.0%)
Removed once a week
(46.7%)
Removed once a week
(45.4%)
Sanitation Not available RDP standard or
above (86.1%)
RDP standard or
above (68.7%)
RDP standard or
above (68.8%)
RDP standard or
above (68.0%)
RDP standard or
above (67.4%)
Water Not available RDP standard or
above (97.9%)
RDP standard or
above (77.7%)
RDP standard or
above (86.5%)
RDP standard or
above (77.7%)
RDP standard or
above (86.2%)
It would appear that, in general within the KLM, municipal services are sufficient and that
the municipal network would be able to sustain additional connections to the electricity
and water network. Sanitation and refuse services appears to be at a vulnerable stage,
which means that it can easily be overloaded and should be used with caution. However,
as the study area borders on the CoT, it is likely that construction teams would make use
of services provided by the CoT.
3.8 Institutional and Empowerment Change Process
Institutional and Empowerment Change Processes relate to way in which the proposed
project might change the face of service delivery in the area and how this change might
affect the quality of life of local residents. It furthermore assesses local residents’ ability
to negotiate such changes in a way that is mutually beneficial to both the project
proponent as well as the affected landowners.
3.8.1 Potential Impacts
Table 7 below provides an overview of the expected institutional and empowerment
change processes to occur as well as the expected impacts that might occur as a result of
the change processes taking place. These potential impacts will be assessed in detail
during the Impact Assessment phase.
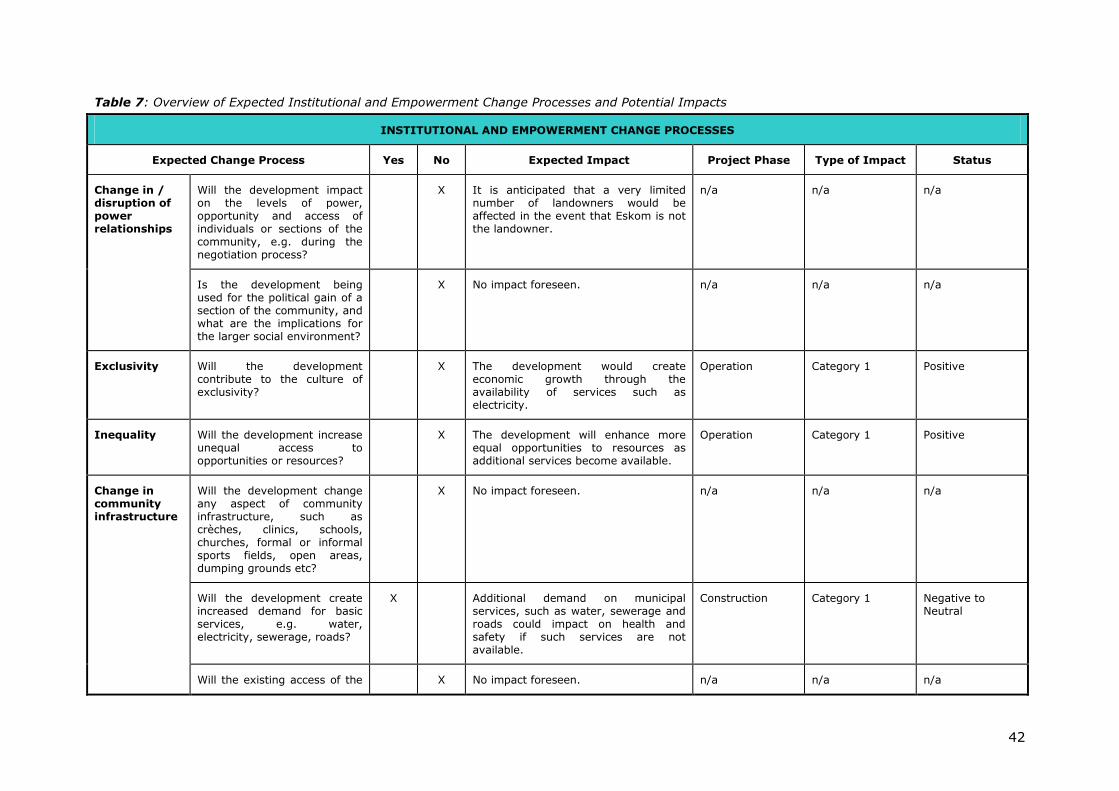
42
Table 7: Overview of Expected Institutional and Empowerment Change Processes and Potential Impacts
INSTITUTIONAL AND EMPOWERMENT CHANGE PROCESSES
Expected Change Process Yes No Expected Impact Project Phase Type of Impact Status
Change in / disruption of power relationships
Will the development impact on the levels of power, opportunity and access of individuals or sections of the community, e.g. during the negotiation process?
X It is anticipated that a very limited number of landowners would be affected in the event that Eskom is not the landowner.
n/a n/a n/a
Is the development being used for the political gain of a section of the community, and what are the implications for the larger social environment?
X No impact foreseen. n/a n/a n/a
Exclusivity Will the development contribute to the culture of exclusivity?
X The development would create economic growth through the availability of services such as electricity.
Operation Category 1 Positive
Inequality Will the development increase unequal access to opportunities or resources?
X The development will enhance more equal opportunities to resources as additional services become available.
Operation Category 1 Positive
Change in community infrastructure
Will the development change any aspect of community infrastructure, such as crèches, clinics, schools, churches, formal or informal sports fields, open areas, dumping grounds etc?
X No impact foreseen. n/a n/a n/a
Will the development create increased demand for basic services, e.g. water, electricity, sewerage, roads?
X Additional demand on municipal services, such as water, sewerage and roads could impact on health and safety if such services are not available.
Construction Category 1 Negative to Neutral
Will the existing access of the X No impact foreseen. n/a n/a n/a
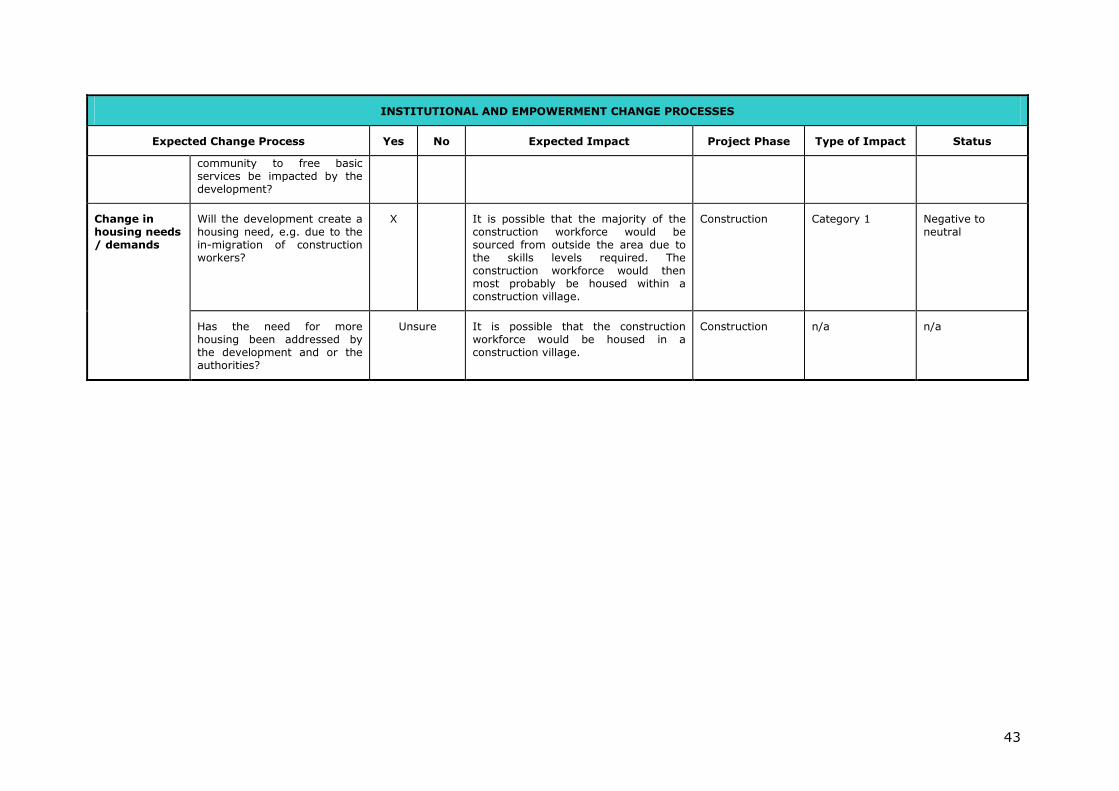
43
INSTITUTIONAL AND EMPOWERMENT CHANGE PROCESSES
Expected Change Process Yes No Expected Impact Project Phase Type of Impact Status
community to free basic services be impacted by the development?
Change in housing needs / demands
Will the development create a housing need, e.g. due to the in-migration of construction workers?
X It is possible that the majority of the construction workforce would be sourced from outside the area due to the skills levels required. The construction workforce would then most probably be housed within a construction village.
Construction Category 1 Negative to neutral
Has the need for more housing been addressed by the development and or the authorities?
Unsure It is possible that the construction workforce would be housed in a construction village.
Construction n/a n/a
44
3.8.2 Information Gaps
To fully assess the potential impacts as a result of empowerment and institutional change
processes, more information is needed on the following aspects:
• The risk for attitude formation against the project (social mobilisation);
• The negotiation process with private landowners in terms of land acquisition, e.g. how
compensation is calculated, when and how the process will take place, etc.; and
• Whether a construction village will be used, and if so, the most likely location for such
a construction village, how many workers would be housed within the construction
village, and the housing conditions.
3.9 Baseline Socio-Cultural Processes
Socio-cultural processes relate to the way in which humans behave, interact and relate to
each other and their environment, as well as the belief and value systems which guide
these interactions. At the time of the study, not enough information was available to
determine the level of cultural and place attachment that residents have to the area.
In terms of socio-cultural processes it should be noted that sense of place goes hand in
hand with place attachment, which is the sense of connectedness a person/community
feels towards certain places. Place attachment may be evident at different geographic
levels, i.e. site specific (e.g. a house, burial site, or tree where religious gatherings take
place), area specific (e.g. a residential area), and/or physiographic specific (e.g. an
attachment to the look and feel of an area). The concept of sense of place therefore
attempts to integrate the character of a particular setting with the personal emotions,
memories and cultural activities associated with such a setting.
3.10 Socio-Cultural Change Processes
Socio-cultural change processes that are associated with the construction and operation
of the proposed project include changes such as health and safety aspects and sense of
place. The concept of ‘health’ is not only limited to physical health (i.e. the absence of
ailments or illness), but also includes mental and social health. The expected changes
that can occur in relation to health and safety aspects can be as a result of the presence
of the proposed substation and loop-in/-out power lines during operation, as well as the
presence of construction workers and/or job seekers during construction.
3.10.1 Potential Impacts
Table 8 below provides an overview of the expected change processes as well as the
expected impacts that might occur as a result of the change processes taking place.
These potential impacts will be assessed in detail during the Impact Assessment phase.
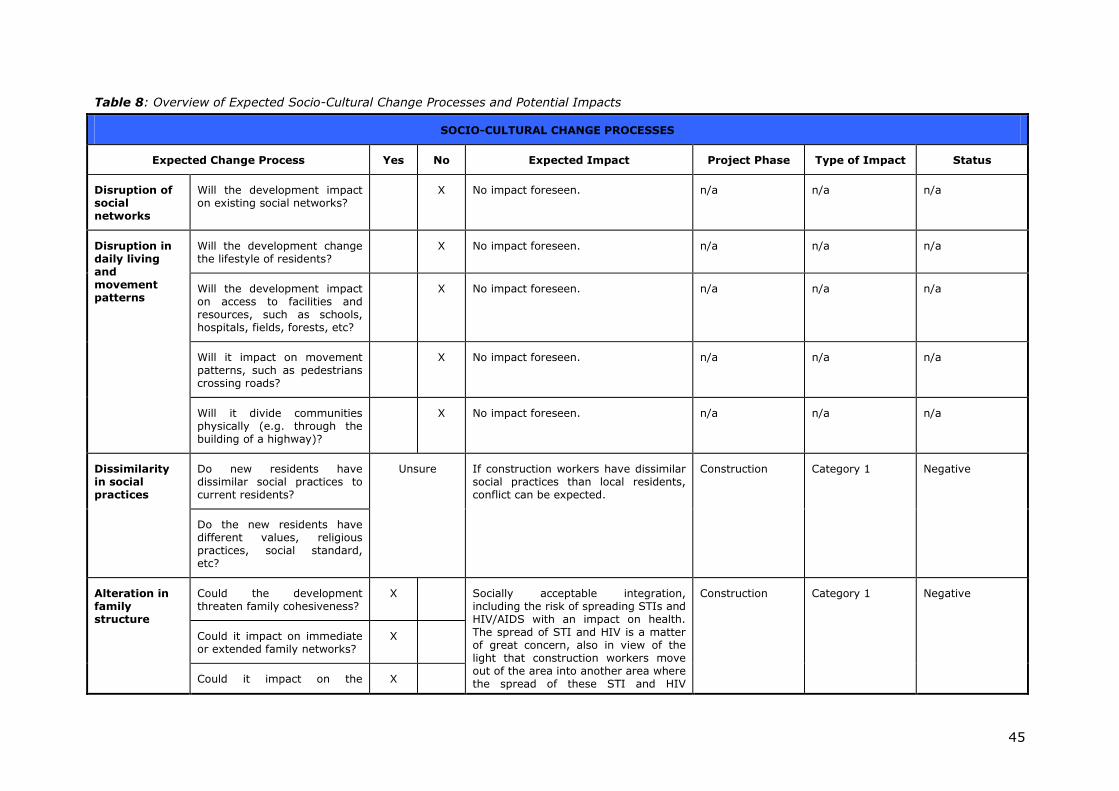
45
Table 8: Overview of Expected Socio-Cultural Change Processes and Potential Impacts
SOCIO-CULTURAL CHANGE PROCESSES
Expected Change Process Yes No Expected Impact Project Phase Type of Impact Status
Disruption of social networks
Will the development impact on existing social networks?
X No impact foreseen. n/a n/a n/a
Disruption in daily living and movement patterns
Will the development change the lifestyle of residents?
X No impact foreseen. n/a n/a n/a
Will the development impact on access to facilities and resources, such as schools, hospitals, fields, forests, etc?
X No impact foreseen. n/a n/a n/a
Will it impact on movement patterns, such as pedestrians crossing roads?
X No impact foreseen. n/a n/a n/a
Will it divide communities physically (e.g. through the building of a highway)?
X No impact foreseen. n/a n/a n/a
Dissimilarity in social practices
Do new residents have dissimilar social practices to current residents?
Unsure If construction workers have dissimilar social practices than local residents, conflict can be expected.
Construction Category 1 Negative
Do the new residents have different values, religious practices, social standard, etc?
Alteration in family structure
Could the development threaten family cohesiveness?
X Socially acceptable integration, including the risk of spreading STIs and HIV/AIDS with an impact on health. The spread of STI and HIV is a matter of great concern, also in view of the light that construction workers move out of the area into another area where the spread of these STI and HIV
Construction Category 1 Negative
Could it impact on immediate or extended family networks?
X
Could it impact on the X
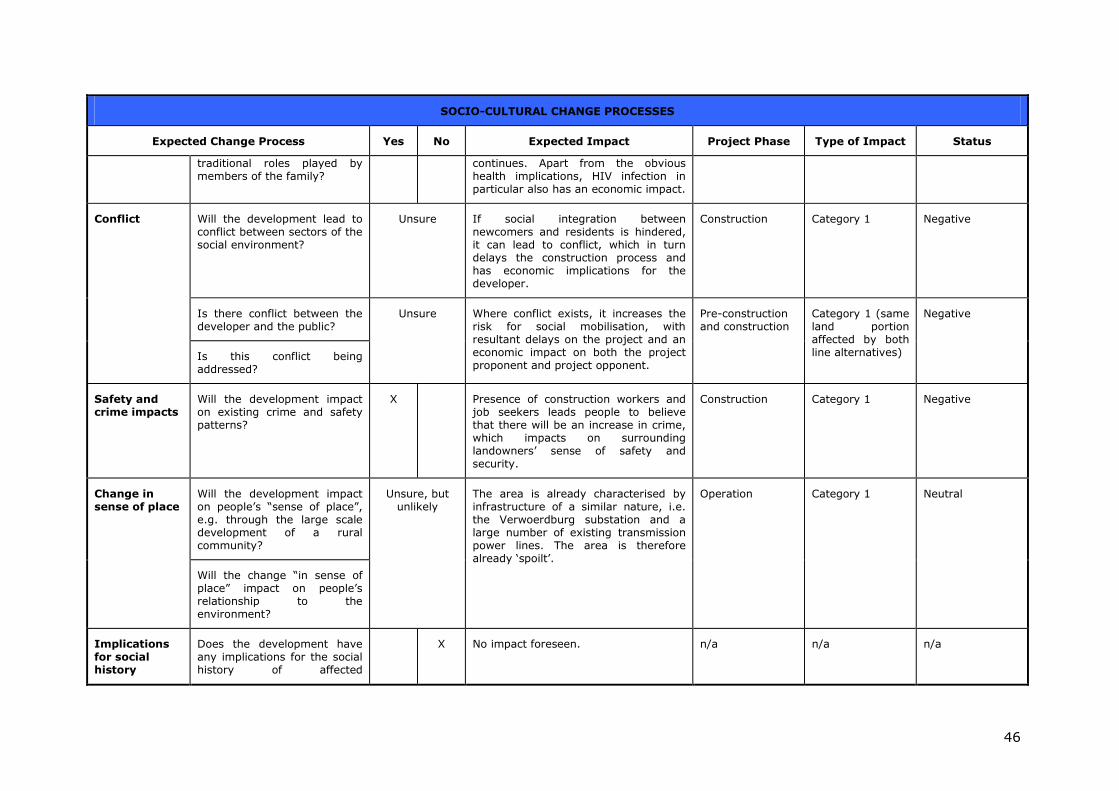
46
SOCIO-CULTURAL CHANGE PROCESSES
Expected Change Process Yes No Expected Impact Project Phase Type of Impact Status
traditional roles played by members of the family?
continues. Apart from the obvious health implications, HIV infection in particular also has an economic impact.
Conflict Will the development lead to conflict between sectors of the social environment?
Unsure If social integration between newcomers and residents is hindered, it can lead to conflict, which in turn delays the construction process and has economic implications for the developer.
Construction Category 1 Negative
Is there conflict between the developer and the public?
Unsure Where conflict exists, it increases the risk for social mobilisation, with resultant delays on the project and an economic impact on both the project proponent and project opponent.
Pre-construction and construction
Category 1 (same land portion affected by both line alternatives)
Negative
Is this conflict being addressed?
Safety and crime impacts
Will the development impact on existing crime and safety patterns?
X Presence of construction workers and job seekers leads people to believe that there will be an increase in crime, which impacts on surrounding landowners’ sense of safety and security.
Construction Category 1 Negative
Change in sense of place
Will the development impact on people’s “sense of place”, e.g. through the large scale development of a rural community?
Unsure, but unlikely
The area is already characterised by infrastructure of a similar nature, i.e. the Verwoerdburg substation and a large number of existing transmission power lines. The area is therefore already ‘spoilt’.
Operation Category 1 Neutral
Will the change “in sense of place” impact on people’s relationship to the environment?
Implications for social history
Does the development have any implications for the social history of affected
X No impact foreseen. n/a n/a n/a
47
SOCIO-CULTURAL CHANGE PROCESSES
Expected Change Process Yes No Expected Impact Project Phase Type of Impact Status
communities?
48
3.10.2 Information Gaps
To fully assess the potential impacts as a result of socio-cultural change processes, more
information is needed on the following aspects:
• The cultural dynamics of the existing settlements and their ability to accommodate
and/or integrate workers from outside their community;
• Measures that are normally implemented at a construction site of this nature
(substation and loop-in/-out power lines) to secure and control access to the area;
• The daily activities of surrounding residents and their cultural attachment to the area;
and
• The activities of maintenance workers and where these maintenance workers will be
sourced from.
49
4. CONCLUSIONS AND RECOMMENDATIONS
This report fulfilled the objectives of the Scoping Phase, which was to complete a broad
assessment of the project from a social perspective to enable a more focussed study in
the Impact Assessment Phase.
A preferred route alignment could not be determined during the scoping study as both
alignments affect the same portion of land. Both alignments are also located away from
surrounding residential areas at an average of 500m. In addition, the area is already
characterised by infrastructure of a similar nature, i.e. the existing Verwoerdburg
substation and a number of high voltage transmission power lines. It is therefore, at this
stage, not foreseen that additions to the Verwoerdburg substation or the construction
and operation of the two proposed turn-in and –out lines would yield significant negative
impacts to the surrounding social environment. Therefore, no issues emerged that can
be considered as fatal flaws and at this stage there are also not areas of great concern. It
is recommended that a brief SIA be conducted during the next phase to test the
assumptions made in this scoping report in respect of issues such as the expected land
use change, temporary influx of people to the area and the likelihood of the project
impacting on sense of place.
This recommendation was based on the specialist’s:
• Understanding of the proposed project, including the alternative route alignments and
the nature and timeframe of the proposed activities;
• Assessment of the affected communities, settlements and institutions in terms of:
* Demographic Processes: the number and composition of the local population;
* Geographic Processes: the land use pattern within the (affected) area; and
* Economic Processes: the way in which people make a living and the economic
activities within a specific (affected) area;
* Empowerment and Institutional Processes: people’s ability to become
actively involved and influence the decision making process, and also the
efficiency and operation of local authorities and other significant organisations);
and
* Socio-Cultural Processes: the way in which humans interact and relate to
each other within the context of their environment, and how this interaction is
guided by value systems.
• Assessment of potential change processes that might occur as a result of the project.
50
5. TERMS OF REFERENCE FOR THE EIA PHASE
This section aims to address the following objective:
• Describe the proposed studies for the Impact Assessment Phase that would ultimately
fill the identified information gaps and result in a detailed assessment of the potential
impacts.
5.1 Geographical Change Processes
• Obtain landowner information from the public participation consultant; and
• Scrutinise the IDP and SDF of the KLM in terms of future developments. If additional
information is required other than that contained in the IDP/SDF, conduct interview(s)
with relevant town planners.
5.2 Demographical Change Processes
• Conduct a desktop study to try and determine what the expected population growth
rate is and how this would be influenced by the HIV infection rate in order to establish
how the population would have expanded without the influx of construction workers
and/or job seekers; and
• Obtain and analyse information from the public participation consultants on the local
residents’ expectations in terms of the proposed project within the social realm, in
order to better understand local residents’ viewpoint on the proposed project and the
potential risk for conflict and other forms of active and passive social mobilisation.
5.3 Economical Change Processes
• If Eskom is not the landowner, obtain and analyse information from the project
proponent on the negotiation process and how compensation is calculated; and
• Obtain and analyse information from the project proponent on an average salary
package for an unskilled labourer to determine the extent and timeframe of economic
impacts on local residents as a result of employment.
5.4 Institutional and Empowerment Change Processes
• Obtain the issues register or issues report from the public participation consultants to
determine the recurrent issues raised from the public’s side and how these issues
were addressed throughout the process. An analysis of these issues would indicate
the risk for social mobilisation; and
• Obtain and analyse information on the size, composition and location of a construction
village.
51
5.5 Socio-Cultural Change Processes
• Obtain information from the public participation consultants on the surrounding
landowners. Either attend or organise a focus group meeting with these landowners
or a landowner representative body such as a residents association to determine their
attachment to the area.
52
6. SOURCES CONSULTED
6.1 Municipal Documentation
• Kungwini Local Municipality (2008). Integrated Development Plan 2008/09.
6.2 Project Documentation
• Project generated maps indicating the various route alternatives.
6.3 Other Documentation
• Slootweg R, Vanclay F, van Schooten M. Function evaluation as a framework for the
integration of social and environmental impact assessment. Impact Assess Project
Appraisal 2001; 19(1):19–28.
• Statistics South Africa. Community Survey 2007: Key Municipal Data. Report No: 03-
01-22 (2007)
• Vanclay, F. 2002. Environmental Impact Assessment Review 22:183–211
6.4 Websites
• Municipal Demarcation Board (http://www.demarcation.org.za) - accessed April 2009.
• Community Survey Interactive Data
(http://www.statssa.gov.za/community_new/content.asp?link=interactivedata.asp) –
accessed April 2009.
• Wikipedia (www.wikipedia.org/wiki/Land_use.html)
• www.soil.ncsu.edu/publications/BMPs/glossary.html