Embed Size (px)
Citation preview
Socioeconomic Status of Indochinese Refugees in the United States: Progress and Problems
by Robert E. Marsh*
The Social Security Administration is responsible for administering assistance programs not only to needy citizens but also to lawfully admitted aliens who require such aid. It therefore is interested in the economic situation of all the Nation’s inhabitants, including refugees. This article examines the status of one such group-the Indochinese refugees who came to this country following the fall of the South Vietnamese government in 1975. A series of sample surveys, commissioned by the Department of Health, Education, and Welfare, reveals that most members of the original group of 130,000 Indo- chinese had achieved a large measure of economic self- sufficiency by the end of 1978. In the fall of that year, however, a new wave of Indochinese refugees began emigrating to the United States. The latecomers-who now outnumber the original group-are generally poorer, less well educated, and less acclimated to urban living than were their predecessors. Such characteristics suggest higher future resettlement costs, which could well be exacerbated by the propensity of ethnic groups to cluster in a few areas.
In April 1975, as the fall of Saigon to the North Vietnamese appeared imminent, the United States began to withdraw its remaining troops from the Indo- chinese peninsula. Included in the evacuation were about 130,000 Vietnamese, Cambodians, and Lao- tians-many of them closely connected with the United States during the war in Southeast Asia. Within a few months, refugees who had escaped to Thailand and other nearby nations of first asylum began to be relo- cated in this country. By the end of 1978 the number of Indochinese refugees living here approached 176,000.
Uganda, and South America. Thus far in 1980, the United States has granted asylum to more than 115,000 Cubans as well as thousands of “boat people” from Haiti.
This humanitarian gesture was to be expected of the United States, a nation that for most of its history has welcomed, and been enriched by, a continuing stream of immigrants and refugees. From 1820 to 1930, America admitted about 60 percent of all the world’s immigrants. More recently, in addition to the immi- grants accepted under regular quotas and an unknown number of illegal entrants from Mexico, these shores have attracted a host of refugees-including about 850,000 from Cuba, 38,000 from Hungary, tens of thousands from the Soviet Union and Eastern Europe, and lesser numbers from Czechoslovakia, Hong Kong,
Most of the Indochinese refugees were admitted into the United States without visas under the Attorney General’s discretionary parole authority. This provision allows the entry of an unlimited number of persons, either individually or as members of a group, in an emergency or for reasons in the public interest. A few refugees arrived as conditional entrants, a roughly similar but inferior condition to that of parolee.
In 1977, Public Law 95-145 permitted the refugees to request a change in status from parolee to permanent resident alien after 2 years of residence. That law further provided that the 5-year waiting period required before citizenship applications may be filed could be satisfied retroactively from the refugee’s date of entry. This year, having fulfilled this requirement, an esti- mated 60,000 Indochinese refugees are expected to apply for citizenship. Such a caseload would raise the total number of such petitions to the highest level in 35 years. 1
* Publications Staff, Office of Research and Statistics, Office of 1 Donnel Nunes, “Flood of Refugees Hoping to Become American Policy, Social Security Administration. Citizens,” Washington Post, March 12, 1980.
Social Security Bulletin, October 198O/Vol. 43, No. 10 11
The Resettlement Process To resettle the Indochinese refugees and provide
them with financial, educational, and medical assist- ance, an ad hoc system was established, involving both government and private agencies. Under the 1975 Indochina Migration and Refugee Assistance Act (Pub- lic Law 9423), an Interagency Task Force, made up of representatives from 12 Federal agencies, was created to supervise evacuation and resettlement efforts. From the outset, however, primary responsibility for the suc- cess of this effort was placed with the Department of State and the Department of Health, Education, and Welfare. (In 1976, after evacuation was largely com- pleted, responsibility for resettlement efforts passed to the U.S. Department of Health, Education, and Welfare Refugee Task Force.) When the original act expired on September 30, 1977, nearly a month elapsed before new legislation authorized continuation of the program. A 5-month interruption in Government-sponsored resettlement efforts occurred between October 1977 and March 1978, during which time Federal appropriations were delayed.*
Reception Centers Most of the Indochinese refugees were housed
temporarily in camps in the western Pacific area, then flown to one of four U.S. reception centers set up in April and May of 1975. These camps-located at Fort Chaffee, Arkansas; Eglin Air Force Base, Florida; Fort Indiantown Gap, Pennsylvania; and Camp Pendleton, California-operated until the end of the year, by which time resettlement of all their occupants had been com- pleted.
Shortly after their arrival in the camps the refugees received a variety of social services-including classes in child care, college placement assistance, and recrea- tional programs-provided by private organizations. Orientation meetings were staged to acquaint them with life in the United States. Schooling was provided for children, and adults were encouraged to devote a considerable portion of their free time to vocational and English-language training. At Camp Pendleton, for example, about 70 percent of the refugees studied English, devoting an average of 4 hours a day to the effort.3
Voluntary Agencies and Sponsors Eventually, each refugee was assigned to a national
voluntary resettlement agency (VOLAG) under con-
2 The Indochinese Exodus: A Humanitarian Dilemma, a Report to the Congress by the Comptroller General of the United States, General Accounting Office, April 24, 1979, page 80.
3 Darrel Montero, Vietnamese Americans: Patterns of Resettle- ment and Socioeconomic Adaptation in the United States, Westview Press, 1979, page 24.
tract with the Interagency Task Force (later with the Department of State) to locate sponsors willing to assume a moral, though not a legal, responsibility for the newcomers for as long as 2 years. Among the principal VOLAGs were the American Council for Nationalities Services, the American Fund for Czech- oslovak Refugees, Church World Service, the Inter- national Rescue Committee, the Lutheran Immigration and Refugee Service, United Hebrew Immigrant Aid Society, the U.S. Catholic Conference, the Travelers Aid-International Social Services, and the Tolstoy Foundation.
VOLAGs received a cash grant for each paroled refugee-a sum that ranged over time from $300 to $500. The grant was intended primarily as “seed money,” to be augmented by larger amounts contrib- uted by private philanthropic groups. Because of the extent of its responsibilities, a VOLAG could incur average costs per refugee family exceeding $5,000.4 The resettlement services that were expected of a volun- tary agency included but were not necessarily limited to
. migration planning and services, such as promoting and securing resettlement opportunities;
. reception services to refugees . . . such as reception costs, lodging, food, clothing, emergency medical and dental services, counseling, distribution of pocket money. . . up to $50 to individuals and $100 to family units;
. inland transportation in the United States, including baggage;
. interim services to facilitate adjustment within the resettlement community, such as lodging, food, clothing, medical and dental services, language, educational and vocational training, counseling, and placement.5
In addition to providing for the immediate needs of the refugees and generally aiding them in adjusting to their new environment, a sponsor was expected to help them find employment, apply for public assistance when it was required, help enroll the children in school, and make arrangements for routine health care. Although such efforts could involve considerable ex- pense, nearly three-fourths of the sponsors chosen were either families or individuals. Most of the group sponsorships were arranged by such organizations as the U.S. Catholic Conference, the Lutheran Immigra- tion and Refugee Service, and the International Rescue Committee.6
At the behest of the Federal Government, the VOLAGs attempted to achieve a wide geographic dis- tribution of the refugees. Dispersal seemed desirable for two reasons: ( 1) The number of potential sponsors
4 Ibid., page 28. 5 The Indochinese Exodus, op. cit., page 71. s Darrel Montero, Vietnamese Americans, op. cit., page 38.
12 Social Security Bulletin, October 198O/Vol. 43, No. 10
willing and able to live up to their obligations would naturally be limited in any locality, and (2) the Nation was then in the midst of an economic recession and it was felt that if too many refugees were sent to a single area they might provide unwelcome competition for scarce jobs. Though the refugees were widely disbursed throughout all the States, the District of Columbia, Guam, and American Samoa, those States in which the camps were located received more than a proportionate share, as did Louisiana, Texas, Virginia, and Washing- ton.
Cash and Medical Assistance If they could not find suitable employment after
being resettled, the refugees became eligible for cash and medical assistance for an unspecified period on much the same basis as U.S. citizens and other lawfully admitted aliens. Under the refugee version of aid to families with dependent children (AFDC), however, the family-composition requirements were waived to permit payments to single persons, childless couples, and families having a father present. The only eligi- bility criteria was income level, which was the same as that for AFDC. The States were reimbursed for their full share of expenses for this “refugee financial assist- ance,” supplemental security income (including any optional State supplementation), and Medicaid. By contrast, the Federal Government normally reimburses a State for half to about three-fourths of outlays under the AFDC and Medicaid programs.7 State and local education agencies also received per capita allocations to help defray the cost of educating refugee children.6
By April 5, 1979, total appropriations made in behalf of the Indochinese refugees reached slightly more than $1 billions rather evenly divided between the Depart- ment of State-concerned mainly with housing, mainte- nance, and transportation of the refugees overseas and with the selection and partial financing of VOLAGs -and the Department of Health, Education, and Wel- fare ( HEW)-whose mission was largely to provide financial and other assistance until the refugees could become economically productive members of society. In fiscal year 1978, the Department of HEW obligated more than $100 million for cash and medical assistance, social services, and administrative costs in their be-
7 Except for the mandatory supplementation required under certain circumstances and the optional payments States may elect to make, supplemental security income is federally financed. The Federal Government meets the full cost of providing food stamps except for the administrative expenses involved. Those costs, for refugees and for other recipients, are shared by the Federal Government and the States on a 50-50 basis.
*Report to the Congress: Indochinese Refugee Assistance Pro- gram, December 31, 1978, Office of Family Assistance, Social Security Administration, pages 6, 8.
Q The Indochinese Exodus, op. cit., page 100.
half.10 During that period, $7.2 million was also ear- marked for English-language and employment-services projects.
Characteristics of the Refugee Population, 197578
As the refugees fanned out across America, program administrators began asking much the same questions about them as might have occurred to curious towns- people: Who are these new residents? In what ways are they like the rest of us and in what ways do they differ? Will they become self-sufficient or rely primarily on welfare? To answer these and other questions, the Department of HEW (now the Department of Health and Human Services) engaged a private firm, Opportu- nity Systems, Inc., to conduct a series of telephone interview surveys of the refugees. Though these nation- al, random samples were largely confined to natives of Vietnam,11 persons from that nation accounted for about 9 out of every 10 resettled Indochinese.
The first wave of interviews, conducted in AugustSeptember 1975, revealed the personal charac- teristics of the refugees and provided base data on their income, employment, occupation, and reliance on pub- lic assistance. The followup effort, through the end of 1978, consisted of five additional interview waves con- ducted in the following periods:
Wave: Period 2 _......................... November-December 1975 3 . . . . . . . July-August 1976 4 . . . . . March-April 1977 5 .__._.____._....___....... July-August 1977 6 . . . . . . . . . . . . . . . . . . . . . . . . . . November-December 197812
Responses to the initial survey show the Vietnamese refugees to be young and relatively well educated. Their work experience was predominantly in white- collar occupations and their family size was relatively large.
Personal Characteristics Age. Four in 10 of the Vietnamese refugees were
under age 15 in 1975 and 8 in 10 were under age 35. (Immigration and Naturalization Service data, pre- pared from 114,140 alien address reports on Indo-
10 Report to the Congress, op. cit., page 161. 11 The first five surveys and part of the sixth deal only with
natives of Vietnam who came to the United States in 1975. Another part of the sixth survey is concerned with Cambodians who were evacuated in that year. Two 1979 surveys, which had not been published when this article was wtitten, have separate parts for Vietnamese, Cambodian, and Laotian refugees and rely on samples taken from the January 1979 Immigration and Naturalization Service alien report file.
12 For a much fuller analysis of the data obtained in waves l-5 and an explanation of the sampling technique and sampling error, see Darrel Montero, Vietnamese Americans, op. cit., chapter 4.
Social Security Bulletin, October 198O/Vol. 43, No. 10 13
Chinese refugees in January 1976, show 42.6 percent of that population to be under age 18, 79.1 percent to be under age 35, 16.4 percent to be aged 35-62, and 4.4 percent to be aged 63 and over.)
Sex. Fifty-two percent of the Vietnamese refugees were male and 48 percent were female.
Education. Ten percent of the Vietnamese refugees reported having received a university education, 40 percent said they had completed secondary schooling, 15 percent reported elementary schooling, and 20 per- cent said they had no formal education. (According to the March 1976 evacuee file of the reception camps, the highest educational level reported by refugees aged 18 and over was: University and postgraduate training, 19.5 percent; secondary training, 37.9 percent; elemen- tary training, 17.9 percent; and no education, 2.1 per- cent.) In both evaluations of educational attainment, data were not available for a considerable proportion of the refugees.
Vietnamese occupation. Fully two-thirds of the refugee household heads were in white-collar occupa- tions before emigrating to the United States; the remainder held blue-collar jobs. Of the white-collar workers, nearly half were professionals, a fifth were in management positions, and the remaining third were in clerical work or in sales. Close to half the blue-collar workers-about 44.5 percent-were craftsmen, and 10.5 percent were operatives or worked in trans- portation. The remaining 45 percent followed mis- cellaneous manual pursuits.
Family size. Because Vietnamese households often contain members of more than one generation and occasionally include even more distant relatives, the number of persons living together under one roof was likely to be high by U.S. standards. The survey revealed that about a third of the refugee households contained at least six persons. Every twentieth Viet- namese family was made up of at least 10 persons.
Employment Characteristics Subsequent surveys provided statistical information
that could be applied against the base data to evaluate change among the Vietnamese refugees as they became conditioned to their new environment. Long before the sixth sampling, in late 1978, the statistical record clearly indicated that, by most measures, the refugees were doing quite well.
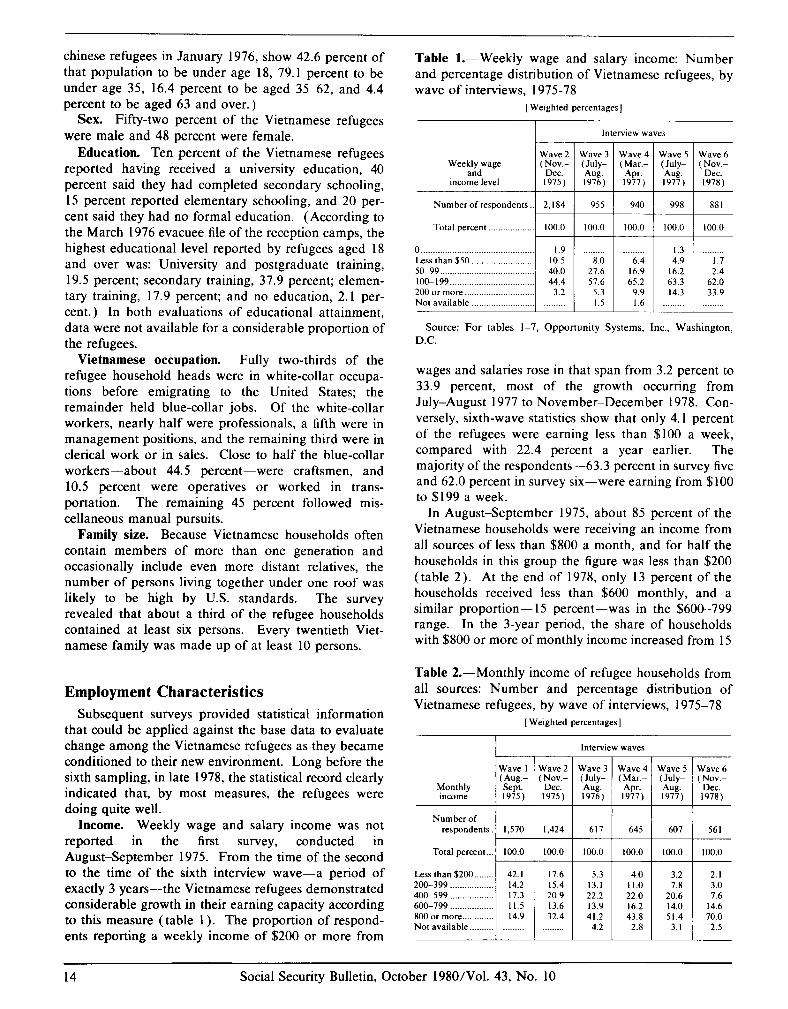
Income. Weekly wage and salary income was not reported in the first survey, conducted in August-September 1975. From the time of the second to the time of the sixth interview wave-a period of exactly 3 years-the Vietnamese refugees demonstrated considerable growth in their earning capacity according to this measure (table 1). The proportion of respond- ents reporting a weekly income of $200 or more from
Table l.-Weekly wage and salary income: Number and percentage distribution of Vietnamese refugees, by wave of interviews, 1975-78
[Weighted percentages]
Wave 2 Weekly wage (Nov.-
and DCC. income level 1975)
Number of respondents _. 2.184
Total percent _...._._.____._.__. 100.0
0 1.9 Less than $50 __._._._.._._.____._...... 10.5 SO-99 100-199 200 or more ___._._.._._._______.........
Interview waves
Wave 3
‘2: ,
1976)
955
100.0
8.0 27.6 57.6
5.3 I.5
Wave 4 (Mar.- Apr. 1977)
940 998 881
100.0 100.0 100.0
1.3 6.4 4.9 I.7
16.9 16.2 2.4 65.2 63.3 62.0
9.9 14.3 33.9 1.6
Wave 5
‘2: 1977)
Wave 6 (Nov.-
Dec. 1978)
Source: For tables 1-7, Opportunity Systems, Inc., Washington,
D.C.
wages and salaries rose in that span from 3.2 percent to 33.9 percent, most of the growth occurring from July-August 1977 to November-December 1978. Con- versely, sixth-wave statistics show that only 4.1 percent of the refugees were earning less than $100 a week, compared with 22.4 percent a year earlier. The majority of the respondents-63.3 percent in survey five and 62.0 percent in survey six-were earning from $100 to $199 a week.
In August-September 1975, about 85 percent of the Vietnamese households were receiving an income from all sources of less than $800 a month, and for half the households in this group the figure was less than $200 (table 2). At the end of 1978, only 13 percent of the households received less than $600 monthly, and a similar proportion- 15 percent-was in the $600-799 range. In the 3-year period, the share of households with $800 or more of monthly income increased from 15
Table 2.-Monthly income of refugee households from all sources: Number and percentage distribution of Vietnamese refugees, by wave of interviews, 1975-78
[Weighted percentages]
Monthly income
Number of
Less than $200 ._._.._ 200-399 _______._.._._.__. NO-599 ___,_,..,......... 600-799 _,.,__._._.____._. 800 or more _._.________. Not available _________.
42.1 14.2 17.3 I I.5 14.9
Nave 2 NOV.- Dec. 1975)
1 Wave 3 Wave 4
‘2: ( z- 1976) 1977)
1,424 617 645
100.0
17.6 15.4 20.9 13.6 32.4
5.3 4.0 13.1 11.0 22.2 22.0 13.9 16.2 41.2 43.8
4.2 2.8
Interview waves
Wave 5
%~ 1977)
Wave 6 (Nov.-
Dec. 1978)
607 561
100.0
3.2 2.1 7.8 3.0
20.6 7.6 14.0 14.6 51.4 70.0
3.1 2.5
14 Social Security Bulletin, October 198O/Vol. 43, No. 10
percent to 70 percent. From the fifth to the sixth interview wave the ratio registering this much income rose by 18.6 percentage points.
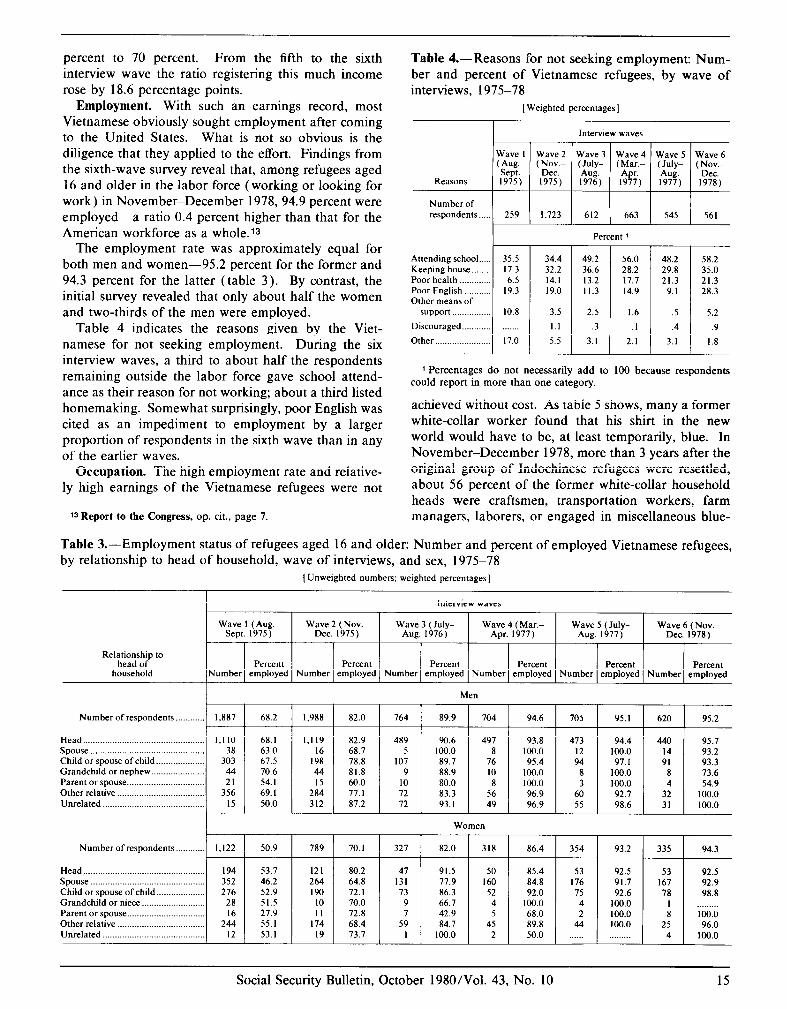
Employment. With such an earnings record, most Vietnamese obviously sought employment after coming to the United States. What is not so obvious is the diligence that they applied to the effort. Findings from the sixth-wave survey reveal that, among refugees aged 16 and older in the labor force (working or looking for work) in November-December 1978, 94.9 percent were employed-a ratio 0.4 percent higher than that for the American workforce as a whole.13
The employment rate was approximately equal for both men and women-95.2 percent for the former and 94.3 percent for the latter (table 3). By contrast, the initial survey revealed that only about half the women and two-thirds of the men were employed.
Table 4 indicates the reasons given by the Viet- namese for not seeking employment. During the six interview waves, a third to about half the respondents remaining outside the labor force gave school attend- ance as their reason for not working; about a third listed homemaking. Somewhat surprisingly, poor English was cited as an impediment to employment by a larger proportion of respondents in the sixth wave than in any of the earlier waves.
Occupation. The high employment rate and relative- ly high earnings of the Vietnamese refugees were not
13 Report to the Congress, op. cit., page 7.
Table 4.-Reasons for not seeking employment: Num- ber and percent of Vietnamese refugees, by wave of interviews, 1975-78
[Weighted percentages]
Interview waves
Wave1 Wave2 Wave3 Wave4 Wave5 Wave6 (sAeupgt:- (No%:- (July- (Mar.- (July- (Nov.-
Aug. Apr. Aug. Dec. Reasons 1975) 1975) 1976) 1977) 1977) 1978)
Number of respondents..... 259 1,723 612 663 545 561
Percent 1
Attending school..... 35.5 Keeping house _.._.._. 17.3 Poor health __.____._.._. 6.5 Poor English _____._.._. 19.3 Other means of
34.4 49.2 56.0 48.2 58.2 32.2 36.6 28.2 29.8 35.0 14.1 13.2 17.7 21.3 21.3 19.0 11.3 14.9 9.1 28.3
support 10.8 3.5 2.5 1.6 .5 5.2
Discouraged ._._._....._ I.1 .3 .I .4 .9
Other ._________.__._._._____ 17.0 5.5 3.1 2.1 3.1 1.8
1 Percentages do not necessarily add to 100 because respondents could report in more than one category.
achieved without cost. As table 5 shows, many a former white-collar worker found that his shirt in the new world would have to be, at least temporarily, blue. In November-December 1978, more than 3 years after the original group of Indochinese refugees were resettled, about 56 percent of the former white-collar household heads were craftsmen, transportation workers, farm managers, laborers, or engaged in miscellaneous blue-
Table 3.-Employment status of refugees aged 16 and older: Number and percent of employed Vietnamese refugees, by relationship to head of household, wave of interviews, and sex, 1975-78
[ Unweighted numbers; weighted percentages]
Interview waves
Relationship to head of
household
Wave I (Aug.- Wave 2 (Nov.- Wave 3 (July- Wave 4 (Mar.- Sept. 1975 ) Dec. 1975) Aug. 1976)
Wave 5 (July- Wave 6 (Nov.- Apr. 1977) Aug. 1977) Dec. 1978)
Percent Percent Percent Percent Percent Percent Number employed Number employed Number employed Number employed Number employed Number employed
Melt
Number of respondents ..__.__._._. L
1,887 68.2 1,988 82.0 764 89.9 704
I,1 10 68. I 1,119 82.9 489 90.6 497 38 63.0 16 68.7 5 100.0 8
303 67.5 198 78.8 107 89.7 76 44 70.6 44 81.8 9 88.9 10 21 54. I 15 60.0 10 80.0 8
356 69.1 284 77.1 72 83.3 56 15 50.0 312 87.2 72 93. I 49
t-
94.6 705 95.1 620 95.2
93.8 473 94.4 440 95.7 100.0 12 100.0 14 93.2 95.4 94 97. I 91 93.3
100.0 8 100.0 8 73.6 100.0 3 100.0 4 54.9 96.9 60 92.7 32 100.0 96.9 55 98.6 31 100.0
Head .__._____._.._._____............................. Spouse . . . Child or spouse of child ___._.._________.__ Grandchild or nephew _____._.__._______._. Parent or spouse ____._...___...._.._........... Other relative . Unrelated .
Number of respondents ._.__._.____ c
Head.. ............................................... Spouse .............................................. Child or spouse of child ................... Grandchild or niece ......................... Parent or spouse ............................... Other relative ................................... Unrelated .........................................
1,122 50.9 789 70.1 327 82.0
194 53.7 121 80.2 352 46.2 264 64.8 276 52.9 190 72. I
28 51.5 10 70.0 lb 27.9 II 72.8
244 55.1 174 68.4 12 53.1 19 73.7
47 131 73
9 7
59 I
91.5 50 85.4 77.9 160 84.8 86.3 52 92.0 66.7 4 100.0 42.9 5 68.0 84.7 45 89.8
100.0 2 50.0
318 86.4 354 93.2 335 94.3 I I I I I
53 92.5 176 91.7 75 92.6
4 100.0 2 100.0
44 100.0
53 167 78
I 8
92.5 92.9 98.8
100.0 96.0
100.0 25
4
Social Security Bulletin, October 198O/Vol. 43, No. 10 15
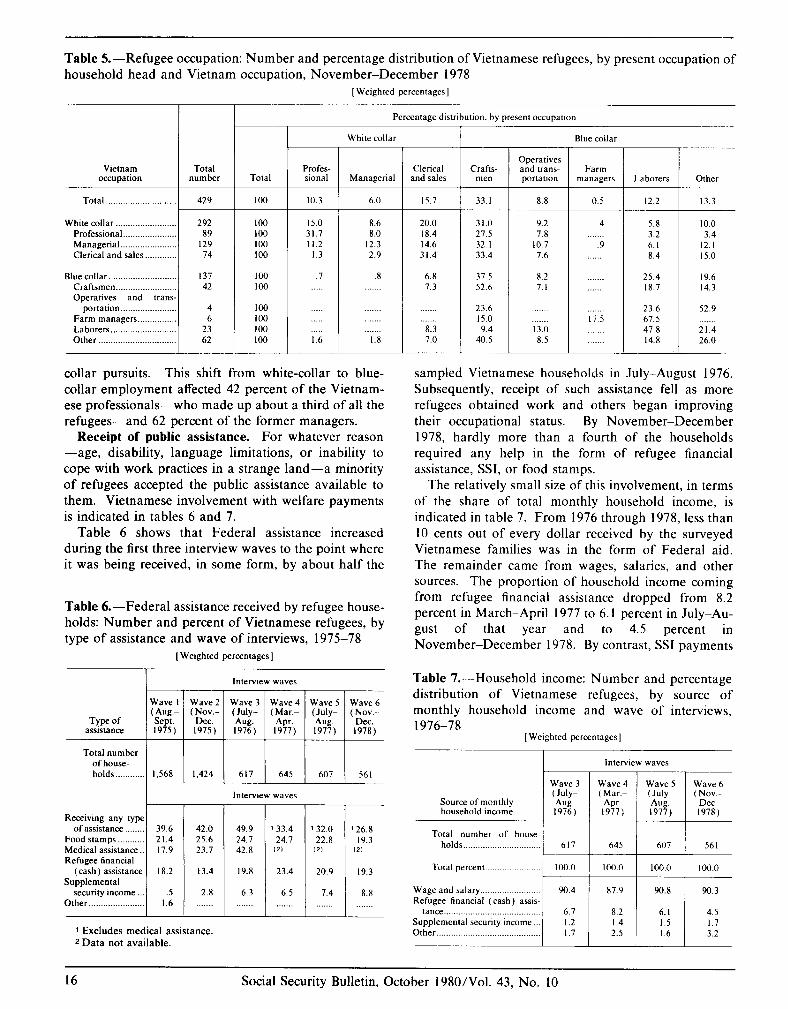
Table 5.-Refugee occupation: Number and percentage distribution of Vietnamese refugees, by present occupation of household head and Vietnam occupation, November-December 1978
[Weighted percentages]
T Percentage distribution, by present occupation
T T Blue collar White collar
Managerial Clerical Crafts-
and sales men
Operatives and trans- portation
Farm managers
Vietnam Total occupation number Total
Profes- sional Laborers Other
Total ._._..__.__._._..___......... 429 10.3 6.0 15.7 33.1 8.8 0.5 12.2 13.3
White collar .,.....,._._____.__...... 292 Professional ____.__.___._......... 89 Managerial _____.__._____.._.__... 129 Clerical and sales _.__.______._ 74
100 100 100 100
100 100
100 100 100 100
15.0 8.6 20.0 31.0 9.2 31.7 8.0 18.4 27.5 7.8 Il.2 12.3 14.6 32. I 10.7
1.3 2.9 31.4 33.4 7.6
.4
.9
5.8 10.0 3.2 3.4 6.1 12.1 8.4 15.0
Blue collar __._____.._._____.._........ Craftsmen _____.__._____.__.__..... Operatives and trans-
portation ..__._.________._____ Farm managers _._._.___._.._.. Laborers ,.....___._,..._.___....... Other _______._..______.._............
137 42
.7 .8 6.8 37.5 7.3 52.6
4 6
23 62 1.6
23.6 15.0 9.4
40.5
8.2 7. I
25.4 19.6 18.7 14.3
52.9
I.8 8.3 7.0
13.0 8.5
17.5 23.6 61.5 41.8 14.8
21.4 26.0
collar pursuits. This shift from white-collar to blue- collar employment affected 42 percent of the Vietnam- ese professionals-who made up about a third of all the refugees-and 62 percent of the former managers.
Receipt of public assistance. For whatever reason -age, disability, language limitations, or inability to cope with work practices in a strange land-a minority of refugees accepted the public assistance available to them. Vietnamese involvement with welfare payments is indicated in tables 6 and 7.
Table 6 shows that Federal assistance increased during the first three interview waves to the point where it was being received, in some form, by about half the
sampled Vietnamese households in July-August 1976. Subsequently, receipt of such assistance fell as more refugees obtained work and others began improving their occupational status. By November-December 1978, hardly more than a fourth of the households required any help in the form of refugee financial assistance, SSI, or food stamps.
The relatively small size of this involvement, in terms of the share of total monthly household income, is indicated in table 7. From 1976 through 1978, less than 10 cents out of every dollar received by the surveyed Vietnamese families was in the form of Federal aid. The remainder came from wages, salaries, and other sources. The proportion of household income coming from refugee financial assistance dropped from 8.2 percent in March-April 1977 to 6.1 percent in July-Au- gust of that year and to 4.5 percent in November-December 1978. By contrast, SSI payments
Table 6.-Federal assistance received by refugee house- holds: Number and percent of Vietnamese refugees, by type of assistance and wave of interviews, 1975-78
[Weighted percentages]
Table 7.-Household income: Number and percentage distribution of Vietnamese refugees, by source of monthly household income and wave of interviews, 1976-78
[Weighted percentages]
Interview waves
Ei Type of
assistance
Total number of house- holds ._. ._._____
Interview waves
Wave 3 Wave 4 Wave 5 Wave 6
‘2: (Mar.- (Nov.-
Source of monthly Apr. ‘% Dec. household income 1976) 1977) 1977) 1978)
Total number of house- holds ..__.__._._........_.......... 617 645 607 561
Total ._......_.__.__._._.... percent 100.0 100.0 100.0 100.0
Wage and salary _._.._._...._._.__._..... 90.4 87.9 90.8 90.3 Refugee financial (cash) assts-
tance .._..._._.__._.................... 6.7 8.2 6.1 4.5 Supplemental security income .._ 1.2 1.4 I.5 I.7 Other .._._______._...,__....................... 1.7 2.5 1.6 3.2
1,568 1.424 617 645 607 561
Interview waves
49.9 24.7 42.8
19.8
6.3
39.6 21.4 17.9
.5 I.6
’ 33.4 24.7
(2)
’ 32.0 22.8
(2)
23.4 20.9
6.5 7.4
42.0 25.6 23.7
I i
Receiving any type of asststance
Food stamps .__.____._ Medical assistance. Refugee financial
(cash) assistance Supplemental
security income Other __.__._._____.____.___
’ 26.8 19.3
(21
19.3
8.8
1 Excludes medical assistance. 2 Data not available.
16 Social Security Bulletin, October 198O/Vol. 43, No. 10
increased gradually during the last three interview waves, moving from 1.4 percent of total income in March-April 1977 to 1.7 percent in November-Decem- ber 1978.
At about the same time, a complete enumeration of the Indochinese population in the United States dis- closed that about 2 percent of the refugees were receiv- ing federally administered SSI payments. That study,14 which was conducted by the Social Security Adminis- tration’s Ofice of Research and Statistics, also revealed that:
-Aged recipients comprised 72 percent, disabled 26 percent, and blind 2 percent [of the 3,465 SSI recipients in the total population of 164,800 Indo- chinese refugees]. By comparison, in January 1976, 891 refugees were eligible for SSI-less than 1 per- cent of the refugee population at that time. Of these, 88 percent were aged, 11 percent disabled, and 1 percent blind. -The average monthly federally administered pay- ment was $197, $201, and $198 for the aged, blind, and disabled, respectively. -Women refugees were more likely than men to be receiving SSI. They accounted for 49 percent of the entire Indochina refugee population, and 61 percent of those receiving SSI. -While children represented 43 percent of all refu- gees, they comprised only 5 percent of the recipients. . . . Of the 165 Indochina refugee children who were eligible in July 1978, 30 percent were between the ages of 10 and 14, and 16 percent were under the age of 5. -Seventy-six percent of Indochina refugees eligible for federally administered SSI payments were living in their own or their parent’s household in July 1978, including 75 percent of the aged, 72 percent of the blind, and 79 percent of the disabled. . . . Since January 1976, the proportion of SSI recipients living in their own household rose from 34 percent to 75 percent among the aged, and from 33 percent to 79 percent among disabled persons. This shift in the living arrangements was due, at least in part, to their movement out of the initial sponsor situation, which was required of all Indochina refugees at the outset of the resettlement program.15
Covered Earnings Under the OASDHI Program*
In 1977, about 6 1,000 refugees from Vietnam, Cam- bodia, and Laos were reported with covered earnings under the old-age, survivors, disability, and health
14 Arthur L. Kahn, Indochina Refugees Receiving Supplemental Security Income, July 1978 (Research and Statistics Note No. 6), Office of Research and Statistics, Office of Policy, Social Security Administration, 1980.
15 Ibid., pages 1-2. * This section was prepared by Harold A. Grossman, Division of
OASDI Statistics, Office of Research and Statistics, Office of Policy, Social Security Administration. For additional tables and a more detailed discussion of the data on this subject, see Harold A. Grossman, “OASDHI-Covered Earnings of Indochina Refugees, 1977” (unpublished paper available from the author).
insurance (OASDHI) program. They represented about 45 percent of the 135,000 Indochinese refugees who had had a social security number issued to and processed for them from April 1975 through the end of 1977. (About 149,000 refugees were resettled in the United States during that period.) Among those aged 20-59, about 74 percent had covered earnings. The proportions were 86 percent for men and 59 percent for women.
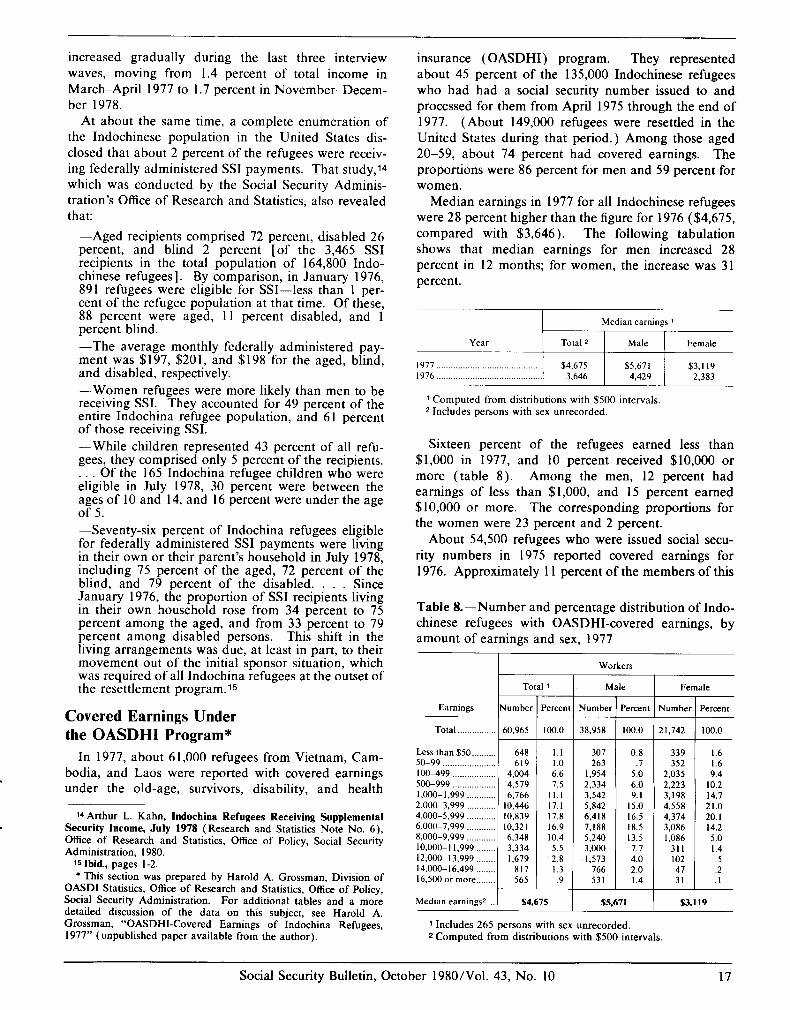
Median earnings in 1977 for all Indochinese refugees were 28 percent higher than the figure for 1976 ($4,675, compared with $3,646). The following tabulation shows that median earnings for men increased 28 percent in 12 months; for women, the increase was 31 percent.
. ..m
1977 , 1976 __._......_._.._.__......................... ,
1 Computed from distributions with $500 intervals. 2 Includes persons with sex unrecorded.
Sixteen percent of the refugees earned less than $1,000 in 1977, and 10 percent received $10,000 or more (table 8). Among the men, 12 percent had earnings of less than $1,000, and 15 percent earned $10,000 or more. The corresponding proportions for the women were 23 percent and 2 percent.
About 54,500 refugees who were issued social secu- rity numbers in 1975 reported covered earnings for 1976. Approximately 11 percent of the members of this
Table &-Number and percentage distribution of Indo- chinese refugees with OASDHI-covered earnings, by amount of earnings and sex, 1977
,
t--ET Earnings Number I =ercenc Number Percent Number
Total .__._.______.___ 60,965 100.0 38,958 100.0 21,742
Less than $50 _._._._.._ 648 50-99 . . . . . . . . . .._..... 619 100499 .._._.......... 4,004 500-999 ______._.......... 4,579 I .OOO- 1,999 __._.._._._. 6,766 2,000-3.999 __._._...._. 10,446 4,000-5,999 10,839 6,000-7,999 .,....._._.. IO,32 I 8,000-9,999 ________._._ 6,348 10.000-1 1,999 3,334 12.000-13,999 .._ 1,679 14,000-16,499 ,_._.,.. 817 16.500 or more __._.___ 565
I.1 307 0.8 339 1.6 1.0 263 .7 352 1.6 6.6 1,954 5.0 2,035 9.4 7.5 2,334 6.0 2,223 10.2
II.1 3,542 9. I 3,198 14.7 17.1 5,842 15.0 4,558 21.0 17.8 6,418 16.5 4,374 20. I 16.9 7,188 18.5 3,086 14.2 10.4 5,240 13.5 1,086 5.0 5.5 3,000 7.7 311 1.4 2.8 .I,573 4.0 102 .5 1.3 766 2.0 47 .2 .9 531 1.4 31 .I
Median earnings* ._. S4.675
Workers
Male Female
‘ercent
100.0
S5,671 $3,119
1 Includes 265 persons with sex unrecorded. 2 Computed from distributions with $500 intervals.
Social Security Bulletin, October 198O/Vol. 43, No. 10 17
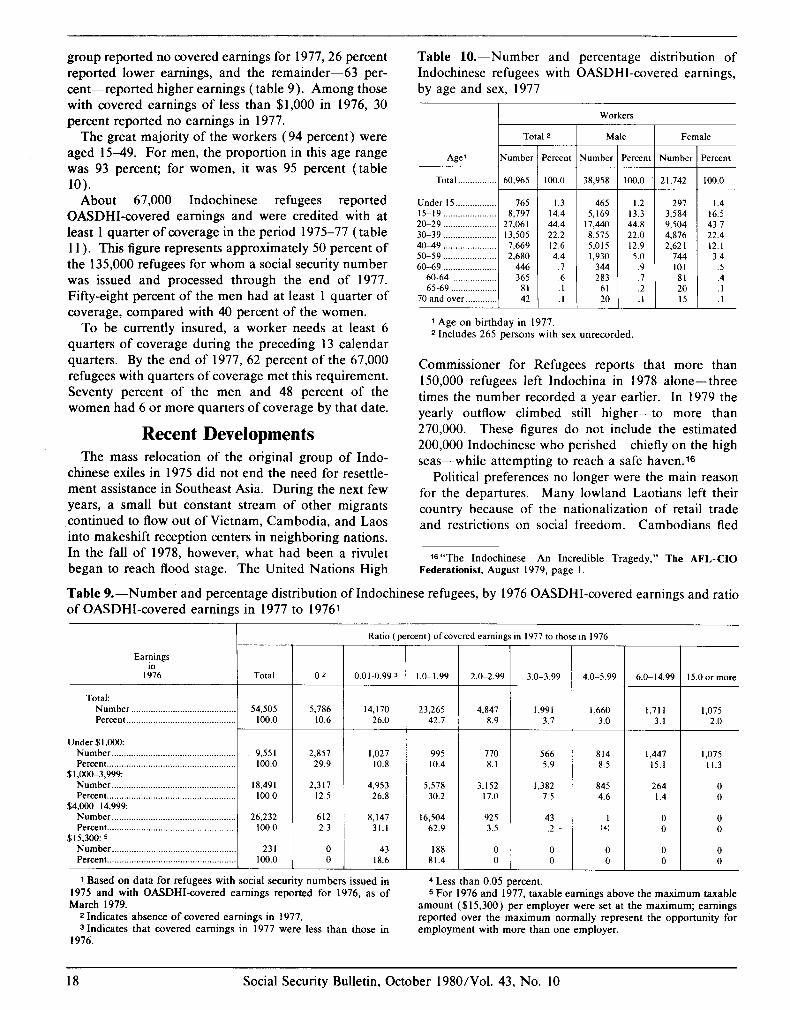
group reported no covered earnings for 1977,26 percent reported lower earnings, and the remainder-63 per- cent-reported higher earnings (table 9). Among those with covered earnings of less than $1,000 in 1976, 30 percent reported no earnings in 1977.
The great majority of the workers (94 percent) were aged 15-49. For men, the proportion in this age range was 93 percent; for women, it was 95 percent (table 10).
About 67,000 Indochinese refugees reported OASDHI-covered earnings and were credited with at least 1 quarter of coverage in the period 1975-77 (table 11). This figure represents approximately 50 percent of the 135,000 refugees for whom a social security number was issued and processed through the end of 1977. Fifty-eight percent of the men had at least 1 quarter of coverage, compared with 40 percent of the women.
To be currently insured, a worker needs at least 6 quarters of coverage during the preceding 13 calendar quarters. By the end of 1977, 62 percent of the 67,000 refugees with quarters of coverage met this requirement. Seventy percent of the men and 48 percent of the women had 6 or more quarters of coverage by that date.
Recent Developments The mass relocation of the original group of Indo-
chinese exiles in 1975 did not end the need for resettle- ment assistance in Southeast Asia. During the next few years, a small but constant stream of other migrants continued to flow out of Vietnam, Cambodia, and Laos into makeshift reception centers in neighboring nations. In the fall of 1978, however, what had been a rivulet began to reach flood stage. The United Nations High
Table lO.-Number and percentage distribution of Indochinese refugees with OASDHI-covered earnings, by age and sex, 1977
Workers
T Female I Total 2
Age’ Number
Total _.._.____.____._ 60,965 100.0
Under 15 ._._.._._._______ 165 1.3 15-19 8,797 14.4 20-29 _....__._.__._._______ 27,06 I 44.4 30-39 13,505 22.2 4049 .._.._._._..__ 7,669 12.6 SO-59 _______._._.._._______ 2,680 4.4 60-69 _____._.__._,_,_.,.... 446 .7
60-64 _._._______._._.._. 365 .6 65-69 .____._._.._.______ 8 I .I
70 and cwer ,_.___.,__,., 42 .I
Qumber I
38,958
465 5,169
17,440 8,575 5,015 1,930
344 283
61 20
,
Percent I Vumber ‘ercent
2 1,742 100.0
1.2 297 1.4 13.3 3,584 16.5 44.8 9,504 43.7 22.0 4,816 22.4 12.9 2,62 I 12.1 5.0 744 3.4
.9 101 .5
.7 81 .4
.2 20 .I
.I 15 .l
1 Age on birthday in 1977 * Includes 265 persons with sex unrecorded
Commissioner for Refugees reports that more than 150,000 refugees left Indochina in 1978 alone-three times the number recorded a year earlier. In 1979 the yearly outflow climbed still higher-to more than 270,000. These figures do not include the estimated 200,000 Indochinese who perished-chiefly on the high seas-while attempting to reach a safe haven.16
Political preferences no longer were the main reason for the departures. Many lowland Laotians left their country because of the nationalization of retail trade and restrictions on social freedom. Cambodians fled
rs“The Indochinese-An Incredible Tragedy,” The AFL-CIO Federationist, August 1979, page 1.
Table 9.-Number and percentage distribution of Indochinese refugees, by 1976 OASDHI-covered earnings and ratio of OASDHI-covered earnings in 1977 to 19761
T - Ratio (percent) of covered earnings in I977 to those in I976
Earnings in
I976 1.0-1.99 15.0 or more Total 02 0.01-0.99 3 2.0-2.99 3.0-3.99 4.0-5.99 6.0-14.99
4,847 1,991 1,660 1,711 8.9 3.7 3.0 3.1
770 566 814 1,447 8.1 5.9 8.5 15.1
3,152 1,382 845 264 17.0 7.5 4.6 1.4
925 43 I 0 3.5 .2 (4) 0
0 0 0 0 0 0 0 0
Total: Number . Percent
Under$l,OOOz Number . Percent . .._............._...............................
$ I ,OOc-3,999: Number . Percent .
$4,000-14,999: Number .._._______.__,.......,.,,.,...,....,..,,......,. Percent
$15,300: 5 Number _____.________.____............................. Percent .
54,505 5.786 100.0 10.6
1,075 2.0
14,170 23,265 26.0 42.7
9,55 I 2,857 1,027 995 100.0 29.9 10.8 10.4
I8,49 I 2,317 4,953 5,578 100.0 12.5 26.8 30.2
26,232 612 100.0 2.3
8,147 31.1
43 18.6
16,504 62.9
231 100.0
0 0
188 81.4
1,075 11.3
0 0
0 0
0 0
1 Based on data for refugees with social security numbers issued in 1975 and with OASDHI-covered earnings reported for 1976, as of March 1979.
a Indicates absence of covered earnings in 1977. s Indicates that covered earnings in 1977 were less than those in
1976.
4 Less than 0.05 percent, 5 For 1976 and 1977, taxable earnings above the maximum taxable
amount ($15,300) per employer were set at the maximum; earnings reported over the maximum normally represent the opportunity for employment with more than one employer.
Social Security Bulletin, October 198O/Vol. 43, No. 10
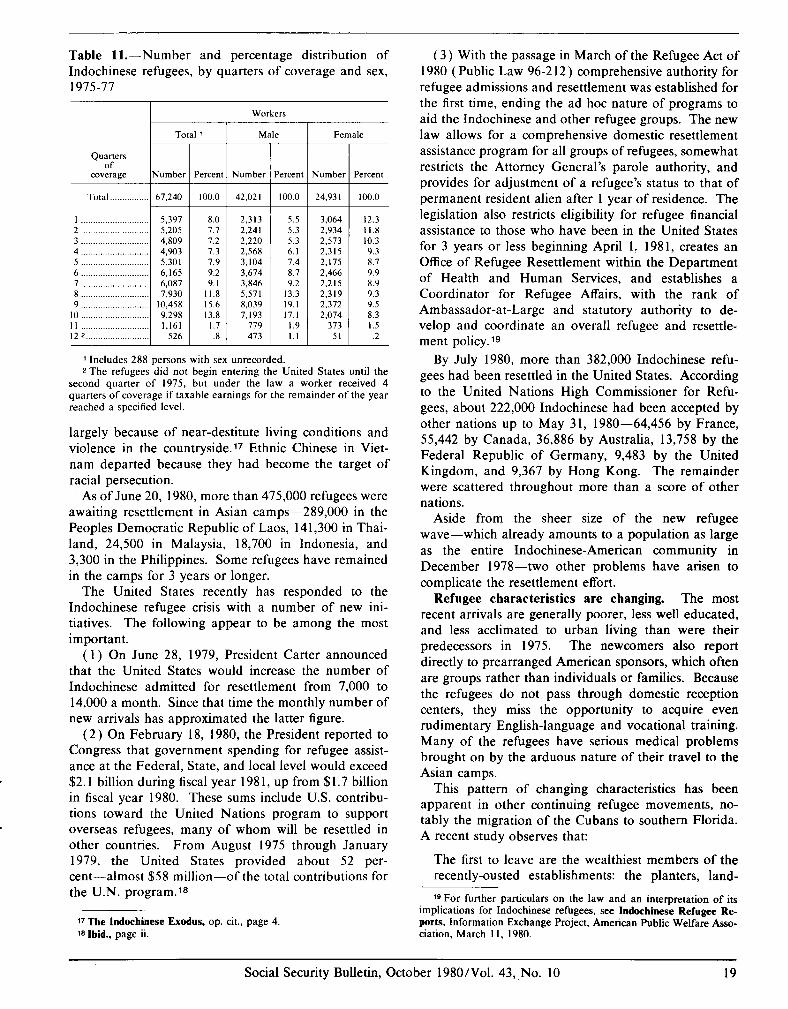
Table Il.-Number and percentage distribution of Indochinese refugees, by quarters of coverage and sex, 1975-77
/ T M.Cile T Female
Numbei
Total _____._._._.._._ 67,240
I ............................ 5,397 8.0 5.5 3,064 12.3 2 ............................ 5,205 7.7 5.3 2,934 I I.8 3 ............................ 4,809 1.2 5.3 2,573 10.3 4 ............................ 4,903 1.3 6.1 2,315 9.3 5 ............................ 5,301 7.9 7.4 2,175 8.7 6 ............................ 6,165 9.2 a.1 2,466 9.9 7 ............................ 6,087 9. I 9.2 2,215 8.9 8 ............................ 7,930 11.8 13.3 2,319 9.3 9 ............................ 10,458 15.6 19.1 2,372 9.5
IO ............................ 9,298 13.8 17.1 2,074 8.3 II ............................ 1,161 I.7 1.9 373 1.5 12 2.. ........................ 526 .8 I.1 51 .2
2,313 2,241 2,220 2,568 3,104 3,674 3,846 5,571 8,039 7,193
779 473
‘ercem Number
100.0 42,02 I 100.0 24,93 I 100.0
Workers
Percent slumber
1 Includes 288 persons with sex unrecorded. a The refugees did not begin entering the United States until the
second quarter of 1975, but under the law a worker received 4 quarters of coverage if taxable earnings for the remainder of the year reached a specified level.
largely because of near-destitute living conditions and violence in the countryside.17 Ethnic Chinese in Viet- nam departed because they had become the target of racial persecution.
As of June 20, 1980, more than 475,000 refugees were awaiting resettlement in Asian camps-289,000 in the Peoples Democratic Republic of Laos, 14 1,300 in Thai- land, 24,500 in Malaysia, 18,700 in Indonesia, and 3,300 in the Philippines. Some refugees have remained in the camps for 3 years or longer.
The United States recently has responded to the Indochinese refugee crisis with a number of new ini- tiatives. The following appear to be among the most important.
( 1) On June 28, 1979, President Carter announced that the United States would increase the number of Indochinese admitted for resettlement from 7,000 to 14,000 a month. Since that time the monthly number of new arrivals has approximated the latter figure.
(2) On February 18, 1980, the President reported to Congress that government spending for refugee assist- ance at the Federal, State, and local level would exceed $2.1 billion during fiscal year 198 1, up from $1.7 billion in fiscal year 1980. These sums include U.S. contribu- tions toward the United Nations program to support overseas refugees, many of whom will be resettled in other countries. From August 1975 through January 1979, the United States provided about 52 per- cent-almost $58 million-of the total contributions for the U.N. program.18
17 The Indochinese Exodus, op. cit., page 4 18 Ibid., page ii.
(3) With the passage in March of the Refugee Act of 1980 (Public Law 96-212) comprehensive authority for refugee admissions and resettlement was established for the first time, ending the ad hoc nature of programs to aid the Indochinese and other refugee groups. The new law allows for a comprehensive domestic resettlement assistance program for all groups of refugees, somewhat restricts the Attorney General’s parole authority, and provides for adjustment of a refugee’s status to that of permanent resident alien after 1 year of residence. The legislation also restricts eligibility for refugee financial assistance to those who have been in the United States for 3 years or less beginning April 1. 198 1, creates an Office of Refugee Resettlement within the Department of Health and Human Services, and establishes a Coordinator for Refugee Affairs, with the rank of Ambassador-at-Large and statutory authority to de- velop and coordinate an overall refugee and resettle- ment policy. 1s
By July 1980, more than 382,000 Indochinese refu- gees had been resettled in the United States. According to the United Nations High Commissioner for Refu- gees, about 222,000 Indochinese had been accepted by other nations up to May 3 1, 1980-64,456 by France, 55,442 by Canada, 36,886 by Australia, 13,758 by the Federal Republic of Germany, 9,483 by the United Kingdom, and 9,367 by Hong Kong. The remainder were scattered throughout more than a score of other nations.
Aside from the sheer size of the new refugee wave-which already amounts to a population as large as the entire Indochinese-American community in December 1978-two other problems have arisen to complicate the resettlement effort.
Refugee characteristics are changing. The most recent arrivals are generally poorer, less well educated, and less acclimated to urban living than were their predecessors in 1975. The newcomers also report directly to prearranged American sponsors, which often are groups rather than individuals or families. Because the refugees do not pass through domestic reception centers, they miss the opportunity to acquire even rudimentary English-language and vocational training. Many of the refugees have serious medical problems brought on by the arduous nature of their travel to the Asian camps.
This pattern of changing characteristics has been apparent in other continuing refugee movements, no- tably the migration of the Cubans to southern Florida. A recent study observes that:
The first to leave are the wealthiest members of the recently-ousted establishments: the planters, land-
1s For further particulars on the law and an interpretation of its implications for Indochinese refugees, see Indochinese Refugee Re- ports, Information Exchange Project, American Public Welfare Asso- ciation, March II, 1980.
Social Security Bulletin, October 198O/Vol. 43, No. 10 19
lords, bankers and high government officials; next come the professionals, other businessmen and middle level government officials; then persons lower on the occupational scale, as well as continuing flows of relatives of all of the above. Generally it is the most assertive, the most prominent and the most ideological who leave the nation first.20 The refugees are migrating internally. While spon-
sors are not legally bound to assist the refugees in their charge, it is also true that refugees are not obligated to remain with their sponsors. Once they are resettled in the United States, the Indochinese are free to move about as they wish. By July 1980, more than half the refugees were clustered in five States-California, Texas, Washington, Pennsylvania, and Illinois. Two- thirds of them resided in 10 States-those listed above plus Minnesota, Oregon, New York, Louisiana, and Virginia.
Though population shifts of this magnitude may be surprising to native-born Americans, they are under- standable in light of the recent experiences of many Indochinese. An older Vietnamese, for example, may already have participated in four migrations in the space of a quarter-century: from North Vietnam to the South following the Geneva Agreements of 1954; from South Vietnam to an Asian camp at the end of the conflict; from the camp to a U.S. reception center; and from that center to the sponsor’s location. For such a person, another trip-perhaps in the relative comfort of a cross-country bus-would not seem perilous.
The most popular destination for these internal mi- grants is California. In July, nearly 122,000 Indo- chinese refugees, or about a third of the U.S. total, were living there. The existence of ethnic enclaves and the desire to achieve family reunification exert so strong an appeal that States with the largest refugee populations may well see them grow at an even faster pace than in other jurisdictions. California officials believe that their State could contain about half of the 600,000 Indo- chinese expected to be residing in this country by late 1983.2’
m Julia Vadala Taft, David S. North, and David A. Ford, Refugee Resettlement in the U.S.: Time for a New Focus, New TramCentury Foundation, July 3 1, 1979, page 14. This report was prepared for the Social Security Administration under Grant No. 18-P-00100/3-01.
21 Alice Z. Cuneo, “California Faces Costs for Asian Refugees,” San Jose Mercury News, March 9, 1980.
Nguyen Van Chau, head of the Indochina Refugee Program in South East Texas, observes that “the Indo- chinese have gone instinctively to downtown areas where they can find cheap housing, putting them very close to low-income black and Mexican-Americans.“** In some cases, the newcomers have incurred the resent- ment of their neighbors, not only because of the special treatment they receive in such areas as public assistance and education, but also because their proximity has brought them into direct competition with dis- advantaged citizens for jobs, public housing, and public health services.
Though the infusion of large numbers of poorly educated Indochinese into areas where unskilled jobs are scarce is likely to lead temporarily to higher welfare outlays, it should not necessarily be assumed that the refugees will become a long-term burden for the economy. By escaping from their native land, they have demonstrated self-reliance and the ability to overcome hardships-qualities that helped earlier generations of immigrants to make their own way in the United States. It should also be emphasized that, as they become economically productive, the refugees will be aiding not only themselves but their adopted Nation as well.
As Michael Barone, senior vice president of Peter D. Hart Research Associates, points out:
Birthrates have fallen since the 1960’s to levels close to zero population growth that are typical of ad- vanced countries. Starting around the year 2010, therefore, we are going to have quite a large number of people retired on Social Security and a relatively small number of people working and paying for Social Security. . . . This situation cannot be avoided, given the birth rates from 1945 to 1980, unless one thing happens: the working population of this country rises substantially. And that can happen in only one way: substantial immigration, as in the years before and just after World War I. There are obviously hundreds of thousands . . . who want to come. As the 1980’s go on, most of them will be people born after 1960-just the age of people we need to have working to support the elderly baby- boom generation in the years after 2010. It is to our advantage, not to keep them out, but to let them in.23
22 Nguyen Van Chau in “Help for the Indochinese: How Much Is Too Much?” (opinion department), Public Welfare, summer 1980, page 9.
2s Michael Barone, “Immigration: Best of Both Worlds,” Washing- ton Post, June 8, 1980.
20 Social Security Bulletin, October 198O/Vol. 43, No. 10