Embed Size (px)
Citation preview
Software Company Assignment
2008 MBA/ENG 290G
International Competition in Technology

Team 4
2008 SaaS Industry Overview
Christian HuthLakshmi Jagannathan Christopher Quek Daisuke TanakaJohn Michael Wyrwas
Executive summary
1. SaaS market had a size of $2.4B in 2007 and shows strong growth of 36%
2. CRM and Talent Management applications account for 90% of total SaaS sales; other applications show strong market growth
3. SalesForce.com market leader followed by several medium-sized players; market concentration through expected consolidation in SaaS
4. High number of companies offering SaaS solutions; category leaders and platforms are emerging (e.g. Salesforce.com, Omniture, DemandTec)
5. Risks in data security lapses (deflating customer confidence) and aggressive investments of large traditional software vendors for smaller players
6. P/E for valuation not applicable mainly due to deferred revenue model; new models of evaluation are emerging
SaaS will penetrate and disrupt traditional software
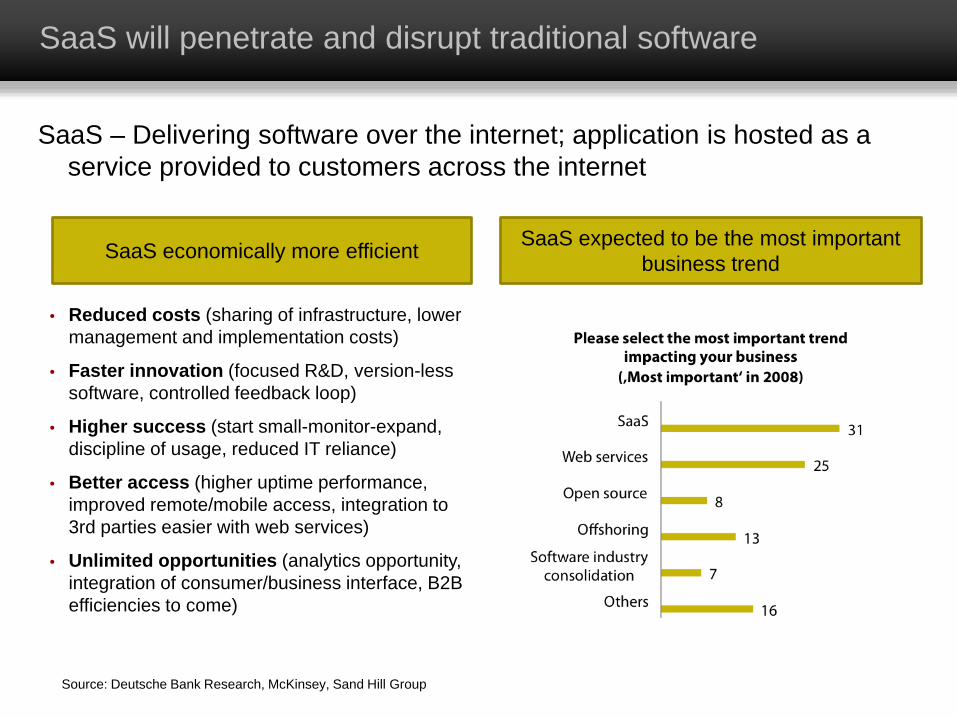
SaaS – Delivering software over the internet; application is hosted as a service provided to customers across the internet
SaaS expected to be the most important business trendSaaS economically more efficient
• Reduced costs (sharing of infrastructure, lower management and implementation costs)
• Faster innovation (focused R&D, version-less software, controlled feedback loop)
• Higher success (start small-monitor-expand, discipline of usage, reduced IT reliance)
• Better access (higher uptime performance, improved remote/mobile access, integration to 3rd parties easier with web services)
• Unlimited opportunities (analytics opportunity, integration of consumer/business interface, B2B efficiencies to come)
Source: Deutsche Bank Research, McKinsey, Sand Hill Group
SaaS market with has reached $2.4B in 2007 with growth of 36%
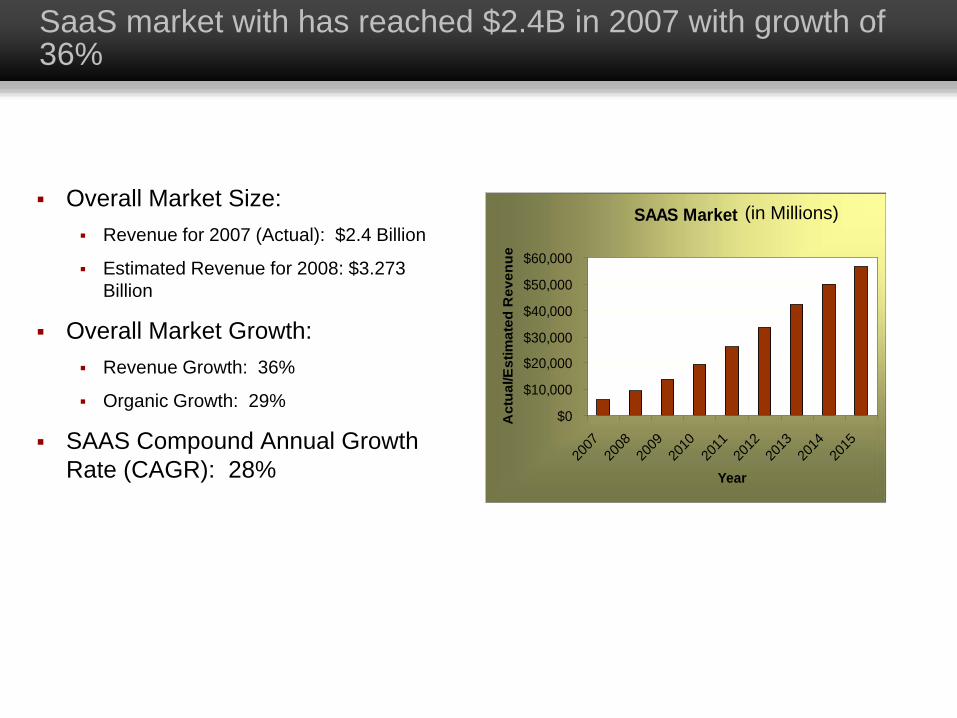
Overall Market Size: Revenue for 2007 (Actual): $2.4 Billion
Estimated Revenue for 2008: $3.273 Billion
Overall Market Growth: Revenue Growth: 36%
Organic Growth: 29%
SAAS Compound Annual Growth Rate (CAGR): 28%
SAAS Market
$0
$10,000
$20,000
$30,000
$40,000
$50,000
$60,000
2007
2008
2009
2010
2011
2012
2013
2014
2015
Year
Act
ual/E
stim
ated
Rev
enue
(in Millions)
Reasons for SaaS Market Growth
1) Leadership: Solution captures the mindshare of customers and partners, and is perceived as
being the best in the market accompanied with the best support.
2) Market Opportunity: Solutions compete with On Premise/On Demand software peers to
solve existing problems but also provide rapid innovation to solve new challenges.
3) Competition: Direct competition is limited, with high value of intellectual property, while the
market is showing rapid adoption.
4) Markets and Verticals: Products are focused on the correct vertical (fastest adopters) and
customer segment (Enterprise or SMB).
5) Budget: Perceived value and ROI, beyond “low deployment cost” are compelling to C-level
executives.
6) Demand: Awareness for the solution is increasing.
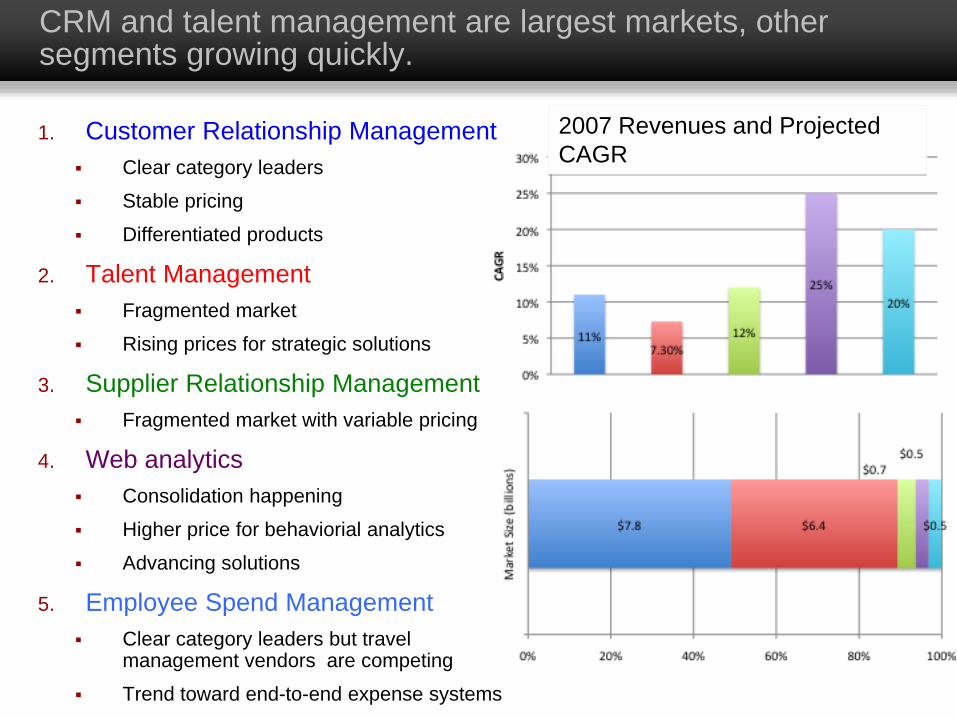
CRM and talent management are largest markets, other segments growing quickly.
1. Customer Relationship Management Clear category leaders
Stable pricing
Differentiated products
2. Talent Management Fragmented market
Rising prices for strategic solutions
3. Supplier Relationship Management Fragmented market with variable pricing
4. Web analytics Consolidation happening
Higher price for behaviorial analytics
Advancing solutions
5. Employee Spend Management Clear category leaders but travel
management vendors are competing
Trend toward end-to-end expense systems
2007 Revenues and Projected CAGR
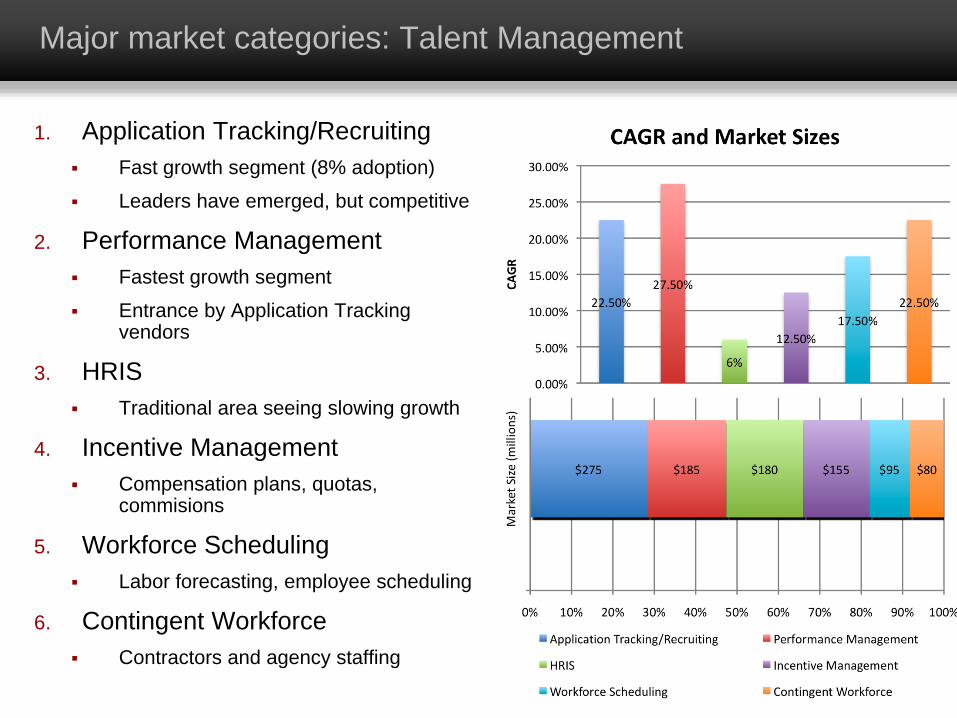
Major market categories: Talent Management
1. Application Tracking/Recruiting Fast growth segment (8% adoption)
Leaders have emerged, but competitive
2. Performance Management Fastest growth segment
Entrance by Application Tracking vendors
3. HRIS Traditional area seeing slowing growth
4. Incentive Management Compensation plans, quotas,
commisions
5. Workforce Scheduling Labor forecasting, employee scheduling
6. Contingent Workforce Contractors and agency staffing
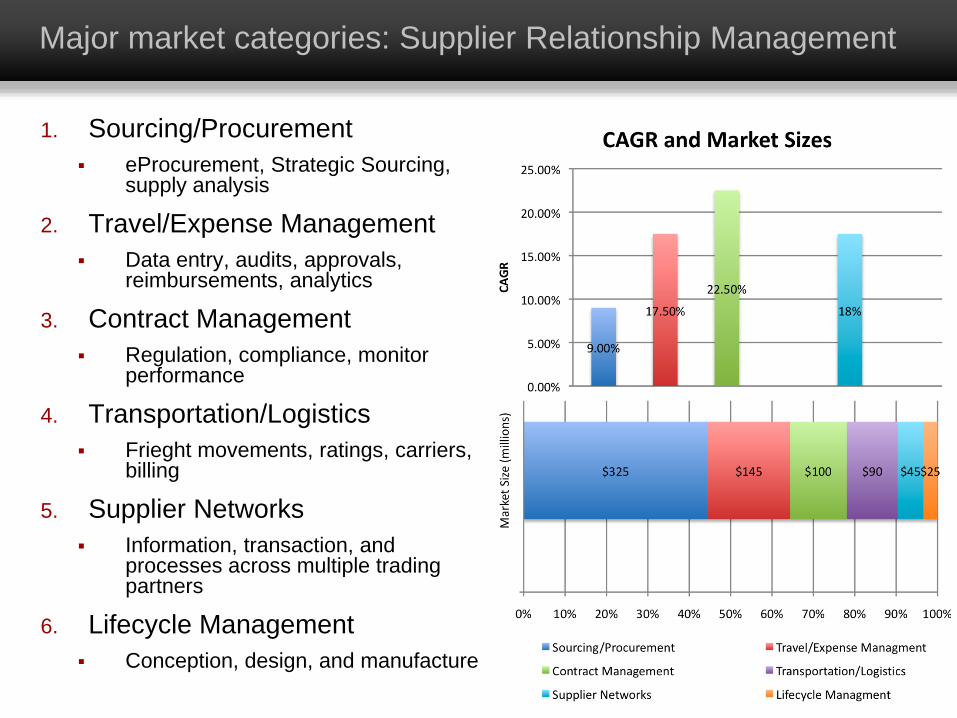
Major market categories: Supplier Relationship Management
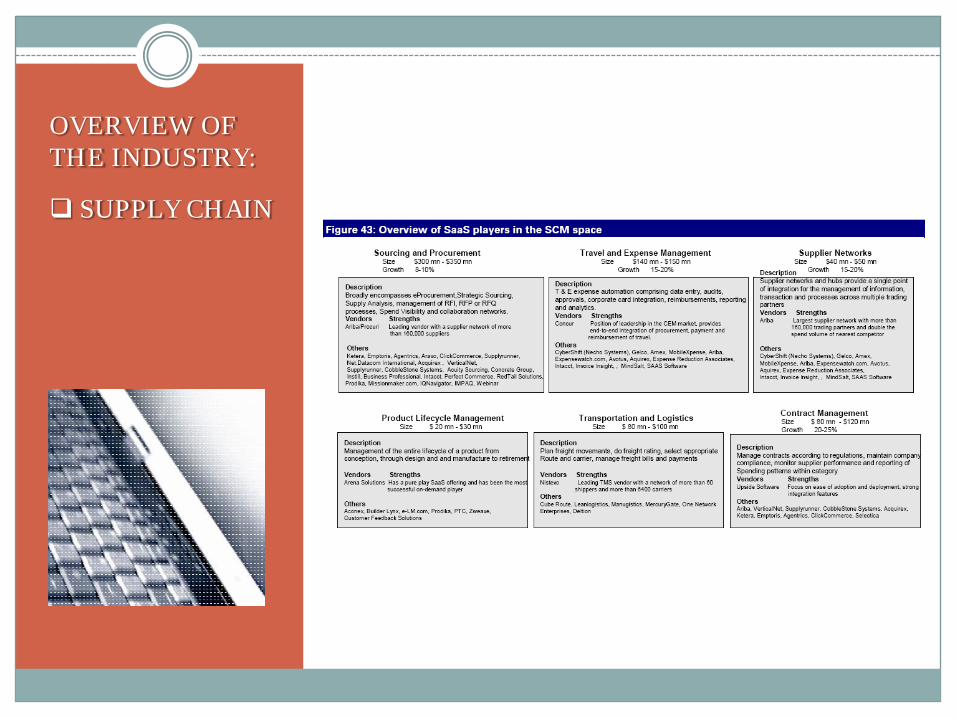
1. Sourcing/Procurement eProcurement, Strategic Sourcing,
supply analysis
2. Travel/Expense Management Data entry, audits, approvals,
reimbursements, analytics
3. Contract Management Regulation, compliance, monitor
performance
4. Transportation/Logistics Frieght movements, ratings, carriers,
billing
5. Supplier Networks Information, transaction, and
processes across multiple trading partners
6. Lifecycle Management Conception, design, and manufacture
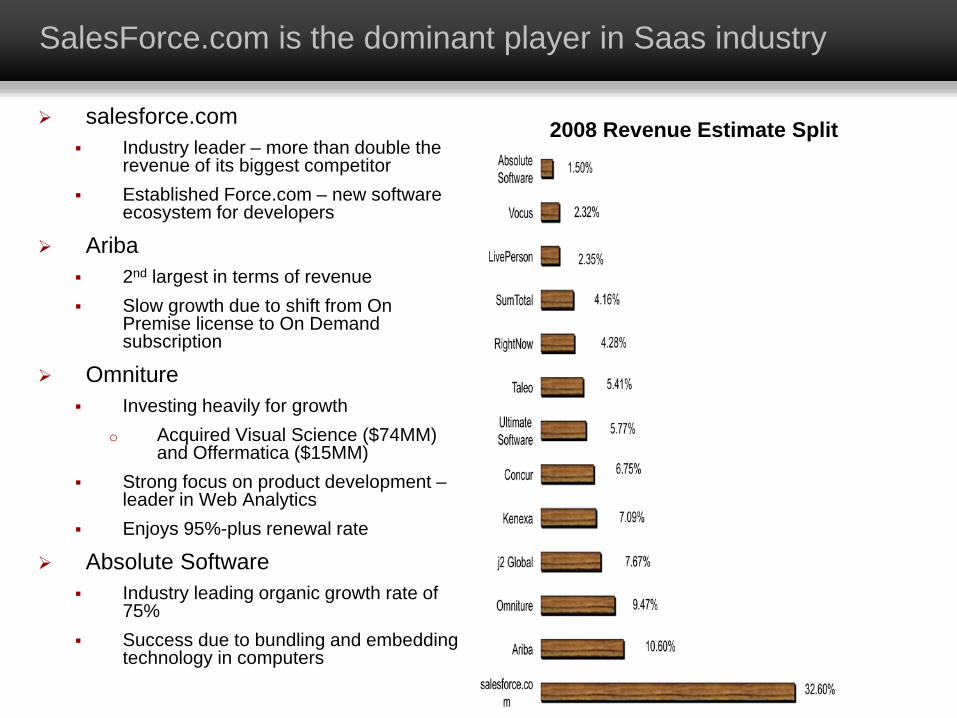
SalesForce.com is the dominant player in Saas industry
salesforce.com Industry leader – more than double the
revenue of its biggest competitor Established Force.com – new software
ecosystem for developers
Ariba 2nd largest in terms of revenue Slow growth due to shift from On
Premise license to On Demand subscription
Omniture Investing heavily for growth
o Acquired Visual Science ($74MM) and Offermatica ($15MM)
Strong focus on product development –leader in Web Analytics
Enjoys 95%-plus renewal rate
Absolute Software Industry leading organic growth rate of
75% Success due to bundling and embedding
technology in computers
2008 Revenue Estimate Split
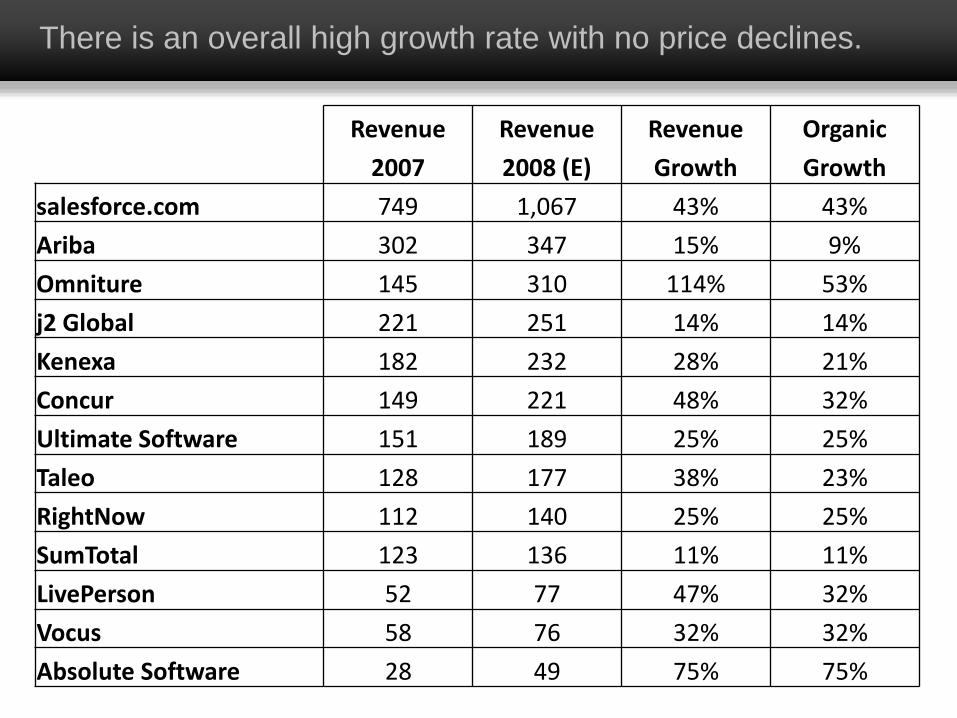
There is an overall high growth rate with no price declines.
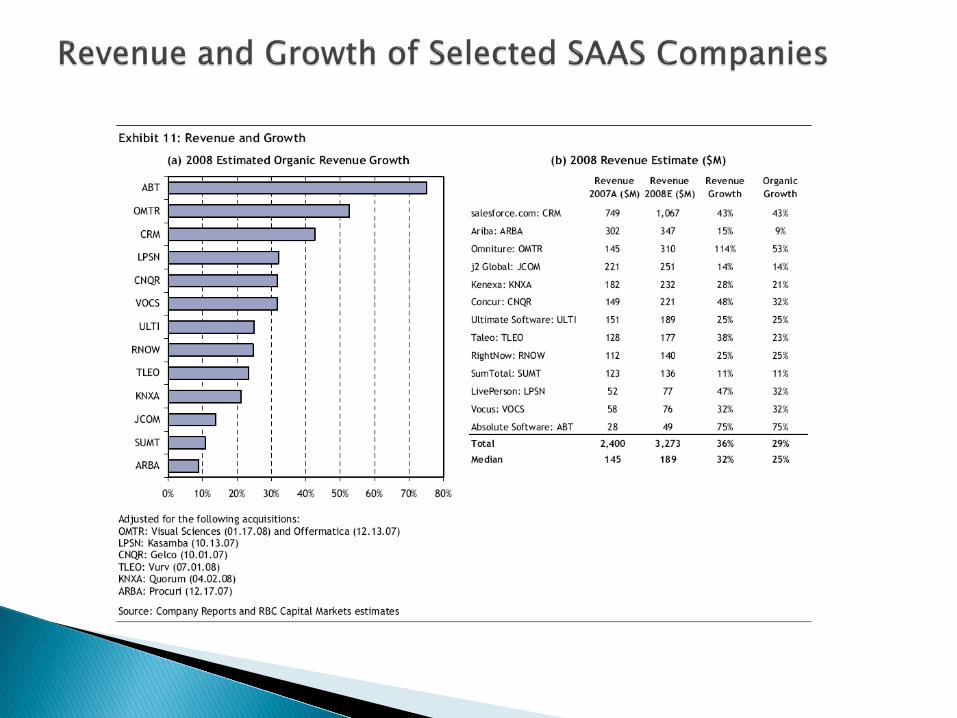
Revenue Revenue Revenue Organic
2007 2008 (E) Growth Growth
salesforce.com 749 1,067 43% 43%
Ariba 302 347 15% 9%
Omniture 145 310 114% 53%
j2 Global 221 251 14% 14%
Kenexa 182 232 28% 21%
Concur 149 221 48% 32%
Ultimate Software 151 189 25% 25%
Taleo 128 177 38% 23%
RightNow 112 140 25% 25%
SumTotal 123 136 11% 11%
LivePerson 52 77 47% 32%
Vocus 58 76 32% 32%
Absolute Software 28 49 75% 75%
Why Traditional Valuations Don’t Work
Traditional P/E Valuation does not work with SaaS companies because:1. Deferred Revenue model distorts the actual revenue from software sales.
Software companies that use a traditional business model report large up-front revenues. This allows them to report the revenues for a software sale at the time of sale.
SaaS companies collect incremental revenues over time. Thus the initial reported revenue for a SaaS software sale is not indicative of the total value of the contract.
The revenue stream for SaaS companies looks more like an annuity due to the nature of the product and the payment stream.
2. SaaS is still a new business model and is in the process of gaining market acceptance. Since it is a new industry, the cost of customer acquisition are high and the revenue stream
is small. This puts artificial downward pressure on profit margins and earnings.
As the industry matures and the business model gains acceptance, the P/E ratio of SaaS companies will gravitate towards the P/E ratio of traditional software companies. This is because profit margins will improve and the revenue streams will become larger.
Proposed Valuation Techniques
There are many possible alternatives to P/E valuation:1. Lifetime Value/Customer Acquisition Costs.
This process involves estimating the Lifetime Value of an individual customer contract against the costs of acquiring that customer.
The results are then aggregated and used to estimate current and future revenues.
An essential part of this valuation method involves estimating customer churn because this affects both revenues and costs.
2. Renewal Revenue + New Customer Revenue. Revenue growth should always be positive, but it is important to split revenues into
“Renewal” and “New Customer” Revenues.
Renewal Revenue must always be higher than New Customer Revenue.
If the ratio of Renewal to New Customer Revenues falls below a certain threshold than this could indicate a problem with a company’s product that causes customer churn.
3. Create a Valuation Model for a SaaS Vendor’s Ecosystem. Some SaaS business models relies heavily on network effects for continued success.
The larger the ecosystem the more likely that customers will be sticky.
Measuring the profitability of partners and sizing the supporting ecosystem is a way to measure the value of a SaaS company.
Team 9
Group 9
James AnZishan Khan
James SuBoaz Ur
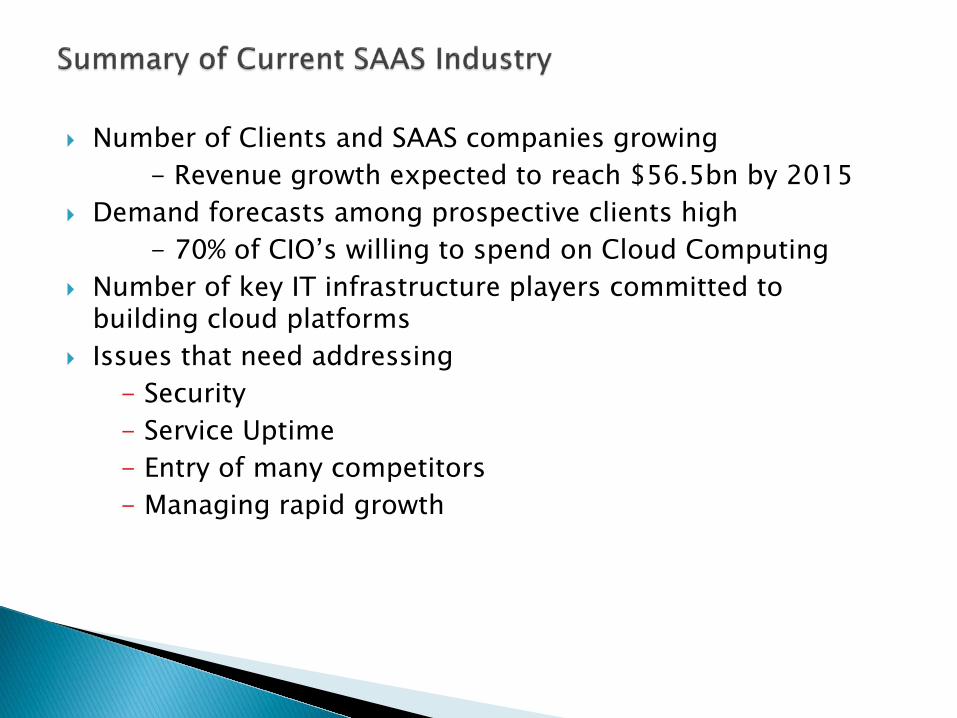
Number of Clients and SAAS companies growing - Revenue growth expected to reach $56.5bn by 2015
Demand forecasts among prospective clients high- 70% of CIO’s willing to spend on Cloud Computing
Number of key IT infrastructure players committed to building cloud platforms
Issues that need addressing- Security- Service Uptime- Entry of many competitors- Managing rapid growth
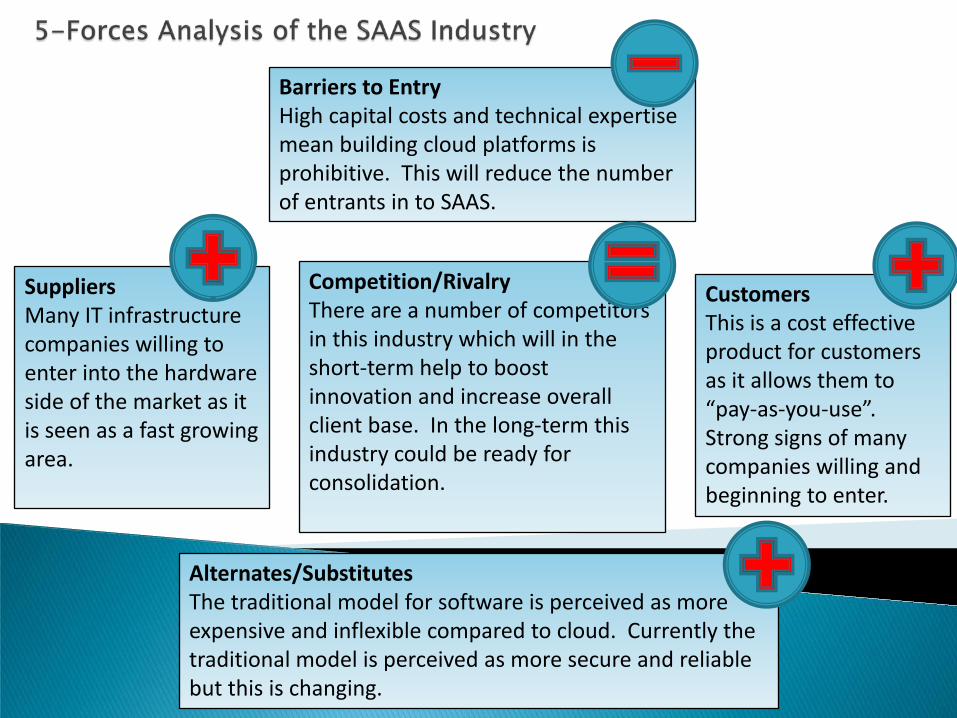
CustomersThis is a cost effective product for customers as it allows them to “pay-as-you-use”. Strong signs of many companies willing and beginning to enter.
Barriers to EntryHigh capital costs and technical expertise mean building cloud platforms is prohibitive. This will reduce the number of entrants in to SAAS.
SuppliersMany IT infrastructure companies willing to enter into the hardware side of the market as it is seen as a fast growing area.
Alternates/SubstitutesThe traditional model for software is perceived as more expensive and inflexible compared to cloud. Currently the traditional model is perceived as more secure and reliable but this is changing.
Competition/RivalryThere are a number of competitors in this industry which will in the short-term help to boost innovation and increase overall client base. In the long-term this industry could be ready for consolidation.
Reduced Costs – sharing of infrastructure, outsourcing applications, and lower implementation costs
Faster Innovation – focused R&D dollars, version-less software, and controlled feedback loop
Higher Success – customized configuration capabilities Better Access – mobile access and integration with 3rd parties Unlimited Opportunities – analytics and business/customer
interface
Source: Deutsche Bank
Enterprise Resource Planning (ERP) Customer Relationship Management (CRM) Spend Management Supply Chain Management (SCM) Web Analytics Human Resources
PE ratio, based on upfront and subscription revenues, does not give a complete picture of the cloud/SAAS industry
• High growth industry- Of 250 companies profiled last year, 24 were removed due to acquisitions, IPOs, and just 1 has closed down; another 100 new companies are added this year (RBC Capital)
•PE ratio does not account for deferred revenue- metrics that include cash flow and bookings will account for at least a portion of deferred revenue
•Front-end loaded customer acquisition costs•Lifetime value of customer bases is much higher than most people perceived
• Measure customer retention- A number that gives a better sense of acquired long-term customer base to account for the lifetime value of the customers (recurring revenue)• As the customers’ usage increases with time, SaaS models tend to get more sticky, and a slowing growth rate would occur, with revenue mix shift to longer tenured customers• Account for customer acquisition cost and report as per annualized dollar of profit acquired• Annual customer attrition rate should be estimated to project future subscription profit stream
Entrance of major vendors into the market-Many large scale vendors looking to enter and may
cause consolidation in the industry
Further Reliability enhancements-This will allay fears of Security & Service Uptime helping
to convince larger firms to enter the market
Combined cloud services gives Economies of Scale-Ability to deliver multiple cloud services (SAAS, platform
computing) will give vendors advantages
Resolution to geographical challenges-Tradeoffs between cheap power versus latency-Political restraints on data location

Team 5
Team 5
What is SaaS? “Software as a service (SaaS)” is a software distribution
model in which applications are hosted by a vendor or service provider and made available to customers over a network, typically the Internet.
SaaS is closely related to other software delivery models: ASP (Application Service Provider) hosted application
management model is similar to ASP: a provider hosts commercially available software for customers and delivers it over the Web
On Demand Computing in the software on demand model, the provider gives customers network-based access to a single copy of an application created specifically for SaaS distribution.
It is regarded as the most important trend impacting IT infrastructure in business (McKinsey & Co. & Sandhill Group Survey 2008).
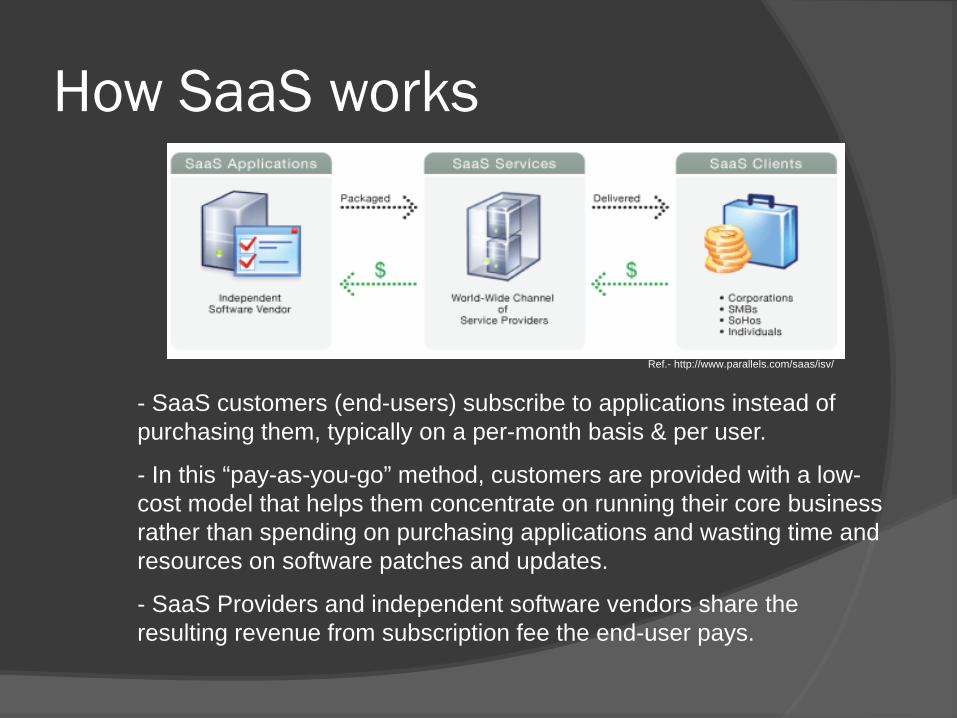
How SaaS works
- SaaS customers (end-users) subscribe to applications instead of purchasing them, typically on a per-month basis & per user.
- In this “pay-as-you-go” method, customers are provided with a low-cost model that helps them concentrate on running their core business rather than spending on purchasing applications and wasting time and resources on software patches and updates.
- SaaS Providers and independent software vendors share the resulting revenue from subscription fee the end-user pays.
Ref.- http://www.parallels.com/saas/isv/
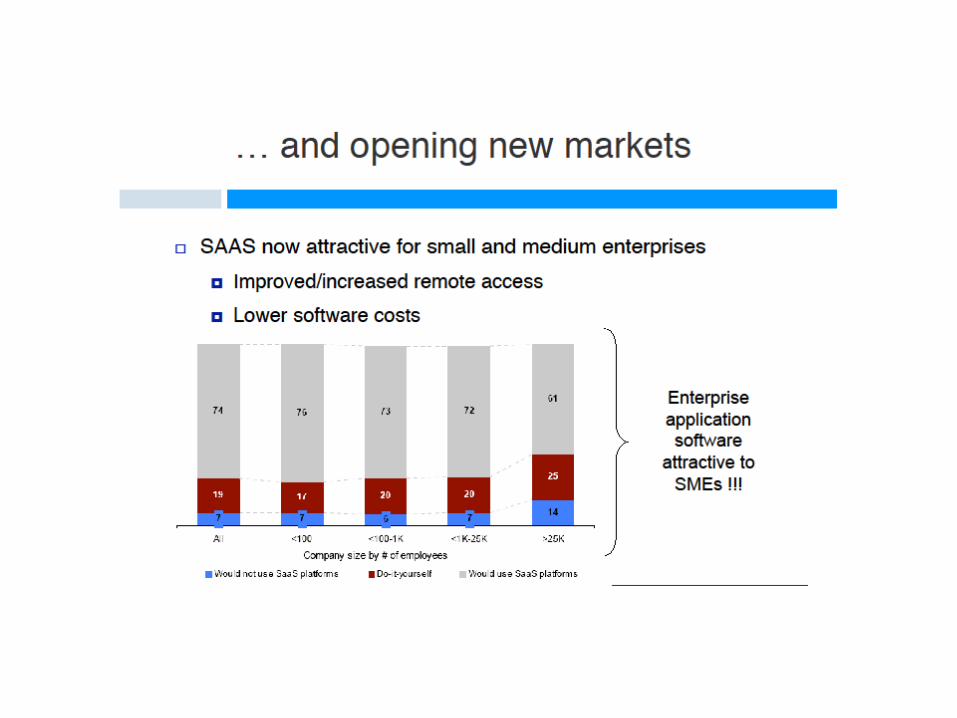
A new market called SaaS The employment of SaaS applications has increased in most geographical
regions:- US is the largest SaaS market, followed by Europe and Asia-Pacific.
Traditional SaaS applications have been in CRM (Customer Relationship Management), HR, web conferencing (e.g. WebEx) and payroll systems.
Newer segments for SaaS expansion are insurance companies and the telecom sector (Telus, British Telecom and XO Communications have moved into SaaS services).
As a result of the recent economic downturn, it is expected that more SMBs (especially emerging companies) will adopt SaaS solutions in the long term to minimize initial software investments.
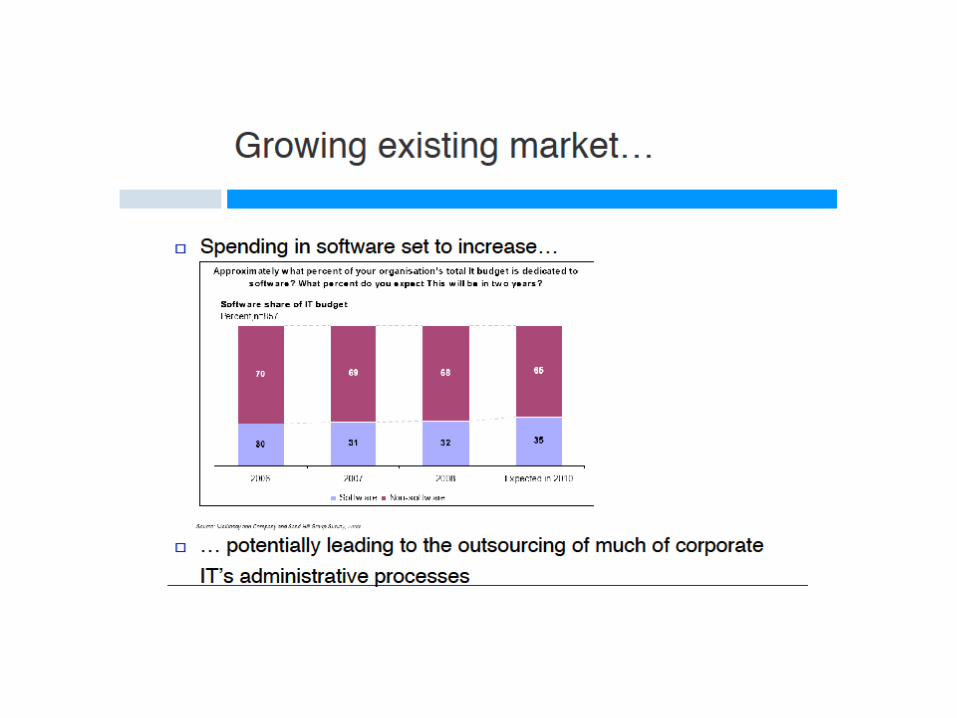
Key Findings[1]
SMBs spent USD 3.2 billion on SaaS applications in 2007, compared to USD 5.3 billion on packaged software
by the end of 2008, more than 55% of businesses based in North America will have deployed at least one SaaS application, with Europe at more than 40%; and the SaaS market in Asia will reach USD 1.6 billion by 2010, with a CAGR of 66%.
[1] Analyst Perspectives, The Global SaaS Market, 3/18/2008
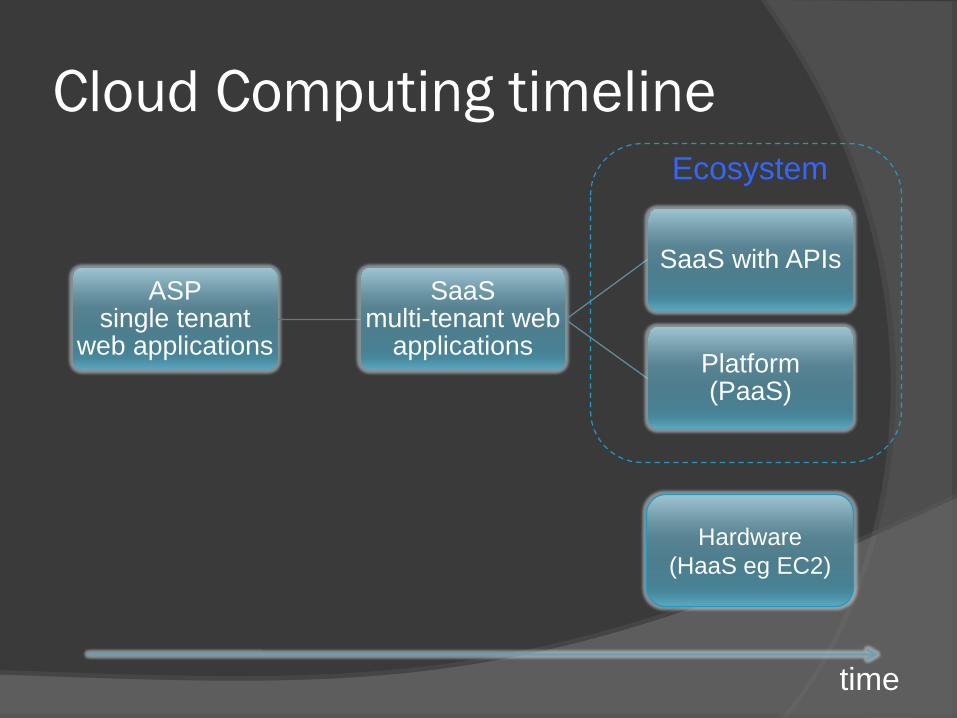
Cloud Computing timeline
ASPsingle tenant
web applications
SaaSmulti-tenant web
applications
SaaS with APIs
Platform(PaaS)
Hardware (HaaS eg EC2)
Ecosystem
time
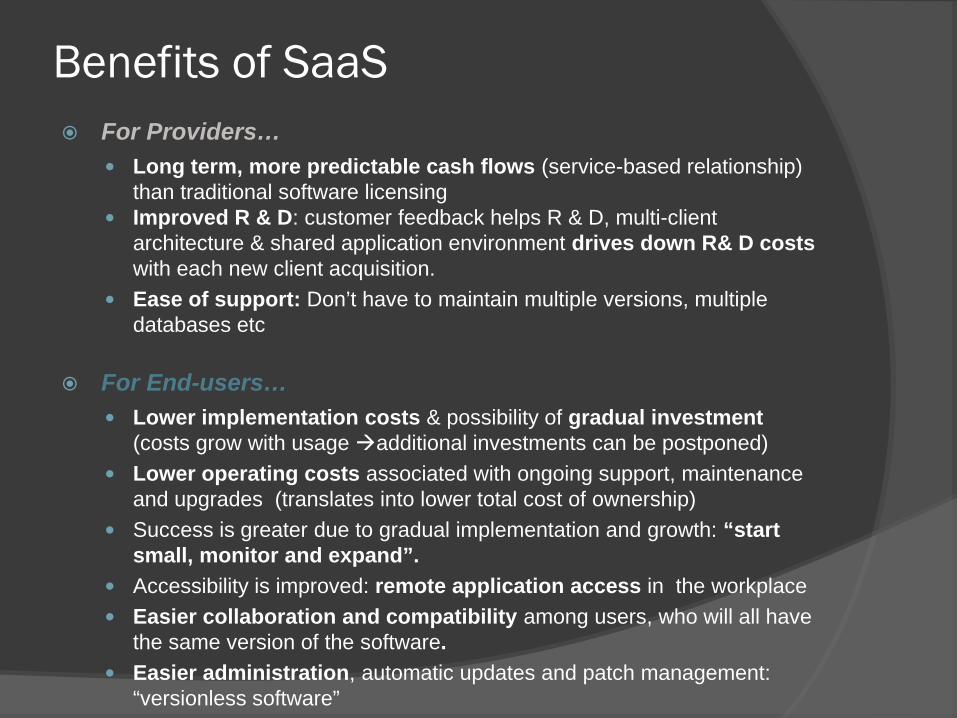
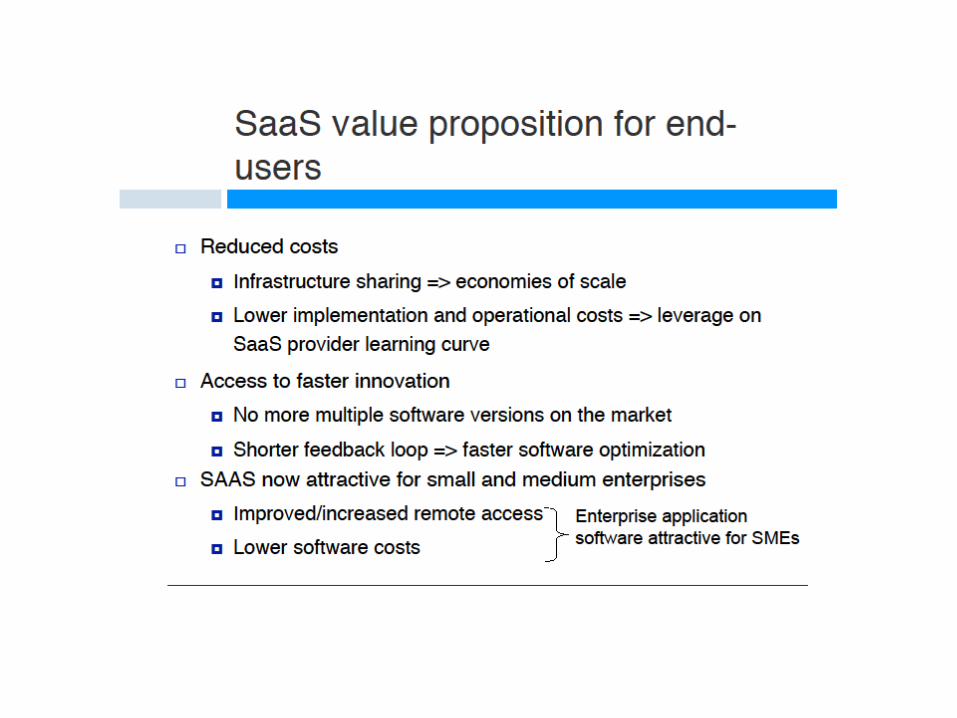
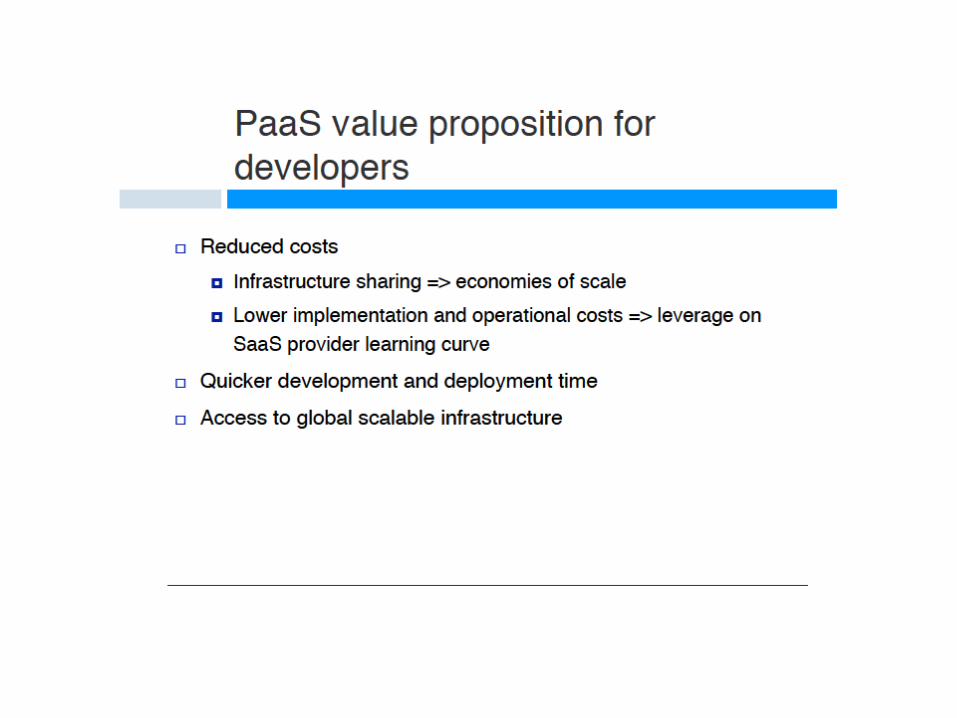
Benefits of SaaS For Providers…
Long term, more predictable cash flows (service-based relationship) than traditional software licensing
Improved R & D: customer feedback helps R & D, multi-client architecture & shared application environment drives down R& D costswith each new client acquisition.
Ease of support: Don’t have to maintain multiple versions, multiple databases etc
For End-users… Lower implementation costs & possibility of gradual investment
(costs grow with usage additional investments can be postponed) Lower operating costs associated with ongoing support, maintenance
and upgrades (translates into lower total cost of ownership) Success is greater due to gradual implementation and growth: “start
small, monitor and expand”. Accessibility is improved: remote application access in the workplace Easier collaboration and compatibility among users, who will all have
the same version of the software. Easier administration, automatic updates and patch management:
“versionless software”
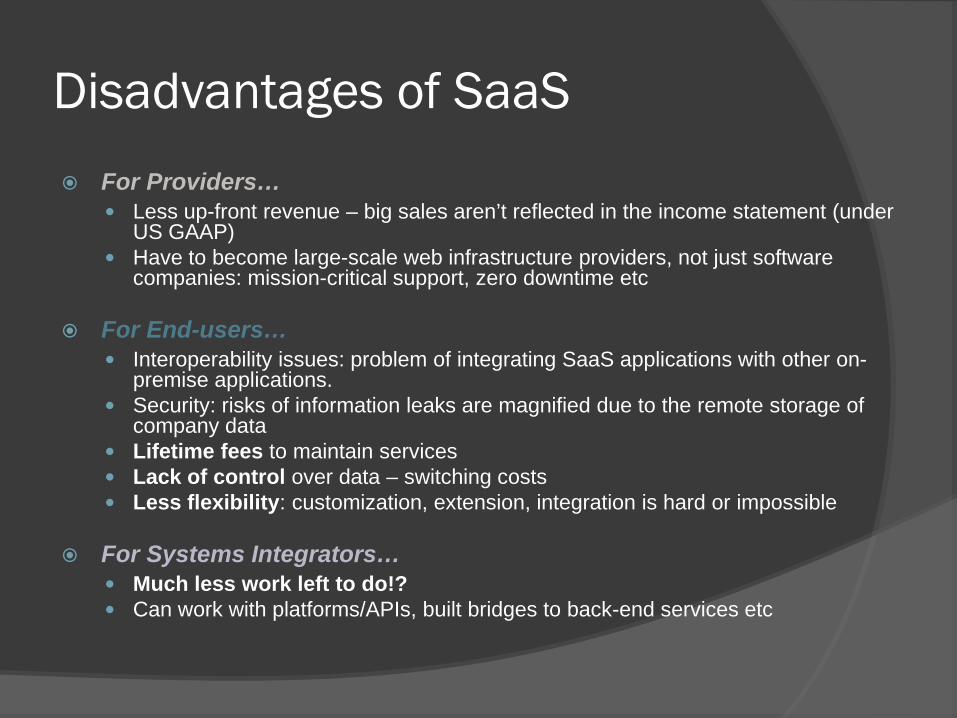
Disadvantages of SaaS For Providers…
Less up-front revenue – big sales aren’t reflected in the income statement (under US GAAP)
Have to become large-scale web infrastructure providers, not just software companies: mission-critical support, zero downtime etc
For End-users… Interoperability issues: problem of integrating SaaS applications with other on-
premise applications. Security: risks of information leaks are magnified due to the remote storage of
company data Lifetime fees to maintain services Lack of control over data – switching costs Less flexibility: customization, extension, integration is hard or impossible
For Systems Integrators… Much less work left to do!? Can work with platforms/APIs, built bridges to back-end services etc
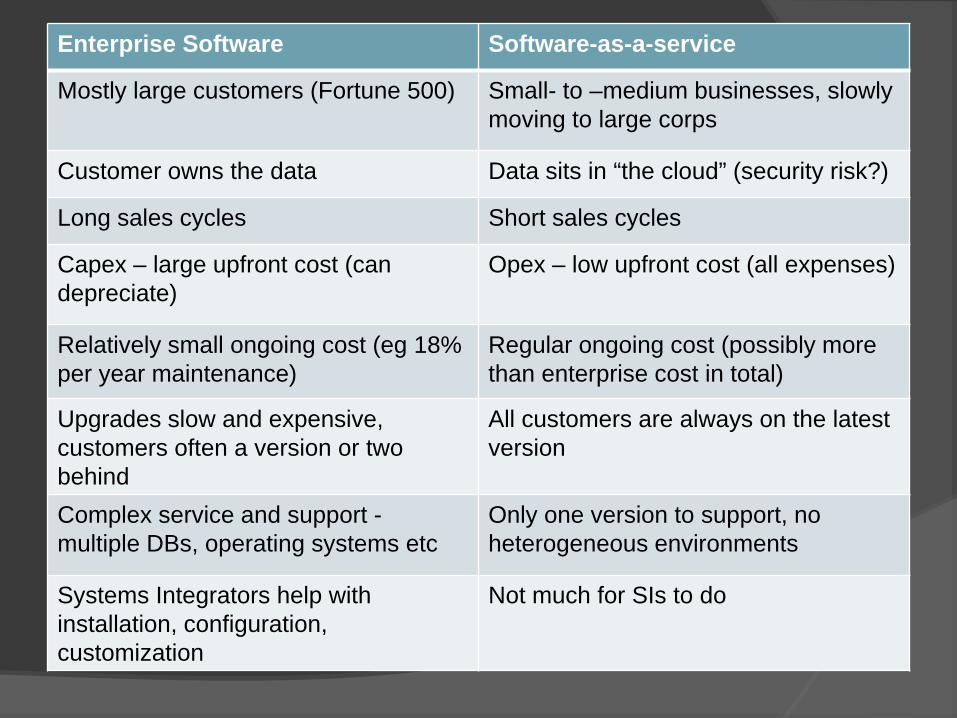
Enterprise Software Software-as-a-service
Mostly large customers (Fortune 500) Small- to –medium businesses, slowly moving to large corps
Customer owns the data Data sits in “the cloud” (security risk?)
Long sales cycles Short sales cycles
Capex – large upfront cost (can depreciate)
Opex – low upfront cost (all expenses)
Relatively small ongoing cost (eg 18% per year maintenance)
Regular ongoing cost (possibly more than enterprise cost in total)
Upgrades slow and expensive, customers often a version or two behind
All customers are always on the latest version
Complex service and support -multiple DBs, operating systems etc
Only one version to support, no heterogeneous environments
Systems Integrators help with installation, configuration, customization
Not much for SIs to do
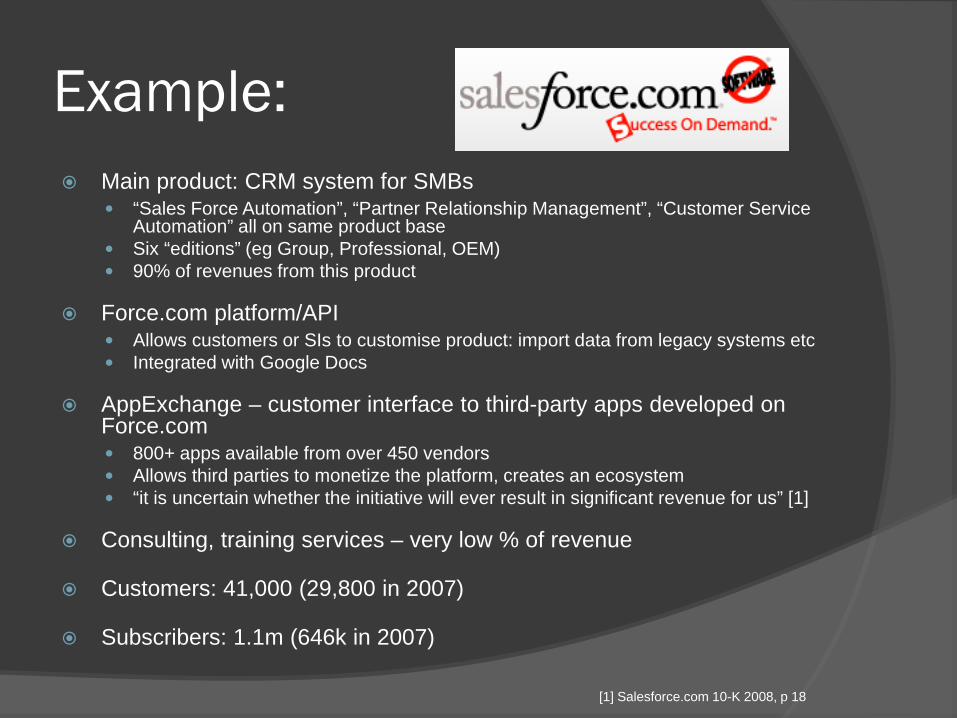
Example: Main product: CRM system for SMBs
“Sales Force Automation”, “Partner Relationship Management”, “Customer Service Automation” all on same product base
Six “editions” (eg Group, Professional, OEM) 90% of revenues from this product
Force.com platform/API Allows customers or SIs to customise product: import data from legacy systems etc Integrated with Google Docs
AppExchange – customer interface to third-party apps developed on Force.com 800+ apps available from over 450 vendors Allows third parties to monetize the platform, creates an ecosystem “it is uncertain whether the initiative will ever result in significant revenue for us” [1]
Consulting, training services – very low % of revenue
Customers: 41,000 (29,800 in 2007)
Subscribers: 1.1m (646k in 2007)
[1] Salesforce.com 10-K 2008, p 18
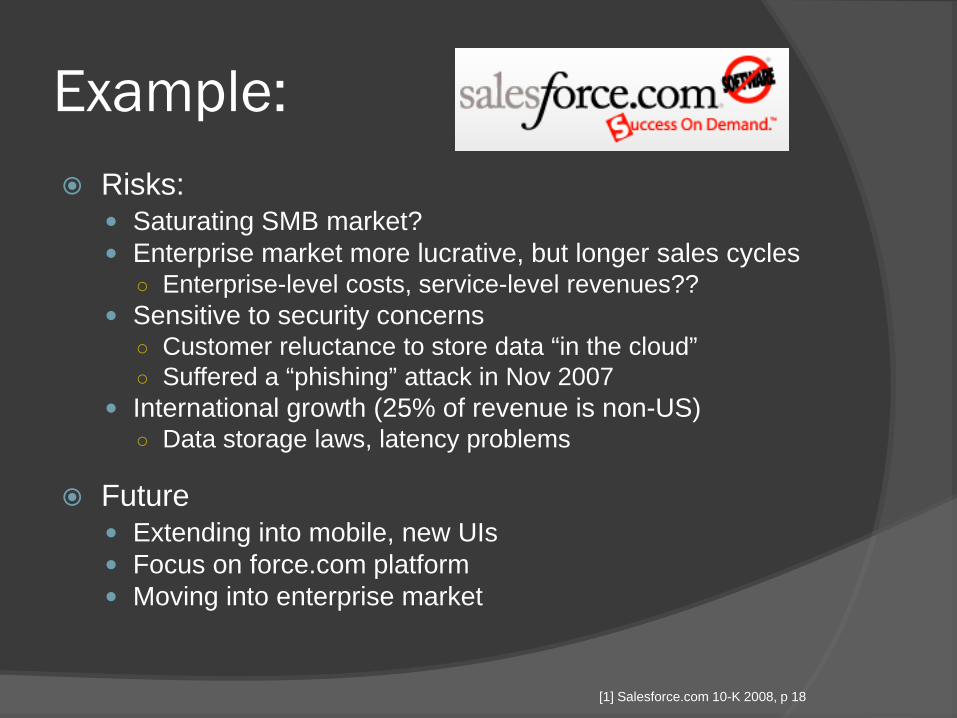
Example: Risks:
Saturating SMB market? Enterprise market more lucrative, but longer sales cycles
○ Enterprise-level costs, service-level revenues?? Sensitive to security concerns
○ Customer reluctance to store data “in the cloud”○ Suffered a “phishing” attack in Nov 2007
International growth (25% of revenue is non-US)○ Data storage laws, latency problems
Future Extending into mobile, new UIs Focus on force.com platform Moving into enterprise market
[1] Salesforce.com 10-K 2008, p 18
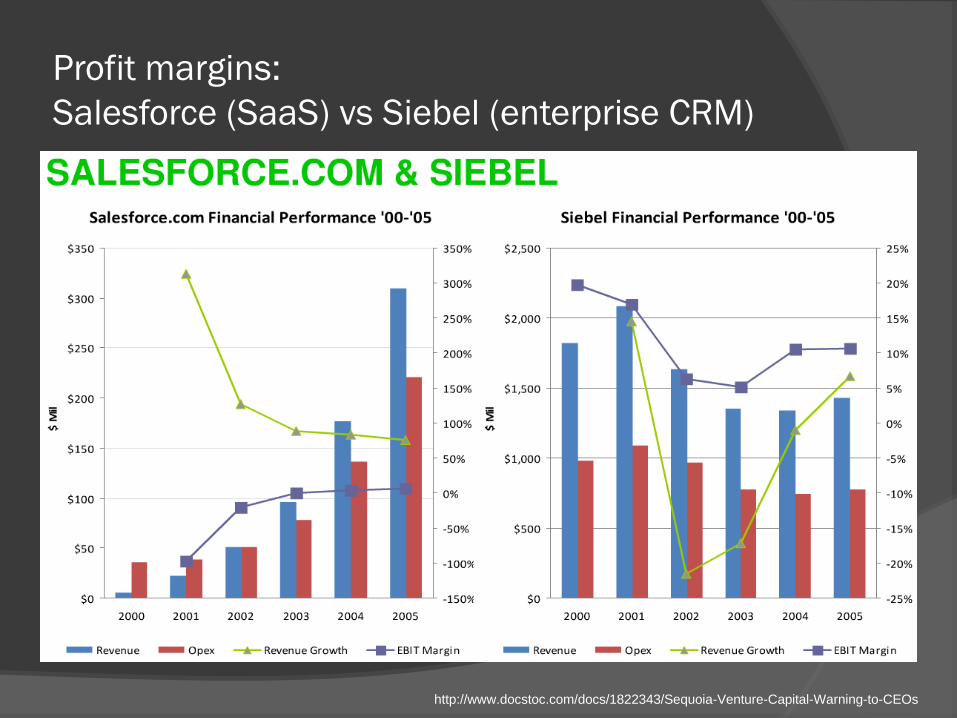
Profit margins:Salesforce (SaaS) vs Siebel (enterprise CRM)
http://www.docstoc.com/docs/1822343/Sequoia-Venture-Capital-Warning-to-CEOs
Example: Main product: SiteCatalyst
Web site analytics
Secondary products: Discover (segmentation analysis) DataWarehouse (mining of historical data) Data Discovery (business intelligence) Channel analytics, test & target, etc
On an acquisition spree Purchased TouchClarity, Visual Sciences, Mercado in
2007/2008
Not yet profitable
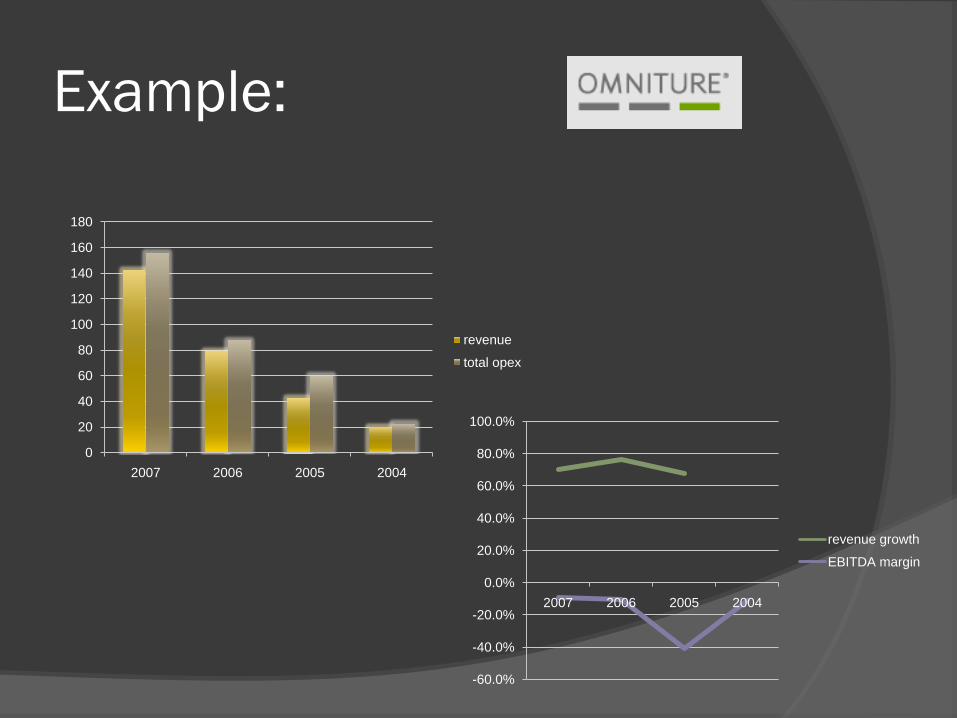
Example:
0
20
40
60
80
100
120
140
160
180
2007 2006 2005 2004
revenue
total opex
-60.0%
-40.0%
-20.0%
0.0%
20.0%
40.0%
60.0%
80.0%
100.0%
2007 2006 2005 2004
revenue growth
EBITDA margin
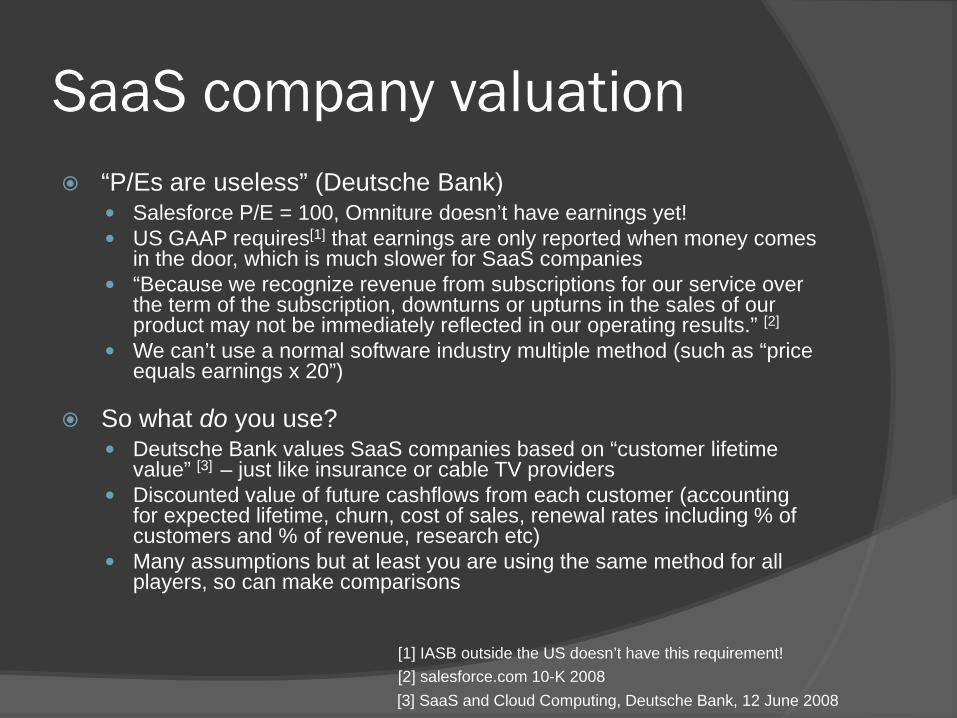
SaaS company valuation “P/Es are useless” (Deutsche Bank)
Salesforce P/E = 100, Omniture doesn’t have earnings yet! US GAAP requires[1] that earnings are only reported when money comes
in the door, which is much slower for SaaS companies “Because we recognize revenue from subscriptions for our service over
the term of the subscription, downturns or upturns in the sales of our product may not be immediately reflected in our operating results.” [2]
We can’t use a normal software industry multiple method (such as “price equals earnings x 20”)
So what do you use? Deutsche Bank values SaaS companies based on “customer lifetime
value” [3] – just like insurance or cable TV providers Discounted value of future cashflows from each customer (accounting
for expected lifetime, churn, cost of sales, renewal rates including % of customers and % of revenue, research etc)
Many assumptions but at least you are using the same method for all players, so can make comparisons
[1] IASB outside the US doesn’t have this requirement![2] salesforce.com 10-K 2008[3] SaaS and Cloud Computing, Deutsche Bank, 12 June 2008
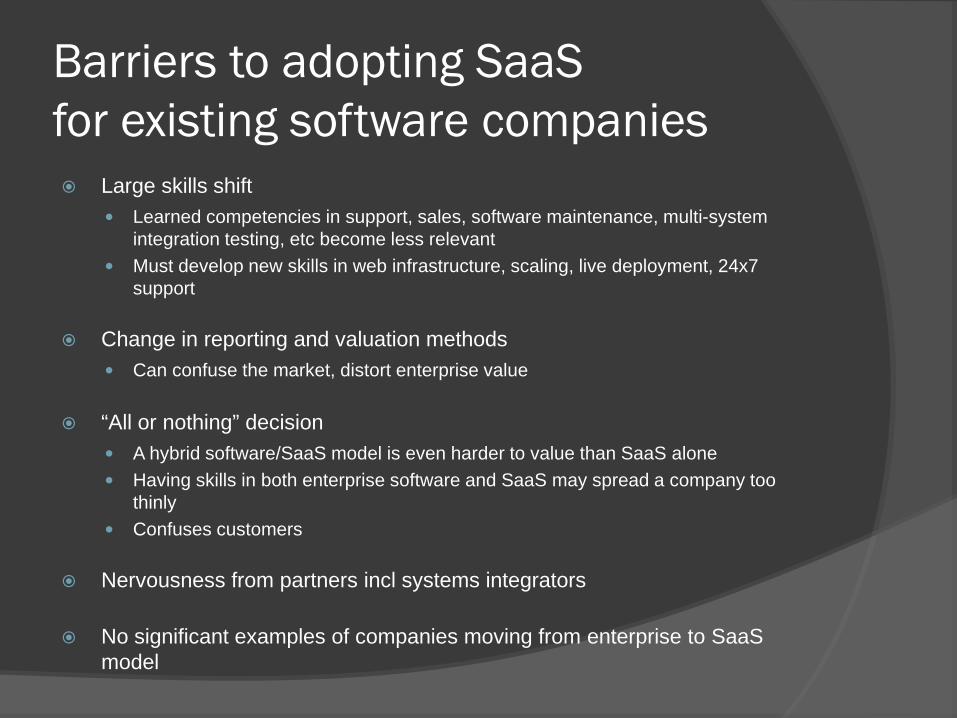
Barriers to adopting SaaSfor existing software companies Large skills shift
Learned competencies in support, sales, software maintenance, multi-system integration testing, etc become less relevant
Must develop new skills in web infrastructure, scaling, live deployment, 24x7 support
Change in reporting and valuation methods Can confuse the market, distort enterprise value
“All or nothing” decision A hybrid software/SaaS model is even harder to value than SaaS alone Having skills in both enterprise software and SaaS may spread a company too
thinly Confuses customers
Nervousness from partners incl systems integrators
No significant examples of companies moving from enterprise to SaaS model
Team 8
Software as a ServiceMBA 290G
Prof. Charles Wu
Fuat E. CelikGopal ChaudhooryIgnacio ContrerasFrancois GalletCamilo Mendez
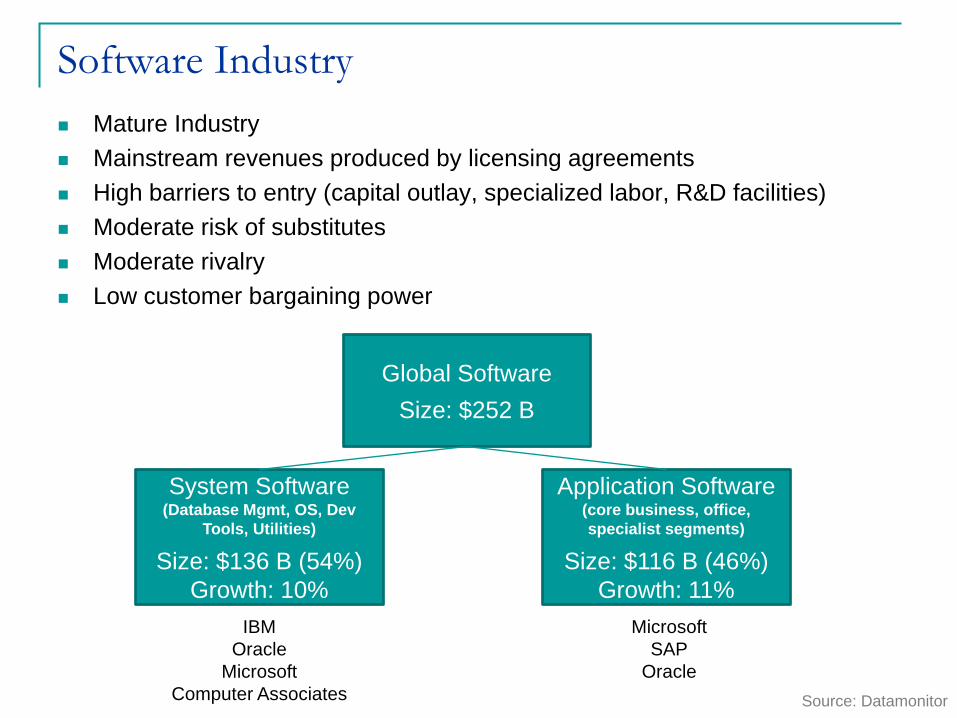
Software Industry Mature Industry Mainstream revenues produced by licensing agreements High barriers to entry (capital outlay, specialized labor, R&D facilities) Moderate risk of substitutes Moderate rivalry Low customer bargaining power
Global SoftwareSize: $252 B
System Software(Database Mgmt, OS, Dev
Tools, Utilities)
Size: $136 B (54%)Growth: 10%
Application Software(core business, office, specialist segments)
Size: $116 B (46%)Growth: 11%
MicrosoftSAP
Oracle
IBMOracle
MicrosoftComputer Associates Source: Datamonitor
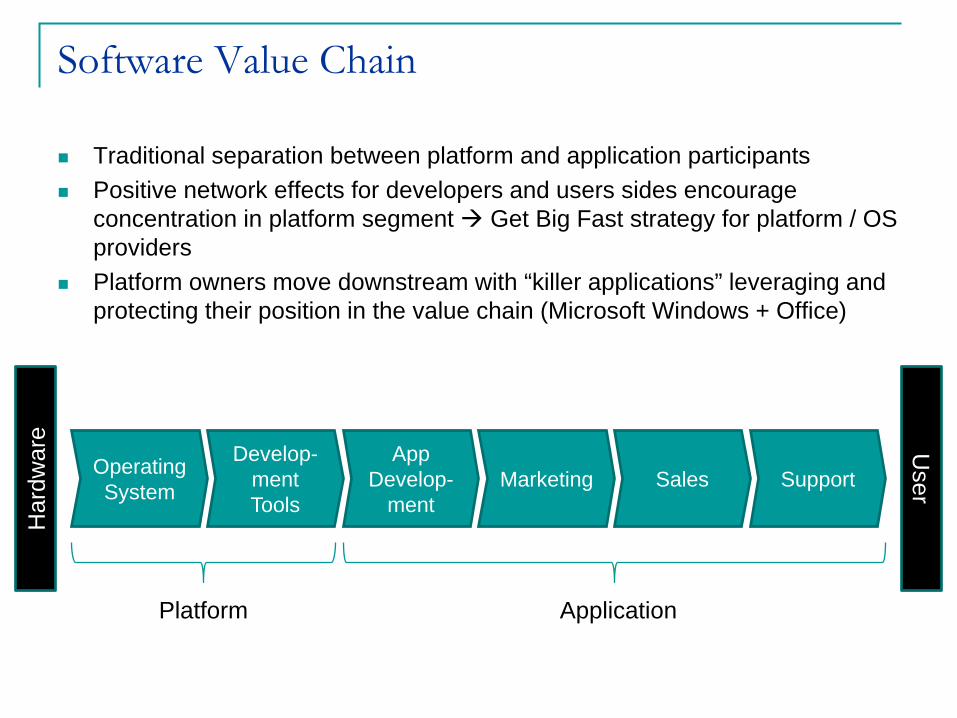
Software Value Chain
Traditional separation between platform and application participants Positive network effects for developers and users sides encourage
concentration in platform segment Get Big Fast strategy for platform / OS providers
Platform owners move downstream with “killer applications” leveraging and protecting their position in the value chain (Microsoft Windows + Office)
Operating System
Develop-mentTools
App Develop-
mentMarketing Sales Support
Har
dwar
e User
Platform Application
Software as a Service (SaaS)
Model of software deployment where an application is hosted as a service provided to customers across the Internet
Application data may remain in customer’s hardware, but usually is stored “in the cloud” by providers
Eliminates the need to install and run applications in customer’s computer
Alleviates burden of software maintenance, support (especially for legacy applications) and operation
Facilitates application deployment and update
Eases information sharing and teamwork
Challenges licensing model with On-Demand / Subscription fees
Software as a Service (SaaS)
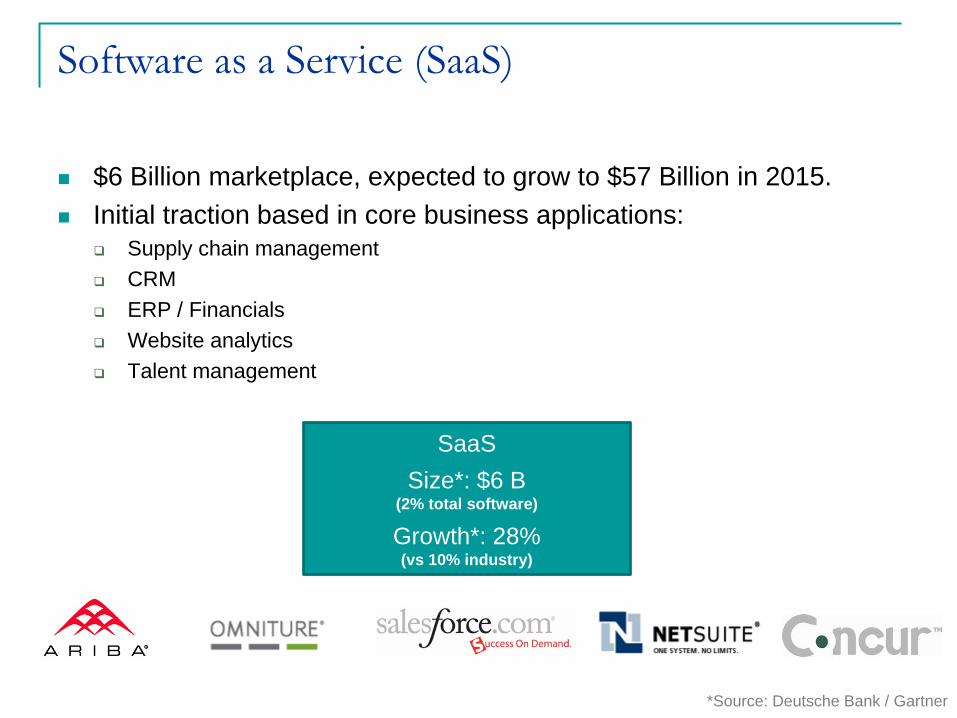
$6 Billion marketplace, expected to grow to $57 Billion in 2015. Initial traction based in core business applications:
Supply chain management CRM ERP / Financials Website analytics Talent management
SaaSSize*: $6 B
(2% total software)
Growth*: 28%(vs 10% industry)
*Source: Deutsche Bank / Gartner
Holy Grail: Platform as a Service
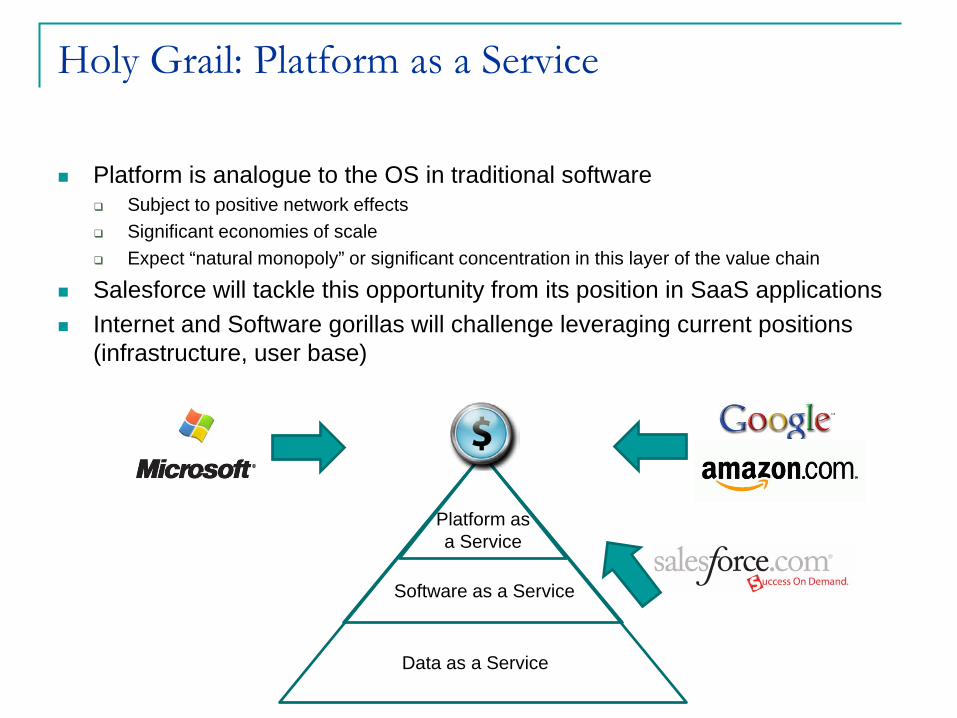
Platform is analogue to the OS in traditional software Subject to positive network effects Significant economies of scale Expect “natural monopoly” or significant concentration in this layer of the value chain
Salesforce will tackle this opportunity from its position in SaaS applications Internet and Software gorillas will challenge leveraging current positions
(infrastructure, user base)
Data as a Service
Software as a Service
Platform as a Service
What is P/E
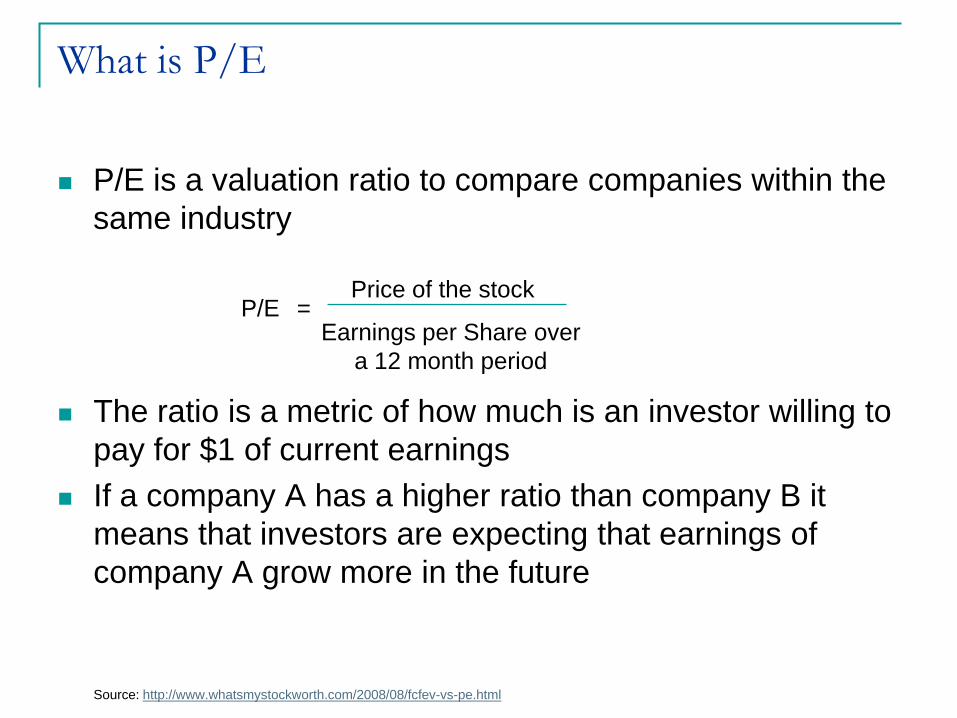
P/E is a valuation ratio to compare companies within the same industry
P/E =Price of the stock
Earnings per Share over a 12 month period
The ratio is a metric of how much is an investor willing to pay for $1 of current earnings
If a company A has a higher ratio than company B it means that investors are expecting that earnings of company A grow more in the future
Source: http://www.whatsmystockworth.com/2008/08/fcfev-vs-pe.html
Why is P/E an inappropriate indicator
Let’s start with the (P) Price does not incorporate cash nor debt on the balance
sheetExample: The price of a house is $100,000 but there is vault in the house
with $30,000 So the effective paid price is $70,000 If on the contrary, the price of the house is $100,000 but the
house has a remaining debt of $30,000 then the effective price is $130,000
Source: http://www.whatsmystockworth.com/2008/08/fcfev-vs-pe.html
Why is P/E an inappropriate indicator
Now let’s see what’s wrong with the (E) Reported Earnings can be subject and a reflection of
creative accounting practicesExample: A company might defer losess for multiple periods reflecting
higher earnings than the real ones A company can defer revenues for multiple periods reflecting
lower earnings than the real ones
Source: http://www.whatsmystockworth.com/2008/08/fcfev-vs-pe.html
What is a better indicator – EV/FCF
A better metric than (E) is Free Cash Flow (F) which is the real amount of cash that the company generated during the period
The problem with FCF is that a company in the early stages could be spending a lot in marketing and sales to build a client base that it will harvest tomorrow – hurting its indicator
While a company that is not investing much could be favored
A better valuation metric than (P) is the Enterprise Value (EV) which takes into account the cash equivalents and debt
EV = Market Capitalization – Cash and equivalents + Total liabilities
Enterprise Value
Future Cash FlowEV/FCF =
What is an even better indicator – EV/FCF/G
FCF could be misleading because a company that invests a lot could generate more revenue in the future that a company that does not
EV/FCF would be the company valuation today we need to see what is its return going to be in the long run
Then, growth rate (G) has to be taken into account to adjust FCF (G) is the projected earnings growth which is a number analysts
calculate or can be extrapolated from previous years
The lower the indicator the better – not negative though
Enterprise Value
Future Cash Flow/Growth rate
EV/FCF/G =
Team 1
Software as a Service:Industry Analysis
October 22, 2008
Group 1Franck FormisRobert KongVincent Ng
Jameson SlatteryChuohao Yeo
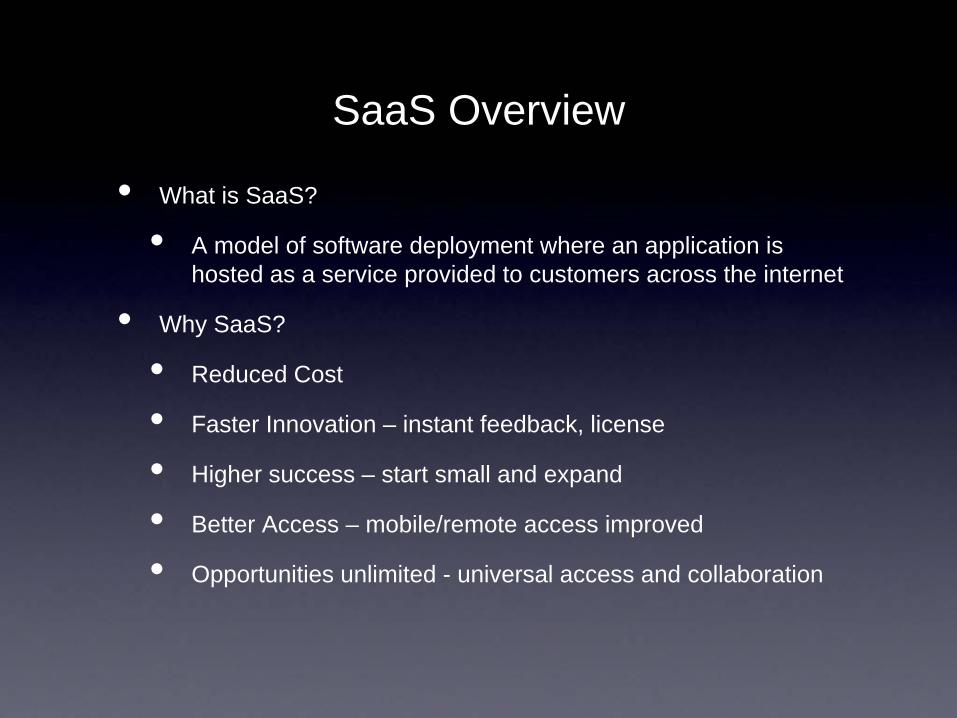
SaaS Overview
• What is SaaS?
• A model of software deployment where an application is hosted as a service provided to customers across the internet
• Why SaaS?
• Reduced Cost
• Faster Innovation – instant feedback, license
• Higher success – start small and expand
• Better Access – mobile/remote access improved
• Opportunities unlimited - universal access and collaboration
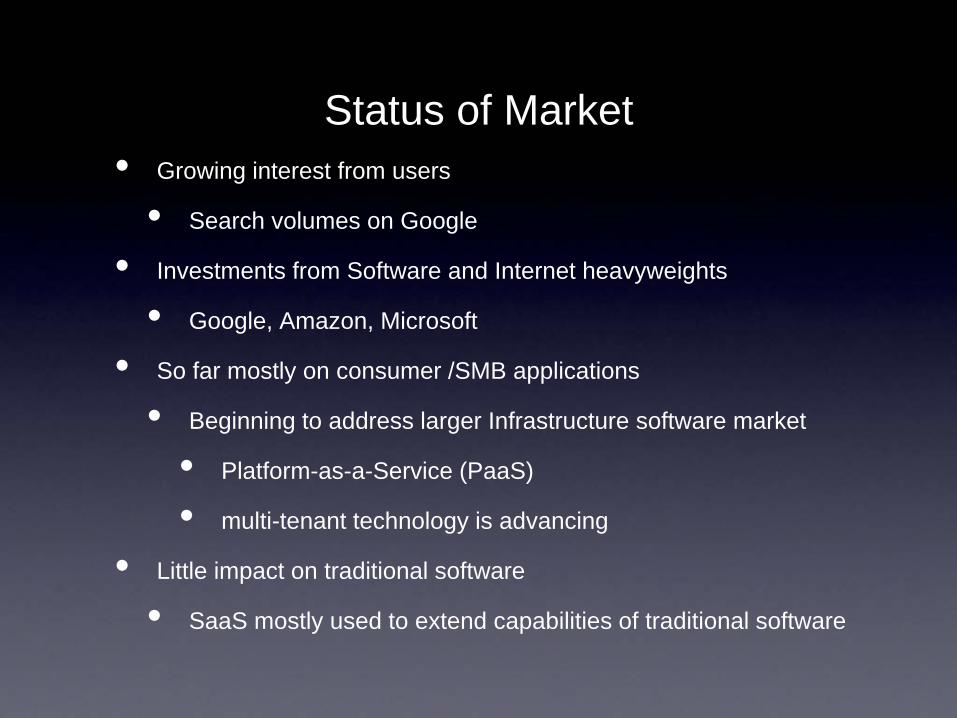
Status of Market• Growing interest from users
• Search volumes on Google
• Investments from Software and Internet heavyweights
• Google, Amazon, Microsoft
• So far mostly on consumer /SMB applications
• Beginning to address larger Infrastructure software market
• Platform-as-a-Service (PaaS)
• multi-tenant technology is advancing
• Little impact on traditional software
• SaaS mostly used to extend capabilities of traditional software
Top successful vendors
• Salesforce.com
• CRM vendor
• 34.8% revenue growth
• Omninature
• website analytics vendor
• 95.6% revenue growth
• 78.8% subscription growth
• DemandTech
• demand analytics and pricing vendor
• 17.2% revenue growth
Barriers to Entry
• Relatively low for pure-play vendors
• Takes time to build and bring to market competitive enterprise SaaS solutions
• Requires numerous iterative revision to match performance
• R&D Dilemma
• Multi-tenancy requires technological enhancement
• Potentially damaging impact to traditional software business(Specific to On-premise vendors)
• Lower license sales
• No one will pay for upgrades
• Customers’ switching cost is high
Factors fueling market growth• Successful usage builds on to each other
• Ability to bring solutions to market that were either technically impossible or economically unattainable
• Processing and scalability
• Ex. Large server farm to run real-time analysis
• Aggregated direct data
• Cross enterprise collaboration applications
• Reduction in supporting IT resources -> more money for software investment
• Software industry is less hyper-cyclical
• Growing demand for Customer Relationship Management applications
Risks• Data Security issues
• Most important!! Customer confidence is directly related to industry adoption of SaaS solution
• Ex. Saleforce.com phishing scam
• Service uptime
• Internet traffic speed/ outage
• Large vendor entry
• Aggressive price bundling strategies to squeeze out the pure-play SaaS vendors
• Managing rapid growth
• Expanding human capital and infrastructure to support high growth rates
• May undermine cost advantage
Competitive Landscape
• Heavyweights vs. pure-play vendors
• Hottest field of competition is On-Demand CRM
• Dominated by Salesforce
• Microsoft’s Forefront, Google Apps
• Still local (globalization is slow but starting)
• Compete in areas like cost, ease-of-integration, and ease-of-use
• new technology and meet the specific business needs of identifiable markets
SaaS Valuation
P/E ratios are inaccurate for SaaS companies:
1) P/E ratios fail to capture deferred revenue and the recurring nature of the SaaS model
2) SaaS costs are front-loaded, resulting in variable profitability throughout a contract
a) Customer acquisition costs
b) Low margin implementation up-front
SaaS Valuation
3) P/E ratios should not be used to compare SaaS companies to traditional SW firms
a) P/E ratios vary dramatically across industries
b) SaaS is fundamentally different than existing software business models
Valuation Metrics
Due to their subscription model, SaaS firms should be valued in similar ways as telecom operators or cable companies:
1)Cash flow
2)Bookings (Revenue + Δ in deferred rev)
3)Subscription metrics (# of customers, ASPs, contract length, customer churn, customer acquisition costs, customer lifetime value)
Team 6
66
SaaS Industry Overview
Team 6Wan-Lin TsengToru YamagishiNuttapong ChentanezJim Miller
67
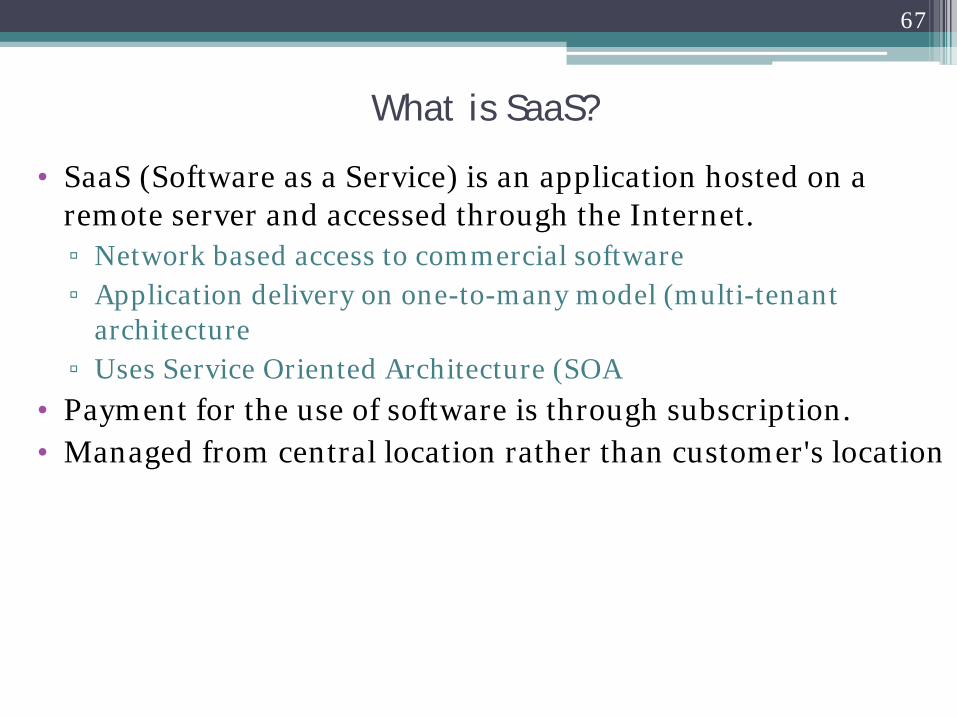
What is SaaS?
• SaaS (Software as a Service) is an application hosted on a remote server and accessed through the Internet.▫ Network based access to commercial software▫ Application delivery on one-to-many model (multi-tenant
architecture▫ Uses Service Oriented Architecture (SOA
• Payment for the use of software is through subscription.• Managed from central location rather than customer's location
68
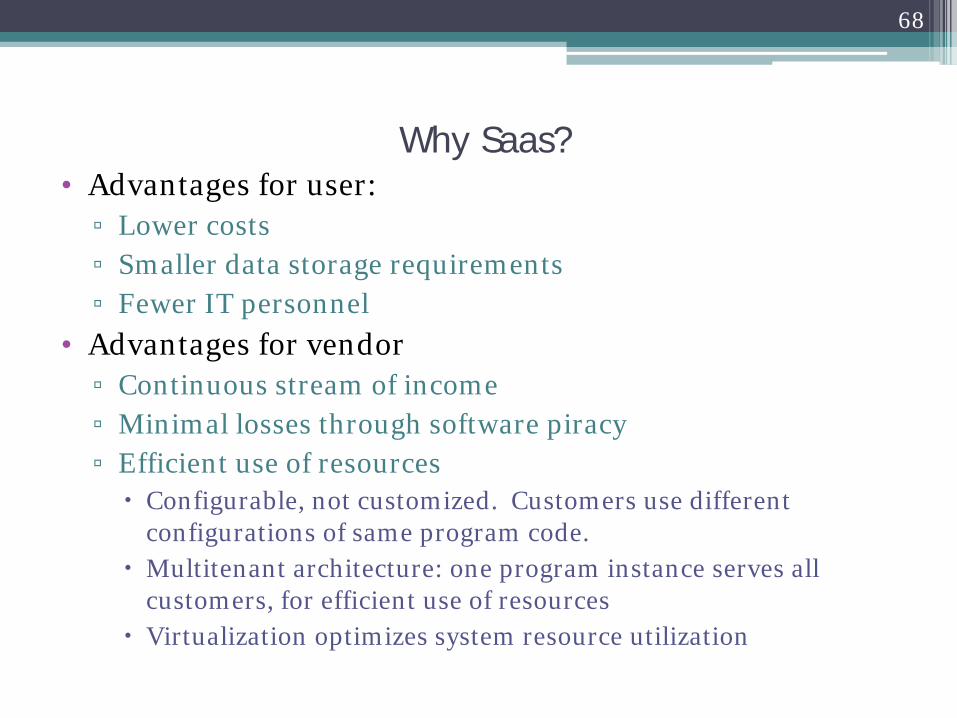
Why Saas?• Advantages for user:▫ Lower costs▫ Smaller data storage requirements ▫ Fewer IT personnel
• Advantages for vendor▫ Continuous stream of income▫ Minimal losses through software piracy▫ Efficient use of resources Configurable, not customized. Customers use different
configurations of same program code. Multitenant architecture: one program instance serves all
customers, for efficient use of resources Virtualization optimizes system resource utilization
69
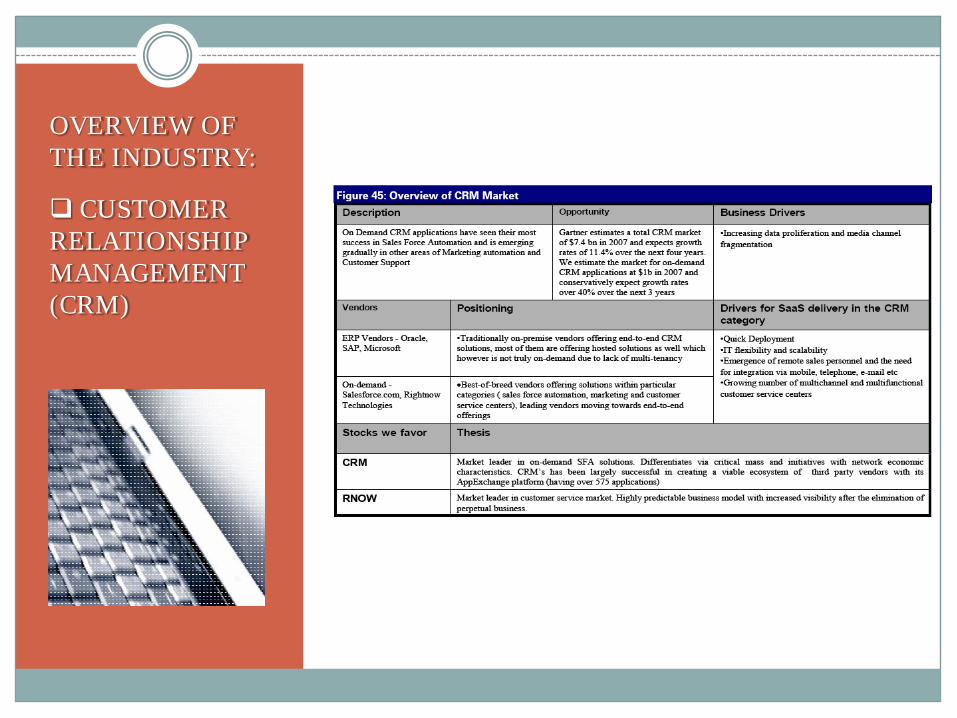
Leading Categories of SaaS (1)• Customer Relationship Management (CRM)▫ Automated control over sales data and processes▫ Integration of sales and marketing▫ Channel management
• $7.4 bn CRM market in 2007 (Gartner)• Growth rates of 11.4% over the next four years (Gartner)• Industry leader: Salesforce.com ▫ "Salesforce.com continues to maintain its dominant
position in the CRM market, with growth accelerating in the past two quarters to over 50%“ (Deutsche Bank)
70
Leading Categories of SaaS (2)• Talent Management▫ Recruiting (talent acquisition), applicant tracking, skills
assessment, performance management, compensation, development & succession, payroll, workforce planning.
• Industry Leaders▫ Kenexa: Talent acquisition▫ Authoria: Compensation management, succession planning▫ Ultimate Software: Payroll
• Demand drivers▫ Increased labor mobility▫ Aging work force▫ Importance of hiring, maintaining, and expanding human
capital
71
Leading Categories of SaaS (3)
• Website Analytics ▫ Enable companies to measure and analyze online customer
behavior)• Industry Leader▫ Omniture: “…close to the highest growth rates in the
market at 114% revenue growth…and nearly 3,000 customer adds in the last 18 months.” (Deutsche Bank)
• Deutsche Bank assessment:▫ “As website analytics evolves from clickstream analysis
…future leaders [will] provide not only…quantitative solutions but also qualitative solutions by better integrating results of customer surveys, competitive analysis…[etc]”
72
Leading Categories of SaaS (4)
• Spend Management▫ Supplier relationship management ▫ Sourcing and procurement▫ Supplier networks
• Industry Leader:▫ Ariba: Leading vendor with a supplier network of more
than 160,000 suppliers“• Demand Driver▫ Companies have only low-hanging fruit cost control
measures, not comprehensive spend management programs.
73
Leading Categories of SaaS (5)
• Employee Spend Management▫ Travel booking▫ expense management
• Industry Leader▫ Concur: "potential to disrupt the entire corporate travel
market“…”Gelco acquisition marks a significant step forward”
74
Risks for current SaaS vendors• Data Security issues▫ Could reduce customer confidence significantly▫ Salesforce.com had phising scam
SunTrust and Gap’s customer emails got stolen▫ Stock down ~10%
• Service uptime▫ Salesforce experienced several outages while upgrading in early 2006▫ Outage -> bad press, reduced customer satisfaction -> less growth
• Large vendor entry▫ SaaS attractive to Microsoft, SAP, Oracle, IBM, Google, Yahoo▫ Can charge more for SaaS vendors’ database & server software▫ Can cut down SaaS price for customers
• Managing rapid growth▫ Expand human capita and infrastructure to support rapid growth
Without disrupting current services
75
Risk for larger vendors to enter SaaS• Cannibalizations▫ Can eat in existing products and maintenances revenue ▫ Eg. Microsoft Office, Oracle Siebel on-demand, SAP on-demand
• Organizational Challenges▫ Require shift at organization level to be successful
Revenue stream changes significantly -> challenge for management
• R&D challenges▫ R&D direction differs from traditional products▫ Need more investment
• Sale challenges▫ Need different kind of sale personnel mindset ▫ Conflict with traditional product sale forces
76
Situation Analysis of Saas Industry• Market size/share▫ Deutsche bank estimated the current market size as 17.2B of 2007 ▫ CRM and talent management are biggest categories followed by spend
management, web analytics, and employee spend management
• Customers ▫ Products are fixing customers’ pain points resulting from the huge
information flow ▫ In most categories, customers tend to be sticky once transforming data to
new software/platform▫ Increasing market share would be the main focus for companies now;
therefore, less bargain power for Saas companies is expected▫ After the stickiness is formed, more bargain power would be resulted
77
• Suppliers▫ Outsourcing to low-cost R&D centers, i.e. India▫ SaaS companies have higher bargain power now; however, as the
industry grows, demand for talents would increase, so bargain power would shift a bit to suppliers
• Competition▫ Building scale and integrated systems are two main entry
barriers▫ New industry standards/innovations along with the nature of
stickiness in this industry result in huge first mover advantages
▫ Heavyweight or large players provide stiffer competition
78
Why P/E ratio is inappropriate in valuing SAAS companies?
• P/E ratio▫ Comparison of stock price and Earnings per share (EPS)▫ EPS is calculated by dividing net income by the number of share▫ GAAP requires firms to defer cost and income periodically▫ P/E is effective when there is small difference between cash flow and
income statement
• SAAS companies▫ Customer acquisition cost is one time expense but revenue stream is
generated for several years▫ Early stage companies with high growth often have to invest much
money for future business expansion▫ Huge difference between recorded income and actual cash flow
79
How to value SAAS companies?
• Focus on Free Cash Flow growth and calculate NPV▫ Identify recurring and non-recurring items
- Recurring item: e.g. subscription revenue- Non-recurring item: e.g. customer acquisition cost
▫ Adjust R&D and SG&A by considering growth rate- High growth companies often spend much
▫ Calculate Cash Flow Stream adjusting by churn rate estimated▫ Discount by appropriate discount rate
- Use different discount rate based on revenue size- Discount rate should be less than total WACC since business with
existing customer base would be less risky than total business

Team 2
SaaS - An overview of the
industry -Team 2
Yanpei ChenDavid Exposito Cossio
Emrehan KirimliRachel Vera Simon
Jonathan Wiesner
Outline
Definition of SaaS SaaS Segments offerings Impediments to Adoption Brief information about SaaS key players Why SaaS will continue to expand ? How SaaS companies should be valued in the
marketplace ? Risks of the growth Executive Summary
SaaS – Software as a Service
a model of software deployment where an application is hosted as a service provided to customers across the Internet (wiki)
eliminates the need to install and run the application on the client’s own computer
no need for client’s infrastructure
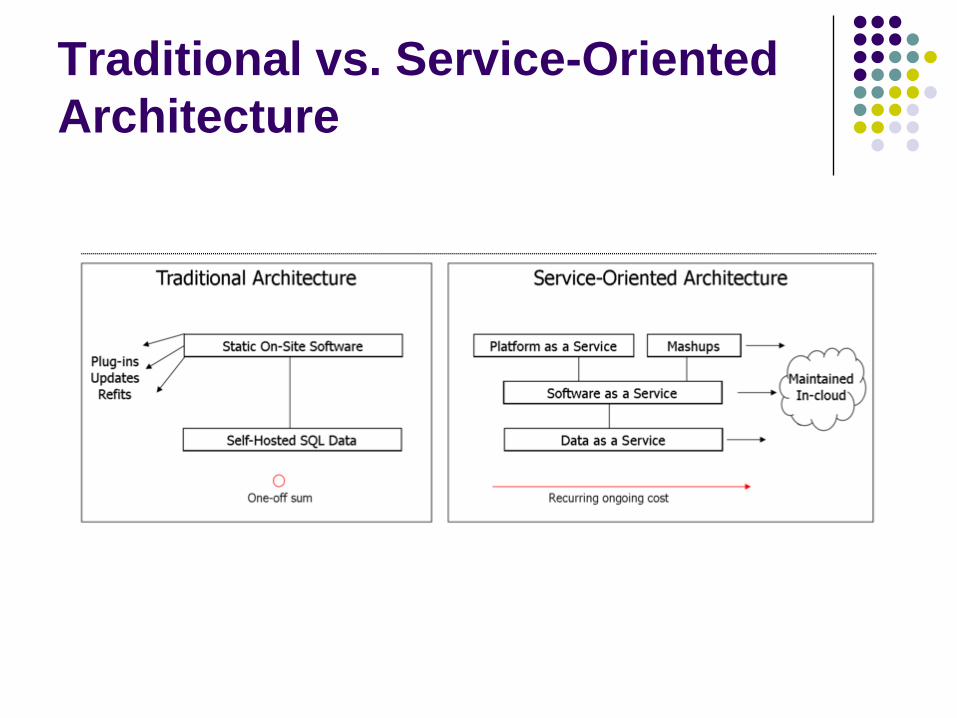
Traditional vs. Service-Oriented Architecture
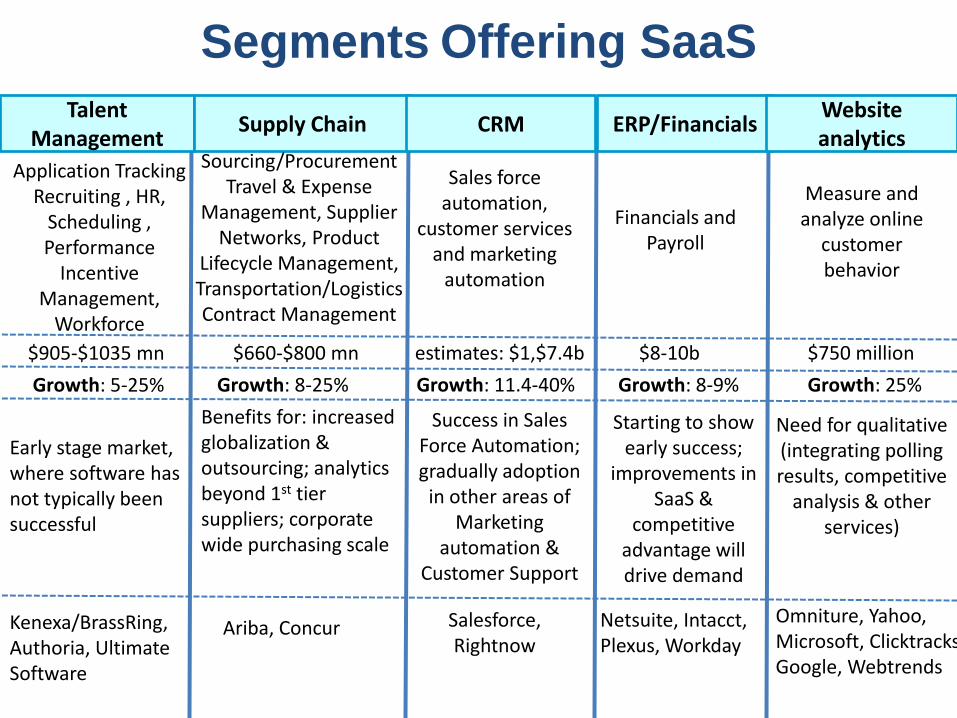
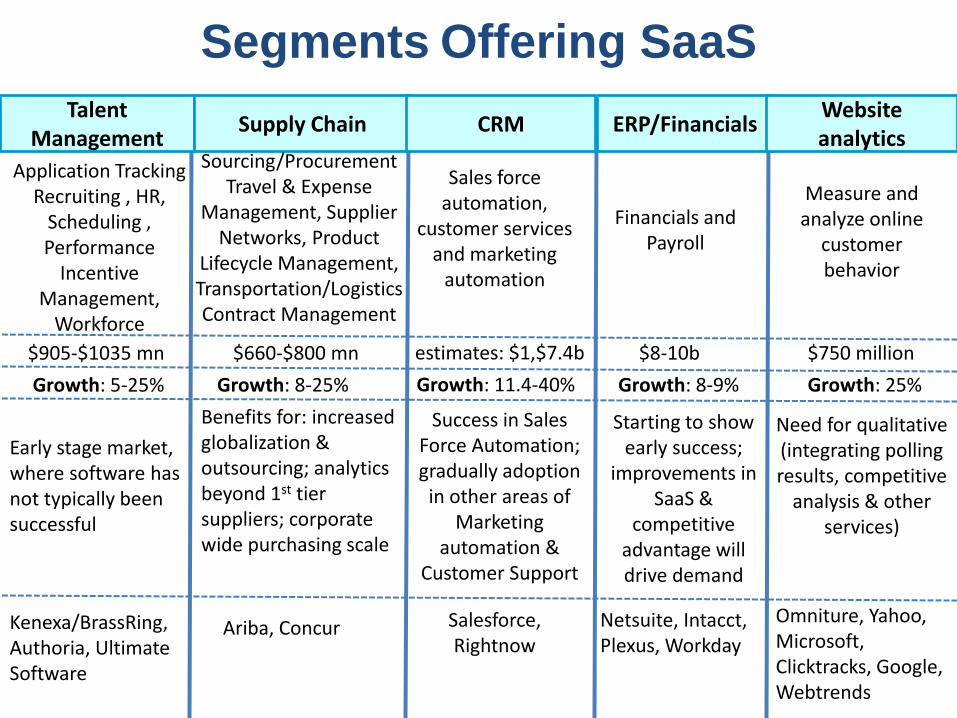
Segments Offering SaaSTalent
ManagementSupply Chain CRM ERP/Financials
Website analytics
Application Tracking Recruiting , HR,
Scheduling , Performance
Incentive Management,
Workforce
Kenexa/BrassRing, Authoria, Ultimate Software
Growth: 5-25%
$905-$1035 mn
Early stage market, where software has not typically been successful
Benefits for: increased globalization & outsourcing; analytics beyond 1st tier suppliers; corporate wide purchasing scale
Sourcing/Procurement Travel & Expense
Management, Supplier Networks, Product
Lifecycle Management, Transportation/LogisticsContract Management
$660-$800 mn
Growth: 8-25%
Ariba, Concur
Sales force automation,
customer services and marketing
automation
Salesforce, Rightnow
Netsuite, Intacct, Plexus, Workday
Financials and Payroll
Growth: 8-9%
$8-10b
Growth: 25%
$750 million
Measure and analyze online
customerbehavior
Omniture, Yahoo, Microsoft, Clicktracks Google, Webtrends
Need for qualitative(integrating polling results, competitive
analysis & other services)
Starting to show early success;
improvements in SaaS &
competitive advantage will drive demand
Success in Sales Force Automation; gradually adoption
in other areas of Marketing
automation & Customer Support
estimates: $1,$7.4b
Growth: 11.4-40%

Impediments to Adoption
Fear of service disruptions Fear of security breaches Performance not up to par Difficulty integration with current systems Need for customer configurations/customization Fate-sharing with SAAS supplier Risk-adverse behavior against adoption
Segments Offering SaaSTalent
ManagementSupply Chain CRM ERP/Financials
Website analytics
Application Tracking Recruiting , HR,
Scheduling , Performance
Incentive Management,
Workforce
Kenexa/BrassRing, Authoria, Ultimate Software
Growth: 5-25%
$905-$1035 mn
Early stage market, where software has not typically been successful
Benefits for: increased globalization & outsourcing; analytics beyond 1st tier suppliers; corporate wide purchasing scale
Sourcing/Procurement Travel & Expense
Management, Supplier Networks, Product
Lifecycle Management, Transportation/LogisticsContract Management
$660-$800 mn
Growth: 8-25%
Ariba, Concur
Sales force automation,
customer services and marketing
automation
Salesforce, Rightnow
Netsuite, Intacct, Plexus, Workday
Financials and Payroll
Growth: 8-9%
$8-10b
Growth: 25%
$750 million
Measure and analyze online
customerbehavior
Omniture, Yahoo, Microsoft, Clicktracks, Google, Webtrends
Need for qualitative(integrating polling results, competitive
analysis & other services)
Starting to show early success;
improvements in SaaS &
competitive advantage will drive demand
Success in Sales Force Automation; gradually adoption
in other areas of Marketing
automation & Customer Support
estimates: $1,$7.4b
Growth: 11.4-40%

Impediments to Adoption
Fear of service disruptions Fear of security breaches Performance not up to par Difficulty integration with current systems Need for customer configurations/customization Fate-sharing with SAAS supplier Risk-adverse behavior against adoption
Saas Leader Clear enterprise Saas Segment Leader Expected $1.1b in revenues this year and $8.9b
market cap 1 million subscribers and 44k customers Customers include Citibank, Dell, Merrill Lynch, Cisco and
Starbucks offers its online CRM services through a SAAS
delivery model AppExchange and Force.com (Platform as a Service)
Main competitors: Oracle’s Siebel, Microsoft and SAP Competitors has recently offered their products online
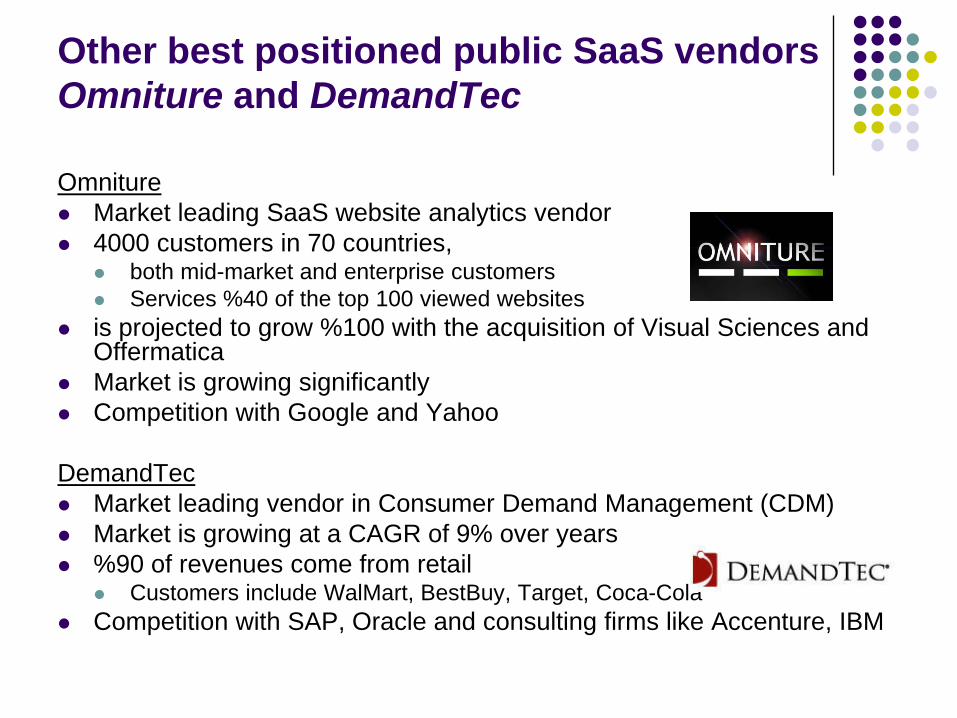
Omniture Market leading SaaS website analytics vendor 4000 customers in 70 countries,
both mid-market and enterprise customers Services %40 of the top 100 viewed websites
is projected to grow %100 with the acquisition of Visual Sciences and Offermatica
Market is growing significantly Competition with Google and Yahoo
DemandTec Market leading vendor in Consumer Demand Management (CDM) Market is growing at a CAGR of 9% over years %90 of revenues come from retail
Customers include WalMart, BestBuy, Target, Coca-Cola Competition with SAP, Oracle and consulting firms like Accenture, IBM
Other best positioned public SaaS vendorsOmniture and DemandTec
Ariba offers Supplier Relationship Management (SRM) solutions.
Concur Technologies is the leading Employee Spend Managementprovider.
Kenexa is the leading recruiting and talent management SaaS provider and business process outsourcer.
NetSuite offers Enterprise Resource Planning (ERP) applications through as a SaaS delivery model.
RightNow Technologies specializes in Customer Relationship Management (CRM) services with a leadership in the on-demand service automation category.
Ultimate Software is a payroll software provider.
Other important players
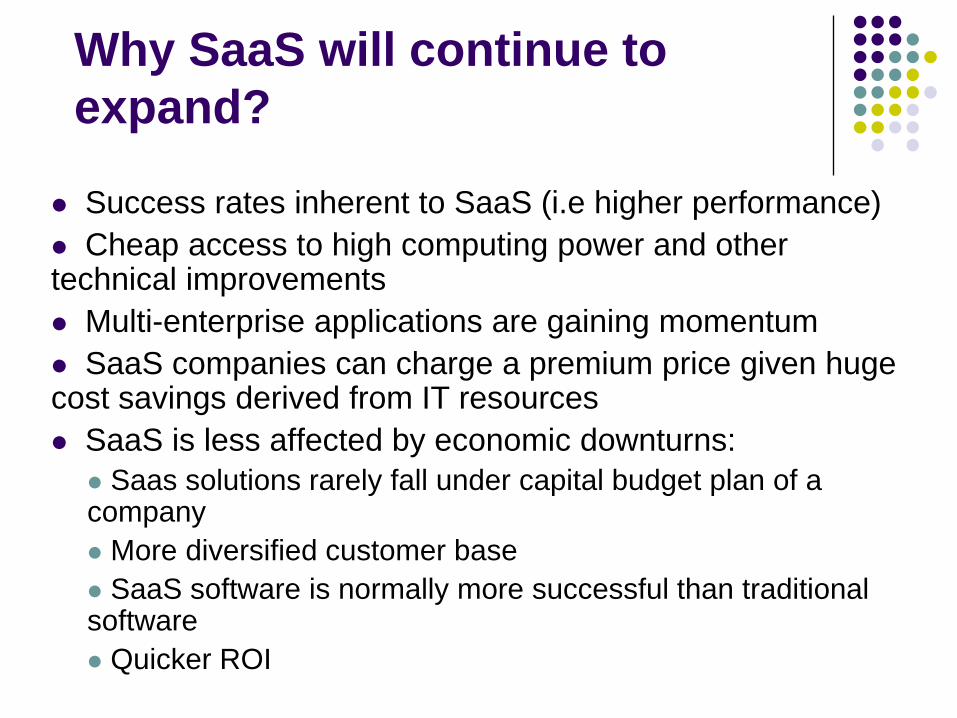
Why SaaS will continue to expand?
Success rates inherent to SaaS (i.e higher performance) Cheap access to high computing power and other technical improvements Multi-enterprise applications are gaining momentum SaaS companies can charge a premium price given huge cost savings derived from IT resources SaaS is less affected by economic downturns: Saas solutions rarely fall under capital budget plan of a company More diversified customer base SaaS software is normally more successful than traditional software Quicker ROI
P/E is inappropriate
Challenges in applying the standard valuation price to EPS multiplies to SaaS industry (front-end loaded customer acquisition costs in a high-growth environment)
Use the Deutsche Bank Research methodology (Lifetime value and customer acquisition analysis) to value SaaS stocks
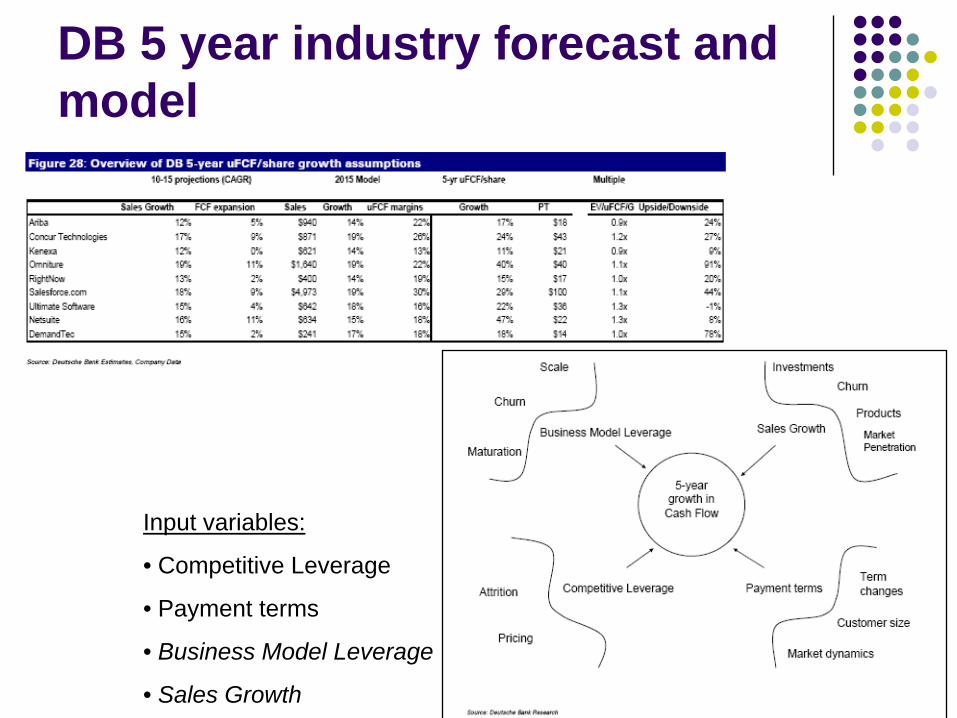
DB 5 year industry forecast and model
Input variables:
• Competitive Leverage
• Payment terms
• Business Model Leverage
• Sales Growth
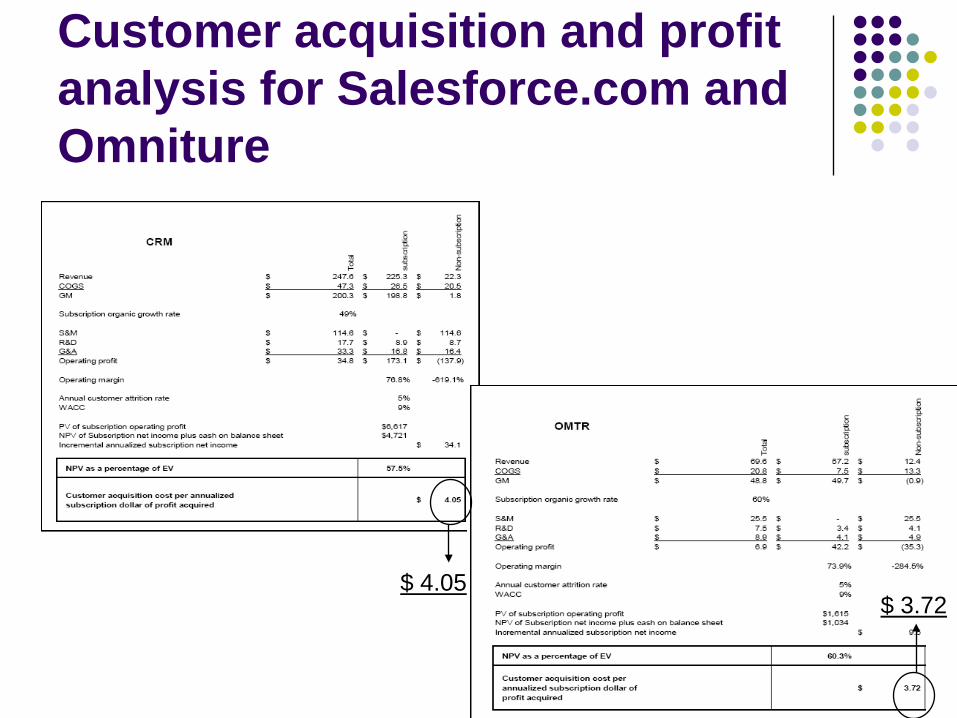
Customer acquisition and profit analysis for Salesforce.com and Omniture
$ 4.05$ 3.72
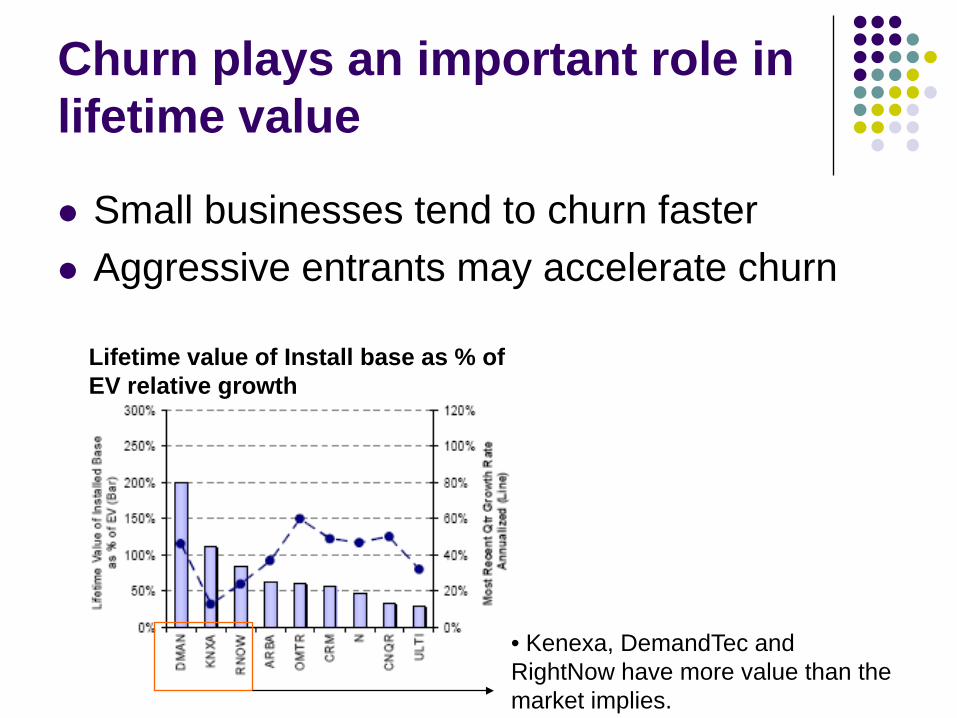
Churn plays an important role in lifetime value
Small businesses tend to churn faster Aggressive entrants may accelerate churn
• Kenexa, DemandTec and RightNow have more value than the market implies.
Lifetime value of Install base as % of EV relative growth
Which are the risks of this growth? Data Security issues: a significant data security lapse
could deflate customer confidence Data ownership issues – mission critical data in the
hands of some other company Service outages Monopolistic behavior by a large software vendor (i.e.
SAP) Ability to handle this rapid growth SAAS becomes commoditized – any supplier same as
any other supplier Resistance against consolidate prevents true economy
of scale
Executive Summary
The trend is here ! Many more companies than expected Advantages of SAAS becoming more apparent Maturing market and ecosystem Company valuation remains difficult Impact on traditional software unclear Risks (data security, ownership, etc.) remain
Team 10
I N D U S T R Y O V E R V I E WT E A M 1 0
2 0 O C T 2 0 0 8
Y I L U N H UE L I H U L U N A - T H O M A S
R A L U C A S C A R L A TA N I R B A N S E N
Software CompaniesSAAS: Software as a Service
MBA290G – INTERNATIONAL COMPETITION IN TECHNOLOGY, HAAS SCHOOL OF BUSINESS, UC BERKELEY
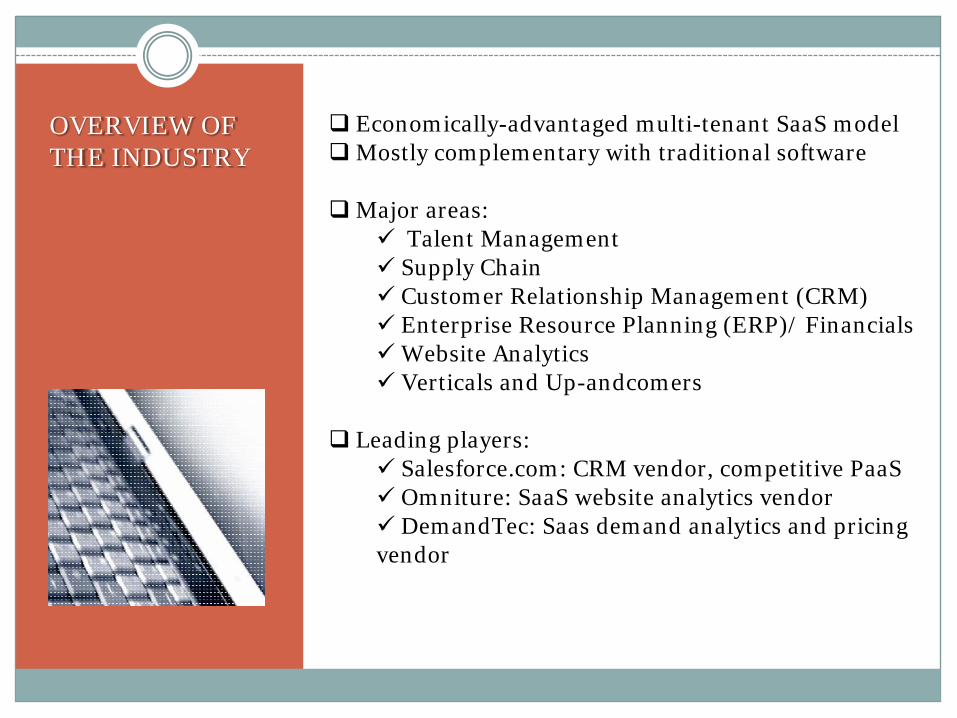
OVERVIEW OF THE INDUSTRY
Economically-advantaged multi-tenant SaaS modelMostly complementary with traditional software
Major areas: Talent Management Supply Chain Customer Relationship Management (CRM) Enterprise Resource Planning (ERP)/ FinancialsWebsite Analytics Verticals and Up-andcomers
Leading players: Salesforce.com: CRM vendor, competitive PaaS Omniture: SaaS website analytics vendor DemandTec: Saas demand analytics and pricing vendor
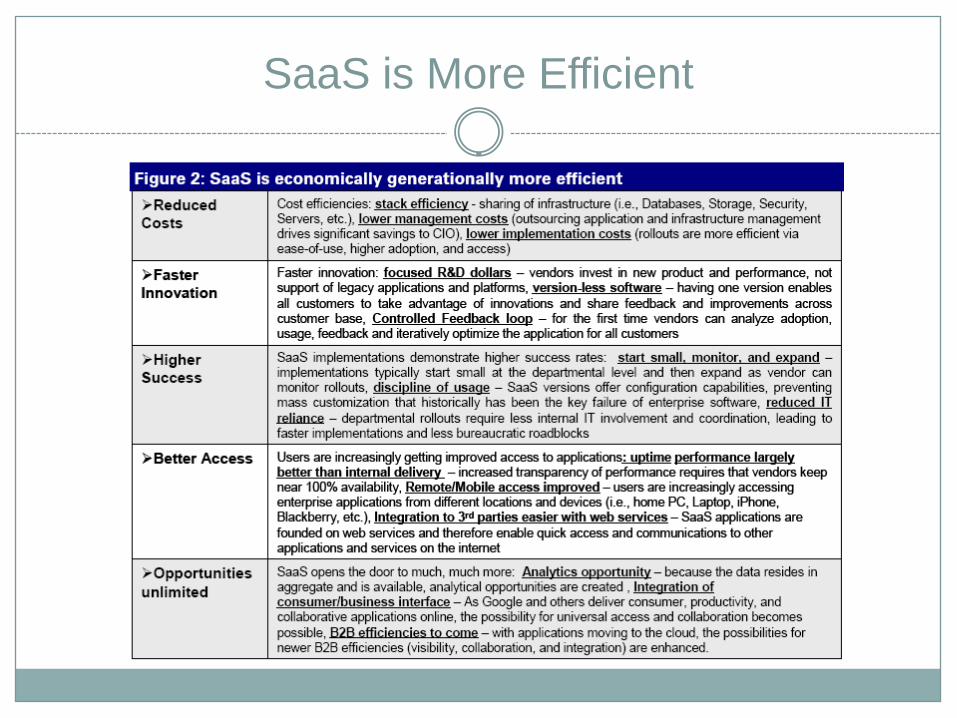
SaaS is More Efficient
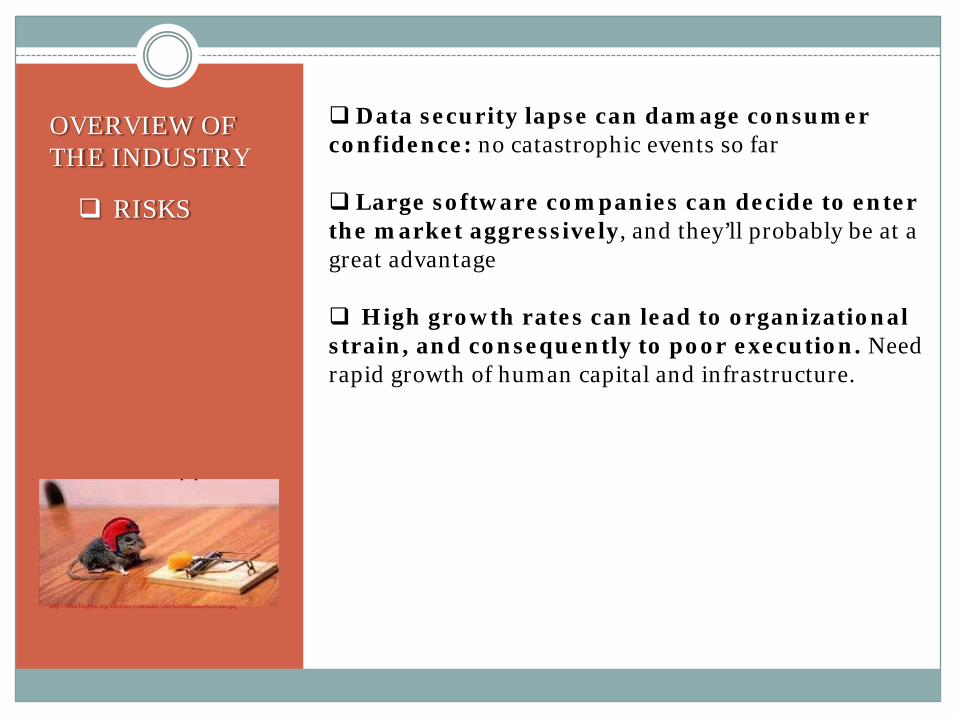
OVERVIEW OF THE INDUSTRY
RISKS
Data security lapse can damage consumer confidence: no catastrophic events so far
Large software companies can decide to enter the market aggressively, and they’ll probably be at a great advantage
High growth rates can lead to organizational strain, and consequently to poor execution. Need rapid growth of human capital and infrastructure.
http://www.blogtext.org/userFiles/CABAnata/Take%20calculated%20risks.jpg
THE STATUS OF THIS NEW MARKETPLACE
SaaS is a well established trend: stack efficiency, innovation advantage, higher customer success, application access everywhere, customer preference. - there is some skepticism that SaaS will remain sustainable, but SaaS is more economically efficient than client-server architectures on mainframe.
Lots of companies
Market concentration through consolidations
Platforms are forming: cloud computing platforms enable IT, ISVs, Sis, and independent devlopers to build and deliver SaaS – example platforms: Force.com (CRM), App Engine (Google), EC2 (Amazon)
Leaders are beginning to stand out: first-mover and scale advantages are more pronounced than with other software, because of network effects
Multi-tenant is advancing fasthttp://stanandergo.files.wordpress.com/2008/03/status-report.jpg
THE STATUS OF THIS NEW MARKETPLACE
(continued)
Established Software and Internet Companies are starting to respond, but they face challenges: structure, time-to-market, cannibalization, business model
No strong impact on traditional software
Software Industry has interest in partnering, but not entering SaaS market themselves.
Difficult to value: subscription revenues complicate matters; instead look at lifetime value of the customer base, and consumer acquisition patterns
http://stanandergo.files.wordpress.com/2008/03/status-report.jpg
WHY P/E IS INAPPROPRIATE
PE = price to earnings ratiolow PE => it costs the investors less to make the same amount of profit
But PE is not a good metric for SaaS because:
deferred GAAP revenue recognition model front-end loaded customer acquisition costs high-growth environment
HOW SAAS COMPANIES SHOULD BE VALUED IN THE MARKETPLACE
General Approach: Lifetime Value Customer Acquisition Cost Analysis Structural Analysis of business leverage
• Estimate a 5-year unlevered free cash flow (uFCF) growth rate (2010 to 2015).
• Calculate growth rate based on: business model leverage sales growth competitive leverage payment terms
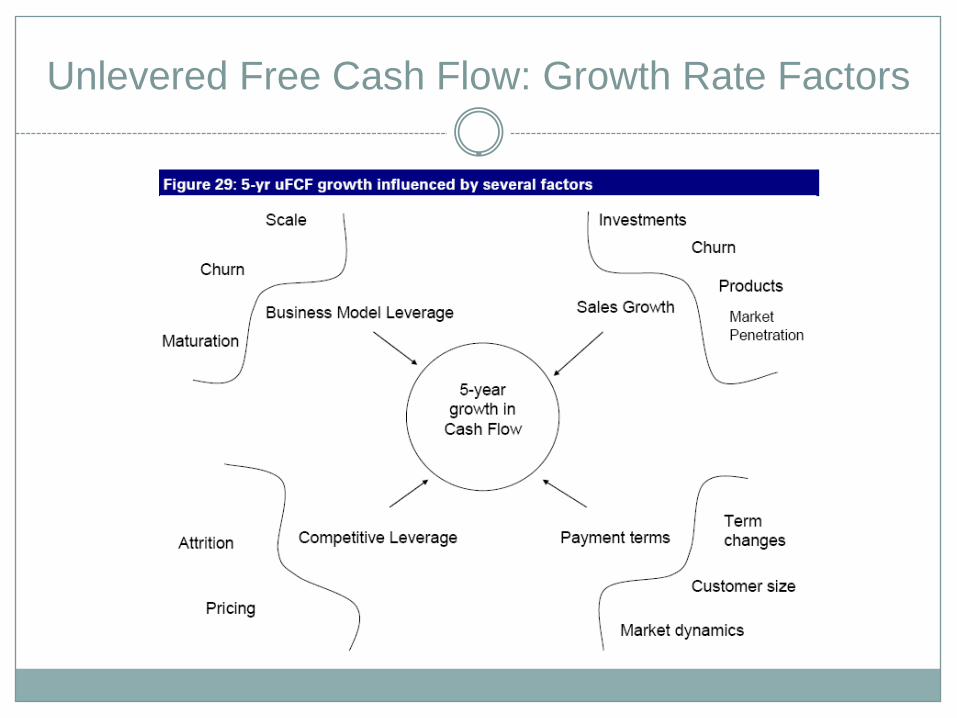
Unlevered Free Cash Flow: Growth Rate Factors
1 . D E U T S C H E B A N K . “ S A A S A N D C L O U D C O M P U T I N G . E N D G A M EC L E A R E R I N ‘ 0 8 : L E G A C Y C H E C K M A T E . ” 1 2 J U N . 2 0 0 8 .
2 . R B C C A P I T A L M A R K E T S . “ O N D E M A N D E V O L U T I O N , V O L U M E I I .I N S I G H T S A N D B E S T P R A C T I C E S A T L E A D I N G O N D E M A N D S A A SP R O V I D E R S . ” A U G U S T 2 0 0 8 .
3 . S O U R C E F O R F I G U R E S A N D T A B L E S : D E U T S C H E B A N K R E S E A R C H
Resources
Industry Overview: Additional Slides
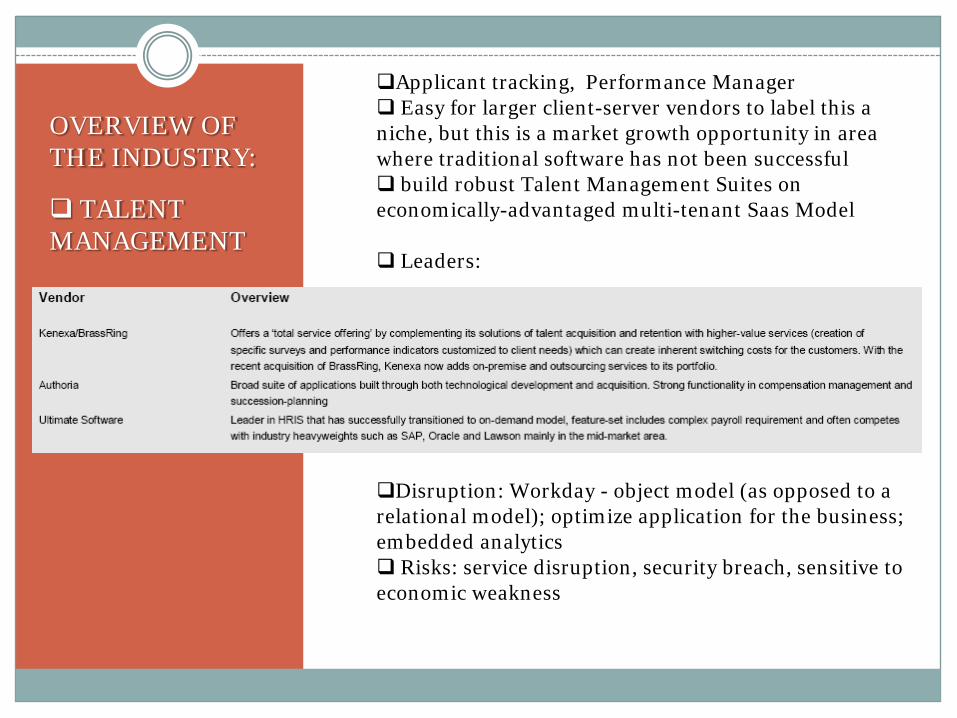
OVERVIEW OF THE INDUSTRY:
TALENT MANAGEMENT
Applicant tracking, Performance Manager Easy for larger client-server vendors to label this a niche, but this is a market growth opportunity in area where traditional software has not been successful build robust Talent Management Suites on economically-advantaged multi-tenant Saas Model
Leaders:
Disruption: Workday - object model (as opposed to a relational model); optimize application for the business; embedded analytics Risks: service disruption, security breach, sensitive to economic weakness
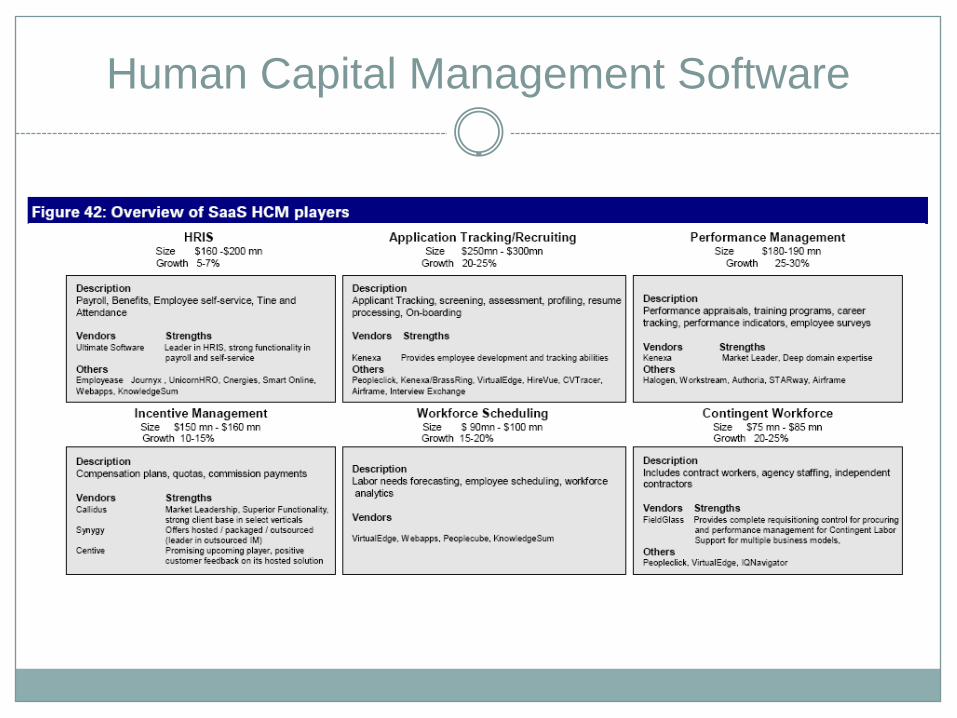
Human Capital Management Software
OVERVIEW OF THE INDUSTRY:
SUPPLY CHAIN
OVERVIEW OF THE INDUSTRY:
CUSTOMER RELATIONSHIP MANAGEMENT (CRM)
OVERVIEW OF THE INDUSTRY:
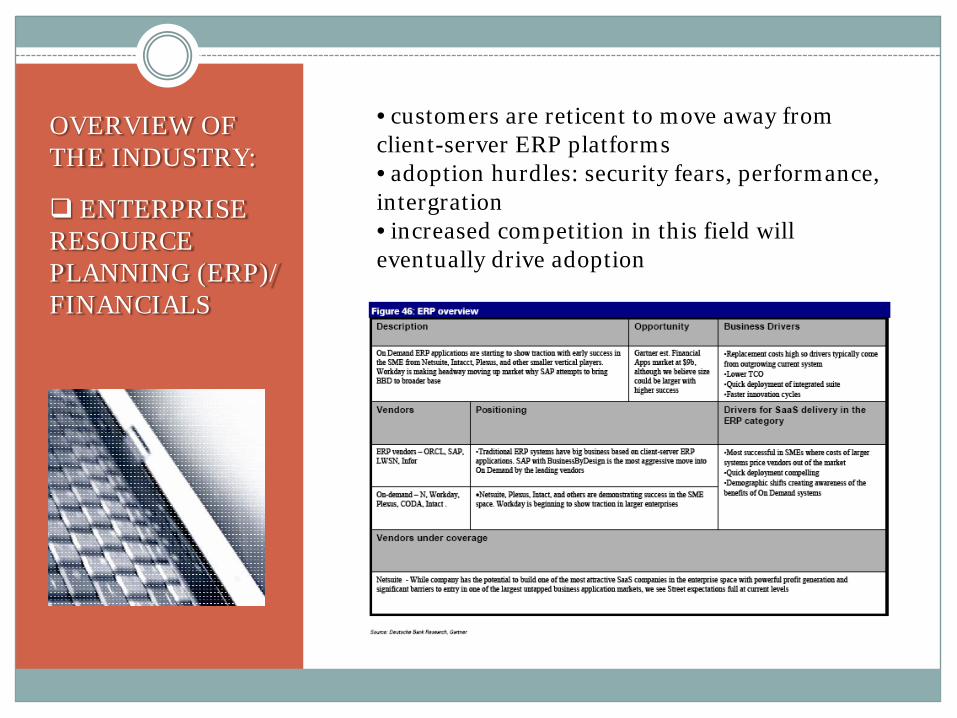
ENTERPRISE RESOURCE PLANNING (ERP)/ FINANCIALS
• customers are reticent to move away from client-server ERP platforms• adoption hurdles: security fears, performance, intergration• increased competition in this field will eventually drive adoption
OVERVIEW OF THE INDUSTRY:
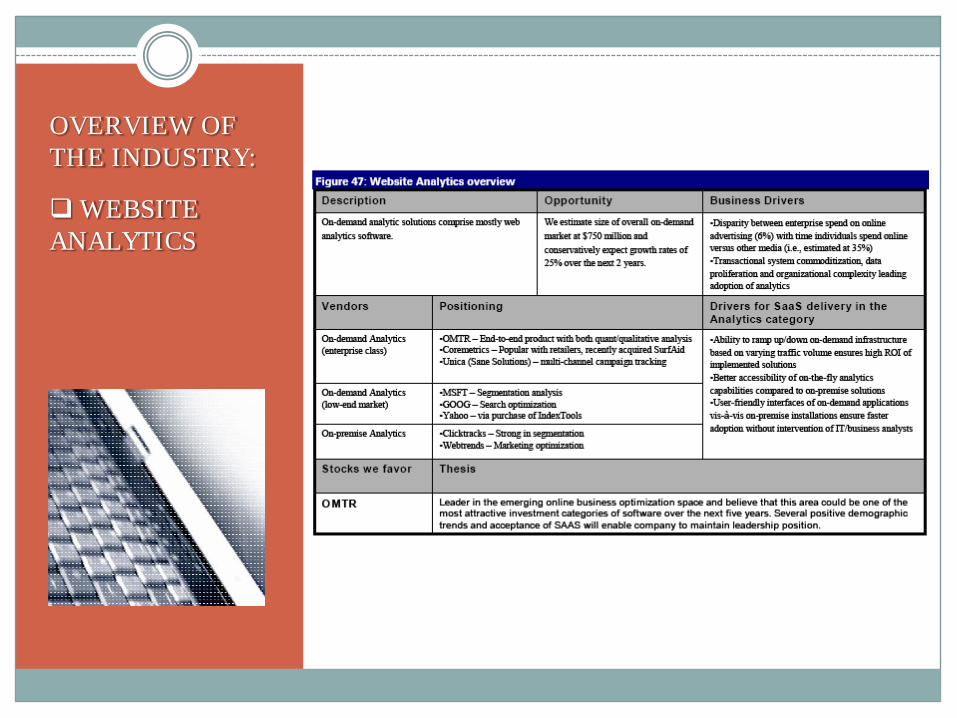
WEBSITE ANALYTICS
OVERVIEW OF THE INDUSTRY:
VERTICALS AND UP-AND-COMERS
• on-demand solutions that were once niche markets• mortgage industry, property management, medical billing, non-profit marketing, restaurant management, etc
Team 7
Team 7KC ChenAnthony GoodrowAndrew LiaoTao ShaPiyapat Tantiwong
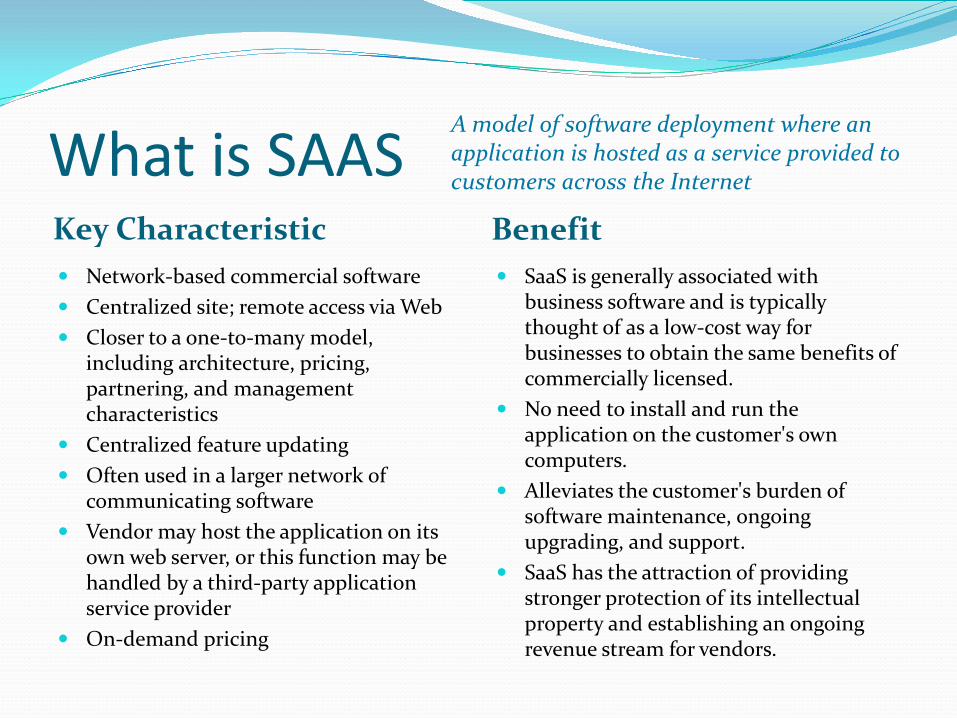
What is SAASKey Characteristic Benefit Network-based commercial software Centralized site; remote access via Web Closer to a one-to-many model,
including architecture, pricing, partnering, and management characteristics
Centralized feature updating Often used in a larger network of
communicating software Vendor may host the application on its
own web server, or this function may be handled by a third-party application service provider
On-demand pricing
SaaS is generally associated with business software and is typically thought of as a low-cost way for businesses to obtain the same benefits of commercially licensed.
No need to install and run the application on the customer's own computers.
Alleviates the customer's burden of software maintenance, ongoing upgrading, and support.
SaaS has the attraction of providing stronger protection of its intellectual property and establishing an ongoing revenue stream for vendors.
A model of software deployment where an application is hosted as a service provided to customers across the Internet
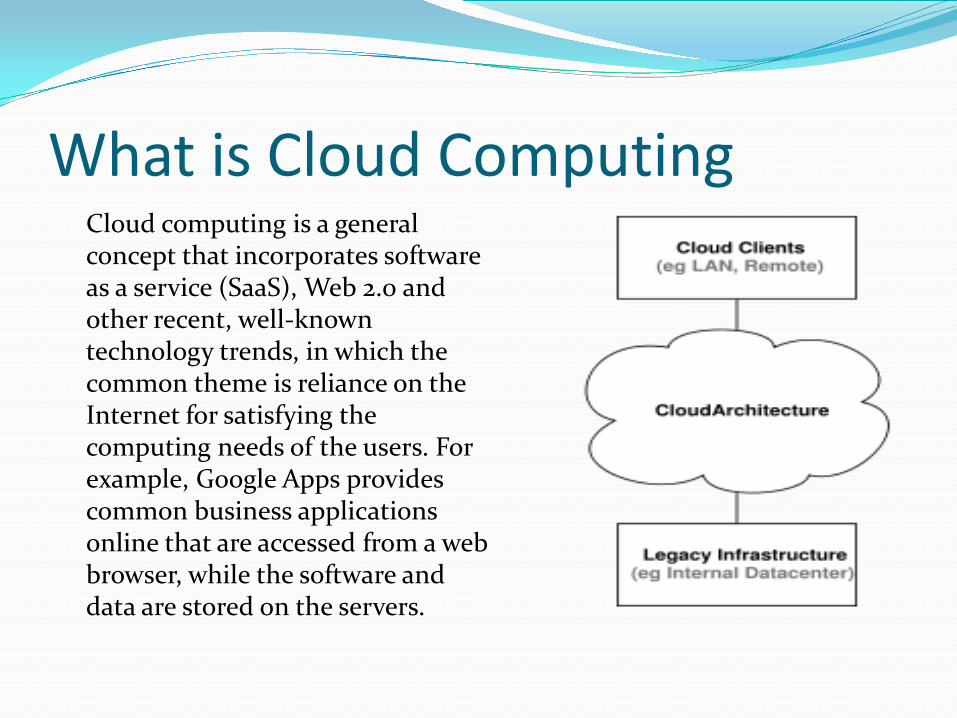
What is Cloud ComputingCloud computing is a general concept that incorporates software as a service (SaaS), Web 2.0 and other recent, well-known technology trends, in which the common theme is reliance on the Internet for satisfying the computing needs of the users. For example, Google Apps provides common business applications online that are accessed from a web browser, while the software and data are stored on the servers.
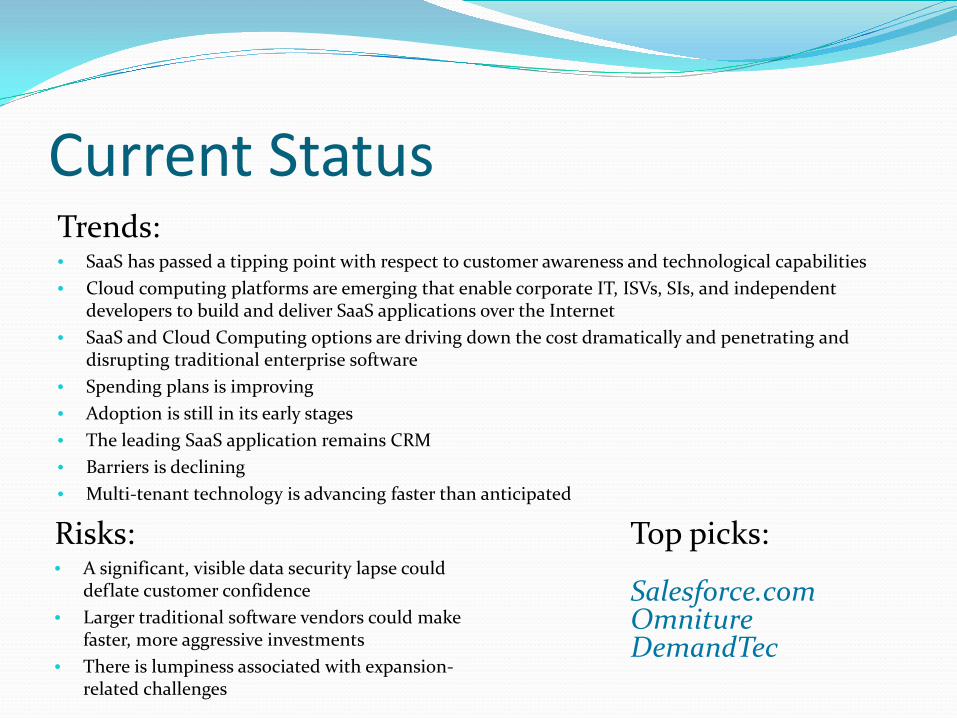
Current StatusTrends: • SaaS has passed a tipping point with respect to customer awareness and technological capabilities• Cloud computing platforms are emerging that enable corporate IT, ISVs, SIs, and independent
developers to build and deliver SaaS applications over the Internet• SaaS and Cloud Computing options are driving down the cost dramatically and penetrating and
disrupting traditional enterprise software• Spending plans is improving• Adoption is still in its early stages• The leading SaaS application remains CRM• Barriers is declining• Multi-tenant technology is advancing faster than anticipated
Top picks:
Salesforce.comOmnitureDemandTec
Risks:• A significant, visible data security lapse could
deflate customer confidence• Larger traditional software vendors could make
faster, more aggressive investments• There is lumpiness associated with expansion-
related challenges
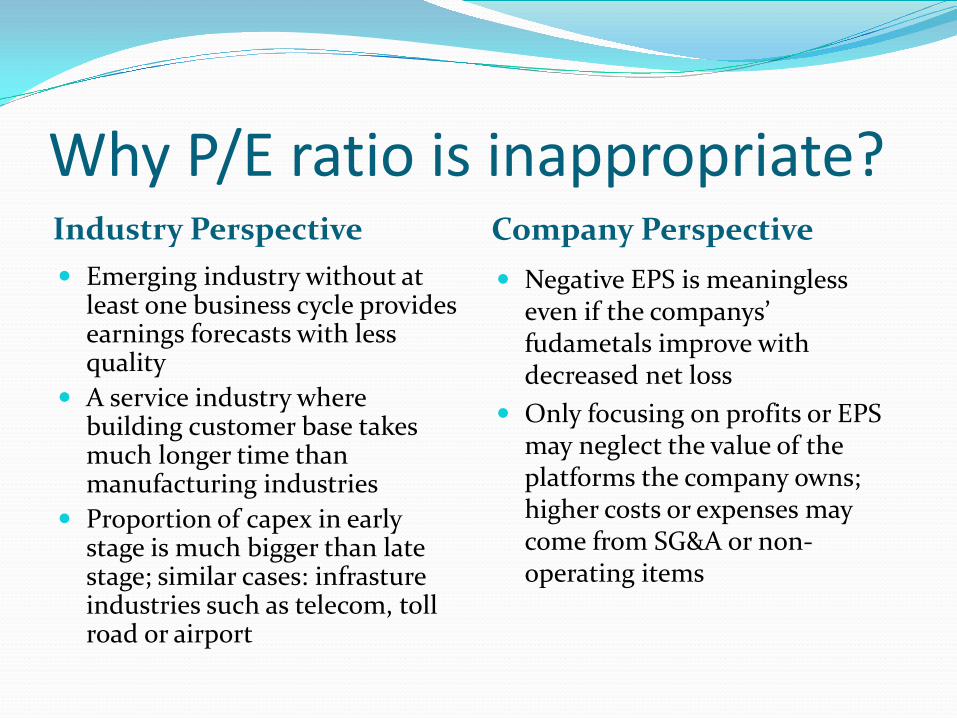
Why P/E ratio is inappropriate?Industry Perspective Company Perspective Emerging industry without at
least one business cycle provides earnings forecasts with less quality
A service industry where building customer base takes much longer time than manufacturing industries
Proportion of capex in early stage is much bigger than late stage; similar cases: infrastureindustries such as telecom, toll road or airport
Negative EPS is meaningless even if the companys’ fudametals improve with decreased net loss
Only focusing on profits or EPS may neglect the value of the platforms the company owns; higher costs or expenses may come from SG&A or non-operating items
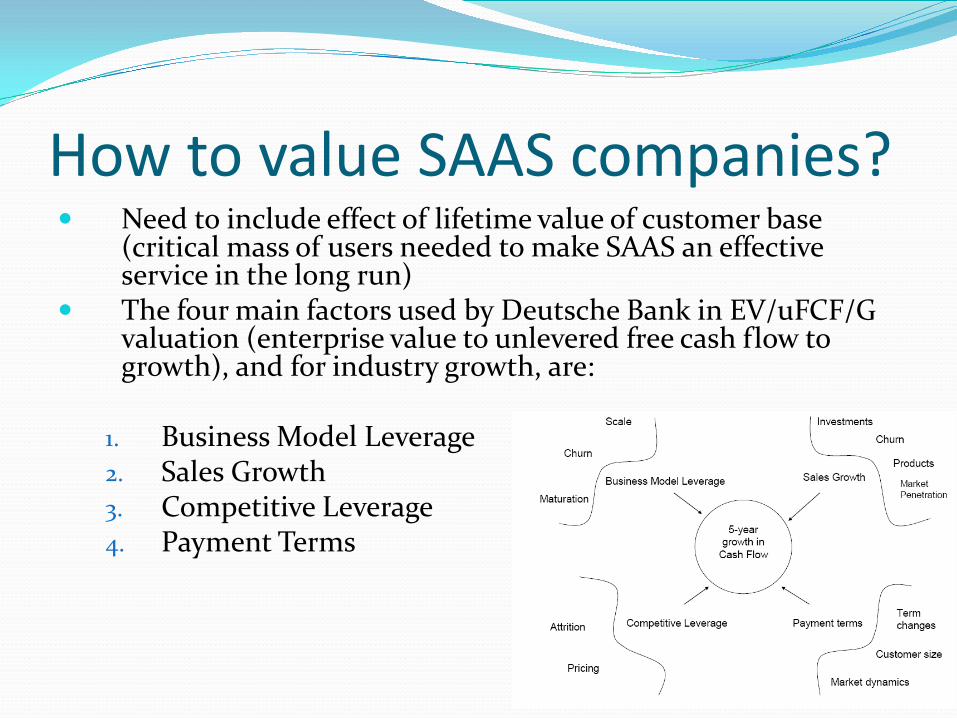
How to value SAAS companies? Need to include effect of lifetime value of customer base
(critical mass of users needed to make SAAS an effective service in the long run)
The four main factors used by Deutsche Bank in EV/uFCF/G valuation (enterprise value to unlevered free cash flow to growth), and for industry growth, are:
1. Business Model Leverage2. Sales Growth3. Competitive Leverage4. Payment Terms

Team 3


![Core Software Technologies [CoreTech]coretechit.com/CoreTech_Company_Profile1.0.pdfCore Software Technologies [CoreTech] Company Profile Core Software Technologies Company Profile](https://img.pdfslide.net/doc/110x75/5aa333167f8b9a1f6d8e45d0/core-software-technologies-coretech-software-technologies-coretech-company-profile.jpg)