Embed Size (px)
Citation preview
International Journal of Applied Engineering Research ISSN 0973-4562 Volume 12, Number 18 (2017) pp. 7490-7500 © Research India Publications. http://www.ripublication.com
7490
Soil Liquefaction Potential Assessment in Northern Thailand
Pithan Pairojn1 and Thipphamala Manivong2
1Division of Civil Engineering Technology, Faculty of Science, Chandrakasem Rajabhat University, Bangkok, 10900, Thailand. 2Department of Civil Engineering, Faculty of Engineering, National University of Laos, Vientiane, 3166, Laos.
1Orcid ID: 0000-0002-5318-9666
Abstract
The aim of this study is to analyze liquefaction due to an earthquake. Specifically, an earthquake which was felt in northern Thailand that is sensitive to liquefaction. The first liquefaction was discovered in Thailand at 6.8 moment magnitude earthquake occurred in the central region of Myanmar causing widespread liquefaction in 2011, and Liquefaction occurred again at 6.3 moment magnitude in Mae Laos, Chaing Rai Province in 2014. Liquefaction has been observed in a wide area in Chaing Rai province in two different studies of geographical evidence that analyzed the resulting opportunity of liquefaction in the Northern of Thailand by the factor of safety against liquefaction. The subsoil profile and peak horizontal ground acceleration were analyzed in this study. The results can be used to prepare safeguards that reduce the danger from liquefaction in northern Thailand.
Keywords: Liquefaction, Earthquakes, Factor of safety against liquefaction, Cyclic Stress Ratio, Cyclic Resistance Ratio
INTRODUCTION
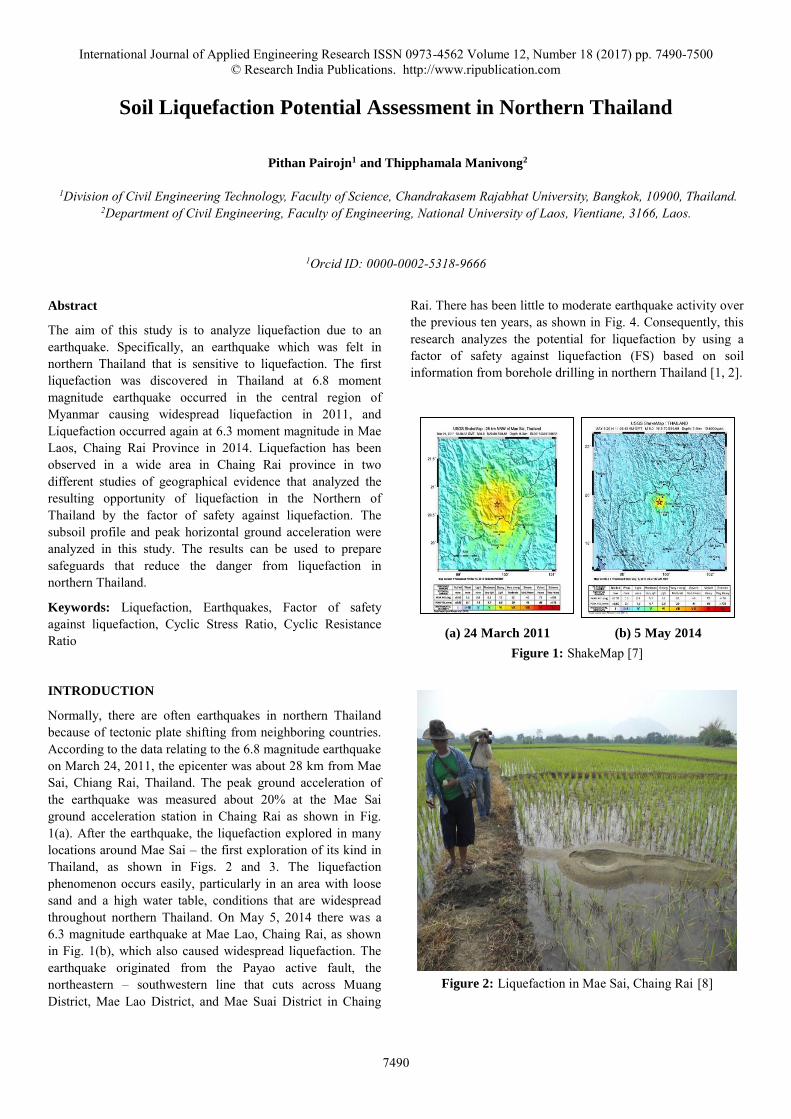
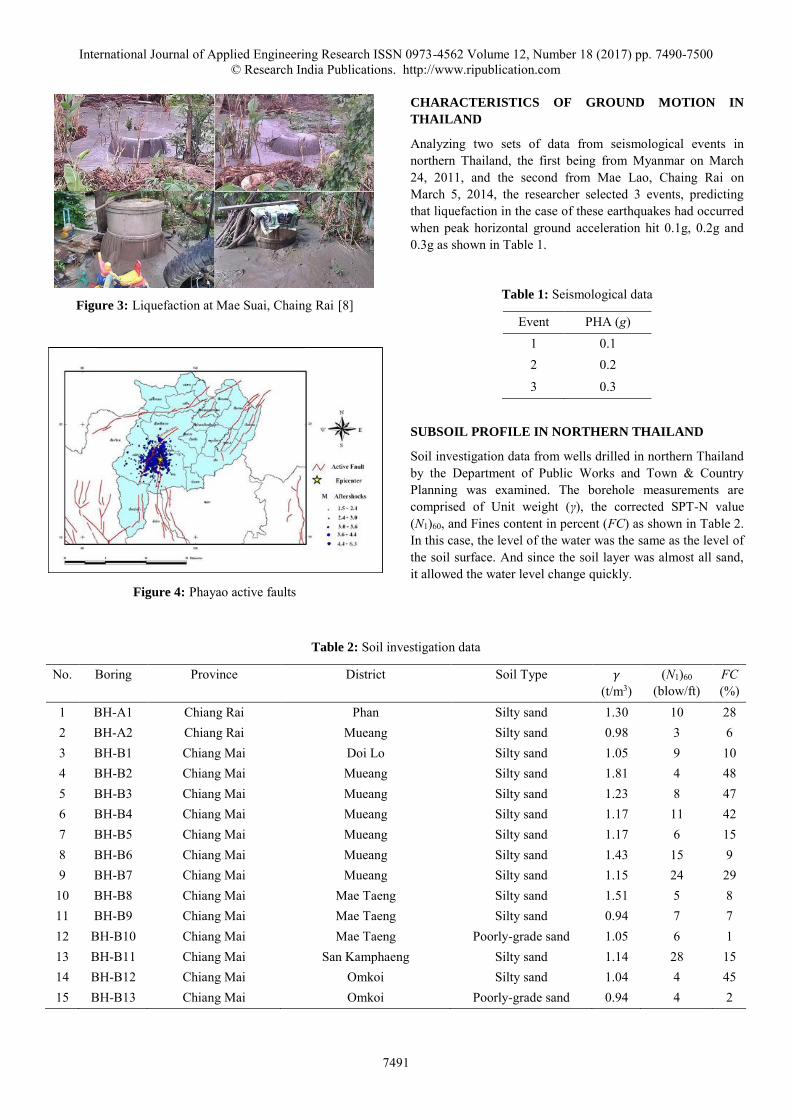
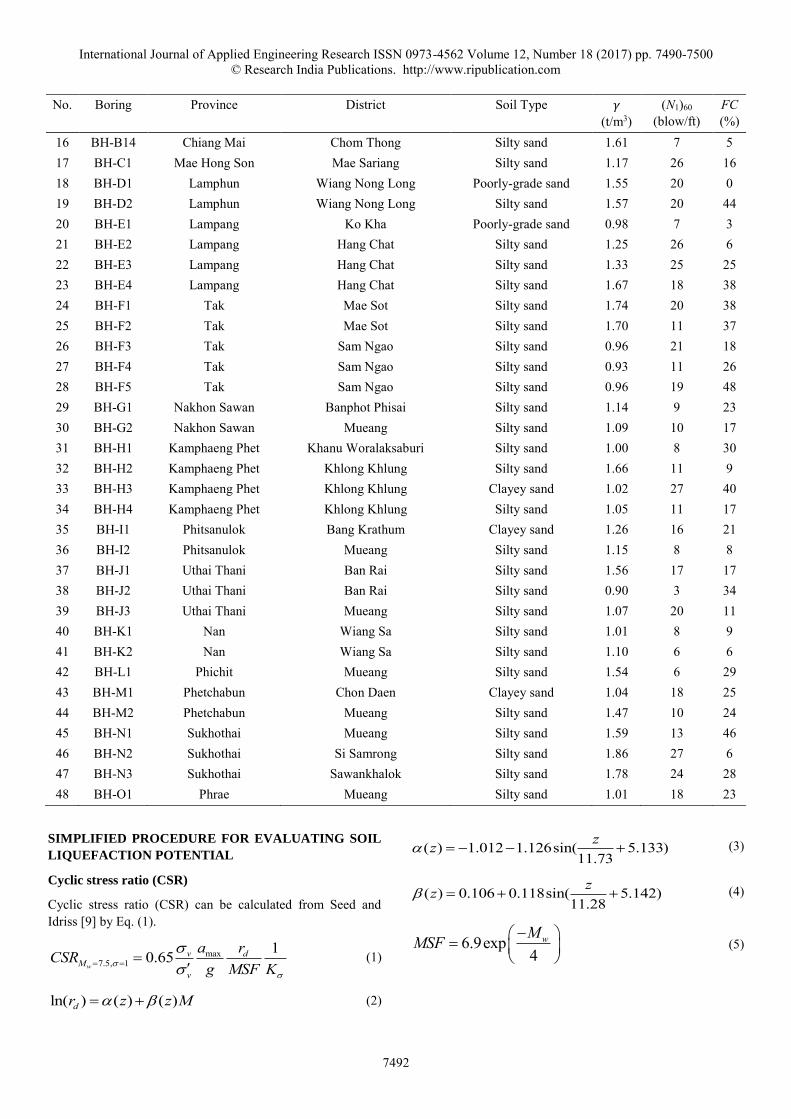
Normally, there are often earthquakes in northern Thailand because of tectonic plate shifting from neighboring countries. According to the data relating to the 6.8 magnitude earthquake on March 24, 2011, the epicenter was about 28 km from Mae Sai, Chiang Rai, Thailand. The peak ground acceleration of the earthquake was measured about 20% at the Mae Sai ground acceleration station in Chaing Rai as shown in Fig. 1(a). After the earthquake, the liquefaction explored in many locations around Mae Sai – the first exploration of its kind in Thailand, as shown in Figs. 2 and 3. The liquefaction phenomenon occurs easily, particularly in an area with loose sand and a high water table, conditions that are widespread throughout northern Thailand. On May 5, 2014 there was a 6.3 magnitude earthquake at Mae Lao, Chaing Rai, as shown in Fig. 1(b), which also caused widespread liquefaction. The earthquake originated from the Payao active fault, the northeastern – southwestern line that cuts across Muang District, Mae Lao District, and Mae Suai District in Chaing
Rai. There has been little to moderate earthquake activity over the previous ten years, as shown in Fig. 4. Consequently, this research analyzes the potential for liquefaction by using a factor of safety against liquefaction (FS) based on soil information from borehole drilling in northern Thailand [1, 2].
(a) 24 March 2011 (b) 5 May 2014
Figure 1: ShakeMap [7]
Figure 2: Liquefaction in Mae Sai, Chaing Rai [8]
International Journal of Applied Engineering Research ISSN 0973-4562 Volume 12, Number 18 (2017) pp. 7490-7500 © Research India Publications. http://www.ripublication.com
7491
Figure 3: Liquefaction at Mae Suai, Chaing Rai [8]
Figure 4: Phayao active faults
CHARACTERISTICS OF GROUND MOTION IN
THAILAND
Analyzing two sets of data from seismological events in northern Thailand, the first being from Myanmar on March 24, 2011, and the second from Mae Lao, Chaing Rai on March 5, 2014, the researcher selected 3 events, predicting that liquefaction in the case of these earthquakes had occurred when peak horizontal ground acceleration hit 0.1g, 0.2g and 0.3g as shown in Table 1.
Table 1: Seismological data
Event PHA (g) 1 0.1 2 0.2
3 0.3
SUBSOIL PROFILE IN NORTHERN THAILAND
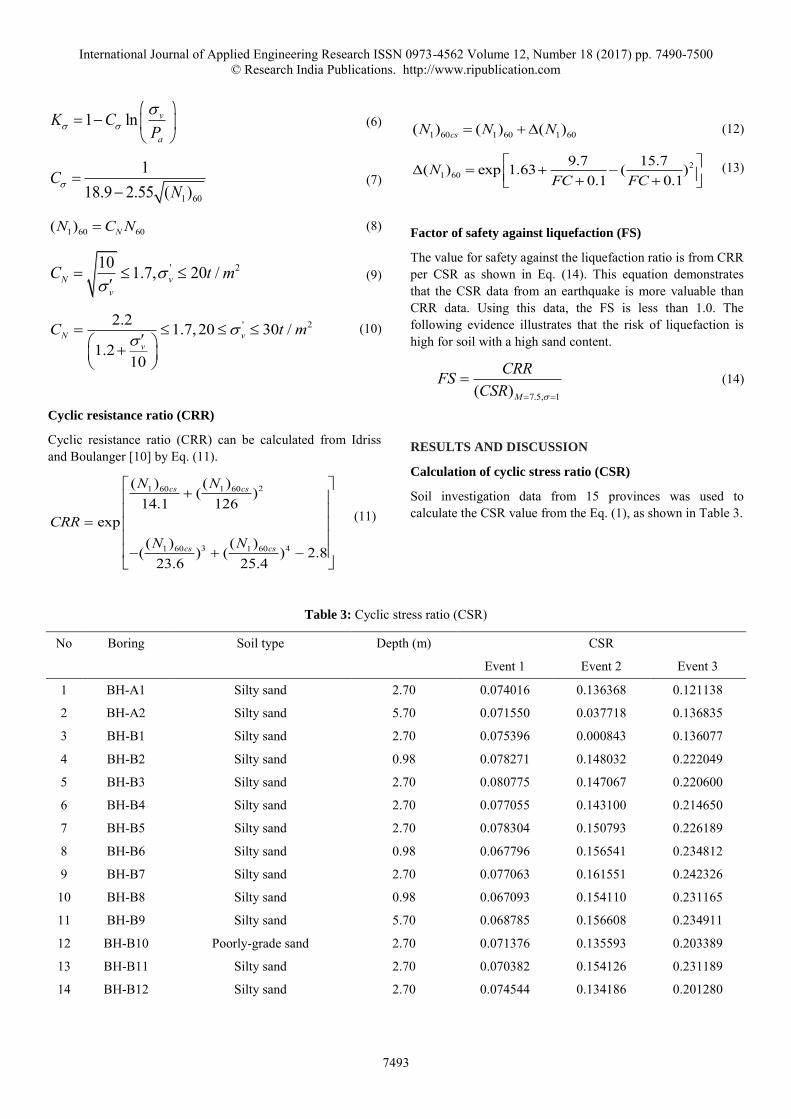
Soil investigation data from wells drilled in northern Thailand by the Department of Public Works and Town & Country Planning was examined. The borehole measurements are comprised of Unit weight (γ), the corrected SPT-N value (N1)60, and Fines content in percent (FC) as shown in Table 2. In this case, the level of the water was the same as the level of the soil surface. And since the soil layer was almost all sand, it allowed the water level change quickly.
Table 2: Soil investigation data
No. Boring Province District Soil Type 𝛾 (t/m3)
(N1)60 (blow/ft)
FC (%)
1 BH-A1 Chiang Rai Phan Silty sand 1.30 10 28 2 BH-A2 Chiang Rai Mueang Silty sand 0.98 3 6 3 BH-B1 Chiang Mai Doi Lo Silty sand 1.05 9 10 4 BH-B2 Chiang Mai Mueang Silty sand 1.81 4 48 5 BH-B3 Chiang Mai Mueang Silty sand 1.23 8 47 6 BH-B4 Chiang Mai Mueang Silty sand 1.17 11 42 7 BH-B5 Chiang Mai Mueang Silty sand 1.17 6 15 8 BH-B6 Chiang Mai Mueang Silty sand 1.43 15 9 9 BH-B7 Chiang Mai Mueang Silty sand 1.15 24 29
10 BH-B8 Chiang Mai Mae Taeng Silty sand 1.51 5 8 11 BH-B9 Chiang Mai Mae Taeng Silty sand 0.94 7 7 12 BH-B10 Chiang Mai Mae Taeng Poorly-grade sand 1.05 6 1 13 BH-B11 Chiang Mai San Kamphaeng Silty sand 1.14 28 15 14 BH-B12 Chiang Mai Omkoi Silty sand 1.04 4 45 15 BH-B13 Chiang Mai Omkoi Poorly-grade sand 0.94 4 2
International Journal of Applied Engineering Research ISSN 0973-4562 Volume 12, Number 18 (2017) pp. 7490-7500 © Research India Publications. http://www.ripublication.com
7492
No. Boring Province District Soil Type 𝛾 (t/m3)
(N1)60 (blow/ft)
FC (%)
16 BH-B14 Chiang Mai Chom Thong Silty sand 1.61 7 5 17 BH-C1 Mae Hong Son Mae Sariang Silty sand 1.17 26 16 18 BH-D1 Lamphun Wiang Nong Long Poorly-grade sand 1.55 20 0 19 BH-D2 Lamphun Wiang Nong Long Silty sand 1.57 20 44 20 BH-E1 Lampang Ko Kha Poorly-grade sand 0.98 7 3 21 BH-E2 Lampang Hang Chat Silty sand 1.25 26 6 22 BH-E3 Lampang Hang Chat Silty sand 1.33 25 25 23 BH-E4 Lampang Hang Chat Silty sand 1.67 18 38 24 BH-F1 Tak Mae Sot Silty sand 1.74 20 38 25 BH-F2 Tak Mae Sot Silty sand 1.70 11 37 26 BH-F3 Tak Sam Ngao Silty sand 0.96 21 18 27 BH-F4 Tak Sam Ngao Silty sand 0.93 11 26 28 BH-F5 Tak Sam Ngao Silty sand 0.96 19 48 29 BH-G1 Nakhon Sawan Banphot Phisai Silty sand 1.14 9 23 30 BH-G2 Nakhon Sawan Mueang Silty sand 1.09 10 17 31 BH-H1 Kamphaeng Phet Khanu Woralaksaburi Silty sand 1.00 8 30 32 BH-H2 Kamphaeng Phet Khlong Khlung Silty sand 1.66 11 9 33 BH-H3 Kamphaeng Phet Khlong Khlung Clayey sand 1.02 27 40 34 BH-H4 Kamphaeng Phet Khlong Khlung Silty sand 1.05 11 17 35 BH-I1 Phitsanulok Bang Krathum Clayey sand 1.26 16 21 36 BH-I2 Phitsanulok Mueang Silty sand 1.15 8 8 37 BH-J1 Uthai Thani Ban Rai Silty sand 1.56 17 17 38 BH-J2 Uthai Thani Ban Rai Silty sand 0.90 3 34 39 BH-J3 Uthai Thani Mueang Silty sand 1.07 20 11 40 BH-K1 Nan Wiang Sa Silty sand 1.01 8 9 41 BH-K2 Nan Wiang Sa Silty sand 1.10 6 6 42 BH-L1 Phichit Mueang Silty sand 1.54 6 29 43 BH-M1 Phetchabun Chon Daen Clayey sand 1.04 18 25 44 BH-M2 Phetchabun Mueang Silty sand 1.47 10 24 45 BH-N1 Sukhothai Mueang Silty sand 1.59 13 46 46 BH-N2 Sukhothai Si Samrong Silty sand 1.86 27 6 47 BH-N3 Sukhothai Sawankhalok Silty sand 1.78 24 28 48 BH-O1 Phrae Mueang Silty sand 1.01 18 23
SIMPLIFIED PROCEDURE FOR EVALUATING SOIL
LIQUEFACTION POTENTIAL
Cyclic stress ratio (CSR)
Cyclic stress ratio (CSR) can be calculated from Seed and Idriss [9] by Eq. (1).
max7.5, 1
10.65w
v dM
v
a rCSRg MSF K
(1)
ln( ) ( ) ( )dr z z M (2)
( ) 1.012 1.126sin( 5.133)11.73
zz (3)
( ) 0.106 0.118sin( 5.142)11.28
zz (4)
6.9exp4
wMMSF
(5)
International Journal of Applied Engineering Research ISSN 0973-4562 Volume 12, Number 18 (2017) pp. 7490-7500 © Research India Publications. http://www.ripublication.com
7493
1 ln v
a
K CP
(6)
1 60
118.9 2.55 ( )
CN
(7)
1 60 60( ) NN C N (8)
' 210 1.7, 20 /N vv
C t m
(9)
' 22.2 1.7,20 30 /1.2
10
N vv
C t m
(10)
Cyclic resistance ratio (CRR)
Cyclic resistance ratio (CRR) can be calculated from Idriss and Boulanger [10] by Eq. (11).
21 60 1 60
3 41 60 1 60
( ) ( )( )
14.1 126exp
( ) ( )( ) ( ) 2.8
23.6 25.4
cs cs
cs cs
N N
CRRN N
(11)
1 60 1 60 1 60( ) ( ) ( )csN N N (12)
21 60
9.7 15.7( ) exp 1.63 ( )0.1 0.1
NFC FC
(13)
Factor of safety against liquefaction (FS)
The value for safety against the liquefaction ratio is from CRR per CSR as shown in Eq. (14). This equation demonstrates that the CSR data from an earthquake is more valuable than CRR data. Using this data, the FS is less than 1.0. The following evidence illustrates that the risk of liquefaction is high for soil with a high sand content.
7.5, 1( )M
CRRFSCSR
(14)
RESULTS AND DISCUSSION
Calculation of cyclic stress ratio (CSR)
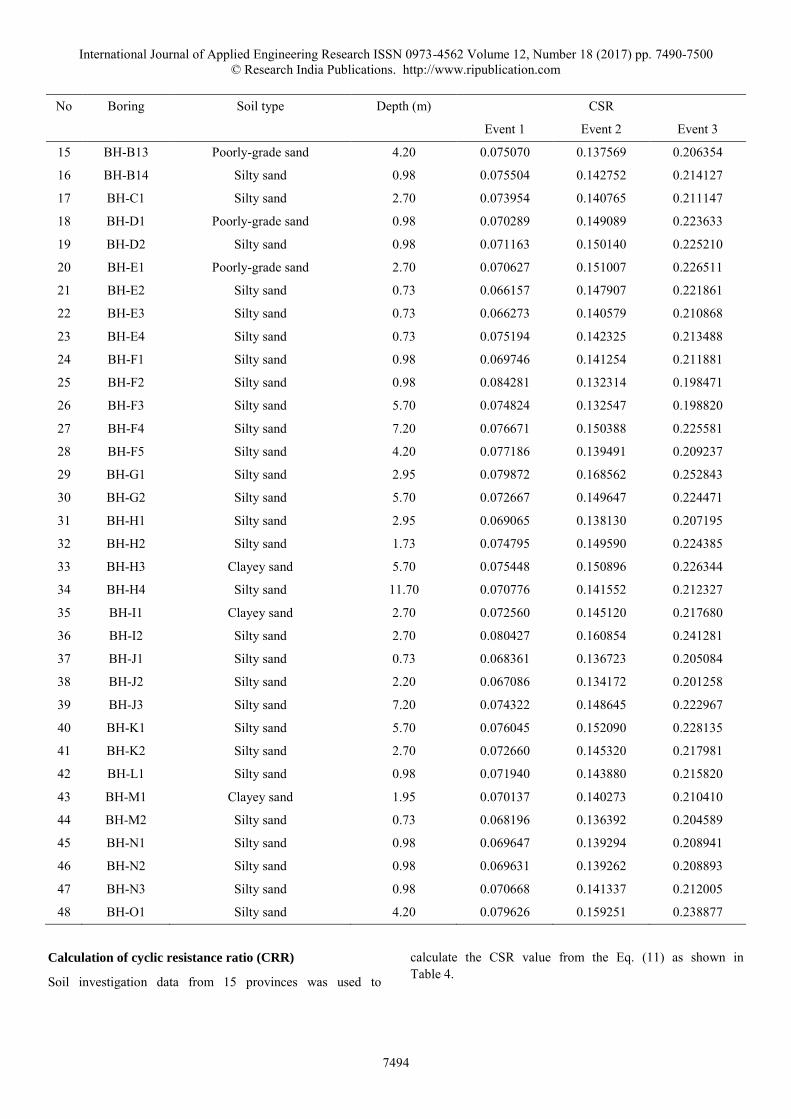
Soil investigation data from 15 provinces was used to calculate the CSR value from the Eq. (1), as shown in Table 3.
Table 3: Cyclic stress ratio (CSR)
No Boring Soil type Depth (m) CSR
Event 1 Event 2 Event 3
1 BH-A1 Silty sand 2.70 0.074016 0.136368 0.121138
2 BH-A2 Silty sand 5.70 0.071550 0.037718 0.136835
3 BH-B1 Silty sand 2.70 0.075396 0.000843 0.136077
4 BH-B2 Silty sand 0.98 0.078271 0.148032 0.222049
5 BH-B3 Silty sand 2.70 0.080775 0.147067 0.220600
6 BH-B4 Silty sand 2.70 0.077055 0.143100 0.214650
7 BH-B5 Silty sand 2.70 0.078304 0.150793 0.226189
8 BH-B6 Silty sand 0.98 0.067796 0.156541 0.234812
9 BH-B7 Silty sand 2.70 0.077063 0.161551 0.242326
10 BH-B8 Silty sand 0.98 0.067093 0.154110 0.231165
11 BH-B9 Silty sand 5.70 0.068785 0.156608 0.234911
12 BH-B10 Poorly-grade sand 2.70 0.071376 0.135593 0.203389
13 BH-B11 Silty sand 2.70 0.070382 0.154126 0.231189
14 BH-B12 Silty sand 2.70 0.074544 0.134186 0.201280
International Journal of Applied Engineering Research ISSN 0973-4562 Volume 12, Number 18 (2017) pp. 7490-7500 © Research India Publications. http://www.ripublication.com
7494
No Boring Soil type Depth (m) CSR
Event 1 Event 2 Event 3
15 BH-B13 Poorly-grade sand 4.20 0.075070 0.137569 0.206354
16 BH-B14 Silty sand 0.98 0.075504 0.142752 0.214127
17 BH-C1 Silty sand 2.70 0.073954 0.140765 0.211147
18 BH-D1 Poorly-grade sand 0.98 0.070289 0.149089 0.223633
19 BH-D2 Silty sand 0.98 0.071163 0.150140 0.225210
20 BH-E1 Poorly-grade sand 2.70 0.070627 0.151007 0.226511
21 BH-E2 Silty sand 0.73 0.066157 0.147907 0.221861
22 BH-E3 Silty sand 0.73 0.066273 0.140579 0.210868
23 BH-E4 Silty sand 0.73 0.075194 0.142325 0.213488
24 BH-F1 Silty sand 0.98 0.069746 0.141254 0.211881
25 BH-F2 Silty sand 0.98 0.084281 0.132314 0.198471
26 BH-F3 Silty sand 5.70 0.074824 0.132547 0.198820
27 BH-F4 Silty sand 7.20 0.076671 0.150388 0.225581
28 BH-F5 Silty sand 4.20 0.077186 0.139491 0.209237
29 BH-G1 Silty sand 2.95 0.079872 0.168562 0.252843
30 BH-G2 Silty sand 5.70 0.072667 0.149647 0.224471
31 BH-H1 Silty sand 2.95 0.069065 0.138130 0.207195
32 BH-H2 Silty sand 1.73 0.074795 0.149590 0.224385
33 BH-H3 Clayey sand 5.70 0.075448 0.150896 0.226344
34 BH-H4 Silty sand 11.70 0.070776 0.141552 0.212327
35 BH-I1 Clayey sand 2.70 0.072560 0.145120 0.217680
36 BH-I2 Silty sand 2.70 0.080427 0.160854 0.241281
37 BH-J1 Silty sand 0.73 0.068361 0.136723 0.205084
38 BH-J2 Silty sand 2.20 0.067086 0.134172 0.201258
39 BH-J3 Silty sand 7.20 0.074322 0.148645 0.222967
40 BH-K1 Silty sand 5.70 0.076045 0.152090 0.228135
41 BH-K2 Silty sand 2.70 0.072660 0.145320 0.217981
42 BH-L1 Silty sand 0.98 0.071940 0.143880 0.215820
43 BH-M1 Clayey sand 1.95 0.070137 0.140273 0.210410
44 BH-M2 Silty sand 0.73 0.068196 0.136392 0.204589
45 BH-N1 Silty sand 0.98 0.069647 0.139294 0.208941
46 BH-N2 Silty sand 0.98 0.069631 0.139262 0.208893
47 BH-N3 Silty sand 0.98 0.070668 0.141337 0.212005
48 BH-O1 Silty sand 4.20 0.079626 0.159251 0.238877
Calculation of cyclic resistance ratio (CRR)
Soil investigation data from 15 provinces was used to
calculate the CSR value from the Eq. (11) as shown in Table 4.
International Journal of Applied Engineering Research ISSN 0973-4562 Volume 12, Number 18 (2017) pp. 7490-7500 © Research India Publications. http://www.ripublication.com
7495
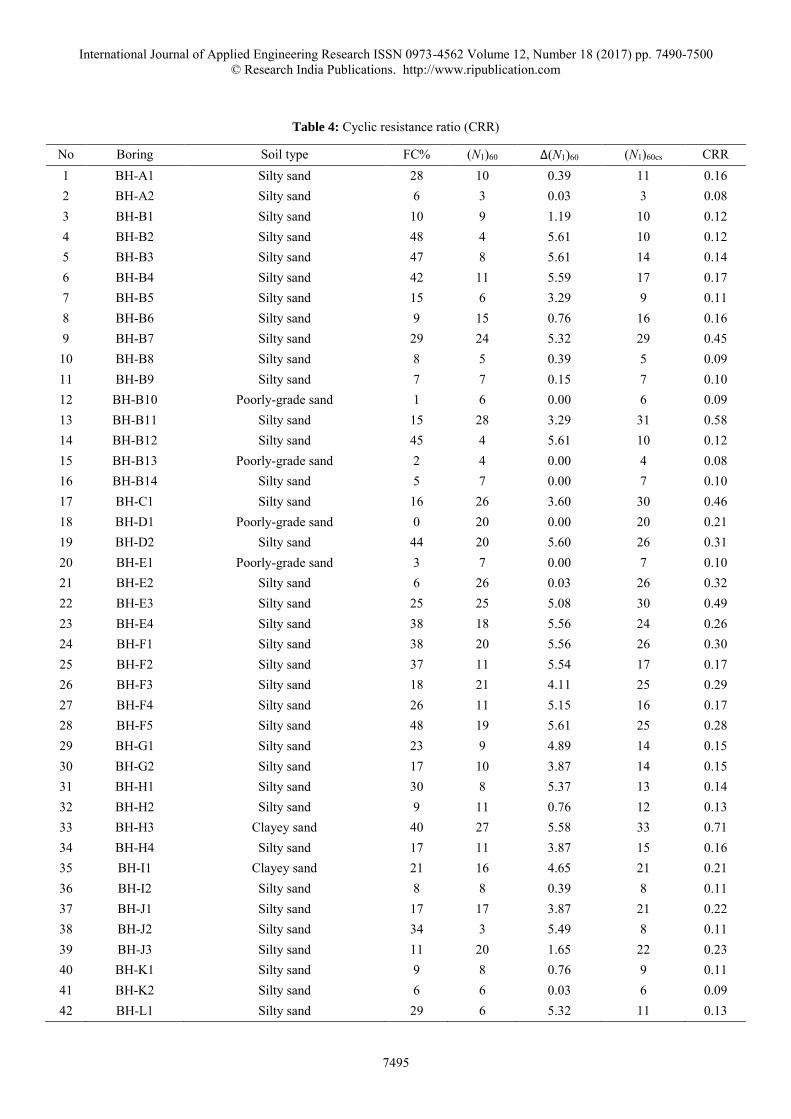
Table 4: Cyclic resistance ratio (CRR)
No Boring Soil type FC% (N1)60 ∆(N1)60 (N1)60cs CRR 1 BH-A1 Silty sand 28 10 0.39 11 0.16 2 BH-A2 Silty sand 6 3 0.03 3 0.08 3 BH-B1 Silty sand 10 9 1.19 10 0.12 4 BH-B2 Silty sand 48 4 5.61 10 0.12 5 BH-B3 Silty sand 47 8 5.61 14 0.14 6 BH-B4 Silty sand 42 11 5.59 17 0.17 7 BH-B5 Silty sand 15 6 3.29 9 0.11 8 BH-B6 Silty sand 9 15 0.76 16 0.16 9 BH-B7 Silty sand 29 24 5.32 29 0.45 10 BH-B8 Silty sand 8 5 0.39 5 0.09 11 BH-B9 Silty sand 7 7 0.15 7 0.10 12 BH-B10 Poorly-grade sand 1 6 0.00 6 0.09 13 BH-B11 Silty sand 15 28 3.29 31 0.58 14 BH-B12 Silty sand 45 4 5.61 10 0.12 15 BH-B13 Poorly-grade sand 2 4 0.00 4 0.08 16 BH-B14 Silty sand 5 7 0.00 7 0.10 17 BH-C1 Silty sand 16 26 3.60 30 0.46 18 BH-D1 Poorly-grade sand 0 20 0.00 20 0.21 19 BH-D2 Silty sand 44 20 5.60 26 0.31 20 BH-E1 Poorly-grade sand 3 7 0.00 7 0.10 21 BH-E2 Silty sand 6 26 0.03 26 0.32 22 BH-E3 Silty sand 25 25 5.08 30 0.49 23 BH-E4 Silty sand 38 18 5.56 24 0.26 24 BH-F1 Silty sand 38 20 5.56 26 0.30 25 BH-F2 Silty sand 37 11 5.54 17 0.17 26 BH-F3 Silty sand 18 21 4.11 25 0.29 27 BH-F4 Silty sand 26 11 5.15 16 0.17 28 BH-F5 Silty sand 48 19 5.61 25 0.28 29 BH-G1 Silty sand 23 9 4.89 14 0.15 30 BH-G2 Silty sand 17 10 3.87 14 0.15 31 BH-H1 Silty sand 30 8 5.37 13 0.14 32 BH-H2 Silty sand 9 11 0.76 12 0.13 33 BH-H3 Clayey sand 40 27 5.58 33 0.71 34 BH-H4 Silty sand 17 11 3.87 15 0.16 35 BH-I1 Clayey sand 21 16 4.65 21 0.21 36 BH-I2 Silty sand 8 8 0.39 8 0.11 37 BH-J1 Silty sand 17 17 3.87 21 0.22 38 BH-J2 Silty sand 34 3 5.49 8 0.11 39 BH-J3 Silty sand 11 20 1.65 22 0.23 40 BH-K1 Silty sand 9 8 0.76 9 0.11 41 BH-K2 Silty sand 6 6 0.03 6 0.09 42 BH-L1 Silty sand 29 6 5.32 11 0.13
International Journal of Applied Engineering Research ISSN 0973-4562 Volume 12, Number 18 (2017) pp. 7490-7500 © Research India Publications. http://www.ripublication.com
7496
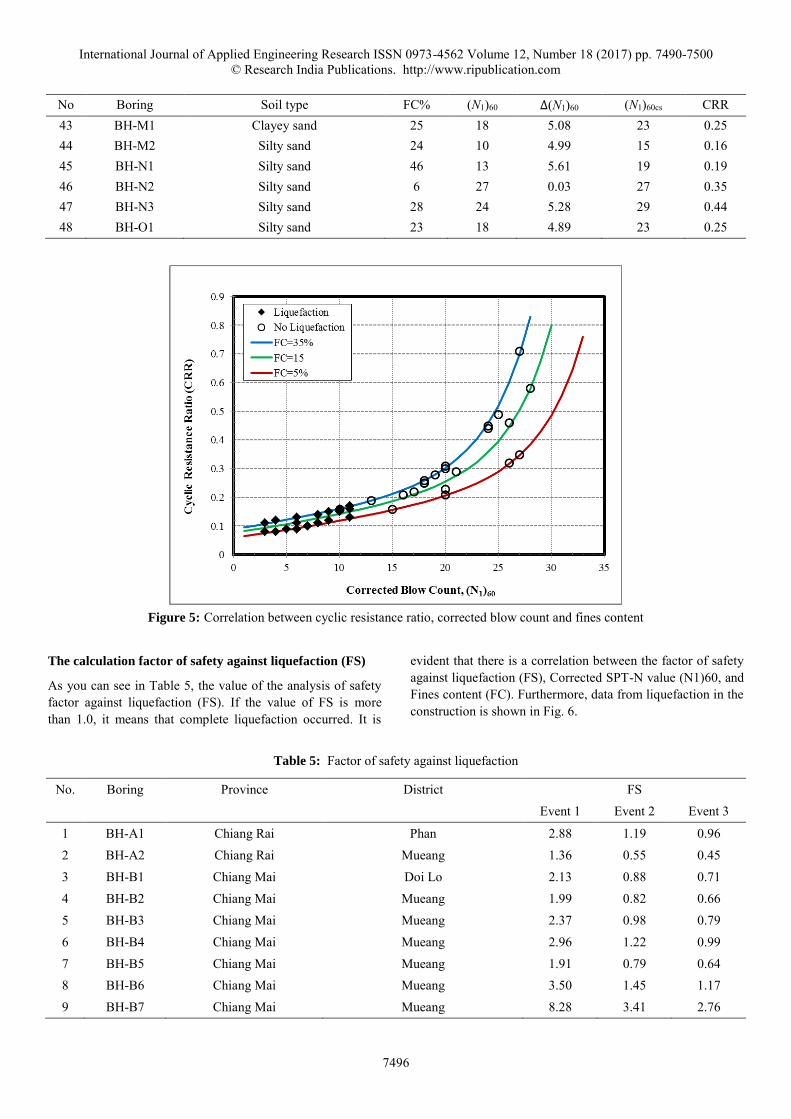
No Boring Soil type FC% (N1)60 ∆(N1)60 (N1)60cs CRR 43 BH-M1 Clayey sand 25 18 5.08 23 0.25 44 BH-M2 Silty sand 24 10 4.99 15 0.16 45 BH-N1 Silty sand 46 13 5.61 19 0.19 46 BH-N2 Silty sand 6 27 0.03 27 0.35 47 BH-N3 Silty sand 28 24 5.28 29 0.44 48 BH-O1 Silty sand 23 18 4.89 23 0.25
Figure 5: Correlation between cyclic resistance ratio, corrected blow count and fines content
The calculation factor of safety against liquefaction (FS)
As you can see in Table 5, the value of the analysis of safety factor against liquefaction (FS). If the value of FS is more than 1.0, it means that complete liquefaction occurred. It is
evident that there is a correlation between the factor of safety against liquefaction (FS), Corrected SPT-N value (N1)60, and Fines content (FC). Furthermore, data from liquefaction in the construction is shown in Fig. 6.
Table 5: Factor of safety against liquefaction
No. Boring Province District FS Event 1 Event 2 Event 3
1 BH-A1 Chiang Rai Phan 2.88 1.19 0.96 2 BH-A2 Chiang Rai Mueang 1.36 0.55 0.45 3 BH-B1 Chiang Mai Doi Lo 2.13 0.88 0.71 4 BH-B2 Chiang Mai Mueang 1.99 0.82 0.66 5 BH-B3 Chiang Mai Mueang 2.37 0.98 0.79 6 BH-B4 Chiang Mai Mueang 2.96 1.22 0.99 7 BH-B5 Chiang Mai Mueang 1.91 0.79 0.64 8 BH-B6 Chiang Mai Mueang 3.50 1.45 1.17 9 BH-B7 Chiang Mai Mueang 8.28 3.41 2.76
International Journal of Applied Engineering Research ISSN 0973-4562 Volume 12, Number 18 (2017) pp. 7490-7500 © Research India Publications. http://www.ripublication.com
7497
No. Boring Province District FS Event 1 Event 2 Event 3
10 BH-B8 Chiang Mai Mae Taeng 1.81 0.75 0.60 11 BH-B9 Chiang Mai Mae Taeng 1.88 0.76 0.63 12 BH-B10 Chiang Mai Mae Taeng 1.71 0.71 0.57 13 BH-B11 Chiang Mai San Kamphaeng 12.13 5.00 4.04 14 BH-B12 Chiang Mai Omkoi 2.04 0.84 0.68 15 BH-B13 Chiang Mai Omkoi 1.40 0.57 0.47 16 BH-B14 Chiang Mai Chom Thong 1.80 0.75 0.60 17 BH-C1 Mae Hong Son Mae Sariang 9.03 3.72 3.01 18 BH-D1 Lamphun Wiang Nong Long 4.40 1.82 1.47 19 BH-D2 Lamphun Wiang Nong Long 6.42 2.67 2.14 20 BH-E1 Lampang Ko Kha 1.86 0.77 0.62 21 BH-E2 Lampang Hang Chat 8.07 3.35 2.69 22 BH-E3 Lampang Hang Chat 12.22 5.08 4.07 23 BH-E4 Lampang Hang Chat 5.21 2.16 1.74 24 BH-F1 Tak Mae Sot 6.46 2.68 2.15 25 BH-F2 Tak Mae Sot 2.83 1.17 0.94 26 BH-F3 Tak Sam Ngao 5.26 2.13 1.75 27 BH-F4 Tak Sam Ngao 2.84 1.14 0.95 28 BH-F5 Tak Sam Ngao 4.97 2.03 1.66 29 BH-G1 Nakhon Sawan Banphot Phisai 2.45 1.01 0.82 30 BH-G2 Nakhon Sawan Mueang 2.62 1.06 0.87 31 BH-H1 Kamphaeng Phet Khanu Woralaksaburi 2.77 1.14 0.92 32 BH-H2 Kamphaeng Phet Khlong Khlung 2.35 0.97 0.78 33 BH-H3 Kamphaeng Phet Khlong Khlung 12.74 5.17 4.25 34 BH-H4 Kamphaeng Phet Khlong Khlung 2.89 1.12 0.96 35 BH-I1 Phitsanulok Bang Krathum 4.01 1.65 1.34 36 BH-I2 Phitsanulok Mueang 1.77 0.73 0.59 37 BH-J1 Uthai Thani Ban Rai 4.79 1.99 1.60 38 BH-J2 Uthai Thani Ban Rai 2.15 0.89 0.72 39 BH-J3 Uthai Thani Mueang 4.00 1.61 1.33 40 BH-K1 Nan Wiang Sa 1.87 0.76 0.62 41 BH-K2 Nan Wiang Sa 1.68 0.69 0.56 42 BH-L1 Phichit Mueang 2.44 1.01 0.81 43 BH-M1 Phetchabun Chon Daen 5.16 2.13 1.72 44 BH-M2 Phetchabun Mueang 3.31 1.37 1.10 45 BH-N1 Sukhothai Mueang 3.90 1.62 1.30 46 BH-N2 Sukhothai Si Samrong 7.80 3.24 2.60 47 BH-N3 Sukhothai Sawankhalok 9.57 3.97 3.19 48 BH-O1 Phrae Mueang 4.20 1.72 1.40
International Journal of Applied Engineering Research ISSN 0973-4562 Volume 12, Number 18 (2017) pp. 7490-7500 © Research India Publications. http://www.ripublication.com
7498
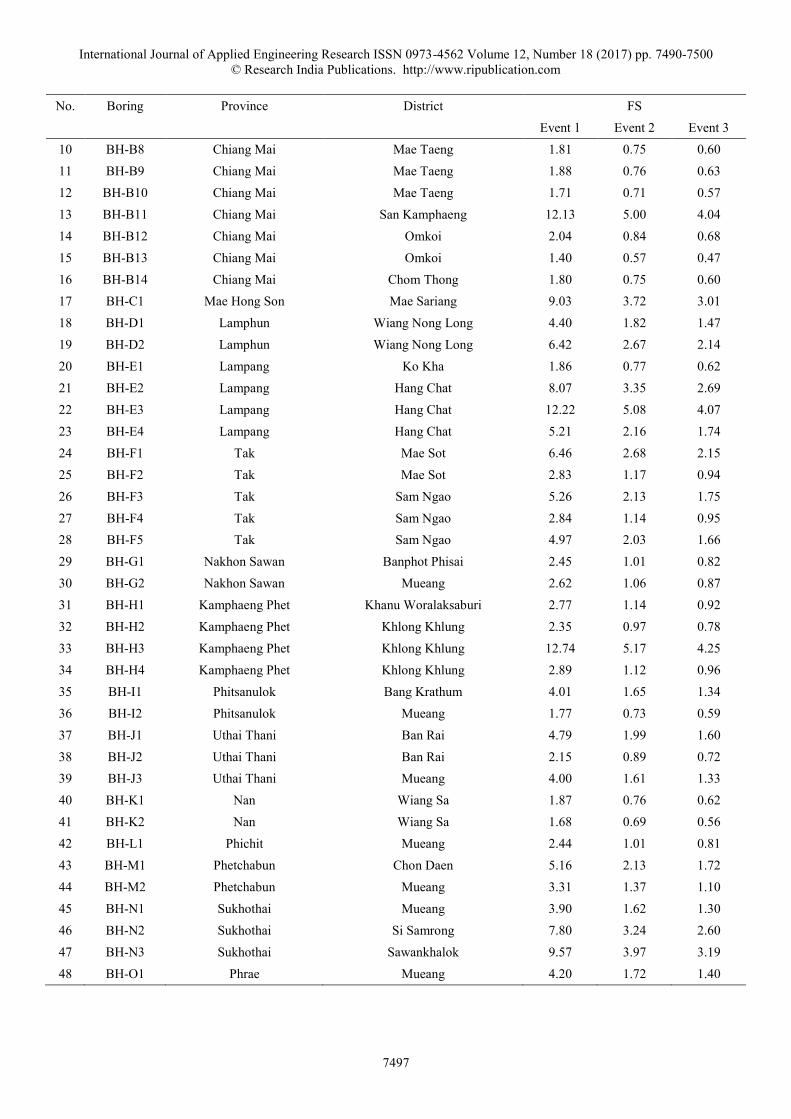
(a) Event 1 (PHA = 0.1 g)
(b) Event 2 (PHA = 0.2 g)
International Journal of Applied Engineering Research ISSN 0973-4562 Volume 12, Number 18 (2017) pp. 7490-7500 © Research India Publications. http://www.ripublication.com
7499
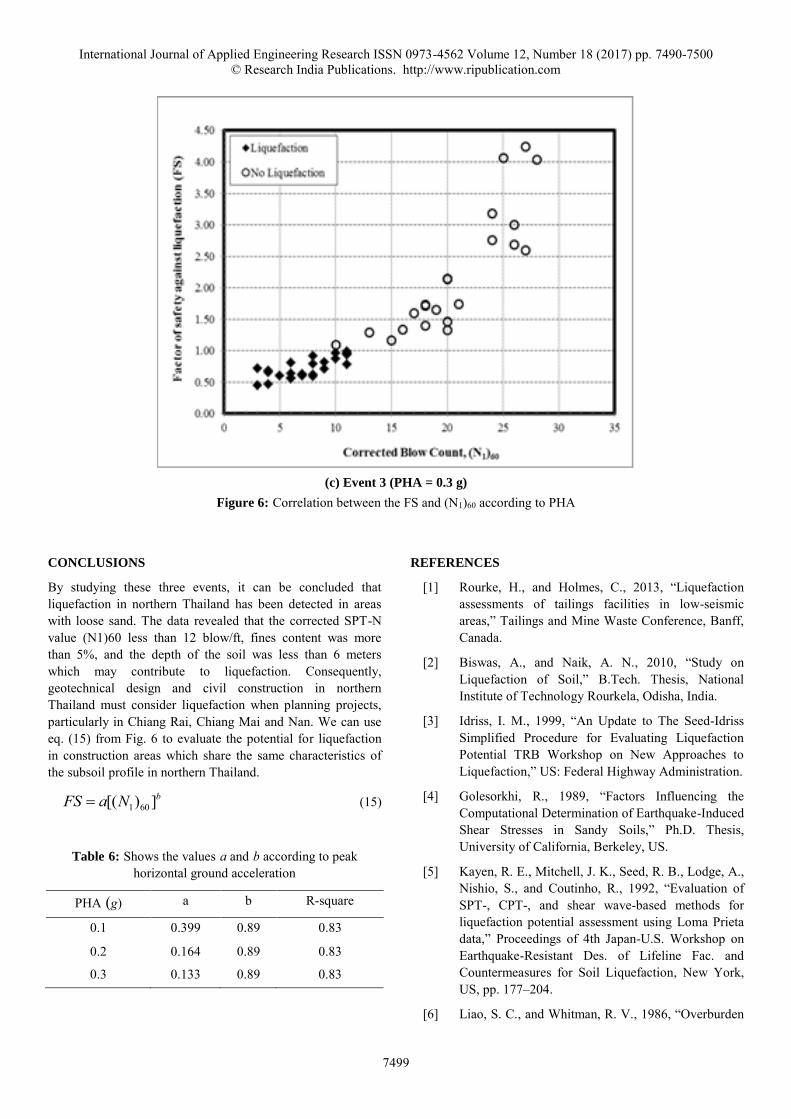
(c) Event 3 (PHA = 0.3 g)
Figure 6: Correlation between the FS and (N1)60 according to PHA
CONCLUSIONS
By studying these three events, it can be concluded that liquefaction in northern Thailand has been detected in areas with loose sand. The data revealed that the corrected SPT-N value (N1)60 less than 12 blow/ft, fines content was more than 5%, and the depth of the soil was less than 6 meters which may contribute to liquefaction. Consequently, geotechnical design and civil construction in northern Thailand must consider liquefaction when planning projects, particularly in Chiang Rai, Chiang Mai and Nan. We can use eq. (15) from Fig. 6 to evaluate the potential for liquefaction in construction areas which share the same characteristics of the subsoil profile in northern Thailand.
1 60[( ) ]bFS a N (15)
Table 6: Shows the values a and b according to peak horizontal ground acceleration
PHA (g) a b R-square
0.1 0.399 0.89 0.83
0.2 0.164 0.89 0.83
0.3 0.133 0.89 0.83
REFERENCES
[1] Rourke, H., and Holmes, C., 2013, “Liquefaction assessments of tailings facilities in low-seismic areas,” Tailings and Mine Waste Conference, Banff, Canada.
[2] Biswas, A., and Naik, A. N., 2010, “Study on Liquefaction of Soil,” B.Tech. Thesis, National Institute of Technology Rourkela, Odisha, India.
[3] Idriss, I. M., 1999, “An Update to The Seed-Idriss Simplified Procedure for Evaluating Liquefaction Potential TRB Workshop on New Approaches to Liquefaction,” US: Federal Highway Administration.
[4] Golesorkhi, R., 1989, “Factors Influencing the Computational Determination of Earthquake-Induced Shear Stresses in Sandy Soils,” Ph.D. Thesis, University of California, Berkeley, US.
[5] Kayen, R. E., Mitchell, J. K., Seed, R. B., Lodge, A., Nishio, S., and Coutinho, R., 1992, “Evaluation of SPT-, CPT-, and shear wave-based methods for liquefaction potential assessment using Loma Prieta data,” Proceedings of 4th Japan-U.S. Workshop on Earthquake-Resistant Des. of Lifeline Fac. and Countermeasures for Soil Liquefaction, New York, US, pp. 177–204.
[6] Liao, S. C., and Whitman, R. V., 1986, “Overburden
International Journal of Applied Engineering Research ISSN 0973-4562 Volume 12, Number 18 (2017) pp. 7490-7500 © Research India Publications. http://www.ripublication.com
7500
correction factors for SPT in sand,” Journal of Geotechnical Engineering, Vol. 112(3), pp. 373–377.
[7] U.S. Geological Survey, 2014, “Earthquake Map,” Retrieved February 25, 2014, from http://www.usgs.gov.
[8] Geotechnical Engineering Research and Development Center, 2014, “News-Information,” Retrieved May 10, 2014, from http://www.gerd.eng.ku.ac.th.
[9] Seed, H. B., and Idriss, I. M., 1971, “Simplified procedure for evaluating soil liquefaction potential,” Journal of the Soil Mechanics and Foundations Division ASCE, Vol. 97(SM9), pp. 1249-1273.
[10] Idriss, I. M., and Boulanger, R. W., 2006, “Semi-empirical procedures for evaluating liquefaction potential during earthquakes,” Soil Dynamics and Earthquake Engineering, Vol. 26, pp. 115–130.