Embed Size (px)
Citation preview
Soil testing for powdery scab – five years’ experience in minimising risk Stuart Wale
2 2
Overview of talk
• Overview of testing procedure
• Typical test results
• Test results from last 5 years of commercial testing
• What growers do with the information
• Some questions
– Why do we record so many 0 values when powdery scab
is a major problem in Scotland?
– Is there a simple relationship between inoculum and
disease?
– Can we reduce the cost of the test?
3 3
PCR developed and validated in two Potato Council projects
3
4 4
Sampling for soil-borne potato disease diagnostics
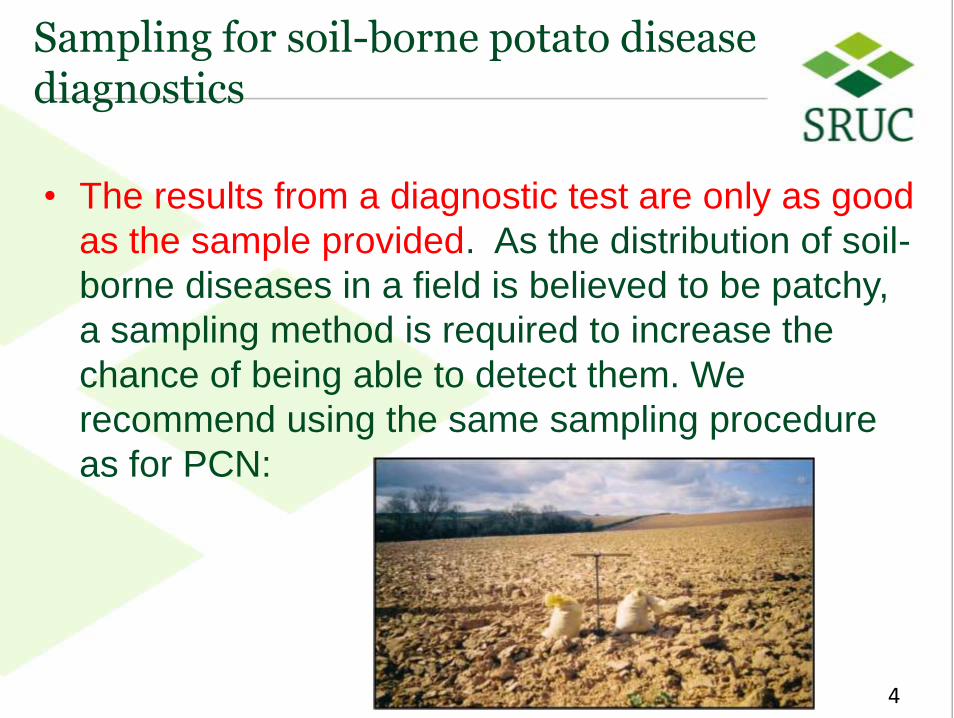
• The results from a diagnostic test are only as good
as the sample provided. As the distribution of soil-
borne diseases in a field is believed to be patchy,
a sampling method is required to increase the
chance of being able to detect them. We
recommend using the same sampling procedure
as for PCN:
4
5 5
Sampling for soil-borne potato disease diagnostics
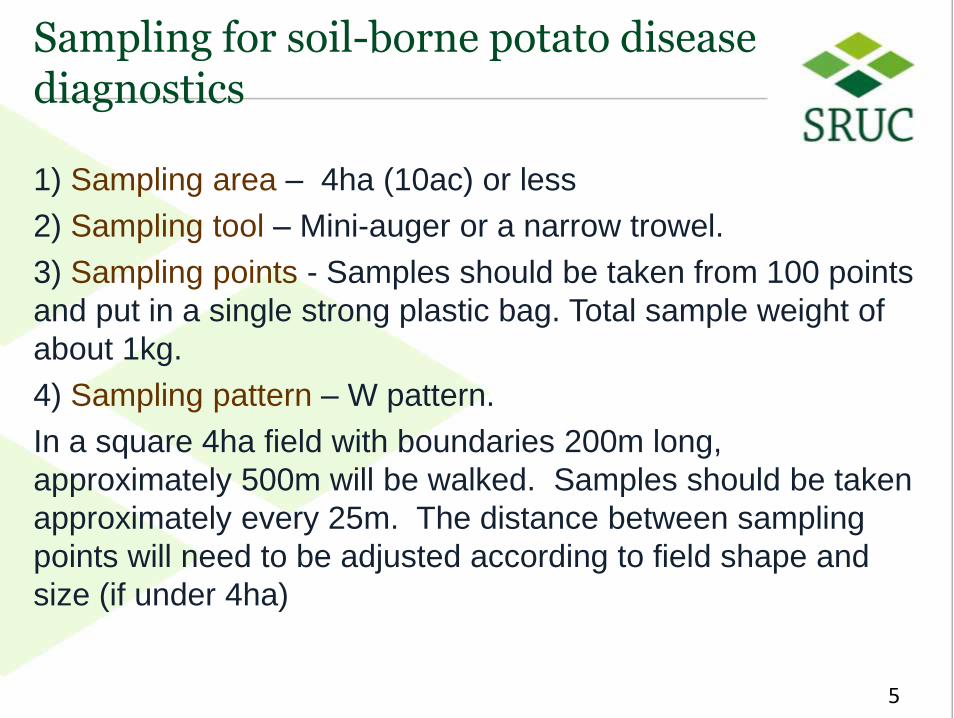
1) Sampling area – 4ha (10ac) or less
2) Sampling tool – Mini-auger or a narrow trowel.
3) Sampling points - Samples should be taken from 100 points
and put in a single strong plastic bag. Total sample weight of
about 1kg.
4) Sampling pattern – W pattern.
In a square 4ha field with boundaries 200m long,
approximately 500m will be walked. Samples should be taken
approximately every 25m. The distance between sampling
points will need to be adjusted according to field shape and
size (if under 4ha)
5
6 6
Laboratory Methodology
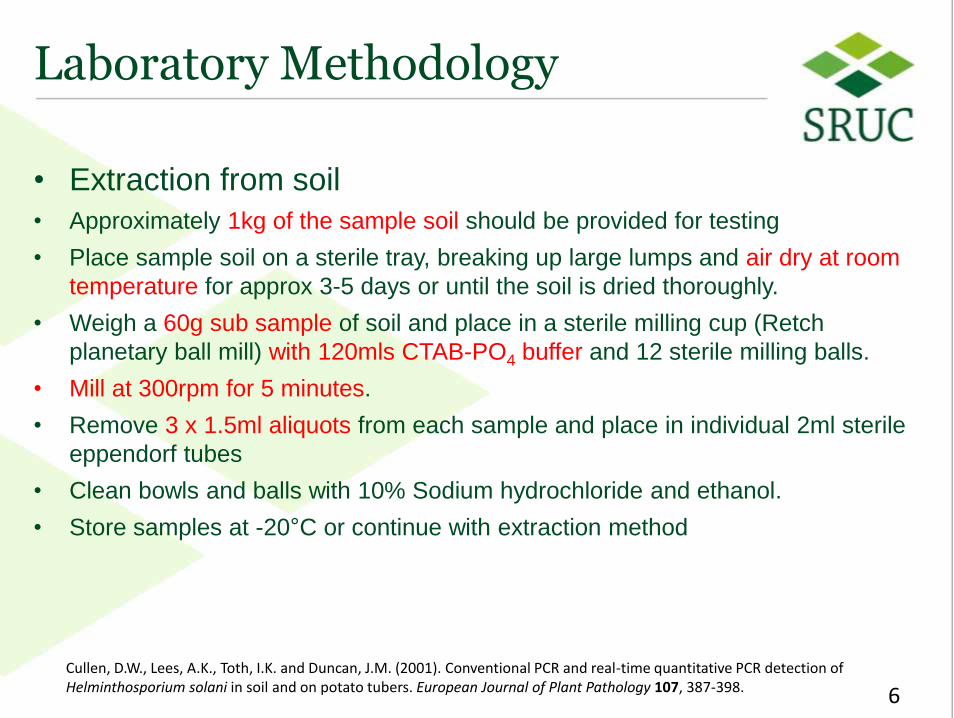
• Extraction from soil
• Approximately 1kg of the sample soil should be provided for testing
• Place sample soil on a sterile tray, breaking up large lumps and air dry at room
temperature for approx 3-5 days or until the soil is dried thoroughly.
• Weigh a 60g sub sample of soil and place in a sterile milling cup (Retch
planetary ball mill) with 120mls CTAB-PO4 buffer and 12 sterile milling balls.
• Mill at 300rpm for 5 minutes.
• Remove 3 x 1.5ml aliquots from each sample and place in individual 2ml sterile
eppendorf tubes
• Clean bowls and balls with 10% Sodium hydrochloride and ethanol.
• Store samples at -20°C or continue with extraction method
6
Cullen, D.W., Lees, A.K., Toth, I.K. and Duncan, J.M. (2001). Conventional PCR and real-time quantitative PCR detection of Helminthosporium solani in soil and on potato tubers. European Journal of Plant Pathology 107, 387-398.
7 7
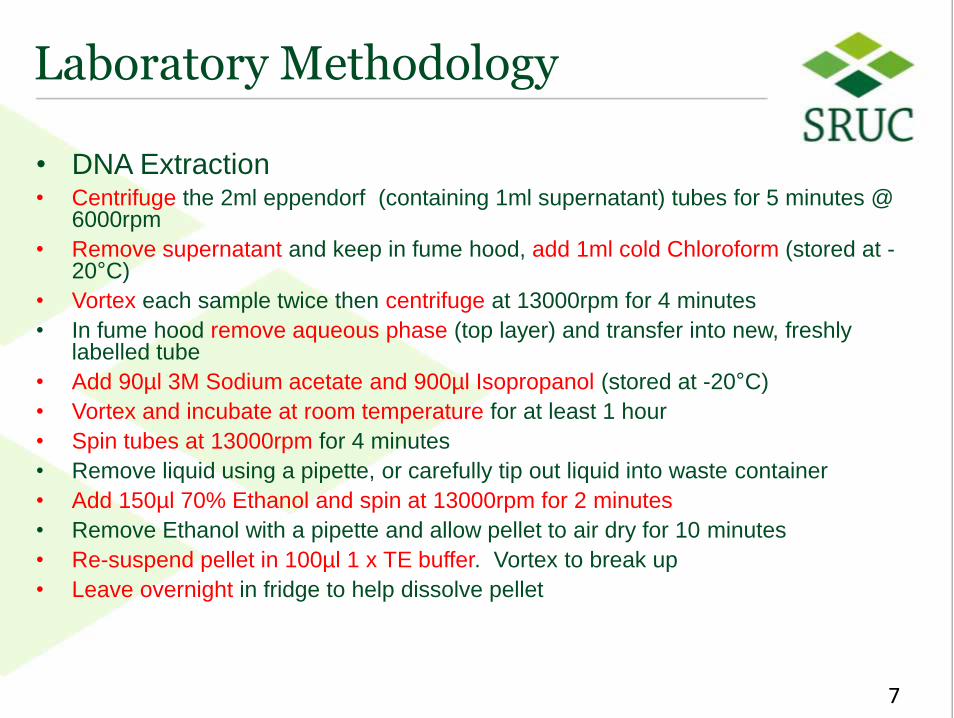
Laboratory Methodology
• DNA Extraction • Centrifuge the 2ml eppendorf (containing 1ml supernatant) tubes for 5 minutes @
6000rpm
• Remove supernatant and keep in fume hood, add 1ml cold Chloroform (stored at -20°C)
• Vortex each sample twice then centrifuge at 13000rpm for 4 minutes
• In fume hood remove aqueous phase (top layer) and transfer into new, freshly labelled tube
• Add 90µl 3M Sodium acetate and 900µl Isopropanol (stored at -20°C)
• Vortex and incubate at room temperature for at least 1 hour
• Spin tubes at 13000rpm for 4 minutes
• Remove liquid using a pipette, or carefully tip out liquid into waste container
• Add 150µl 70% Ethanol and spin at 13000rpm for 2 minutes
• Remove Ethanol with a pipette and allow pellet to air dry for 10 minutes
• Re-suspend pellet in 100µl 1 x TE buffer. Vortex to break up
• Leave overnight in fridge to help dissolve pellet
7
8 8
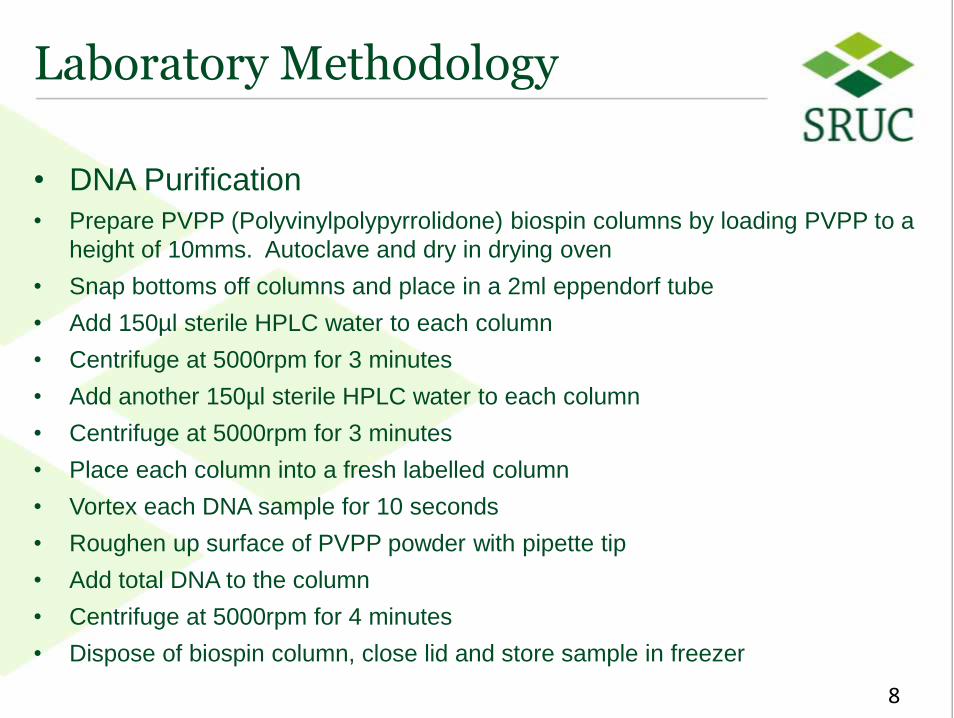
Laboratory Methodology
• DNA Purification
• Prepare PVPP (Polyvinylpolypyrrolidone) biospin columns by loading PVPP to a
height of 10mms. Autoclave and dry in drying oven
• Snap bottoms off columns and place in a 2ml eppendorf tube
• Add 150µl sterile HPLC water to each column
• Centrifuge at 5000rpm for 3 minutes
• Add another 150µl sterile HPLC water to each column
• Centrifuge at 5000rpm for 3 minutes
• Place each column into a fresh labelled column
• Vortex each DNA sample for 10 seconds
• Roughen up surface of PVPP powder with pipette tip
• Add total DNA to the column
• Centrifuge at 5000rpm for 4 minutes
• Dispose of biospin column, close lid and store sample in freezer
8
9 9
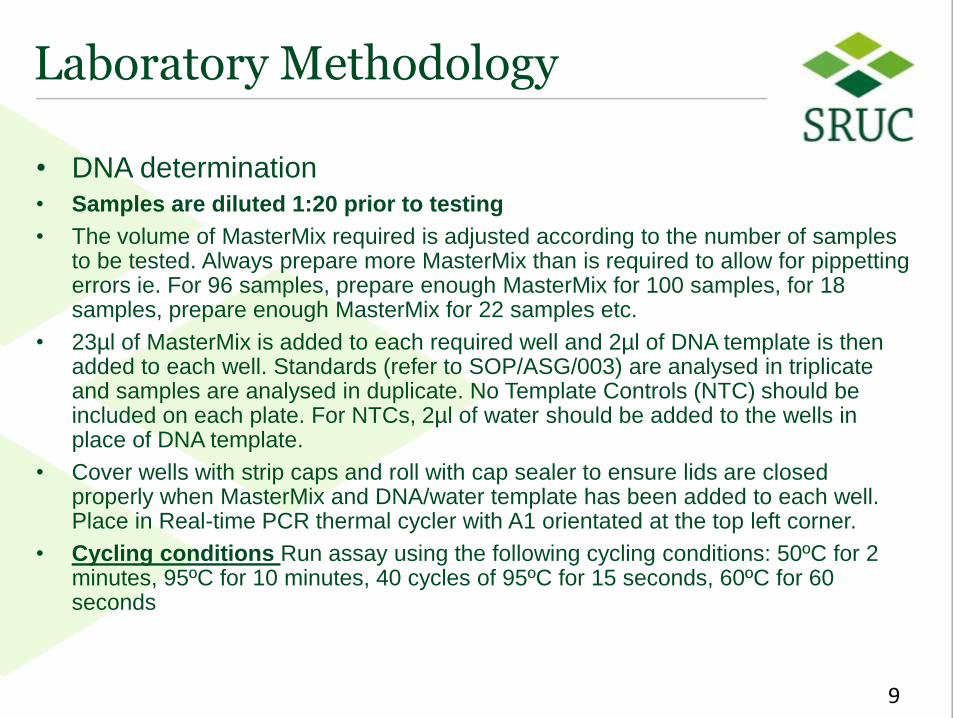
Laboratory Methodology
• DNA determination • Samples are diluted 1:20 prior to testing
• The volume of MasterMix required is adjusted according to the number of samples to be tested. Always prepare more MasterMix than is required to allow for pippetting errors ie. For 96 samples, prepare enough MasterMix for 100 samples, for 18 samples, prepare enough MasterMix for 22 samples etc.
• 23µl of MasterMix is added to each required well and 2µl of DNA template is then added to each well. Standards (refer to SOP/ASG/003) are analysed in triplicate and samples are analysed in duplicate. No Template Controls (NTC) should be included on each plate. For NTCs, 2µl of water should be added to the wells in place of DNA template.
• Cover wells with strip caps and roll with cap sealer to ensure lids are closed properly when MasterMix and DNA/water template has been added to each well. Place in Real-time PCR thermal cycler with A1 orientated at the top left corner.
• Cycling conditions Run assay using the following cycling conditions: 50ºC for 2 minutes, 95ºC for 10 minutes, 40 cycles of 95ºC for 15 seconds, 60ºC for 60 seconds
9
10 10
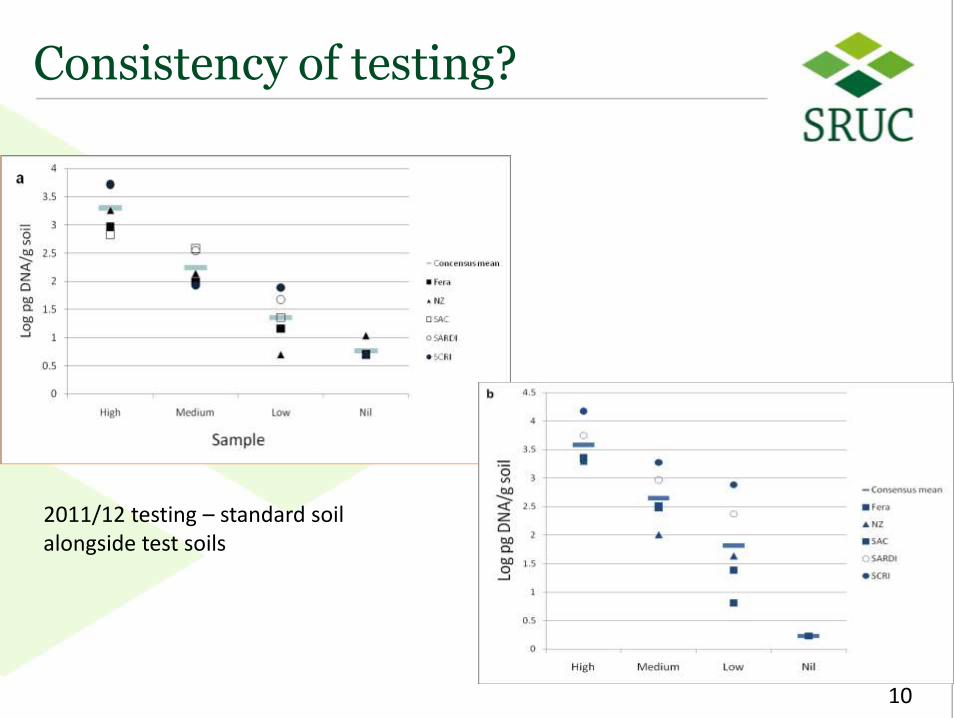
Consistency of testing?
10
2011/12 testing – standard soil alongside test soils
11 11
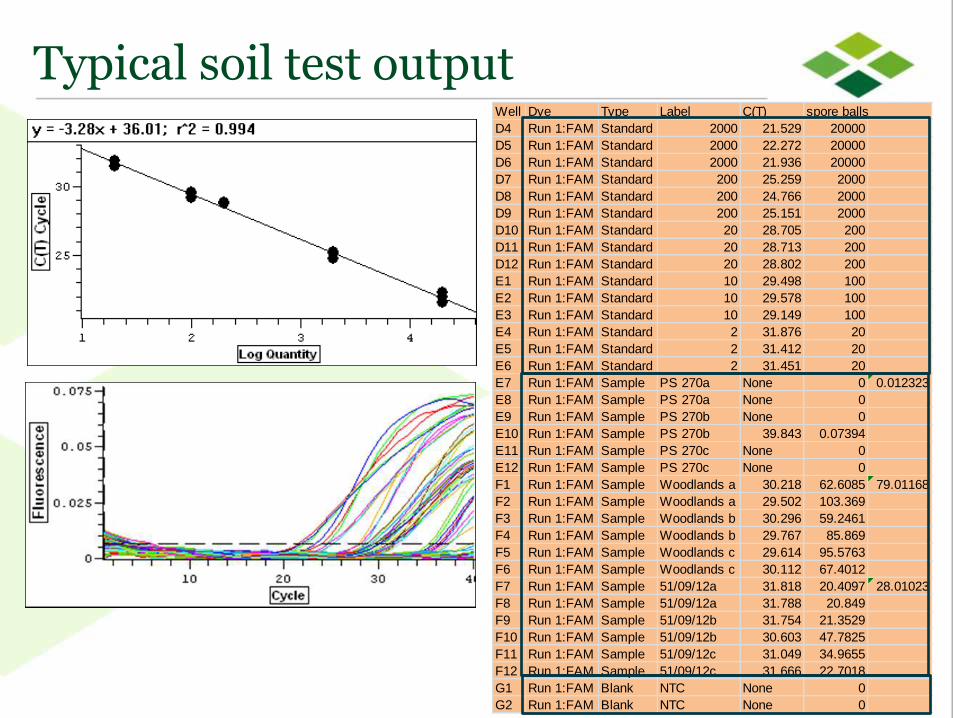
Typical soil test output Well Dye Type Label C(T) spore balls
D4 Run 1:FAM Standard 2000 21.529 20000
D5 Run 1:FAM Standard 2000 22.272 20000
D6 Run 1:FAM Standard 2000 21.936 20000
D7 Run 1:FAM Standard 200 25.259 2000
D8 Run 1:FAM Standard 200 24.766 2000
D9 Run 1:FAM Standard 200 25.151 2000
D10 Run 1:FAM Standard 20 28.705 200
D11 Run 1:FAM Standard 20 28.713 200
D12 Run 1:FAM Standard 20 28.802 200
E1 Run 1:FAM Standard 10 29.498 100
E2 Run 1:FAM Standard 10 29.578 100
E3 Run 1:FAM Standard 10 29.149 100
E4 Run 1:FAM Standard 2 31.876 20
E5 Run 1:FAM Standard 2 31.412 20
E6 Run 1:FAM Standard 2 31.451 20
E7 Run 1:FAM Sample PS 270a None 0 0.012323
E8 Run 1:FAM Sample PS 270a None 0
E9 Run 1:FAM Sample PS 270b None 0
E10 Run 1:FAM Sample PS 270b 39.843 0.07394
E11 Run 1:FAM Sample PS 270c None 0
E12 Run 1:FAM Sample PS 270c None 0
F1 Run 1:FAM Sample Woodlands a 30.218 62.6085 79.01168
F2 Run 1:FAM Sample Woodlands a 29.502 103.369
F3 Run 1:FAM Sample Woodlands b 30.296 59.2461
F4 Run 1:FAM Sample Woodlands b 29.767 85.869
F5 Run 1:FAM Sample Woodlands c 29.614 95.5763
F6 Run 1:FAM Sample Woodlands c 30.112 67.4012
F7 Run 1:FAM Sample 51/09/12a 31.818 20.4097 28.01023
F8 Run 1:FAM Sample 51/09/12a 31.788 20.849
F9 Run 1:FAM Sample 51/09/12b 31.754 21.3529
F10 Run 1:FAM Sample 51/09/12b 30.603 47.7825
F11 Run 1:FAM Sample 51/09/12c 31.049 34.9655
F12 Run 1:FAM Sample 51/09/12c 31.666 22.7018
G1 Run 1:FAM Blank NTC None 0
G2 Run 1:FAM Blank NTC None 0
12 12
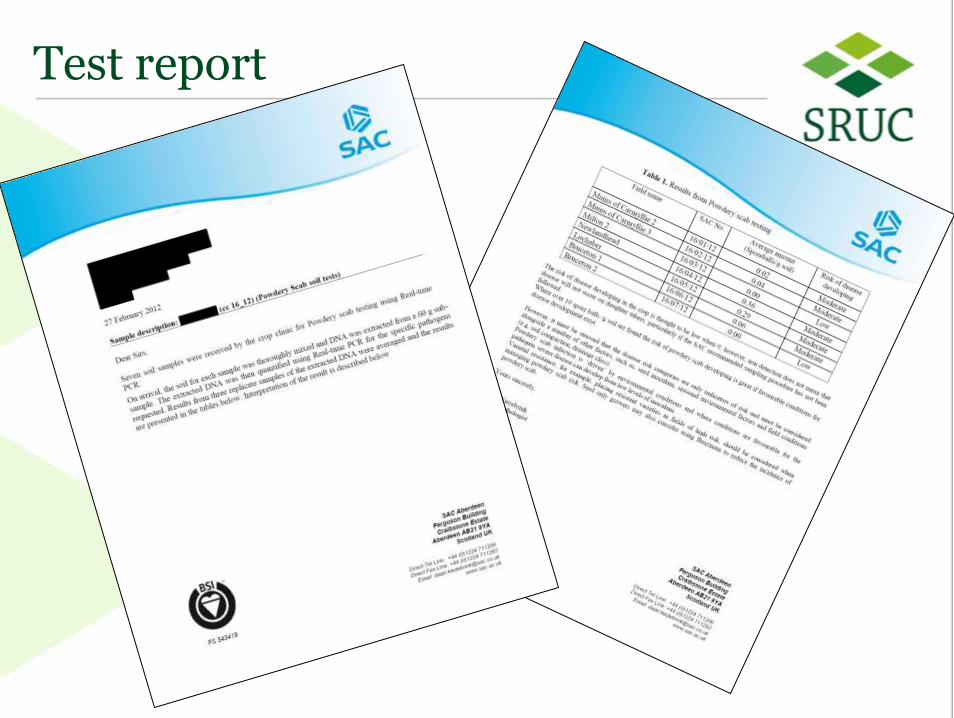
Test report
13 13
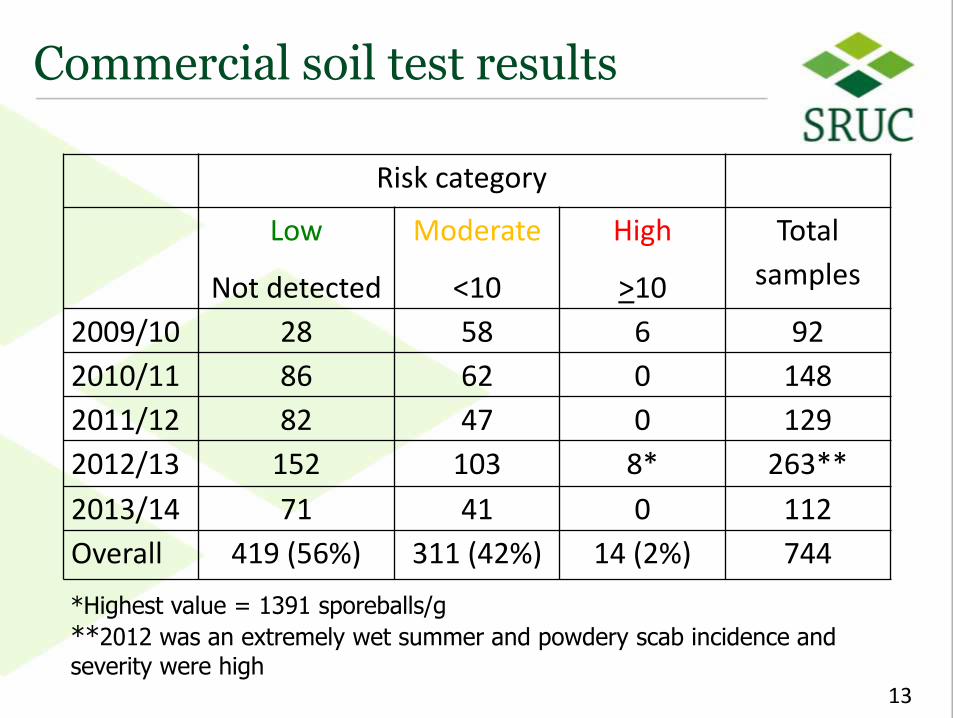
Commercial soil test results
Risk category
Low
Not detected
Moderate
<10
High
>10
Total
samples
2009/10 28 58 6 92
2010/11 86 62 0 148
2011/12 82 47 0 129
2012/13 152 103 8* 263**
2013/14 71 41 0 112
Overall 419 (56%) 311 (42%) 14 (2%) 744
13
*Highest value = 1391 sporeballs/g
**2012 was an extremely wet summer and powdery scab incidence and
severity were high
14 14
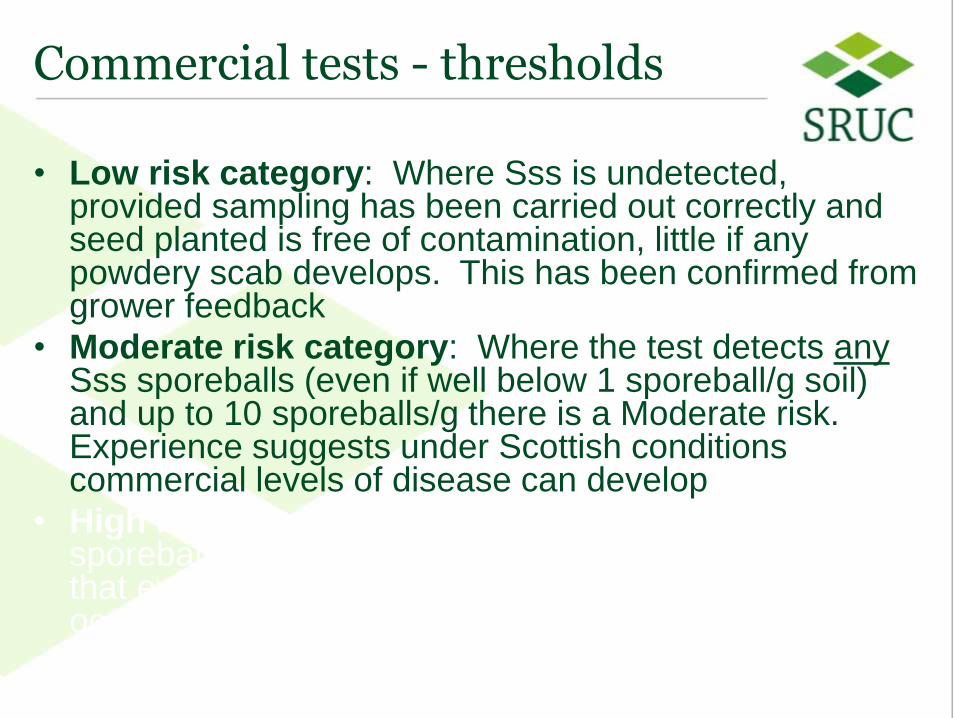
Commercial tests - thresholds
• Low risk category: Where Sss is undetected, provided sampling has been carried out correctly and seed planted is free of contamination, little if any powdery scab develops. This has been confirmed from grower feedback
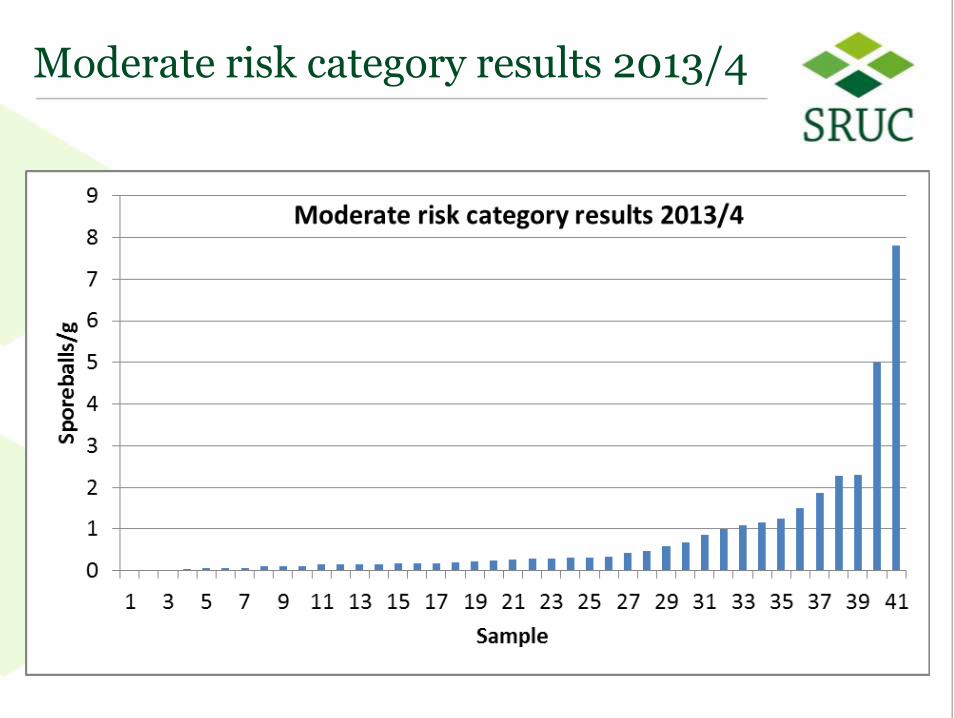
• Moderate risk category: Where the test detects any Sss sporeballs (even if well below 1 sporeball/g soil) and up to 10 sporeballs/g there is a Moderate risk. Experience suggests under Scottish conditions commercial levels of disease can develop
• High risk category: Where the test detects >10 sporeballs/g the risk is high and experience has shown that even if conditions are sub-optimal, disease will occur
15 15
Moderate risk category results 2013/4
16 16
Commercial tests - thresholds
• Low risk category: Where Sss is undetected, provided sampling has been carried out correctly and seed planted is free of contamination, little if any powdery scab develops. This has been confirmed from grower feedback
• Moderate risk category: Where the test detects any Sss sporeballs (even if well below 1 sporeball/g soil) and up to 10 sporeballs/g there is a Moderate risk. Experience suggests under Scottish conditions commercial levels of disease can develop
• High risk category: Where the test detects >10 sporeballs/g the risk is high and experience has shown that even if conditions are sub-optimal, disease will occur
17 17
How growers use the information
• Disease escape – fields with upper moderate to
high risk levels are avoided for growing potatoes
• Lower moderate fields – more resistant variety
grown (but only 25% of varieties have resistance
>5 on a 1=susceptible to 9=resistant scale)
Or
• Fluazinam soil treatment applied
• Low risk fields – susceptible varieties grown
provided seed is visually powdery scab free
18 18
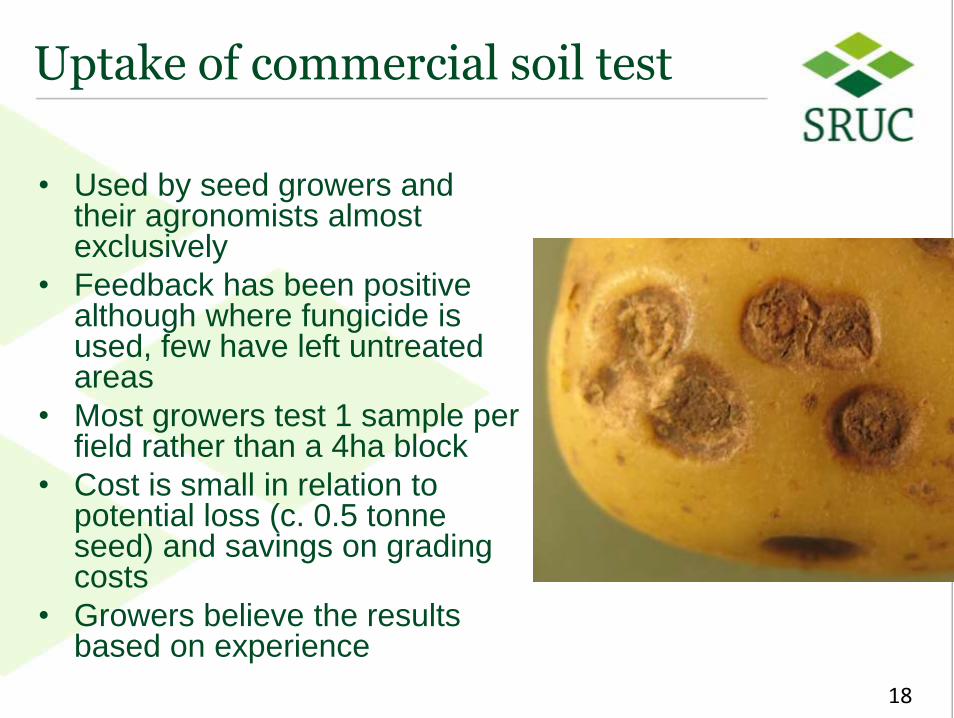
Uptake of commercial soil test
• Used by seed growers and their agronomists almost exclusively
• Feedback has been positive although where fungicide is used, few have left untreated areas
• Most growers test 1 sample per field rather than a 4ha block
• Cost is small in relation to potential loss (c. 0.5 tonne seed) and savings on grading costs
• Growers believe the results based on experience
18
19 19
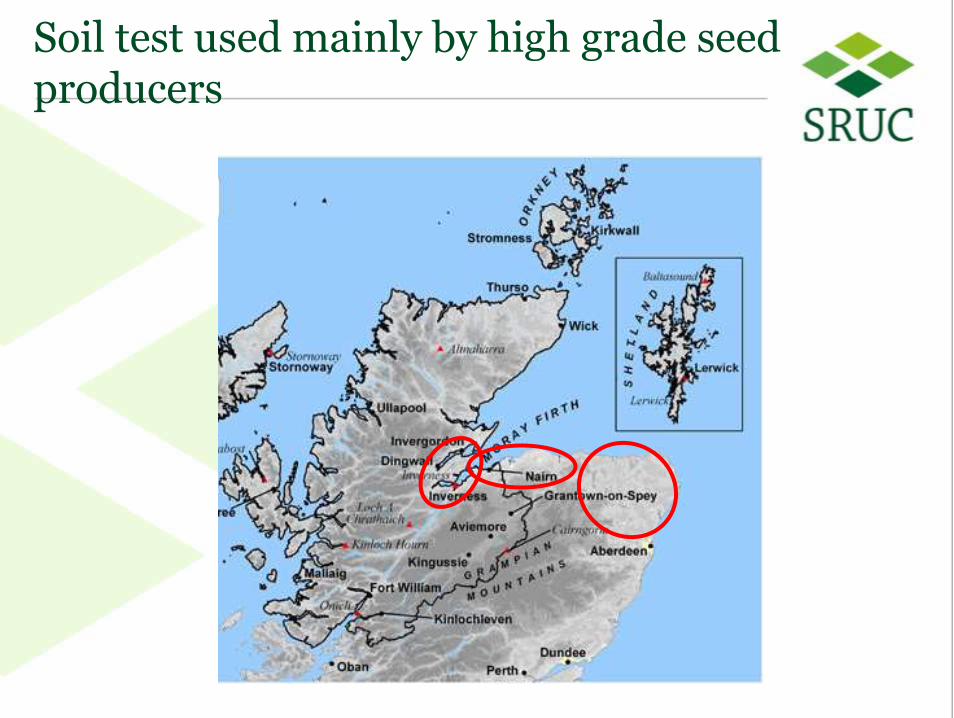
Soil test used mainly by high grade seed producers
20 20
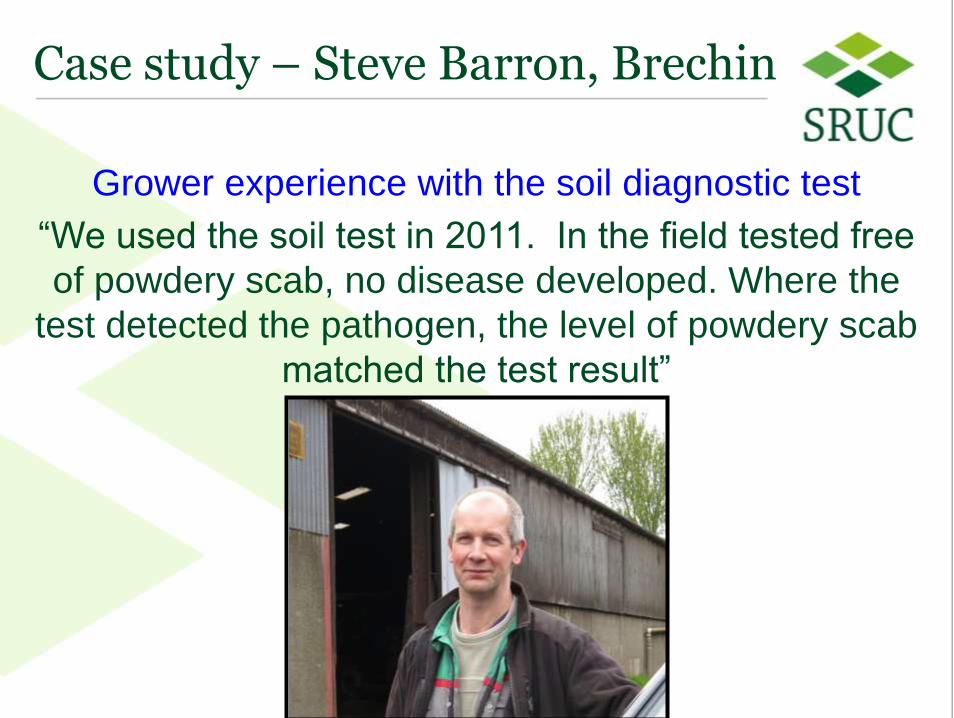
Case study – Steve Barron, Brechin
Grower experience with the soil diagnostic test
“We used the soil test in 2011. In the field tested free
of powdery scab, no disease developed. Where the
test detected the pathogen, the level of powdery scab
matched the test result”
21 21
Other factors to consider when assigning varieties to fields
• The history of powdery scab on a farm. – Survey work and experience suggests that occurrence of
powdery scab on a farm means that the risk of powdery scab developing is likely.
• Soil type. – The soil type must be suitable for the end market, for
example, it must be suitable to achieve an acceptable skin finish if pre-packing is the target market. Soil type may affect powdery scab development, disease may be more likely to occur on lighter soils (sands - sandy loams) than heavier soils (silts to clays)
• Drainage. – If soil drainage in a field is not 'good', the likelihood of free
water persisting in the soil matrix is higher and the risk of powdery scab greater.
22 22
Questions
• Why so many results with no detection of Sss?
23 23
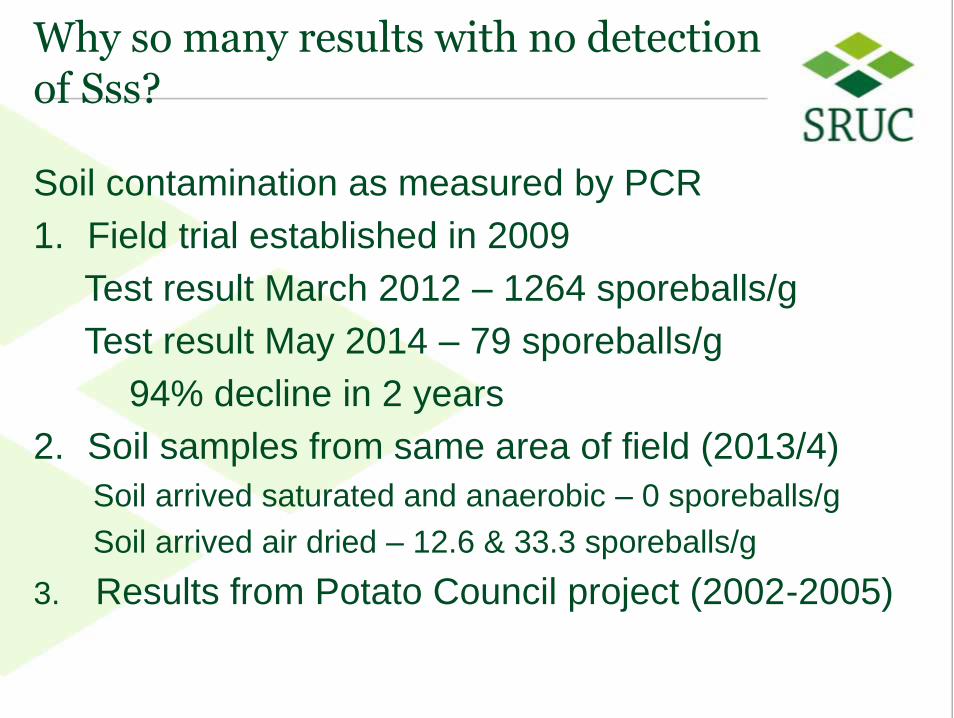
Why so many results with no detection of Sss?
Soil contamination as measured by PCR
1. Field trial established in 2009
Test result March 2012 – 1264 sporeballs/g
Test result May 2014 – 79 sporeballs/g
94% decline in 2 years
2. Soil samples from same area of field (2013/4)
Soil arrived saturated and anaerobic – 0 sporeballs/g
Soil arrived air dried – 12.6 & 33.3 sporeballs/g
3. Results from Potato Council project (2002-2005)
24 24
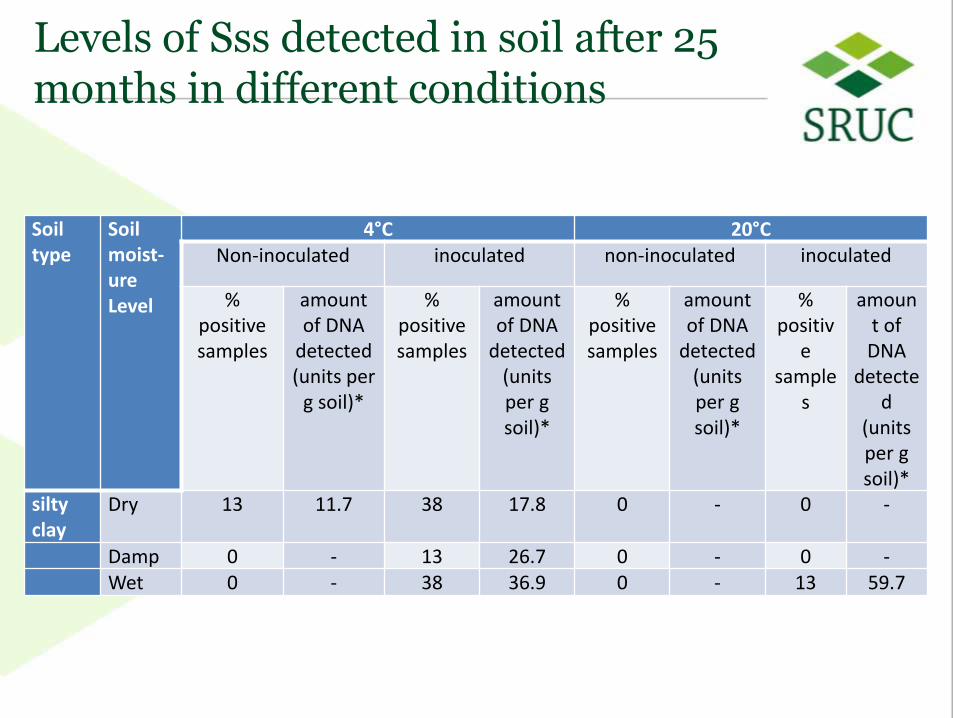
Levels of Sss detected in soil after 25 months in different conditions
Soil type
Soil moist-ure Level
4°C 20°C
Non-inoculated inoculated non-inoculated inoculated
% positive samples
amount of DNA
detected (units per
g soil)*
% positive samples
amount of DNA
detected (units per g soil)*
% positive samples
amount of DNA
detected (units per g soil)*
% positiv
e sample
s
amount of DNA
detected
(units per g soil)*
silty clay
Dry 13 11.7 38 17.8 0 - 0 -
Damp 0 - 13 26.7 0 - 0 - Wet 0 - 38 36.9 0 - 13 59.7
25 25
Hypothesis
• Survival of sporeballs exposed to long periods of
soil saturation – and thus anaerobiosis – is low
26 26
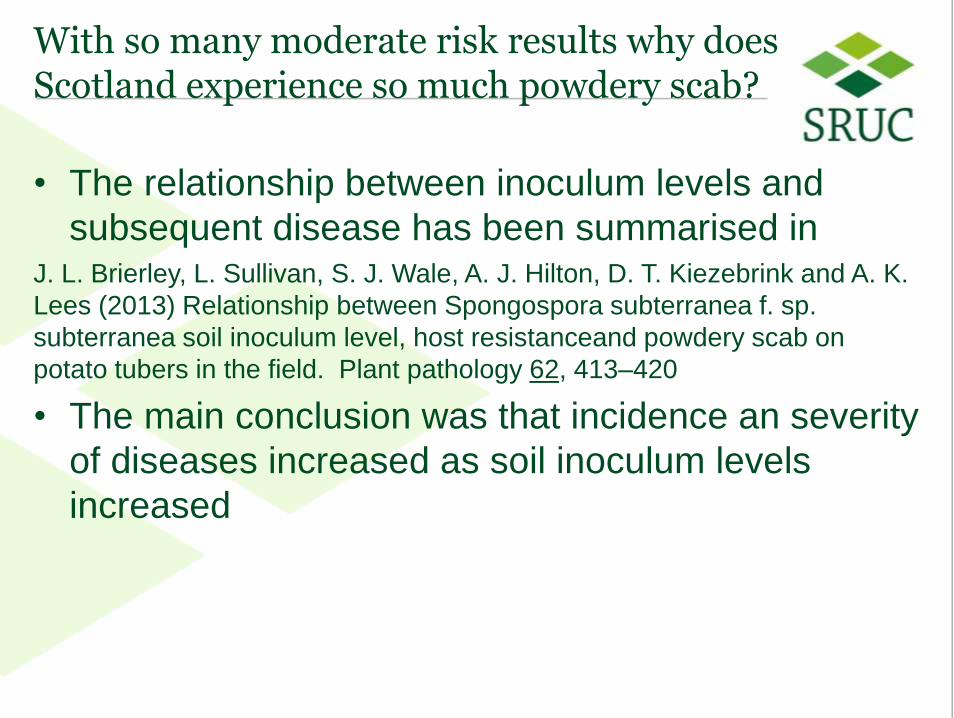
With so many moderate risk results why does Scotland experience so much powdery scab?
• The relationship between inoculum levels and
subsequent disease has been summarised in J. L. Brierley, L. Sullivan, S. J. Wale, A. J. Hilton, D. T. Kiezebrink and A. K.
Lees (2013) Relationship between Spongospora subterranea f. sp.
subterranea soil inoculum level, host resistanceand powdery scab on
potato tubers in the field. Plant pathology 62, 413–420
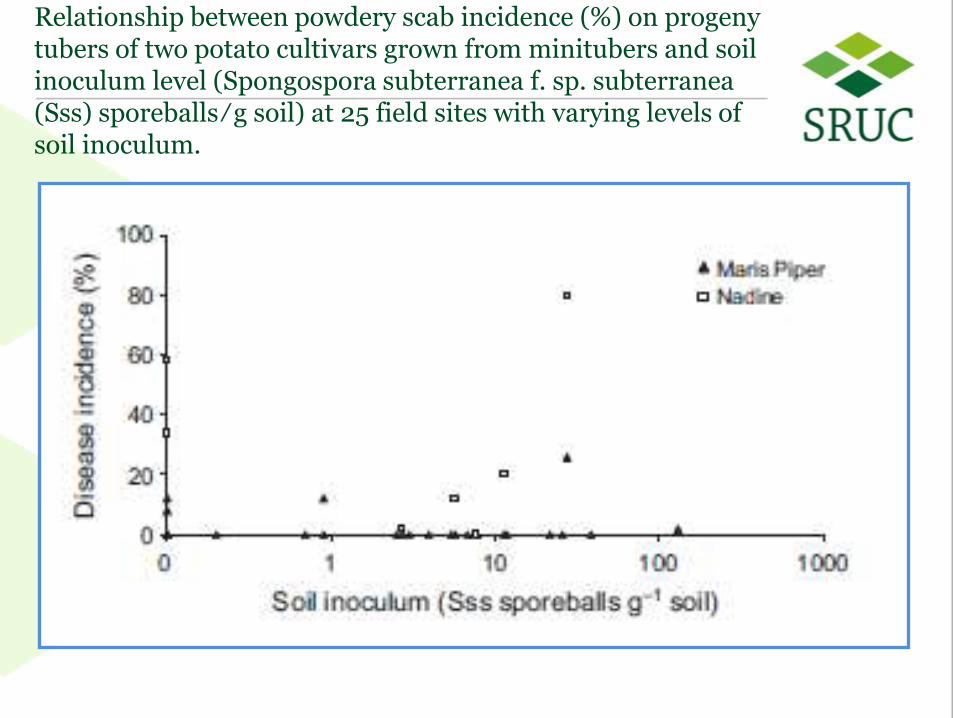
• The main conclusion was that incidence an severity
of diseases increased as soil inoculum levels
increased
27 27
Relationship between powdery scab incidence (%) on progeny tubers of two potato cultivars grown from minitubers and soil inoculum level (Spongospora subterranea f. sp. subterranea (Sss) sporeballs ⁄ g soil) at 25 field sites with varying levels of soil inoculum.
28 28
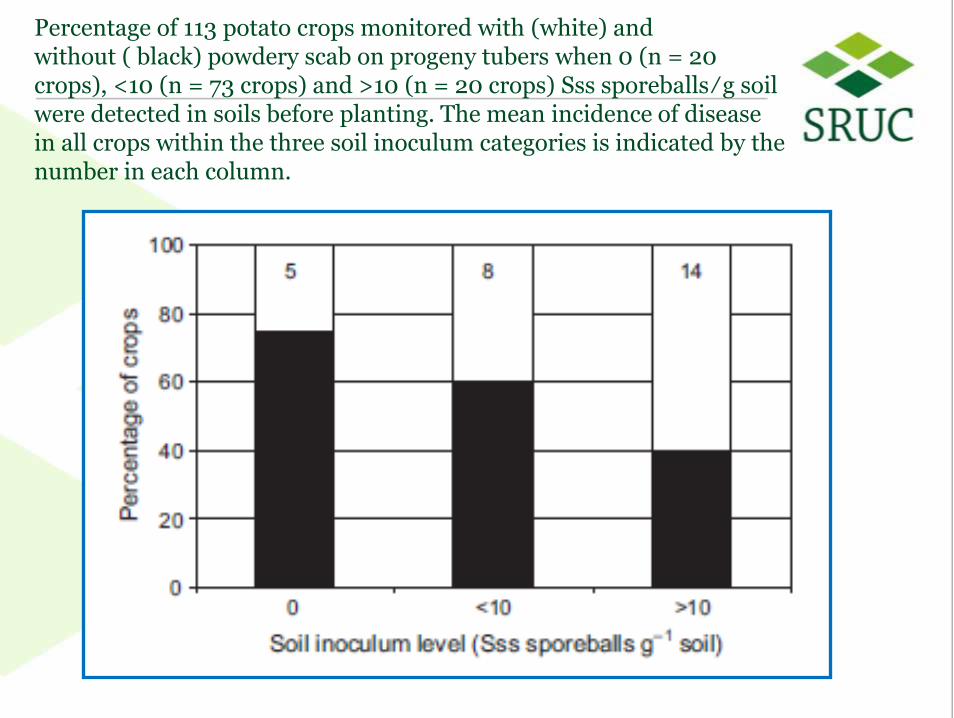
Percentage of 113 potato crops monitored with (white) and without ( black) powdery scab on progeny tubers when 0 (n = 20 crops), <10 (n = 73 crops) and >10 (n = 20 crops) Sss sporeballs ⁄ g soil were detected in soils before planting. The mean incidence of disease in all crops within the three soil inoculum categories is indicated by the number in each column.
29 29
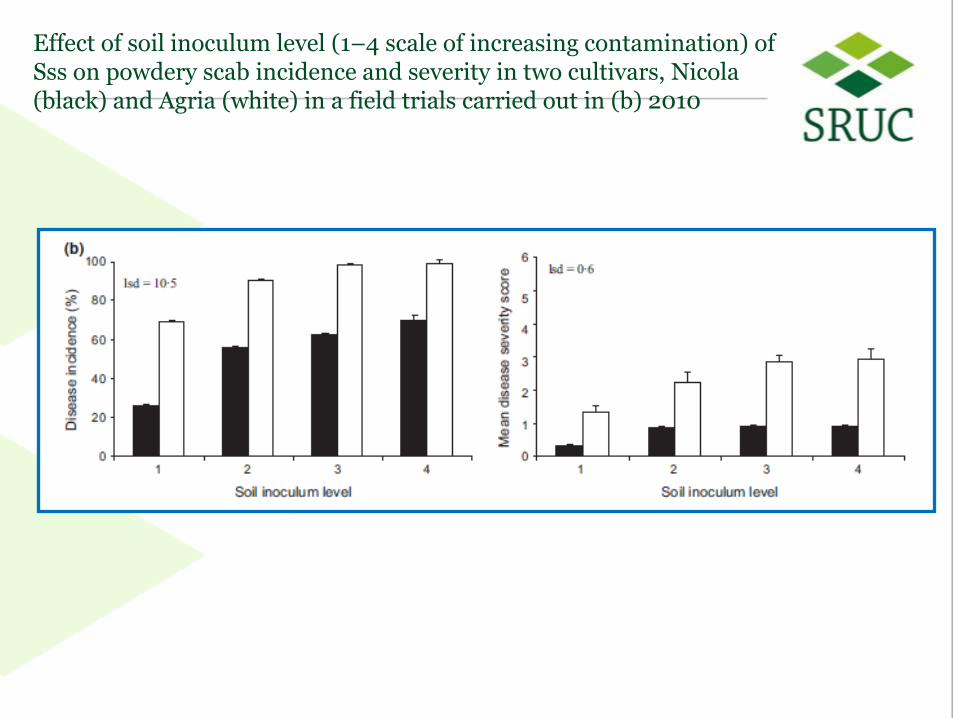
Effect of soil inoculum level (1–4 scale of increasing contamination) of Sss on powdery scab incidence and severity in two cultivars, Nicola (black) and Agria (white) in a field trials carried out in (b) 2010
30 30
With so many moderate risk results why does Scotland experience so much powdery scab?
• Because the disease is environmentally driven and
very low levels of soil inoculum can increase
rapidly through cycles of root infection before
tubers form
• Scotland’s climate is highly suited to Sss
31 31
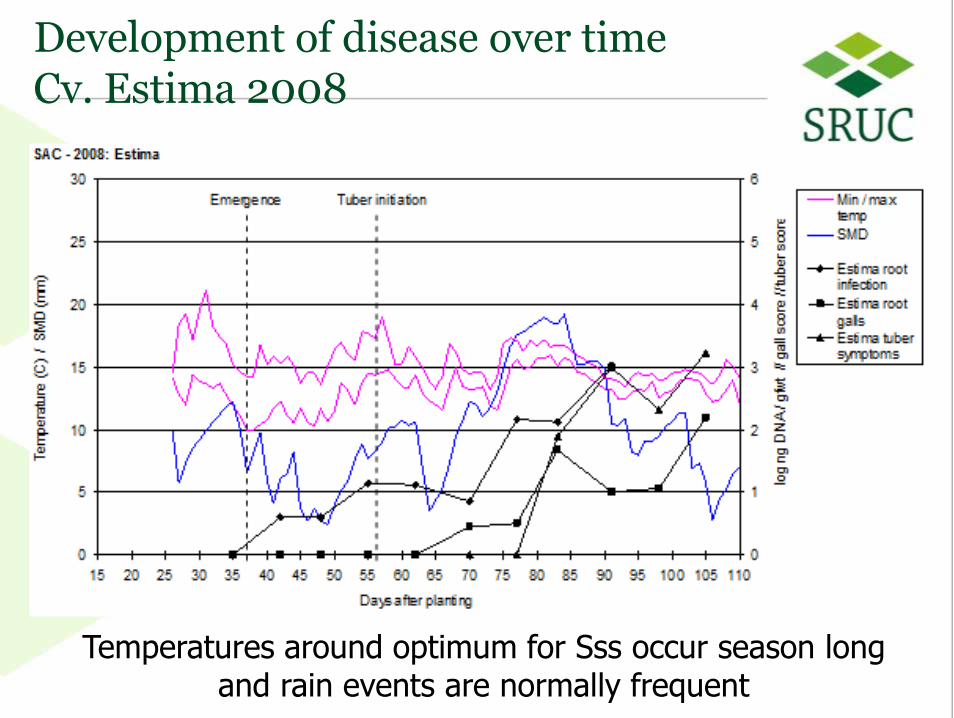
Development of disease over time Cv. Estima 2008
Temperatures around optimum for Sss occur season long and rain events are normally frequent
32 32
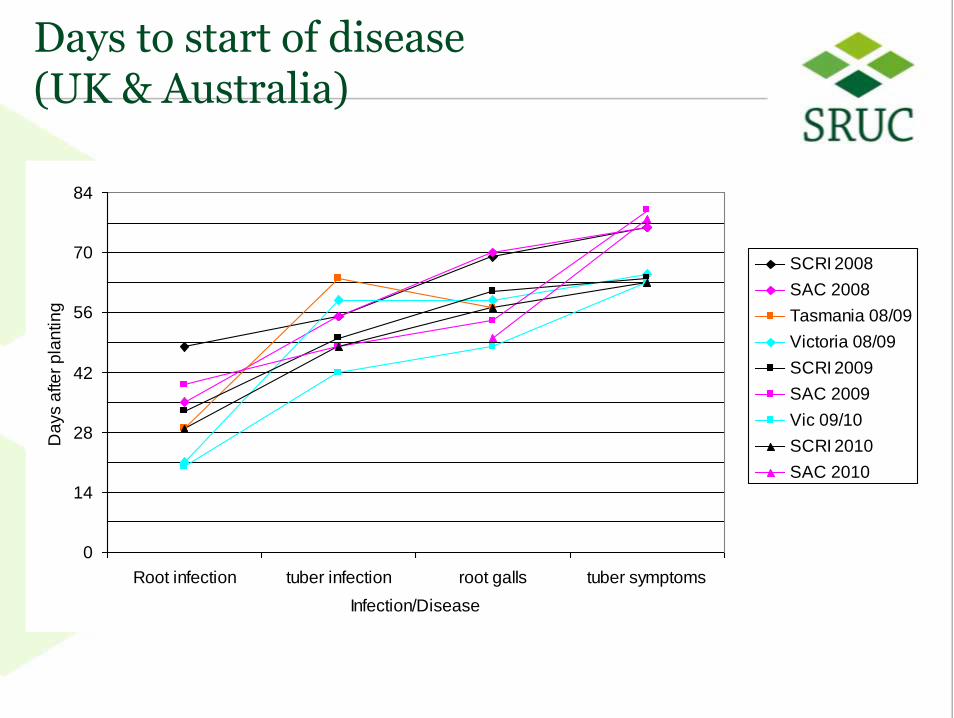
Days to start of disease (UK & Australia)
0
14
28
42
56
70
84
Root infection tuber infection root galls tuber symptoms
Infection/Disease
Da
ys a
fte
r p
lan
tin
g .
SCRI 2008
SAC 2008
Tasmania 08/09
Victoria 08/09
SCRI 2009
SAC 2009
Vic 09/10
SCRI 2010
SAC 2010
33 33
Soil test costs £108 DNA extraction plus £41 Real-time PCR (+VAT)
• Much greater uptake is expected if the price can be
reduced – but how?
• Potential loss of fluazinam as a soil fungicide
treatment in 2015 will place greater pressure on
avoidance – thereby placing more reliance on the
soil test