Embed Size (px)
Citation preview
Solid Waste Management
in Vientiane, Lao PDR
by
V ongvilay Khotpathoum
(University of Tasmania)
A thesis submitted in partial fulfilment of the requirements for a
Master Degree at the School of Geography ,and Environmental
Studies, University of Tasmania (October, 2008).
Declaration
This thesis contains no material which has been accepted for the award of
any other degree or diploma in any tertiary institution, and to the best of
my knowledge and belief, contains no material previously published or
written by another person, except where due reference is made in the text
of the thesis.
Signed
17th October, 2008
11
Abstract
The substantial growth in research into solid waste management in
developed countries is well documented. However, the management and practices of
solid waste in developing countries are not so well-known. Therefore, the purpose of
this study is to focus on solid waste management in Vientiane Municipality, in Lao
PDR, a developing country, and to learn from the experience of managing solid
waste in Australia, a developed country.
Firstly, this thesis examines the general issues and solid waste management
strategies in Australia, followed by Australian policy and legislative :frameworks for
solid waste management. Secondly, the study investigates the current issues,
legislation and solid waste management practices in Vientiane, Lao PDR. A survey
of solid waste management in Vientiane Municipality focuses on the Vientiane
Urban Development Administrative Agency (VUDAA), two private waste
contractors, and householders. The research methodology consisted of two survey
questionnaires. The first was administered to the VUDAA and two private sector
providers, and the other to 102 households in both urban and rural areas.
The survey results show that solid waste management practices in Laos are
still inadequate, with poorly serviced households, inappropriate landfill management,
weak financial status, and low community awareness. I argue that solid waste
managers and households in Laos can learn from Australian waste management
practices in order to improve their solid waste management practices.
111
Acknowledgments
I would like to thank the people whose support and contribution made this thesis
possible.
Firstly, I would like to acknowledge the support received from my family. Words
cannot describe the emotional feeling that I extend to my parents, sister, brother, and
cousins for their support and belief in me during the pursuit of my educational goals.
I also would like to acknowledge Mr. Teo Hwe Teq, a person who has given me
valuable input and encouragement all the way through.
I off er my grateful appreciation is to Mrs. Margaret Eldridge who has helped me and
welcomed me to share her home. I would not have had the opportunity to be here
without her generous support. I particularly want to thank her for helping with
English language.
Much appreciation extends to my supervisor, Julie Davidson, for her knowledge,
ideas, thoughtful suggestions, patience, guidance, and time. She was always there
when I needed help. This thesis would not have been completed without her.
Special thanks go to people in Vientiane, Laos. Especially, I thank those at Earth
Systems Laos (the environmental consultancy company) - Mr. Viengvilay
Duangphachan, Mr. Kongmeng Ly, and Mr Vixiene Kamphilavong. Also, thanks to
Mrs. Nitkeo Khammy who brought the completed questionnaires from Vientiane.
lV
Acronyms
ADB
ATSDR
DCTPC
DOE
EPA
EPR
ESL
GDP
GNP
GTZ
JFPR
JICA
LaoPDR
LDC
MCTPC
MTR
NCEE
NGO
NKRS
NMOC
NSC
NSW
Asian Development Bank
Agency for Toxic Substances and Disease Registry
Department of Communications, Transport, Posts and
Construction
Department of Environment
Environmental Protection Act
Extended Producer Responsibility
Earth Systems Lao
Gross Domestic Product
Gross National Product
Gesellschaft fiir Technische Zusammenarbeit
Japan Fund for Poverty Reduction
Japan International Cooperation Agency
Lao People's Democratic Republic
Least Developed Countries
Ministry of Communications, Transports, Post, and
Construction
Mid Term Review
National Centre for Environmental Economics
Non-Government Organisation
National Kerbside Recycling Strategy
Non-Methane Organic Compound
National Statistics Centre
New South Wales
v
NUOL
NWMRS
OECD
PADETC
PPPUE
STENO
STEO
SWM
ucs
UNDP
UNEP
VUDAA
WHO
WMC
National University of Laos
National Waste Minimisation and Recycling Strategy
Organisation for Economic Cooperation and Development
Participatory Development Training Centre
Public Private Partnerships for the Urban Environment
Science and Technology and Environment Organization
Science Technology and Environment Office
Solid Waste Management
Urban Cleansing Service
United Nations Development Program
United Nations Environmental Program
Vientiane Urban Development Administrative Agency
World Health Organisation
Waste Pickers' Multipurpose Centre
vi
Table of Contents
Declaration .............................................................................................. · .... · · · ·. · · · · · · · · · · · 11
Abstract .......................................................................................................... · · ... · · · · · · · · 111
Acknowledgement. ...................................................................................................... iv
Acronyms ..................................................................................................................... v
Table of contents ........................................................................................................ v11
List of figures ............................................................................................................... x
List of tables ................................................................................................................ xi
Chapter 1: Introduction .............................................................................................. 1
1.1 Introduction ............................................................................................................ 1
1.1.1 Country circumstances .................................................................................. 2
1.2 Study objectives ..................................................................................................... 4
1.3 Study area ............................................................................................................... 5
1.3.l A brief background on Vientiane .................................................................. 7
1.3.2 Population growth ............................................................................................... 7
1.4 Summary .............................................................................................................. 10
1.5 Thesis outline ....................................................................................................... 11
1.6 The limitations ofthis research ............................................................................ 12
Chapter 2: The mountain of waste ........................................................................... 13
2.1Introduction .......................................................................................................... 13
2.1.1 Waste and problem associated with it.. ....................................................... 13
2.1.2 Solid waste .................................................................................................. 14
2.2 Solid waste management ...................................................................................... 16
2.2.1 Collection and transport .............................................................................. 17
2.2.2 Waste minimisation ..................................................................................... 18
2.2.3 Treatment and disposal ............................................................................... 19
2.3 The economics of solid waste .............................................................................. 23
2.3.1 Charges ........................................................................................................ 25
2.4 Summary .............................................................................................................. 26
Chapter 3: Solid waste management in Australia. ...•............................................... 27
3 .1 Overview of solid waste management in Australia .............................................. 27
3.2 Solid waste management strategies in Australia .................................................. 28
Vll
3.2.1 Waste avoidance .......................................................................................... 28
3.2.2 Waste reduction ........................................................................................... 29
3.2.3 Waste recycling ........................................................................................... 31
3.2.4 Energy recovery .......................................................................................... 32
3.2.5 Waste disposal. ............................................................................................ 33
3.3 Solid waste management issues in Australia ....................................................... 35
3.4 Australian policy and legislative frameworks for solid waste management ........ 36
3.4.1 National waste minimisation and recycling strategy (NWMRS) ................ 36
3.4.2 National kerbside recycling strategy (NKRS) ............................................. 37
3.4.3 State and territory government solid waste management policies and
legislations ............................................................................................................ 3 8
3.5 Australian local government and environmental management.. .......................... 39
3.5.1 Local government and solid waste management system ............................ 40
3.5.2 Problems in solid waste management faced by local governments ............ 41
3.6 Summary .............................................................................................................. 42
Chapter 4: Solid waste management in Vientiane, Lao PDR ................................• 43
4.1 Solid waste management issues ........................................................................... 43
4.2 Legislative framework ......................................................................................... 45
4.3 Solid waste management and organisational involvements ................................. 48
4.4 Solid waste management in Vientiane ................................................................. 51
4.4.1 Responsibilities for solid waste management ............................................. 51
4.4.2 Waste disposal and landfill site ................................................................... 53
4.4.3 Waste collection systems ............................................................................ 55
4.4.4 Waste recycling ........................................................................................... 56
4.4.5 Wa"ste pickers .............................................................................................. 58
4.5 Summary .............................................................................................................. 59
Chapter 5: A survey of solid waste management in Vientiane ................................ 60
5.1 Purposes of the survey ......................................................................................... 60
5.2 Methodology ........................................................................................................ 61
5.3 Survey results ....................................................................................................... 64
5.3.l VUDAA and private waste contractors ....................................................... 64
5.3.1.1 General details and waste collection service ................................... 64
5.3.1.2 Waste disposal and landfill site ....................................................... 70
5.3.1.3 Potential for implements waste disposal and collection ................. 71
vm
5.3.2 Domestic households .................................................................................. 72
5.3.2.1 Waste collection service .................................................................. 72
5.3.2.2 Waste disposal. ................................................................................ 75
5.3.2.3 The possibility of improving waste disposal ................................... 77
5.3.2.4 The possibility of improving waste disposal and collection service79
5.4 Discussion ................................................................... ' ......................................... 82
5.4.1 Waste collection service .............................................................................. 82
5.4.2 Waste disposal ............................................................................................. 85
Chapter 6: Conclusion and recommendation .......................................................... 86
6.1 Conclusion ............................................................................... · ............................. 86
6.2 Recommendations ................................................................................................ 87
References .................................................................................................................. 90
Appendix 1 ................................................................................................................ 101
Appendix 2 ................................................................................................................ 107
Appendix 3 ........ ........................................................................................................ 111
IX
List of Figures
Figure 1.1 Map of the Lao PDR .................................................................................... 2
Figure 1.2 Map of Vientiane, Lao PDR ........................................................................ 6
Figure 1.3 Population data for Vientiane Municipality, Lao PDR in 1995, 2000 and
2005 ····························································································································· 9
Figure 4.1 Organisational structure of SWM in Vientiane Municipality ................... 52
Figure 4.2 Waste collection service in Vientiane ....................................................... 56
Figure 4.3 Waste pickers in Vientiane ....................................................................... 58
Figure 5.1 VUDAA organisation flow chart .............................................................. 65
Figure 5.2 Waste collection activity with a large open dump truck at the market in
Vientiane .................................................................................................................... 67-
Figure 5.3 Frequency of waste collection by area ...................................................... 72
Figure 5.4 Rubbish bins provided by area ................................................................. 73
Figure 5.5 Timing of service by area ......................................................................... 73
Figure 5.6 Waste disposal service used for normal waste by area ............................. 74
Figure 5.7 Failure to collect waste by area ................................................................ 74
Figure 5.8 Frequency of failure to collect waste by area ........................................... 75
Figure 5.9 Waste separated into different categories by area .................................... 76
Figure 5.10 Different categories waste separated by area ......................................... 76
Figure 5 .11 Usual method of waste disposal by area ................................................. 77
Figure 5.12 Collection service improvement in the last five years by area ............... 79
Figure 5.13 Satisfaction with waste collection service by area ................................. 80
x
Figure 5.14 Capacity afford waste collection service by area ................................... 80
Figure 5.15 Willingness to pay for improved service by area ................................... 81
X1
List of Tables
Table 1.1 Comparison of population growth rates in South East Asian countries ...... 8
Table 2.1 The stren~ths and weaknesses of waste treatment and disposal methods .. 20
Table 3.1 Key legislation and selected waste minimisation strategies for the New
South Wales and the Tasmanian government, a case of comparison ........................ 38
Table 3 .2 Legislation, regulations and guidelines relating to landfills for the
governments of New South Wales and Tasmania, a case of comparison .................. 39
Table 4.1 Main features of the levels oflandfill and leachate control.. ..................... 54
Table 5.1 A list of survey area ................................................................................... 63
Table 5.2 Waste volume collected per annum ........................................................... 64
Table 5 .3 Summary of the weekly designated areas of the Lao Garbage Company
waste collection service .............................................................................................. 69
Table 5.4 Aware of effects of dumpling and burning waste by area ......................... 78
Table 5.5 Willingness to separate waste by area ........................................................ 78
Xll
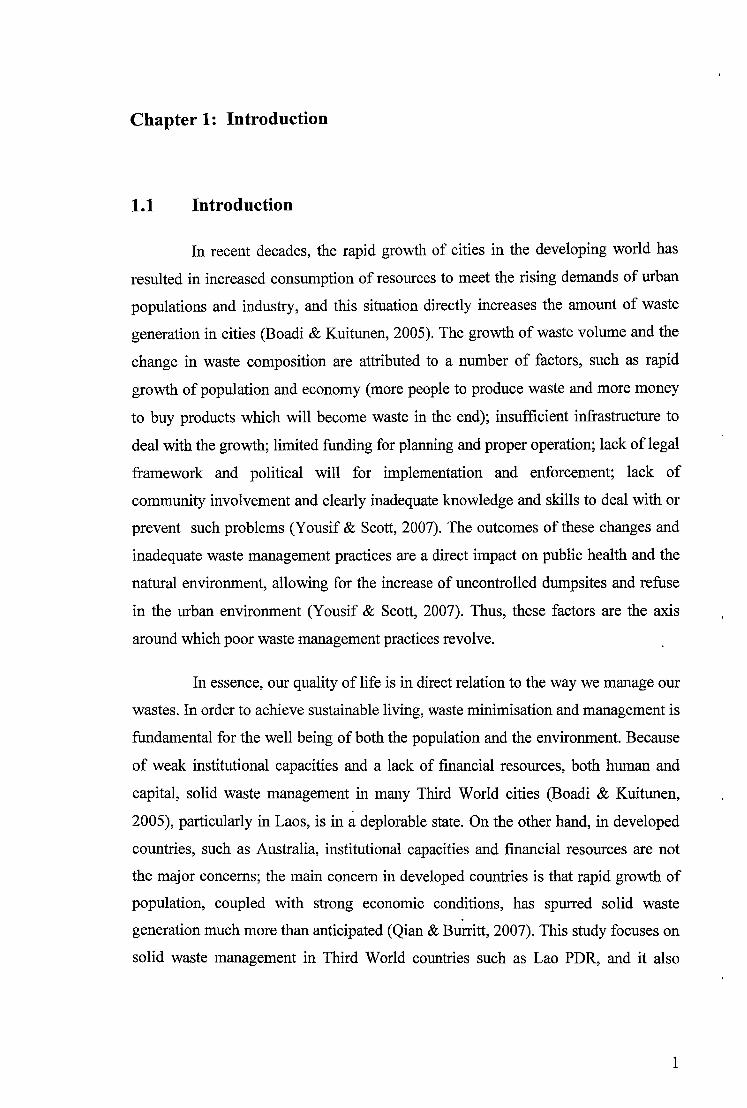
Chapter 1: Introduction
1.1 Introduction
In recent decades, the rapid growth of cities in the developing world has
resulted in increased consumption of resources to meet the rising demands of urban
populations and industry, and this situation directly increases the amount of waste
generation in cities (Boadi & Kuitunen, 2005). The growth of waste volume and the
change in waste composition are attributed to a number of factors, such as rapid
growth of population and economy (more people to produce waste and more money
to buy products which will become waste in the end); insufficient infrastructure to
deal with the growth; limited funding for planning and proper operation; lack of legal
framework and political will for implementation and enforcement; lack of
community involvement and clearly inadequate knowledge and skills to deal with or
prevent such problems (Yousif & Scott, 2007). The outcomes of these changes and
inadequate waste management practices are a direct impact on public health and the
natural environment, allowing for the increase of uncontrolled dumpsites and refuse
in the urban environment (Yousif & Scott, 2007). Thus, these factors are the axis
around which poor waste management practices revolve.
In essence, our quality of life is in direct relation to the way we manage our
wastes. In order to achieve sustainable living, waste minimisation and management is
fundamental for the well being of both the population and the environment. Because
of weak institutional capacities and a lack of financial resources, both human and
capital, solid waste management in many Third World cities (Boadi & Kuitunen,
2005), particularly in Laos, is in a deplorable state. On the other hand, in developed
countries, such as Australia, institutional capacities and financial resources are not
the major concerns; the main concern in developed countries is that rapid growth of
population, coupled with strong economic conditions, has spurred solid waste
generation much more than anticipated (Qian & Burritt, 2007). This study focuses on
solid waste management in Third World countries such as Lao PDR, and it also
1
anticipates learning from the expenence of developed countries, particularly
Australia.
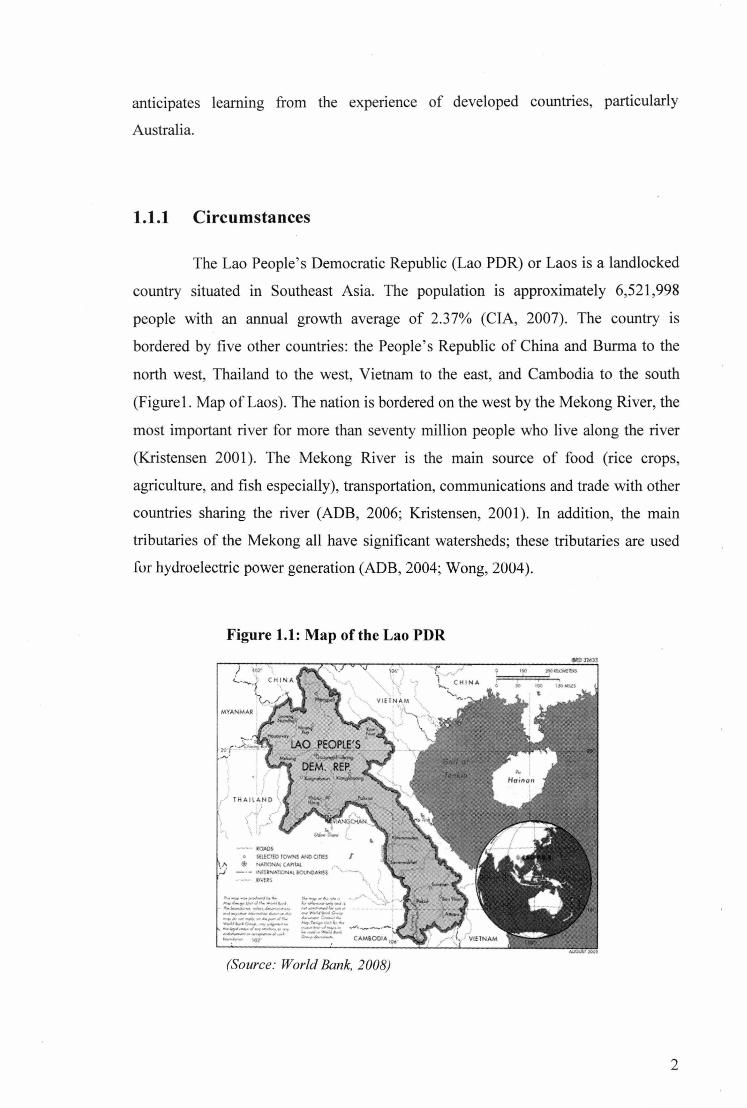
1.1.1 Circumstances
The Lao People's Democratic Republic (Lao PDR) or Laos is a landlocked
country situated in Southeast Asia. The population is approximately 6,521 ,998
people with an annual growth average of 2.37% (CIA, 2007). The country is
bordered by five other countries: the People 's Republic of China and Burma to the
north west, Thailand to the west, Vietnam to the east, and Cambodia to the south
(Figurel. Map of Laos). The nation is bordered on the west by the Mekong River, the
most important river for more than seventy million people who live along the river
(Kristensen 2001). The Mekong River is the main source of food (rice crops,
agriculture, and fish especially), transportation, communications and trade with other
countries sharing the river (ADB, 2006; Kristensen, 2001). In addition, the main
tributaries of the Mekong all have significant watersheds; these tributaries are used
fur hydroelectric power generation (ADB, 2004; Wong, 2004).
Figure 1.1: Map of the Lao PDR
-~-~ tOAOS
, ... \.
\ VfU NAM \
0 SUfCl(D fOWNS Ai"1D OflES I ,.. @ iw..nc>NA.t CAl'f1Al
;..J - -- INfUNATIONAI. M)JN0 AIJE$. ,... · lr·'fU ~ ,
"'·--~"".,. ... .....,~"""""'""' ......... ._ .... ,,,.._ ........... ..._ -""'tlo~._ ...... .,..,i1,o _,,.. ... ~ ...... ,,..,.1-.. ~ ..... c:i..._.,........_ -·-.,..,-.. ~..,. -'--~· <I-· ~- 107·
,,......,............ .r- :'\..~ > """""""""" ·~-- · ... ·-1),., ""'-*"~- .. """~~"""' ... --i'.'-...... ~ ... ,i.:. ... ....,.i...--'....,...,,. -'~-- ·-· "'-"'-~ ..... c.--.- CAM&.OOfA tOli
(Source: World Bank, 2008)
2
Laos has a total land area of 236.800 square kilometres (km2) with largely
mountainous topography and thick forest (ADB, 2006; CIA, 2008). The mountainous
landscape widens across the most northern part of the country (WHO, 2005). The
central and southern parts of the nation are plateaus and plains with heavy pollution
compared to the northern area (Wong, 2004). Administratively the country is divided
into sixteen provinces, one municipality, and one special region (Regional data
exchange systems, 2008). The capital city of Laos is Vientiane which is located in
the central part of the country (Wong, 2004).
Laos has a tropical monsoon climate which is characterized mainly by two
distinct seasons - a rainy season from May to October and a dry season from
December to April (ADB, 2006). The natural hazards are flooding and drought
which occur frequently (CIA, 2008). For the period of the wet season, areas of
greater altitude can receive rainfall of more than 3000 mm annually (Wong, 2004).
Due to relatively low altitude, Vientiane receives an annual rainfall of between 1500
mm and 2000 mm (Wong, 2004). The annual average temperature range is
approximately 28 °C to a maximum of 38 °C (Regional data exchange systems,
2008). However, during winter in the mountainous areas, the temperature drops to
around 14 to 15 °C (Regional data exchange systems, 2008).
Laos is in the group ofleast developed countries (LDC) with 30.7% of the
population below the poverty line (CIA, 2008). The country is currently ranked 133rd
out of 177 countries and thus categorised within the "Medium Human Development"
category (UNDP, 2008). The Lao government has ambitiously planned to lift the
country's status to be out of poverty and no longer in the list of LDC by 2020
(Regional data exchange systems, 2008). A GDP per capita was estimated at US$
1,900 with 7% of the real growth rate in 2007 (CIA, 2008). However, the literacy
rates of people aged fifteen and over averaged 58.7% and the unemployment rate
was approximately 2.4% in 2005 (CIA, 2008). Although health indicators have been
improving gradually over the past three decades, the efforts of the national
authorities still remain under international standards, being the lowest in the region
(WHO, 2005). A quarter of the population has no access to health services and nearly
half live without access to clean drinking water (WHO, 2005). The estimated life
expectancies in 2005 were 63 years for women and 59 years for men and the
3
estimated maternal mortality was more than 400 per 100 OOO births. This was higher
for females aged between 15-39 years, and it was even higher with those aged
between 30-39 years (NSC, 2005).
From an economic perspective, Laos is largely an agricultural region with
about 80% of its labour force employed in the agriculture sector, while the industry
and services sector employs around 20% (estimated in 2005) (ADB, 2006; CIA,
2008). Laos depends a lot on foreign aid and imports a large number of its
manufactured goods, medicine and machinery (DEFAIT, 2003 cited in Wong, 2004).
The Lao economy benefits from investments in hydropower, mining, and the
construction of hydroelectric dams. The latter is one of the strong economic drivers
(CIA, 2008). In addition, the export commodities are mainly hydroelectricity, timber,
copper and gold, coffee, wood products and textiles (CIA, 2008).
Laos J:ias an underdeveloped infrastructure, especially m rural areas.
Although the Lao government has support from Japan and China to improve the road
system, it has no railroad, only a basic road system, limited external and internal
telecommunications (CIA, 2008).
In addition, because of climatic and topographic conditions, SWM is a
largely neglected subject. Low awareness and education on SWM result in
inappropriate handling of waste, for instance, through burning and dumping which
produce health risks for all communities. The country's rivers, especially the
Mekong River, are critical to the population's livelihoods. However, the rivers are
still used as a dumpling ground for waste, so that during the rainy season, when
flooding occurs, the dumped waste is redistributed into residential areas. These
practices produce widespread and negative health effects.
1.2 Study Objectives
The main objectives of this thesis are to:
• review the relevant literature associated with solid waste management;
• explore solid waste management practices in Australia
4
• collect information on the ongoing status of solid waste management
activities in Laos;
• explore the relevant regulations and legislation in Australia and Laos with
are associated with solid waste management and the roles these play in
order to encourage environmental improvement;
• critically examine the key challenges and hurdles to solid waste
management in Laos;
• provide recommendations on how to improve waste management m
Vientiane, based on the case study results;
• learn from the experience of a developed country, using the example of
Australia.
1.3 Study area
The survey was undertaken in the Vientiane Municipality, Lao PDR. There
are nine districts in Vientiane, divided into two areas: the urban and rural area. The
four districts in the urban area are Chanthabury, Sikhothabong, Xaysettha, and
Sisatthanak. For rural area, there are five districts: Naxaithong, Xaithany,
Hadxaipong, Sangthong, and Maypakgeung (see figure 1). For the purpose of this
thesis, two districts in the rural area are excluded: Sangthong, and Maypakgeung.
The reason for this exclusion is because these two areas are far away from the
research centre. Due to logistical and financial issues, this exclusion was deemed
necessary.
5
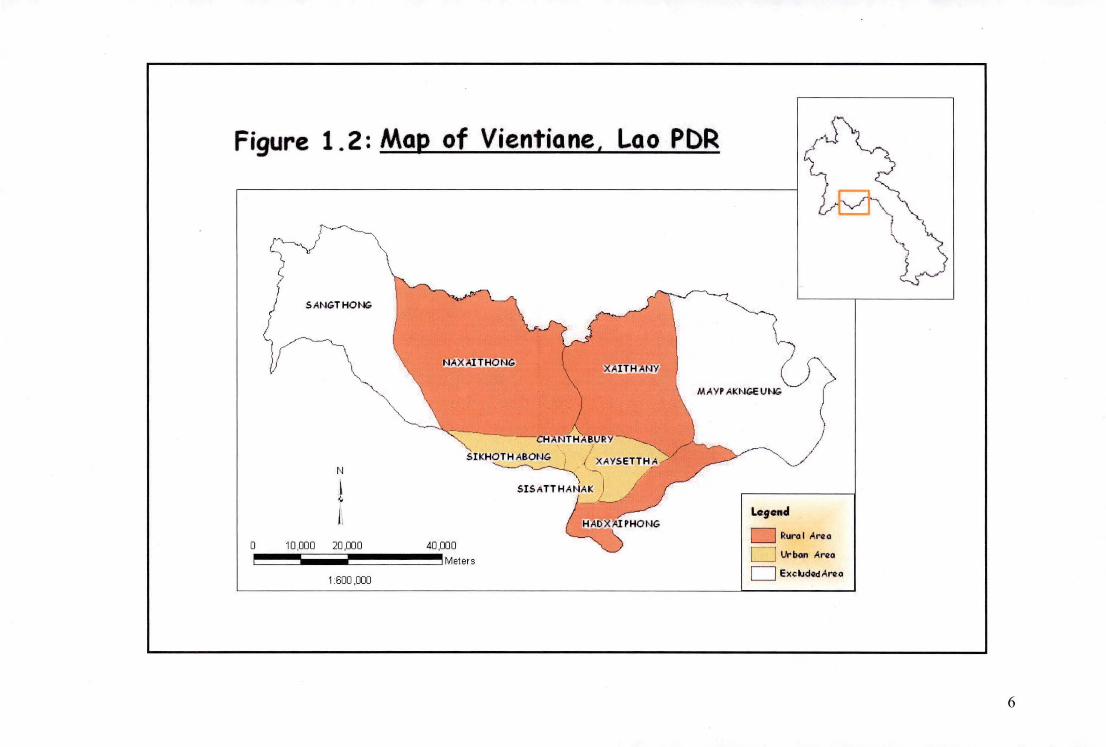
Figure 1.2: Map of Vientiane, Lao PDR
0
S ANGTHONG
N
! I
NAX AITHONG XAITH ANY
- c H:t.. THABUR ~
SIKHOTH A80tJG / XAYSETTH A
~--SIS1ffTH ANAK I
/::~ 10,000 20,000 40,000
~~~liiiiiiiiiiiiiiiiiiiiliiiiiiil~~~~~~ Meters
~PHONG
1:600 ,000
Logctnd
Rural Arcio
D lkban Arcia
D Exc~dQdArci o
6
1.3.1 A brief background on Vientiane
As mentioned before, the capital city of Lao PDR is Vientiane. It has a total
land area of approximately 3,920 km2 and is located on the Mekong river bank
directly opposite Nongkhai province, Thailand (MacDonald, 2004; WEP A, 2008).
As the Lao economy remains open to foreign investments, the prefecture of
Vientiane is the centre for business and government. The city accommodates all of
the foreign embassies, the presidential palace, government offices and non
government organisation head offices (MacDonald, 2004). In addition, many foreign
businesses invest in several sectors, particularly in industrial factories, wood
processing, textiles, and garment factories (Phouxay, 2007). Thus, urban migration
seems to be increasing with the requirement for a bigger labour force and a number
of young people have migrated from the countryside to the larger cities, particularly
to the capital city, in order to improve their life, chances, career, and education
(Phouxay, 2007). Since Vientiane has expanded rapidly, the city is facing a number
of infrastructure-related problems such as traffic jams, sewerage disposal problems,
and poor waste management. According to UNEP (2001 ), "such growth is known
from experiences a 11 over the world to lead to an exponential increase in mban
environmental problems and stress the cultural fabric of the ethnically diverse
country". People in rural areas, however, still remain in farming (ADB, 2006).
1.3.2 Population growth
In 2006, Vientiane city had a population of approximately 711,919 people
with a 4.3% annual growth rate which is a lot higher than the national level which i~
around 2.5% (Khanal & Souksavath, 2005; NSC, 2007); this is a high growth rate
compared to the neighbouring countries. Table 1 shows the comparison of population
growth rates among the Mekong Subregion Countries. It is interesting that Laos and
Cambodia have the highest population growth rates, followed by Burma. Basically,
these three countries are in the group of least developed and low income countries.
The majority of people in these three countries still continue to maintain high birth
rates (Encyclopedia of the Nations, 2008). According to Becklake (1991), many
countries in Asia have the greatest increasing populations because families have
7
many children in case they do not all service. The other Mekong subregion countries,
such as Vietnam and China (particularly Yunnan province), had adopted policies to
reduce the rapid rate of population growth (Jones, 1999); for example, one or two
children per family. According to Jones (1999), Thailand has the highest level of
urban dominance of any large countries in the world, with its urban population
existing in the capital city (Bangkok). However, the low population growth rate in
this country is mostly because of the urbanisation subverts the largely corporate
family based way of life of traditional society and replaces it with individualism and
growing personal objectives (Jones, 1999). The Urban Development Sector Unit
(1999) states that socio-economic development, industrialisation, and urbanisation
have an effect on the waste generation rates.
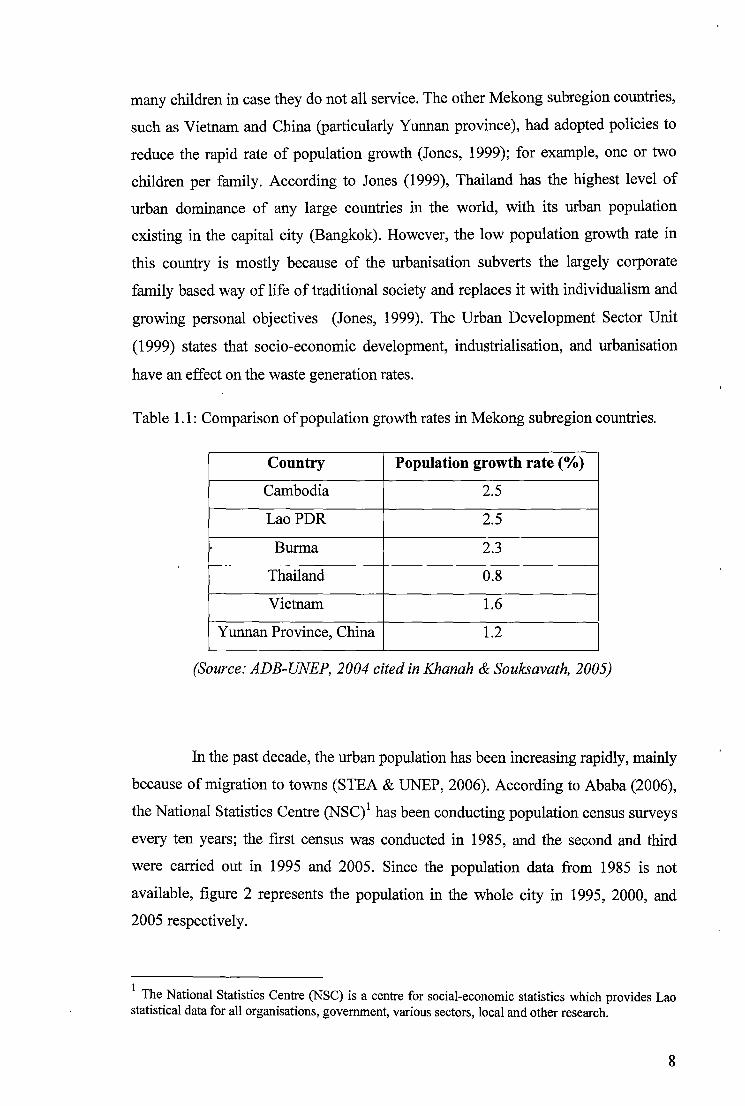
Table 1.1: Comparison of population growth rates in Mekong subregion countries.
Country Population growth rate (%)
Cambodia 2.5
LaoPDR 2.5
Burma 2.3 --- Thailand 0.8
Vietnam 1.6
Yunnan Province, China 1.2
(Source: ADB-UNEP, 2004 cited in Khanah & Souksavath, 2005)
In the past decade, the urban population has been increasing rapidly, mainly
because of migration to towns (STEA & UNEP, 2006). According to Ababa (2006),
the National Statistics Centre (NSC)1 has been conducting population census surveys
every ten years; the first census was conducted in 1985, and the second and third
were carried out in 1995 and 2005. Since the population data from 1985 is not
available, figure 2 represents the population in the whole city in 1995, 2000, and
2005 respectively.
1 The National Statistics Centre (N"SC) is a centre for social-economic statistics which provides Lao
statistical data for all organisations, government, various sectors, local and other research.
8
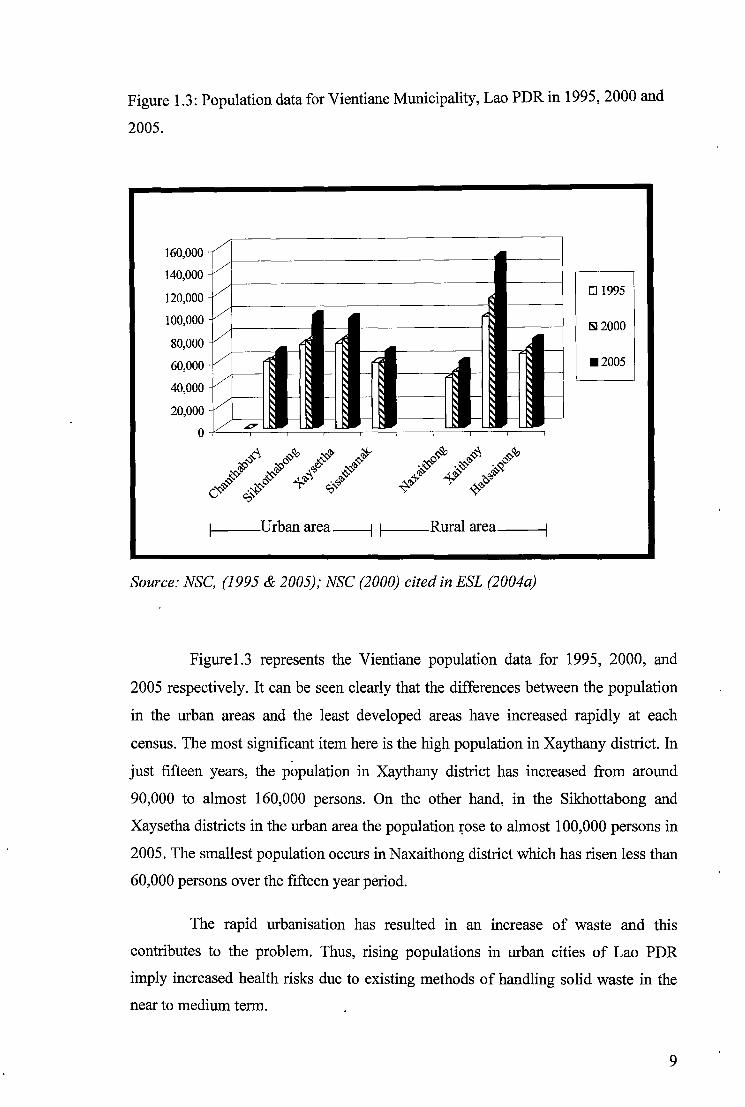
Figure 1.3: Population data for Vientiane Municipality, Lao PDR in 1995, 2000 and
2005.
160,000
140,000
120,000
100,000
80,000
60,000
40,000
20,000
0
/
/
v ~
v ' ~,
~
v -
I di 'I - ~ I- - -~~ -
v ~~ ~
~ ~
' - ~ ~ - ' ~ -
I
-V~' ~ !
~
~ ~ ~ ~
v~' - ~ ~ ~ - ~ - ~ - -
~ ~ ~ ~
~ ~ ~
~ ~
v-u- ~ - I- - ~ ~ - -
~
1---Urban area---l 1---Rural area---;
Source: NSC, (1995 & 2005); NSC (2000) cited in ESL (2004a)
D 1995
fSi12000
•2005
Figurel.3 represents the Vientiane population data for 1995, 2000, and
2005 respectively. It can be seen clearly that the differences between the population
in the urban areas and the least developed areas have increased rapidly at each
census. The most significant item here is the high population in Xaythany district. In
just fifteen years, the population in Xaythany district has increased from around
90,000 to almost 160,000 persons. On the other hand, in the Sikhottabong and
Xaysetha districts in the urban area the population :r;ose to almost 100,000 persons in
2005. The smallest population occurs in Naxaithong district which has risen less than
60,000 persons over the fifteen year period.
The rapid urbanisation has resulted m an increase of waste and this
contributes to the problem. Thus, rising populations in urban cities of Lao PDR
imply increased health risks due to existing methods of handling solid waste in the
near to medium term.
9
1.4 Summary
In order to assess issues of SWM in Vientiane Municipality, this chapter
provided an overview of Lao PDR, with a special focus on Vientiane background. As
the population growth rate in Vientiane is one of the factors that contributes to the
waste generation problems, a comparison of population growth rates in the Mekong
subregion countries (Cambodia, Lao PDR, Burma, Thailand, Vietnam, and Yurman
Province, China) is provided. The differences between population growth rates in the
Mekong subregion countries show that the group of least developed countries such as
Lao PDR, Cambodia, and Burma are more likely to have higher population growth
rates than others. This is because large families are perceived as necessary to provide
labour and ensure support in old age. There is no policy for reducing population
growth rate as in Vietnam and Yurman province, China. Lastly, this chapter describes
the increase in Vientiane's population for 1995, 2000, and 2005 respectively. The
population growth has a direct effect on economic growth, industrialisation, and
urbanisation in Lao PDR.
10
1.5 Thesis outline
This thesis is organised as follows:
Chapter 2 examines the literature to illustrate SWM theory and the
complexities involved. These include collection and transportation, waste
minimisation, treatment and disposal. In addition, the economics of solid waste is
highlighted as an associated environmental problem.
Chapter 3 gives SWM background and SWM strategies in Australia. It
focuses on SWM issues, the national policy and regulatory framework for SWM
which include the national waste minimisation and recycling strategy, and state and
territory government SWM policy and legislations. In addition, Australian local
government environmental management is also illustrated.
Chapter 4 examines some of the SWM issues in Vientiane Municipality. It
illustrates the legislative framework in Lao PDR and then focuses on the SWM
initiatives and organisational involvement. It details SWM in Vientiane Municipality
including responsibility for SWM, waste disposal and landfill sites, waste collection
systems, and waste recycling.
Chapter 5 reports on a survey of SWM in Vientiane. It explains the
methodology and interview process involving relevant stakeholders. These include
the Vientiane Urban Development Administrative Agency (VUDAA), two private
contractors: a.) Lao garbage company and b.) Chanthabury Cleansing Pvt. Company
and lastly households. In addition, survey results and data analysis are also provided.
Chapter 6 concludes the research of both developed and developing
countries such as Laos and Australia. Recommendations are provided by illustrating
the best outcomes for solid waste management in Vientiane through the case study
analysis as well as lessons from developed countries such as Australia.
11
1.6 The limitations of this research
Not many solid waste management projects have been undertaken in Lao
PDR, thus there were difficulties accessing the relevant documents for references and
analysis of the issues. In addition, a review of literature from different sources found
only a few papers or studies relevant to this topic. These are projects of the Japan
International Cooperation Agency (JICA) (2004) and the United Nations
Development Program (UNDP) (2004) both of which employed Earth Systems Lao
to undertake waste management studies in Vientiane. In addition, the research paper
written by Bhoj Raj Rhanal and Bounsouk Souksavath (2005) proved helpful.
The survey which forms the basis of this thesis was carried out overseas,
and a number of problems emerged during its conduct. These included
communication problems, postage delay, difficulties in finding interviewers, and
obtaining responses to questionnaires from government and private sectors.
12
Chapter 2: The Mountain of Waste
2.1 Introduction
2.1.1 Waste and problems associated with it
What is waste? We usually think that waste is just rubbish such as tins,
bottles, paper and old food that are thrown in the rubbish bin (Becklake, 1991: 4 ), but
in fact the definition of "waste" is more than that. According to Becklake, ( 1991 : 3 ),
"All living things produce waste". Waste is basically produced from households,
industries and commercial enterprises. It can be defined as any product or substance
that is no longer of use or value to people or organisations that own it and which will
be discarded (Australian Government Productivity Commission, 2006: 2). Simply
throwing things away creates pollution and is wasteful of the Earth's limited natural
resources (Becklake, 1991). EPA NSW defines waste as "any matter, whether solid,
liquid, gaseous or radioactive, which is discharged, emitted or deposited in the
environment in such volume, constituency or manner as to cause an alteration of the
environment" (EPA NSW, 1996).
Even though waste is perceived to be a problem for many reasons, the three
major reasons usually cited are: (i). disposal which can affect the environment and
people's health; (ii). landfill space is claimed to be becoming scarce; and (iii). waste
is the unused items of a life cycle process that can have upstream environmental and
resource implications (Australian Government Productivity Commission,
2006:XXVII). In general terms, poor waste management practices have a direct
impact on public health, natural environment, and economy. Firstly, in terms of
public health, poor waste management practices allow for the creation of serious
health problems associated with disease-carrying pests, such as rats and flies (Birley
& Lock, 1999, cited in Yousif & Scott, 2007). In addition, many households store
their waste in open containers ranging from baskets to plastic bags, making home
storage unhygienic (Boadi & Kuitenen, 2005). When improperly stored in open
containers for long periods, waste becomes detrimental to health because it increases
the breeding of disease-carrying vectors like rodents and insects (Boadi & Kuitenen,
13
2005). For instance, Domfeh (1999) asserts that poor garbage storage and sanitation
results in diarrhoea in most third world countries. Secondly, Rogers (2005: 4) claims
that the direct environmental impacts of solid waste are sobering. In particular, the
greatest environmental threat of solid waste is from the landfill itself. According to
Rogers (2005: 4), the increased amounts of waste mean more and more toxins are
released into the environment, and contaminate the soil and water supply. The
landfills also emit 'land-fill gas', due to the emissions of decomposing waste
(Rogers, 2005: 4). This vapour consists mostly of highly flammable methane, which
is a major contributor to global climate change (Cameron, 2008; Rogers, 2005: 4).
Lastly, due to increasing solid waste generation, increasing land prices and more
stringent environmental regulations, waste management is becoming more expensive
(Qian & Burritt, 2007). For example, the urban areas of Asian countries currently
spend around US$ 25 billion on SWM per annum; this figure will rise to at least US
$ 50 billion in 2025 (Urban Development Sector Unit, 1999). In the long run, this
increase in cost not only has a negative impact on the country's economy, it will also
impact on the effective operations of the organisations involved in waste
management (Qian & Burritt, 2007).
Therefore, due to this complexity of issues at hand, waste management is a
challenging field. In other words, waste management often covers a truly wide range
of disciplines from natural sciences and technology to social sciences and beyond
(Bruner, 1996; Miranda, Miller & Jacobs, 2000). Indeed, while looking for solutions
to waste problems, it is always necessary to address more than just one discipline
(Bruner & Feliner, 2007).
2.1.2 Solid waste
Solid waste is best defined by what it is not- it is not waste-water discharges
to surface water and is not waste air emissions (Beranek, 1992). Solid waste is any
waste that someone would consider disposing of on the land (Beranek, 1992). In
other words, solid waste is generated in offices, landscaping activities, homes,
agriculture, construction and factories and includes waste from scrap metal to ash
(Ayotamuno & Gobo, 2004; Becklake, 1991: 4; Beranek, 1992). Over the years, the
14
increased generation of large amounts of solid waste in th.e world is attributed to the
rapid growth of cities both in developing and developed countries (Boadi &
Kuitunen, 2005). Compounding this effect is the fact that modem societies are also
known as 'throwaway societies'. Some of the characteristics of these societies are;
economic prosperity which encourages people to buy more, which in tum increases
waste generation; advertising which emphasises the short life-cycle of previous
products, where the latest product is an improvement on all the others; and self
service cultures that wrap everything individually so that we can take the goods from
the shelves ourselves (Becklake, 1991: 6). All of these factors have contributed to the
increase in the level of solid waste generation over the past.
Since this study deals with municipal solid waste only, a more refined
definition of solid waste will be used. According to EPA (1998: 18, cited in Lah,
2001), municipal solid waste includes waste such as durable goods, non-durable
goods, containers and packaging, food scraps, yard trimmings, and miscellaneous
inorganic waste from residential, commercial, institutional, and industrial sources.
The greater the economic prosperity and the higher the percentage of urban
population the greater the amount of solid waste (Urban Development Sector Unit,
1999). Examples illustrate the composition percentages of different types of waste in
different regions. In Central America, the municipal solid waste consists of 43.8 per
cent food waste, 13.7 per _cent paper and cardboard, 13.5 per cent wood, 2.6 per cent
textiles, 1.8 per cent rubber/ leather, 6.7 per cent plastic, 2.6 per cent metal, 3.7 per
cent glass, and 12.3 per cent other (ash, dirt, dust, soil, electronic waste)
(Intergovernmental Panel on Climate Change, 2006). In contrast, municipal solid
waste in Eastern Asian countries consists of 26.2 per cent food waste, 18.8 per cent
paper and cardboard, 3.5 per cent wood, 3.5 per cent textiles, 1.0 per cent rubber/
leather, 14.3 per cent plastic, 2.7 per cent metal, 3.1 per cent glass, and 7.4 per cent
other (Intergovernmental Panel on Climate Change, 2006). In addition, municipal
solid waste is further classified into several categories such as residential, industrial,
institutional, and construction and demolition (Urban Development Sector Unit,
1999). However, for the purpose of this thesis, all of the above is considered as
municipal solid waste.
15
In Australia, a portion of solid waste has been designated by the government
as 'hazardous waste' (Scott, Beydoun, Amal, Low & Cattle, 2005). In general terms,
hazardous waste is defined as waste that requires treatment before it is suitable for
disposal to landfill (Beranek, 1992, Nathanson, 1986: 373; Scott et al., 2005).
Examples of hazardous waste include medical waste from hospitals, fertilisers,
paints, and cosmetics (Becklake, 1991: 18; Beranek, 1992; Nathason, 1986: 337). In
Australia, although all states specify the separate disposal of hazardous wastes,
variations exist between states as to what constitutes a hazardous waste, and the acts
and regulations that control them (Scott et al., 2005). Having said that, hazardous
wastes in Australia are generally categorised according to their basic properties of
toxicity, reactivity, ignitability, and corrosivity (Chayabutra, 1994). It is not the
intention of this thesis to focus on hazardous solid waste, hence, solid waste will be
considered to be the more common type of municipal waste, as alluded to earlier.
The purpose of municipal solid waste management is to protect public health,
prevent congestion, and preclude unpleasant odours and aesthetically offensive
scenes by removing these wastes from point of origin and disposing of them in a safe
and acceptahle way (Beede & Bloom, 1996: 177). Therefore, with this notion in
mind, the following discussion will focus on the management of solid waste.
2.2 Solid waste management
Scholars recommend the implementation of an integrated waste management
hierarchy in order to achieve sustainable solid waste management (for example, see,
Price & Joseph, 2000). Indeed, review of the literature on solid waste management
shows that this system has been favoured by many developed countries such as the
United States (for example, see, Lah, 2001), Australia (for example, see, Chayabutra,
1994) and developing countries as well, such as Panama (for example, see Linowes
& Hupert, 2006) and India (for example, see, Zia & Devadas, 2007). The solid waste
management hierarchy was designed to provide a framework by which municipal
solid waste is reduced or managed through several different practices (Price &
Joseph, 2000). Although this strategy may be tailored depending on a particular
16
community's needs (Lah, 2001; Yousif & Scott, 2007), the basis of this strategy
consists of (Price & Joseph, 2001; Urban Development Sector Unit, 1999):
• Collection and transport
• Waste minimisation
• Treatment and disposal (recycling, composting, landfilling, incineration with
energy recovery)
2.2.1 Collection and transport
The primary aim of waste collection and transportation is to transport wastes
to a disposal site at minimum cost in order to prevent any risk to public health and
the environment (Siklossy, 1993). In essence, the method of collection, number and
type of collector trucks, and the number of workers involved are crucial factors in
waste collection (Angelelli & Speranza, 2002). In Australia, solid waste collection is
generally a local municipal service provided to residents (Australian Government
Productivity Commission, 2006: 42), where residents place their waste in one or
more bins. This waste is collected in trucks and taken to various facilities to be
reused, recycled or disposed of (Australian Government Productivity Commission,
2006: 65). fo. addition, the practice of separating waste into a number of bins
(typically recyclables and general waste) requires time and effort on the part of the
householder, and as such it imposes nonmonetary costs on them (Australian
Government Productivity Commission, 2006: 46). Waste collection and
transportation in Australia can be conducted either by municipal management or by
private contractors (Worthington & Dollery, 2001). In general, these different
arrangements can be grouped into four categories: municipal, where the local
authority manages the entire system; private contract, where private operators bid for
contracts to manage all or part of the system; private collection, where private
operators bid for contracts with individual householders; and franchise, where private
operators are awarded monopolistic franchise over an entire area (Corbitt, 1990 cited
in Chayabutra, 1994).
17
In general, there are three waste collection methods. The first method is
referred to as the traditional method, where a truck with a three-man crew drives
from one house to another as two men empty dustbins or throw rubbish bags into the
rear of the truck (Angelelli & Speranza, 2002). This method is still used in many
developing countries. The primary s1,iortcoming of this method is that it requires a
large number of crew to do the collection, hence increasing the collection cost
(Angelelli & Spreranza, 2002).
The second method, known as the side-loader system, requires residents to
place their garbage bins on the streets, and the collecting truck will stop beside each
container and, by means of a semi-automatic system operated by the driver from the
cabin, it lifts and empties the bins into the truck's body (Angelelli &' Speranza,.
2002). This system requires the lowest number of crew, it collects more rubbish in a
single operation as compared to the traditional system, is faster and does not involve
the division of a collection area into neighbourhoods (Angelelli & Speranza, 2002).
However, the main drawback of this system is it often results in litter being left
where bags have been ripped or interfered with by animals (Chayabutra, 1994). This
is by the far most popular waste collection method in Australia.
The third method is the communal collection ( Chayabutra, 1994 ), where the
municipality provides large containers at designated areas for residents. In Australia,
this method is still practised in rural areas and areas that are far away from local
infrastructure. The drawback of this system is it could be expensive for the operator
due to the long distances travelled and the time involved (Chayabutra, 1994). In
addition, this method is inconvenient for residents because they need to travel to a
central location in order to dispose of their waste.
2.2.2 Waste Minimisation
According to EPA (1998, cited in Lah, 2001), waste minimisation is referred
to as any change in the design, manufacturing, purchase or use of materials or
products (including packaging) to reduce the amount of waste before it enters the
municipal waste management syst~m. In other words, waste reduction activities
18
affect the waste stream before the point of generation, while recycling, combustion
and landfilling are the management options after the point of generation (Phillips,
Adams, Read & Green, 2000; Price & Joseph, 2000; Read & Phillips, 1998). Waste
minimisation has been regarded by some as too idealistic to feature within the solid
waste management strategy (Price & Joseph, 2000). However, the best way to
achieve more sustainable waste management is the reduction of waste at source
(Phillips, Clarkson, Adams, Read & Coggins, 2003). Although waste minimisation is
at the top of the waste management hierarchy, it is almost the most difficult to
implement. Scholars argue that reform of education and information strategies are
essential in order to increase the awareness of the importance of waste minimisation
(Price & Joseph, 2000; Waite, 1995). Having said that, this strategy has also been
successfully implemented. A good example can be drawn from Northamptonshire in
UK, where the local council, in partnership with 22 companies, developed a program
that concentrates on resource efficiency and dramatic waste reduction, and increased
the production of more first class product per unit of resource (Phillips et al., 2003).
After 24 months, the companies not only saved 3.5 million pounds, they also reduced
their waste output associated with production by at least 20 percent (For full details,
refer to Phillips et al., 2003), hence, greatly reducing waste generation.
2.2.3 Treatment and disposal
The most common method of waste disposal world wide is landfilling. This
option is generally viable for a community with a long life-span landfill (Y ousiff &
Scott, 2007). Other methods are composting, recycling and incineration. The
strengths and weaknesses of each method are shown in Table 2.1 (Commission of the
European Communities, 1982, cited in Chayabutra, 1994).
19
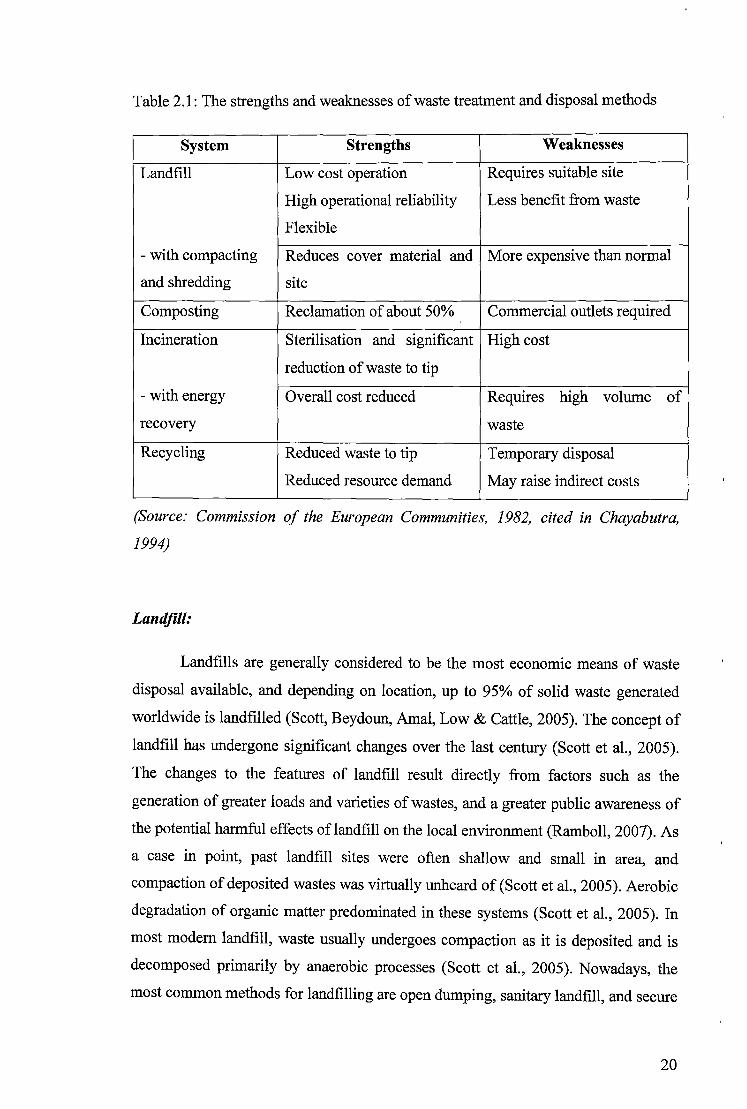
Table 2.1: The strengths and weaknesses of waste treatment and disposal methods
System Strengths Weaknesses
Landfill Low cost operation Requires suitable site
High operational reliability Less benefit from waste
Flexible
- with compacting Reduces cover material and More expensive than normal
and shredding site
Composting Reclamation of about 50% Commercial outlets required
Incineration Sterilisation and significant High cost
reduction of waste to tip
- with energy Overall cost reduced Requires high volume of
recovery waste
Recycling Reduced waste to tip Temporary disposal
Reduced resource demand May raise indirect costs
(Source: Commission of the European Communities, 1982, cited in Chayabutra,
1994)
Landfill:
Landfills are generally considered to be the most economic means of waste
disposal available, and depending on location, up to 95% of solid waste generated
worldwide is landfilled (Scott, Beydoun, Amal, Low & Cattle, 2005). The concept of
landfill has undergone significant changes over the last century (Scott et al., 2005).
The changes to the features of landfill result directly from factors such as the
generation of greater loads and varieties of wastes, and a greater public awareness of
the potential harmful effects of landfill on the local environment (Ramboll, 2007). As
a case in point, past landfill sites were often shallow and small in area, and
compaction of deposited wastes was virtually unheard of (Scott et al., 2005). Aerobic
degradation of organic matter predominated in these systems (Scott et al., 2005). In
most modem landfill, waste usually undergoes compaction as it is deposited and is
decomposed primarily by anaerobic processes (Scott et al., 2005). Nowadays, the
most common methods for landfilling are open dumping, sanitary landfill, and secure
20
landfill (Ramboll, 2007). Open landfills have a low management cost, but result in a
lot of pollution (Chayabutra, 1994). Typically, these landfills are located in areas
where the risk that they will cause damage to human health and the environment is
reduced to acceptable levels (Australian Government Productivity Commission,
2006: 68). Once they reach the end of their operational life, they are restored and
used for recreational or other purposes (Ramboll, 2007). The main drawback of open
dumping and sanitary landfill is that it is practically impossible to keep the hazardous
waste within landfill sites (Becklake, 1991: 19). Therefore, secure landfills are often
used to treat hazardous waste to prevent detrimental effects on the environment
(Department of Primary Industries, Water, and Environment, 2004).
In terms of municipal solid waste landfills, the waste deposited in these
landfills generally derives from households, offices, and small businesses and they
do not accept many forms of hazardous waste (Scott et al., 2005). Nevertheless, the
items that originate from these seemingly benign sources often contain toxic
substances. As they break down, they can release their toxic constituents into the
leachate (Musson, Jang, Townsend, Chung, 2000).
Composting
On the large scale, composting involves separating out the organic
decomposable material from waste, shredding or pulverising it to reduce its particle
size, and digesting it through a window method (Russell, 1982: 134; Zbinden &
Goodman, 2007). This decomposition of organic waste results in a humus-like
substance which is primarily used as a soil conditioner (Russell, 1982: 134). On the
small scale, composting is often referred to as backyard composting of biodegradable
organic waste (Lah, 2001 ). Either large or small scale, the disadvantage of
composting is the production of odours, harmful gases such as methane and nitrous
oxide; pollution of ground water and soil; and the attraction of pests and pathogens to
the area (Hobson, 2007).
According to Russell (1982: 135), the greatest threat to composting of solid
waste is because there are limited markets for composted products.
21
Incineration
In simple terms, incineration is the burning of waste. This is a popular
method in many countries such as Japan, Denmark, Sweden, and Switzerland,
because this can reduce the amount of solid waste by about 80 to 90 percent
(Becklake, 1991: 12). In addition, a properly designed incinerator that operates under
suitable temperatures and. conditions can generate heat or electricity for the nearby
areas (Lah, 2001; Price & Joseph, 2000; Russell, 1982: 135). At the present time,
incineration is the only suitable method for intractable wastes and has gradually
attained better efficiency and less emission of toxic residues (Chayabutra, 1994).
However, incineration also has its harmful environmental impacts (Price & Joseph,
2000). Firstly, proportionately more energy is needed to produce smaller units of
energy. In other· words, the resources required to install, run and maintain an
incinerator will be more than half those needed to run a similar-size generator (Price
& Joseph, 2001). Furthermore, for every ten tonnes of waste burned, one tonne of
ash remains (Becklake, 1991: 12). This may still contain harmful materials which
pollute the environment when the ash is buried in landfill sites (Becklake, 1991: 12).
Recycling
Recycling is the activity by which discarded materials that are no longer
useful are accumulated, sorted, processed, and converted into raw materials and used
in the production of raw products (EPA NSW, 1996). Before recyclable materials
can be processed, they must be collected. Most recycling involves curbside
recyclables collection, drop-off programs, buy-back operations, and/or container
deposit systems (Lah, 2001 ). The success of the recycling process needs a system of
source separation and careful handling (Pollock-Shea, 1988). In other words, it is
necessary to distinguish between quantity and quality (Pollock-Shea, 1988). For
instance, paper rapidly loses its value when combined with other trash, particularly
organic food waste and thereby does not command a good market price. Indeed,
according to Pollock-Shea (1998), the cleanest discarded materials always command
the highest prices and value.
22
The benefits of recycling are resources conservation (eg. trees), reduced
energy consumption ( eg. making paper from used paper instead of virgin timber
reduces the energy used for production by almost 70 percent and requires less than
half as much water), and lower water and air pollution (Pollock-Shea, 1988; Price &
Joseph, 2000). In addition, recycling offers communities an opportunity to trim their
waste disposal needs, and thereby reduce disposal costs and reduce the demand on
the size of increasing landfill (Pollock-Shea, 1988). However, in many areas of the
world, there are barriers to recycling such us prejudice against use, or post-consumer
materials; and weaknesses in secondary material markets (Gandy, 1993). In other
words, the economic viability of the recycling option depends largely on the
availability of secondary markets for recovery products or materials (Australian
Government Productivity Commission, 2006: 81; Department of Environment,
Queensland, 1996; Russell, 1982: 78).
The other main challenge of recycling is that many residents are still unsure
of what can be recycled and how to present items before placement in the bins. This
is evidenced by the fact that many items that are not recyclable such as garden waste,
ceramics etc are found in recycling bins (Christchurch City Council, 2006). In
addition, the recyclable items are poorly presented such as caps and lids still attached
to containers, and the containers are not thoroughly rinsed (Christchurch City
Council, 2006).
2.3 The economics of solid waste
There are many different sources of funds for SWM. In general, these are
positively correlated to SWM decision making that is based on a particular method
for determining the appropriate price of waste management services (Bureau of
Industry Economics, 1993: 32). Indeed, literature on SWM identifies an array of
costs that have an important impact on the sources of funds for SWM. Morris &
Holthausen (1994) suggest the usage of household production models as a means of
analysing and evaluating the household component of a variety of waste management
initiatives, such as changes in financing of waste collection service, recycling
requirements and collection options offered; they have a direct impact on the funding
23
of solid waste management. In similar vein, Beede & Bloom (1995) suggest several
mechanisms that may affect funding for waste management. These are the effects of
income and demand for environmental quality (Beede & Bloom, 1995). For instance,
they assert that high-income households are likely to demand more for environmental
quality than low-income households, and thus are willing to pay more for it (Beede
& Bloom, 1995). Quite differently, Bose & Blore (1993) suggest the funds for solid
waste management should incorporate total costs, including the opportunity cost of
landfills and the costs associated with various externalities, such as diminished
neighbouring property values and environmental risk costs.
Recently, there has been consideration of the possibility of financing waste
management through unit charges rather than property taxes as a means of bringing
about a reduction in societal waste production. More importantly, without the unit
charges for garbage, individuals do in fact perceive the marginal cost of the waste
management services they receive to be zero and therefore have no incentive to
change their waste production level (Ferrara, 1999).
Despite a wide array of literature pertaining to the economics of SWM, the
fundamental sources of funds for SWM are generally clustered around sources such
as property taxes, separate property taxes, service charge fees, can or container rental
charges, special assessment and miscellaneous revenues (American Public Works
Association, 1966, cited in Chayabutra, 1994). The rate bases for SWM through
property tax are generally estimated by combining two or three different measures;
these are generally measured by uniform charges for each service, number of rooms,
dwelling, units or apartments, frequency and service provided, size and numbers of
containers (Chayabutra, 1994). With regards to residential properties, service charges
are usually based on number and size of containers, collection method, frequency
and distance of the waste collection (Australian Government Productivity
Commission, 2006: 66), whereas commercial rates are usually based on quantity,
frequency of collection, kind of business, square footage or flat rate, and large
container services (Bernstein, 1991).
Although the success of financing SWM relies heavily on how municipalities
collect service charges for funds, each municipality uses different methods in
collecting charges (Bose & Blore, 1993). Within Australia for instance, the variations
24
in charges for solid waste collection are influenced by a number of factors such as
the number of dwellings, the nature of the streets to be negotiated, the distance from
collection area to the disposal site and the productivity of the collection crew (Bureau
of Industry Economics, 1993: 51 ). In addition, metropolitan dwellers are often
charged higher compared to rural residents (Bureau of Industry Economics, 1993:
63).
Within Australia, general tax revenues collected by local governments have
funded SWM (Australian Government Productivity Commission, 2006: 42). The
greatest tax revenue is derived from the sector that collects and transports waste (64
percent); followed by the processing, treatment and/or disposal sector (27 percent);
and the collection and transport of recyclables sector (6 percent) (Australian
Government Productivity Commission, 2006: 42). This general tax revenue 1s
derived from both private firms and government trading enterprises (Australian
Government Productivity Commission, 2006: 42).
2.3.] Charges
According to Bernstein (1991), three types of charges apply to the collection
and disposal of solid waste: user charges, disposal charges, and product charges.
User charges. This type of charge is usually based on the volume of waste
collected (Australian Government Productivity Commission 2006: 229). In most
cases, the charge is calculated to cover total expenditures of collection and treatment
of municipal solid waste, and does not reflect the marginal costs of environmental
effects (Bernstein, 1991). In some instances, some municipalities implement this
system as an incentive for households to reduce waste production (Kelleher & ·Dixie,
2000). For instance, Houtven & Morris (1999) found that this charging strategy in
Georgia, United States has resulted in a 36 percent reduction in waste generation by
households. However, the most common problems associated with this strategy are
disagreement over the charge base, high monitoring cost (Bernstein, 1991 ), and the
increase in the illegal dumping rate (Fullerton & Kinnaman, 1996).
25
Disposal Charges. These charges are based on the type of waste and the
method of treatment before dumping (Bernstein, 1991). For example, incinerated and
composted waste attract a lower rate than landfilled waste (Bernstein, 1991 ), because
it is necessary to treat landfilled waste for leachate emission and other
environmentally harmful polluters.
Product charges. Most product charges on waste have applied to non
retumable containers, lubricant oils, plastic bags, fertilizers, tyres, and feedstock
(Bernstein, 1991). Special charges and taxes that compose these product charges are
often levied on these polluting products to influence firms or households' behaviour,
aiming at either reducing the quantity produced, or at decreasing the amount of
effluents (Bernstein, 1991; Morage-Gonzalez & Padron-Fumero, 2002). For instance,
in Sweden and Norway, product charges are applied to batteries, fertilizers, and
pesticides (Morage-Gonzalez & Padron-Fumero, 2002). However, most product
charges systems lack actual incentive impact because they rely heavily on direct
monitoring and regulation by government (Bernstein, 1991).
2.4 Summary
This chapter describes the waste and problems associated with it.
Subsequently, it describes the concept of solid waste, followed by its management.
With regards to SWM, its strategies in terms of waste hierarchy such as collection
and transport, waste minimisation, treatment, and waste disposal are discussed. In
general, waste hierarchy was designed to provide a framework to reduce and better
manage solid waste. Finally, the economics of solid waste is discussed in respect to
the sources of funds such as charges, that are associated with SWM.
26
Chapter 3: Solid Waste Management in Australia
3.1 Overview of solid waste management in Australia
Like many developed countries, Australia has become increasingly concerned
about the relationship between environment and development. These concerns are
based on the fact that several important environmental issues are land-use related and
are tied to growth (Chinitz, 1990; O'Gallagher, 1990: 1). Specifically, Australia is
now at a stage where SWM choices are fast becoming as important a competitive
development factor among communities as water management, reliable electricity,
sewer capacity, buildings, and other infrastructure (Beranek, 1992; Keen & Mercer,
1993). In this context, good SWM choices and management have become major foci
of development, particularly within the context of sustainable development (Keen &
Mercer, 1993).
Along with the growing urban population in Australia in recent years, waste
generation has grown rapidly (Qian & Burritt, 2007). It is estimated that more than
26. 7 million tonnes of solid waste is collected and disposed of in landfills each year
nationwide (Australian Bureau of Statistics, 1998). More startling is the fact that the
study suggests that Australia's level of solid waste generation per capita is one of the
highest in the world (Environment Australia, 2001 cited in Qian & Burritt, 2007).
Given the limited capacity of the ecosystem and environmental impacts of solid
waste disposal on the ecosystem, the increasing quantities of waste have become a
critical problem challenging sustainable development (Qian & Burritt, 2007).
Therefore, more recently, SWM strategies in Australia have become
concerned with broader issues of sustainability and conservation, rather than just
focusing on end-of-pipe or downstream solutions (that is, waste disposal) (Australian
Government ProductiVity Commission, 2006: 11 ). Indeed, a waste hierarchical
approach of avoidance, reduction, recycling, energy recovery and disposal, has been
adopted (Australian Government Productivity Commission, 2006: 11).
27
Stemming from that notion, this chapter briefly explains the SWM strategies
adopted in Australia, followed by policy and regulatory frameworks that are related
to these strategies, and lastly the role of local government in planning and managing
solid waste in Australia.
3.2 Solid waste management strategies in Australia
As mentioned earlier, the philosophy for SWM in Australia adopts a waste
hierarchical approach that focuses on avoidance, recycling, energy recovery and
lastly disposal. In this approach, a proper strategy for SWM for individuals,
businesses, and communities is one that addresses as much of the solid waste at the
highest level on the hierarchy as possible (Rubick, 1991: 2). Indeed, the presumption
underpinning the waste hierarchy is that the environmental costs are generally lower
if waste is avoided altogether and higher when waste is disposed to landfill
(Ackerman, 2005: 2). Having said that, according to Beranek (1992), options that are
successful in one country may not be successful in another due to economics or other
social factors such as prevailing allilutles (Beranek, 1992). Therefore, the purpose of
this section is to critically examine each option in Australia and its strengths and
weaknesses in the Australian context.
3.2.1 Waste avoidance
According to Environment Australia (1997: 49), waste avoidance refers to the
complete removal of some materials from the waste stream and may involve changes
to production processes. In this part of the hierarchy, resource conservation is
generally accepted as a major environmental benefit resulting from waste
minimisation (Environment Australia, 1997: 5). For waste avoidance, the main
initiative is education such as increasing community awareness and cooperation
(Beranek, 1997). In Australia, some of the measures that have been implemented by
local, state and commonwealth governments are providing initiatives for businesses
to remove unnecessary packaging from products and changes in product design to
reduce materials consumption, encouraging consumers to purchase products that use
28
appropriate packaging and reusable or refillable products (Environment Australia,
1997: 50). The strength of this method is that it is the best way to achieve sustainable
SWM as it can prevent many negative environmental impacts of SWM compared to
other methods such as landfilling.
However, success in terms of implementing this strategy is hard to quantify
because of there being so many reasons for waste stream fluctuation and also because
it is hard to measure the success rate of 'educating' communities about waste
avoidance (Beranek, 1997). Indeed, according to the Australian Government
Productivity Commission (2006: 147), in order to maximise net benefits to the
community, SWM policy should be guided by rigorous analysis of the financial,
environmental and social costs and benefits, not by the simple priorities suggested by
the waste hierarchy. In other words, without any measurable standards or
benchmarks, waste avoidance strategies can be viewed as aspirational targets at best,
as opposed to legally binding regulations. Therefore, it is difficult to assign
accountability to the parties involved, as well as consequences for targets not being
met (Australian Government Productivity Commission, 2006: 154).
In short, the zero waste targets tend to be aspirational goals or arbitrary
targets rather than strategic and comprehensive strategies. More importantly, in
Australia, the evidence shows that chasing this zero waste target has a very high cost
and is technically, financially and administratively complex (Australian Government
Productivity Commission, 2006: 150). Therefore, in Australia, this approach is not
widely endorsed compared to other SWM strategies.
3.2.2 Waste reduction
According to Environment Australia (1997: 53), waste reduction refers to
changes to a product or process that reduce the amount of waste produced, that is,
situations where it is not viable to avoid the production of some waste. In Australia,
some identifiable examples of waste minimisation include:
• Packaging materials are constantly being redesigned to reduce the amounts of
materials necessary to achieve this goal. Plastic bottles made of PET now require
29
15% less material than the original product which was introduced in 1978
(Rubick, 1991: 31).
• The glass industry is constantly responding to this challenge as well. In Australia,
the 'stubby' beer bottle produced by ACI Glass Packaging weighed 260g in 1980
but only 170g in 1990 (Rubick, 1991: 31 ).
• Various councils have adopted differential pricing strategies across Australia.
These initiatives are mainly based on the justification from research by Recycle
NSW in 1993 that indicates that larger garbage bins resulted in more waste being
diverted into the bin (Litter and Recycling Research Association, 1993). These
initiatives include (Environment Australia, 1997: 54):
- Pay by volume- Charging households according to the size of bin they
select.
Bag or tag systems- Similar to volume based systems, but the charge
levied relates to actual volume generated rather than the volume available.
Pay by weight- Charging households based on the weight of waste
collected.
Rebate systems- Householders pay for a standard service level and then
receive a rebate (reward) for using the service less often.
However, the main disadvantage of these strategies is they are not easy to
implement. This is because the options available need to be balanced against other
criteria such as community expectation, type of waste, incidence of illegal dumping,
and other problems such as 'stomping' on bin contents (Environment Australia,
1997: 53). Indeed, to cite one example, the Australian Government Productive
Commission (2006: 145) states that solid waste such as glass, plastics and aluminium
and ferrous metals is largely inert in landfills and is not a significant contributor to
leachate, therefore produces few or no externalities in landfill. Therefore, seeking to
move such waste 'up the hierarchy' would impose net costs on the community if
additional costs incurred by disposers are not offset by the benefits of reduced
environmental externalities (Australian Government Productivity Comission, 2006:
146).
In short, Australian councils do not widely endorse the waste avoidance and
minimisation approaches, rather, they are regarded as indicative priorities ~ntended to
30
guide waste management policies (Australian Productivity Commission, 2006: 143).
The reason is that strict adherence to the waste hierarchy list of preference can lead
to waste management outcomes that are unsuitable for the circumstances, costly to
the community, and risk circumventing the study of all relevant costs and benefits
required in order to develop sound SWM policy (Australian Productivity
Commission, 2006: 143).
3.2.3 Waste recycling
Recycling is the process of converting products back into their constituent
raw materials and then reprocessing this raw material into new articles (Environment
Australia, 1997: 63). The impetus for recycling is the need to conserve natural
resources and to protect the environment (Institution of Municipal Engineers, 1991:
11 ). As mentioned earlier, however, different properties of various materials
determine their suitability for recycling, as not all materials can be recycled
indefinitely (Pollock-Shea, 1998). In some cases, recycling reduces the quality of a
material, so it is not always possible to yrodu1,;t: lht: same arlicles that are provided
from the source material (Organisation for Economic Co-operation and
Development, 1983: 20). In addition, recycling success is also determined by the fact
that recycling cost does not outweigh the anticipated benefit, and demand exists for
the finished product (Institution of Municipal Engineers, 1991: 11; Pollock-Shea,
1998). In other words, councils must first seek a reliable outlet for the products of
recycling and establish that the required standards of cleanliness, consistency and
absence from contaminants are achievable within the collection routines to be
adopted (Institution of Municipal Engineers, 1991: 11 ).
In Australia, a range of municipal recycling activities is undertaken, including
kerbside, and approximately 90 percent of Australian household have access to
kerbside recycling for paper and packaging; and many others can drop off their
recyclables at depots (Australian Government Productivity Commission, 2006: 79).
While municipal recycling in Australia is common, only 20 percent of Australia's
recycled materials are recovered from municipal waste (Australian Productivity
Commission, 2006: 42).
31
In Australia, although the recycling rates have increased over the years,
research by Harrison Market Research (2005), suggests that the recycling program in
Australia is one of the most successful in Organisation for Economic Cooperation
and Development (OECD) countries. The main contributors to this success are the
Australian public's perception of the importance of recycling activities and the
strength of market demand in Australia and internationally for recovered materials
compared to virgin materials (Australian Bureau of Statistics, 2003). In addition, the
use of a marketing network has proven very successful in developing markets for
recycled materials in Australia (Nicholson, 2005). These marketing networks consist
of members with common goods and/or services and facilitators that assist in the
development of new and existing markets for the members' products (Nicholson,
2005). These marketing networks (in essence, also the recycling companies), with
the support of local governments, have created the demand for recovered materials
both locally and internationally by driving the prices of recovered materials below
the virgin materials (Australian Government Productivity Commission, 2006: 24).
Also, with the support of local governments, recycling companies have thrived, with
operations ranging from recovery of cardboard and glass to organic waste and oil
(Environment Australia, 1997: 64). Having said that, the success of recycling also
needs to be balanced by the location of recycled products and the stability of
recycling markets (the main contributing factors) (Environment Australia, 1997: 67).
3.2.4 Energy recovery
Energy recovery refers to the use of waste products as a source of fuel
(Environment Australia, 1997: 76). In Australia, the most likely opportunity for
councils to recover energy from waste is by designing and operating local/regional
landfills to optimise landfill gas generation and recovering it for electricity
generation (Environment Australia, 1997: 76). According to the Department of the
Environment and Heritage (2005), between 1990 and 2003, the proportion of landfill
gas that was captured and converted into energy grew from almost zero to
approximately 24 percent; with 75 percent of this generated electricity servicing
major urban areas and capital cities. Although landfill-gas capture does not represent
a significant energy source for Australia (Australian Government Productivity
32
Commission, 2006: 33), the growth in landfill-gas capture has occurred due to
government incentives, regulatory requirements promoting the generation of
electricity from renewable sources, attempts to reduce greenhouse gas emissions
from landfills, and commercial incentives (Department of the Environment and
Heritage, 2005).
3.2.5 Waste disposal
In Australia, the current state of technology an4 comparative cost of
alternative methods to landfill suggest that approved and managed landfill is the
most appropriate means of solid waste disposal (Australian Government Productivity
Commission, 2006: 68). More than 90 percent of all solid waste generated in
Australia is disposed of in landfill (Scott et al., 2005). In 1993 it was estimated that
each year more than 14 million tonnes of refuse, representing 95% of the total, is
disposed of in Australian landfills (Scott et al., 2005). By 1996-1997 this had
increased to 21.2 million tonnes, 33 tonnes corresponding to a per capita disposal of
1.1 tonnes per year and placing Australia among the highest 10 solid waste
generators within the OECD (Scott et al., 2005). However, the amount of waste
disposed to landfill in Australia as a proportion of total generated, appears to have
fallen (Australian Government Productivity Commission, 2006: 68). For example,
landfill-disposal rates decreased from 60 percent to 45 percent and 67 percent to 27
percent respectively, in Victoria and the ACT between 1994-95 and 2004-05;
potentially for the same reasons that recycling rates have increased (Australian
Government Productivity Commission, 2006: 31).
Within Australia, due to the potential risk to health and environment from
open-dumping landfill, the most recent method of sanitary landfill is used which is
achieved by dumping, compacting, and covering with soil (Department of Primary
Industries, Water arid Environment, 2004). Modem sanitary landfills are subjected to
strict control, where they operate according to the highest environmental standards,
in respect of waste reception, control and management (Ramboll, 2007). In addition,
they also incorporate features, such as liners and leachate collection, in order to
reduce the emissions of leachate and landfill gases (Australian Government
33
Productivity Commission, 2006: 68). Indeed, the Environmental Guidelines for Solid
Waste Landfills and Industrial Landfilling (EPA NSW, 1996) describe the
benchmark procedures for the proper management of solid waste in landfills as
follows:
a. Lining and capping. Lining of a landfill bed cell is usually accomplished
using an impervious material such as compacted clay and/or artificial liners such as
high-density polyethylene. Some authors have estimated the life-span of this lining to
be up to a century (Baccini, Henseler, Figi & Belevi, 1987; Christensen, 1989: 20).
However, more recently, a report by Van Moorst (1996) indicated that some liners
have been found to fail after only several years, possibly due to the environment and
soil conditions. Therefore, within Australia, there is a call to extensively investigate
the current measures of liners in order to prevent the release of contaminants into the
environment in the long term (Scott et al., 2005). Capping involves placing a layer
(usually of material similar to the liner) over the filled landfill to minimise the
_infiltration of rainfall or surface water. The main purpose of the cap is to maintain a
'dry' environment within the cell and prevent the generation of leachate.
b. Layering. Layering involves placing the waste in a series of layers of
nominal thickness, covering each layer (daily) with clean soil. Layering improves
waste compaction and reduces the problems with odours and vermin and decreases
the infiltration of precipitation.
c. Compaction. The primary aim of compaction is to reduce waste volume.
Compaction does have an influence on other landfill characteristics such as leachate
generation, liquid and gas permeability, and decomposition rate (Scott et al., 2005).
Canziani & Cossu (1989 cited in Scott et al., 2005) reported that the extent of
compaction can significantly reduce leachate volumes.
d. Leachate recirculation. Leachate recirculation is a technique aimed at
encouraging saturation in order to stimulate the degradation processes, leading to
more rapid stabilisation of the landfill. Moisture is essential in order for
biodegradation of wastes to occur, and rather than relying on intermittent rainfall,
leachate circulation is employed to enhance and maintain refuse saturation.
34
3.3. Solid waste management issues in Australia
As detailed earlier, a waste management hierarchy is utilised within the
Australian context. In terms of this waste management hierarchy, the main challenge
that faces the governments is how it can convince various stakeholders such as
industries and communities to adopt more acceptable waste management practices
(O'Gallagher, 1990: 65). In other words, a fine balance of the "stick" approach to
legislation and its associated penalties and the "carrot" approach of providing
incentives for various stakeholders to regulate themselves must be attained in order
to achieve sustainable development and management of solid waste policies and
strategies (O'Gallagher, 1990: 65).
Indeed, according to Rasmussen and Vigso (2005, cited in Australian
Government Productivity Commission, 2006: 144), the waste management hierarchy
is only a simplified list of priorities that favours some waste management options
over others, and does not take into account the range of costs and benefits associated
with different waste management options. In essence, waste management policies
need to take account of the location, circumstance, and the overall cost and benefits
to the community, rather than simple adherence to the waste hierarchy (Australian
Productivity Commission, 2006: 340). An example to illustrate the above notion is
the call by the Bureau of Industry Economics (1993, cited in Commonwealth of
Australia, 1994: 109) to develop landfill that takes account of the perception of the
community and various social and physical costs such as the value of the landfill,
location and type of waste, environmental amenity and contingency costs, the
relationship between waste disposal charges and recycling levels, on-site retention of
waste and penalties for illegal disposal. Therefore, in order to achieve the best solid
waste management outcome for a particular area, good data that are based on robust
technical and economic analysis need to be collected in order to achieve asustainable
outcome (Scott et al., 2005).
35
3.4 Australian policy and legislative frameworks for solid waste
management
In Australia, as elsewhere, traditionally waste management was concerned
with any potential adverse outcomes of putrescible waste on public health (Scott et
al., 2005). From the early 1970s, the public has become increasingly concerned with
the effects of pollution on the environment, and eventually this concern has extended
to the management of solid waste (Australian Government Productivity Commission,
2006: 45).
Environmental policy and legislation is a state responsibility in Australia
(Hubick, 1991: 122). In essence, solid waste management is mainly under the
jurisdiction of each state in Australia. However, many of the policy responses
currently in place in the states have their origin in two key national policy initiatives
adopted in 1992: the National Waste Minimisation and Recycling Strategy
(NWMRS) and the National Kerbside Recycling Strategy (NKRS) (Australian
Government Productivity Commission, 2006: 46).
3.4.1 National Waste Minimisation and Recycling Strategy
(NWMRS)
Briefly defined, the goals of the NWMRS are to encourage the ecologically
sustainable non-wasteful use of resources; reduce potential hazards to human health
and the environment posed by pollution and wastes; and maintain or improve
environmental quality (Commonwealth Environment Protection Agency, 1992: 10).
In addition, it was also made clear in the NWMRS that governments should only
pursue waste-related policies if the policies maximised the net benefits to the
community (Australian Government Productivity Commission, 2006: 47). NWMRS
set the goals to reduce the amount of waste going to landfill site by 50 per cent by he
year 2000 and also provide support for the development of new waste management
and environmental technologies (Commonwealth Environment Protection Agency,
1992: 12). Flowing from that, in order to achieve this goal, the roles of extended
producer responsibility and product stewardship schemes were emphasised in the
36
NWMRS (Australian Government Productivity Commission, 2006: 47). These
schemes place greater responsibility on producers for recovery or disposal of specific
goods. Extended producer responsibility (EPR) involves policies that make
producers (at least partially) responsible for waste treatment and/or disposal of their
products or goods (Lindhqvist, 2000). The responsibility assigned to producers does
not make it necessary to physically take back goods and process or dispose of them,
rather, producers could be made responsible for financing such activities by others
(Australian Government Productivity Commission, 2006: 260). Within Australia,
although some agencies questioned the efficiency of just targeting producers, given
that many parties are involved in a product's life cycle, many local governments do
favour EPR (Australian· Government Productivity Commission, 2006: 260). The
most common initiatives practised within Australia are take-back requirements and
deposit refunds such as those on beverage containers under the container deposit
legislation prescribed in the Environment Protection Act 1993 in South Australia
(Environment Protection Authority SA, 1998).
3.4.2 National Kerbside Recycling Strategy (NKRS)
This strategy was developed to complement and advance some of the policy
actions outlined in the NWMRS (Australian Government Productivity Commission,
2006: 47). Recycling targets were agreed between local governments and industries
for materials such as plastic containers, glass, aluminium and steel cans, newsprint
and paper (Australian Government Productivity Commission, 2006: 45). Some of the
policies of the NKRS that guided the development of industry action plans and state
and local government solid waste management plans are those such as the target that
more than 90 percent of urban households should have a regular kerbside recycling
collection by June 1994, and at least 60 percent of households with access to
kerbside collections should use it at least once a month by June 1993 (Australian
Productivity Commission, 2006: 48).
37
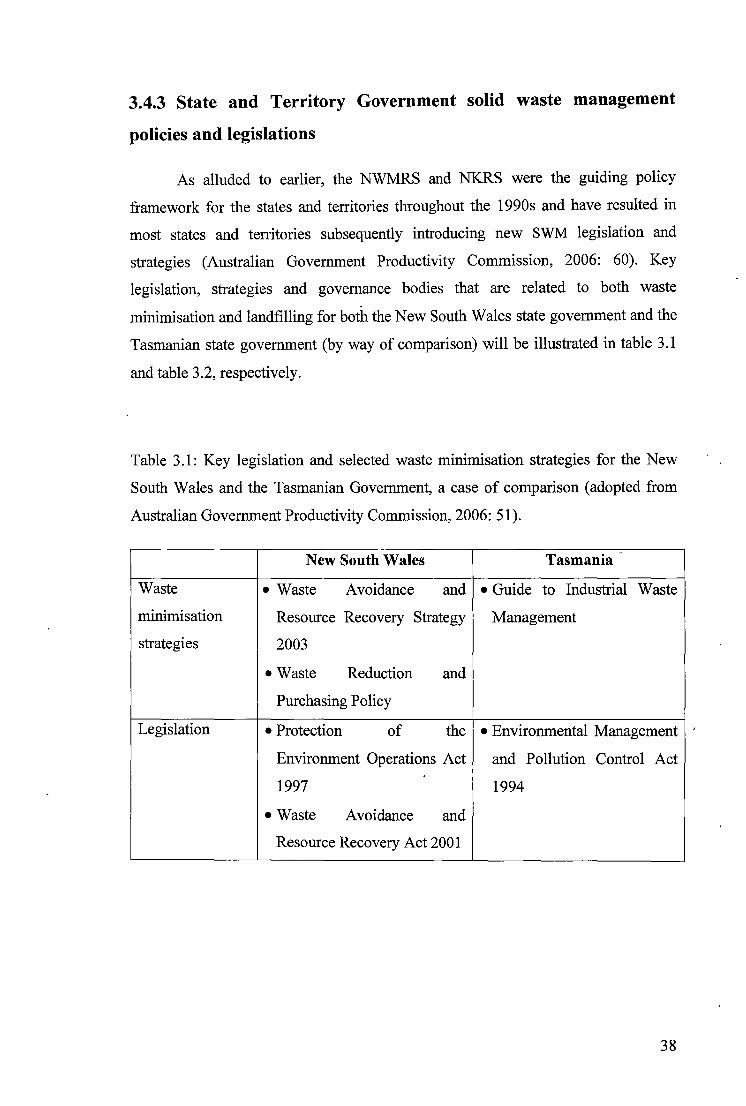
3.4.3 State and Territory Government solid waste management
policies and legislations
As alluded to earlier, the NWMRS and NKRS were the guiding policy
framework for the states and territories throughout the 1990s and have resulted in
most states and territories subsequently introducing new SWM legislation and
strategies (Australian Government Productivity Commission, 2006: 60). Key
legislation, strategies and governance bodies that are related to both waste
minimisation and landfilling for both the New South Wales state government and the
Tasmanian state government (by way of comparison) will be illustrated in table 3.1
and table 3.2, respectively.
Table 3.1: Key legislation and selected waste minimisation strategies for the New
South Wales and the Tasmanian Government, a case of comparison (adopted from
Australian Government Productivity Commission, 2006: 51 ).
~
New South Wales Tasmania
Waste • Waste Avoidance and •Guide to Industrial Waste
minimisation Resource Recovery Strategy Management
strategies 2003
•Waste Reduction and
Purchasing Policy
Legislation • Protection of the • Environmental Management
Environment Operations Act and Pollution Control Act
1997 1994
•Waste Avoidance and
Resource Recovery Act 2001
38
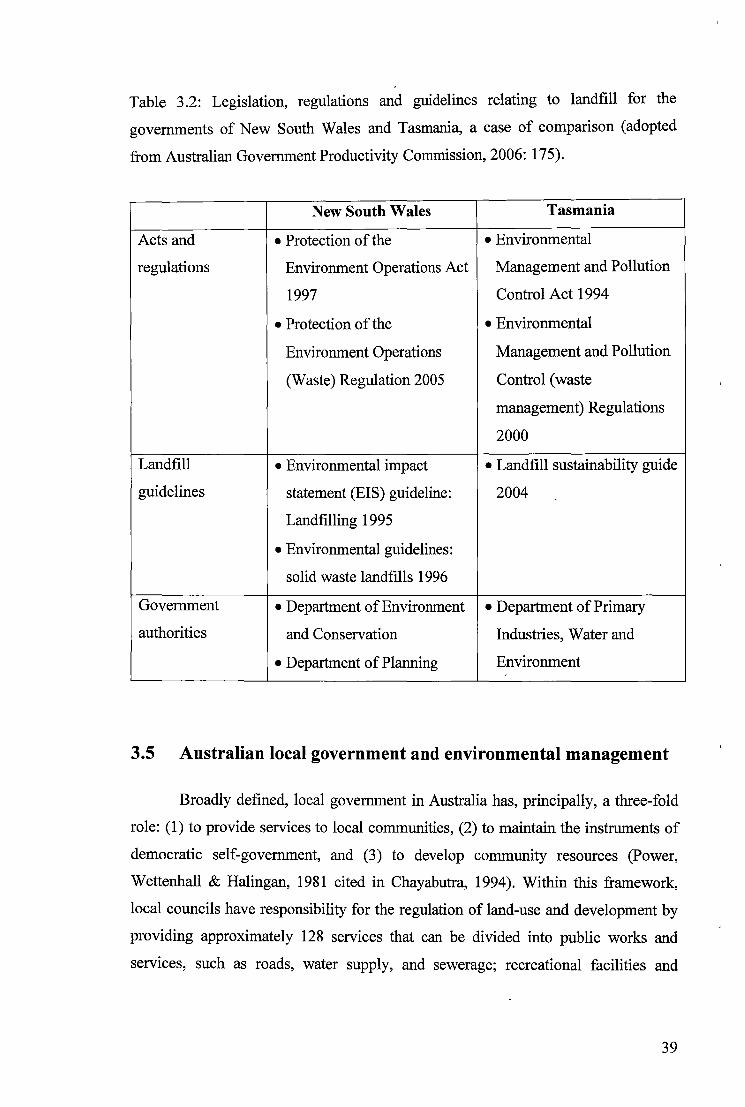
Table 3.2: Legislation, regulations and guidelines relating to landfill for the
governments of New South Wales and Tasmania, a case of comparison (adopted
from Australian Government Productivity Commission, 2006: 175).
New South Wales Tasmania
Acts and • Protection of the • Environmental
regulations Environment Operations Act Management and Pollution
1997 Control Act 1994
• Protection of the • Environmental
Environment Operations Management and Pollution
(Waste) Regulation 2005 Control (waste
management) Regulations
2000
Landfill • Environmental impact • Landfill sustainability guide
guidelines statement (EIS) guideline: 2004
Landfilling 1995
•Environmental guidelines:
solid waste landfills 1996
Government • Department of Environment • Department of Primary
authorities and Conservation Industries, Water and
• Department of Planning Environment
3.5 Australian local government and environmental management
Broadly defined, local government in Australia has, principally, a three-fold
role: (1) to provide services to local communities, (2) to maintain the instruments of
democratic self-government, and (3) to develop community resources (Power,
Wettenhall & Halingan, 1981 cited in Chayabutra, 1994). Within this framework,
local councils have responsibility for the regulation of land-use and development by
providing approximately 128 services that can be divided into public works and
services, such as roads, water supply, and sewerage; recreational facilities and
39
services such as parks; and community facilities and services, such as the removal of
solid and liquid waste (Cutts & Osborn, 1989: 10).
3.5.1 Local government and the solid waste management system
As mentioned earlier, in terms of solid waste management, state
governments' solid waste management policies mainly stem from the two national
frameworks of NWMRS and NKRS. In tum, local governments adopt these solid
waste management policies (Commonwealth of Australia, 1994: 209). Specifically,
local governments are normally responsible for land-use planning and development
approvals within their boundaries, and also responsible for the collection and
disposal of municipal solid waste (Australian Government Productivity Commission,
2006: 339), while the monitoring, regulatory and enforcement matters are the
responsibility of the State (Commonwealth of Australia, 1994: 212). A generally
accepted rule for apportioning responsibilities for providing public services among
the different tiers of government, called the subsidiarity principle, is that decisions
where the impact is restridt:u lo a local area should be made at the local level
(Australian Government Productivity Commission, 2006: 339). If the impact of solid
waste management responsibilities goes beyond local government boundaries- for
instance, because of scale economies- there is a case for assigning these
responsibilities to a higher level of government (Australian Government Productivity
Commission, 2006: 400). In essence, although these activities are carried out at a
local level, they are not all controUed by local government, with the degree of
authority varying from state to state depending on state laws (Chayabutra, 1994).
As a result of these responsibilities, in many instances there is overlap
between the responsibilities of state departments and local government, which can
result in conflict of interest or ambiguity over the responsibilities (Chayabutra, 1994;
Commonwealth of Australia, 1994: 209). In addition, there was a concern over the
lack of knowledge of a number of local councils about the solid waste management
options and the state policies that they were required to implement (Australian
Government Productivity Commission, 2006: 336 Commonwealth of Australia,
1994: 209). For instance, local governments in the Hobart area were required by the
40
Tasmanian Government to upgrade all sewage treatment plants to secondary
treatment by June 1994. This subsequently resulted in pressure on local governments
and generated many internal and external problems (Chayabutra, 1994).
3.5.2 Problems in solid waste management faced by local
governments
Due to the gap mentioned above, the most common barriers faced by local
governments in terms of implementing solid waste management policies
(Commonwealth of Australia, 1994: 210) include:
• a multiplicity of state and local approval systems with contradictory
requirements;
• lack of financial and physical support by state government resulting in
constraints on a market based property development system on which local
government income depends; and
• lack of knowledge, resources and skills transfer from state government to
local government level resulting in poorly developed policy framework.
Indeed, a survey by the University of New South Wales found that of the
local government planners who considered themselves well informed, only one third
were aware of State government reports, and less than a quarter were familiar with
Commonwealth Government information (Brown, Orr & Smith, 1992: 11). A
separate survey by the University of Western Australia, found that most local
government staff considered their information sources to be out-of-date and
inadequate and obtained their information primarily through informal
communication such as personal contacts (Brown et al., 1992: 61).
Due to this inconsistency faced by local governments, the Australian
Government Productivity Commission (2006: 396) has called for the Australian
Government to play a more active and significant role than it has in the past by:
• Working with the state governments to develop and implement consistent waste
classification systems and databases- At a minimum, this would help ensure that
41
more consistent data was collected (which in turn would assist with monitoring
and benchmarking performance), and that similar processes would apply from
state governments to local governments. This work would lay the foundation for
exploring opportunities to achieve further consistency in regulatory standards
applying to solid wastes.
• Refining information, education and awareness programs to help ensure the
local government is well informed about waste management issues and policies
In particular, effort should be directed at addressing the current 'knowledge gap'
between state and local governments.
• Facilitating research into the significant externalities caused by waste disposal
The Australian Government could provide a central coordinating role in ensuring
a more robust analysis of environmental issues is undertaken. There may be
scope for this to be done on a collaborative basis, involving the state and local
governments and research institutions, such as the CSIRO and the universities.
3.6 Summary
Chapter 3 details SWM in Australia. Specifically, it describes the strategies
that are emphasised by the Australian government, solid waste management issues in
Australia, followed by the policy and legislative frameworks that are related to solid
waste management in Australia. Lastly, it examises the role state and local
governments have in SWM in Australia, and the most common problems faced by
local governments in dealing with SWM.
42
Chapter 4: Solid waste management in Vientiane, Lao PDR
4.1 Solid waste management issues
Waste management is one of the most common and most serious problems in
many countries, especially in the least developed countries, and Laos is grouped in
that category. The main concern currently is the problem of large volumes of waste
in Lao PDR. While the quantities of waste being produced each day increase, Laos
still does not have a proper SWM system incorporating waste collection, recycling,
and disposal services. In addition, the majority of Lao people do not truly understand
the potential risks associated with poor waste management systems (Khanah &
Souksavath, 2005). Even though there are a number of projects designed to improve
the SWM system _in Vientiane as well as in other towns around the country, SWM in
Laos still has a long way to go in order to achieve the object of sustainable
development. These issues are discussed in greater detail below.
Waste generation in Vientiane Municipality
According to the WHO (2005) in 2001, approximately 91,250 tons of solid
waste was generated in the Vientiane Municipality. This equates to solid waste
production on average of 0.75 kg per person per day with a daily total estimat~ of
250 tons (WHO, 2005). Of this estimate, only 80 - 100 tons are collected and
disposed of at the municipal landfill site (ADB, 2003). In general, solid waste
consists of approximately 30 per cent organic matter, 30 per cent plastic, 15 per cent
paper, and 25 per cent glass, cans, and other metals (STEA, 2000 cited in UNEP,
2001 & WHO, 2005). Hazardous and toxic wastes, however, are often mixed with
municipal wastes, and no segregation is required (WHO, 2005). With the average per
capita waste production changing gradually the population increase becomes the
principal source of additional pressure on municipal waste management in Laos
(STEA & UNEP, 2006).
43
SWMsystem
Waste collection services in Laos are limited to geographically accessible
areas, markets, and economically profitable groups, such as high-income residents
(STEA & UNEP, 2006). Waste collection does not occur in many remote areas. The
result has been that a number of residents still resort to burning and dumping their
waste. Waste collection services cannot cover many areas due to lack of financial
resources. For example, the fees are too low to compensate government and private
contractors for the cost of municipality solid waste collection and disposal (Khanah
& Souksavath, 2005). Secondly, most residents are reluctant to pay the monthly
waste collection fees (partly because of the insufficient service provided to them). In
addition, insufficient and poor maintenance of equipment, and inadequate staffing
makes providing SWM services problematic (Khanah & Souksavath, 2005).
The landfill sites in Laos are inadequate and do not meet international
environmental standards (STEA & UNEP, 2006). While there are only five landfills
in the whole country, only Vientiane and another town (Luangprabang) have barely
sufficient separation of hazardous waste from the rest (STEA & UNEP, 2006).
However, landfill in Vientiane is still being poorly managed in terms of effectively
protecting the environment and health of the surrounding communities (ESL, 2004a).
Landfill sites, such as the old Vientiane landfill, "Km 18"2, are not regularly covered
with soil, have no leachate control, the site is surrounded by agricultural land, and it
was accessible to scavengers and animal (World Bank, 2005). During the rainy
season (July to October), the landfill operations are subject to significant seasonal
fluctuations, with the quantities and weight of solid waste rising substantially, as it is
too wet to bum waste easily (STEA & UNEP, 2006).
Low public awareness
The factors that contribute to the underdevelopment of SWM are: (i) lack of
concern among communities as to the importance of environmental impacts; (ii) lack
of motivation to reduce waste generation; and (iii) peoples' unwillingness to separate
their waste making it difficult to recycle (Khotsay & Vilaythong, 2005). According
to Furedy (1993), because solid wastes in Asian cities normally comprise 70 to 80
per cent organic material including dirt and dust, composting has long been
2 Called Km 18 because it is located 18 kms from the city of Vientiane. The new site is called Km 36
because it is 36 km from the city
44
considered the main technique to reduce waste quantities for municipal disposal.
Khotsay and Vilaythong (2005) also mention that in some poor areas in Vientiane,
there is virtually no support for resident's community managed practices had to
dealing with solid waste. In other words, the environmental conditions in these areas
are affected badly by the lack of waste collection from households (Khotsay &
Vilaythong, 2005). In addition, the on-going practices by local householders of
burning mixed waste, particularly plastic and rubber, in the backyard contributes to a
serious air pollution problem in urban areas (Khotsay & Vilaythong, 2005).
4.2 Legislative framework
Lao PDR has developed a number of policies, laws, and regulations relevant
to environmental protection, energy, forestry, and foreign investments. However,
there are currently no specific waste management regulations (Khanal & Souksavath,
2005). While the SWM legislative framework crosses a number of government
sectors, including environment, human health and urban infrastructure, it is one of
the difficulties in progressing SWM regulation that it is typically defined as a uni
sectoral issue (ESL, 2004a). Because of this overlap, in many instances it is difficult
to establish which agency will take the lead role, particularly in countries that are
under-resourced in terms of their institutional capacity to create coherent
environmental policy (ESL, 2004a).
In 1990; the legal framework for SWM was recognised as deficient in that
there was no national waste management legislation, although the Ministry of Health
had prepared a Draft Guideline for health and hygiene, which included a chapter on
SWM (ESL, 2004a). After the 1992 Rio Earth Summit, Lao PDR established the
Science, Technology and Environment Organisation (STENO) directly under the
Prime Minister's Office (Khanah & Souksavath, 2005). Within STENO, the
Department of Environment (DOE) is delegated the specific task of environmental
management (Khanah & Souksavath, 2005). Within this framework, the authority to
manage solid waste lies with STENO at the national level, and with environmental
management and monitoring units at the ministerial, provincial, special zone,
municipal, district and village levels (Khanah & Souksavath, 2005). On the other
hand, the Science Technology and Environment Agency (STEA) is responsible for
the development of a legislative and regulatory framework for the environment
45
(ESL, 2004a). As a result, it is difficult to coordinate the roles between the two
agencies concerning SWM policy (Foppes, Teerawatsakul & Vest, 2001, cited in
ESL, 2004a). Therefore, while progress has been made, specific SWM legislation has.
not yet been established (Khotsay & Vilaythong, 2005).
The legislative frameworks dealing with SWM in Laos are outlined below:
• The Environment Protection Law of Lao PDR 1998;
• Draft National Health Regulation 2001;
• Guidelines for Hospital Waste Management 1997.
• Industrial Waste Discharge Regulation 1994;
• Provincial Decree for SWM in Vientiane 1999;
• Regulation on the Monitoring and Control of Waste Discharge 1998;
• Decree on the Management of Solid waste and the Cleaning of Public and
Residential Areas.
As mentioned earlier, there is no specific waste management regulation. The
Lao government has operated with unclear policy on waste management and·
operational guidelines. For instance, the Provincial Decree for SWM in Vientiane
(1999) provides the ability to fine the community littering or dumping waste.
However, the decree emphasises only road cleanliness instead of SWM practices
(ESL, 2004a). In addition, the Environment Protection Law (1999) is the principal
legislation in Laos, but references specifically to waste management are included
only in chapter 3, Article 23 Prevention Measures and Pollution Control (STEA &
UNEP, 2006), " ... All kinds of littering are forbidden. It is required to allocate waste
disposal sites, and to separate waste before its disposal. Technologies for waste
treatment, recycling of waste into production, and reuse must be supported. It is
forbidden to import, transport, and move any kind of hazardous waste through land,
water and sky border of the Lao PDR."
In short, the lack of law and legislation that deals directly with SWM poses
many problems for the Lao Government. According to STEA & World Bank (2005),
having different ministries responsible for the development of sectoral legislation
results in inconsistencies of legislation. Principle inconsistencies include conflict
provision, overlapping commands given to different ministries, poor implementing of
46
regulations and supporting environmental standards (STEA & World Bank, 2005).
Arguing along a similar line, Khanal & Souksavath (2005) contend that the
fundamental flaw of the over-arching legislation above, is its lack of effective
monitoring, data generation and enforcement that are usually required for SWM to
function effectively. The same authors also argue that this over-arching legislation
undervalues the need for strong and efficient administration that is required to
implement better pollution standards and monitoring guidelines for the practices of
SWM (Khanal & Souksavath, 2005). In addition, this over-arching legislation also
undermines the need for more sophisticated regulatory compliance staff and better
functioning administrative and political institutions (Khanal & Souksavath, 2005).
This can be illustrated by the example provided by the Japan International
Cooperation Agency (JICA) (1999). In that report, it was noted that the management
of solid waste in Vientiane rested poorly under the responsibility of the Department
of Communications, Transport, Post, and Construction (DCTPC). This department
was entrusted to collect waste from public institutions, hospitals and commercial
enterprises (JICA, 1999). This department further delegates its responsibilities to
private companies for waste collection (JICA, 1999). The Japan International
Cooperation Agency (1999) noted that without proper functioning administrative and
political institutions, this has resulted in a collection rate of 13 per cent (in 1999) in
residential areas and 22 per cent (1999) in commercial and business areas. As a
result, the majority of the uncollected waste is illegally dumped into rivers, drainage
or vacant lots in the city (Japan Cooperation Agency, 1999).
In addition, the lack of strong institutional structures with a strong legislative
framework has resulted in market-based incentives for SWM becoming predominant
in Laos (Khanal & Souksavath, 2005). The market-based incentives aim at
internalising environmental externalities by settling costs and benefits to influence
decisions and behaviours towards more environmentally desirable situations
(Australian Productivity Commission, 2006: 221). However, some scholars question
the validity of these initiatives, arguing that they allow people to 'pay to pollute'
since every household and commercial institution may generate any amount of waste
and then pay the charge (Khanal & Souksavath, 2005). Indeed, the same authors
argue that heavy reliance on these incentives for SWM in Laos does not change
public attitudes and behaviours towards minimising waste. Without strong legislative
47
framework, these incentives do not work effectively alone in the management of
solid waste (Khanal & Souksavath, 2005).
As a result of this weak legislative framework, Earth Systems Lao, an
environmental consultancy company in Lao, has proposed that a round table forum
between relevant ministries to assess the current status of laws and review roles and
responsibilities, is an essential first step in determining an effective pathway to
implementing national waste management (ESL, 2004a).
4.3 SWM initiatives and organisational involvements
So far only three big projects have supported SWM in Laos as outlined
below:
The first one is JICA which has been involved in SWM in Vientiane through
a number of studies since 1991 (ESL, 2004a). JICA provided the Ministry of
Communications, Transport, Post, and Construction (MCTPC) financial support for
SWM and it has also been working in coordination with the municipality and the
Urban Cleansing Service (UCS) (Khanah & Souksavath, 2005). In addition, JICA
helped to establish the collection system, landfill design, disposal techniques,
maintenance, purchase of waste collection vehicles, and metal solid waste bins (ESL,
2004a; and MacDonald, 2004). According to UNDP (2001, cited in Khanah &
Souksavath, 2005), the JICA project "Improvement of the Solid Waste Management
System in Vientiane Urban Area" provided heavy equipment and a maintenance
workshop to improve the Km 18 waste disposal landfill site (the old landfill), and
also provided safe drinking water to residents that live around the dumpsite.
Apart from JICA, the United Nations Development Programme (UNDP) is
another sector involved in waste management activities in Vientiane. UNDP tends to
focus more on raising public awareness, poverty reduction and income generation
from waste materials such as using food scraps for making natural fertiliser and
selling recyclables for extra income. According to ESL (2004b), the UNDP's Public
Private Partnerships for the Urban Environment (PPPUE) funded project,
"Integrated Solid Waste Management in Vientiane Municipality", during 2002 and
48
2003, had an objective to establish an effective community based system for SWM in
Vientiane. The project basically aims to:
• "improve the urban environment by developing and implementing the model for
waste management in urban area in Lao PDR,
• improve income generating activities for urban poor through the establishment of
small scale enterprises for the collection, separation, and recycling of waste"
(ESL, 2004b)
In addition, in 2004, the project continued an external Mid Term Review
(MTR) by examining the project's outcomes performance, and identifying problems
and suggesting improvements for effectiveness, operational efficiency and
management (ESL, 2004b ).
While UNDP was working on public awareness, the VUDAA requested the
Asian Development Bank (ADB) for finance through the Japan Fund for Poverty
Reduction (JFPR) for support to help the government prepare an innovative
environmental improvement project for the low-income areas as well as generate
income for the poor households in Vientiane Municipality (ADB, 2003). This project
is titled "Solid Waste Management and Income Generation for Vientiane's Poor".
The proposals for this project focus on (i) solid waste collection practices,
transportation and disposal services in poor communities; (ii) the capability to plan
and implement sustainable community-based SWM and (iii) generating profits and
supporting employment opportunities for waste pickers and poor residents (ADB,
2003). According to ESL (2004a), this project has the potential to join with the
UNDP project in order to increase the scope and expand its benefits. In addition, this
project gives UCS an opportunity to develop a creative and affordable model for a
waste collection service in cooperation with communities (ESL, 2004a). There is
another project that is based on an ADB loan to VUDAA which is the "Vientiane
Urban 1-nfrastructure and Services" project and this was implemented from March of
2002 to August 2007 (ADB, 2008). The overall aims ofthis project are to (i) improve
the quality of life of urban residents of Vientiane; and to (ii) enhance productivity
and economic growth (ADB, 2008). This project covered only four main districts in
Vientiane which are Chanthabury, Saysetha, Sisattanak, and Sikhottabong. The
sectors that were covered by the project are drainage, roads, traffic management and
49
road safety, sanitation, and SWM. In addition, the construction of VUDAA building
was also included in the project investment (ADB, 2008).
Apart from these three organisations, there are also some other initiatives that
have led to a number of activities in order to improve the waste management system
in Laos:
• A grant from the French Government for urban development in 1996 (a grant
roughly US$ 2.7 million) (ESL, 2004a);
• A Canadian grant for distribution of waste management and environmental
protection booklets (UCSC, 1999);
• The UCS established three workshops that focused on the improvement of
handling and disposal of medical wastes (ESL, 2004a);
• A collaboration of the Lao government and a non-government organisation
(NGO) which established the "Keep Vientiane Clean project with funding from
the Royal Netherlands Embassy (ESL, 2004a & P ADETC, 2008). There are
various parties in this project such as VUDAA, the Science Technology and
Environment office (STEO), the Participatory Development Training Centre
(PADETC)3, village authorities, recycle traders, the Lao Women's Union, the
National University of Laos (NUOL), and schools (ESL, 2004a). This project
aimed to improve urban waste management focussing on educational and training
programs for all stakeholders (communities and schools). In addition, this project
set up a private waste recycling centre, the Lao Chareon Recycling Centre, and
promoted recycling banks in schools and villages (ESL, 2004a & PADETC,
2008);
•
•
The ministry of Public Health and the World Health Organisation are constantly
promoting the treatment of hazardous and infectious waste in municipality
projects (Khanah & Souksavath, 2005).
A program called "Waste-Econ" run by the Department of Geography and the
Institute for Environmental Studies at the University of Toronto, and a number of
government institutions, universities, and non-governmental organisations based
3 PADETC is the private non-profit Lao institution. It provides waste management programs which
focuses on Lao communities, especially young people.
50
in Laos, Cambodia and Vietnam, joined with the National Science Council
(NSC) at the Prime Minister's Office in Vientiane to conduct research on waste
economy (Waste Econ, 2008). This was a six-year program (2000-2005) which
focused on the benefits to the economy and this included recycling, exchanging,
and reducing waste (Waste Econ, 2008). According to ESL (2004a), the program
delivered training programs; for instance, a workshop in Vientiane. In addition, a
pilot project was carried out researching the possibility of using organic waste
from markets in Vientiane (MacDonald, 2004).
4.4 Solid waste management in Vientiane
4.4.1 Responsibilities for SWM
Even though Vientiane is the centre for the country's economic,
educational, industrial, and business activities, it is faced with a number of
environmental problems in general and specifically with solid waste problems
(Khanah & Souksavath, 2005). At the national level, the MCTPC is responsible for
urban SWM (STEA & UNEP, 2006). The provincial office of the DCTPC controls
SWM at the provincial level (UNEP, 2001); for instance, the Vientiane Municipality
level. The responsibility for SWM infrastructure and services in Laos depends on the
district authorities and, for Vientiane Municipality, lies with the Vientiane Urban
Development Administrative Agency (VUDAA)4 (ESL, 2004a). At the district level,
there are village authorities and residents respectively. Figure 3 shows an outline of
the responsibilities of each organisation. The Urban Cleansing Service (UCS) is the
main authority that has been dealing with SWM in Vientiane since 1998 (Khanah &
Souksavath, 2005). It was established under the VUDAA and it provides cleansing
services, waste collection, transportation, and disposal for most residential,
institutional, and commercial sectors around Vientiane Municipality.
In addition, the Ministry of Public Health (MoH) is responsible particularly
for hospital and health sector waste and the Ministry of Industry and Handicraft
(MIH) is responsible for industrial waste management (STEA & UNEP, 2006).
4 VUDAA - a division that is responsible for urban services, planning, infrastructure, environment and
sanitation in Vientiane.
51
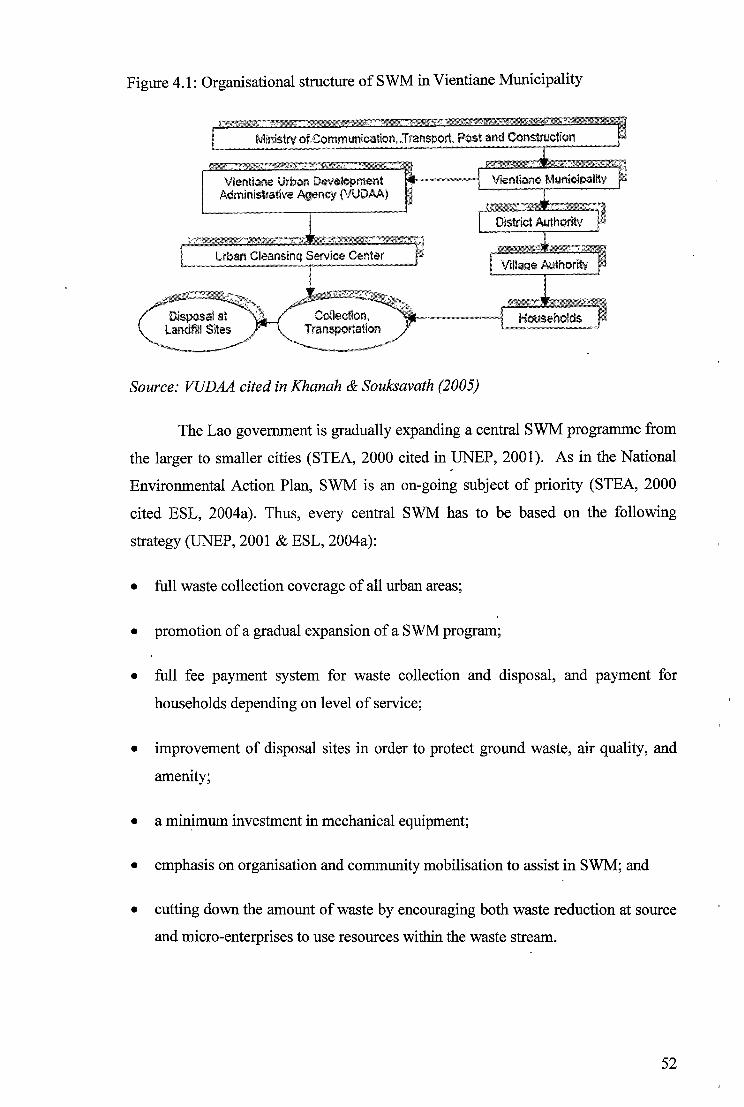
Figure 4.1: Organisational structure of SWM in Vientiane Municipality
Mir1i$tl'Y of, Communication .• Transport, Post and Construction
Vienti.:.ne Urb;nn Development Adminlst1ative Agency {VUDAA)
Lrban Cleansinq Service Center
Disposal at Landfill Sltes
"'--~,____....,....
Source: VUDAA cited in Khanah & Souksavath (2005)
The Lao government is gradually expanding a central SWM programme from
the larger to smaller cities (STEA, 2000 cited in UNEP, 2001). As in the National
Environmental Action Plan, SWM is an on-going subject of priority (STEA, 2000
cited ESL, 2004a). Thus, every central SWM has to be based on the following
strategy (UNEP, 2001 & ESL, 2004a):
• full waste collection coverage of all urban areas;
• promotion of a gradual expansion of a SWM program;
• full fee payment system for waste collection and disposal, and payment for
households depending on level of service;
• improvement of disposal sites in order to protect ground waste, air quality, and
amenity;
• a min.imum investment in mechanical equipment;
• emphasis on organisation and community mobilisation to assist in SWM; and
• cutting down the amount of waste by encouraging both waste reduction at source
and micro-enterprises to use resources within the waste stream.
52
4.4.2 Waste disposal and landfill site
In terms of waste management, it is obviously of concern that the majority of
Lao people who still either bum or dump in low-lying plots or water bodies (STEA
& UNEP, 2006 and MacDonald, 2004). Hazardous and toxic wastes, for example,
batteries, paint cans, aerosols and other unused wastes, are usually mixed with
organic material, plastic, paper, glass, and other metals (World Bank, 2005). This
mixture of wastes can clearly be seen at the landfill. However, unwanted large
materials such as fridges, washing machines, and furniture are traditionally given
away to someone else or sold to the shops in order to be reused. Hence, this
component of the waste management stream is not as problematic as it is in
developed countries (Becklake, 1991: 6).
Because of the small disposal areas, there are still no leachate collection or
monitor wells (World Bank, 2005). Household waste remains of concern around the
country. According to ESL (2004a), over the last decades, economic development
has brought about growing incomes and greater access to consumer goods. Because
traditional consumption patterns have changed and the waste stream composition
also has changed with a growth in plastics and a related decrease in organic
materials, traditional methods of waste disposal are no longer appropriate (ESL,
2004a).
Currently, there is a new dumping site located at 36 kilometres southeast of
Vientiane city. This landfill site opened in 2007 after the km 18 landfill was full (the
next chapter describes the capacity of the Km 36 landfill). Even though the landfill at
km 18 was actually constructed for a fifteen year lifespan and had a maximum
capacity of 900,000 tons to be reached in 2010 (MacDonald, 2004), it has been
closed for dumping rubbish and it is planned to develop the site as a golf course.
According to Toowoomba Regional Council (2008), it is common to use full landfills
as community sites, for instance, parks, sports areas, wildlife habitats, and golf
courses. However, there are various considerations such as time and effort for
replanting trees and shrubs due to low nutrient content, heavily compacted soils and
the production of methane (Toowoomba Regional Council, 2008). In the case of Km
18 landfill site, there are risks which need to be considered with this golf course
development which include land submergence if the landfill decays and it has not
been compacted properly and the production of methane gas.
53
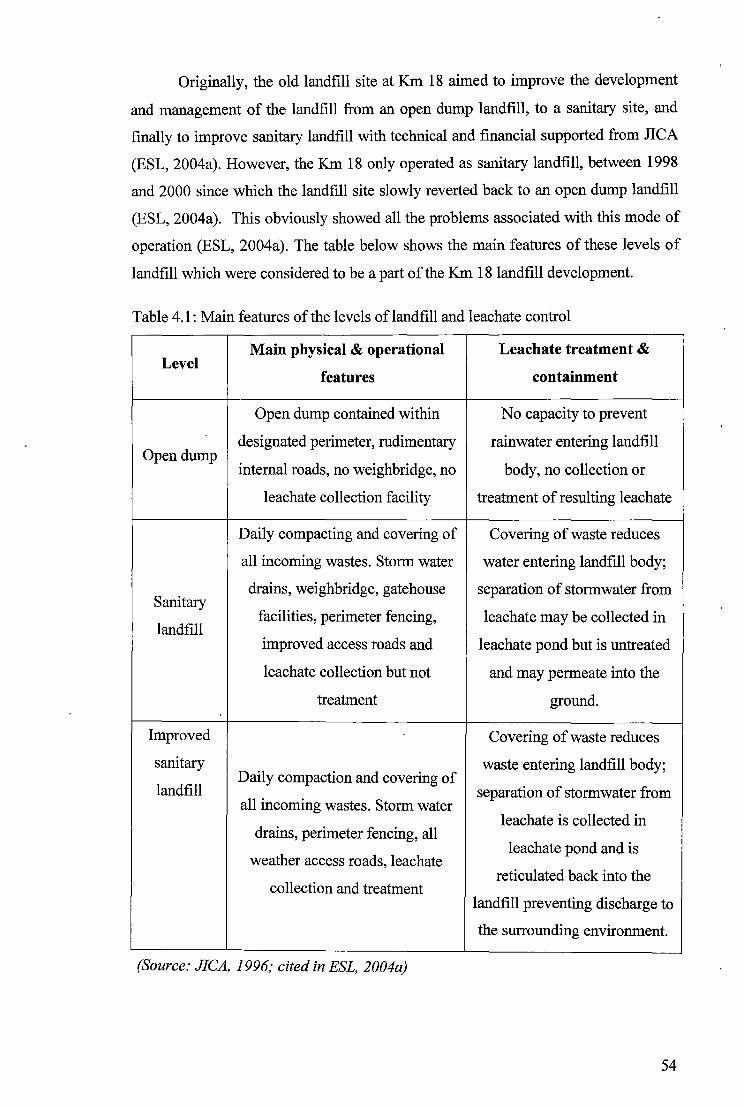
Originally, the old landfill site at Km 18 aimed to improve the development
and management of the landfill from an open dump landfill, to a sanitary site, and
finally to improve sanitary landfill with technical and financial supported from IlCA
(ESL, 2004a). However, the Km 18 only operated as sanitary landfill, between 1998
and 2000 since which the landfill site slowly reverted back to an open dump landfill
(ESL, 2004a). This obviously showed all the problems associated with this mode of
operation (ESL, 2004a). The table below shows the main features of these levels of
landfill which were considered to be a part of the Km 18 landfill development.
Table 4.1: Main features of the levels of landfill and leachate control
Main physical & operational Leachate treatment & Level
features containment
Open dump contained within No capacity to prevent
Open dump designated perimeter, rudimentary rainwater entering landfill
internal roads, no weighbridge, no body, no collection or
leachate collection facility treatment of resulting leachate
Daily compacting and covering of Covering of waste reduces
all incoming wastes. Storm water water entering landfill body;
Sanitary drains, weighbridge, gatehouse separation of stormwater from
landfill facilities, perimeter fencing, leachate may be collected in
improved access roads and leachate pond but is untreated
leachate collection but not and may permeate into the
treatment ground.
Improved Covering of waste reduces
sanitary Daily compaction and covering of
waste entering landfill body;
landfill separation of stormwater from all incoming wastes. Storm water
leachate is collected in drains, perimeter fencing, all
leachate pond and is weather access roads, leachate
reticulated back into the collection and treatment
landfill preventing discharge to
the surrounding environment.
(Source: JICA, 1996; cited in ESL, 2004a)
54
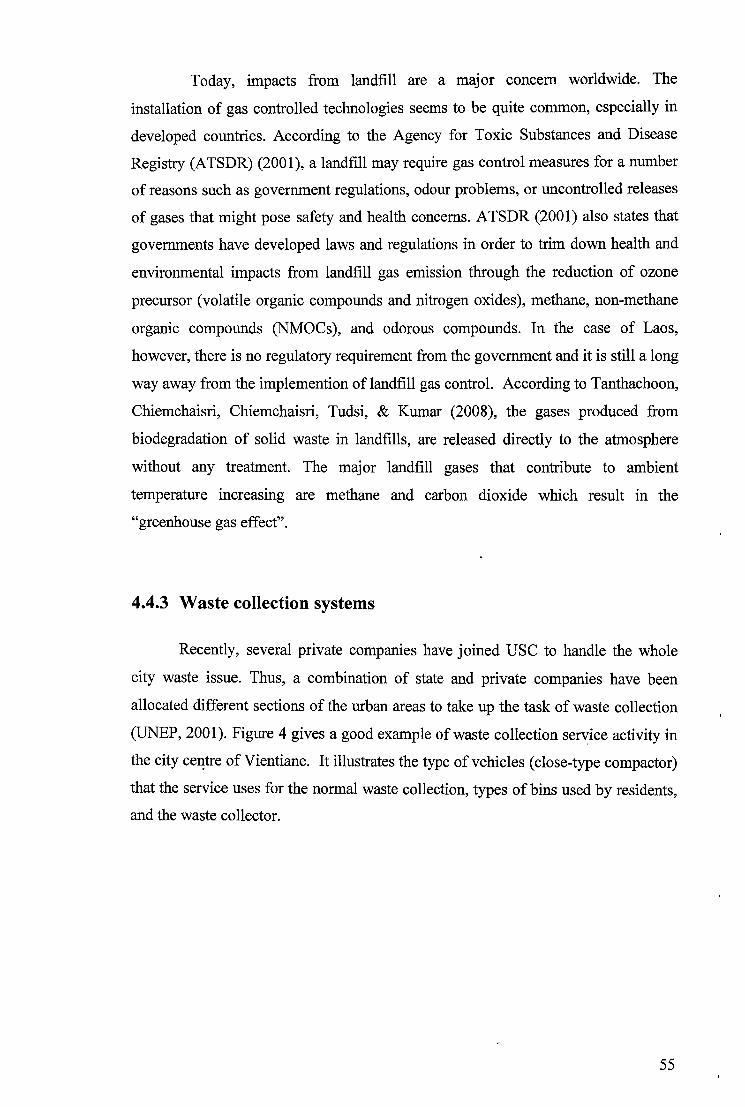
Today, impacts from landfill are a major concern worldwide. The
installation of gas controlled technologies seems to be quite common, especially in
developed countries. According to the Agency for Toxic Substances and Disease
Registry (ATSDR) (2001 ), a landfill may require gas control measures for a number
of reasons such as government regulations, odour problems, or uncontrolled releases
of gases that might pose safety and health concerns. ATSDR (2001) also states that
governments have developed laws and regulations in order to trim down health and
environmental impacts from landfill gas emission through the reduction of ozone
precursor (volatile organic compounds and nitrogen oxides), methane, non-methane
organic compounds (NMOCs ), and odorous compounds. In the case of Laos,
however, there is no regulatory requirement from the government and it is still a long
way away from the implemention of landfill gas control. According to Tanthachoon,
Chiemchaisri, Chiemchaisri, Tudsi, & Kumar (2008), the gases produced from
biodegradation of solid waste in landfills, are released directly to the atmosphere
without any treatment. The major landfill gases that contribute to ambient
temperature increasing are methane and carbon dioxide which result in the
"greenhouse gas effect".
4.4.3 Waste collection systems
Recently, several private companies have joined USC to handle the whole
city waste issue. Thus, a combination of state and private companies have been
allocated different sections of the urban areas to take up the task of waste collection
(UNEP, 2001). Figure 4 gives a good example of waste collection service activity in
the city cel!tre of Vientiane. It illustrates the type of vehicles (close-type compactor)
that the service uses for the normal waste collection, types of bins used by residents,
and the waste collector.
55
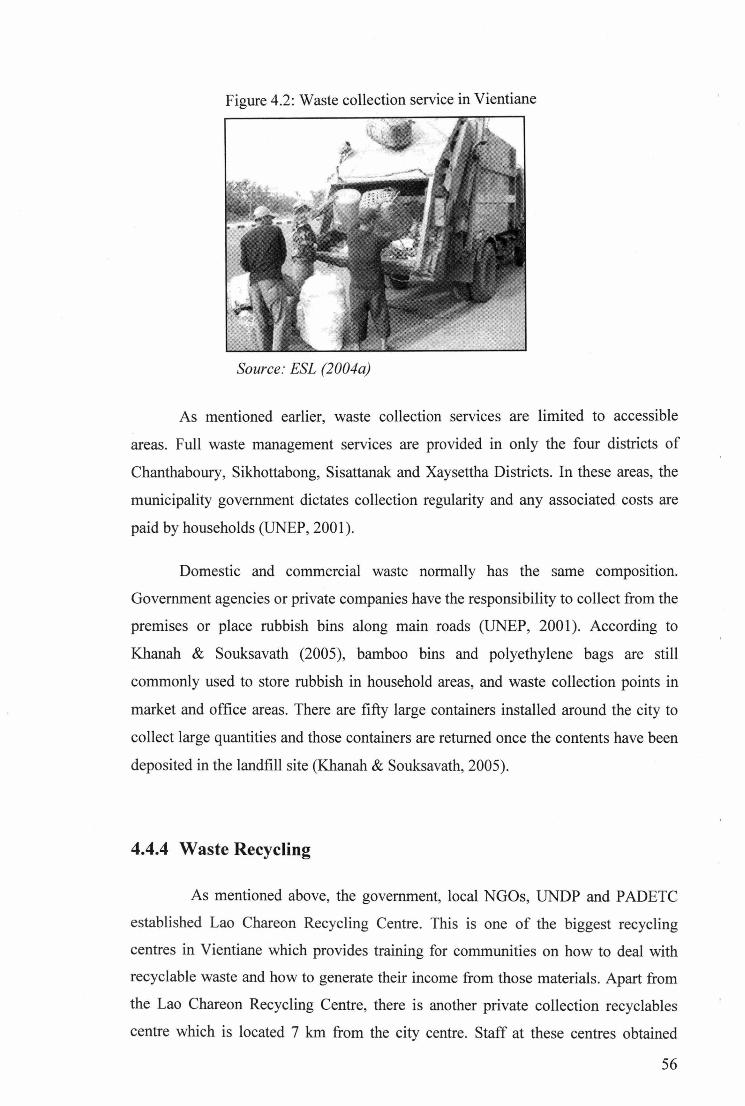
Figure 4.2: Waste collection service in Vientiane
Source: ESL (2004a)
As mentioned earlier, waste collection services are limited to accessible
areas. Full waste management services are provided in only the four districts of
Chanthaboury, Sikhottabong, Sisattanak and Xaysettha Districts. In these areas, the
municipality government dictates collection regularity and any associated costs are
paid by households (UNEP, 2001).
Domestic and commercial waste normally has the same composition.
Government agencies or private companies have the responsibility to collect from the
premises or place rubbish bins along main roads (UNEP, 2001). According to
Khanah & Souksavath (2005), bamboo bins and polyethylene bags are still
commonly used to store rubbish in household areas, and waste collection points in
market and office areas. There are fifty large containers installed around the city to
collect large quantities and those containers are returned once the contents have been
deposited in the landfill site (Khanah & Souksavath, 2005).
4.4.4 Waste Recycling
As mentioned above, the government, local NGOs, UNDP and PADETC
established Lao Chareon Recycling Centre. This is one of the biggest recycling
centres in Vientiane which provides training for communities on how to deal with
recyclable waste and how to generate their income from those materials. Apart from
the Lao Chareon Recycling Centre, there is another private collection recyclables
centre which is located 7 km from the city centre. Staff at these centres obtained
56
training at the Wongpanit Recycling Company (a Thai company) and also received
follow-up and support from P ADETC (Khanah & Souksavath, 2005). In addition,
this recycling centre mainly buys recyclable wastes and exports them to
neighbouring countries such as Thailand or Vietnam.
The Lao Chareon Recycling Centre has promoted the development of
recycling banks which buy or collect recyclable materials from individuals around
the city area, members of the informal sector (waste pickers and scavengers at the
landfills), communities and schools (Manivong, 2004 cited in MacDonald, 2004).
There are now around thirty recycling banks that operate in Vientiane and these
include twenty in communities and ten in schools (Khanah & Souksavath, 2005). A
number of recycling banks were funded by the Royal Dutch Embassy and the
German donor GTZ5 (ESL, 2004b). In addition, these recycling banks were created
to receive recyclable waste from households that had been trained .to separate the
organic and residual household wastes from the recyclable materials (ESL, 2004b ).
According to Khanah & Souksavath (2005), most students and teachers in the
schools are operating and managing the banks as an additional curricular activity.
Once the banks are full, they normally contact the recycling centre and then sell their
wastes (Khanah & Souksavath, 2005). The pricing system for waste . purchase
depends on the different waste categories that communities bring to deposit in the
recycling banks (P ADETC, 2008). In order to reduce the volume of wastes that goes
to the landfill, recycling activities are being encouraged for all communities in
Vientiane Municipality as well as the whole country. Laos has applied a deposit -
refund system for most recyclable materials such as bottles, cardboard, plastics, and
papers. This system is basically like a tax on the purchase of a product with subsidy
for returning the used item to a designated collection site (NCEE, 2001 ). The idea of
the refund system is to encourage individuals and firms to dispose of those used
items in an environmentally acceptable method (NCEE, 2001). Thus, this is the most
effective way to encourage people to return the recyclable products. In Vientiane,
most of the drink bottles are traditionally returned back to the shop. In particular for
beer bottles, a deposit of 1 OOO kip (US$ 0.10) is required (Khanah & Souksavath,
2005). In addition, some households donate the recycling materials such as glass and
plastic bottles and car batteries to waste dealers and pickers, and most of the broken
5 GTZ (Gesellschaft fur Technische Zusammenarbeit) is an international cooperation enterprise for
sustainable development.
57
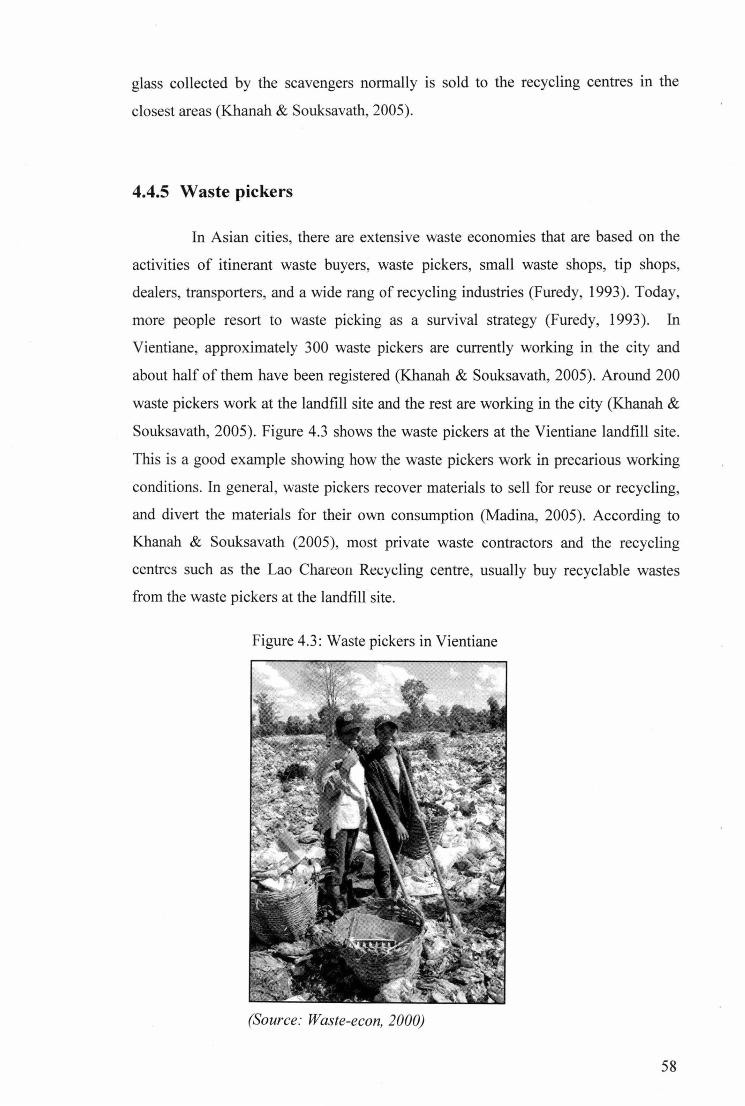
glass collected by the scavengers normally is sold to the recycling centres in the
closest areas (Khanah & Souksavath, 2005).
4.4.5 Waste pickers
In Asian cities, there are extensive waste economies that are based on the
activities of itinerant waste buyers, waste pickers, small waste shops, tip shops,
dealers, transporters, and a wide rang of recycling industries (Furedy, 1993 ). Today,
more people resort to waste picking as a survival strategy (Furedy, 1993). In
Vientiane, approximately 300 waste pickers are currently working in the city and
about half of them have been registered (Khanah & Souksavath, 2005). Around 200
waste pickers work at the landfill site and the rest are working in the city (Khanah &
Souksavath, 2005). Figure 4.3 shows the waste pickers at the Vientiane landfill site.
This is a good example showing how the waste pickers work in precarious working
conditions. In general, waste pickers recover materials to sell for reuse or recycling,
and divert the materials for their own consumption (Madina, 2005). According to
Khanah & Souksavath (2005), most private waste contractors and the recycling
centres such as the Lao Chal'eou Rel:yding centre, usually buy recyclable wastes
from the waste pickers at the landfill site.
Figure 4.3: Waste pickers in Vientiane
(Source: Waste-econ, 2000)
58
Waste pickers are in contact with waste everyday. They are often associated
with dirt, disease, squalor, and perceived as a nuisance, a symbol of backwardness
and even as criminals (Medina, 2005). As mentioned above, the "Solid Waste
Management and Income Generation for Vientiane's Poor" project was supported to
improve the municipal landfill conditions (the old landfill at Kml 8). It established a
waste pickers' multipurpose centre (WMC) which provides a training and reference
center for waste pickers and residents to increase income, promote work safety
amongst waste pickers and workers at the landfill, and improve management
capability of the municipal landfill authority (ADB, 2003).
4.5 Summary
This chapter describes the waste management practices and issues
associated with solid waste management in Laos. In general, the main concern in
regards to solid waste in Vientiane, is the increase in the waste volume, the poor
SWM system, and low public awareness. Furthermore, this chapter also describes the
legislative framework relating to the management of solid waste in Lao followed by
the organisations involved. Specifically, this chapter focuses on SWM in Vientiane
which includes the responsibilities for SWM, waste disposal and landfill site, waste
collection service, waste recycling, and waste pickers in Laos.
59
Chapter 5: A survey of solid waste management in Vientiane
5.1 Purposes of the survey
This chapter by way of a survey the status of SWM activities in Vientiane
Municipality, Lao PDR. The main purpose of this survey is to identify gaps and
potential improvements for SWM in Vientiane Municipality. Therefore, the focus is
on the quality of solid waste services and the perspectives of the community towards
their waste services. In addition, it explores householders' behaviours, for instance,
the way that householders dispose of their waste. Lastly, opinions on how to improve
waste services for both residents and service providers are highlighted.
Basically, the survey focuses on the stakeholders that are involved in the
SWM. This includes three main players: (i). the government, (ii). the private sector,
and (iii). residents. This chapter describes SWM of both government and the private
sector, and also examines the roles of those two sectors in terms of waste collection
and disposal practices. The government in this context is the VUDAA, which is the
main agency responsible for Vientiane's infrastructure and services. In 1998,
VUDAA formed the UCS as a component of urban infrastructure and services
(collection, transpo_rtation, and disposal), and as a dedicated SWM institution within
VUDAA (ESL, 2004a).
"' There is also a number of private waste companies that are involved in
managing SWM in Vientiane. The majority of them provide waste collection
services for a number of industries, institutions, and households. Hence, it is
important to involve some of those private companies in this study. Two private
waste contractors were selected. Chanthabury Cleansing Company, and Lao Garbage
Company. It is important to obtain information about how they organise and manage
their services to the public in order to understand their operations, the drivers and
impediments to improving waste management.
60
As mentioned in chapter one, for logistical reasons, two districts in the rural
area were excluded. Since, the government and private sector do not provide services
to these two areas, information is difficult to obtain.
The reasons behind the household survey are to understand urban and rural
residents' perceptions of waste management and to obtain a comprehensive overview
of SWM in urban versus rural areas. Subsequently, this allows for acquiring
information on management practices and associated problems in these respective
areas.
In essence, this survey solicits opinions or feedback from the three groups
of players to enable identification of opportunities, weaknesses, and hurdles. The
outcome component of the survey comprises quantitative analysis. Quantitative
analyses include secondary data analysis and the stakeholder survey. The secondary
data analysis includes measurement and analysis of existing reports and literature
that are related to SWM in Vientiane Municipality. The stakeholder survey solicited
stakeholders' opinions, the current situation of SWM practices, systems, and waste
management services in order to suggest ways to rectify the problems that those
stakeholders still face.
It needs to be noted that the term "village" has two connotations in Laos. In
rural areas, a village is a discrete entity areas but in urban areas villages flow into and
about one another. The term village is used in reference to the level of organisation
where a village head is represents the party and responsible for local management.
5.2 Methodology
First, the method for this study was to review all relevant literature that is
associated with SWM in Vientiane, Lao PDR. The literature reviewed documentation
related to previous and current waste management projects. These documents include
articles from web sites, reports and papers obtained from the government and
NGOs/intemational organisations and private companies. Interviews were conducted
with three stakeholders: VUDAA (government), two private waste contractors and
local residents.
61
The research methodology consisted of two survey questionnaires. The
first was administered to the VUDAA and two private waste providers, and the other
to 102 households in both urban and rural areas in Vientiane Municipality. However,
the questionnaires for VUDAA and private waste contractors are slightly different
from the household questionnaire. The questionnaires for each sector are shown in
~ppendix 1, 2 and 3, pp 103, 109 and 113 accordingly. The questionnaires were
translated into Lao. Back translations and successive revision of the two different
language versions of the questionnaires were conducted by native language speakers.
The interview processes were undertaken by the environmental consultancy
company, Earth Systems Laos (ESL) and six people were hired to conduct the
household survey. Earth Systems Laos and the six people were contacted via e-mail
and telephone communication. All of the subjects had been informed of the process
of the survey and invited to participate on a voluntary basis. Both government and
the private sector had nominated their respective managers to answer the
questionnaires. This is because the managers were the key personnel responsible for
waste management services and have a complete overview of the company's
operations.
The interview forms for VUDAA and the two private waste contractors
were delivered and collected by ESL. The survey process started around the end of
May, 2008 and the first questionnaire was returned from Lao Garbage Company
within three weeks. The following questionnaire received was the Chanthabury
Cleansing Company (within four weeks). VUDAA took more than two months to
return the survey questionnaire. According to VUDAA, the reason for this delay was
because only one person could answer the questionnaire and that person was not
available at that stage.
For the household survey, households were selected on a random basis in
the three chosen districts of Chanthabury, Sekhottabong, and Xaithany. Both
Chanthabury and Sekhothabong are located in the urban area, and Xaithany is in the
rural area. Fifty survey questionnaires were randomly distributed to Chanthabury and
Sekhothabong district. Xaythany was allocated 52 survey questionnaires on a random
sampling basis. In addition, the urban areas were randomly divided into four villages
that are in the city centre (with commercial and businesses) and residential areas
62
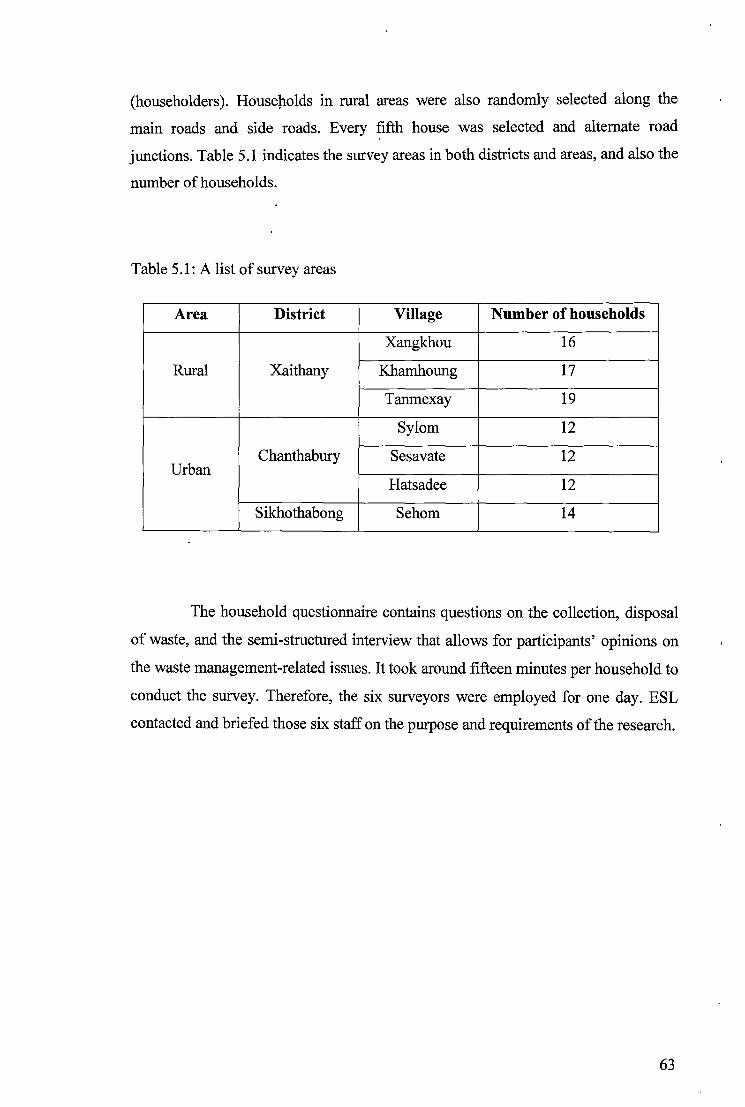
(householders). Housel:iolds in rural areas were also randomly selected along the
main roads and side roads. Every fifth house was selected and alternate road
junctions. Table 5.1 indicates the survey areas in both districts and areas, and also the
number of households.
Table 5.1: A list of survey areas
Area District Village Number of households
Xangkhou 16
Rural Xaithany Khamhoung 17
Tanmexay 19
Sy lorn 12
Chanthabury Sesavate 12 Urban
Hatsadee 12
Sikhothabong Sehorn 14
The household questionnaire contains questions on the collection, disposal
of waste, and the semi-structured interview that allows for participants' opinions on
the waste management-related issues. It took around fifteen minutes per household to
conduct the survey. Therefore, the six surveyors were employed for one day. ESL
contacted and briefed those six staff on the purpose and requirements of the research.
63
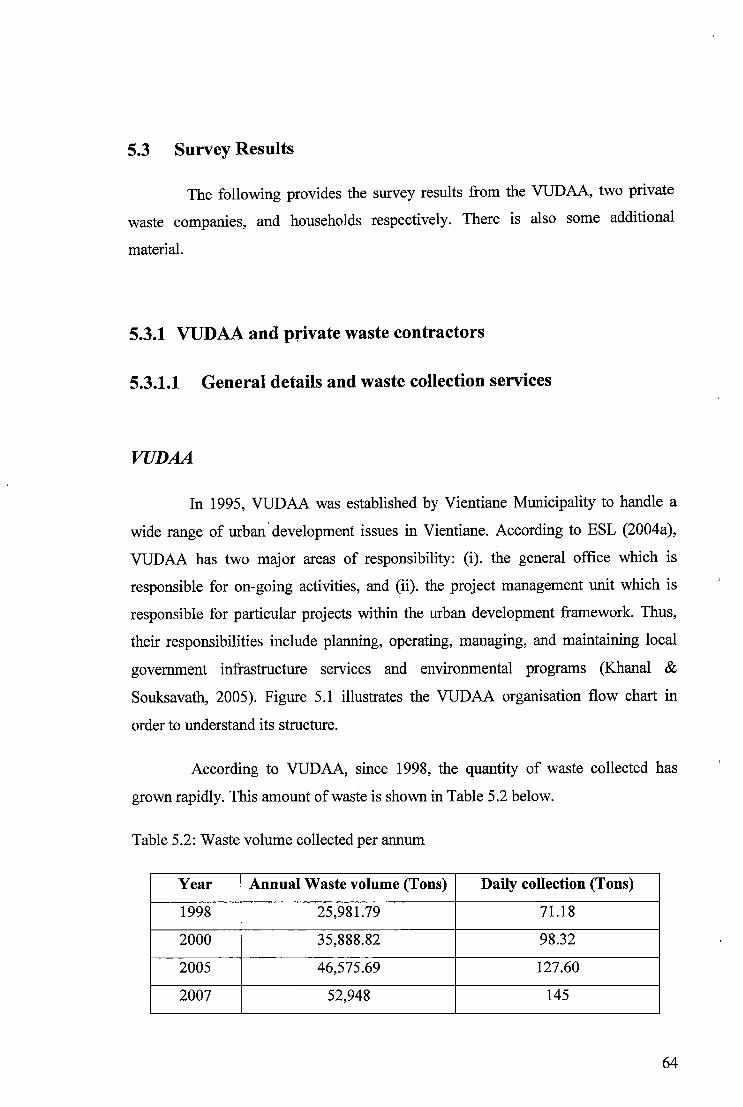
5.3 Survey Results
The following provides the survey results from the VUDAA, two private
waste compames, and households respectively. There is also some additional
material.
5.3.1 VUDAA and private waste contractors
5.3.1.1 General details and waste collection services
VUDAA
In 1995, VUDAA was established by Vientiane Municipality to handle a
wide range of urban. development issues in Vientiane. According to ESL (2004a),
VUDAA has two major areas of responsibility: (i). the general office which is
responsible for on-going activities, and (ii). the project management unit which is
responsible for particular projects within the urban development framework. Thus,
their responsibilities include planning, operating, managing, and maintaining local
government infrastructure services and environmental programs (Khanal &
Souksavath, 2005). Figure 5.1 illustrates the VUDAA organisation flow chart in
order to understand its structure.
According to VUDAA, since 1998, the quantity of waste collected has
grown rapidly. This amount of waste is shown in Table 5.2 below.
Table 5.2: Waste volume collected per annum
Year Annual Waste volume (Tons) Daily collection (Tons)
1998 25,981.79 71.18
2000 35,888.82 98.32
2005 46,575.69 127.60
2007 52,948 145
64
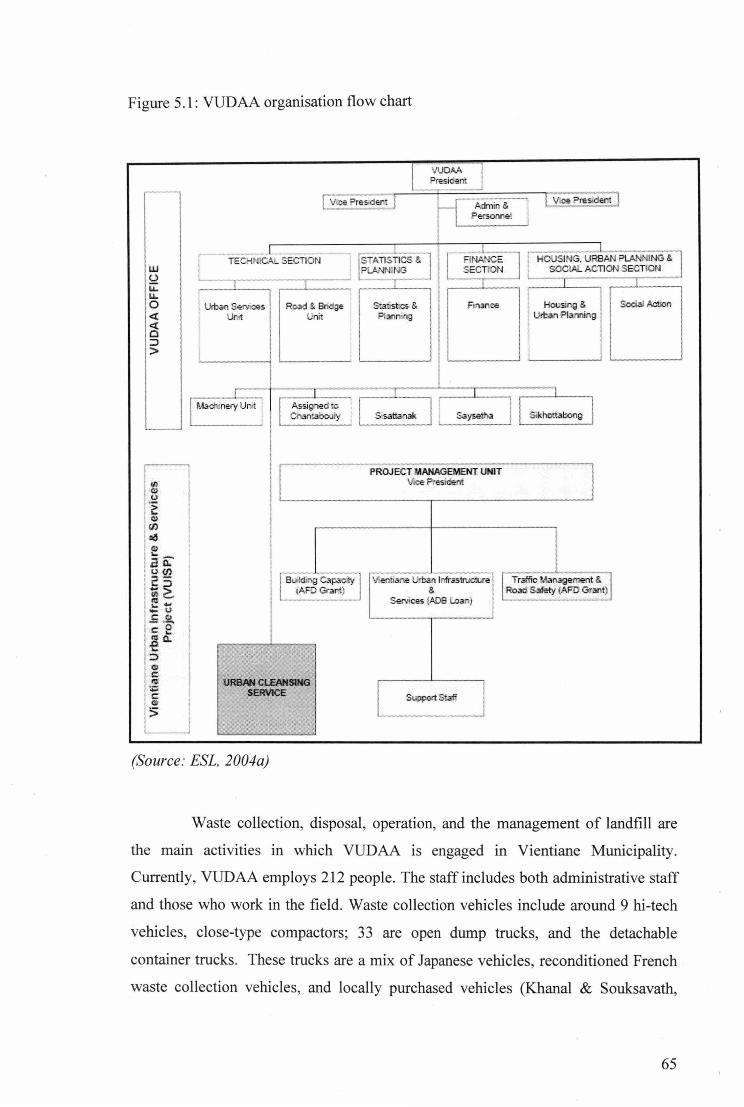
Figure 5.1: VUDAA organisation flow chart
n-'1 nit I Urban Seivx:es Roarl & Bnd go:
I
Machinery Ur,il
Smistics& P!.annina
NANC: SECTION
Fmar10E
A$sigr1ed 10 ' I C n:abou!y _ Sisatta:nak
URBAN CLEANSING SERVICE
(Source : ESL, 2004a)
PROJECT MANAGEMENT UNIT V11:e esident
-------, lf"tentiane Urban I fraslrudute
& !
Services (ADB Loa ) I
Support St-..
I Housing &
Urban f'lanni · g
Sikh01!abong
Traffic Man:l(Qement & Hood Safety (AFD Grant}
Soci- Action
Waste collection, disposal, operation, and the management of landfill are
the main activities in which VUDAA is engaged in Vientiane Municipality.
Currently, VUDAA employs 212 people. The staff includes both administrative staff
and those who work in the field. Waste collection vehicles include around 9 hi-tech
vehicles, close-type compactors; 33 are open dump trucks, and the detachable
container trucks. These trucks are a mix of Japanese vehicles, reconditioned French
waste collection vehicles, and locally purchased vehicles (Khanal & Souksavath,
65
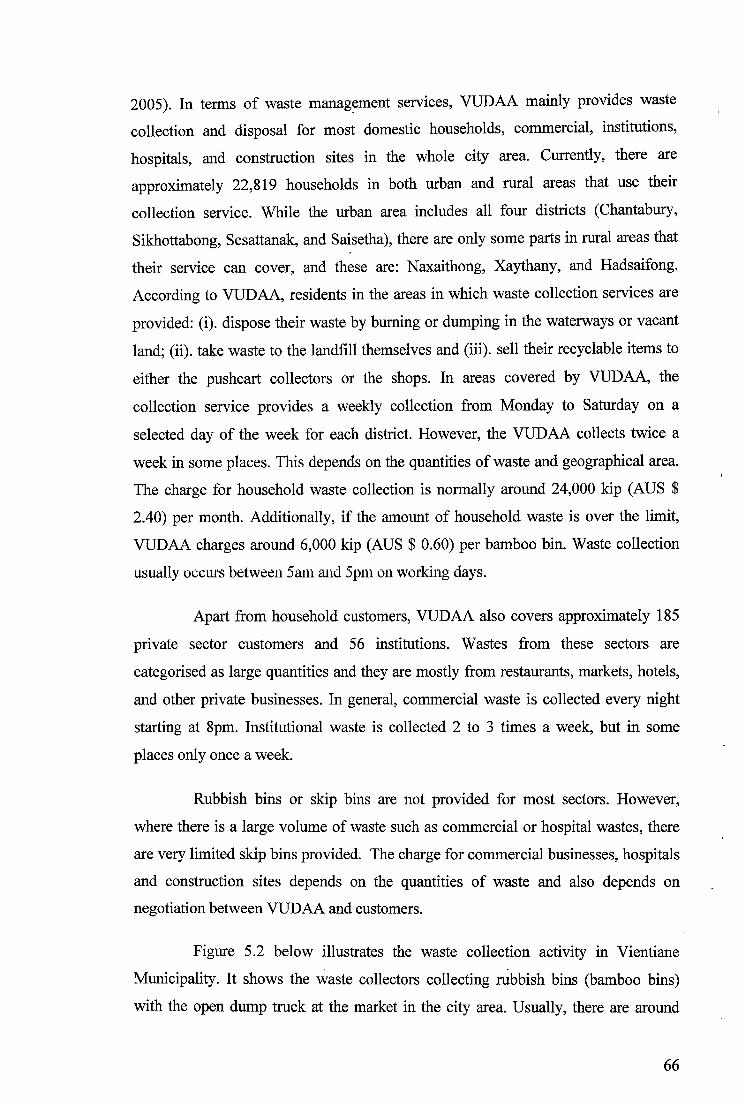
2005). In terms of waste manag~ment services, VUDAA mainly provides waste
collection and disposal for most domestic households, commercial, institutions,
hospitals, and construction sites in the whole city area. Currently, there are
approximately 22,819 households in both urban and rural areas that use their
collection service. While the urban area includes all four districts (Chantabury,
Sikhottabong, Sesattanak, and Saisetha), there are only some parts in rural areas that
their service can cover, and these are: Naxaithong, Xaythany, and Hadsaifong.
According to VUDAA, residents in the areas in which waste collection services are
provided: (i). dispose their waste by burning or dumping in the waterways or vacant
land; (ii). take waste to the landfill themselves and (iii). sell their recyclable items to
either the pushcart collectors or the shops. In areas covered by VUDAA, the
collection service provides a weekly collection from Monday to Saturday on a
selected day of the week for each district. However, the VUDAA collects twice a
week in some places. This depends on the quantities of waste and geographical area.
The charge for household waste collection is normally around 24,000 kip (AUS $
2.40) per month. Additionally, if the amount of household waste is over the limit,
VUDAA charges around 6,000 kip (AUS$ 0.60) per bamboo bin. Waste collection
usually occms between 5am and 5pm on working days.
Apart from household customers, VUDAA also covers approximately 185
private sector customers and 56 institutions. Wastes from these sectors are
categorised as large quantities and they are mostly from restaurants, markets, hotels,
and other private businesses. In general, commercial waste is collected every night
starting at 8pm. Institutional waste is collected 2 to 3 times a week, but in some
places only once a week.
Rubbish bins or skip bins are not provided for most sectors. However,
where there is a large volume of waste such as commercial or hospital wastes, there
are very limited skip bins provided. The charge for commercial businesses, hospitals
and construction sites depends on the quantities of waste and also depends on
negotiation between VUDAA and customers.
Figure 5.2 below illustrates the waste collection activity in Vientiane
Municipality. It shows the waste collectors collecting rubbish bins (bamboo bins)
with the open dump truck at the market in the city area. Usually, there are around
66
five collectors per truck to handle waste collection. Waste collection vehicles parked
to collect their waste cause heavy traffic jams.
Figure 5.2: Waste collection
activity with a large open
dump truck at the market in
Vientiane
(Source: Waste Econ, 2000)
Based on the information obtained from the VUDAA questionnaire, there
are several private contractors involved in providing waste management in Vientiane.
These arc:
);;:> Waste Transport and Cleansing Service
);;:> Lao Garbage Company
);;:> Chanthabury Cleansing Company
);;:> Municipality Waste Transportation Company
);;:> Transportation Service
);;:> Xaysettha Waste Transportation Centre
);;:> Hadxaifong Cleansing Service Company
);;:> Naxaithong Waste Cleansing Company
67
The number of private waste contractors has increased over the years. Some
of them have equipment provided by NGOs/ non-NGO and different types of
vehicles given by donors. However, most of the small private waste contractors were
found to be self-funded. All of them are responsible for their designated areas.
Lao Garbage Company
The Lao Garbage company is a private company established in 1995, as a
cooperative enterprise between Lao and Thai interests (ESL, 2004a). Currently, Lao
Garbage Company employs 92 people in total: about 60 field workers and the rest
are administrative staff. The company operates 13 hi-tech trucks and 6 large open
dump trucks for waste collection service. The Lao Garbage Company provides the
waste collection service for domestic households, commercial companies,
institutions and hospital wastes. Although the company does not provide rubbish bins
to householders, limited skip bins are provided to some sectors such as commercial
companies and institutions. Its commercial contracts include Beer Lao Company,
Vientiane Airport, which used UCS (ESL, 2004a). The company has approximately
9,011 households, and 40 commercial customers. The Lao Garbage Company works
from Monday to Saturday, from 8am to 6pm. The operating cost of their waste
collection service for households is around 18,000 kip (AUS $ 1.80) per month or
4,500 kip (AUS $ 0.45) per bin, and for the commercial sectors roughly 300,000 -
600,000 kip (AUS $30 to $60) per trip. Table 5.3 illustrates the areas and number of
villages for which the Lao Garbage Company provides a waste collection service in
both urban and rural area. The service basically covers only four districts in both
areas. These are: Chanthabury and Sikhottabong, Hadxaifong, and Xaithany. With
the number of households from which they collect, the quantity of waste is
approximately 2,500 tonnes per month. This equals approximately 80 tonnes per day.
Industrial and construction material collected is approximately 448.2 tonnes per
month; office waste, 172.6 tonnes; and electronic waste, 59.7 tonnes per month.
68
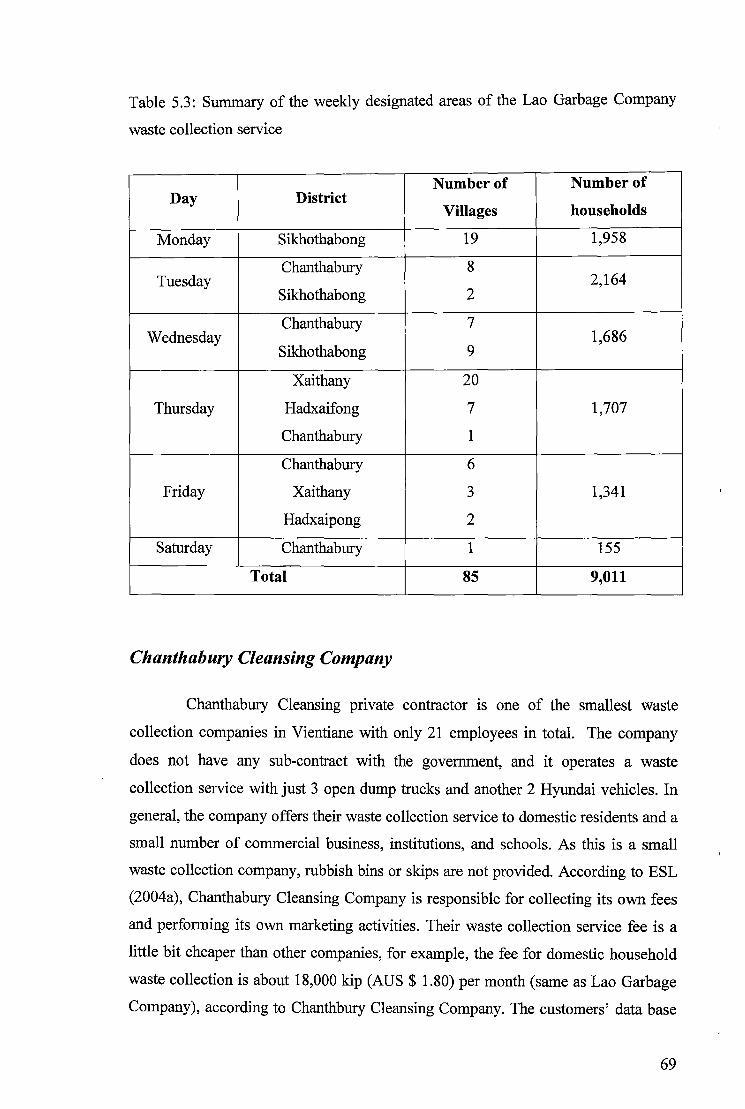
Table 5 .3: Summary of the weekly designated areas of the Lao Garbage Company
waste collection service
Number of Number of Day District
households Villages
Monday Sikhothabong 19 1,958
Chanthabury 8 Tuesday 2,164
Sikhothabong 2
Chanthabury 7 Wednesday 1,686
Sikhothabong 9
Xaithany 20
Thursday Hadxaifong 7 1,707
Chanthabury 1
Chanthabury 6
Friday Xaithany 3 1,341
Hadxaipong 2
Saturday Chanthabury 1 155
Total 85 9,011
Chanthabury Cleansing Company
Chanthabury Cleansing private contractor is one of the smallest waste
collection companies in Vientiane with only 21 employees in total. The company
does not have any sub-contract with the government, and it operates a waste
collection service with just 3 open dump trucks and another 2 Hyundai vehicles. In
general, the company offers their waste collection service to domestic residents and a
small number of commercial business, institutions, and schools. As this is a small
waste collection company, rubbish bins or skips are not provided. According to ESL
(2004a), Chanthabury Cleansing Company is responsible for collecting its own fees
and performing its own marketing activities. Their waste collection service fee is a
little bit cheaper than other companies, for example, the fee for domestic household
waste collection is about 18,000 kip (AUS $ 1.80) per month (same as Lao Garbage
Company), according to Chanthbury Cleansing Company. The customers' data base
69
shows that there are about 2,800 residents and 15 commercial customers. The
collection service occurs from Monday to Saturday between 3 am and 6 pm. The
collection service covers only the urban area, and this includes Chanthabury,
Sisattanak and Sikhottabong. The volume of waste that Chanthabury Cleansing
Company collects each year is approximately 5,000 tonnes.
5.3.1.2 Waste disposal and landfill site
VUDAA operates a sanitary landfill site at Km 36 (from the city centre).
Km 36 is the main solid waste disposal area in Vientiane Municipality with a total
land area of about 750 ha which is a lot bigger than the old landfill. So far, this
landfill site has used up to 100 ha with 36,853.57 tonnes (from January to July). This
landfill is mainly financed by the Lao Government. In order to gain entrance to the
landfill, an entry fee must be paid.
According to VUDAA and the two private waste contractors, most of the
waste from households, hospitals, industrial and construction site is generally
disposed of at Km 36 landfill. In Vientiane, hazardous wastes are separated from the
main disposal area inside the landfill boundary (STEA & UNEP, 2006). Even though
medical waste has a designated area at the landfill, toxic and non-toxic wastes are
still combined.
According to the VUDAA survey data, the Km 36 landfill is poorly
managed, as there is no proper landfill management system. The "Lao Garbage
Company and Chanthabury Cleansing Company indicated that their main concern is
related to the open dump and irregular covered waste, as it produces a bad odour and
inundation which is especially problematic during the rainy season.
70
5.3.1.3 Potential for implementation of waste collection and disposal
~ Waste collection service
Waste collection in Vientiane is limited to accessible areas, because there
are a number of problems that the three stakeholders are facing. The important
considerations for the three waste collection providers are:
• adequate transport
• adequate staff
• vehicle maintenance
• appropriate landfill
• running costs
In order to improve waste collection services, Chanthabury Cleansing
Company suggests that the Lao government should put more effort into public
awareness. The main source of waste comes from the community; therefore,
everyone should know how to manage their waste in order to improve the waste
collection service as well as reducing their waste at the same time. VUDAA and the
Lao Garbage Company also suggest that residents should be responsible for their
own waste by separating recyclable and general waste. In addition, because both
private and municipal collection services still lack financial support, householders
should be willing to pay the waste collection fee in order to improve waste collection
services.
~ Waste disposal
The current environmental effect of solid waste disposal is mainly pollution.
This is a serious concern for people's health; especially those people who work at the
landfill (for example, waste pickers). However, respondents said that the Km 36
disposal site requires more financial support, expertise in landfilling management
and appropriate equipment. Raising community awareness about the environmental
effects also should be a crucial focus. Thus, one of the most effective methods is to
71
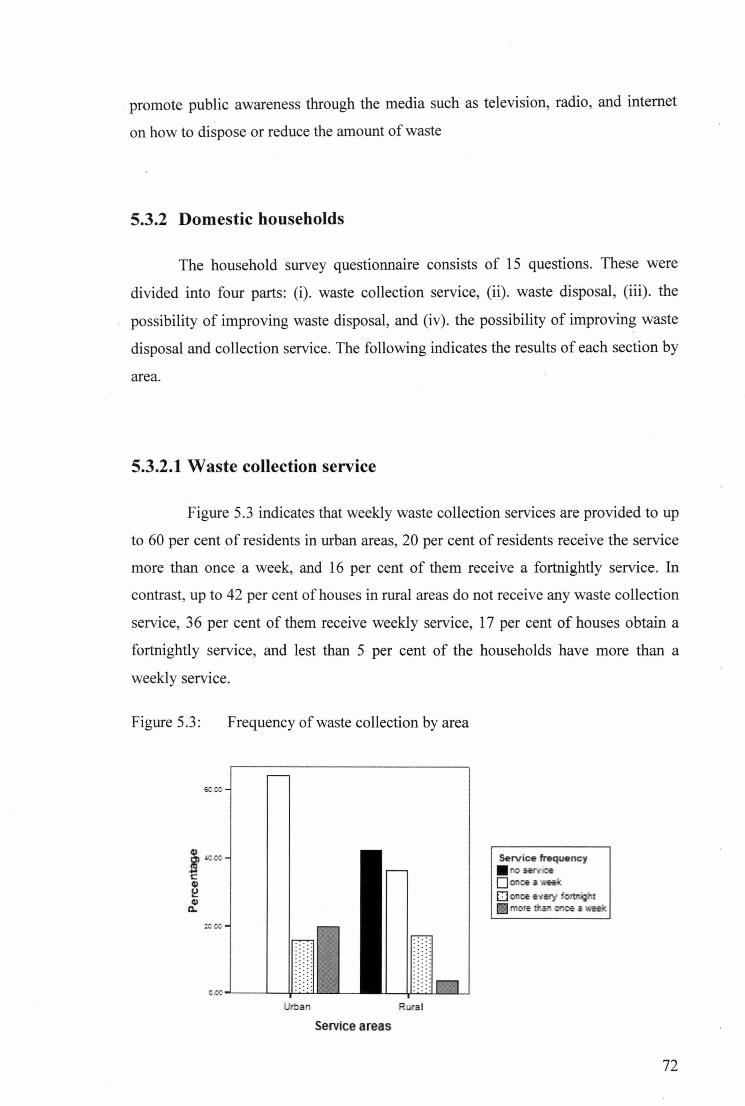
promote public awareness through the media such as television, radio, and internet
on how to dispose or reduce the amount of waste
5.3.2 Domestic households
The household survey questionnaire consists of 15 questions. These were
divided into four parts: (i). waste collection service, (ii). waste disposal, (iii). the
possibility of improving waste disposal, and (iv) . the possibility of improving waste
disposal and collection service. The following indicates the results of each section by
area.
5.3.2.1 Waste collection service
Figure 5.3 indicates that weekly waste collection services are provided to up
to 60 per cent of residents in urban areas, 20 per cent of residents receive the service
more than once a week, and 16 per cent of them receive a fortnightly service. In
contrast, up to 42 per cent of houses in rural areas do not receive any waste collection
service, 36 per cent of them receive weekly service, 17 per cent of houses obtain a
fortnightly service, and lest than 5 per cent of the households have more than a
weekly service.
Figure 5.3: Frequency of waste collection by area
Urban Rural
Service areas
Se-rvic't! freq~ncy • s~·,oice D oe a we: O onoe every ·onnioit.t
re !:ha. once a lll>eek
72
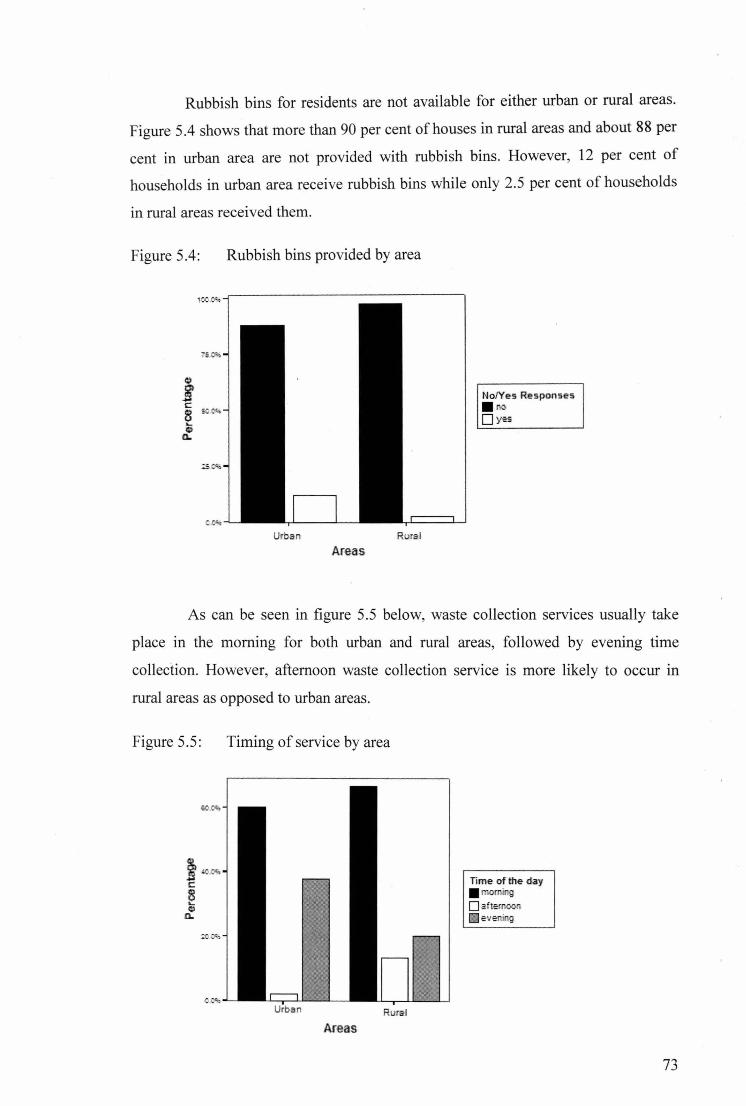
Rubbish bins for residents are not available for either urban or rural areas.
Figure 5.4 shows that more than 90 per cent of houses in rural areas and about 88 per
cent in urban area are not provided with rubbish bins. However, 12 per cent of
households in urban area receive rubbish bins while only 2.5 per cent of households
in rural areas received them.
Figure 5.4: Rubbish bins provided by area
Areas
No/Yes RespDnses
• D yes
As can be seen in figure 5.5 below, waste collection services usually take
place in the morning for both urban and rural areas, followed by evening time
collection. However, afternoon waste collection service is more likely to occur in
rural areas as opposed to urban areas.
Figure 5.5: Timing of service by area
nme of the d ay • •
Areas
73
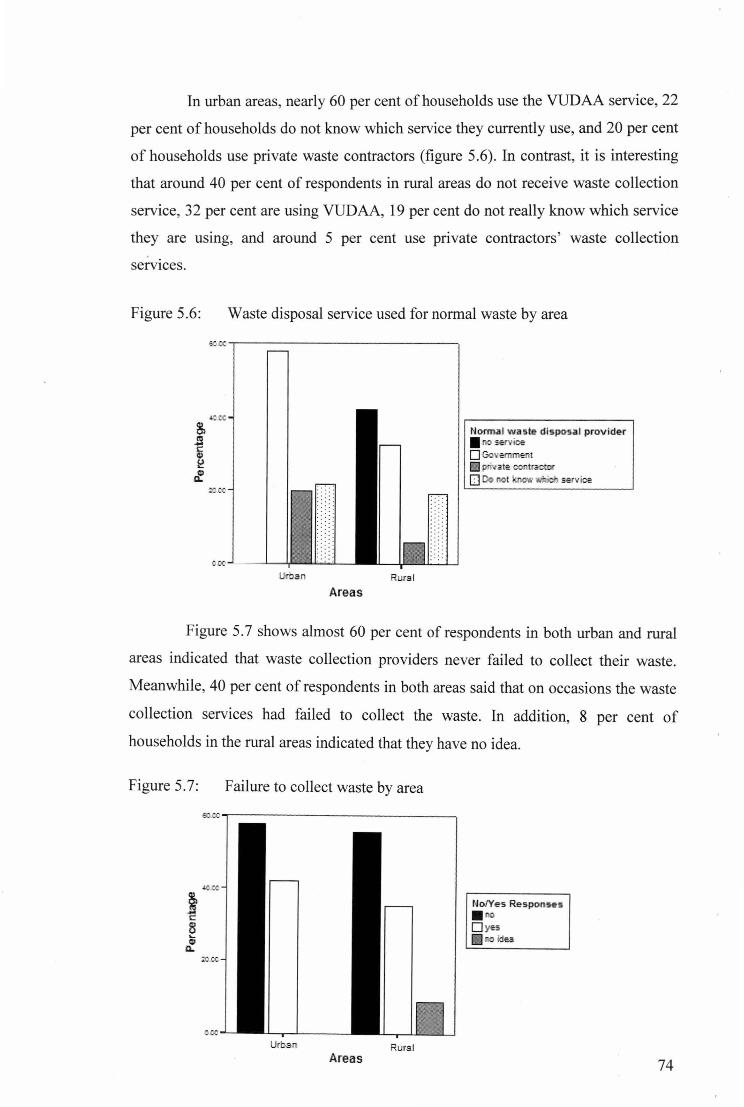
In urban areas, nearly 60 per cent of households use the VUDAA service, 22
per cent of households do not know which service they currently use, and 20 per cent
of households use private waste contractors (figure 5.6). In contrast, it is interesting
that around 40 per cent of respondents in rural areas do not receive waste collection
service, 32 per cent are using VUDAA, 19 per cent do not really know which service
they are using, and around 5 per cent use private contractors' waste collection
services.
Figure 5.6: Waste disposal service used for normal waste by area
Urban Rural
Areas
Normal waste disposal provider • service 0 Govem
pri11ate co fl"actor
0 Do t • N 'N i service
Figure 5.7 shows almost 60 per cent of respondents in both urban and rural
areas indicated that waste collection providers never failed to collect their waste.
Meanwhile, 40 per cent of respondents in both areas said that on occasions the waste
collection services had failed to collect the waste. In addition, 8 per cent of
households in the rural areas indicated that they have no idea.
Figure 5.7: Failure to collect waste by area
Urban Rural Areas
Nol'Yes Recsponses . 00 D yes 11 idea
74
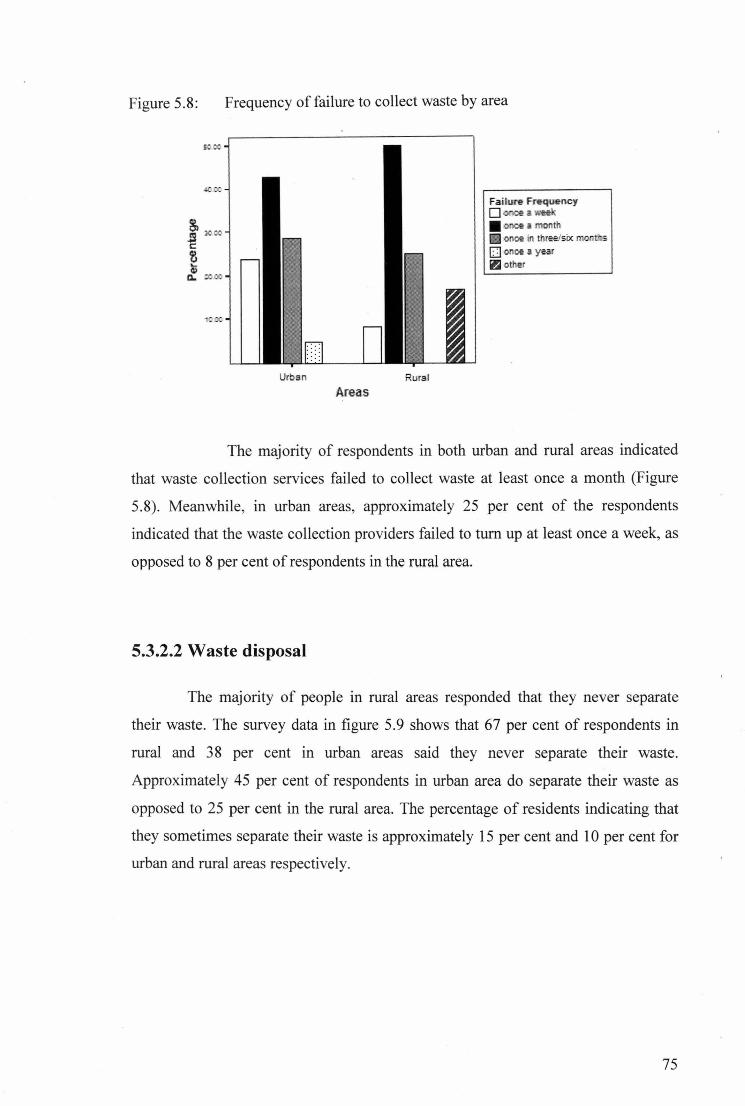
Figure 5.8:
4000
10.00
Frequency of failure to collect waste by area
Rural
Areas
Fai lure Freq,uency D onceawaek • OOOE a rnoJit
1111 once · t re<> six .months O onoeaye3J ~ oth::r
The majority of respondents in both urban and rural areas indicated
that waste collection services failed to collect waste at least once a month (Figure
5.8). Meanwhile, in urban areas, approximately 25 per cent of the respondents
indicated that the waste collection providers failed to turn up at least once a week, as
opposed to 8 per cent of respondents in the rural area.
5.3.2.2 Waste disposal
The majority of people in rural areas responded that they never separate
their waste. The survey data in figure 5.9 shows that 67 per cent of respondents in
rural and 38 per cent in urban areas said they never separate their waste.
Approximately 45 per cent of respondents in urban area do separate their waste as
opposed to 25 per cent in the rural area. The percentage of residents indicating that
they sometimes separate their waste is approximately 15 per cent and 10 per cent for
urban and rural areas respectively.
75
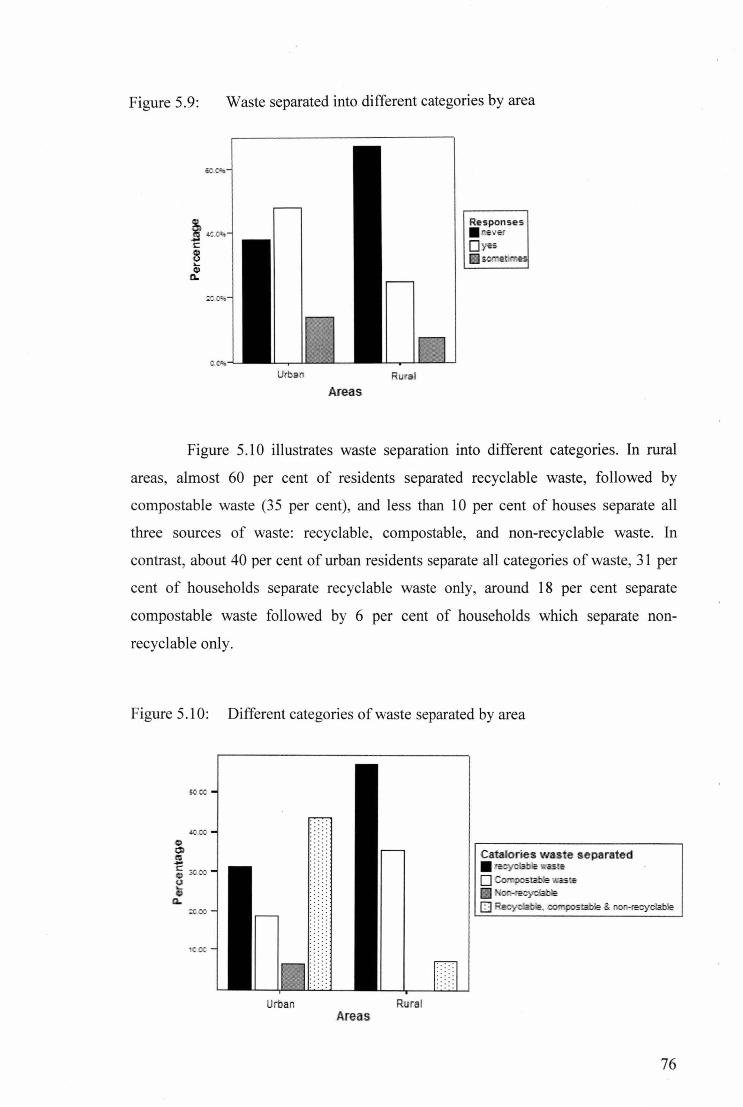
Figure 5.9: Waste separated into different categories by area
Areas
Responses . !le\lc T
0 ye:s ~etime=
Figure 5.10 illustrates waste separation into different categories. In rural
areas, almost 60 per cent of residents separated recyclable waste, followed by
compostable waste (35 per cent), and less than 10 per cent of houses separate all
three sources of waste: recyclable, compostable, and non-recyclable waste. In
contrast, about 40 per cent of urban residents separate all categories of waste, 31 per
cent of households separate recyclable waste only, around 18 per cent separate
compostable waste followed by 6 per cent of households which separate non
recyclable only.
Figure 5 .10: Different categories of waste separated by area
Urban Rura l Areas
Catalories waste separated • ecy -b : wast-:
0 Compostab wast: No ecycta:bl:
0 Recyclable. co postable & -recyclable
76
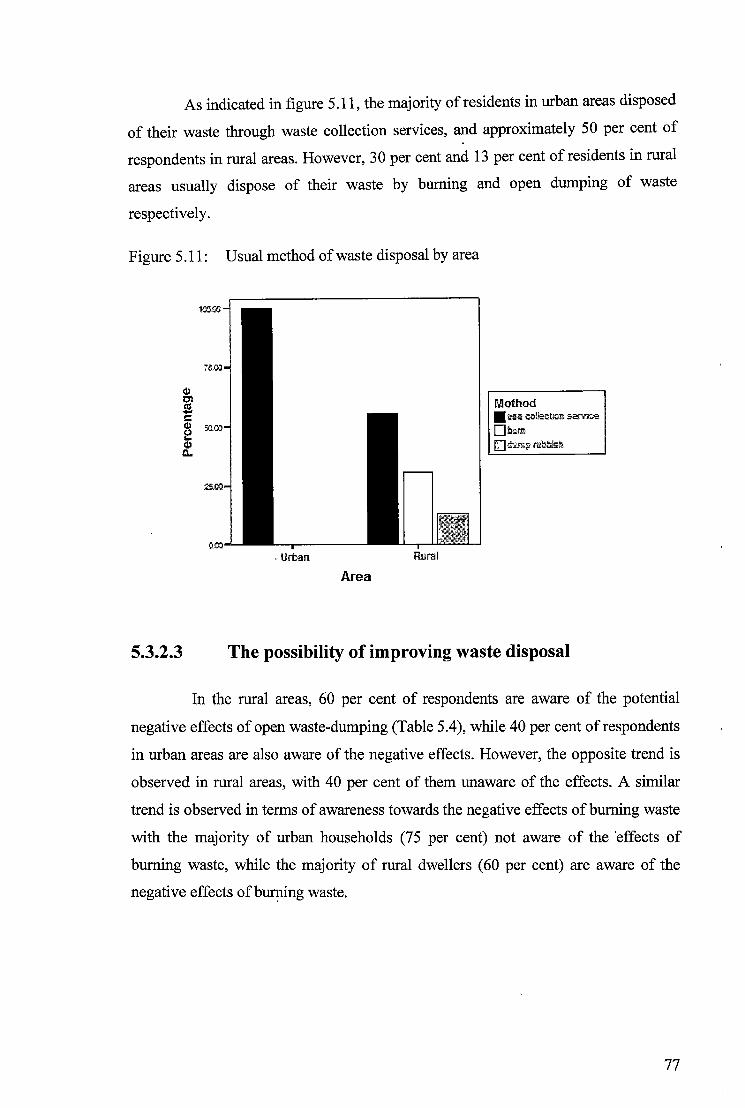
As indicated in figure 5.11, the majority of residents in urban areas disposed
of their waste through waste collection services, and approximately 50 per cent of
respondents in rural areas. However, 30 per cent and 13 per cent of residents in rural
areas usually dispose of their waste by burning and open dumping of waste
respectively.
Figure 5 .11: Usual method of waste disposal by area
. Urban Rural
Area
Mothod • w;e oo!lei:oon servi::ie ObUJn []ifarnp rubbish
5.3.2.3 The possibility of improving waste disposal
In the rural areas, 60 per cent of respondents are aware of the potential
negative effects of open waste-dumping (Table 5.4), while 40 per cent of respondents
in urban areas are also aware of the negative effects. However, the opposite trend is
observed in rural areas, with 40 per cent of them unaware of the effects. A similar
trend is observed in terms of awareness towards the negative effects of burning waste
with the majority of urban households (75 per cent) not aware of the 'effects of
burning waste, while the majority of rural dwellers (60 per cent) are aware of the
negative effects of b~ng waste.
77
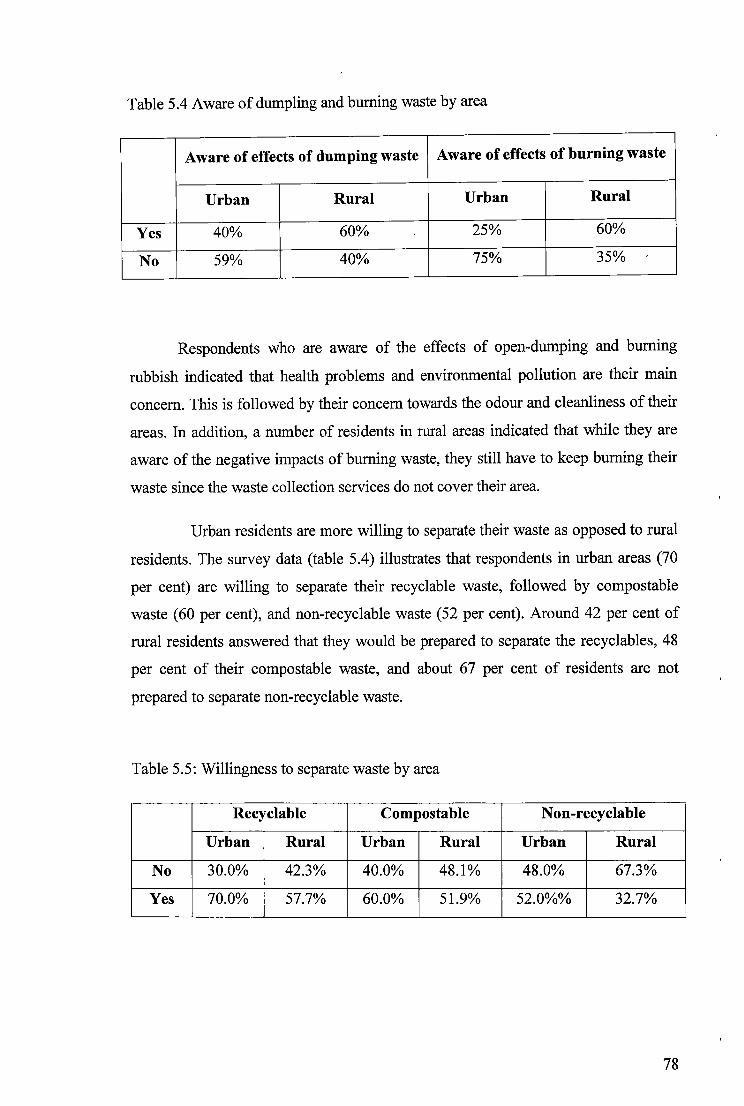
Table 5.4 Aware of dumpling and burning waste by area
Aware of effects of dumping waste Aware of effects of burning waste
Urban Rural Urban Rural
Yes 40% 60% 25% 60%
No 59% 40% 75% 35%
Respondents who are aware of the effects of open-dumping and burning
rubbish indicated that health problems and environmental pollution are their main
concern. This is followed by their concern towards the odour and cleanliness of their
areas. In addition, a number of residents in rural areas indicated that while they are
aware of the negative impacts of burning waste, they still have to keep burning their
waste since the waste collection services do not cover their area.
Urban residents are more willing to separate their waste as opposed to rural
residents. The survey data (table 5.4) illustrates that respondents in urban areas (70
per cent) are willing to separate their recyclable waste, followed by compostable
waste (60 per cent), and non-recyclable waste (52 per cent). Around 42 per cent of
rural residents answered that they would be prepared to separate the recyclables, 48
per cent of their compostable waste, and about 67 per cent of residents are not
prepared to separate non-recyclable waste.
Table 5.5: Willingness to separate waste by area
Recyclable Compostable Non-recyclable
Urban Rural Urban Rural Urban Rural
No 30.0% 42.3% 40.0% 48.1% 48.0% 67.3%
Yes 70.0% 57.7% 60.0% 51.9% 52.0%% 32.7%
78
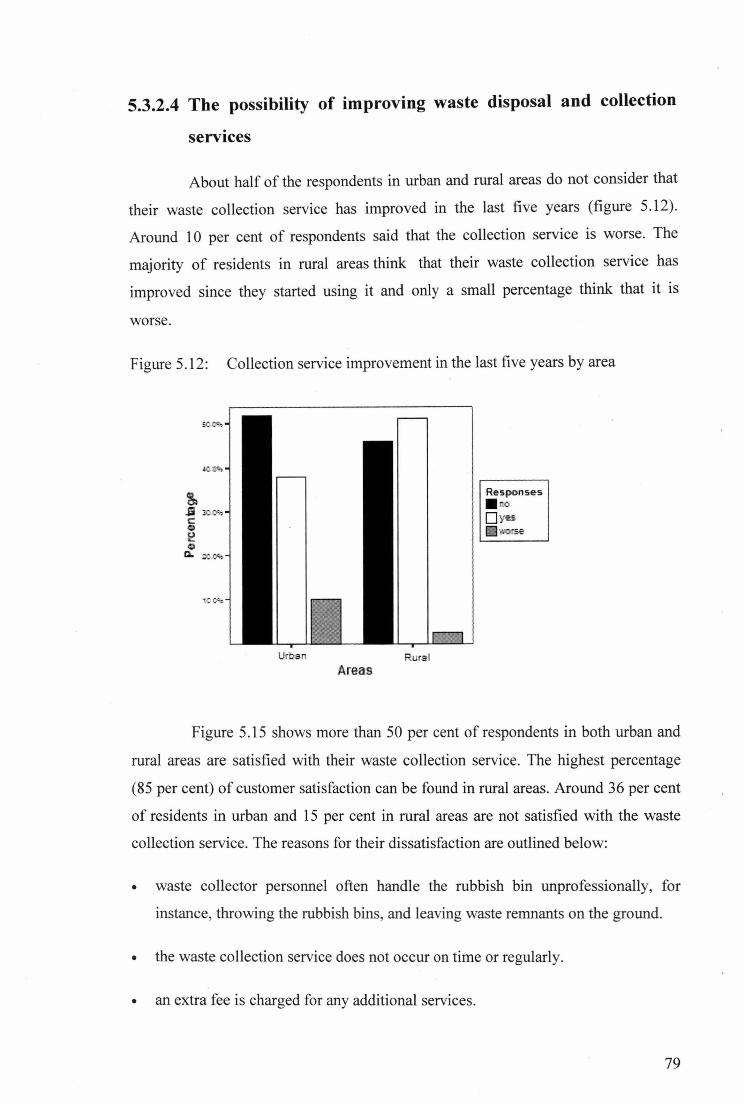
5.3.2.4 The possibility of improving waste disposal and collection
services
About half of the respondents in urban and rural areas do not consider that
their waste collection service has improved in the last five years (figure 5.12).
Around 1 O per cent of respondents said that the collection service is worse. The
majority of residents in rural areas think that their waste collection service has
improved since they started using it and only a small percentage think that it is
worse.
Figure 5.12: Collection service improvement in the last five years by area
lkba n Rural Areas
Responses • Q y5
Figure 5 .15 shows more than 50 per cent of respondents in both urban and
rural areas are satisfied with their waste collection service. The highest percentage
(85 per cent) of customer satisfaction can be found in rural areas. Around 36 per cent
of residents in urban and 15 per cent in rural areas are not satisfied with the waste
collection service. The reasons for their dissatisfaction are outlined below:
• waste collector personnel often handle the rubbish bin unprofessionally, for
instance, throwing the rubbish bins, and leaving waste remnants on the ground.
• the waste collection service does not occur on time or regularly.
• an extra fee is charged for any additional services.
79
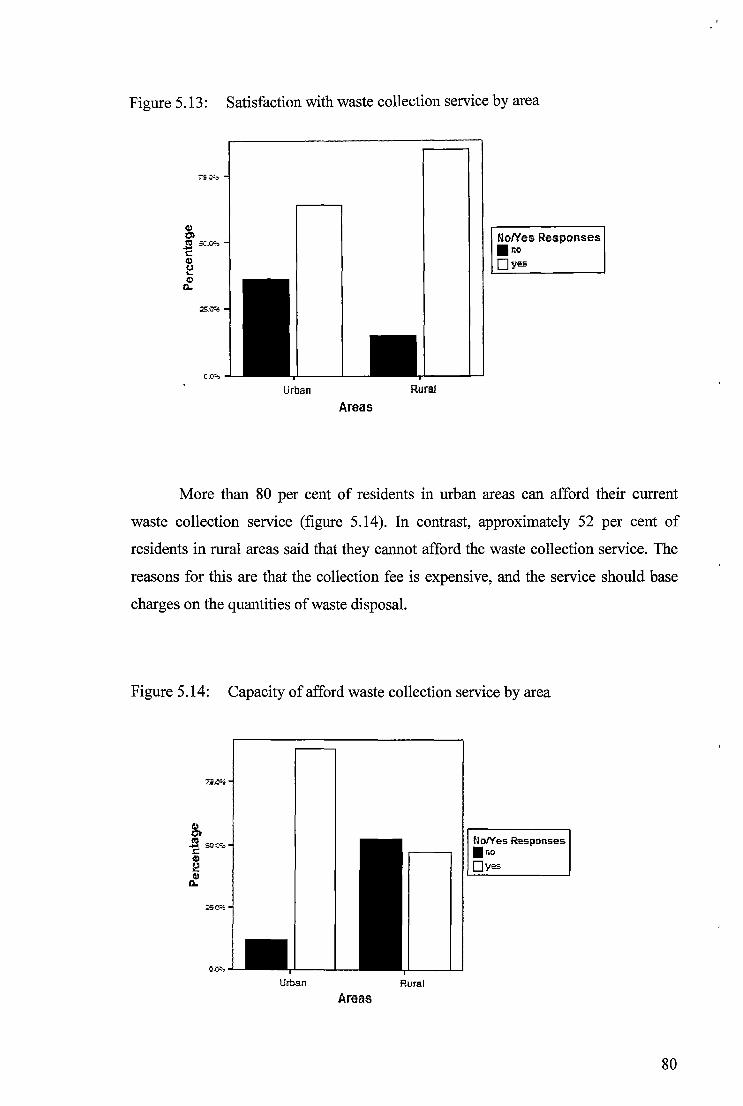
Figure 5.13: Satisfaction with waste collection service by area
Urban
Areas
Rural
HoNes Responses .no Dyes
More than 80 per cent of residents in urban areas can afford their current
waste collection service (figure 5.14). In contrast, approximately 52 per cent of
residents in rural areas said that they cannot afford the waste collection service. The
reasons for this are that the collection fee is expensive, and the service should base
charges on the quantities of waste disposal.
Figure 5.14: Capacity of afford waste collection service by area
Uroan
Areas Rural
No/Yes Responses .r.,;;. Dyes
80
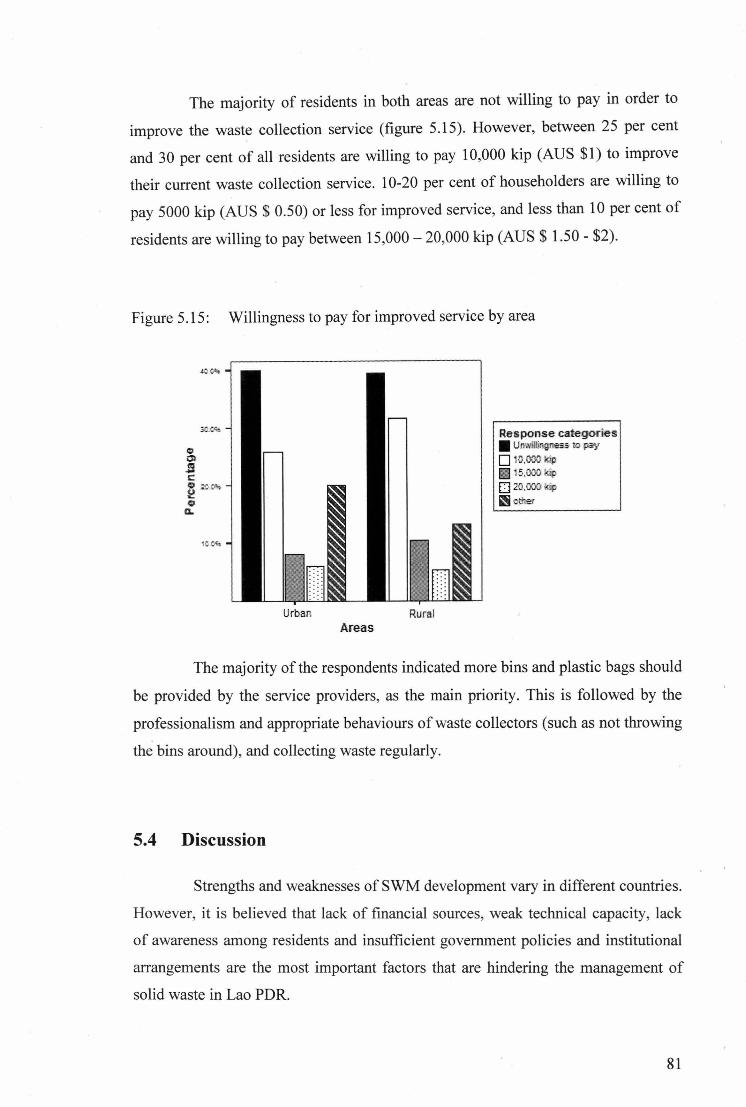
The majority of residents in both areas are not willing to pay in order to
improve the waste collection service (figure 5.15). However, between 25 per cent
and 30 per cent of all residents are willing to pay 10,000 kip (AUS $1) to improve
their current waste collection service. 10-20 per cent of householders are willing to
pay 5000 kip (AUS $ 0.50) or less for improved service, and less than 10 per cent of
residents are willing to pay between 15,000- 20,000 kip (AUS$ 1.50 - $2).
Figure 5 .15: Willingness to pay for improved service by area
Urban Rural Area.s
Response categories • u ·lli!l~nes.s. to pa)'
D o.009 ~P Fil 5,00Dk:ip
D 20.oo:i lklp
~ other
The majority of the respondents indicated more bins and plastic bags should
be provided by the service providers, as the main priority. This is followed by the
professionalism and appropriate behaviours of waste collectors (such as not throwing
the bins around), and collecting waste regularly.
5.4 Discussion
Strengths and weaknesses of SWM development vary in different countries.
However, it is believed that lack of financial sources, weak technical capacity, lack
of awareness among residents and insufficient government policies and institutional
arrangements are the most important factors that are hindering the management of
solid waste in Lao PDR.
81
5.4.1 Waste collection service
The findings of this study indicate that waste collection services are still
poorly managed in Lao PDR, with only 60 per cent of urban households receiving a
weekly waste collection service, while about 35 per cent of rural households receive
a weekly waste collection service. Similarly, in line with ESL's (2004a) findings, the
research indicates that many households in the rural area have no waste collection
service. Specifically, in this study, 40 per cent of households in rural areas indicated
that their area is not covered by any waste collection service at all. As a result, the
majority of rural residents engaged in inappropriate handling of solid waste such as
illegal dumping and open burning (ESL, 2004b; Khanal & Soksavath, 2005). Indeed,
the findings of this study show that 30 per cent and 13 per cent of rural respondents
burn their waste and illegally dump their waste in open areas.
Open burning of waste is a major concern in Lao. Not only does smoke from
open burning contribute to localised as well as city-wide pollution, it is also
detrimental to the health of residents through the inhalation of respirable suspended
particulates, including carbon monoxide, nitrogen dioxide and sulphur dioxide
(Boadi & Kuitunen, 2005). Indeed, 25 per cent of urban households and 55 per cent
of rural households in this research indicated that they are aware of the potential
negative impacts of open burning, but have little choice because of the inadequate
waste collection services.
Apart from the inadequacy or absence of waste collection services in some
areas, residents that use waste collection services generally perceive the services are
oflow quality and standards. Indeed, the findings of this research indicate that 36 per
cent and of the residents in urban and 15 per cent in rural areas are not satisfied with
their waste collection service providers. Three main reasons given for the
dissatisfaction are the unprofessional conduct of waste collectors, such as throwing
the rubbish bins and leaving waste remnants on the ground, the waste collection
service does not occur in a timely and regular fashion and there are no standard bins
and standard fees for waste collection services, where extra fees are often charged for
any additional services. Indeed, in an interview with VUDAA personnel, they
indicated that they do not provide bins for most of the households, and· an extra fee is
often charged for additional services such as carrying extra loads of household waste.
82
Supporting the above data provided by VUDAA, this thesis findings indicate that 88
per. cent of the households in urban and 90 per cent in rural areas, are not provided
with bins by their waste collection services providers. However, the findings of this
research are contrary to the findings observed in developed countries such as
Australia. For instance, Chayabutra (1994) found a very low dissatisfaction rate
among Hobart residents relating to their waste collection services. In addition, in his
study, Chayabutra (1994) indicated that the main reason for householders'
dissatisfaction was the fact that one bin per household was not enough to
accommodate all their waste.
The findings of this research also partially support the notion that the major
concerns relating to the public's poor perception of SWM in third world countries
such as Lao PDR, are weak technical capacity, and insufficient government
legislation in guiding SWM (Boadi & Kuitunen, 2005; ESL, 2004a; STEA & UNEP,
2006). Flowing on from that, SWM and practices in third world countries are
believed to improve at a slower rate compared to developed countries due to lack of
financial support (Boadi & Kuitunen, 2005; ESL, 2004a). The above notion is also
supported by the current research, where approximately 50 per cent of the
respondents both in urban and rural areas do not believe that their waste collection
services have improved over the last five years. This clearly shows the lack of
technical capacity (such as, trained staff, knowledge and expertise) in solid waste
management in Lao. In addition, the slow improvement rate in Vientiane could also
be potentially explained by the unwillingness of the majority (approximately 40 per
cent of respondents) of both urban and rural households to pay for service
improvement. Although the majority of the respondents were unwilling to pay for
improved service, some of the respondents indicated that they was willing to pay
extra ifthe waste collection is improved. However, none of them were willing to pay
beyond the price range of AUS $ 1.50 to AUS $ 2.00 per month. A more detailed
survey is required in the future to fully comprehend SWM.
It should be noted that the VUDAA waste collection fee for normal
household waste is more expensive than the other two private contractors. The
findings indicate that the VUDAA monthly charge is around 24,000 kip or AUS $
2.40, while the other two private waste companies charge only 18,000 kip or AUS$
83
1.80 per month per household. In addition, an over the limit waste fee is charged by
VUDAA and the two private contractors. Specifically, VUDAA charges an
additional 6,000 kip or AUD $ 0.60 per bamboo bin, while the other two private
contractors charge an additional 4,000 kip or AUS 0.40 per bamboo bin.
5.4.2 Waste disposal
According to ESL (2004a) and STEA and UNEP (2006), the main problems
countered by the Lao government in terms of disposing waste at landfill are that
there is no clear segregation between waste (it is a mixture of organic, household,
and in some cases, hazardous waste) prior to being disposed at landfill; there is
insufficient technological capacity in managing landfill such as no compaction of
waste (open dumping); and the problems for waste pickers of being exposed to
disease and toxins.
Indeed, the above problems associated with disposed waste at Lao landfill
were also encountered in this research. For instance, approximately 40 per cent of
urban households indicated that they never separate their waste into household waste
and recyclable waste categories, whilst 67 per cent of rural dwellers indicated that
they never separate their waste. This could indicate that urban dw~llers are more
aware of the importance of waste separation compared to rural dwellers. Similarly,
this could also be due to the fact that urban dwellers have easier access to SWM
facilities such as recycling centres, landfills or skip bins as opposed to rural dwellers.
Having said that, the high percentage of both urban and rural dwellers that do not
separate their waste is a major concern, because numerous studies have indicated that
this mixture is not only contaminating underlying aquifers, it also contributes to the
flooding in landfill area in the monsoon rainy season (ESL, 2004a). This will
indirectly impact on residents' health and the increased likelihood of disease. To cite
an example, a study in Jakarta found a correlation between unseparated garbage at
landfill and the occurrence of infectious diseases caused by rodents and flies
(Surjadi, 1993).
84
From interviews with the two private contractors, they indicated that their
major concerns are related to the open dumping and irregular coverage of waste at
landfills. Apparently, this poor management of landfill has many detrimental effects
from environmental impacts to household health issues. Furthermore, they also
indicated that this could be attributed to the lack of financial support by the
government, lack of technical expertise in landfill management and lack of
appropriate equipment and technologies such as leachate control technologies.
In addition, the two private contractors indicated that they are worried about
the presence of waste pickers for two reasons. Firstly, they are concerned about the
safety of the waste pickers as heavy machinery and vehicles are constantly present at
the landfill. Secondly, they are concerned about the health of waste pickers as they
are more likely to be exposed to a variety of health related problems. Indeed, ESL
(2004a) found that some of the waste pickers were infected with hand and mouth
diseases, and cases of food poisoning have been established among waste pickers.
85
Chapter 6: Conclusion and Recommendations
6.1 Conclusion
This study demonstrates the problems associated with SWM in Lao PDR.
By interviewing three key players directly associated with solid waste management
in Lao PDR, valuable information and insights were obtained. Firstly, many of the
households in Vientiane Municipality in both urban and rural areas, are still not
covered by waste collection services. This is especially true for rural dwellers, which
in turn leaves them no choice other than burning their waste and/or openly and yet
illegally dumping their waste in open areas. Several extant studies have shown
various environmental and health impacts associated with open burning and illegal
dumping of waste. AISo, the findings of this research indicate that households have
low awareness with regard to the proper technique of separating waste sources, and
the importance of waste separation. From the perspective of SWM providers, the
findings of this slwly indicate that SWM practices are not carried out in an efiicient
way, from the collection of waste itself to the management of landfill. This is mainly
due to the lack of financial capacity, technical expertise and knowledge, the lack of
appropriate technology (as can be seen by the usage of open dump-trucks and
bamboo bins). This also results in the slow improvement rate of solid waste
management in Lao PDR. Therefore, it is no surprise that the public have poor
perceptions with regard to the management of solid waste in Lao PDR. In essence,
SWM in Lao PDR i~ not sustainable at this point.
86
6.2 Recommendations
The recommendations that can be drawn from this research are as follows:
1. Establish a sound strategy, policy or legislative framework in which a reliable
collection system and regular service can be provided. As mentioned earlier in
chapter 4, in terms of solid waste management, Lao PDR has a weak legislative
framework that has failed to establish proper roles for the organisations involved
in SWM. Therefore, sound and strong legislation needs to be established in order
to cover waste management practices such as waste collection and the
management of landfill. In addition, there are a number of lessons that can be
learnt from developed countries such as Australia. Especially, Australian waste
management policy frameworks place a greater emphasis on the producers of
waste sources and they are required to take responsibility for waste treatment and
disposal.
2. Increase community awareness regarding the importance of waste separation
and proper waste disposal techniques. The open burning and dumping are
alarming trends in Lao PDR. Governments should take initiatives so that these
trends are minimised if not prevented. The establishment of recycling centres at
public institutions is a positive and healthy step to achieve this overall goal.
Strong coordination and cooperation among various stakeholders involved in
waste collection should be emphasised, in order to ensure that the majority of
households in both urban and rural are supplied with waste collection services.
This will certainly reduce the incidence of open dumping and burning. Media
channels could also be encouraged to convey the information to households with
regards to the importance of proper SWM techniques in households. For example,
waste awareness and educational programs should be made widely available via
various types of media such as television, radio, magazines, and newspapers.
More importantly, programs should be offered in schools and training centres and
at a village level so that this will educate the new generation with regard to the
importance of proper waste management in order to reduce harmful
environmental effects.
87
3. Reinforcement of the management and administration system. The findings of
this thesis indicate that Lao PDR still has weak SWM and technical capacities.
As such, proper and adequate training should be provided to staff and there needs
to be an ongoing organisational commitment to these training programs. Formal
and on the job training needs to be more structured, particularly for workers and
management personnel. Indeed, in Australia, the Australian Government
Productivity Commission states that the Australian Government has to make
refine information, education and awareness programs in both waste management
issues and policies. In addition, investment in the appropriate technologies (such
as closed-compact trucks) and waste management techniques such as leachate
monitoring at landfill should be encouraged and promoted by the government. A
lesson on landfill management could also be learnt from Australia's practices on
landfill management. The most widely used management techniques used in ,
Australia are compacting and covering the waste with soil regularly. In addition,
extra measures such as lining, capping, and leachate recirculation are all parts of
the waste management practices in Australia. In contrast, because Lao PDR' s
landfills mainly consist of open dumping, the focus should be shifted to adoption
of the landfill management practices used in Australia.
4. Strengthening financial capacity. As mentioned in chapter 4, currently, the Lao
government is partly sponsored by various nations and/or organisations/ non
government organisations, especially, the UNDP and JICA in regards to
managing solid waste. This financial support needs not only to be maintained, it
also needs to be boosted in order to continue support for SWM in Vientiane as
well as in the whole country. For this reason, the government should
continuously seek and secure funds from developed nations and/or organisations.
5. Establishment of a standard payment system for waste services. As indicated by
the findings of this study, different organisations involved in solid waste
management charge differently. There needs to be a standard and consistent
payment system that applies to all households. However, the proven pay systems
that are applicable in Australia need to be considered with caution before being
applied in Lao PDR. The reason being that the strength of household income in
both nations is clearly different, with the former ranked as one of the richest
88
countries in the world whilst the latter is the opposite. Ind eed, the payment
system applicable in the Laos context provides an opportunity for future research
in order to ensure that households are willing to pay in order for their waste to be
disposed appropriately and what is an appropriate fee scale.
89
References
Ackerman, 2005: Cost-effective recycling. In C. Rasmussen & D. Vigso (Eds.),
Rethinking the waste hierarchy: 1-21. Copenhagen: Environmental Assessment
Institute for Miljovurdering.
Agency for Toxic Substances and Disease Registry (ATSDR), 2001: Landfill gas
control measures. Available on-line at: <http://www.atsdr.cdc.gov/HAC/landfill/
PDFs/Landfill 2001 ch5.pdf>, (accessed 25th September. 2008)
Angelelli, E. & Sperenza, M. G. 2002: The application of a vehicle routing model to
a waste-collection problem: Two case studies. Journal of the Operational Research
Society, 53 (9): 944-952.
Asian Development Bank (ADB), 2003: Solid waste management and income
generation for Vientiane's poor pr.oject. Available on-line at:
<http://www.adb.org/Documents/JFPRs/lao/jfur-lao-37651.pdf>, (accessed 15th
March. 2008)
Asian Development Bank (ADB), 2004: Lao PDR: Water Resources Coordinating
Committee, Available on-line at: <www.adb.org/water/nwsab/2004/Lao PDR
country paper.pdf>, (accessed 25th June. 2008)
Asian Development Bank (ADB), 2006: Country Synthesis Report on Urban Air
Quality Management, Lao PDR. Available on-line at: <http://www.adb.org/
Documents/Reports/U rban-Air-Quality-Management/lao%20pdr .pdf>, (accessed 24 th
June. 2008)
Asian Development Bank (ADB), 2008: Lao People's Democratic Republic:
Vientiane Urban Infrastructure and Services Project. Available on-line at:
<http://www.adb.org/Documents/PCRs/LA0/33432-LAO-PCR.pdf>, (accessed 18th
June. 2008)
Association of Municipal Engineers, 1991: Recycling household waste: The way
ahead. West Sussex: Faygate Printing Services.
90
Australian Bureau of Statistics, 1998: Waste Management Industry: Australia, 1996-
1997. Available on-line at: <http://www.abs.gov.au/ausstats/[email protected]/
mediareleasesbyReleaseDate/4015DOF0342E5B46CA2568A.9001362D9?0penDocu
ment>, (accessed 2ih August. 2008)
Australian Bureau of Statistics, 2003: Environmental issues: People's views and
practices. Available on-line at: <http://www.ausstats.abs.gov.au/ausstats/
subscriber.nsf/O/B91Al8D868909E31CA256DE9007443Cl/$File/46020 mar%2020
03.pdf>, (accessed 2ih August. 2008)
Australian Government Productivity Commission, 2006: Waste management.
Victoria.
Ayotamuno, J. M. & Gobo, A. E. 2004: Municipal solid waste management in Port
Harcourt, Nigeria: Obstacles and prospects. Management of Environmental Quality,
15 (1): 389-400.
Baccini, P., Henseler, G., Figi, R. & Belevi, H. 1987: Water and element balances of
municipal solid waste landfills. Waste Mana~ement & Research, 5 (1): 483-389.
Becklake, S. 1991: Waste Disposal and Recycling. Aladdin Books Ltd: London
Beede, D, N. & Bloom, D. E. 1995: The economics of municipal solid waste. The
World Bank Research Observer, 10 (2): 113-151.
Beede, D. N. & Bloom, D. E. 1996: Coping with municipal solid waste in developing
countries. In S. Yusuf, W. Wu & S. Evenett (Eds.), Local dynamic in an era of
globalization: 175-184. Washington: The World Bank.
Beranek, W. 1992: Solid waste management and economic development. Economic
Development Review, 10 (3): 49-52.
Bernstein, J. D. 1991: Alternative approaches to pollution control and waste
management: Regulatory and economic instruments. The World Bank Organisation.
Available on-line at: <http://www-wds.worldbank.org/ external/ default/
WDSContentServer/WDSP /IB/ 1991/04/01 /000009265 3 961001125114/Rendered/P
DP/multi page.pd£>, (accessed 6th June. 2008)
91
Boadi, 0. K. & Kuitunen, M. 2005: Environmental and health impacts of household
solid waste handling and disposal practices in third world cities: case study of the
Accra Metropolitan area, Ghana. Environmental Health, 68 (4): 32-36.
Bose, A. & Blore, I. 1993: Public waste and private property: An enquiry into the
economics of solid waste in Calcutta. Public Administration and Development, 13
(1): 1-15.
Brown, V., Orr, L. & Smith, D. 1992: Acting locally: Meeting the environmental
information needs of local government. Canberra: Centre for Resource and
Environmental Studies.
Bruner, P. H. & Feliner, J. 2007: Setting priorities for waste management strategies
in developing countries. Waste Management & Research, 25 (3): 234.
Bruner, P.H. 1996: Editorial. Waste Management & Research, 14: 1-2.
Bureau of Industry Economics, 1993: Waste Management and landfill pricing.
Canberra: Australian Government Publishing Service.
Cameron, D. 2008: Towards emissions trading. Engineers Australia, 80 (1): 25-32.
Central Intelligence Agency (CIA), 2008: The world fact book: Laos. Available on
line at: <https://www .cia.gov/library/publications/the-world-factbook/ geos/la.html>,
(accessed 241h June. 2008)
Chayabutra, C. 1994: The roles of government, the private sector, and residents in
solid waste management: Lessons from a case study in greater Hobart local
government areas, Tasmania. Unpublished doctoral thesis, University of Tasmania,
Hobart.
Chinitz, B. 1990: Growth management: Good for the town, bad for the nation?
Journal of American Planning Association, 56 (1): 3-9.
Christchurch City Council, 2006: Toward Zero Waste. Available on-line at:
<http://www.ccc.govt.nz/Waste/managementplan/WasteManagementPlan2006.pdf>,
(accessed 9th May. 2008)
92
Christensen, T. H. 1989: Environmental aspects of sanitary landfilling. In R. Cossu.
& R. Stegmann (Eds.), Sanitary landfilling: Process technology and environmental
impact: 19-25. London: Academic Press.
Commonwealth Environment Protection Agency, 1992: National waste minimisation
and recycling strategy. Canberra: Senate Printing Unit.
Commonwealth of Australia, 1994: Waste disposal: A report from the senate
standing committee on environment, recreation and the arts. Canberra: Senate
Printing Unit.
Cutts, L. & Osborn, D. 1989: Diversity in local government systems: The Australian
local governments handbook. Canberra: Australian Government Publishing Service.
Department of Environment, Queensland, 1996: Waste Management Strategy for
Queensland. Available on-line at: <http//www.epa.qld.gov.au publicationsp00572
aa.pdf> (accessed 6th May. 2008)
Department of Primary Industries, Water, and Environment. 2004: Landfill
sustainable guiue. Available on-line at: <http://www.environment.tas.gov.au/
downloads/Landfill Sustainability Guide%202004.pdf>, (accessed 5th May. 2008).
Department of the Environment and Heritage, 2005: Waste sector greenhouse gas
emissions projections. Available on-line at: <http://www.greenhouse.gov.au/
projections/pubs/ waste2005.pdf>, (accessed 29th August. 2008)
Domfeh, K. A. 1999: Some environmental factors affecting health in the Greater
Accra Metropolitan Area, Ghana. Environments, 27 (2): 1-13.
Earth Systems Lao (ESL ), 2004a: JICA follow-up survey on assistance for waste
management. Unpublished paper prepared for Japan International Cooperation
Agency (JICA).
Earth Systems Lao (ESL ), 2004b: Integrated Solid Waste Management in Vientiane
Municipality 2003-2004: External Mid-Term Review. Unpublished paper prepared
for United Nation Development Program.
93
Encyclopedia of the Nations, 2008: National economies encyclopedia Asia and the
Pacific: Lao PDR. Available on-line at: <http://www.nationsencyclopedia.com/
economies/ Asia-and-the-Pacific/>, (accessed 23rd September. 2008)
Environment Australia, 1991 : Waste minimisation manual for local government: A
guide to resources, issues and best practice. Victoria: Environment Australia.
Environment Protection Agency SA, 1998: EPA guidelines: Major solid waste
landfill depots. Available on-line at: <http://www.epa.sa.gov.au/pdfs/
swlandfill.pdf>, (accessed 29th August. 2008)
Environment Protection Authority (EPA) NSW, 1996: Environmental guidelines:
Solid waste landfills. Available on-line at: <http://www.epa.nsw.gov.au/resources/
solidlandfill.pdf>, (accessed 23 April. 2008)
Environment Protection Authority (EPA) Victoria, 2008: Waste. Available on-line
at: <http://www.epa.vic.gov.au/waste/default.asp>, (accessed·2nd July. 2008)
Ferrara, I. 1999: Essays on solid waste management: The impact of user fees.
Unpublished doctoral thesis, York University, Canada.
Fullerton, D. & Kinnaman, T. 1996: Household responses to pricing garbage by the
bag. American Economic Review, 86 (4): 971-984.
Furedy, C. 1993: Working with the waste pickers: Asian approaches to urban solid
waste management. Waterloo: 19 (2): 18
Gandy, M. 1993: A critical analysis of environmental policy in developed
economies: The case of recycling. Institutions and the Environment, 1: 1.
Harrison Market Research, 2005: Working with the community: Report for zero
waste SA. Adelaide: Government of South Australia.
Hobson, A. M. B. 2007: Methane and nitrous oxide from waste composting.
Unpublished doctoral thesis, Open University, United Kingdon.
Houtven, G. V. & Morris, G. 1999: Household behaviour under alternative pay-as
you-throw systems for solid waste disposal. Land Economics, 75 (4): 515-537.
94
Rubick, K. T. 1991: Management & technologfos of wastes: A perspective-Australia
1990. ACT: CPN Publications.
Intergovernmental Panel on Climate Change, 2006: Waste generation, composition,
and management data. Available on-line at: <http://www.ipcc
nggip.iges.or.jp/public/2006gl/pdf/5 Volume5N5 2 Ch2 Waste Data.pdf>,
(accessed lih August. 2008)
Japan International Cooperation Agency (JICA), 1999: Country profile on
environment: Laos. Available on-line at: <http://www.jica.go.jp/english/global/env/
profiles/e99lao.pdf>, (accessed lih September. 2008)
Jones, G. W, 1999: Population of South East Asia. Available on-line at:
<http://dspace-dev.anu.edu.au/bitstream/l 030.58/12298/2/81.pdf>, (accessed 12th
September. 2008)
Keen, M., & Mercer, D. 1993: Environmental planning at the local level: The
example of local conservation strategies in Victoria, Australia. The Environmentalist,
13 (2): 83-95.
Kelleher, M. & Dixie, J. 2000: User pay in Canada. Solid waste & Recycling, 5 (3):
8-11.
Khanal, B. R & Souksavath, B. 2005: Environmental Management measures. and
current practices in solid waste management: A case study from Vientiane, Lao
People's Democratic Republic. Journal of GMS development studies, 2 (1): 79- 99
Khotsay, K. & Vilaythong, D. 2005: Regional training workshop on the inventory of
hazardous waste generation: Country report. Available on-line at:
<http://www. base Lint/ stratplan/oewg 1 /proj docs/indonesia/rpt-laos.doc>, (accessed
8th September.2008)
KPMG Lao Company Limited, 2008: Investment in Lao PDR. Available on-line at:
<http://www.kpmg.co .th/Publications/tax legal/InvestmentinLao2008. pdf>,
(accessed 24th August, 2008)
95
Kristensen, J. 2001: Food Security & Development in the Lower Mekong River
Basin: a challenge for the Mekong River Commission. Paper delivered at the Asia
and Pacific Forum on Poverty, Manila.
Lah, T. J. 2001: Municipal solid waste management: A case study of Indianapolis.
Unpublished doctoral thesis, Indiana University, Indiana.
Lindhqvist, T. 2000: Extended producer responsibility in cleaner production: Policy
principle to promote environmental improvements of product systems. Available on
line at: <http://www.lub.lu.se/luft/diss/tec355.pdf>, (accessed 29th August. 2008)
Linowes, R. & Rupert, M. B. 2006: The tropical waste dilemma: Waste management
in Panama. International Journal of Emerging Markets, 1 (3): 225-234.
Litter and Recycling Research Association, 1993: Garbage bin analysis and
recycling audit. Available on-line at: <https://www.epa.nsw.gov.au/soe/95/
192.htm>, (accessed 2ih August. 2008)
MacDonald. M. A. 2004: Proposed methodology for siting of compost facilities in
Vientiane, Lao PDR. Available online at: <http://www.utoronto.ca/waste
econ/MacDonaldthesis%20final%20report%20take%202.pdf>, (accessed 1 Oth June.
2008)
Madina, M. 2005: Co-operatives benefit waste recyclers. Appropriate Technology:
32 (3): 53.
Miranda, M. L., Miller, J. M. & Jacobs, T. L. 2000: Talking trash about landfills:
Using quantitative scoring schemes in landfill siting processes. Journal of Policy
Analysis and Management, 19 (1): 3-22.
Morage-Gonzalez, J. L. & Padron-Fumero, N. 2002: Environmental policy in a green
market. Environmental and Resource Economics, 22 (3): 419-449.
Morris, G. E. & Holthausen, D. M. 1994: The economics of household solid waste
generation and disposal. Journal of Environmental Economics and Management, 26
(3): 215-235.
96
Musson, S. E., Jang, Y. C., Townsend, T. G. & Chung, I. H. 2000: Characterisation
of lead leachability from cathode ray tubes using the toxicity characteristics leaching
procedure. Environment Science Technology, 34: 4376.
Nathanson, J. A. 1986: Basic environmental technology: Water supply, waste
disposal, and pollution control. New Jersey: Prentice Hall.
National Centre for Environmental Economics (NCEE), 2001: The United States
Experience with Economic Incentives for Protecting the Environment. Available on
line at: <http://usinfo.state.gov/infousa/economy/technology/docs/EE-0216B-
13 .pdf>, (accessed 20th August. 2008)
National Statistics Centre (NSC), 1995: The population and housing census 1995.
Vientiane: State printing.
National Statistics Centre (NSC), 2005: The population and housing census 2005.
Vientiane: State printing.
National Statistics Centre (NSC), 2006: Statistical year book 2006. Vientiane: State
printing.
Nicholson, J. 2005: Australian to the CORE: The art of selling recycled organics.
Solid Waste & Recycling. 10 (3): 34-35.
O'Gallagher, B. 1990: Waste management technologies: Opportunities for research
and manufacturing in Australia. Sydney: Department of Industry, Technology and
Commerce.
Organisation for Economic Co-operation and Development (OECD), 1983:
Household waste: Separate collection and recycling. Paris Cedex, France: OECD
Publications Office.
Phillips, P. S., Adams, K. T., Read, A. D. & Green, A. E. 2000: Regional variations
in waste minimization in England: Challenges and issues for policy development.
Regional Studies, 34 (3): 297-305.
97
Phillips, P. S., Clarkson, P., Adams, J., Read, A. D. & Coggins, P. C. 2003: County
waste minimization programmes: A case study from Northamptonshire, UK.
Sustainable Development, 11(2):103-119.
Phouxay, K. 2007: Internal migration and socio-economic change in Lao PDR.
Available on-line at: <www.grm.cuhk.edu.hk/en/4ipgc/download/ AroomLTlPPT/
6A1Phouxay kab6A12July.ppt>, (accessed 24th August, 2008)
Pollock-Shea, C. 1988: Recycling urban wastes: Solving the garbage glut. Academic
Research Library, 117 (2518): 88-92.
Price, J. L. & Joseph, J.B. 2000: Demand management- A basis for waste policy: A
critical review of the applicability of the waste hierarchy in terms of achieving
sustainable waste management. Sustainable Development, 8 (2): 96-105.
Qian, W. & Burritt, R. 2007: Environmental accounting for waste management: A
study oflocal governments in Australia. Environmentalist, 27: 143-154.
Ramboll, 2007: Waste management. Available on-line at:
<httm://viewer.zmags.com/getMagPdf. php?mid=wdqsd/>, (accessed 5th July. 2008)
Read, A. D. & Phillips, P. S. 1998: Waste minimization as a local government issue:
Fact or fiction? Sustainable Development, 6: 78-91.
Regional data exchange systems, 2008: Profile of Lao People's Democratic Republic
(LaoPDR). Available on-line at: <http://www.faorap-apcas.org/lao.html>, (accessed
241h June. 2008)
Rogers, H. 2005: Gone tomorrow: The hidden life of garbage. The New Press:
London.
Russell, S. H. 1982: Resource Recovery Economics: Methods for Feasibility
Analysis. New York: Marcel Dekker Inc.
Science Technology and Environmental Agency (STEA) & United Nations
Environmental Program (UNEP), 2006: LAO P.D.R. National Environmental
Performance Assessment (EPA) Report. Available on-line at:
98
<http://www.rrcap.unep.org/ sef/doc pub/Laos%20EP A %20Report.pdf>, (accessed
l 81h September. 2008)
Science, Technology and Environmental Agency (STEA) & World Bank, 2005: Lao
PDR Environment Monitor. Available on-line at: <http://siteresources.worldbank.
org/NEWS/Resources/report-en.pdf>, (accessed 28th. August. 2008).
Scott, J., Beydoun, D., Amal, R., Low, G. & Cattle, J. 2005: Landfill management,
leachate generation, and leach testing of solid wastes in Australia and overseas.
Critical Reviews in Environmental Science and Technology, 35 (3): 239-333.
Siklossy, M. 1993: Management of solid wastes in Budapest. Academic Research
Library, 60: 358-359.
Surjadi, C. 1993: Respiratory diseases of mothers and children and environmental
factors among households in Jakarta. Environment and Urbanization, 5 (2): 78-86.
Tanthachoon. N, Chiemchaisri. C, Chiemchaisri. W, Tudsri. S, & Kumar. S. 2008:
Methane Oxidation in Compost-Based Landfill Cover with Vegetation during Wet
and Dry Conditions in the Tropics. Pittsburgh: 58(5): 603
Toowoomba Regional Coup.cil, 2008: Landfill - the end of the line for waste.
Available on-line at: <http://www. toowoomba.gld. gov .au/index.php ?option=com
docman&task=doc view&gid=519&Itemid=71>, (accessed 18 August. 2008)
United Nations Development Program (UNDP), 2008: On the ground in Lao PDR.
Available on-line at: <http://www.undplao.org/>, (accessed 24th June. 2008)
United Nations Environmental Programme (UNEP). 2001: Lao PDR - State of the
environment. Available on-line at: <http://rrcap.unep.org/pub/soe/lao urban.pdf>,
(accessed 1 Oth June. 2008)
Urban Cleansing Service Centre (UCSC), 1999: Rules for Waste Disposal and
Environmental Protection. Vientiane: UCSC and Environmental Agency.
Urban Development Sector Unit, 1999: What a waste: Solid waste management in
Asia. Available on-line at: <http://www.worldbank.org/urban/solid wm/erm/
CWG%20folder/uwpl.pdf>, (accessed 20 June. 2008)
99
. '
Moorst, V. 1996: Toxic landfills: Some preliminary research findings, Report for
Werribee Residents against toxic dumps (WRATD). Available on-line at:
<http://www.21 century .com.au/environment/wratd/Report I .html>, (accessed 29th
June. 2008)
Waite, R. 1995: Household waste recycling. London: Earthscan.
Waste Econ, 2008: About waste-econ in Laos. Available on-line at:
<http://www.utoronto.ca/waste-econ/abo-lao.html>, (accessed 18th September. 2008)
WEPA, 2008: Governmental activities - Lao PDR. Available on-line at:
<http://www.wepa-db.net/ngos/ government/laos/top.htm>, (accessed 1 Oth June.
2008)
Wong. R.G, 2004: Analysis of separation options for composting market waste in
Vientiane, Lao PDR. Available on-line at: <http://www.utoronto.ca/waste
econ/GenWong.pd:f>, (accessed 23rd June 2008)
World Health Organisation (WHO), 2005: Lao People's Democratic Republic -
Environmental Health Country Profile. Available on-line at:
<http://www.environment-health.asia/fileupload/laopdr ehcp 19May05. pd±>,
(accessed 20th August. 2008)
Worthington, A. C. & Dollery, B. E. 2001: Measuring efficiency in local
government: An analysis of New South Wales municipalities' domestic waste
management function. Policy Studies Journal, 29 (2): 232-249.
Yousif, D. & Scott, S. 2007: Governing solid waste management in Mazatenango,
Guatemala: Problems and prospects. International Development Planning Review, 29
(4): 433-451.
Zbinden, M. & Goodman, T. 2007: Commingled organics at yard trimmings
composting site. BioCycle, 48 (9): 23-27.
Zia, H. & Devadas, V. 2007: Municipal solid waste management in Kanpur, India:
Obstacles and prospects. Management of Environmental Quality, 18 (1 ): 89-108.
100
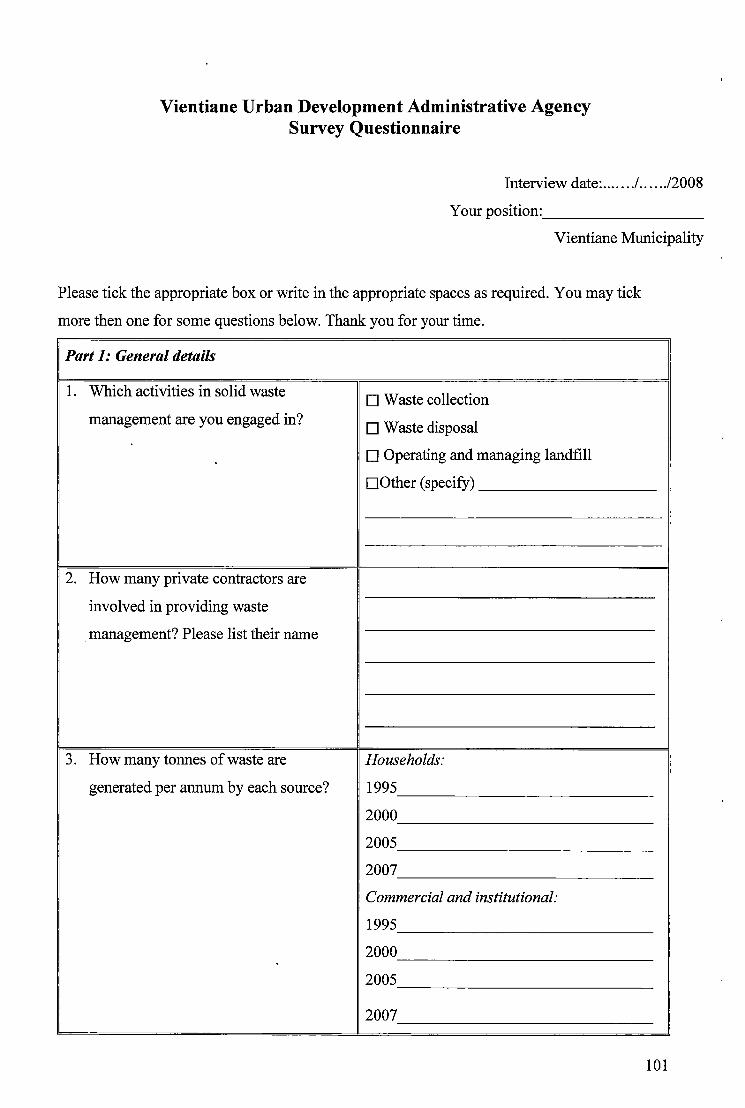
Vientiane Urban Development Administrative Agency Survey Questionnaire
Interview date: ...... ./ ..... ./2008
Your position: ________ _
Vientiane Municipality
Please tick the appropriate box or write in the appropriate spaces as required. You may tick
more then one for some questions below. Thank you for your time.
Part 1: General details
1. Which activities in solid waste D Waste collection management are you engaged in?
D Waste disposal
D Operating and managing landfill
OOther (specify)
2. How many private contractors are
involved in providing waste
. management? Please list their name
3. How many tonnes of waste are Households:
generated per annum by each source? 1995
2000
2005
2007
Commercial and institutional:
1995
2000
2005
2007
101
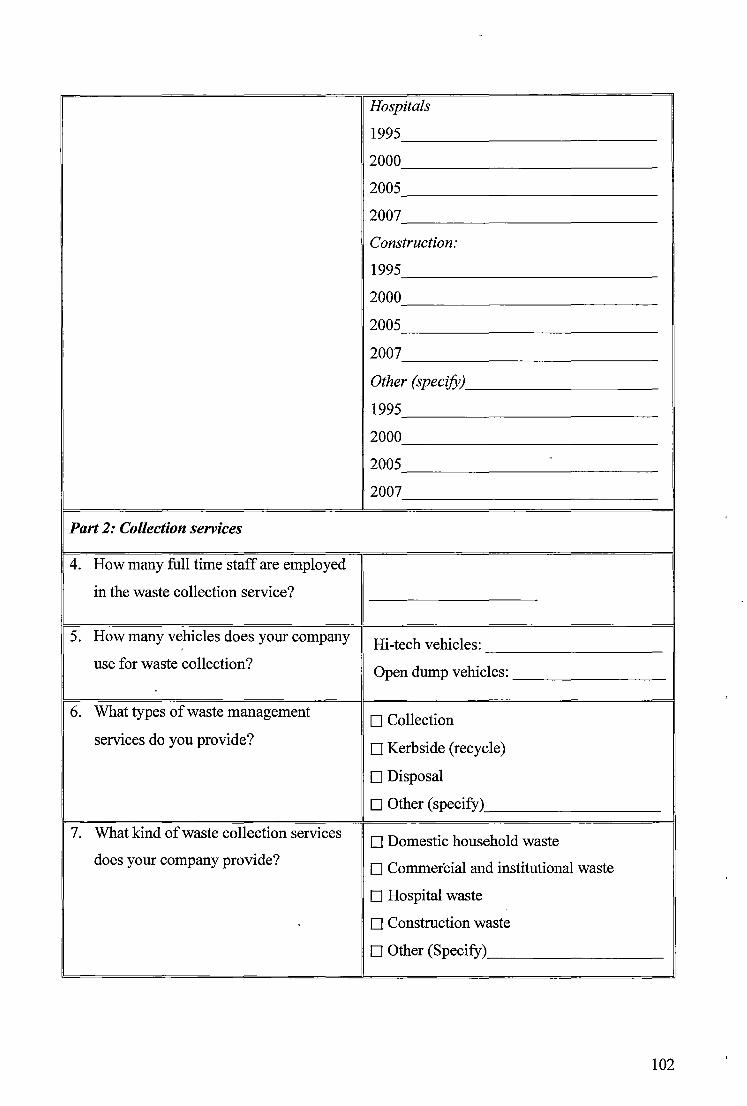
Hospitals
1995
2000
2005
2007
Construction:
1995
2000
2005
2007
Other (specify)
1995
2000
2005
2007
Part 2: Collection services
4. How many full time staff are employed
II
I
in the waste collection service?
5. How many vehicles does your company Hi-tech vehicles: use for waste collection? Open dump vehicles:
6. What types of waste management D Collection services do you provide? D Kerbside (recycle)
D Disposal
D Other (specify)
7. What kind of waste collection services D Domestic household waste does your company provide? D Commercial and institutional waste
D Hospital waste
D Construction waste
D Other (Specify)
102
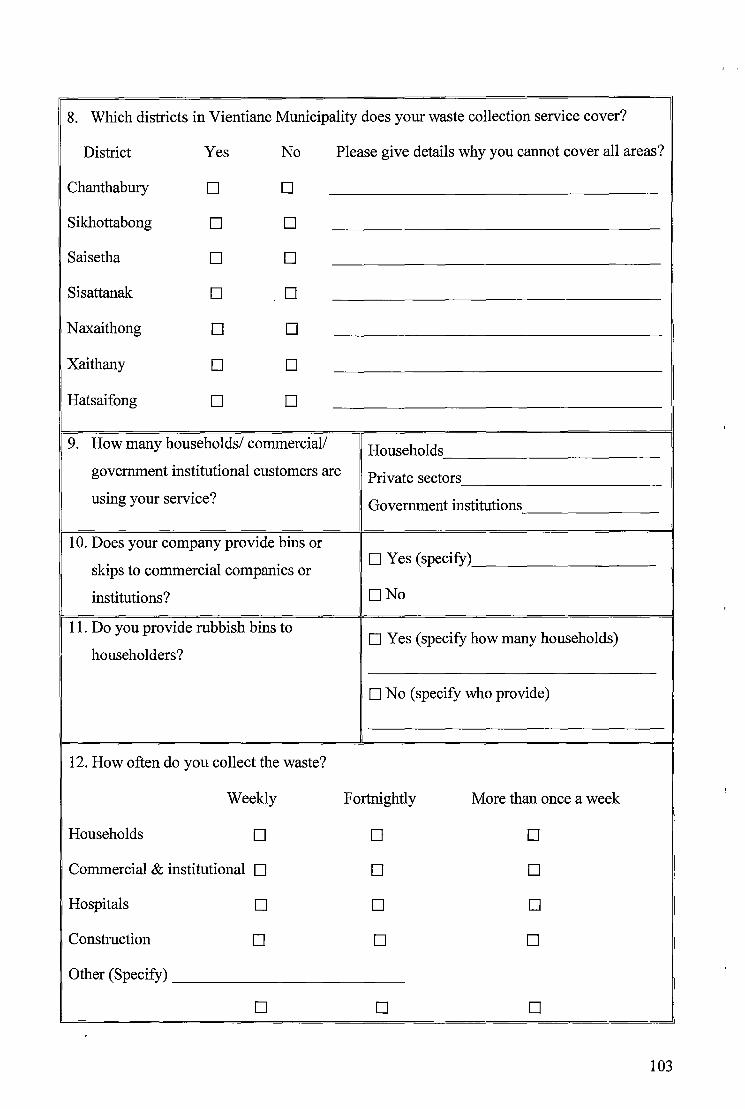
8. Which districts in Vientiane Municipality does your waste collection service cover?
District Yes No Please give details why you cannot cover all areas?
Chanthabury D D
Sikhottabong D D
Saisetha D D
Sisattanak D D
Naxaithong D D
Xaithany D D
Hatsaifong D D
9. How many households/ commercial/ Households government institutional customers are Private sectors using your service? Government institutions
10. Does your company provide bins or
skips to commercial companies or D Yes (specify)
institutions? DNo
11. Do you provide rubbish bins to D Yes (specify how many households)
householders?
D No (specify who provide)
12. How often do you collect the waste?
Weekly Fortnightly More than once a week
Households D D D
Commercial & institutional D D D
Hospitals D D D
Construction D D D
Other (Specify)
D D D
103
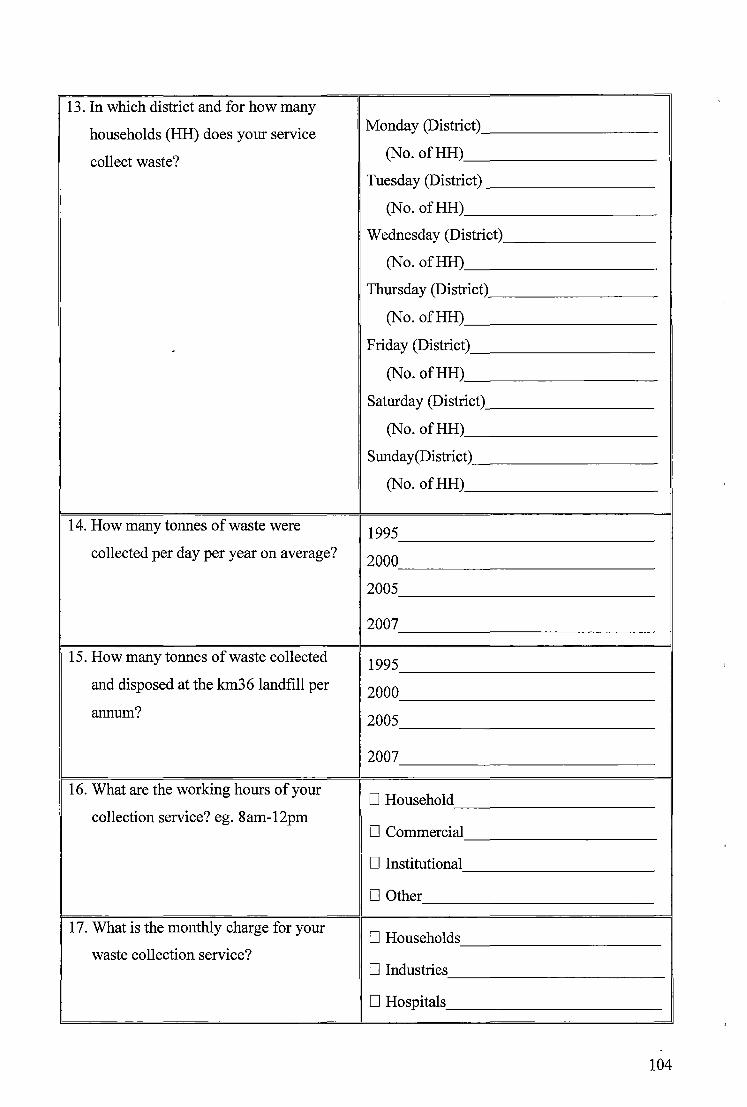
13. In which district and for how many
households (HH) does your service Monday (District)
collect waste? (No. ofHH)
Tuesday (District)
(No. ofHH)
Wednesday (District)
(No. ofHH)
Thursday (District)
(No. ofHH)
. Friday (District)
(No. ofHH)
Saturday (District)
(No. ofHH)
Sunday(District)
(No. ofHH)
14. How many tonnes of waste were 1995 collected per day per year on average? 2000
2005
2007
15. How many tonnes of waste collected 1995 and disposed at the km36 landfill per 2000 annum? 2005
2007
16. What are the working hours of your D Household
collection service? eg. 8am-12pm D Commercial
D Institutional
D Other
17. What is the monthly charge for your D Households
waste collection service? D Industries
D Hospitals
104
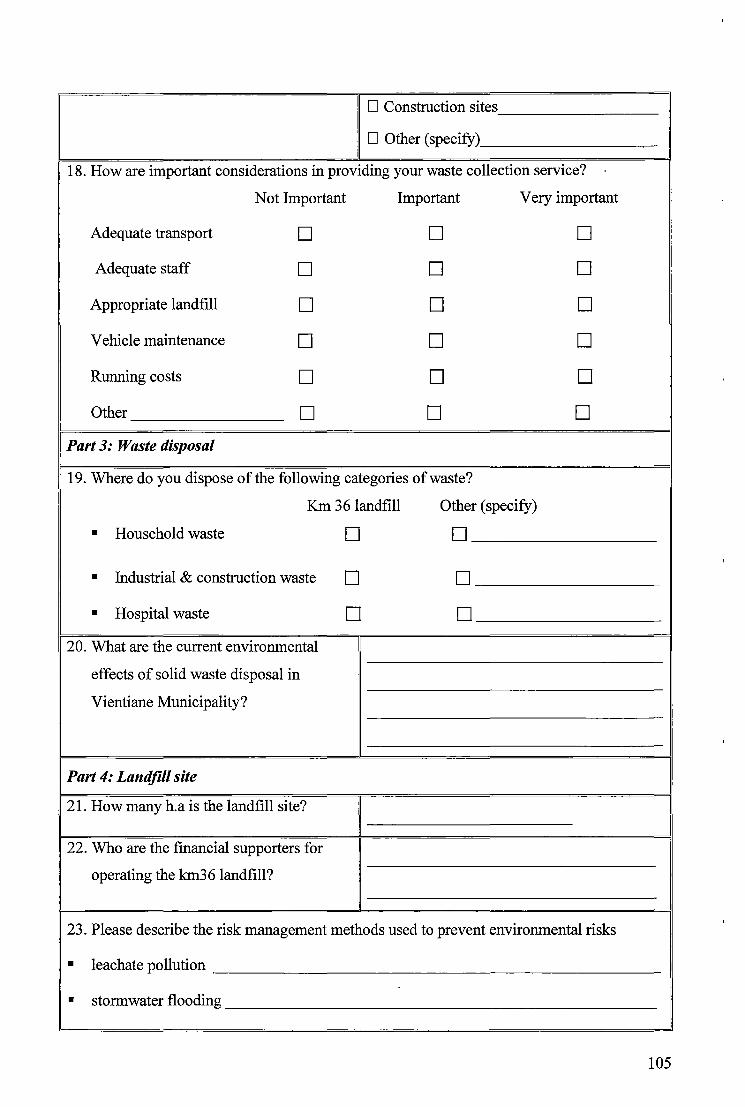
D Construction sites
D Other (specify)
18. How are important considerations in providing your waste collection service?
Not Important Important Very important
Adequate transport D D D
Adequate staff D D D
Appropriate landfill D D D
Vehicle maintenance D D D
Running costs D D D
Other D D D .,, YYF ~·· l ~Jo ,, u.>u;. ulSposa
19. Where do you dispose of the following categories of waste?
Km 3 6 landfill Other (specify)
• Household waste D D
• Industrial & construction waste D D
• Hospital waste D D
20. What are the current environmental
effects of solid waste disposal in
Vientiane Municipality?
I Part 4: Landfill site I
121. How many h.a is the landfill site?
I 22. Who are the financial supporters for
I I
operating the km3 6 landfill?
23. Please describe the risk management methods used to prevent environmental risks
• leachate pollution
• stormwater flooding
105
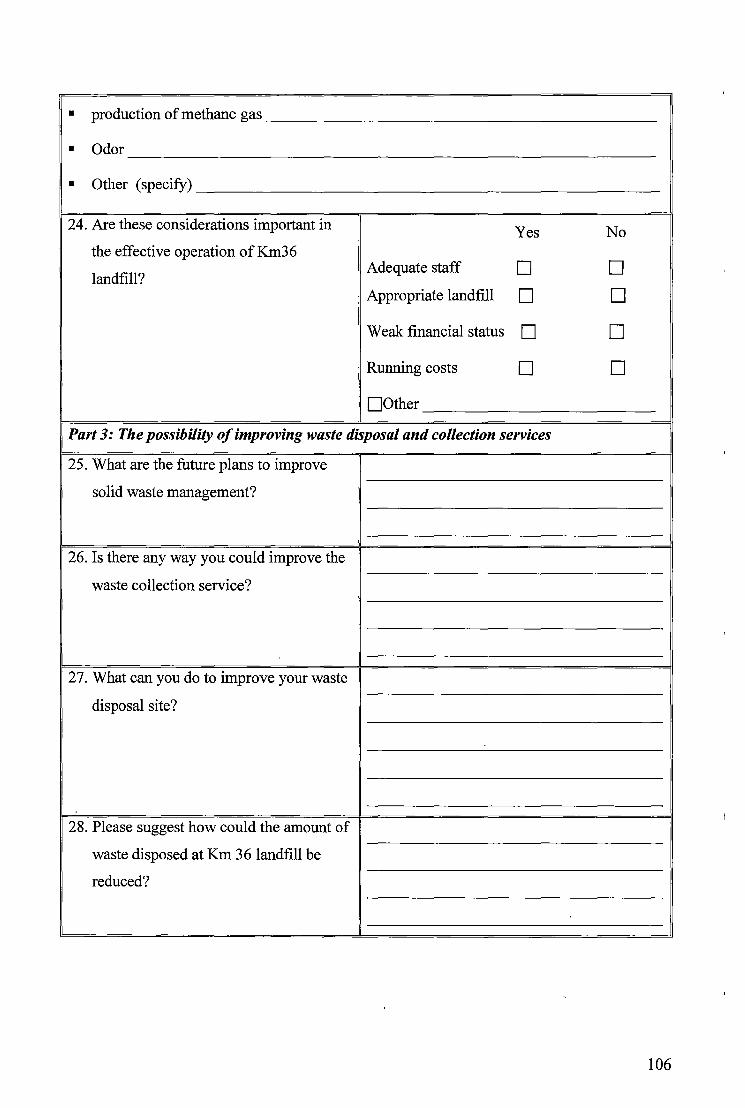
• production of methane gas
• Odor
• Other (specify)
24. Are these considerations important in Yes No the effective operation of Krn36
landfill? Adequate staff D D Appropriate landfill D D
Weak financial status D D
Running costs D D
OOther
Part 3: The possibility of improving waste disposal and collection services
25. What are the future plans to improve
solid waste management?
26. Is there any way you could improve the
waste collection service?
27. What can you do to improve your waste
disposal site?
28. Please suggest how could the amount of
waste disposed at Km 3 6 landfill be
reduced?
106
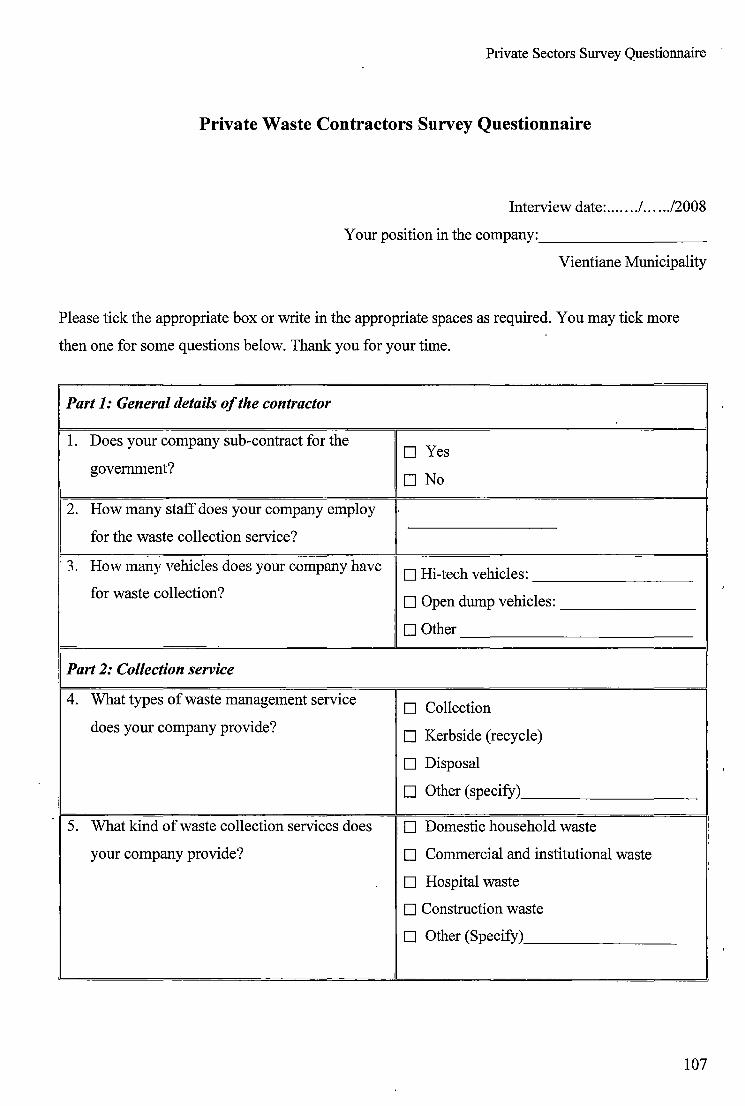
Private Sectors Survey Questionnaire '
Private Waste Contractors Survey Questionnaire
Interview date: ...... ./ ..... ./2008
Your position in the company: _________ _
Vientiane Municipality
Please tick the appropriate box or write in the appropriate spaces as required. You may tick more
then one for some questions below. Thank you for your time.
Part 1: General details of the contractor
1. Does your company sub-contract for the Yes D
government? D No
2. How many staff does your company employ
for the waste collection service?
3. How many vehicles does your company have D Hi-tech vehicles: for waste collection? D Open dump vehicles:
D Other
I Part 2: Collection service
4. What types of waste management service D Collection
does your company provide? D Kerbside (recycle)
D Disposal
D Other (specify)
5. What kind of waste collection services does D Domestic household waste
your company provide? D Commercial and institutional waste
D Hospital waste
D Construction waste
D Other (Specify)
I
107
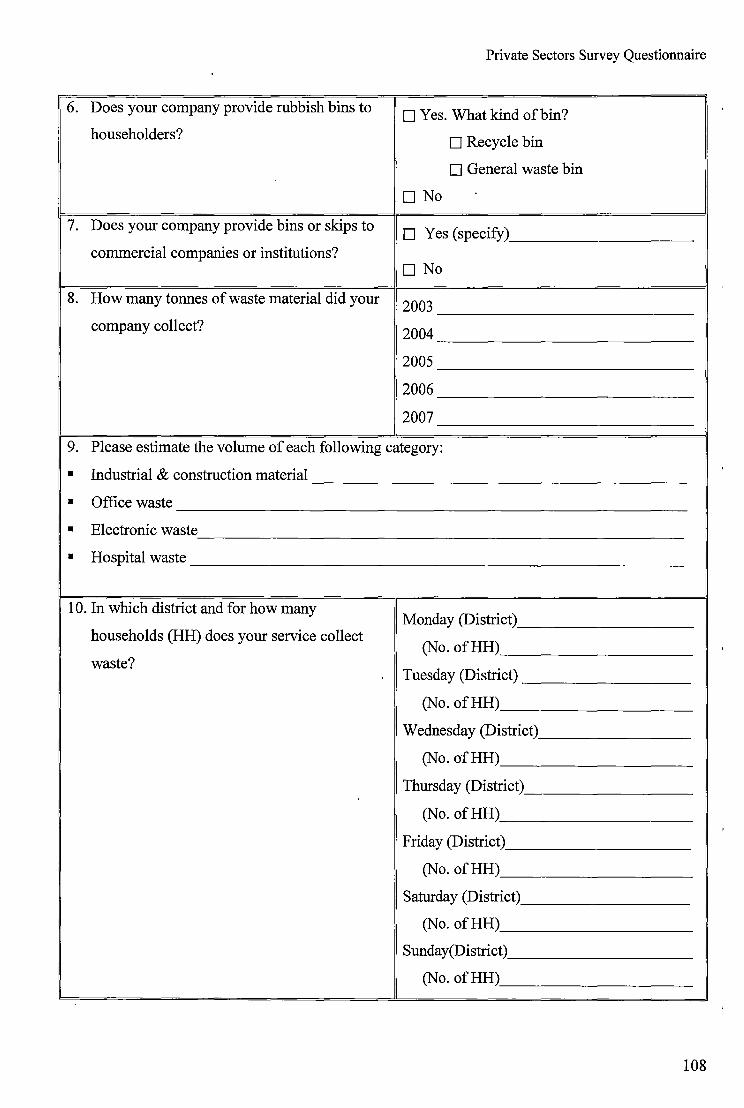
Private Sectors Survey Questionnaire
6. Does your company provide rubbish bins to D Yes. What kind of bin? householders? D Recycle bin
D General waste bin
D No
7. Does your company provide bins or skips to D Yes (specify) commercial companies or institutions?
D No
8. How many tonnes of waste material did your 2003 company collect? 2004
2005
2006
2007
9. Please estimate the volume of each following category:
• Industrial & construction material
• Office waste
• Electronic waste
• Hospital waste --
10. In which district and for how many Monday (District)
households (HH) does your service collect (No. ofHH)
waste? Tuesday (District)
(No. ofHH)
Wednesday (District)
(No. ofHH)
Thursday (District)
(No. ofHH)
Friday (District)
(No. ofHH)
Saturday (District)
(No. ofHH)
Sunday(District)
(No. ofHH)
108
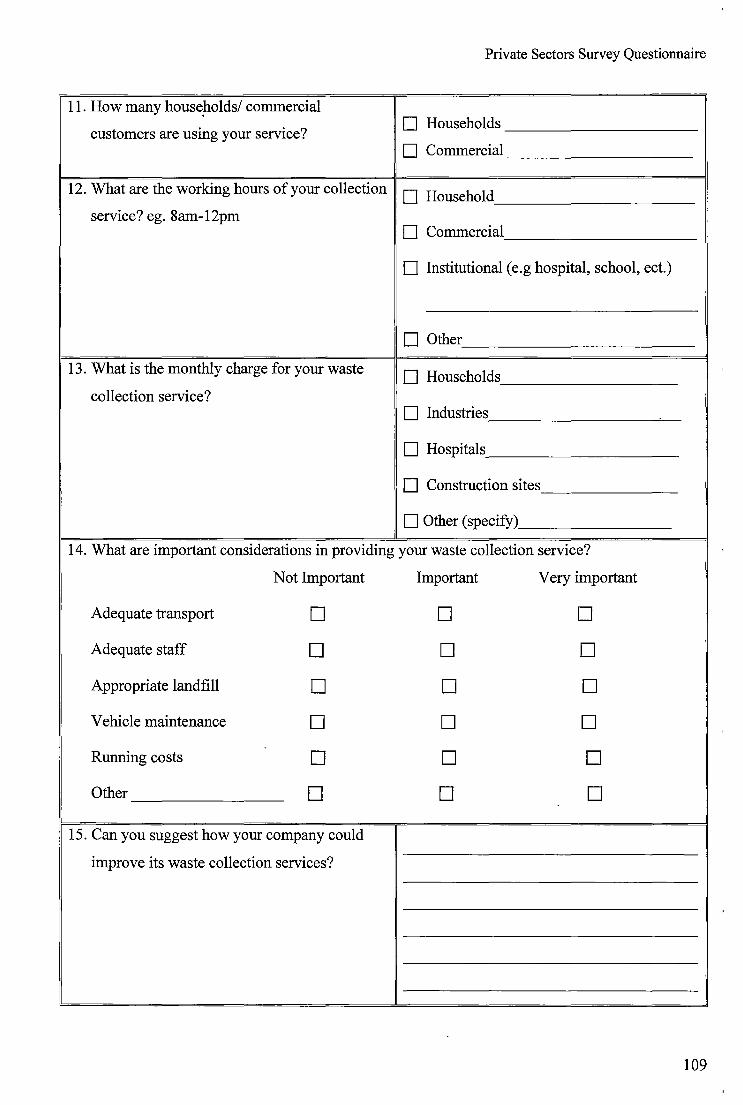
Private Sectors Survey Questionnaire
11. How many housep.olds/ commercial
customers are using your service? D Households
D Commercial
12. What are the working hours of your collection D Household service? eg. 8am-12pm
D Commercial
D Institutional (e.g hospital, school, ect.)
D Other
13. What is the monthly charge for your waste D Households collection service?
D Industries
D Hospitals
D Construction sites
D Other (specify)
14. What are important considerations in providing your waste collection service?
Not Important Important Very important
Adequate transport D D D
Adequate staff D D D
Appropriate landfill D D D
Vehicle maintenance D D D
Running costs D D D
Other D D D
15. Can you suggest how your company could
improve its waste collection services?
109
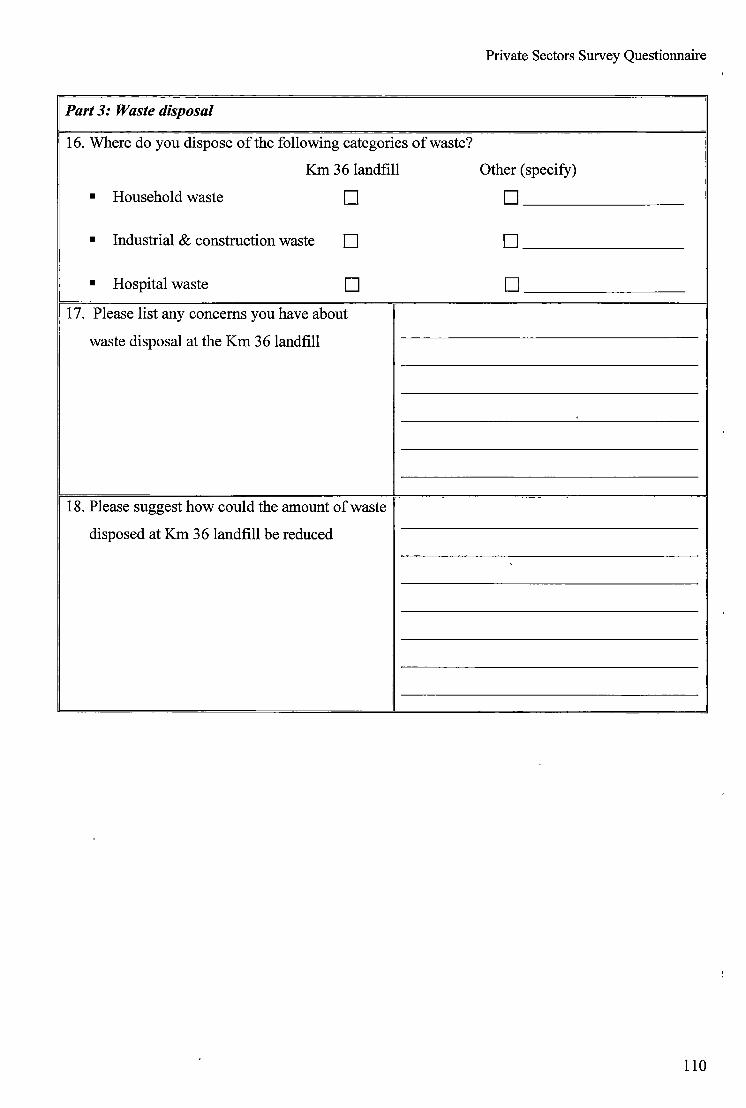
Private Sectors Survey Questionnaire
Part 3: Waste disposal
16. Where do you dispose of the following categories of waste?
Km 36 landfill Other (specify)
• Household waste D D
• Industrial & construction waste D D
• Hospital waste D D 17. Please list any concerns you have about
waste disposal at the Km 3 6 landfill
18. Please suggest how could the amount of waste
disposed at Km 36 landfill be reduced
110
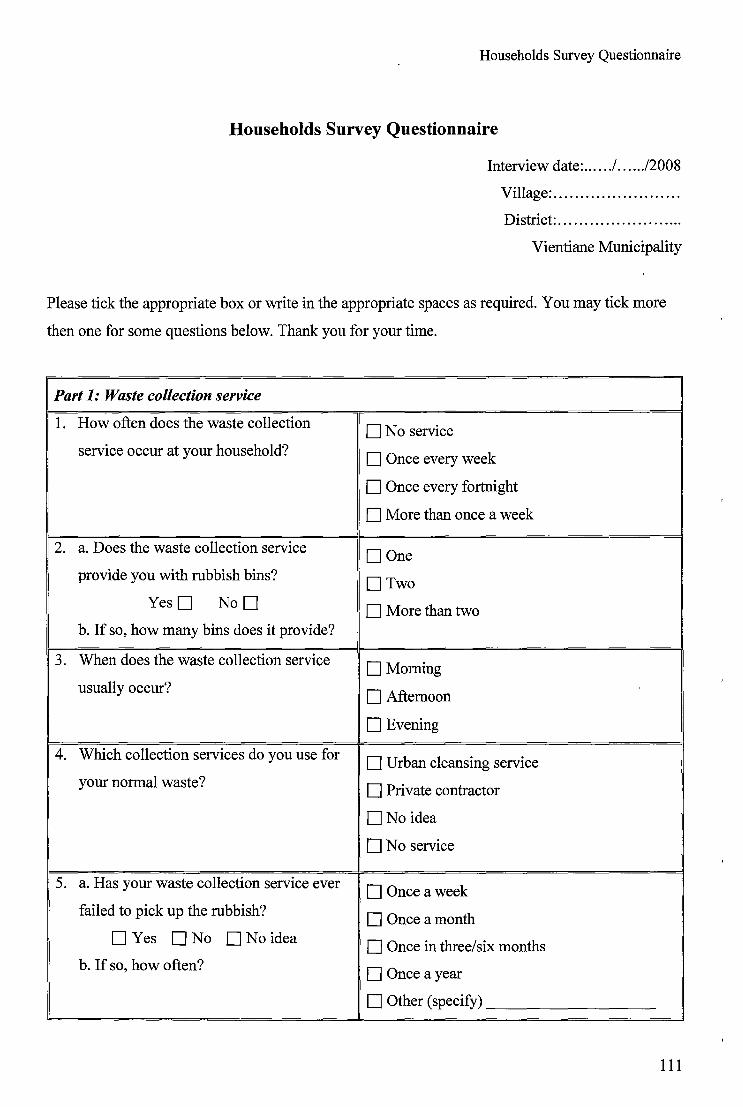
Households Survey Questionnaire
Households Survey Questionnaire
Interview date: ..... ./ ..... ./2008
Village: ....................... .
District: ....................... .
Vientiane Municipality
Please tick the appropriate box or write in the appropriate spaces as required. You may tick more
then one for some questions below. Thank you for your time.
Part 1: Waste collection service
1. How often does the waste collection
service occur at your household?
2. a. Does the waste collection service
provide you with rubbish bins?
YesD No D
b. If so, how many bins does it provide?
3. When does the waste collection service
usually occur?
4. Which collection services do you use for
your normal waste?
5. a. Has your waste collection service ever
failed to pick up the rubbish?
D Yes D No D No idea
b. If so, how often?
DNo service
D Once every week
D Once every fortnight
D More than once a week
DOne
DTwo
D More than two
DMoming
D Afternoon
D Evening
D Urban cleansing service
D Private contractor
DNo idea
D No service
D Once a week
D Once a month
D Once in three/six months
D Once a year
D Other (specify) ________ _
111
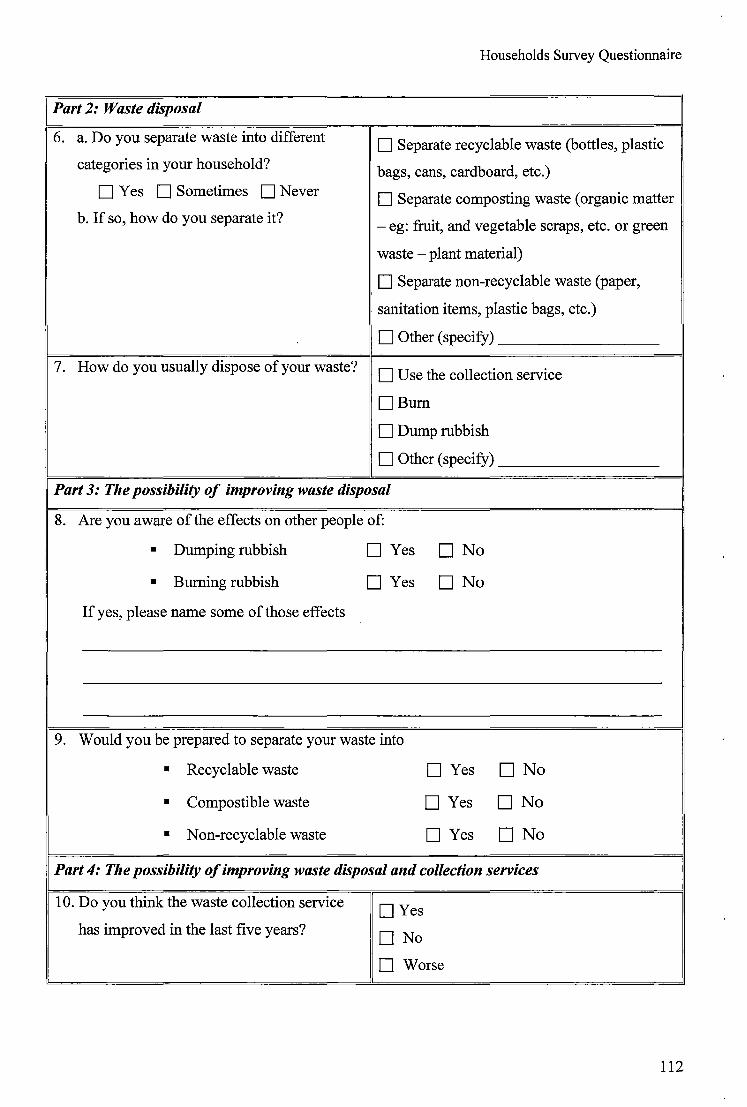
Households Survey Questionnaire
Part 2: Waste disposal
6. a. Do you separate waste into different D Separate recyclable waste (bottles, plastic categories in your household? bags, cans, cardboard, etc.)
DYes D Sometimes DNever D Separate composting waste (organic matter b. If so, how do you separate it? - eg: fruit, and vegetable scraps, etc. or green
waste - plant material)
D Separate non-recyclable waste (paper,
sanitation items, plastic bags, etc.)
D Other (specify)
7. How do you usually dispose of your waste? D Use the collection service
DBurn
D Dump rubbish
D Other (specify)
Part 3: The possibility of improving waste disposal
8. Are you aware of the effects on other people of:
• Dumping rubbish D Yes D No
• Burning rubbish D Yes D No
If yes, please name some of those effects
9. Would you be prepared to separate your waste into
• Recyclable waste D Yes D No
• Compostible waste D Yes D No
• Non-recyclable waste D Yes D No
I Part 4: The possibility of improving waste disposal and collection services
10. Do you think the waste collection service DYes
has improved in the last five years? D No
D Worse
112
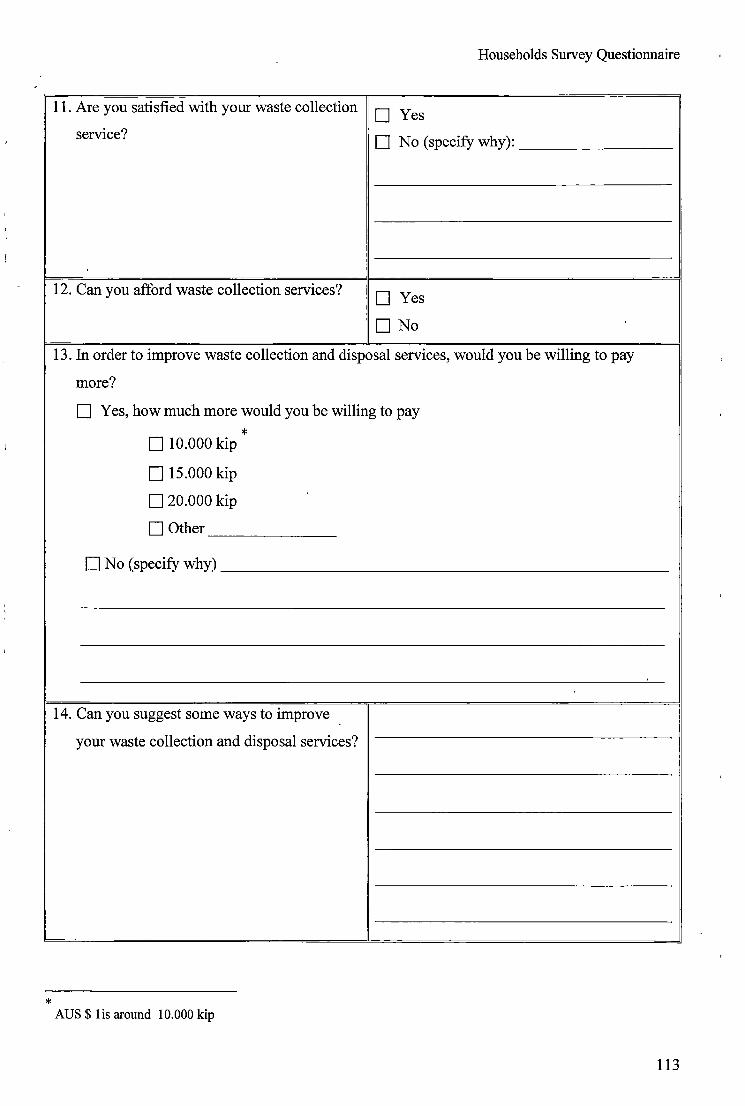
Households Survey Questionnaire
11. Are you satisfied with your waste collection D Yes service? D No (specify why):
12. Can you afford waste collection services? D Yes
D No
13. In order to improve waste collection and disposal services, would you be willing to pay
more?
D Yes, how much more would you be willing to pay
* D 10.000 kip
D 1s.ooo kip
D 20.000 kip
D Other
0 No (specify why)
14. Can you suggest some ways to improve
your waste collection and disposal services?
* AUS$ lis around 10.000 kip
113