Embed Size (px)
Citation preview
Solomon IslandsANALYSIS OF THE 2005/06 HOUSEHOLD INCOME AND EXPENDITURE SURVEY
Final report on the estimation of basic needs poverty lines, and the incidence and characteristics of poverty in Solomon Islands
Solomon Islands National Statistics Officeand UNDP Pacific Centre
Suva, Fiji
July 2008

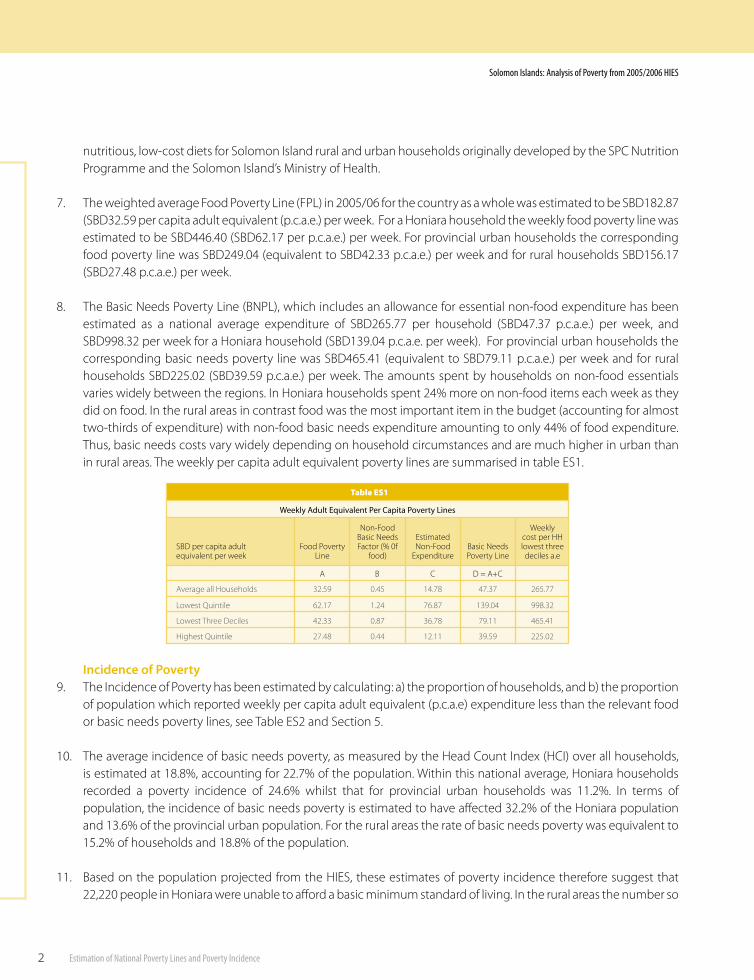
Photo credits - Jeff Liew/UNDP, Reama Biumaiono/UNDP
�
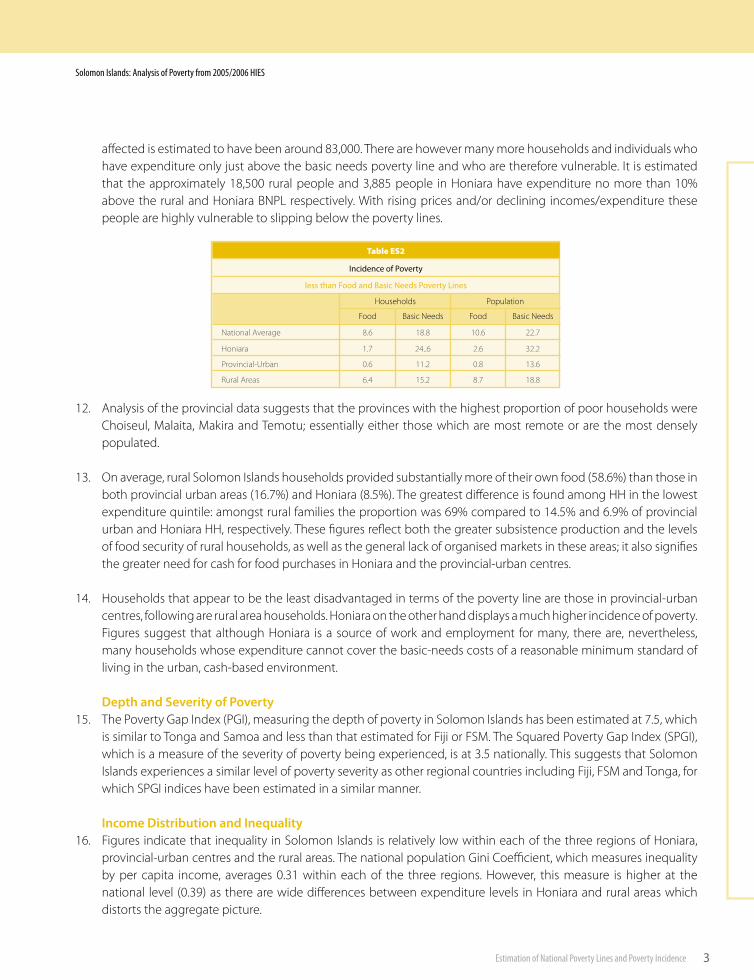
Solomon Islands: Analysis of Poverty from 2005/2006 HIES
Estimation of National Poverty Lines and Poverty Incidence
Solomon IslandsANALYSIS OF THE 2005/06 HOUSEHOLD INCOME AND EXPENDITURE SURVEY
Final report on the estimation of basic needs poverty lines, and the incidence and characteristics of poverty in Solomon Islands Solomon Islands National Statistics Office and UNDP Pacific Centre Suva, Fiji. July 2008
��
Solomon Islands: Analysis of Poverty from 2005/2006 HIES
Estimation of National Poverty Lines and Poverty Incidence
This analysis of the household income and expenditure survey has been undertaken with the support of technical assistance provided by the UNDP Pacific Centre in Fiji. The report and analysis is one in a series of national poverty reports that are being compiled cooperatively between national statistics offices, SPC, ADB and UNDP Pacific Centre based on recent Household Income and Expenditure Surveys (HIES). The work in Solomon Islands benefited from support and technical inputs from the Solomon Islands Government Statistician, Nick Gagahe, who guided the analysis. In the National Statistics Office the primary collaborators were Willington Piduru, Deputy Government Statistician; Douglas Kimi, Chief Statistician (Social); Dever Reggie, Chief Statistician (Surveys and Census); Joachim Gaiafuna, Chief Statistician (Economics); Andrew Kakate, Principal Statistician (Economics); and Anna Luvu, Senior Statistician (CPI) who were responsible for coordinating and supervising the general conduct of the surveys and the processing of survey data. It was a pleasure to work with these staff of the National Statistics Office and the analysis has benefited from their insights, technical support and dedication. The support and encouragement of the Hon Minister for Finance and Treasury and the Permanent Secretary for Finance (Economic Reform, Budget and Statistics), Shadrach Fanega, is acknowledged with appreciation. Technical support was also provided by staff of the Statistics Programme at SPC, notably by Graeme Brown and Gerald Haberkorn, Regional Statisticians, as well as Chris Ryan and Greg Keeble and Kim Robertson, SPC/ADB Consultant to the Regional Poverty Programme. Valuable inputs and comments have been provided on working drafts of the paper by UN colleagues, notably Jean-Louis Rallu of UNFPA, Fiji and my colleagues at the UNDP Pacific Centre, especially Carol Flore, Jeff Liew, Roderic Evers and Kai Carter. The analysis also benefited from the insights of Michelle Llegu, Coordinator of the SPC/ADB Participatory Poverty Assessment. However, none of those who have contributed their advice and insights are responsible for any errors in the analysis presented here. This report and analysis of the poverty lines is not the end of the story; it focuses only on the “headline” poverty lines and indicators and the broad characteristics of those in the lowest expenditure deciles. Further work is needed to make estimates of the poverty incidence of US$1 and US$2 per day for monitoring MDG 1. This is being done with assistance of both SPC and the Australian Bureau of Statistics. It is hoped that this national poverty report and analysis will lead to further and more detailed investigation of some of the broader socio-economic aspects of the survey data enabling greater policy substance to be added to the key poverty indicators and characteristics. It is hoped that this will also further develop the various conclusions and hypotheses relating to poverty in Solomon Islands which are covered in this report. Further enquiries regarding the Report should be addressed to the Solomon Islands National Statistics Office in the first instance with a copy to the undersigned.
David F AbbottPacific Regional Macroeconomic and Poverty Reduction AdvisorUNDP Pacific [email protected] 18, 2008
Acknowledgements
���
Solomon Islands: Analysis of Poverty from 2005/2006 HIES
Estimation of National Poverty Lines and Poverty Incidence
Acknowledgements iiTable of Contents iiiAbbreviation ivSolomon Map vExecutive Summary 1Introduction 1Food and Basic Needs Poverty Lines 1Incidence of Poverty 2Depth and Severity of Poverty 3Income Distribution and Inequality 4Conclusions 51. Purpose of Paper 72. Introduction 8 2.1 Defining Hardship and Poverty in the Solomon Island Context 8 2.2 Poverty = Hardship: A Pacific Definition of Poverty 10 2.3 What is the Poverty Line 11 2.4 Estimating the Poverty Line for Solomon Islands 113. The Household Income and Expenditure Survey 12 3.1 Survey Methodology 12 3.2 Overview of HIES Results 13 3.2.1 Household Size and Adult Equivalence 13 3.2.2 Household Expenditure 144. The Food Poverty Line 22 4.1 Low-Cost Diets 22 4.2 The Food Poverty Lines 235. The Basic Needs Poverty Line 24 5.1 Non-Food Basic Needs Expenditure 24 5.2 Basic Needs Poverty Lines 256. The Incidence, Depth & Severity of Poverty in Solomon Islands 25 6.1 Head Count Ratio 25 6.2 Incidence of Food Poverty 26 6.3 Incidence of Basic Needs Poverty 26 6.4 Depth and Severity of Poverty 28 6.5 Income Distribution and Inequality 287. Who Are the Poor and What are their Characteristics? 30 7.1 Location of the Rural Poor 30 7.2 Age of Household Heads 31 7.3 Gender of Household Heads 31 7.4 Children in Poverty 32 7.5 Economic Activity 33 7.6 Educational Attainment 34 7.7 Energy Access and Use 35 7.8 Access to Water and Sanitation 368. Conclusions 38 8.1 Poverty of Income or Opportunity? 38 8.2 How Does Poverty Affect People 40 Appendix Table 43
Table of contents
�v
Solomon Islands: Analysis of Poverty from 2005/2006 HIES
Estimation of National Poverty Lines and Poverty Incidence
ABS Australian Bureau of StatisticsADB Asian Development Banka.e. adult equivalentBNPL Basic Needs Poverty LineCGER Combined Gross Enrolment RateCPI Consumer Price IndexCSO Civil Society OrganisationCVI Composite Vulnerability IndexEEZ Exclusive Economic ZoneEU European UnionFAO Food and Agriculture Organization of the United NationsFPL Food Poverty LineFSM Federated States of MicronesiaGDP Gross Domestic ProductGNP Gross National ProductHCI Head Count IndexHDI Human Development IndexHDR Human Development ReportHH HouseholdHIES Household Income and Expenditure SurveyHPI Human Poverty IndexIMF International Monetary FundIP Incidence of PovertyLFPR Labour Force Participation RateMDG Millennium Development GoalsNCD Non-communicable Disease
NDS National Development StrategiesNGO Non Government OrganisationPACER Pacific Agreement on Closer Economic RelationsPAH Participatory Assessment of Hardshipp.c.a.e per capita adult equivalentPGI Poverty Gap IndexPHDR Pacific Human Development ReportPIC(s) Pacific Island Country/CountriesPICTA Pacific Island Countries Trade AgreementPNG Papua New GuineaPPA Participatory Poverty Assessment PPP Purchasing Power ParityPPS Probability Proportional to SizePRS Poverty Reduction StrategiesRMI Republic of Marshall IslandsSDP Strategic Development PlanSOE State Owned EnterpriseSPC Secretariat of the Pacific CommunitySPGI Squared Poverty Gap Index STI Sexually Transmitted InfectionsSTR Student Teacher RatioUN United NationsUNDP United Nations Development ProgrammeUNFPA United Nations Population FundWHO World Health OrganizationWTO World Trade Organisation
Abbreviations
v
Solomon Islands: Analysis of Poverty from 2005/2006 HIES
Estimation of National Poverty Lines and Poverty Incidence
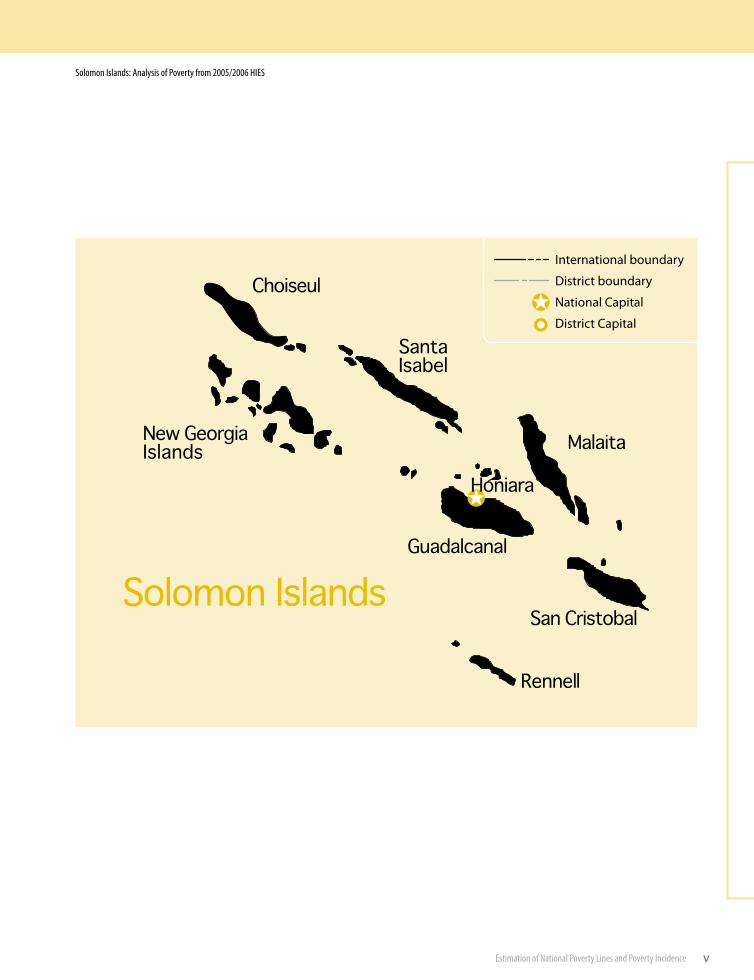
Internat�onal boundary
D�str�ct boundary
Nat�onal Cap�tal
D�str�ct Cap�tal

v�
Solomon Islands: Analysis of Poverty from 2005/2006 HIES
Estimation of National Poverty Lines and Poverty Incidence
Solomon Islands: Analysis of Poverty from 2005/2006 HIES
Estimation of National Poverty Lines and Poverty Incidence
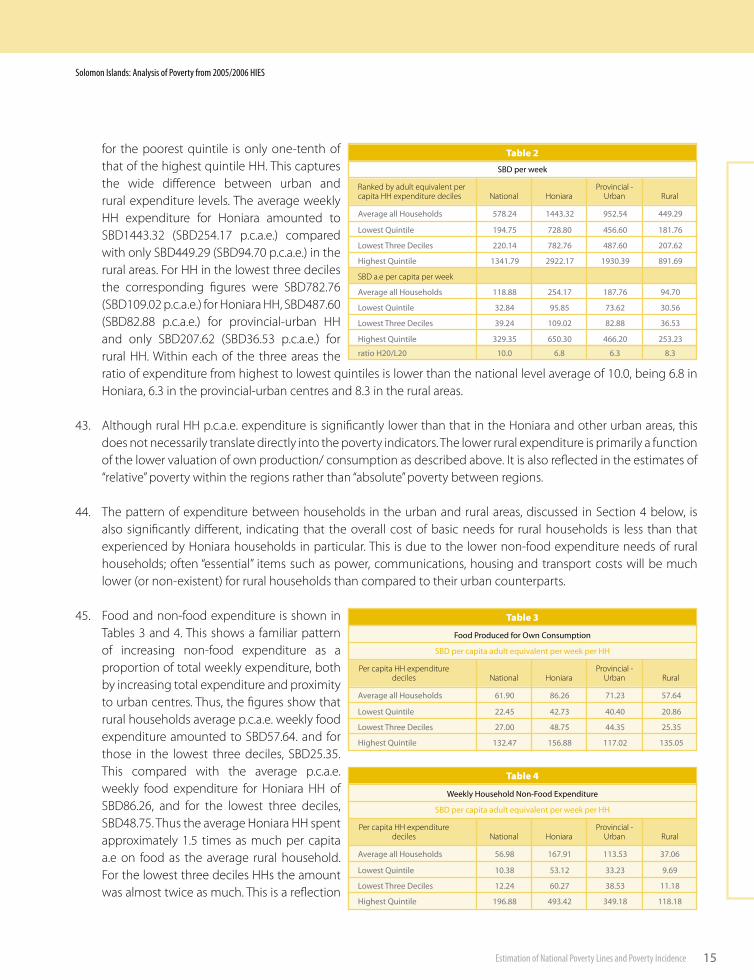
Executive Summary
Introduction1. Poverty as measured by national poverty lines is a relative measure of hardship. It assesses the basic costs of a
minimum standard of living in a particular society and measures the number of households and/or the proportion of the population that are deemed to not be able to meet these basic needs. The costs and basic-needs for individual households may differ across the country from the urban to the rural areas. It is therefore necessary to analyse each of these specific regions to provide an understanding of the relative costs and standards of living of households and people living in the different parts of the country.
2. Poverty analysis is primarily concerned therefore with identifying within each society who the poor are, where they live and what are the characteristics that set these poor households apart from those that are better-off. In order to be able to develop targeted pro-poor poverty reduction or alleviation strategies it is necessary to try to understand why some are poor and others are not. Is the lack of education a common characteristic? Is the age, gender or employment status of the head of household a common factor? By analysing household income and expenditure data it is possible to begin to gain a better understanding of these issues and how they might be addressed in order to reduce hardship and poverty.
3. For Solomon Islands household income and expenditure data from the 2005/06 Urban and Rural Household Income and Expenditure Surveys (HIES) has been used to estimate national and regional Food and Basic Needs Poverty Lines - for Honiara, provincial-urban centres and rural areas. From these the incidence levels, depth and severity of poverty in Solomon Islands and across these regions have been measured. Estimates have also been made of Gini coefficients on levels of income inequality. An analysis of the characteristics of the poorest 30% of households has also been undertaken.
4. Every country experiences some incidence of poverty, but the levels of incidence measured by national poverty lines are not directly comparable across countries. Thus two countries may have similar levels of relative poverty measured by national poverty lines but might have very different levels of absolute poverty.
5. The measurement of absolute poverty, enabling cross-country comparisons of the extent of poverty, is usually done through the estimating of the US$1 or US$2 per day PPP values used in Goal 1 of the Millennium Development Goals (MDGs). Presently this measure of poverty cannot be estimated for Solomon Islands or Pacific Islands generally as the necessary PPP indices are not yet available; however estimates should be available in the near future enabling a more detailed cross country analysis to be made.
Food and Basic Needs Poverty Lines6. The Food Poverty Lines (FPL) for Honiara, provincial-urban and rural Solomon Islands households/families were
calculated from the actual diary food expenditure patterns recorded for households in the lowest three-deciles of per capita adult-equivalent expenditure (p.c.a.e.).1 For Honiara HH, Honiara market prices were used to cost local foods, either own produce or purchased items. In the provincial urban and rural areas costs/values for local foods were based on householders’ estimates of their worth. This resulted in the costs of local foods outside Honiara being much lower than in Honiara, by a factor of at least half, and in some cases by two-thirds. This reflects the fact that in the rural areas a far greater proportion of food is home grown and markets, as such, do not really exist. The food consumption costs so generated were then checked against the notional costs of the two minimally
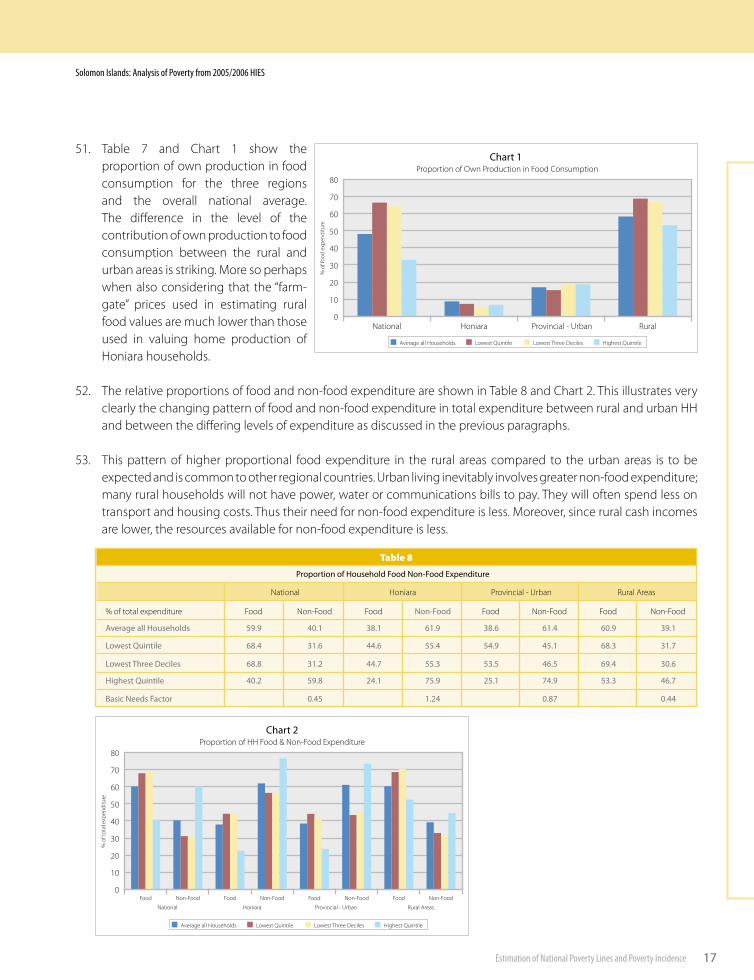
�
� For an explanat�on of th�s and other terms used �n the analys�s refer to the ma�n report.
�
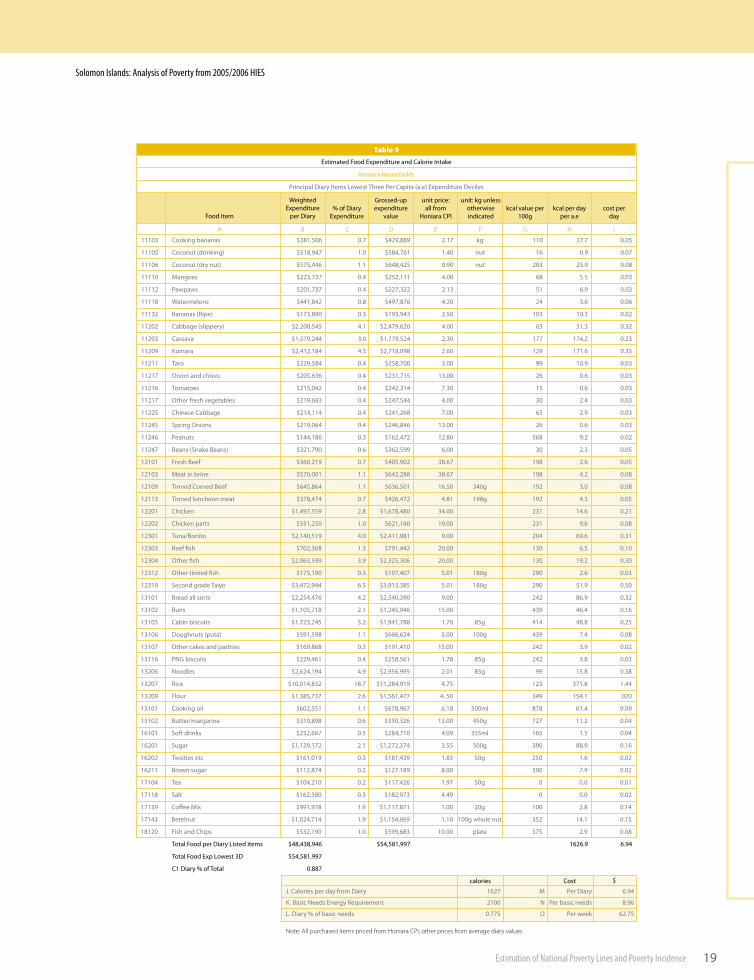
Solomon Islands: Analysis of Poverty from 2005/2006 HIES
Estimation of National Poverty Lines and Poverty Incidence
nutritious, low-cost diets for Solomon Island rural and urban households originally developed by the SPC Nutrition Programme and the Solomon Island’s Ministry of Health.
7. The weighted average Food Poverty Line (FPL) in 2005/06 for the country as a whole was estimated to be SBD182.87 (SBD32.59 per capita adult equivalent (p.c.a.e.) per week. For a Honiara household the weekly food poverty line was estimated to be SBD446.40 (SBD62.17 per p.c.a.e.) per week. For provincial urban households the corresponding food poverty line was SBD249.04 (equivalent to SBD42.33 p.c.a.e.) per week and for rural households SBD156.17 (SBD27.48 p.c.a.e.) per week.
8. The Basic Needs Poverty Line (BNPL), which includes an allowance for essential non-food expenditure has been estimated as a national average expenditure of SBD265.77 per household (SBD47.37 p.c.a.e.) per week, and SBD998.32 per week for a Honiara household (SBD139.04 p.c.a.e. per week). For provincial urban households the corresponding basic needs poverty line was SBD465.41 (equivalent to SBD79.11 p.c.a.e.) per week and for rural households SBD225.02 (SBD39.59 p.c.a.e.) per week. The amounts spent by households on non-food essentials varies widely between the regions. In Honiara households spent 24% more on non-food items each week as they did on food. In the rural areas in contrast food was the most important item in the budget (accounting for almost two-thirds of expenditure) with non-food basic needs expenditure amounting to only 44% of food expenditure. Thus, basic needs costs vary widely depending on household circumstances and are much higher in urban than in rural areas. The weekly per capita adult equivalent poverty lines are summarised in table ES1.
Incidence of Poverty9. The Incidence of Poverty has been estimated by calculating: a) the proportion of households, and b) the proportion
of population which reported weekly per capita adult equivalent (p.c.a.e) expenditure less than the relevant food or basic needs poverty lines, see Table ES2 and Section 5.
10. The average incidence of basic needs poverty, as measured by the Head Count Index (HCI) over all households, is estimated at 18.8%, accounting for 22.7% of the population. Within this national average, Honiara households recorded a poverty incidence of 24.6% whilst that for provincial urban households was 11.2%. In terms of population, the incidence of basic needs poverty is estimated to have affected 32.2% of the Honiara population and 13.6% of the provincial urban population. For the rural areas the rate of basic needs poverty was equivalent to 15.2% of households and 18.8% of the population.
11. Based on the population projected from the HIES, these estimates of poverty incidence therefore suggest that 22,220 people in Honiara were unable to afford a basic minimum standard of living. In the rural areas the number so
SBD per capita adult equivalent per week
Weekly Adult Equ�valent Per Cap�ta Poverty L�nes
Food PovertyLine
Estimated Non-Food
Expenditure
Average all Households 32.59 0.45 14.78 47.37
Lowest Quintile 62.17 1.24 76.87 139.04
Lowest Three Deciles 42.33 0.87 36.78 79.11
Highest Quintile 27.48 0.44 12.11 39.59
Table ES1
Non-Food Basic Needs Factor (% 0f
food)Basic NeedsPoverty Line
A B C D = A+C
265.77
998.32
465.41
225.02
Weekly cost per HH lowest three deciles a.e
�
Solomon Islands: Analysis of Poverty from 2005/2006 HIES
Estimation of National Poverty Lines and Poverty Incidence
affected is estimated to have been around 83,000. There are however many more households and individuals who have expenditure only just above the basic needs poverty line and who are therefore vulnerable. It is estimated that the approximately 18,500 rural people and 3,885 people in Honiara have expenditure no more than 10% above the rural and Honiara BNPL respectively. With rising prices and/or declining incomes/expenditure these people are highly vulnerable to slipping below the poverty lines.
12. Analysis of the provincial data suggests that the provinces with the highest proportion of poor households were Choiseul, Malaita, Makira and Temotu; essentially either those which are most remote or are the most densely populated.
13. On average, rural Solomon Islands households provided substantially more of their own food (58.6%) than those in both provincial urban areas (16.7%) and Honiara (8.5%). The greatest difference is found among HH in the lowest expenditure quintile: amongst rural families the proportion was 69% compared to 14.5% and 6.9% of provincial urban and Honiara HH, respectively. These figures reflect both the greater subsistence production and the levels of food security of rural households, as well as the general lack of organised markets in these areas; it also signifies the greater need for cash for food purchases in Honiara and the provincial-urban centres.
14. Households that appear to be the least disadvantaged in terms of the poverty line are those in provincial-urban centres, following are rural area households. Honiara on the other hand displays a much higher incidence of poverty. Figures suggest that although Honiara is a source of work and employment for many, there are, nevertheless, many households whose expenditure cannot cover the basic-needs costs of a reasonable minimum standard of living in the urban, cash-based environment.
Depth and Severity of Poverty15. The Poverty Gap Index (PGI), measuring the depth of poverty in Solomon Islands has been estimated at 7.5, which
is similar to Tonga and Samoa and less than that estimated for Fiji or FSM. The Squared Poverty Gap Index (SPGI), which is a measure of the severity of poverty being experienced, is at 3.5 nationally. This suggests that Solomon Islands experiences a similar level of poverty severity as other regional countries including Fiji, FSM and Tonga, for which SPGI indices have been estimated in a similar manner.
Income Distribution and Inequality16. Figures indicate that inequality in Solomon Islands is relatively low within each of the three regions of Honiara,
provincial-urban centres and the rural areas. The national population Gini Coefficient, which measures inequality by per capita income, averages 0.31 within each of the three regions. However, this measure is higher at the national level (0.39) as there are wide differences between expenditure levels in Honiara and rural areas which distorts the aggregate picture.
Inc�dence of Poverty
Food
Table ES2
less than Food and Bas�c Needs Poverty L�nes
National Average 8.6
Honiara 1.7
Provincial-Urban 0.6
Rural Areas 6.4 8.7 18.8
0.8 13.6
2.6 32.2
10.6 22.7
15.2
11.2
24..6
18.8
Basic Needs Food Basic Needs
Households Population
�
Solomon Islands: Analysis of Poverty from 2005/2006 HIES
Estimation of National Poverty Lines and Poverty Incidence
Who are the Poor and What are their Characteristics?
Gender17. Gender plays a role in determining the incidence of poverty in Solomon Islands. The HIES analysis suggests
that female-headed households are slightly over-represented in the lowest three expenditure deciles. In rural areas female-headed households are particularly over-represented in the lowest quintile (20%) of households, suggesting that these households are amongst the very poorest in these areas. Overall, female-headed households are estimated to account for 6.5% of all HH, but account for around 7.3% of all those HH falling below the basic needs poverty line.
Children in Poverty 18. In Honiara 38.7% of children live in households in the three lowest deciles as compared to 34.3% in provincial
urban and 33.6% in rural areas. This suggests that children in Honiara are more likely to be living in the poorest households compared to other parts of the country. Combining the figures for children in the poorest households and those living in female-headed households indicates that those children living in such circumstances are amongst the most disadvantaged in the country.
Educational Attainment 19. In rural areas 21.5% of household heads in the lowest three deciles have no education as compared with only 7.3%
of those in the highest three deciles. In comparison, only 4.7% of the poorest HH and 1.7% of those in highest three deciles in Honiara have no education. In the poorest three deciles almost three-quarters of HH heads had no attainment beyond primary level. Of those HH heads with only primary level education there was little difference between the lowest and highest three deciles; in both groups the proportion was around 52%. In Honiara there was, however, a significant difference with 43.5% of the lowest three deciles and only 9.4% of the highest three deciles reaching only primary level.
20. Data suggests that the poor in Honiara are only one-third as likely to have post primary education as the better-off. Even against the overall average of Honiara HH the poorest are only half as likely to have progressed beyond primary level. In rural areas, the poorest HH are only half as likely to have gone beyond primary level compared with the average for all HH. Not surprisingly, the highest proportion with post-secondary education are found in the highest three deciles of urban HH heads. The rural areas are clearly disadvantaged in terms of attainment at post-secondary levels; even amongst the highest three expenditure deciles the proportion of HH heads attaining this level is only 11.6%.
Economic Activity21. Employment is a critical factor in being not-poor in Honiara, where 78.8% of all HH heads are in some form of full or
part time employment; and even in the lowest three deciles the proportion is 75.6%. In contrast, in the rural areas
�
Solomon Islands: Analysis of Poverty from 2005/2006 HIES
Estimation of National Poverty Lines and Poverty Incidence
only 16.6% of HH heads are in employment. This proportion falls to 9.5% for those in the lowest three deciles. This suggests of course that many of those in employment are earning less than the poverty line and may be described as the “working poor”. The recent increase in the minimum wage to SBD4.00 per hour for non-agricultural workers and to SBD3.20 per hour for agricultural workers acknowledges these issues.
22. The lack of employment opportunities in the rural areas is reflected in the one-third of all HH heads engaged in production for home consumption (46.4% of those in the lowest three deciles). This compared to 2.3% in total and 4.6% of the lowest three decile HH heads in Honiara who were similarly engaged in home production. This validates the conclusion concerning the very low level of own consumption by Honiara HH, and despite the lower unit-values of rural own production, the much higher total value of own food production in the rural areas.
23. The level of unemployment is especially high in the rural areas where one-third of all males and all females in the lowest three deciles reported as being unemployed. In contrast only 4.9% of rural males and 1.5% of rural females reported as being in full time employment. In Honiara 32.0% of males in the lowest three deciles reported as working full time, as did 19.3% of all Honiara females.
Energy Use24. In both Honiara and rural areas, an open fire is the most popular form of energy use for cooking. Although gas and
electricity are available in Honiara, 57.3% in the lowest three decile HH and 32.7% in the highest three deciles use open fires for cooking. This suggests that the cost of purchased fuel is a deterrent from its use and that firewood is easily accessible, either in markets or from own-collection. In the rural areas there is very little use of energy sources other than firewood and virtually all cooking is done this way in the poorest HH. Amongst the lowest expenditure households, in both Honiara and rural areas, kerosene is the most widely used power source for lighting.
Water and Sanitation
25. Overall, an average 23.5% of HH in Solomon Islands use unsafe or unprotected water sources. In rural areas, this percentage is higher (27.4%). In Honiara the town reticulated supply or a similar piped source is the most common water supply. Over 60% amongst the low expenditure HH and 85% amongst the highest expenditure receive water from these sources. However, almost 30% of the poorest HH in Honiara rely on unsafe water sources.
26. In rural areas, the most common form of sanitation is the over-water closet type, accounting for 54% of those in the poorest HH and 41% in the top three expenditure deciles. For inland rural HH, pits and many other “not improved” forms are commonly used and therefore are a source of potential health problems. In Honiara many of the low decile households do not appear to have a satisfactory sanitation system with 50% using either a household pit or bucket. While around 40% of the lowest three deciles have access to a septic tank, for the very bottom decile the proportion is only around a quarter. Thus in Honiara there must be serious health concerns that in the lowest decile a significant proportion of households have neither safe water nor safe sanitation. These are likely to be in the peripheral squatter areas where conditions of living are poor and consequently health risks are high.
Conclusions27. Poverty in the Solomon Island context does not mean hunger or destitution, but rather struggling to meet daily/
weekly living expenses, particularly those that require cash payments. Families constantly have to make choices on a daily or weekly basis between the competing demands for household expenditure and the limited availability
�
Solomon Islands: Analysis of Poverty from 2005/2006 HIES
Estimation of National Poverty Lines and Poverty Incidence
of cash income to meet that expenditure. Trade-offs are made between one bill and another, food or school fees, utilities or bus-fares. Households deemed to be experiencing basic needs poverty are therefore facing hardship on a daily basis. They struggle to pay bills and purchase adequate and suitably nutritious food. They borrow regularly from “loan-sharks”, who charge very high interest rates, for small unsecured loans to meet family commitments and community obligations. They are thus frequently, and occasionally constantly, in debt.
28. Urban drift, leading to higher levels of unemployment and growing numbers of people living in squatter settlements and sub-standard housing conditions, result in a deteriorating social environment. Many of the poor live in low-quality housing without proper access to water, sanitation and other basic services. Poor housing conditions lead to poor health, poor employment prospects, and poor education attainment. Children frequently miss school due to ill-health or because school fees have not been paid. Adults are frequently poorly educated and thus unable to get anything but the lowest paid and often casual employment, if such employment is even available. The cycle of poverty can therefore be perpetuated.
29. This analysis seeks to provide government with clearer, evidence-based indications of the extent and nature of poverty in Solomon Islands. It suggests policy issues and possible policy options to address these. Increased opportunities for employment or economic opportunity, not only in the urban centres but also in the rural areas, together with improved basic education are amongst the critical.
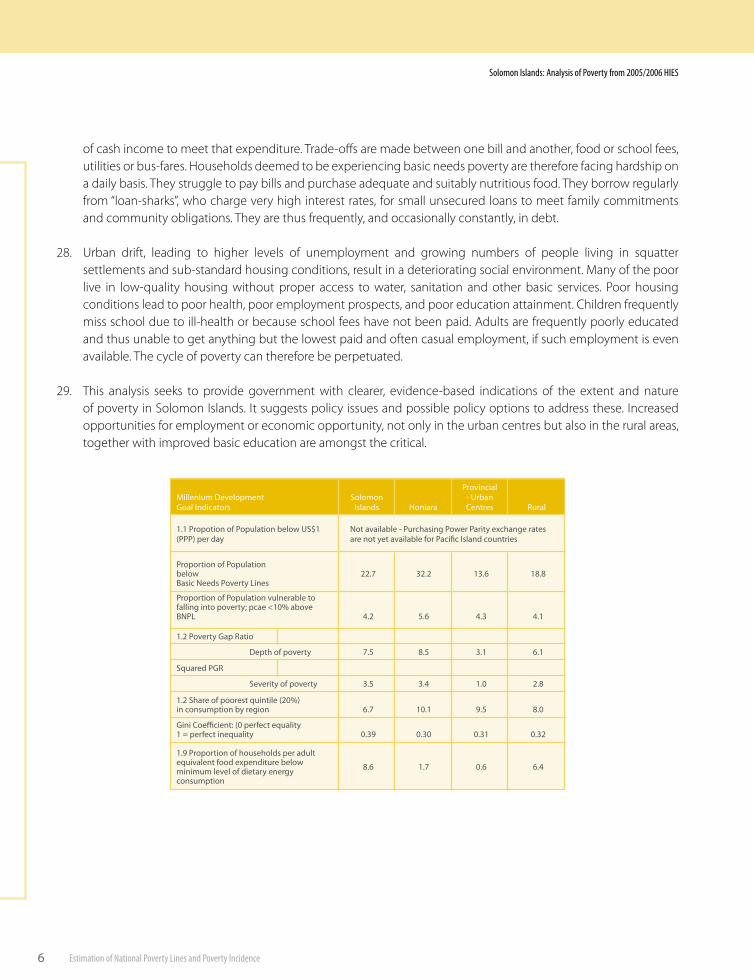
M�llen�um Development Goal Ind�cators
�.� Propot�on of Populat�on below US$� (PPP) per day
Not ava�lable - Purchas�ng Power Par�ty exchange rates are not yet ava�lable for Pac�fic Island countr�es
Proport�on of Populat�on below Bas�c Needs Poverty L�nes
Proport�on of Populat�on vulnerable to fall�ng �nto poverty; pcae <�0% above BNPL
�.� Poverty Gap Rat�o
Depth of poverty
Squared PGR
Sever�ty of poverty
�.� Share of poorest qu�nt�le (�0%) �n consumpt�on by reg�on
G�n� Coeffic�ent: (0 perfect equal�ty � = perfect �nequal�ty
Solomon Islands
��.7
�.�
�.�
7.�
Hon�ara
��.�
�.�
�.�
Prov�nc�al- UrbanCentres
��.�
�.�
�.0
�.�8.�
�.7 �0.� 9.�
Rural
�8.8
�.�
8.0
�.8
�.�
�.9 Proport�on of households per adult equ�valent food expend�ture below m�n�mum level of d�etary energy consumpt�on
0.�9 0.�0 0.��
8.� �.7 0.�
0.��
�.�
7
Solomon Islands: Analysis of Poverty from 2005/2006 HIES
Estimation of National Poverty Lines and Poverty Incidence
� The Head Count Rat�o �s not the same as the Poverty Ind�cator �n M�llenn�um Development Goal �. The MDG � �nd�cator, based on US$� per day, �s not yet ava�lable for Solomon Islands, or any other Pac�fic �sland Countr�es, as est�mates of the Purchas�ng Power Par�ty exchange rates requ�red to calculate the MDG �nd�cator have not yet been final�sed by SPC and the Austral�an Bureau of Stat�st�cs (ABS). The MDG � �nd�cator, when ava�lable, w�ll enable d�rect compar�sons of ‘absolute” poverty levels to be made between countr�es. Nat�onal poverty l�nes, wh�ch are used �n th�s analys�s, enable assessments of relat�ve poverty w�th�n countr�es.� The survey defined households as un�ts “where normal fam�ly or household l�v�ng arrangements are exerc�sed”; and therefore excludes �nst�tut�onal hous�ng such as schools, hosp�tals etc.
National Poverty Lines and Estimates of the Incidence in of Poverty in Solomon Islands1. Purpose of Paper
1. The purpose of this paper is to provide estimates of National Poverty Lines and the incidence of poverty for Solomon Islands based on an analysis of the household data from the national 2005/06 Household Income and Expenditure Survey (HIES).
2. The HIES contains a wealth of information. This paper analyses the expenditure data to estimate the incidence of poverty through the Head Count Index (HCI)2 by comparing food and basic needs poverty lines with recorded levels of expenditure. It also estimates indicators of the depth (Poverty Gap Index, PGI) and severity (Squared Poverty Gap Index, SPGI) of poverty in Solomon Islands and levels of income/consumption inequality through the Gini Coefficient.
3. It further provides an analysis of the broad characteristics of low-expenditure households in terms of their socio-economic status, demographics and level of household access to basic services. Together with the poverty indicators these provide a good indication of which households are the most disadvantaged in Solomon Islands, what common characteristics they might share and why they might be in this situation of disadvantage and hardship. Such information will be useful for government to define targeted policies and interventions to assist in alleviating their poverty and hardship.
4. Specifically the paper will:- Discuss the definition and context of poverty in the Pacific and Solomon Islands in particular, Section 2;- Outline the poverty analysis methodology used and provide an overview of some of the key household
and socio-economic indicators from the HIES, Section 3;- Estimate food and basic needs poverty lines for Honiara, provincial-urban and rural households3; Sections
4 & 5;- Provide indications of the incidence, depth and severity of poverty, and estimates of the extent of
inequality in expenditure (or income) between regions and households in Honiara, provincial-urban and rural areas, Section 6;
- Outline the characteristics of poor households, defined as those in the lowest three deciles of per capita adult equivalent expenditure, Section 7; and
- Provide a summary of key policy issues arising from the analysis, section 8.
5. This report presents the first attempt to establish national poverty lines for Solomon Islands. It is therefore a benchmark analysis that provides a basis for both identifying policies and monitoring the impact of targeted pro-poor policies and strategies in the medium term development framework. Solomon Islands is a signatory to the Millennium Declaration and has endorsed the Millennium Development Goals (MDGs) as key development targets for achievement by 2015 and support for which is an overarching goal of all the agencies that have contributed to this analysis. The better understanding of hardship and poverty in Solomon Islands afforded by this analysis will therefore help to integrate the core poverty reduction focus of the MDGs in to national strategies. The information and data contained in the HIES and in the analysis will contribute to an improved ability to monitor progress towards the goals.
8
Solomon Islands: Analysis of Poverty from 2005/2006 HIES
Estimation of National Poverty Lines and Poverty Incidence
6. This analysis of poverty and hardship in Solomon Islands is one of a series of national poverty reports being compiled cooperatively by national statistics offices, SPC, ADB and UNDP Pacific Centre based on the recent round of household surveys. These national reports benefit from a standard methodology as agreed at the SPC coordinated Regional Heads of Planning and Heads of Statistics Meeting held in Noumea in September 2007 and a subsequent technical workshop held in November.
2. Introduction
2.1 Defining Hardship and Poverty in the Solomon Island Context7. Traditional Solomon Island society, as well as Pacific societies generally, embraces caring for and sharing with
family and clan. As a result, there is a continuing belief that poverty cannot and should not be a part of normal life in the Pacific region. The suggestion that there might be poverty in some form is not, therefore, something that many people have been prepared to readily accept. Indeed, the usual images of poverty (starving children, landless peasants, and men and women toiling with ox ploughs) do not immediately spring to mind in relation to the Pacific or Solomon Islands.
8. While Solomon Islanders might not be well off in financial or material terms, their strong family and community ties have traditionally provided social safety nets for the most disadvantaged and vulnerable. However, the increasing monetisation of Pacific economies, the impact of television and internet, and increasing rural/urban migration leading to greater urbanisation, have begun to undermine these traditional structures.
9. As a consequence poverty and hardship, as now defined and understood in the Pacific, (see Section 2.2), are being increasingly accepted as concerns which need greater attention from the development community. Some countries in the Pacific region, including Fiji Islands, Papua New Guinea (PNG), and Timor-Leste, have fully embraced the need to deal with increasing levels of hardship and poverty and their societal implications. Other countries, though perhaps not yet acknowledging hardship and poverty as serious issues, are nevertheless accepting that there are growing numbers of disadvantaged people who are being left behind as economic and social structures change in response to both external and internal developments. However, poverty and hardship must be seen as issues that are best dealt with before they become serious.
10. What does poverty mean then in the Solomon Island context? In so far as an internationally recognised “official” definition exists it is widely accepted as the US$1 per capita per day of Millennium Development Goal 1. But, as yet, this figure is not available for Solomon Islands (or Pacific countries generally) because the “purchasing power parity” indices on which this definition is based are still being developed for the Pacific situation. Instead, for an income or expenditure based poverty indicator, we need to look at national basic-needs poverty lines.
11. National basic needs poverty lines are estimated from the cost of a minimally-nutritious, low-cost diet which
delivers a minimum of 2100 calories (Kcal) per day plus adequate additional nutrition to provide a sound and balanced, but basic, diet. To this is added an amount for essential non-food expenditure (e.g. housing, transport, education, clothing, utilities) which is required to provide an overall basic needs standard of living. Households which have per capita incomes or expenditure below the basic needs poverty line are then deemed to be living in poverty.
9
Solomon Islands: Analysis of Poverty from 2005/2006 HIES
Estimation of National Poverty Lines and Poverty Incidence
12. Poverty is therefore measured at the household level; it is not possible to disaggregate poverty on an intra-household basis. Thus if the average per capita expenditure/income of a household falls below the poverty line then all members of that household are deemed to be equally poor, similarly if a household has an average per capita income/expenditure above the poverty line then none of the members are considered to be poor.
13. Data for estimating national basic needs poverty lines at the household level are becoming available as more surveys and analysis are undertaken to quantify the extent of hardship and poverty in Pacific societies. From the work which has been done to date it is estimated that, on average across the Pacific region, approximately one-in-four households have per capita expenditure/incomes below what would be considered as the basic needs poverty line in their respective countries. On this measure poverty is estimated to be highest in PNG (37.5%, 1996), Fiji (28.8% in 2002/03), Tuvalu (29.2% 2005) and in Port Vila, Vanuatu (27.2%, 2006) compared with the lowest in Tonga (22.3%, 2001), Samoa (20.3%, 2002), and Cook Islands (12.0%, 1998).
14. But poverty and hardship need to be defined in ways which are more easily understood in Pacific societies. Poverty means different things to different people at different times and in different places. This has given rise to much misunderstanding and confusion. Poverty can be either absolute as in the US$1 per day situation or it can be relative where people are disadvantaged compared to their neighbours in terms of national or localised regional poverty lines. This latter is the nature of hardship and poverty being estimated in this paper. In the Pacific it is often said that everyone is poor but no-one suffers poverty. In the sense of experiencing absolute poverty and destitution this is generally true. But within every society there are those who are more disadvantaged and poorer than others.
15. Poverty and hardship may be temporary and widespread because of the impact of a natural disaster or the affects of conflict situations. In the Solomon Islands these circumstances may have arisen as a result of the displacement of many people during “the tensions” or during the recent tsunami in Western Province. It has also occurred in Fiji where many people have been displaced and suffered hardship as a result of the non-renewal of leases on their sugar-cane farms. Poverty and hardship may also be long-term, personal and chronic due to causes such as unemployment, sickness or disability.
16. Most discussions of poverty centre on its most extreme manifestations: absolute poverty and destitution. There are, however, many other ways in which people can be poor or can suffer hardship. Indeed people can be reasonably well fed and moderately healthy but still live in relative poverty and suffer varying degrees of hardship. Their incomes might be insufficient to meet their food and other basic needs. Additionally, they might lack access to basic services, such as water and sanitation or health and education facilities, freedom of choice, or socio-economic opportunities. This “poverty of opportunity” 4 is just as important in defining the extent of poverty and hardship in a society as the lack of income. In fact, often the conditions and circumstances that give rise to poverty of opportunity (poor access to, or standards of, service delivery, poor governance, limited employment opportunities, and social exclusion) are the underlying causes of income poverty.
17. However defining poverty by level of cash income, or level of cash expenditure, alone might not be appropriate in the Pacific where most economies include high levels of subsistence production and own consumption, particularly in the rural areas. The current analysis takes account of this subsistence production/consumption by valuing it as part of both income and expenditure, thus providing a better picture of overall well-being, see Section 2.4.
� F�rst used �n the Pac�fic context �n the UNDP �999 Pac�fic Human Development Report, defined as “the �nab�l�ty of people to lead the k�nd of l�ves they asp�re to.”
�0
Solomon Islands: Analysis of Poverty from 2005/2006 HIES
Estimation of National Poverty Lines and Poverty Incidence
18. Household survey data on subsistence production also provides a sounder basis for estimating the non-monetary sector in national accounts. Historically in many countries, calculating the value of such subsistence production in the national income (gross domestic product) has not been complete; it may have been inadequately assessed in GDP estimates or occasionally it is missing entirely. The data now available from the HIES will help to rectify this situation to provide a better understanding of the importance of subsistence agriculture to livelihoods and to food security.
19. Overall in the past, data from censuses and HIES has often not been collected with poverty and hardship in mind, or has not been fully analysed for poverty indicators. There might also have been a lack of community participation in assessing poverty and hardship, and the socio-cultural aspects may have been ignored. This is now changing. There is a growing recognition of the importance of the data generated by HIES, both in terms of the information it can provide on poverty, but also the importance of accurately capturing subsistence production and consumption for national accounts purposes.
2.2 Poverty = Hardship: A Pacific Definition of Poverty20. Recognising the importance of obtaining a “people perspective” on issues of hardship and poverty a series of
Participatory Assessments of Hardship (PAH)5 were conducted by ADB in ten PICs, including Solomon Islands, over the period 2001 – 2006. These involved extensive consultations with traditional leaders, focus groups, local CSOs and individuals throughout the various countries. Through these consultations a working definition of Pacific poverty, or perhaps more correctly “Hardship”, was defined in Human Development terms as:
An inadequate level of sustainable human development, manifested by:- a lack of access to basic services such as health care, education and clean water;- a lack of opportunities to participate fully in the socio-economic life of the community; and - a lack of access to productive resources and income generation support systems (rural credit ,capital, markets, skill) to meet the basic needs of the household, and/or customary obligations to the extended family, village community and/or the church.
21. The findings of the participatory assessments highlighted hardship and poverty as real issues in the lives of many people in both urban and rural areas, and on outer islands and atolls. The concerns of the people showed remarkable consistency not only between the urban and rural areas within each country, but also across the region. In other words, despite the wide differences in geography and resource endowments, and culture and ethnicity among the atoll states of Micronesia and the high islands of Melanesia and much of Polynesia, the concerns of the people were very similar.
22. The causes of hardship and poverty centre around the need for income, a reasonable standard of basic services, and skills to meet opportunities and challenges as they arise. These are the challenges which face governments and policy makers in framing national, sector and community level interventions aimed at alleviating the causes of hardship and poverty and achieving the MDGs.
23. Progress is now being made as planners, policy makers and statisticians come to realise the importance and benefits of both sound evidence-based policy making and the engagement of communities in the policy process.
� RETAs �00� , �0�7 and ���7 cover�ng FSM, K�r�bat�, F�j�, PNG, RMI, Samoa, Solomon Islands, Tonga ,Tuvalu and Vanuatu

��
Solomon Islands: Analysis of Poverty from 2005/2006 HIES
Estimation of National Poverty Lines and Poverty Incidence
2.3 What is the Poverty Line24. The estimation of poverty lines and the incidence, depth and severity of poverty in society is not an exact science.
There is considerable academic as well as empirical debate about the “best” methodology. Box 1 summarises the view of the World Bank, one of the leaders in the debate on global poverty, its measurement and the development of policies and strategies to alleviate the hardship experienced by those who are poor.
25. Not withstanding the issues raised by the World Bank, the “Cost of Basic Needs” method has been used in undertaking this analysis. This method has been used on similar analyses in other Pacific Island countries6 and elsewhere in the world and provides a sound and well-tested methodology.
2.4 Estimating the Poverty Line for Solomon Islands 26. Following the “Cost of Basic Needs” methodology the estimation of poverty lines and, from them, the extent or
Incidence of Poverty (IP) in Solomon Islands is a four step process: a) calculating the Food Poverty Line (FPL); b) estimating a non-food basic-needs component; c) combining the FPL with the non-food basic needs component gives an estimate of the Basic Needs Poverty
Line (BNPL) ; and finally, d) estimating the Incidence of Poverty against the BNPL benchmark from the HIES data gives the Head Count
Index (HCI) and other poverty indicators measuring inequality and the depth and severity of poverty between households.
27. The Basic Needs Poverty Line is therefore made up of two components: a) the cost of food and, b) the amount of expenditure required for essential non-food basic needs. It is therefore intended to represent the minimum expenditure per week, month or year that is required by an individual, household or family; firstly, to provide a basic, low-cost, minimally nutritious diet, (measured in terms of the minimum daily calorie intake required for basic human survival, which is internationally benchmarked at an average of around 2100 calories/day per capita7), termed the “Food Poverty Line” (FPL), and secondly, an additional amount which is required to meet the costs of purchasing essential non-food basic needs (e.g. housing/shelter, clothing, utilities, school fees, other education
We define a poverty line as the monetary cost of achieving a standard of living above which one is not deemed to be poor. A poverty comparison assesses which of
distributions (of an agreed indicator of living standards among members of a group) has more poverty on average. The groups can be regions or sectors of a country,
the same population at different dates, or the same population observed with and without a policy change. A special case of a poverty comparison is a poverty file,
in which groups of households defined by some characteristic (such as where they live) are compared at one date.
The guiding principal in making a poverty comparison to inform policy is that it should be consistent with the policy objective. When that objective is to reduce
poverty by increasing people’s command over basic consumption needs, any two individual (at one date or at different dates) with same command over those
needs should be treated identically. This requires that the poverty line should have a fixed purchasing power over relevant commodities.
The cost-of-basic-needs method
The cost-of-basic-needs method bases poverty lines on purchasing power over basic consumption needs. This achieves the desired consistency for the purposes of
Bank Poverty Assessments. But putting this method into practice with imperfect data can be difficult. Once “basic needs” are defined, we need to able to measure
their cost over time and location. Setting basic needs requires and inherent value judgement, which often leads to disagreements. Also price data are often
inadequate.
World Bank, 1994
Box 1: What Makes A Good Poverty L�ne?
� ADB Reg�onal Poverty Programme RETA�0��, �0�7 and ���7 undertook s�m�lar poverty analyses �n Samoa, Tonga, and FSM and jo�ntly w�th UNDP �n Tuvalu and F�j�, World Bank/ADB est�mates of poverty �n PNG and East T�mor. 7 Th�s �s the FAO/WHO recommended da�ly m�n�mum adult calor�e �ntake for a moderately act�ve adult.
��
Solomon Islands: Analysis of Poverty from 2005/2006 HIES
Estimation of National Poverty Lines and Poverty Incidence
related costs, health, and transport) and to meet family/community/church obligations. Most of these non-food costs require cash payments and are often the underlying cause of the greatest financial hardship.
28. Together the FPL and the non-food component make up the benchmark “Basic Needs Poverty Line” (BNPL). The Incidence of Poverty is then measured against the FPL and BNPL by estimating the proportion of households and/or population which have an adult equivalent per capita expenditure (including subsistence) less than the either the FPL and/or BNPL values, referred to as the Head Count Index or Ratio. Households with per capita adult equivalent expenditure below the FPL are deemed to be in “severe” poverty since their expenditure is below that required to meet basic food needs. Those with expenditure below the BNPL are deemed to be in “basic-needs” poverty.
29. In the Pacific region as a whole, many households, particularly in the rural areas, are able to provide a high proportion of their daily food needs from their own subsistence production (Tables 6 & 7); this is certainly true in Solomon Islands, see section 3.2.2. However, their ability to generate cash income for non-food basic needs is often very limited, albeit that in the rural areas the need for non-food expenditure may itself be low due to lack of access to shops and services. This, as the following analysis will attempt to illustrate, means that low rates of incidence of severe poverty (income/expenditure below the food poverty line) are seen along side quite high levels of basic-needs poverty.
30. Linked to this an analysis of dietary patterns and levels of reliance on either own-produced or purchased food between the urban and rural areas highlights important issues for consideration in relation to nutrition and food security.
31. The depth and severity of poverty between households and population in the different regions (Honiara, provincial-urban, and rural areas) can be estimated by using the Poverty Gap Index (PGI) and the Squared Poverty Gap Index (SPGI), Section 6.4. Estimates of inequality are made using the Gini Coefficients and expenditure distributions, Section 6.5.
3. The Household Income and Expenditure Survey
3.1 Survey Methodology 32. The 2005/06 HIES comprised a total of 3,822 households made up of samples8 of 433 Honiara HH, 486 provincial-
urban HH and 2,903 rural households. These sample households represented a total of 86,734 households comprising 9,984 Honiara HH (4.8% sample), 2,505 provincial-urban HH (19.4% sample) and 74,246 rural HH (3.9% sample).
33. The survey results indicated a total estimated population of around 533,672. This was made-up of 69,189 (13% of total) in Honiara, 16,308 (3.0%) in the provincial-urban centres and 448,173 (84.0%) in the rural areas. This compares with the most recent 1999 population census of 409,042 and implies an average annual increase of around 10%. However, it is widely believed that there was significant under-counting in the 1999 census.9
34. Information was collected on both household income and expenditure, and included information on the production and consumption of home produced foods and other commodities. In the survey the value of subsistence production/consumption was valued in two ways. For the urban centre of Honiara the “opportunity
8 A strat�fied probab�l�ty proport�onal to s�ze (PPS) sample select�on methodology was used based on nat�onal enumerat�on areas, see deta�ls �n Household Income and Expend�ture Survey �00�/0�, Nat�onal Report, Solomon Islands Stat�st�cs Office.9 See Household Income and Expend�ture Survey �00�/0�; Nat�onal Report (Part One) sect�on �.�, Solomon Islands Stat�st�cs Office, Hon�ara, September �00�
��
Solomon Islands: Analysis of Poverty from 2005/2006 HIES
Estimation of National Poverty Lines and Poverty Incidence
cost” of producing for own consumption was valued at the price recorded in the Honiara Consumer Price Index (CPI). For the rest of the country the value of production for own consumption was estimated on the basis of householders’ valuations of what the items might be worth if sold locally. Since there are few organised markets in the rural areas, and thus no established price mechanism (and produce is often exchanged rather than sold), this tended to result in significant variations in estimated values between households.
35. A review of the rural valuations suggested that on average local produce has an “opportunity cost” or “shadow price” of between one quarter and one half of the Honiara market price. This had implications for the overall value of household expenditure between the Honiara and other regions and is reflected in the different levels of the food and basic-needs poverty lines between the regions.
36. Where items were purchased from markets or stores the actual prices paid were recorded, or in absence the CPI price was used.
37. The survey also collected information on household demographics, employment, education attainment, and household characteristics, including access to water and sanitation, energy utilization for cooking and lighting. There was also a separate questionnaire on health issues on which a separate report has been issued by the Ministry of Health.10 The survey fieldwork was conducted in the fourth-quarter of 2005 and first-quarter of 2006. Support was provided to the conduct of the survey by SPC.
38. Whether data on income or expenditure is used as the basis for the calculation of the poverty line and incidence of poverty depends primarily in the perceived accuracy and reliability of the two data sources. In most cases expenditure data is usually regarded as the more reliable, see Box 2, although the choice between income and expenditure may rest primarily on the reliability criteria. In the Solomon Islands survey much more detail was available on expenditure and, in addition, recorded income was generally lower than recorded expenditure. This analysis therefore uses per capita household expenditure, adjusted for adult equivalence, 11 as the basis for the estimation of the poverty lines and incidence levels. All analysis in this paper, unless otherwise indicated, is therefore based on a household’s adult equivalent per capita (p.c.a.e) weekly expenditure as recorded in the survey.
39. The detailed calculation of poverty lines and the estimation of poverty incidence has therefore been conducted on the basis of adult equivalent per capita household expenditure and the proportion of households and population deemed to have adult equivalent per capita expenditure below the food and basic needs poverty line levels. For the broader analysis of poverty characteristics the lowest three deciles of households has been used as the basis for detailed scrutiny.
3.2 Overview of HIES Results3.2.1 Household Size and Adult Equivalence
40. In the survey the overall national average household size was reported as 6.2 (4.9 a.e). However for poor, low-expenditure households (for this purpose those with expenditure in the lowest three deciles) the average HH size was 7.0 (5.6 a.e), see Table 1. The largest average household size was found in Honiara where the lowest quintile HH had an average of 9.3 persons (7.6 a.e).
�0 Analys�s of Health Ind�cators from �00�/0� HIES, M�n�stry of Health & M�n�stry of F�nance, Hon�ara, �007.�� Adult equ�valents are der�ved from “equ�valence factors” where ch�ldren under the age of �� years are counted as half an adult, thus a household w�th two adults and two ch�ldren would be equ�valent to � adult equ�valents. Th�s methodology has been adopted to take account of the downward b�as that would otherw�se occur �n households w�th more ch�ldren.

��
Solomon Islands: Analysis of Poverty from 2005/2006 HIES
Estimation of National Poverty Lines and Poverty Incidence
41. The table illustrates that over the three areas of Honiara, provincial-urban centres and the rural areas, the size of family and the number of children per HH declines with expenditure. This is a finding that is consistent with the situation in other parts of the Pacific region. Urban poor HH tend to be the largest and most disadvantaged, rural HH tend to be smaller, and better-off HH in all areas tend to be smaller in overall size and number of children. The characteristics of low-income/expenditure and poor households is discussed in more detail in Section 7.
3.2.2 Household Expenditure 42. Average household expenditure by locality is shown in Table 2. This table also indicates average weekly per capita
adult equivalent (p.c.a.e.) expenditure as recorded by the survey. At the national level average p.c.a.e expenditure
Adult equilvalent per capita HHexpenditure quintiles
Table 1Household S�ze
National Honiara Provincial - Urban Rural Areas
Average all Households
Lowest Quintile
Lowest Three Deciles
Highest Quintile
ActualAdult
Equivalent ActualAdult
Equivalent ActualAdult
Equivalent ActualAdult
Equivalent
6.2
7.4
7.0
5.1
4.9
5.9
5.6
4.1
6.9
9.3
8.8
5.4
5.7
7.6
7.2
4.5
6.5
7.8
7.4
5.1
5.2
6.2
5.9
4.1
6.0
7.4
7.1
4.5
4.7
5.9
5.7
3.5
There are two basic ingredients in measuring poverty. The first is a poverty line that refers to a benchmark level of consumption (or income) that enables a
person to attain a threshold standard of living. A person whose consumption is below this benchmark level does not attain the threshold standard of living and
is thereby defined as poor. The poverty lines is said to be absolute, as opposed to relative, when the threshold standard of living is held fixed both over time
and space. Given that absolute poverty lines, and the poverty measures derived from these, are widely believed to be the appropriate bases on which to inform
antipoverty policies in developing countries, the discussion focuses on these.
The second ingredient in measuring poverty is a survey that collects data on income and/or consumption levels from a sample of household’s
representative of a given population. The choice of income or consumption as an indicator of household welfare is often determined by the availability of
data. Where choice is available, researches have normally preferred consumption to income on the basis that the former is a better indicator of permanent
income and standard of living of people due to consumption smoothing through savings and insurance opportunities. It has also been argued that it is easier
to collect information from respondents on consumption that on income. Once a poverty line has been set and survey data are available, it is a simple matter
to determine how many households or people are poor.’
Unfortunately, the setting of poverty lines always involves some element of subjective methodological choice. The poverty line refers to a minimum level of
living necessary for physical and social development of a person. A minimum level of living defined in monetary terms comprises both food and non-food
components of consumption. An objective approach could, in principle, be adopted for computing minimum food expenditure, the dominant component in
the total consumption bundle of the poor. However, non-food expenditure is clearly affected by social needs and the minimum on this count obviously differs
from one society (or region) to another. …. it is difficult to consider even the physical component of minimum needs entirely on an objective basis. Despite
such problems, recent literature has grown substantially to define the absolute poverty line on a reasonably, although not completely, objective basis.
Once the poverty line is defined, data are required on size distribution of income or consumption to compute the number and proportion of the population
below the poverty line. Household income or consumption expenditure surveys are the principle source of such data….. ADB 2004b, pp 7 & 8
…. Poverty lines are defined either in terms of income or consumption. In practice, this choice is restricted by the availability of household survey data since
most countries collect data on either household income or consumption. A few countries … collect data on both income and consumption. Income is a
better measure of opportunity for consumption than actual consumption in the case of households that save. But consumption might be a better measure of
opportunity for poor households that save little or in fact dis-save. Most practitioners also prefer to define poverty in terms of total consumption expenditure
because income data collection faces a wider range of measurement problems. Consumption is less affected by short-term fluctuations due to the consumption
smoothing opportunities available to a household. Hence, total consumption expenditure is thought to be a better indicator of the permanent income of a
household, particularly in an agrarian economy….. ADB 2004b, p 41
Box 2: Nat�onal Poverty L�nes; Income or Consumpt�on
The ADB Perspect�ve
��
Solomon Islands: Analysis of Poverty from 2005/2006 HIES
Estimation of National Poverty Lines and Poverty Incidence
for the poorest quintile is only one-tenth of that of the highest quintile HH. This captures the wide difference between urban and rural expenditure levels. The average weekly HH expenditure for Honiara amounted to SBD1443.32 (SBD254.17 p.c.a.e.) compared with only SBD449.29 (SBD94.70 p.c.a.e.) in the rural areas. For HH in the lowest three deciles the corresponding figures were SBD782.76 (SBD109.02 p.c.a.e.) for Honiara HH, SBD487.60 (SBD82.88 p.c.a.e.) for provincial-urban HH and only SBD207.62 (SBD36.53 p.c.a.e.) for rural HH. Within each of the three areas the ratio of expenditure from highest to lowest quintiles is lower than the national level average of 10.0, being 6.8 in Honiara, 6.3 in the provincial-urban centres and 8.3 in the rural areas.
43. Although rural HH p.c.a.e. expenditure is significantly lower than that in the Honiara and other urban areas, this does not necessarily translate directly into the poverty indicators. The lower rural expenditure is primarily a function of the lower valuation of own production/ consumption as described above. It is also reflected in the estimates of “relative” poverty within the regions rather than “absolute” poverty between regions.
44. The pattern of expenditure between households in the urban and rural areas, discussed in Section 4 below, is also significantly different, indicating that the overall cost of basic needs for rural households is less than that experienced by Honiara households in particular. This is due to the lower non-food expenditure needs of rural households; often “essential” items such as power, communications, housing and transport costs will be much lower (or non-existent) for rural households than compared to their urban counterparts.
45. Food and non-food expenditure is shown in Tables 3 and 4. This shows a familiar pattern of increasing non-food expenditure as a proportion of total weekly expenditure, both by increasing total expenditure and proximity to urban centres. Thus, the figures show that rural households average p.c.a.e. weekly food expenditure amounted to SBD57.64. and for those in the lowest three deciles, SBD25.35. This compared with the average p.c.a.e. weekly food expenditure for Honiara HH of SBD86.26, and for the lowest three deciles, SBD48.75. Thus the average Honiara HH spent approximately 1.5 times as much per capita a.e on food as the average rural household. For the lowest three deciles HHs the amount was almost twice as much. This is a reflection
Per capita HH expenditure deciles
Weekly Household Non-Food Expend�ture
SBD per cap�ta adult equ�valent per week per HH
National RuralHoniaraProvincial -
Urban
Average all Households ��.98
Lowest Qu�nt�le �0.�8
Lowest Three Dec�les ��.��
H�ghest Qu�nt�le �9�.88
��7.9�
��.��
�0.�7
�9�.��
���.��
��.��
�8.��
��9.�8
�7.0�
9.�9
��.�8
��8.�8
Table 4
Per capita HH expenditure deciles
Food Produced for Own Consumpt�on
SBD per cap�ta adult equ�valent per week per HH
National RuralHoniaraProvincial -
Urban
Average all Households ��.90
Lowest Qu�nt�le ��.��
Lowest Three Dec�les �7.00
H�ghest Qu�nt�le ���.�7
8�.��
��.7�
�8.7�
���.88
7�.��
�0.�0
��.��
��7.0�
�7.��
�0.8�
��.��
���.0�
Table 3
Ranked by adult equivalent per capita HH expenditure deciles
Table 2
SBD per week
National RuralHoniaraProvincial -
Urban
Average all Households �78.��
Lowest Qu�nt�le �9�.7�
Lowest Three Dec�les ��0.��
H�ghest Qu�nt�le ����.79
SBD a.e per capita per week
Average all Households ��8.88
Lowest Qu�nt�le ��.8�
Lowest Three Dec�les �9.��
H�ghest Qu�nt�le ��9.��
rat�o H�0/L�0 �0.0
����.��
7�8.80
78�.7�
�9��.�7
���.�7
9�.8�
�09.0�
��0.�0
�.8
9��.��
���.�0
�87.�0
�9�0.�9
�87.7�
7�.��
8�.88
���.�0
�.�
��9.�9
�8�.7�
�07.��
89�.�9
9�.70
�0.��
��.��
���.��
8.�

��
Solomon Islands: Analysis of Poverty from 2005/2006 HIES
Estimation of National Poverty Lines and Poverty Incidence
of the higher proportion of own-production in the food consumption of rural households compared to those in Honiara where most food is purchased; see Tables 5 to 8 following.
46. For non-food expenditure rural households average weekly p.c.a.e. expenditure amounted to SBD37.06, but for
those in the lowest three deciles it amounted to only SBD11.18. This compared with the weekly average p.c.a.e. non-food expenditure for Honiara HH of SBD167.91, and for the lowest three deciles, SBD60.27.
47. For non-food expenditure items therefore, the average Honiara HH spent 4.5 times as much on non-food items as the average rural HH. For the lowest three deciles the gap was even wider at 5.4 times, with Honiara HH spending an average of SBD60.27 p.c.a.e. weekly on non-food items compared to only SBD11.18 for rural HH. This is a reflection not only of the higher costs of urban living, but also the lack of access to services in the rural areas.
48. The patterns of food purchases and food produced for own consumption are shown in tables 5, 6 and 7, and in Chart 1. These tables and Chart provide greater detail on the composition of household food expenditure patterns, and clearly demonstrate the importance of home production for rural households. Conversely it also illustrates the weakening food security situation for those living in the urban centres. If imports of food are disrupted, or supplies from the rural areas into the urban markets are curtailed, a severe food shortage could rapidly eventuate.
49. Table 5 shows that food purchased by the average rural household amounted to SBD23.86 p.c.a.e. compared to SBD78.89 purchased by the average Honiara HH, a ratio of 3.3. For those in the lowest three deciles however the amounts were SBD8.43 and SBD45.58 for rural and Honiara HH respectively, a ratio of 5.4.
50. The corollary of this is illustrated in Table 6. The average rural HH produced food for own consumption valued at SBD33.78 p.c.a.e. compared to only SBD7.37 for Honiara HH. For those HH in the lowest three deciles the comparative amounts were SBD16.93 p.c.a.e. and SBD3.16 respectively. The low level of own production and heavy reliance on purchased food in the urban centre of Honiara is clear.
Per capita HH expenditure deciles
Proport�on of Own Product�on �n Food Consumpt�on
% of total food consumed
National RuralHoniaraProvincial -
Urban
Average all Households �7.8
Lowest Qu�nt�le ��.�
Lowest Three Dec�les ��.9
H�ghest Qu�nt�le ��.9
8.�
�.9
�.�
7.�
��.7
��.�
�8.�
�7.9
�8.�
�9.0
��.8
��.7
Table 7
Per capita HH expenditure deciles
Food Produced for Own Consumpt�on
SBD per cap�ta adult equ�valent per week per HH
National RuralHoniaraProvincial -
Urban
Average all Households �9.��
Lowest Qu�nt�le ��.87
Lowest Three Dec�les �7.��
H�ghest Qu�nt�le ��.��
7.�7
�.9�
�.��
��.�0
��.9�
�.87
8.0�
�0.98
��.78
��.�9
��.9�
7�.�8
Table 6
Per capita HH expenditure deciles
Food purchases by Household
SBD per cap�ta adult equ�valent per week per HH
National RuralHoniaraProvincial -
Urban
Average all Households ��.��
Lowest Qu�nt�le 7.�8
Lowest Three Dec�les 9.�9
H�ghest Qu�nt�le 8�.��
78.89
�9.78
��.�8
���.78
�9.��
��.��
��.��
�9.0�
��.8�
�.�8
8.��
��.�7
Table 5
�7
Solomon Islands: Analysis of Poverty from 2005/2006 HIES
Estimation of National Poverty Lines and Poverty Incidence
51. Table 7 and Chart 1 show the proportion of own production in food consumption for the three regions and the overall national average. The difference in the level of the contribution of own production to food consumption between the rural and urban areas is striking. More so perhaps when also considering that the “farm-gate” prices used in estimating rural food values are much lower than those used in valuing home production of Honiara households.
52. The relative proportions of food and non-food expenditure are shown in Table 8 and Chart 2. This illustrates very clearly the changing pattern of food and non-food expenditure in total expenditure between rural and urban HH and between the differing levels of expenditure as discussed in the previous paragraphs.
53. This pattern of higher proportional food expenditure in the rural areas compared to the urban areas is to be expected and is common to other regional countries. Urban living inevitably involves greater non-food expenditure; many rural households will not have power, water or communications bills to pay. They will often spend less on transport and housing costs. Thus their need for non-food expenditure is less. Moreover, since rural cash incomes are lower, the resources available for non-food expenditure is less.
0
10
20
30
40
50
60
70
80
National Honiara Provincial - Urban Rural
Average all Households Lowest Quintile Lowest Three Deciles Highest Quintile
% o
f foo
d ex
pend
iture
Chart �Proportion of Own Production in Food Consumption
Table 8
Proport�on of Household Food Non-Food Expend�ture
National Honiara Provincial - Urban Rural Areas
% of total expenditure Food Non-Food Food
Average all Households
Lowest Qu�nt�le
Lowest Three Dec�les
H�ghest Qu�nt�le �0.�
Bas�c Needs Factor 0.�� �.�� 0.87 0.��
�9.8 ��.� 7�.9 ��.� 7�.9 ��.� ��.7
�8.8 ��.� ��.7 ��.� ��.� ��.� �9.� �0.�
�8.� ��.� ��.� ��.� ��.9 ��.� �8.� ��.7
�9.9 �0.� �8.� ��.9 �8.� ��.� �0.9 �9.�
Non-Food Food Non-Food Food Non-Food
0
10
20
30
40
50
60
70
80
Food
Average all Households Lowest Quintile Lowest Three Deciles Highest Quintile
% o
f tot
al e
xpen
ditu
re
Chart �Proportion of HH Food & Non-Food Expenditure
Non-Food Food
National Honiara Provincial - Urban Rural Areas
FoodNon-Food Non-Food Food Non-Food
�8
Solomon Islands: Analysis of Poverty from 2005/2006 HIES
Estimation of National Poverty Lines and Poverty Incidence
4. The Food Poverty Line
4.1 Low-Cost Diets54. The first step in measuring poverty is the calculation of the Food Poverty Line (FPL). Two methods are typically
used to derive food poverty lines: either using “model diets” or using actual food expenditure and consumption patterns of the lowest three decile p.c.a.e households from the daily expenditure diaries. The one method can be used to validate the results of the other since they approach the same issue, a basic diet, from different perspectives. The model diets approach from the nutrition perspective, while the other approaches from actual consumption patterns. From the FPL we need to be comfortable that actual food expenditure could meet basic nutrition needs.
55. For Solomon Islands, the food poverty line was derived, therefore, from the actual food expenditure and consumption patterns of the lowest three expenditure decile p.c.a.e households as recorded in the daily expenditure diaries. This is the preferred approach as it gives a better reflection of local consumption preferences than the model diets. The derivation of the FPL using this method is described in the following section.
56. For comparative purposes the model diets developed by the SPC Nutrition Programme and the Solomon Islands Ministry of Health are given at Annexes 1 and 2 for Honiara and rural households respectively. Research undertaken in other Pacific countries has shown that there is generally very little difference in using the “model menu” approach and the actual food expenditure and items from the household expenditure diaries, see next section.
57. As already noted in Section 2.4 above the FPL is anchored to a basic minimum nutrition requirement of 2100 calories (Kcal) per adult per day. This nutrition benchmark has been established by WHO and is a common reference point for almost all food poverty line estimates globally. Referencing the nutrition benchmark to the basic energy needs of an “average adult” links to the underlying analytical approach using a “per capita adult equivalent” basis for the estimation and analysis of the poverty lines. Within the household the “average” adult equivalent benchmarks implicitly recognise that food energy needs and other basic needs differ from child to adult and across gender, but average out over households.
58. For the “model” menu approach diets were developed by the SPC nutritionists and the respective ministries of health which met the requirements of being both low-cost and minimally nutritious for each geographic region (or for other important sub-groups such as different ethnic groups). Typically the urban menus contained a greater proportion of purchased items compared with rural menus, reflecting observed patterns of household expenditure on purchased and own account food consumption, as shown in Tables 5 & 6 above. To obtain the FPL the menus are then priced according to CPI prices where available, and according to average recorded diary prices for other areas where CPI is not available and where home production was more significant. An average adult in a low-expenditure family living on either of these menus would therefore receive an adequate level of nutrition.
59. The model diets or menus are representative baskets of items and a similar estimating technique is used to that used for calculating the CPI. The basket of goods used for the CPI does not represent any individual family’s actual consumption, but rather an average or is symbolic of what is consumed overall, see Boxes 3 and 4. The menus do not necessarily represent what low-income families actually eat, (often the diets of low-income households are very poor in nutrition), but rather what such families could eat in order to stay healthy if they are only able to afford a low-level of food expenditure.
Box 3: The Food Poverty L�ne
The food component of the poverty l�ne �s almost un�versally anchored
to nutr�t�onal requ�rements for good health. Th�s does not generate a
un�que monetary poverty l�ne, s�nce many bundles of food goods y�eld
the same nutr�t�on. In pract�ce, a d�et �s chosen wh�ch accords w�th
preva�l�ng consumpt�on patterns, about wh�ch one m�ght expect to
arr�ve at a consensus �n most sett�ngs. Ravall�on �998
�9
Solomon Islands: Analysis of Poverty from 2005/2006 HIES
Estimation of National Poverty Lines and Poverty Incidence
J. Calor�es per day from Da�ry ���7 M Per D�ary �.9�
K. Bas�c Needs Energy Requ�rement ��00 N Per bas�c needs 8.9�
L. D�ary % of bas�c needs 0.77� O Per week ��.7�
calor�es Cost $
Note: All purchased items priced from Honiara CPI, other prices from average diary values
���0� Cook�ng bananas $�8�,�0� 0.7 $��9,889 �.�7 kg ��0 �7.7 0.0�
���0� Coconut (dr�nk�ng) $��8,9�7 �.0 $�8�,7�� �.�0 nut �� 0.9 0.07
���0� Coconut (dry nut) $�7�,��� �.� $��8,��� 0.90 nut �8� ��.9 0.08
����0 Mangoes $���,7�7 0.� $���,��� �.00 �8 �.� 0.0�
����� Pawpaws $�0�,7�7 0.� $��7,��� �.�� �� �.9 0.0�
����8 Watermelons $���,8�� 0.8 $�97,87� �.�0 �� �.� 0.0�
����� Bananas (R�pe) $�7�,890 0.� $�9�,9�� �.�0 �0� �0.� 0.0�
���0� Cabbage (sl�ppery) $�,�00,��� �.� $�,�79,��0 �.00 �� ��.� 0.��
���0� Cassava $�,�79,��� �.0 $�,779,��� �.�0 �77 �7�.� 0.��
���09 Kumara $�,���,�8� �.� $�,7�8,098 �.�0 ��9 �7�.� 0.��
����� Taro $��9,�8� 0.� $��8,700 �.00 99 �0.9 0.0�
����7 On�on and ch�ves $�0�,��� 0.� $���,7�� ��.00 �� 0.� 0.0�
����� Tomatoes $���,0�� 0.� $���,��� 7.�0 �� 0.� 0.0�
����7 Other fresh vegetables $��9,�8� 0.� $��7,��� �.00 �0 �.� 0.0�
����� Ch�nese Cabbage $���,��� 0.� $���,��8 7.00 �� �.9 0.0�
����� Spr�ng On�ons $��9,0�� 0.� $���,8�� ��.00 �� 0.� 0.0�
����� Peanuts $���,�8� 0.� $���,�7� ��.80 ��8 9.� 0.0�
����7 Beans (Snake Beans) $���,790 0.� $���,�99 �.00 �0 �.� 0.0�
���0� Fresh Beef $��0,��9 0.7 $�0�,90� �8.�7 �98 �.� 0.0�
���0� Meat �n br�ne $�70,00� �.� $���,�88 �8.�7 �98 �.� 0.08
���09 T�nned Corned Beef $���,8�� �.� $���,�0� ��.�0 ��0g �9� �.0 0.08
����� T�nned luncheon meat $�78,�7� 0.7 $���,�7� �.8� �98g �9� �.� 0.0�
���0� Ch�cken $�,�97,��9 �.8 $�,�78,�80 ��.00 ��� ��.� 0.��
���0� Ch�cken parts $���,��0 �.0 $���,��0 �9.00 ��� 9.� 0.08
���0� Tuna/Bon�to $�,��0,��9 �.0 $�,���,98� 9.00 �0� �9.� 0.��
���0� Reef fish $70�,��8 �.� $79�,��� �0.00 ��0 �.� 0.�0
���0� Other fish $�,0��,�99 �.9 $�,���,�0� �0.00 ��0 �9.� 0.�0
����� Other t�nned fish $�7�,�90 0.� $�97,�07 �.0� �80g �90 �.� 0.0�
����9 Second grade Ta�yo $�,�7�,9�� �.� $�,9��,�8� �.0� �80g �90 ��.9 0.�0
���0� Bread all sorts $�,���,�7� �.� $�,��0,�90 9.00 ��� 8�.9 0.��
���0� Buns $�,�0�,7�8 �.� $�,���,9�� ��.00 ��9 ��.� 0.��
���0� Cab�n b�scu�ts $�,7��,��� �.� $�,9��,788 �.78 8�g ��� �8.8 0.��
���0� Doughnuts (puta) $�9�,�98 �.� $���,��� �.00 �00g ��9 7.� 0.08
���07 Other cakes and pastr�es $��9,8�8 0.� $�9�,��0 ��.00 ��� �.9 0.0�
����� PNG b�scu�ts $��9,��� 0.� $��8,��� �.78 8�g ��� �.8 0.0�
���0� Noodles $�,���,�9� �.9 $�,9��,99� �.0� 8�g 99 ��.8 0.�8
���07 R�ce $�0,0��,8�� �8.7 $��,�8�,9�9 �.7� ��� �7�.8 �.��
���09 Flour $�,�8�,7�7 �.� $�,���,�77 �..�0 ��9 ���.� 0�0
���0� Cook�ng o�l $�0�,��� �.� $�78,9�7 �.�8 �00ml 878 ��.� 0.09
���0� Butter/margar�ne $��0,898 0.� $��0,��� ��.00 ��0g 7�7 ��.� 0.0�
���0� Soft dr�nks $���,��7 0.� $�8�,7�0 �.09 ���ml ��� �.� 0.0�
���0� Sugar $�,��9,�7� �.� $�,�7�,�7� �.�� �00g �90 88.9 0.��
���0� Tws�t�es etc $���,0�9 0.� $�8�,��9 �.8� �0g ��0 �.� 0.0�
����� Brown sugar $���,87� 0.� $��7,�89 8.00 �90 7.9 0.0�
�7�0� Tea $�0�,��0 0.� $��7,��� �.97 �0g 0 0.0 0.0�
�7��8 Salt $���,�80 0.� $�8�,97� �.�9 0 0.0 0.0�
�7��9 Coffee M�x $99�,978 �.9 $�,��7,87� �.00 �0g �00 �.8 0.��
�7��� Betelnut $�,0��,7�� �.9 $�,���,��9 �.�0 �00g whole nut ��� ��.� 0.��
�8��0 F�sh and Ch�ps $���,�90 �.0 $�99,�8� �0.00 plate �7� �.9 0.08
Total Food per D�ary L�sted �tems $�8,��8,9�� $��,�8�,997 ����.9 �.9�
Total Food Exp Lowest �D $��,�8�,997
C� D�ary % of Total 0.887
Est�mated Food Expend�ture and Calor�e Intake
Hon�ara Households
Table 9
Pr�nc�pal D�ary Items Lowest Three Per Cap�ta (a.e) Expend�ture Dec�les
Food Item
A B C D E F G H I
We�ghted Expend�ture
per D�ary% of D�ary
Expend�ture
Grossed-up expend�ture
value
un�t pr�ce: all from
Hon�ara CPI
un�t: kg unless otherw�se �nd�cated
kcal value per �00g
cost perday
kcal per day per a.e
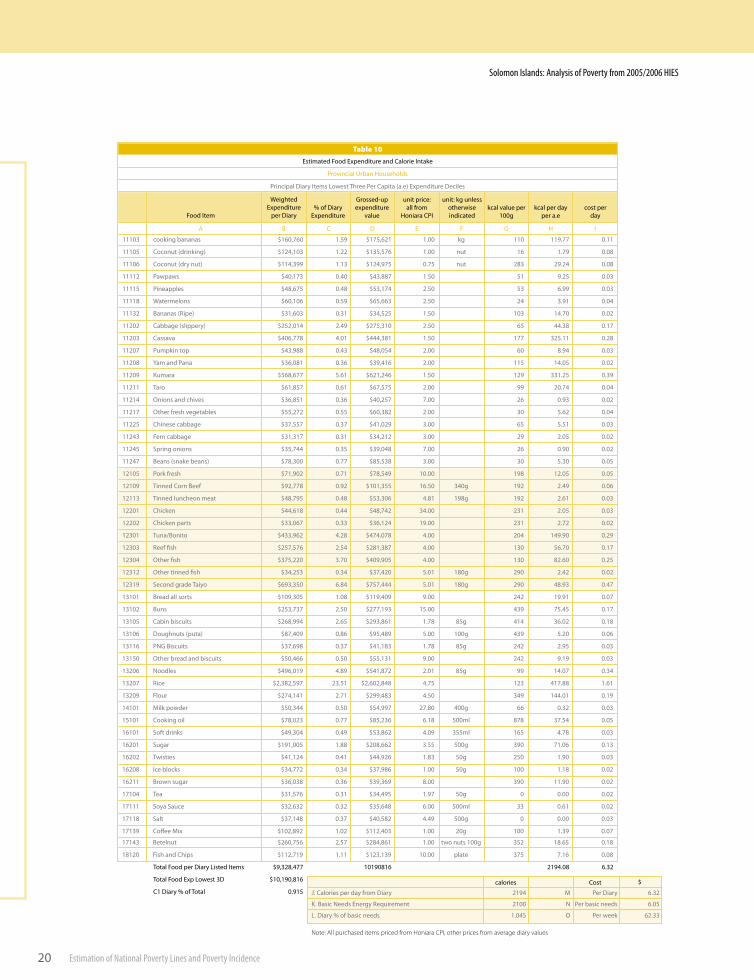
�0
Solomon Islands: Analysis of Poverty from 2005/2006 HIES
Estimation of National Poverty Lines and Poverty Incidence
J. Calor�es per day from D�ary ��9� M Per D�ary �.��
K. Bas�c Needs Energy Requ�rement ��00 N Per bas�c needs �.0�
L. D�ary % of bas�c needs �.0�� O Per week ��.��
calor�es Cost $
Note: All purchased items priced from Honiara CPI, other prices from average diary values
���0� cook�ng bananas $��0,7�0 �.�9 $�7�,��� �.00 kg ��0 ��9.77 0.��
���0� Coconut (dr�nk�ng) $���,�0� �.�� $���,�7� �.00 nut �� �.79 0.08
���0� Coconut (dry nut) $���,�99 �.�� $���,97� 0.7� nut �8� �9.�� 0.08
����� Pawpaws $�0,�7� 0.�0 $��,887 �.�0 �� 9.�� 0.0�
����� P�neapples $�8,�7� 0.�8 $��,�7� �.�0 �� �.99 0.0�
����8 Watermelons $�0,�0� 0.�9 $��,��� �.�0 �� �.9� 0.0�
����� Bananas (R�pe) $��,�0� 0.�� $��,��� �.�0 �0� ��.70 0.0�
���0� Cabbage (sl�ppery) $���,0�� �.�9 $�7�,��0 �.�0 �� ��.�8 0.�7
���0� Cassava $�0�,778 �.0� $���,�8� �.�0 �77 ���.�� 0.�8
���07 Pumpk�n top $��,988 0.�� $�8,0�� �.00 �0 8.9� 0.0�
���08 Yam and Pana $��,08� 0.�� $�9,��� �.00 ��� ��.0� 0.0�
���09 Kumara $��8,�77 �.�� $���,��� �.�0 ��9 ���.�� 0.�9
����� Taro $��,8�7 0.�� $�7,�7� �.00 99 �0.7� 0.0�
����� On�ons and ch�ves $��,8�� 0.�� $�0,��7 7.00 �� 0.9� 0.0�
����7 Other fresh vegetables $��,�7� 0.�� $�0,�8� �.00 �0 �.�� 0.0�
����� Ch�nese cabbage $�7,��7 0.�7 $��,0�9 �.00 �� �.�� 0.0�
����� Fern cabbage $��,��7 0.�� $��,��� �.00 �9 �.0� 0.0�
����� Spr�ng on�ons $��,7�� 0.�� $�9,0�8 7.00 �� 0.90 0.0�
����7 Beans (snake beans) $78,�00 0.77 $8�,��8 �.00 �0 �.�0 0.0�
���0� Pork fresh $7�,90� 0.7� $78,��9 �0.00 �98 ��.0� 0.0�
���09 T�nned Corn Beef $9�,778 0.9� $�0�,��� ��.�0 ��0g �9� �.�9 0.0�
����� T�nned luncheon meat $�8,79� 0.�8 $��,�0� �.8� �98g �9� �.�� 0.0�
���0� Ch�cken $��,��8 0.�� $�8,7�� ��.00 ��� �.0� 0.0�
���0� Ch�cken parts $��,0�7 0.�� $��,��� �9.00 ��� �.7� 0.0�
���0� Tuna/Bon�to $���,9�� �.�8 $�7�,078 �.00 �0� ��9.90 0.�9
���0� Reef fish $��7,�7� �.�� $�8�,�87 �.00 ��0 ��.70 0.�7
���0� Other fish $�7�,��0 �.70 $�09,90� �.00 ��0 8�.�0 0.��
����� Other t�nned fish $��,��� 0.�� $�7,��0 �.0� �80g �90 �.�� 0.0�
����9 Second grade Ta�yo $�9�,��0 �.8� $7�7,��� �.0� �80g �90 �8.9� 0.�7
���0� Bread all sorts $�09,�0� �.08 $��9,�09 9.00 ��� �9.9� 0.07
���0� Buns $���,7�7 �.�0 $�77,�9� ��.00 ��9 7�.�� 0.�7
���0� Cab�n b�scu�ts $��8,99� �.�� $�9�,8�� �.78 8�g ��� ��.0� 0.�8
���0� Doughnuts (puta) $87,�09 0.8� $9�,�89 �.00 �00g ��9 �.�0 0.0�
����� PNG B�scu�ts $�7,�98 0.�7 $��,�8� �.78 8�g ��� �.9� 0.0�
����0 Other bread and b�scu�ts $�0,��� 0.�0 $��,��� 9.00 ��� 9.�9 0.0�
���0� Noodles $�9�,0�9 �.89 $���,87� �.0� 8�g 99 ��.07 0.��
���07 R�ce $�,�8�,�97 ��.�� $�,�0�,8�8 �.7� ��� ��7.88 �.��
���09 Flour $�7�,��� �.7� $�99,�8� �.�0 ��9 ���.0� 0.�9
���0� M�lk powder $�0,��� 0.�0 $��,997 �7.80 �00g �� 0.�� 0.0�
���0� Cook�ng o�l $78,0�� 0.77 $8�,��� �.�8 �00ml 878 �7.�� 0.0�
���0� Soft dr�nks $�9,�0� 0.�9 $��,8�� �.09 ���ml ��� �.78 0.0�
���0� Sugar $�9�,00� �.88 $�08,��� �.�� �00g �90 7�.0� 0.��
���0� Tw�st�es $��,��� 0.�� $��,9�� �.8� �0g ��0 �.90 0.0�
���08 Ice blocks $��,77� 0.�� $�7,98� �.00 �0g �00 �.�8 0.0�
����� Brown sugar $��,0�8 0.�� $�9,��9 8.00 �90 ��.90 0.0�
�7�0� Tea $��,�7� 0.�� $��,�9� �.97 �0g 0 0.00 0.0�
�7��� Soya Sauce $��,��� 0.�� $��,��8 �.00 �00ml �� 0.�� 0.0�
�7��8 Salt $�7,��8 0.�7 $�0,�8� �.�9 �00g 0 0.00 0.0�
�7��9 Coffee M�x $�0�,89� �.0� $���,�0� �.00 �0g �00 �.�9 0.07
�7��� Betelnut $��0,7�� �.�7 $�8�,8�� �.00 two nuts �00g ��� �8.�� 0.�8
�8��0 F�sh and Ch�ps $���,7�9 �.�� $���,��9 �0.00 plate �7� 7.�� 0.08
Total Food per D�ary L�sted Items $9,��8,�77 �0�908�� ��9�.08 �.��
Total Food Exp Lowest �D $�0,�90,8��
C� D�ary % of Total 0.9��
Est�mated Food Expend�ture and Calor�e Intake
Prov�nc�al Urban Households
Table 10
Pr�nc�pal D�ary Items Lowest Three Per Cap�ta (a.e) Expend�ture Dec�les
Food Item
A B C D E F G H I
We�ghted Expend�ture
per D�ary% of D�ary
Expend�ture
Grossed-up expend�ture
value
un�t pr�ce: all from
Hon�ara CPI
un�t: kg unless otherw�se �nd�cated
kcal value per �00g
cost perday
kcal per day per a.e
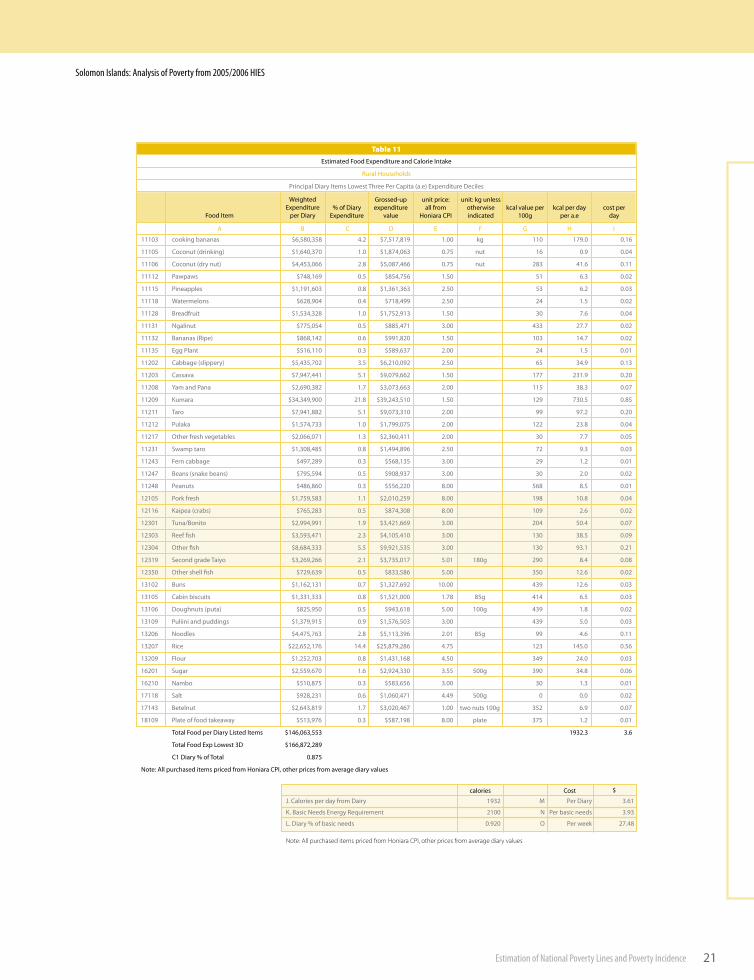
��
Solomon Islands: Analysis of Poverty from 2005/2006 HIES
Estimation of National Poverty Lines and Poverty Incidence
J. Calor�es per day from Da�ry �9�� M Per D�ary �.��
K. Bas�c Needs Energy Requ�rement ��00 N Per bas�c needs �.9�
L. D�ary % of bas�c needs 0.9�0 O Per week �7.�8
calor�es Cost $
Note: All purchased items priced from Honiara CPI, other prices from average diary values
���0� cook�ng bananas $�,�80,��8 �.� $7,��7,8�9 �.00 kg ��0 �79.0 0.��
���0� Coconut (dr�nk�ng) $�,��0,�70 �.0 $�,87�,0�� 0.7� nut �� 0.9 0.0�
���0� Coconut (dry nut) $�,���,0�� �.8 $�,087,��� 0.7� nut �8� ��.� 0.��
����� Pawpaws $7�8,��9 0.� $8��,7�� �.�0 �� �.� 0.0�
����� P�neapples $�,�9�,�0� 0.8 $�,���,��� �.�0 �� �.� 0.0�
����8 Watermelons $��8,90� 0.� $7�8,�99 �.�0 �� �.� 0.0�
����8 Breadfru�t $�,���,��8 �.0 $�,7��,9�� �.�0 �0 7.� 0.0�
����� Ngal�nut $77�,0�� 0.� $88�,�7� �.00 ��� �7.7 0.0�
����� Bananas (R�pe) $8�8,��� 0.� $99�,8�0 �.�0 �0� ��.7 0.0�
����� Egg Plant $���,��0 0.� $�89,��7 �.00 �� �.� 0.0�
���0� Cabbage (sl�ppery) $�,���,70� �.� $�,��0,09� �.�0 �� ��.9 0.��
���0� Cassava $7,9�7,��� �.� $9,079,��� �.�0 �77 ���.9 0.�0
���08 Yam and Pana $�,�90,�8� �.7 $�,07�,��� �.00 ��� �8.� 0.07
���09 Kumara $��,��9,900 ��.8 $�9,���,��0 �.�0 ��9 7�0.� 0.8�
����� Taro $7,9��,88� �.� $9,07�,��0 �.00 99 97.� 0.�0
����� Pulaka $�,�7�,7�� �.0 $�,799,07� �.00 ��� ��.8 0.0�
����7 Other fresh vegetables $�,0��,07� �.� $�,��0,��� �.00 �0 7.7 0.0�
����� Swamp taro $�,�08,�8� 0.8 $�,�9�,89� �.�0 7� 9.� 0.0�
����� Fern cabbage $�97,�89 0.� $��8,��� �.00 �9 �.� 0.0�
����7 Beans (snake beans) $79�,�9� 0.� $908,9�7 �.00 �0 �.0 0.0�
����8 Peanuts $�8�,8�0 0.� $���,��0 8.00 ��8 8.� 0.0�
���0� Pork fresh $�,7�9,�8� �.� $�,0�0,��9 8.00 �98 �0.8 0.0�
����� Ka�pea (crabs) $7��,�8� 0.� $87�,�08 8.00 �09 �.� 0.0�
���0� Tuna/Bon�to $�,99�,99� �.9 $�,���,��9 �.00 �0� �0.� 0.07
���0� Reef fish $�,�9�,�7� �.� $�,�0�,��0 �.00 ��0 �8.� 0.09
���0� Other fish $8,�8�,��� �.� $9,9��,��� �.00 ��0 9�.� 0.��
����9 Second grade Ta�yo $�,��9,��� �.� $�,7��,0�7 �.0� �80g �90 8.� 0.08
����0 Other shell fish $7�9,��9 0.� $8��,�8� �.00 ��0 ��.� 0.0�
���0� Buns $�,���,��� 0.7 $�,��7,�9� �0.00 ��9 ��.� 0.0�
���0� Cab�n b�scu�ts $�,���,��� 0.8 $�,���,000 �.78 8�g ��� �.� 0.0�
���0� Doughnuts (puta) $8��,9�0 0.� $9��,��8 �.00 �00g ��9 �.8 0.0�
���09 Pul��n� and pudd�ngs $�,�79,9�� 0.9 $�,�7�,�0� �.00 ��9 �.0 0.0�
���0� Noodles $�,�7�,7�� �.8 $�,���,�9� �.0� 8�g 99 �.� 0.��
���07 R�ce $��,���,�7� ��.� $��,879,�8� �.7� ��� ���.0 0.��
���09 Flour $�,���,70� 0.8 $�,���,��8 �.�0 ��9 ��.0 0.0�
���0� Sugar $�,��9,�70 �.� $�,9��,��0 �.�� �00g �90 ��.8 0.0�
����0 Nambo $��0,87� 0.� $�8�,��� �.00 �0 �.� 0.0�
�7��8 Salt $9�8,��� 0.� $�,0�0,�7� �.�9 �00g 0 0.0 0.0�
�7��� Betelnut $�,���,8�9 �.7 $�,0�0,��7 �.00 two nuts �00g ��� �.9 0.07
�8�09 Plate of food takeaway $���,97� 0.� $�87,�98 8.00 plate �7� �.� 0.0�
Total Food per D�ary L�sted Items $���,0��,��� �9��.� �.�
Total Food Exp Lowest �D $���,87�,�89
C� D�ary % of Total 0.87�
Note: All purchased �tems pr�ced from Hon�ara CPI, other pr�ces from average d�ary values
Est�mated Food Expend�ture and Calor�e Intake
Rural Households
Table 11
Pr�nc�pal D�ary Items Lowest Three Per Cap�ta (a.e) Expend�ture Dec�les
Food Item
A B C D E F G H I
We�ghted Expend�ture
per D�ary% of D�ary
Expend�ture
Grossed-up expend�ture
value
un�t pr�ce: all from
Hon�ara CPI
un�t: kg unless otherw�se �nd�cated
kcal value per �00g
cost perday
kcal per day per a.e
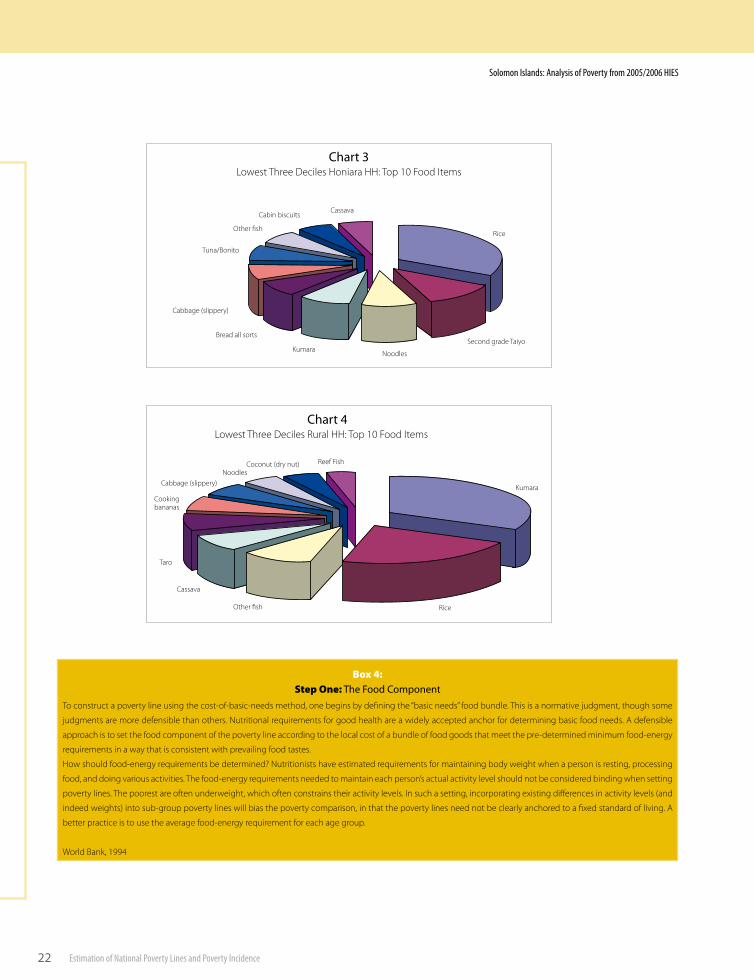
��
Solomon Islands: Analysis of Poverty from 2005/2006 HIES
Estimation of National Poverty Lines and Poverty Incidence
Chart �Lowest Three Deciles Rural HH: Top 10 Food Items
Rice
Kumara
Reef FishCoconut (dry nut)Noodles
Cabbage (slippery)
Cooking bananas
Taro
Cassava
Other fish
Box 4:
To construct a poverty line using the cost-of-basic-needs method, one begins by defining the “basic needs” food bundle. This is a normative judgment, though some
judgments are more defensible than others. Nutritional requirements for good health are a widely accepted anchor for determining basic food needs. A defensible
approach is to set the food component of the poverty line according to the local cost of a bundle of food goods that meet the pre-determined minimum food-energy
requirements in a way that is consistent with prevailing food tastes.
How should food-energy requirements be determined? Nutritionists have estimated requirements for maintaining body weight when a person is resting, processing
food, and doing various activities. The food-energy requirements needed to maintain each person’s actual activity level should not be considered binding when setting
poverty lines. The poorest are often underweight, which often constrains their activity levels. In such a setting, incorporating existing differences in activity levels (and
indeed weights) into sub-group poverty lines will bias the poverty comparison, in that the poverty lines need not be clearly anchored to a fixed standard of living. A
better practice is to use the average food-energy requirement for each age group.
World Bank, 1994
Step One: The Food Component
Chart �Lowest Three Deciles Honiara HH: Top 10 Food Items
Noodles
Second grade Taiyo
Rice
Kumara
Bread all sorts
Cabbage (slippery)
Tuna/Bonito
Other fish
Cabin biscuitsCassava
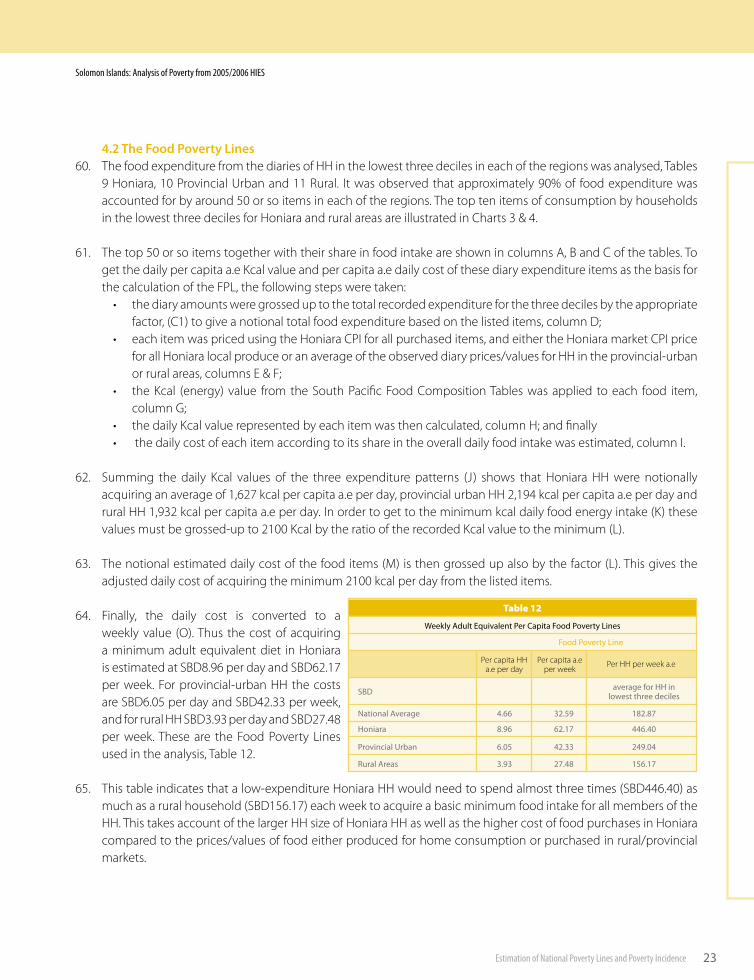
��
Solomon Islands: Analysis of Poverty from 2005/2006 HIES
Estimation of National Poverty Lines and Poverty Incidence
4.2 The Food Poverty Lines60. The food expenditure from the diaries of HH in the lowest three deciles in each of the regions was analysed, Tables
9 Honiara, 10 Provincial Urban and 11 Rural. It was observed that approximately 90% of food expenditure was accounted for by around 50 or so items in each of the regions. The top ten items of consumption by households in the lowest three deciles for Honiara and rural areas are illustrated in Charts 3 & 4.
61. The top 50 or so items together with their share in food intake are shown in columns A, B and C of the tables. To get the daily per capita a.e Kcal value and per capita a.e daily cost of these diary expenditure items as the basis for the calculation of the FPL, the following steps were taken:
• the diary amounts were grossed up to the total recorded expenditure for the three deciles by the appropriate factor, (C1) to give a notional total food expenditure based on the listed items, column D;
• each item was priced using the Honiara CPI for all purchased items, and either the Honiara market CPI price for all Honiara local produce or an average of the observed diary prices/values for HH in the provincial-urban or rural areas, columns E & F;
• the Kcal (energy) value from the South Pacific Food Composition Tables was applied to each food item, column G;
• the daily Kcal value represented by each item was then calculated, column H; and finally• the daily cost of each item according to its share in the overall daily food intake was estimated, column I.
62. Summing the daily Kcal values of the three expenditure patterns (J) shows that Honiara HH were notionally acquiring an average of 1,627 kcal per capita a.e per day, provincial urban HH 2,194 kcal per capita a.e per day and rural HH 1,932 kcal per capita a.e per day. In order to get to the minimum kcal daily food energy intake (K) these values must be grossed-up to 2100 Kcal by the ratio of the recorded Kcal value to the minimum (L).
63. The notional estimated daily cost of the food items (M) is then grossed up also by the factor (L). This gives the adjusted daily cost of acquiring the minimum 2100 kcal per day from the listed items.
64. Finally, the daily cost is converted to a weekly value (O). Thus the cost of acquiring a minimum adult equivalent diet in Honiara is estimated at SBD8.96 per day and SBD62.17 per week. For provincial-urban HH the costs are SBD6.05 per day and SBD42.33 per week, and for rural HH SBD3.93 per day and SBD27.48 per week. These are the Food Poverty Lines used in the analysis, Table 12.
65. This table indicates that a low-expenditure Honiara HH would need to spend almost three times (SBD446.40) as much as a rural household (SBD156.17) each week to acquire a basic minimum food intake for all members of the HH. This takes account of the larger HH size of Honiara HH as well as the higher cost of food purchases in Honiara compared to the prices/values of food either produced for home consumption or purchased in rural/provincial markets.
Per capita HH a.e per day
Weekly Adult Equ�valent Per Cap�ta Food Poverty L�nes
Food Poverty L�ne
Per HH per week a.e
SBD
Nat�onal Average �.��
Hon�ara
Prov�nc�al Urban �.0�
8.9�
��.�9
��.�7
��.��
average for HH �n lowest three dec�les
�8�.87
���.�0
��9.0�
Table 12
Per capita a.e per week
Rural Areas �.9� �7.�8 ���.�7
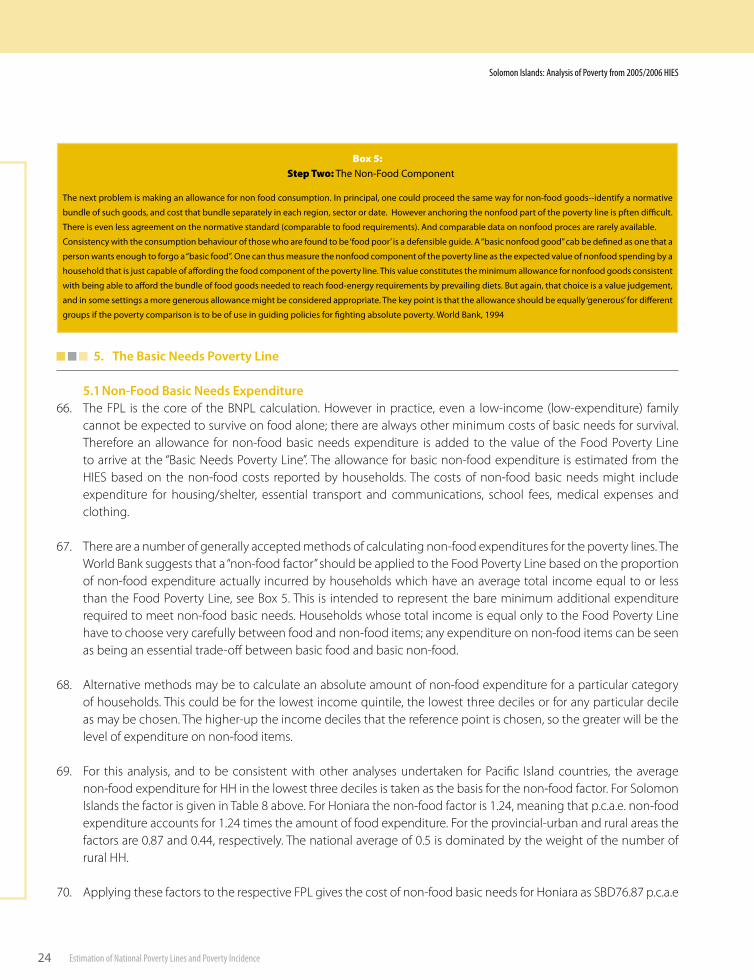
��
Solomon Islands: Analysis of Poverty from 2005/2006 HIES
Estimation of National Poverty Lines and Poverty Incidence
5. The Basic Needs Poverty Line
5.1 Non-Food Basic Needs Expenditure66. The FPL is the core of the BNPL calculation. However in practice, even a low-income (low-expenditure) family
cannot be expected to survive on food alone; there are always other minimum costs of basic needs for survival. Therefore an allowance for non-food basic needs expenditure is added to the value of the Food Poverty Line to arrive at the “Basic Needs Poverty Line”. The allowance for basic non-food expenditure is estimated from the HIES based on the non-food costs reported by households. The costs of non-food basic needs might include expenditure for housing/shelter, essential transport and communications, school fees, medical expenses and clothing.
67. There are a number of generally accepted methods of calculating non-food expenditures for the poverty lines. The World Bank suggests that a “non-food factor” should be applied to the Food Poverty Line based on the proportion of non-food expenditure actually incurred by households which have an average total income equal to or less than the Food Poverty Line, see Box 5. This is intended to represent the bare minimum additional expenditure required to meet non-food basic needs. Households whose total income is equal only to the Food Poverty Line have to choose very carefully between food and non-food items; any expenditure on non-food items can be seen as being an essential trade-off between basic food and basic non-food.
68. Alternative methods may be to calculate an absolute amount of non-food expenditure for a particular category of households. This could be for the lowest income quintile, the lowest three deciles or for any particular decile as may be chosen. The higher-up the income deciles that the reference point is chosen, so the greater will be the level of expenditure on non-food items.
69. For this analysis, and to be consistent with other analyses undertaken for Pacific Island countries, the average non-food expenditure for HH in the lowest three deciles is taken as the basis for the non-food factor. For Solomon Islands the factor is given in Table 8 above. For Honiara the non-food factor is 1.24, meaning that p.c.a.e. non-food expenditure accounts for 1.24 times the amount of food expenditure. For the provincial-urban and rural areas the factors are 0.87 and 0.44, respectively. The national average of 0.5 is dominated by the weight of the number of rural HH.
70. Applying these factors to the respective FPL gives the cost of non-food basic needs for Honiara as SBD76.87 p.c.a.e
Box 5:
The next problem �s mak�ng an allowance for non food consumpt�on. In pr�nc�pal, one could proceed the same way for non-food goods--�dent�fy a normat�ve
bundle of such goods, and cost that bundle separately �n each reg�on, sector or date. However anchor�ng the nonfood part of the poverty l�ne �s pften d�fficult.
There �s even less agreement on the normat�ve standard (comparable to food requ�rements). And comparable data on nonfood proces are rarely ava�lable.
Cons�stency w�th the consumpt�on behav�our of those who are found to be ‘food poor’ �s a defens�ble gu�de. A “bas�c nonfood good” cab be defined as one that a
person wants enough to forgo a “bas�c food”. One can thus measure the nonfood component of the poverty l�ne as the expected value of nonfood spend�ng by a
household that �s just capable of afford�ng the food component of the poverty l�ne. Th�s value const�tutes the m�n�mum allowance for nonfood goods cons�stent
w�th be�ng able to afford the bundle of food goods needed to reach food-energy requ�rements by preva�l�ng d�ets. But aga�n, that cho�ce �s a value judgement,
and �n some sett�ngs a more generous allowance m�ght be cons�dered appropr�ate. The key po�nt �s that the allowance should be equally ‘generous’ for d�fferent
groups �f the poverty compar�son �s to be of use �n gu�d�ng pol�c�es for fight�ng absolute poverty. World Bank, �99�
Step Two: The Non-Food Component
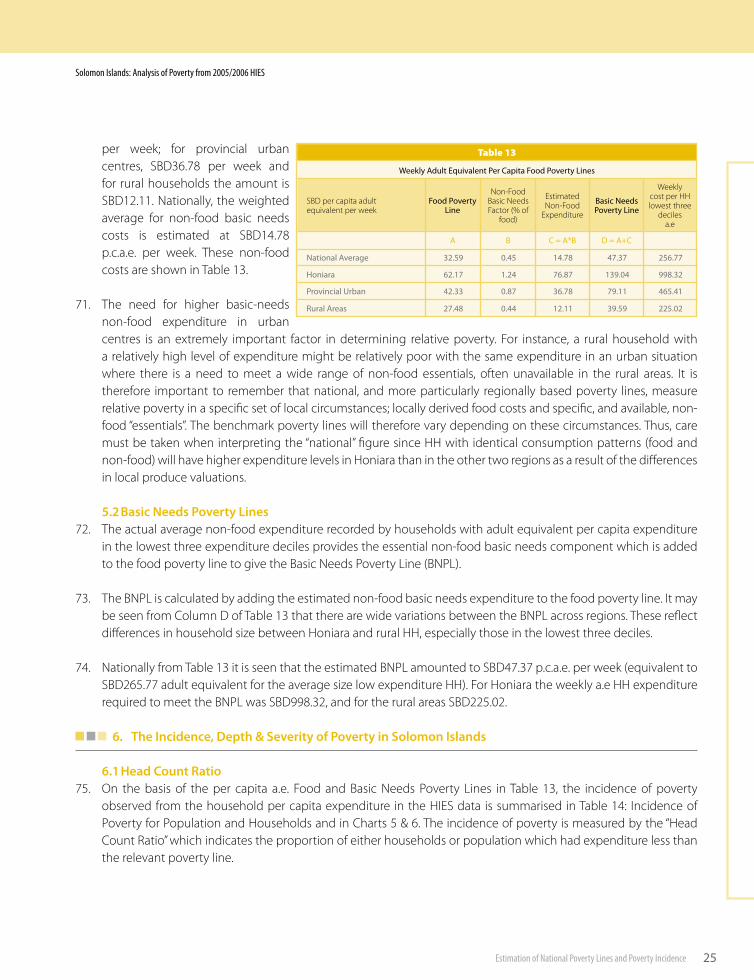
��
Solomon Islands: Analysis of Poverty from 2005/2006 HIES
Estimation of National Poverty Lines and Poverty Incidence
per week; for provincial urban centres, SBD36.78 per week and for rural households the amount is SBD12.11. Nationally, the weighted average for non-food basic needs costs is estimated at SBD14.78 p.c.a.e. per week. These non-food costs are shown in Table 13.
71. The need for higher basic-needs non-food expenditure in urban centres is an extremely important factor in determining relative poverty. For instance, a rural household with a relatively high level of expenditure might be relatively poor with the same expenditure in an urban situation where there is a need to meet a wide range of non-food essentials, often unavailable in the rural areas. It is therefore important to remember that national, and more particularly regionally based poverty lines, measure relative poverty in a specific set of local circumstances; locally derived food costs and specific, and available, non-food “essentials”. The benchmark poverty lines will therefore vary depending on these circumstances. Thus, care must be taken when interpreting the “national” figure since HH with identical consumption patterns (food and non-food) will have higher expenditure levels in Honiara than in the other two regions as a result of the differences in local produce valuations.
5.2 Basic Needs Poverty Lines72. The actual average non-food expenditure recorded by households with adult equivalent per capita expenditure
in the lowest three expenditure deciles provides the essential non-food basic needs component which is added to the food poverty line to give the Basic Needs Poverty Line (BNPL).
73. The BNPL is calculated by adding the estimated non-food basic needs expenditure to the food poverty line. It may be seen from Column D of Table 13 that there are wide variations between the BNPL across regions. These reflect differences in household size between Honiara and rural HH, especially those in the lowest three deciles.
74. Nationally from Table 13 it is seen that the estimated BNPL amounted to SBD47.37 p.c.a.e. per week (equivalent to SBD265.77 adult equivalent for the average size low expenditure HH). For Honiara the weekly a.e HH expenditure required to meet the BNPL was SBD998.32, and for the rural areas SBD225.02.
6. The Incidence, Depth & Severity of Poverty in Solomon Islands
6.1 Head Count Ratio75. On the basis of the per capita a.e. Food and Basic Needs Poverty Lines in Table 13, the incidence of poverty
observed from the household per capita expenditure in the HIES data is summarised in Table 14: Incidence of Poverty for Population and Households and in Charts 5 & 6. The incidence of poverty is measured by the “Head Count Ratio” which indicates the proportion of either households or population which had expenditure less than the relevant poverty line.
Food PovertyL�ne
Weekly Adult Equ�valent Per Cap�ta Food Poverty L�nes
A
Nat�onal Average
Hon�ara
Prov�nc�al Urban ��.��
��.�7
Table 13
SBD per capita adult equivalent per week
Non-Food Basic NeedsFactor (% of
food)
EstimatedNon-Food
Expenditure
Bas�c NeedsPoverty L�ne
Weekly cost per HH lowest three
decilesa.e
B C = A*B D = A+C
0.��
�.��
0.87
��.�9 ��.78
7�.87
��.78
�7.�7
��9.0�
79.��
���.77
998.��
���.��
0.���7.�8 ��.�� �9.�9 ���.0�Rural Areas
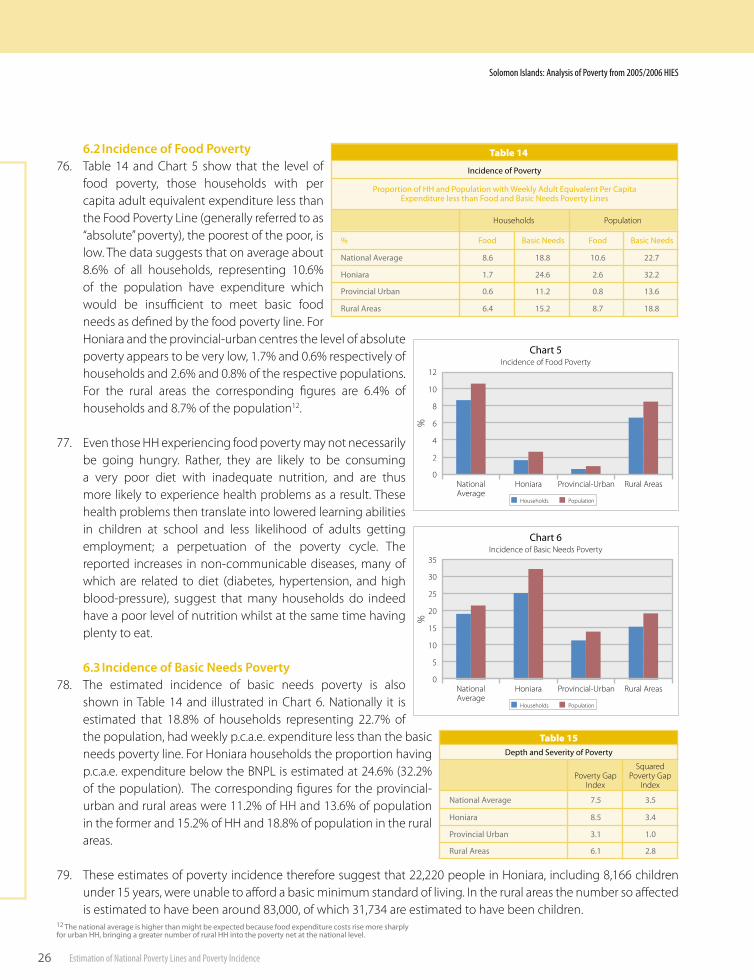
��
Solomon Islands: Analysis of Poverty from 2005/2006 HIES
Estimation of National Poverty Lines and Poverty Incidence
6.2 Incidence of Food Poverty76. Table 14 and Chart 5 show that the level of
food poverty, those households with per capita adult equivalent expenditure less than the Food Poverty Line (generally referred to as “absolute” poverty), the poorest of the poor, is low. The data suggests that on average about 8.6% of all households, representing 10.6% of the population have expenditure which would be insufficient to meet basic food needs as defined by the food poverty line. For Honiara and the provincial-urban centres the level of absolute poverty appears to be very low, 1.7% and 0.6% respectively of households and 2.6% and 0.8% of the respective populations. For the rural areas the corresponding figures are 6.4% of households and 8.7% of the population12.
77. Even those HH experiencing food poverty may not necessarily be going hungry. Rather, they are likely to be consuming a very poor diet with inadequate nutrition, and are thus more likely to experience health problems as a result. These health problems then translate into lowered learning abilities in children at school and less likelihood of adults getting employment; a perpetuation of the poverty cycle. The reported increases in non-communicable diseases, many of which are related to diet (diabetes, hypertension, and high blood-pressure), suggest that many households do indeed have a poor level of nutrition whilst at the same time having plenty to eat.
6.3 Incidence of Basic Needs Poverty 78. The estimated incidence of basic needs poverty is also
shown in Table 14 and illustrated in Chart 6. Nationally it is estimated that 18.8% of households representing 22.7% of the population, had weekly p.c.a.e. expenditure less than the basic needs poverty line. For Honiara households the proportion having p.c.a.e. expenditure below the BNPL is estimated at 24.6% (32.2% of the population). The corresponding figures for the provincial-urban and rural areas were 11.2% of HH and 13.6% of population in the former and 15.2% of HH and 18.8% of population in the rural areas.
79. These estimates of poverty incidence therefore suggest that 22,220 people in Honiara, including 8,166 children under 15 years, were unable to afford a basic minimum standard of living. In the rural areas the number so affected is estimated to have been around 83,000, of which 31,734 are estimated to have been children.
Depth and Sever�ty of Poverty
Table 15
7.�
Hon�ara
Prov�nc�al Urban
�.�
�.�
�.�
�.0
�.8
8.�
Rural Areas
Nat�onal Average �.�
Poverty GapIndex
SquaredPoverty Gap
Index
0
5
10
15
20
25
30
35
NationalAverage
Honiara Provincial-Urban Rural Areas
Households Population
%
Chart �Incidence of Basic Needs Poverty
Inc�dence of Poverty
Food
Nat�onal Average
Hon�ara
Prov�nc�al Urban 0.�
�.7
Table 14
Proport�on of HH and Populat�on w�th Weekly Adult Equ�valent Per Cap�ta Expend�ture less than Food and Bas�c Needs Poverty L�nes
�8.8
��.�
��.�
8.� �0.�
�.�
0.8
��.7
��.�
��.�
��.��.� 8.7 �8.8Rural Areas
% Bas�c Needs Food Bas�c Needs
Households Population
0
2
4
6
8
10
12
Honiara Provincial-Urban Rural Areas
Households Population
%
Chart �Incidence of Food Poverty
NationalAverage
�� The nat�onal average �s h�gher than m�ght be expected because food expend�ture costs r�se more sharply for urban HH, br�ng�ng a greater number of rural HH �nto the poverty net at the nat�onal level.
�7
Solomon Islands: Analysis of Poverty from 2005/2006 HIES
Estimation of National Poverty Lines and Poverty Incidence
80. There are also many more households and individuals who have expenditure only just above the basic needs poverty line and who are therefore vulnerable. It is estimated that additionally around 18,500 rural people (including 8070 children) and 3,885 people in Honiara (including 1450 children) have expenditure no more than ten percent above the rural and Honiara BNPL respectively. With rising prices and/or declining incomes/expenditure these people are highly vulnerable to slipping below the poverty lines.
81. Based on the aggregate national average basic needs poverty line it is estimated that 121,063 people were living in basic-needs poverty in Solomon Islands. This included an estimated 47,238 children. Additionally those children living in households where the per capita adult equivalent expenditure was no more than ten percent about the level of the national BNPL numbered an additional 10,136. Thus approximately 57,000 children in Solomon Islands were either already living below the poverty line or were highly vulnerable to falling into poverty.
82. These figures suggest that although Honiara is a source of work and employment for many, there are, nevertheless, many households whose expenditure cannot cover the basic needs costs of a reasonable minimum standard of living. There are many who would be classified as working poor. They may be in employment, either full or part-time, but their incomes and thus expenditure is insufficient to meet all their family’s needs.
83. Households that appear to be least disadvantaged in terms of the poverty line are those in the provincial-urban centres. Many in these centres are employed either by government or the provincial administrations. Indeed the survey reveals that almost 70% of HH heads in the provincial urban centres were in some form of employment, and even amongst the lowest three deciles the proportion was around 60%. These HH have the benefit of lower local produce prices and less need to spend on non-food items. Thus they appear generally better-off relative to those in Honiara.
84. The proportion of rural households below the rural poverty line is lower than the proportion of HH in Honiara below the urban poverty line. Average expenditure is lower in the rural areas, primarily because food costs/values are lower and there is little need (or opportunity) for non-food expenditure. Therefore, the basic needs poverty line is lower and as a higher proportion of food comes from own production, the extent of poverty is itself lower. However, as will be seen later in the report, these rural HH often lack access to essential basic services and are thus more disadvantaged in terms of opportunity and access. This is termed the “poverty of opportunity” as opposed to the poverty of income or consumption.
85. In considering the basic incidence of poverty it is also useful to estimate the number of those other households and population who might be vulnerable to falling into poverty, that is those who are only just now living above the BNPL. A sensitivity analysis has therefore been done with the BNPL being increased by 10% to estimate the additional number of HH and population that would then fall below the BNPL.
86. For Honiara a 10% increase in the BNPL to SBD152.94 p.c.a.e per week would bring an additional 510 households and 3885 people into poverty. This would raise the incidence of households in poverty by 5.1 percentage points to 29.7%, and would raise the proportion of the Honiara population below the poverty by 5.6 percentage points to 37.8%.
87. For the rural areas raising the BNPL by 10% to SBD43.55 p.c.a.e per week would bring 2471 households into poverty representing and additional 18,504 people. This would raise the incidence of rural households in poverty by 3.3
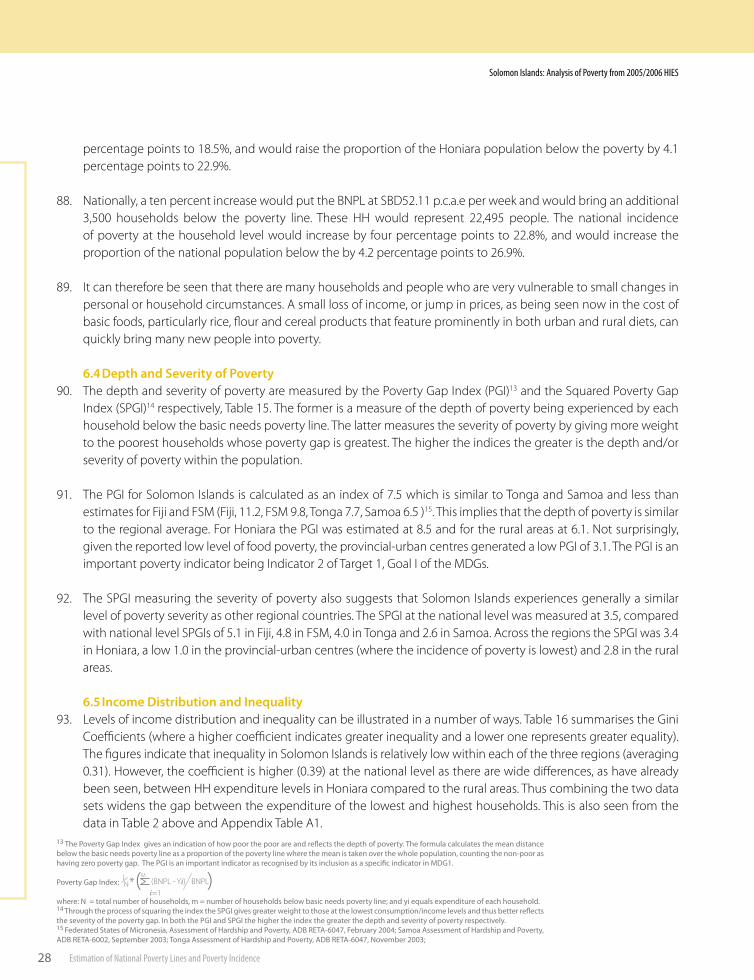
�8
Solomon Islands: Analysis of Poverty from 2005/2006 HIES
Estimation of National Poverty Lines and Poverty Incidence
percentage points to 18.5%, and would raise the proportion of the Honiara population below the poverty by 4.1 percentage points to 22.9%.
88. Nationally, a ten percent increase would put the BNPL at SBD52.11 p.c.a.e per week and would bring an additional 3,500 households below the poverty line. These HH would represent 22,495 people. The national incidence of poverty at the household level would increase by four percentage points to 22.8%, and would increase the proportion of the national population below the by 4.2 percentage points to 26.9%.
89. It can therefore be seen that there are many households and people who are very vulnerable to small changes in personal or household circumstances. A small loss of income, or jump in prices, as being seen now in the cost of basic foods, particularly rice, flour and cereal products that feature prominently in both urban and rural diets, can quickly bring many new people into poverty.
6.4 Depth and Severity of Poverty90. The depth and severity of poverty are measured by the Poverty Gap Index (PGI)13 and the Squared Poverty Gap
Index (SPGI)14 respectively, Table 15. The former is a measure of the depth of poverty being experienced by each household below the basic needs poverty line. The latter measures the severity of poverty by giving more weight to the poorest households whose poverty gap is greatest. The higher the indices the greater is the depth and/or severity of poverty within the population.
91. The PGI for Solomon Islands is calculated as an index of 7.5 which is similar to Tonga and Samoa and less than estimates for Fiji and FSM (Fiji, 11.2, FSM 9.8, Tonga 7.7, Samoa 6.5 )15. This implies that the depth of poverty is similar to the regional average. For Honiara the PGI was estimated at 8.5 and for the rural areas at 6.1. Not surprisingly, given the reported low level of food poverty, the provincial-urban centres generated a low PGI of 3.1. The PGI is an important poverty indicator being Indicator 2 of Target 1, Goal I of the MDGs.
92. The SPGI measuring the severity of poverty also suggests that Solomon Islands experiences generally a similar level of poverty severity as other regional countries. The SPGI at the national level was measured at 3.5, compared with national level SPGIs of 5.1 in Fiji, 4.8 in FSM, 4.0 in Tonga and 2.6 in Samoa. Across the regions the SPGI was 3.4 in Honiara, a low 1.0 in the provincial-urban centres (where the incidence of poverty is lowest) and 2.8 in the rural areas.
6.5 Income Distribution and Inequality93. Levels of income distribution and inequality can be illustrated in a number of ways. Table 16 summarises the Gini
Coefficients (where a higher coefficient indicates greater inequality and a lower one represents greater equality). The figures indicate that inequality in Solomon Islands is relatively low within each of the three regions (averaging 0.31). However, the coefficient is higher (0.39) at the national level as there are wide differences, as have already been seen, between HH expenditure levels in Honiara compared to the rural areas. Thus combining the two data sets widens the gap between the expenditure of the lowest and highest households. This is also seen from the data in Table 2 above and Appendix Table A1.
�� The Poverty Gap Index g�ves an �nd�cat�on of how poor the poor are and reflects the depth of poverty. The formula calculates the mean d�stance below the bas�c needs poverty l�ne as a proport�on of the poverty l�ne where the mean �s taken over the whole populat�on, count�ng the non-poor as hav�ng zero poverty gap. The PGI �s an �mportant �nd�cator as recogn�sed by �ts �nclus�on as a spec�fic �nd�cator �n MDG�. Poverty Gap Index:
where: N = total number of households, m = number of households below bas�c needs poverty l�ne; and y� equals expend�ture of each household.�� Through the process of squar�ng the �ndex the SPGI g�ves greater we�ght to those at the lowest consumpt�on/�ncome levels and thus better reflects the sever�ty of the poverty gap. In both the PGI and SPGI the h�gher the �ndex the greater the depth and sever�ty of poverty respect�vely.�� Federated States of M�crones�a, Assessment of Hardsh�p and Poverty, ADB RETA-�0�7, February �00�; Samoa Assessment of Hardsh�p and Poverty, ADB RETA-�00�, September �00�; Tonga Assessment of Hardsh�p and Poverty, ADB RETA-�0�7, November �00�;
NI *(M
(BNPL - Yi) BNPL)i=1

�9
Solomon Islands: Analysis of Poverty from 2005/2006 HIES
Estimation of National Poverty Lines and Poverty Incidence
94. Chart 7 shows the share of expenditure incurred by each decile; Appendix Table A1 provides details of the proportion of expenditure by decile. On average the poorest ten-percent of all households incurred about 2.6% of expenditure while the top decile of households incurred around 31% of all expenditure. There were variations between the three regions with the lowest three deciles in Honiara having a slightly greater share of expenditure (16.3%) compared to 13.8% in the rural areas. However in both Honiara and the rural areas the top three deciles had 52.6% and 52.8% of expenditure respectively.
95. The ratio of the share of the bottom quintile to the top quintile of HH (MDG Indicator 3 of Target 1, Goal 1) was 6.9 at the national level, 4.0 for Honiara and 4.9 for the rural areas. The higher ratio at the national level reflects the bias of Honiara HH to the higher deciles when aggregated with those in the rural areas where expenditure is generally lower as a result of the valuation of own-production.
96. The foregoing analysis has illustrated that there are wide gaps between the expenditure levels of households across the country, and particularly between those in the urban and rural areas. It has highlighted however, that although the p.c.a.e. expenditure levels of those in the rural areas is on average lower than households in Honiara, when it comes to their ability to meet basic needs, those in the rural areas are in fact “better-off”. They produce more of their own food, and thus do not need to purchase so much, and also they need less cash for non-food basic needs as there is generally less available in the way of services to be purchased, and less “need” for expenditure on such things as transport, fuel and power, water, communications and such other “essentials” required in an urban environment.
97. It is arguable of course that households in the rural areas without, or with only limited access to basic services are inherently “poorer” than those with better access in Honiara. As noted at the beginning however, this analysis is looking at “relative” poverty amongst those living in similar environments and not at “absolute” poverty measured against a single common benchmark (e.g. US$1 or US$2 per day).
Locat�on of Rural HH �n Lowest Three Dec�les
Table 17
ProvinceProportion ofall Rural HH
Proportion ofHH in Lowest
3D
Proportion ofall Rural
Population
Proportion ofRural
PopulationLowest 3D
�.7Cho�seul 9.7 �.9 9.7
�7.�
�.�Isabel
0.9
�8.�
�9.�
9.9
�.7
100.0Total 100.0 100.0 100.0
Temotu 8.� �.� 8.0
Mak�ra ��.� �0.8 ��.�
Mala�ta ��.� �0.9 ��.�
Guadalcanal ��.8 �7.� ��.�
Renbell 0.� �.0 0.�
�.7 �.� �.�
Western
�.�Central �.� �.� �.�
��.8 �7.� ��.9
G�n� Coeffic�ents of Inequal�ty
Table 16
Nat�onal Average
Hon�ara
0.�9
0.�0
0.��Prov�nc�al Urban
Per capita a.e expenditureGini
Coefficient
0.��Rural Areas
0
5
10
15
20
25
30
35
Average all Households Honiara Provincial-Urban Rural
% o
f exp
emdi
ture
Chart 7Distribution of HH Expenditure by Decile
1st Decile 2nd Decile 3rd Decile 4th Decile 5th Decile 6th Decile 7th Decile 8th Decile 9th Decile Top Decile
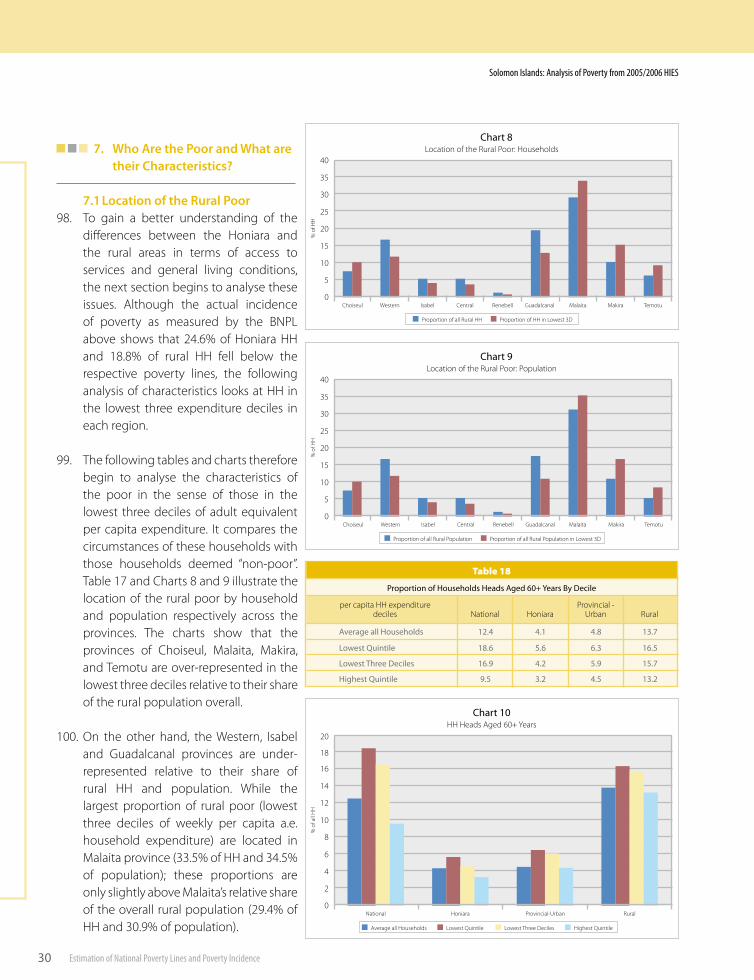
�0
Solomon Islands: Analysis of Poverty from 2005/2006 HIES
Estimation of National Poverty Lines and Poverty Incidence
7. Who Are the Poor and What are their Characteristics?
7.1 Location of the Rural Poor98. To gain a better understanding of the
differences between the Honiara and the rural areas in terms of access to services and general living conditions, the next section begins to analyse these issues. Although the actual incidence of poverty as measured by the BNPL above shows that 24.6% of Honiara HH and 18.8% of rural HH fell below the respective poverty lines, the following analysis of characteristics looks at HH in the lowest three expenditure deciles in each region.
99. The following tables and charts therefore begin to analyse the characteristics of the poor in the sense of those in the lowest three deciles of adult equivalent per capita expenditure. It compares the circumstances of these households with those households deemed “non-poor”. Table 17 and Charts 8 and 9 illustrate the location of the rural poor by household and population respectively across the provinces. The charts show that the provinces of Choiseul, Malaita, Makira, and Temotu are over-represented in the lowest three deciles relative to their share of the rural population overall.
100. On the other hand, the Western, Isabel and Guadalcanal provinces are under-represented relative to their share of rural HH and population. While the largest proportion of rural poor (lowest three deciles of weekly per capita a.e. household expenditure) are located in Malaita province (33.5% of HH and 34.5% of population); these proportions are only slightly above Malaita’s relative share of the overall rural population (29.4% of HH and 30.9% of population).
Proport�on of Households Heads Aged �0+ Years By Dec�le
per capita HH expenditure deciles National RuralHoniara
Provincial -Urban
Average all Households
Lowest Qu�nt�le �8.�
��.�
Lowest Three Dec�les
H�ghest Qu�nt�le 9.�
��.9
�.�
�.�
�.�
�.�
�.8
�.�
�.9
�.�
��.7
��.�
��.7
��.�
Table 18
0
2
4
6
8
10
12
14
16
National
% o
f all
HH
Chart �0HH Heads Aged 60+ Years
18
20
Honiara Provincial-Urban Rural
Average all Households Lowest Quintile Lowest Three Deciles Highest Quintile
0
5
10
15
20
25
30
35
40
Proportion of all Rural Population Proportion of all Rural Population in Lowest 3D
% o
f HH
Chart 9Location of the Rural Poor: Population
Choiseul Western Isabel Central Renebell Guadalcanal Malaita Makira Temotu
0
5
10
15
20
25
30
35
40
Choiseul
Proportion of all Rural HH Proportion of HH in Lowest 3D%
of H
H
Chart 8Location of the Rural Poor: Households
Western Isabel Central Renebell Guadalcanal Malaita Makira Temotu
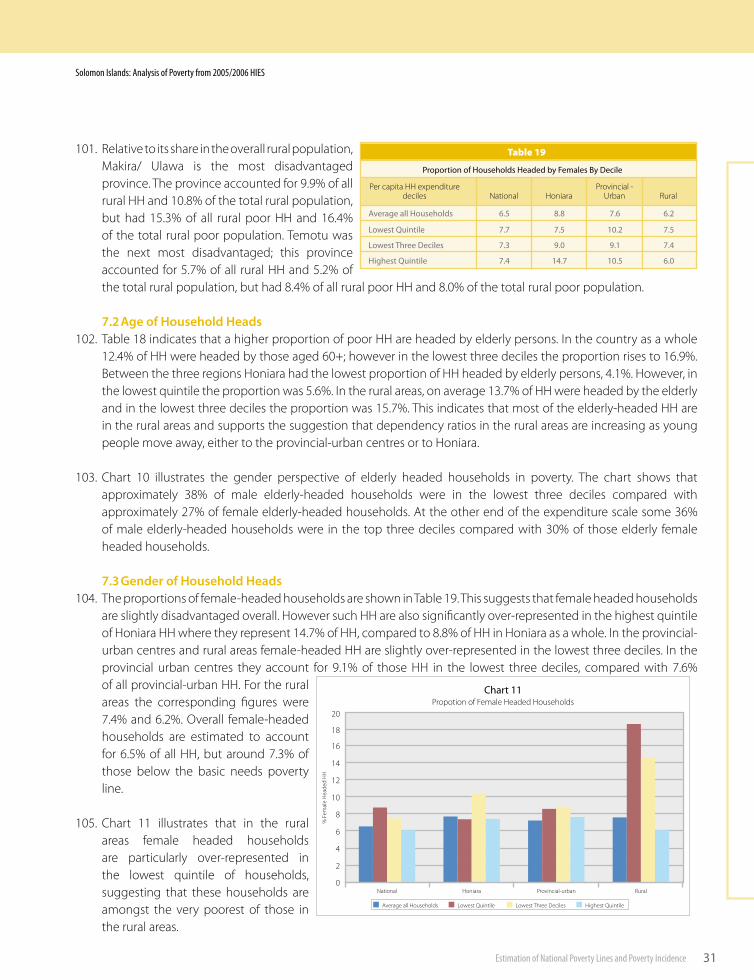
��
Solomon Islands: Analysis of Poverty from 2005/2006 HIES
Estimation of National Poverty Lines and Poverty Incidence
101. Relative to its share in the overall rural population, Makira/ Ulawa is the most disadvantaged province. The province accounted for 9.9% of all rural HH and 10.8% of the total rural population, but had 15.3% of all rural poor HH and 16.4% of the total rural poor population. Temotu was the next most disadvantaged; this province accounted for 5.7% of all rural HH and 5.2% of the total rural population, but had 8.4% of all rural poor HH and 8.0% of the total rural poor population.
7.2 Age of Household Heads102. Table 18 indicates that a higher proportion of poor HH are headed by elderly persons. In the country as a whole
12.4% of HH were headed by those aged 60+; however in the lowest three deciles the proportion rises to 16.9%. Between the three regions Honiara had the lowest proportion of HH headed by elderly persons, 4.1%. However, in the lowest quintile the proportion was 5.6%. In the rural areas, on average 13.7% of HH were headed by the elderly and in the lowest three deciles the proportion was 15.7%. This indicates that most of the elderly-headed HH are in the rural areas and supports the suggestion that dependency ratios in the rural areas are increasing as young people move away, either to the provincial-urban centres or to Honiara.
103. Chart 10 illustrates the gender perspective of elderly headed households in poverty. The chart shows that approximately 38% of male elderly-headed households were in the lowest three deciles compared with approximately 27% of female elderly-headed households. At the other end of the expenditure scale some 36% of male elderly-headed households were in the top three deciles compared with 30% of those elderly female headed households.
7.3 Gender of Household Heads104. The proportions of female-headed households are shown in Table 19. This suggests that female headed households
are slightly disadvantaged overall. However such HH are also significantly over-represented in the highest quintile of Honiara HH where they represent 14.7% of HH, compared to 8.8% of HH in Honiara as a whole. In the provincial-urban centres and rural areas female-headed HH are slightly over-represented in the lowest three deciles. In the provincial urban centres they account for 9.1% of those HH in the lowest three deciles, compared with 7.6% of all provincial-urban HH. For the rural areas the corresponding figures were 7.4% and 6.2%. Overall female-headed households are estimated to account for 6.5% of all HH, but around 7.3% of those below the basic needs poverty line.
105. Chart 11 illustrates that in the rural areas female headed households are particularly over-represented in the lowest quintile of households, suggesting that these households are amongst the very poorest of those in the rural areas.
Proport�on of Households Headed by Females By Dec�le
Per capita HH expenditure deciles National RuralHoniara
Provincial -Urban
Average all Households �.�
Lowest Qu�nt�le 7.7
Lowest Three Dec�les 7.�
H�ghest Qu�nt�le 7.�
8.8
7.�
9.0
��.7
7.�
�0.�
9.�
�0.�
�.�
7.�
7.�
�.0
Table 19
0
2
4
6
8
10
12
14
16
National
% F
emal
e H
eade
d H
H
Chart ��Propotion of Female Headed Households
18
20
Honiara Provincial-urban Rural
Average all Households Lowest Quintile Lowest Three Deciles Highest Quintile
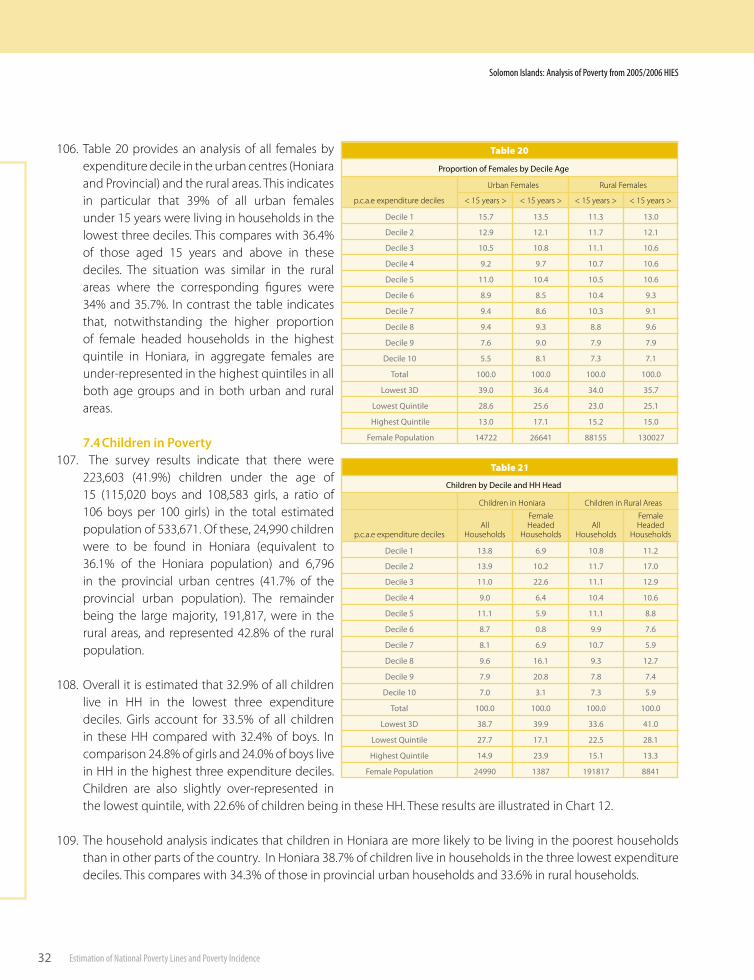
��
Solomon Islands: Analysis of Poverty from 2005/2006 HIES
Estimation of National Poverty Lines and Poverty Incidence
106. Table 20 provides an analysis of all females by expenditure decile in the urban centres (Honiara and Provincial) and the rural areas. This indicates in particular that 39% of all urban females under 15 years were living in households in the lowest three deciles. This compares with 36.4% of those aged 15 years and above in these deciles. The situation was similar in the rural areas where the corresponding figures were 34% and 35.7%. In contrast the table indicates that, notwithstanding the higher proportion of female headed households in the highest quintile in Honiara, in aggregate females are under-represented in the highest quintiles in all both age groups and in both urban and rural areas.
7.4 Children in Poverty107. The survey results indicate that there were
223,603 (41.9%) children under the age of 15 (115,020 boys and 108,583 girls, a ratio of 106 boys per 100 girls) in the total estimated population of 533,671. Of these, 24,990 children were to be found in Honiara (equivalent to 36.1% of the Honiara population) and 6,796 in the provincial urban centres (41.7% of the provincial urban population). The remainder being the large majority, 191,817, were in the rural areas, and represented 42.8% of the rural population.
108. Overall it is estimated that 32.9% of all children live in HH in the lowest three expenditure deciles. Girls account for 33.5% of all children in these HH compared with 32.4% of boys. In comparison 24.8% of girls and 24.0% of boys live in HH in the highest three expenditure deciles. Children are also slightly over-represented in the lowest quintile, with 22.6% of children being in these HH. These results are illustrated in Chart 12.
109. The household analysis indicates that children in Honiara are more likely to be living in the poorest households than in other parts of the country. In Honiara 38.7% of children live in households in the three lowest expenditure deciles. This compares with 34.3% of those in provincial urban households and 33.6% in rural households.
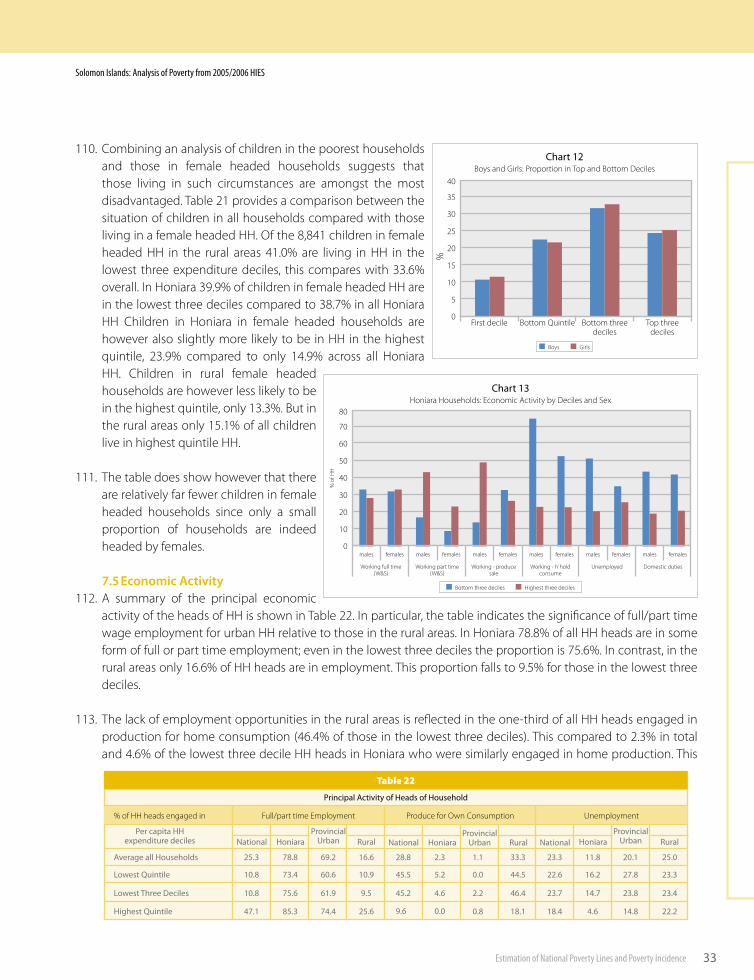
��
Solomon Islands: Analysis of Poverty from 2005/2006 HIES
Estimation of National Poverty Lines and Poverty Incidence
110. Combining an analysis of children in the poorest households and those in female headed households suggests that those living in such circumstances are amongst the most disadvantaged. Table 21 provides a comparison between the situation of children in all households compared with those living in a female headed HH. Of the 8,841 children in female headed HH in the rural areas 41.0% are living in HH in the lowest three expenditure deciles, this compares with 33.6% overall. In Honiara 39.9% of children in female headed HH are in the lowest three deciles compared to 38.7% in all Honiara HH Children in Honiara in female headed households are however also slightly more likely to be in HH in the highest quintile, 23.9% compared to only 14.9% across all Honiara HH. Children in rural female headed households are however less likely to be in the highest quintile, only 13.3%. But in the rural areas only 15.1% of all children live in highest quintile HH.
111. The table does show however that there are relatively far fewer children in female headed households since only a small proportion of households are indeed headed by females.
7.5 Economic Activity 112. A summary of the principal economic
activity of the heads of HH is shown in Table 22. In particular, the table indicates the significance of full/part time wage employment for urban HH relative to those in the rural areas. In Honiara 78.8% of all HH heads are in some form of full or part time employment; even in the lowest three deciles the proportion is 75.6%. In contrast, in the rural areas only 16.6% of HH heads are in employment. This proportion falls to 9.5% for those in the lowest three deciles.
113. The lack of employment opportunities in the rural areas is reflected in the one-third of all HH heads engaged in production for home consumption (46.4% of those in the lowest three deciles). This compared to 2.3% in total and 4.6% of the lowest three decile HH heads in Honiara who were similarly engaged in home production. This
0
10
20
30
40
50
60
70
Bottom three deciles Highest three deciles
Chart ��Honiara Households: Economic Activity by Deciles and Sex
males females males females males females males females males females males females
Working full time(W&S)
Working part time(W&S)
Working - producesale
Working - h’ holdconsume
Unemployed Domestic duties
80
% o
f HH
Table 22
Pr�nc�pal Act�v�ty of Heads of Household
Produce for Own Consumption Unemployment% of HH heads engaged in Full/part time Employment
�0.8
�0.8
�7.�
Average all Households ��.�
Per cap�ta HH expend�ture dec�les Nat�onal Hon�ara
Prov�nc�alUrban Rural
7�.�
7�.�
8�.�
78.8
�0.�
��.9
7�.�
�9.�
�0.9
9.�
��.�
��.�
Lowest Qu�nt�le
Lowest Three Dec�les
H�ghest Qu�nt�le
��.�
��.�
9.�
�8.8
Nat�onal Hon�araProv�nc�al
Urban Rural
�.�
�.�
0.0
�.�
0.0
�.�
0.8
�.�
��.�
��.�
�8.�
��.�
��.�
��.7
�8.�
��.�
Nat�onal Hon�araProv�nc�al
Urban Rural
��.�
��.7
�.�
��.8
�7.8
��.8
��.8
�0.�
��.�
��.�
��.�
��.0
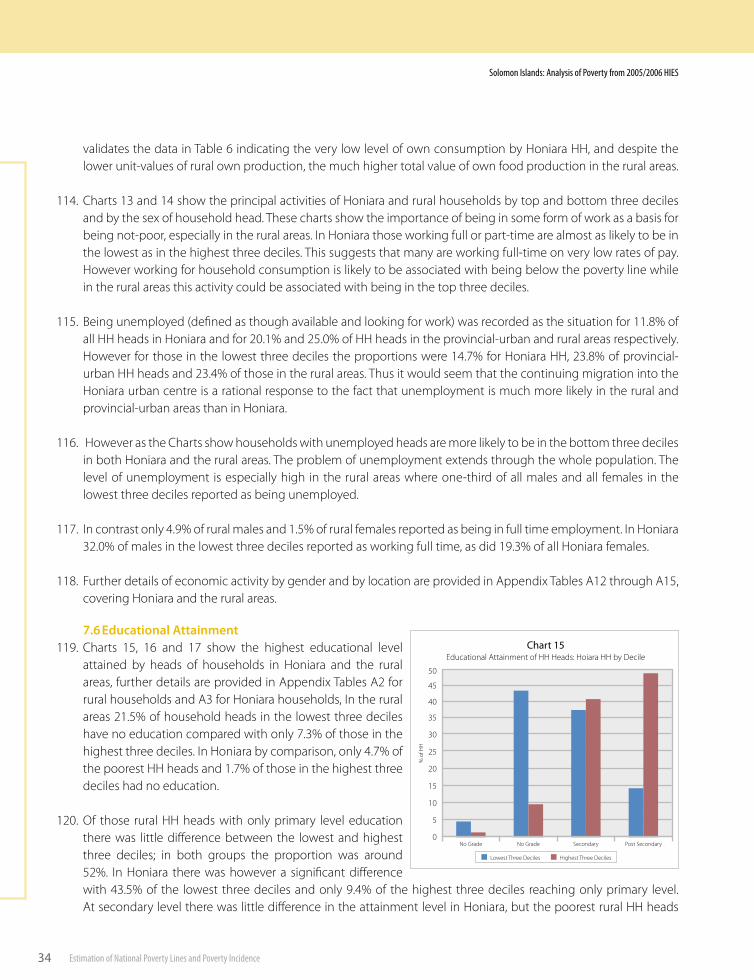
��
Solomon Islands: Analysis of Poverty from 2005/2006 HIES
Estimation of National Poverty Lines and Poverty Incidence
validates the data in Table 6 indicating the very low level of own consumption by Honiara HH, and despite the lower unit-values of rural own production, the much higher total value of own food production in the rural areas.
114. Charts 13 and 14 show the principal activities of Honiara and rural households by top and bottom three deciles and by the sex of household head. These charts show the importance of being in some form of work as a basis for being not-poor, especially in the rural areas. In Honiara those working full or part-time are almost as likely to be in the lowest as in the highest three deciles. This suggests that many are working full-time on very low rates of pay. However working for household consumption is likely to be associated with being below the poverty line while in the rural areas this activity could be associated with being in the top three deciles.
115. Being unemployed (defined as though available and looking for work) was recorded as the situation for 11.8% of all HH heads in Honiara and for 20.1% and 25.0% of HH heads in the provincial-urban and rural areas respectively. However for those in the lowest three deciles the proportions were 14.7% for Honiara HH, 23.8% of provincial-urban HH heads and 23.4% of those in the rural areas. Thus it would seem that the continuing migration into the Honiara urban centre is a rational response to the fact that unemployment is much more likely in the rural and provincial-urban areas than in Honiara.
116. However as the Charts show households with unemployed heads are more likely to be in the bottom three deciles in both Honiara and the rural areas. The problem of unemployment extends through the whole population. The level of unemployment is especially high in the rural areas where one-third of all males and all females in the lowest three deciles reported as being unemployed.
117. In contrast only 4.9% of rural males and 1.5% of rural females reported as being in full time employment. In Honiara 32.0% of males in the lowest three deciles reported as working full time, as did 19.3% of all Honiara females.
118. Further details of economic activity by gender and by location are provided in Appendix Tables A12 through A15, covering Honiara and the rural areas.
7.6 Educational Attainment119. Charts 15, 16 and 17 show the highest educational level
attained by heads of households in Honiara and the rural areas, further details are provided in Appendix Tables A2 for rural households and A3 for Honiara households, In the rural areas 21.5% of household heads in the lowest three deciles have no education compared with only 7.3% of those in the highest three deciles. In Honiara by comparison, only 4.7% of the poorest HH heads and 1.7% of those in the highest three deciles had no education.
120. Of those rural HH heads with only primary level education there was little difference between the lowest and highest three deciles; in both groups the proportion was around 52%. In Honiara there was however a significant difference with 43.5% of the lowest three deciles and only 9.4% of the highest three deciles reaching only primary level. At secondary level there was little difference in the attainment level in Honiara, but the poorest rural HH heads
Chart ��Educational Attainment of HH Heads: Hoiara HH by Decile
0
5
10
15
20
25
30
35
40
No Grade
45
50
% o
f HH
No Grade Secondary Post Secondary
Lowest Three Deciles Highest Three Deciles

��
Solomon Islands: Analysis of Poverty from 2005/2006 HIES
Estimation of National Poverty Lines and Poverty Incidence
were seven percentage points less likely to have achieved completion of secondary education than those in the highest three deciles, 20.8% compared with 27.8%. In the poorest three deciles almost three-quarters of HH heads had no attainment beyond primary level.
121. Not surprisingly, the highest proportion with post-secondary education are found in the highest three deciles of urban HH heads. 48.5% of this group had achieved some level of post primary education, compared with only 14.6% of those in the poorest three deciles. This suggests that the poor are only one-third as likely to have post primary education as the better-off. Even against the overall average of Honiara HH, the poorest are only half as likely to have progressed beyond primary level.
122. A similar situation exists in the rural areas where the poorest HH are only half as likely to have gone beyond primary level compared with the average for all HH.
123. The rural areas are clearly disadvantaged in terms of attainment at post-secondary levels. Even amongst the highest three deciles the proportion of HH heads attaining this level was only 11.6%, and these were almost certainly government employees in rural schools or medical facilities. For the lowest three deciles 3.9% of HH heads had, however, achieved some level of post-secondary education.
124. Since this is the first survey to have linked educational attainment (and other household characteristics) with expenditure it is not possible to say whether or by how much the “tensions” of the past few years have impacted either educational levels or the state of poverty. However, given the breakdown in much of the institutional structure during the “tensions”, it would be surprising if there were not some significant adverse impacts being felt through the economy.
7.7 Energy Access and Use125. Chart 18 shows the nature of energy
used for cooking by Honiara HH. It is interesting that although both gas and electricity are available in Honiara a high proportion of households across all expenditure deciles (57.3% of the lowest three decile HH and 32.7% of those in the highest three deciles) use open fires for cooking. In the lowest three deciles a further 15.2% used saw-dust stoves
Chart ��Educational Attainment of HH Head: Rural HH: Lowest Three Deciles
No Grade, 21.5
Secondary20.8
PostSecondary, 3.9
Primary, 52.0
NR, 1.9
No Grade Primary Secondary Post Secondary NR
Chart �7Educational Attainment of HH Head: Rural HH:
Highest Three Deciles
No Grade, 7.3
Secondary27.8
PostSecondary, 11.6
Primary, 51.8
NR, 1.9
No Grade Primary Secondary Post Secondary NR
0
10
20
30
40
50
60
Electric plate
Lowest Three Deciles Highest Three Deciles
% o
f HH
Chart �8Type of energy usage for cooking: Honiara HH
Electric stove Gas Burner Gas Oven Kerosene Woodstove Sawdust stove Open Fire Other
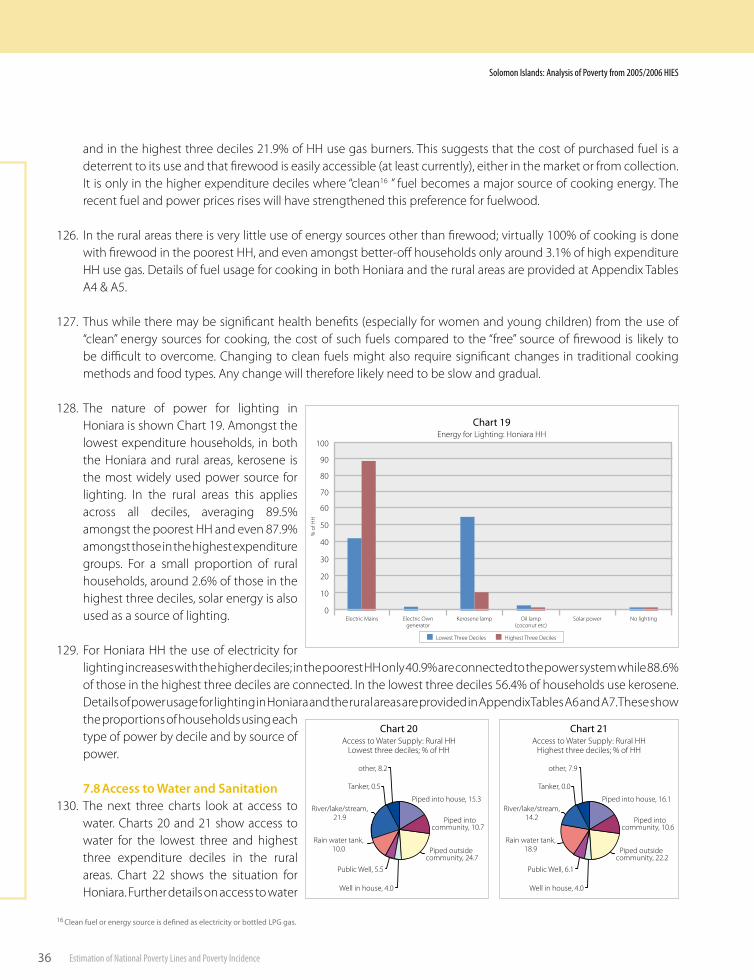
��
Solomon Islands: Analysis of Poverty from 2005/2006 HIES
Estimation of National Poverty Lines and Poverty Incidence
and in the highest three deciles 21.9% of HH use gas burners. This suggests that the cost of purchased fuel is a deterrent to its use and that firewood is easily accessible (at least currently), either in the market or from collection. It is only in the higher expenditure deciles where “clean16 ” fuel becomes a major source of cooking energy. The recent fuel and power prices rises will have strengthened this preference for fuelwood.
126. In the rural areas there is very little use of energy sources other than firewood; virtually 100% of cooking is done with firewood in the poorest HH, and even amongst better-off households only around 3.1% of high expenditure HH use gas. Details of fuel usage for cooking in both Honiara and the rural areas are provided at Appendix Tables A4 & A5.
127. Thus while there may be significant health benefits (especially for women and young children) from the use of “clean” energy sources for cooking, the cost of such fuels compared to the “free” source of firewood is likely to be difficult to overcome. Changing to clean fuels might also require significant changes in traditional cooking methods and food types. Any change will therefore likely need to be slow and gradual.
128. The nature of power for lighting in Honiara is shown Chart 19. Amongst the lowest expenditure households, in both the Honiara and rural areas, kerosene is the most widely used power source for lighting. In the rural areas this applies across all deciles, averaging 89.5% amongst the poorest HH and even 87.9% amongst those in the highest expenditure groups. For a small proportion of rural households, around 2.6% of those in the highest three deciles, solar energy is also used as a source of lighting.
129. For Honiara HH the use of electricity for lighting increases with the higher deciles; in the poorest HH only 40.9% are connected to the power system while 88.6% of those in the highest three deciles are connected. In the lowest three deciles 56.4% of households use kerosene. Details of power usage for lighting in Honiara and the rural areas are provided in Appendix Tables A6 and A7. These show the proportions of households using each type of power by decile and by source of power.
7.8 Access to Water and Sanitation130. The next three charts look at access to
water. Charts 20 and 21 show access to water for the lowest three and highest three expenditure deciles in the rural areas. Chart 22 shows the situation for Honiara. Further details on access to water
Lowest Three Deciles Highest Three Deciles
Chart �9Energy for Lighting: Honiara HH
0
10
20
30
40
50
60
Electric Mains
% o
f HH
70
80
90
100
Electric Owngenerator
Kerosene lamp Oil lamp (coconut etc)
Solar power No lighting
Chart ��Access to Water Supply: Rural HH
Highest three deciles; % of HH
community, 22.2Piped outside
community, 10.6Piped into
Piped into house, 16.1
other, 7.9
Tanker, 0.0
River/lake/stream,14.2
Rain water tank,18.9
Public Well, 6.1
Well in house, 4.0
Chart �0Access to Water Supply: Rural HH
Lowest three deciles; % of HH
community, 24.7Piped outside
community, 10.7Piped into
Piped into house, 15.3
other, 8.2
Tanker, 0.5
River/lake/stream,21.9
Rain water tank,10.0
Public Well, 5.5
Well in house, 4.0
�� Clean fuel or energy source �s defined as electr�c�ty or bottled LPG gas.
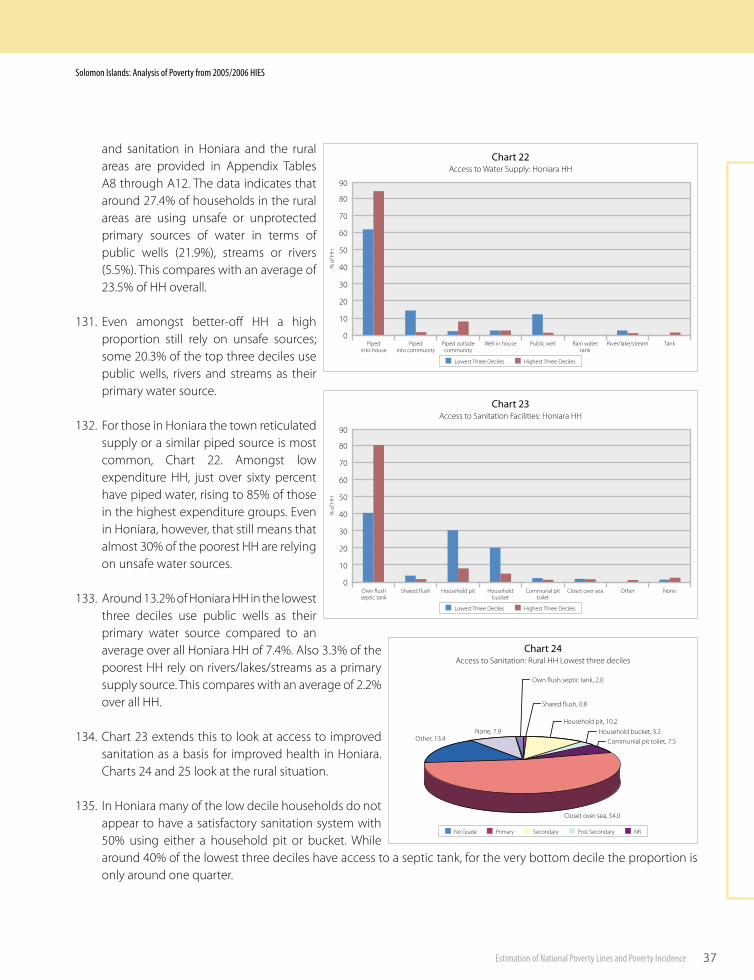
�7
Solomon Islands: Analysis of Poverty from 2005/2006 HIES
Estimation of National Poverty Lines and Poverty Incidence
and sanitation in Honiara and the rural areas are provided in Appendix Tables A8 through A12. The data indicates that around 27.4% of households in the rural areas are using unsafe or unprotected primary sources of water in terms of public wells (21.9%), streams or rivers (5.5%). This compares with an average of 23.5% of HH overall.
131. Even amongst better-off HH a high proportion still rely on unsafe sources; some 20.3% of the top three deciles use public wells, rivers and streams as their primary water source.
132. For those in Honiara the town reticulated supply or a similar piped source is most common, Chart 22. Amongst low expenditure HH, just over sixty percent have piped water, rising to 85% of those in the highest expenditure groups. Even in Honiara, however, that still means that almost 30% of the poorest HH are relying on unsafe water sources.
133. Around 13.2% of Honiara HH in the lowest three deciles use public wells as their primary water source compared to an average over all Honiara HH of 7.4%. Also 3.3% of the poorest HH rely on rivers/lakes/streams as a primary supply source. This compares with an average of 2.2% over all HH.
134. Chart 23 extends this to look at access to improved sanitation as a basis for improved health in Honiara. Charts 24 and 25 look at the rural situation.
135. In Honiara many of the low decile households do not appear to have a satisfactory sanitation system with 50% using either a household pit or bucket. While around 40% of the lowest three deciles have access to a septic tank, for the very bottom decile the proportion is only around one quarter.
Chart ��Access to Sanitation: Rural HH Lowest three deciles
No Grade Primary Secondary Post Secondary NR
Communial pit toilet, 7.5Other, 13.4None, 7.9
Closet over sea, 54.0
Own flush septic tank, 2.0
Household bucket, 3.2Household pit, 10.2
Shared flush, 0.8
0
10
20
30
40
50
60
70
80
Piped into house
% o
f HH
Chart ��Access to Water Supply: Honiara HH
90
Lowest Three Deciles Highest Three Deciles
Piped into community
Piped outsidecommunity
Well in house Public well Rain water tank
River/lake/stream Tank
0
10
20
30
40
50
60
70
80
Own flush septic tank
Chart ��Access to Sanitation Facilities: Honiara HH
90
Lowest Three Deciles Highest Three Deciles
% o
f HH
Shared flush Household pit Household bucket
Communal pit toilet
Closet over sea Other None
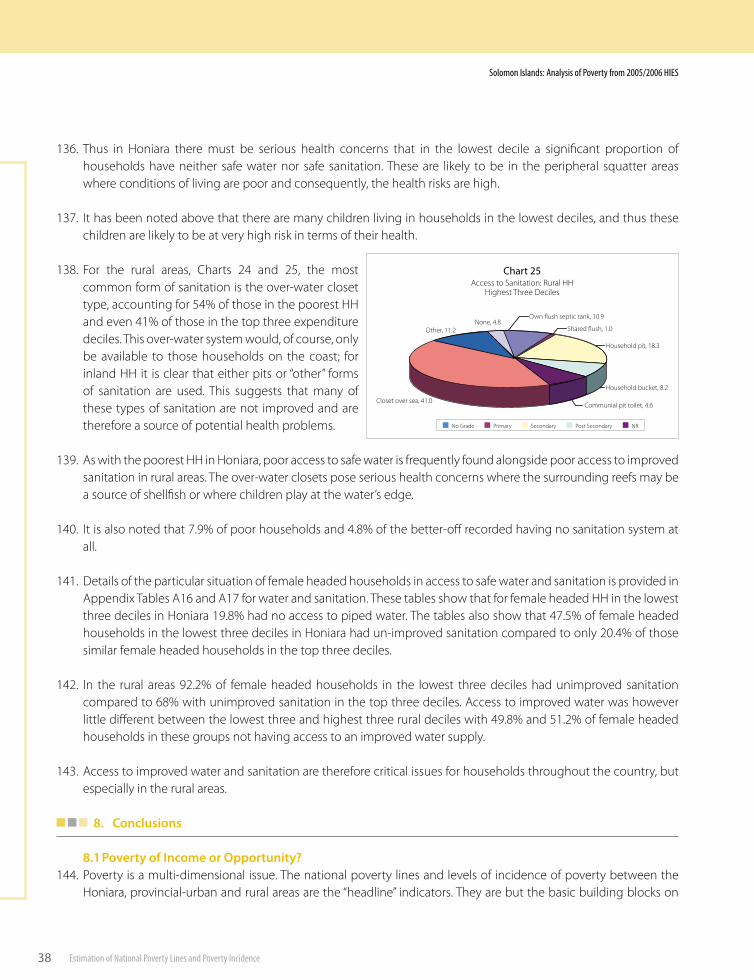
�8
Solomon Islands: Analysis of Poverty from 2005/2006 HIES
Estimation of National Poverty Lines and Poverty Incidence
136. Thus in Honiara there must be serious health concerns that in the lowest decile a significant proportion of households have neither safe water nor safe sanitation. These are likely to be in the peripheral squatter areas where conditions of living are poor and consequently, the health risks are high.
137. It has been noted above that there are many children living in households in the lowest deciles, and thus these children are likely to be at very high risk in terms of their health.
138. For the rural areas, Charts 24 and 25, the most common form of sanitation is the over-water closet type, accounting for 54% of those in the poorest HH and even 41% of those in the top three expenditure deciles. This over-water system would, of course, only be available to those households on the coast; for inland HH it is clear that either pits or “other” forms of sanitation are used. This suggests that many of these types of sanitation are not improved and are therefore a source of potential health problems.
139. As with the poorest HH in Honiara, poor access to safe water is frequently found alongside poor access to improved sanitation in rural areas. The over-water closets pose serious health concerns where the surrounding reefs may be a source of shellfish or where children play at the water’s edge.
140. It is also noted that 7.9% of poor households and 4.8% of the better-off recorded having no sanitation system at all.
141. Details of the particular situation of female headed households in access to safe water and sanitation is provided in Appendix Tables A16 and A17 for water and sanitation. These tables show that for female headed HH in the lowest three deciles in Honiara 19.8% had no access to piped water. The tables also show that 47.5% of female headed households in the lowest three deciles in Honiara had un-improved sanitation compared to only 20.4% of those similar female headed households in the top three deciles.
142. In the rural areas 92.2% of female headed households in the lowest three deciles had unimproved sanitation compared to 68% with unimproved sanitation in the top three deciles. Access to improved water was however little different between the lowest three and highest three rural deciles with 49.8% and 51.2% of female headed households in these groups not having access to an improved water supply.
143. Access to improved water and sanitation are therefore critical issues for households throughout the country, but especially in the rural areas.
8. Conclusions
8.1 Poverty of Income or Opportunity?144. Poverty is a multi-dimensional issue. The national poverty lines and levels of incidence of poverty between the
Honiara, provincial-urban and rural areas are the “headline” indicators. They are but the basic building blocks on
Chart ��Access to Sanitation: Rural HH
Highest Three Deciles
Household bucket, 8.2
No Grade Primary Secondary Post Secondary NR
Communial pit toilet, 4.6
Household pit, 18.3
Shared flush, 1.0
Own flush septic tank, 10.9None, 4.8
Other, 11.2
Closet over sea, 41.0
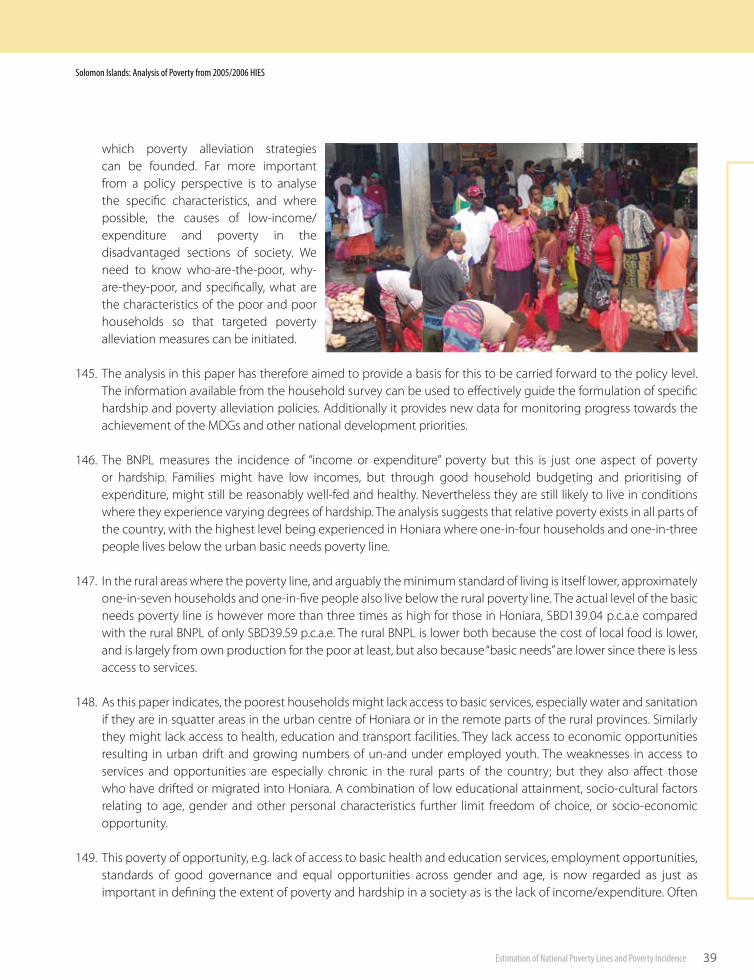
�9
Solomon Islands: Analysis of Poverty from 2005/2006 HIES
Estimation of National Poverty Lines and Poverty Incidence
which poverty alleviation strategies can be founded. Far more important from a policy perspective is to analyse the specific characteristics, and where possible, the causes of low-income/expenditure and poverty in the disadvantaged sections of society. We need to know who-are-the-poor, why-are-they-poor, and specifically, what are the characteristics of the poor and poor households so that targeted poverty alleviation measures can be initiated.
145. The analysis in this paper has therefore aimed to provide a basis for this to be carried forward to the policy level. The information available from the household survey can be used to effectively guide the formulation of specific hardship and poverty alleviation policies. Additionally it provides new data for monitoring progress towards the achievement of the MDGs and other national development priorities.
146. The BNPL measures the incidence of “income or expenditure” poverty but this is just one aspect of poverty or hardship. Families might have low incomes, but through good household budgeting and prioritising of expenditure, might still be reasonably well-fed and healthy. Nevertheless they are still likely to live in conditions where they experience varying degrees of hardship. The analysis suggests that relative poverty exists in all parts of the country, with the highest level being experienced in Honiara where one-in-four households and one-in-three people lives below the urban basic needs poverty line.
147. In the rural areas where the poverty line, and arguably the minimum standard of living is itself lower, approximately one-in-seven households and one-in-five people also live below the rural poverty line. The actual level of the basic needs poverty line is however more than three times as high for those in Honiara, SBD139.04 p.c.a.e compared with the rural BNPL of only SBD39.59 p.c.a.e. The rural BNPL is lower both because the cost of local food is lower, and is largely from own production for the poor at least, but also because “basic needs” are lower since there is less access to services.
148. As this paper indicates, the poorest households might lack access to basic services, especially water and sanitation if they are in squatter areas in the urban centre of Honiara or in the remote parts of the rural provinces. Similarly they might lack access to health, education and transport facilities. They lack access to economic opportunities resulting in urban drift and growing numbers of un-and under employed youth. The weaknesses in access to services and opportunities are especially chronic in the rural parts of the country; but they also affect those who have drifted or migrated into Honiara. A combination of low educational attainment, socio-cultural factors relating to age, gender and other personal characteristics further limit freedom of choice, or socio-economic opportunity.
149. This poverty of opportunity, e.g. lack of access to basic health and education services, employment opportunities, standards of good governance and equal opportunities across gender and age, is now regarded as just as important in defining the extent of poverty and hardship in a society as is the lack of income/expenditure. Often
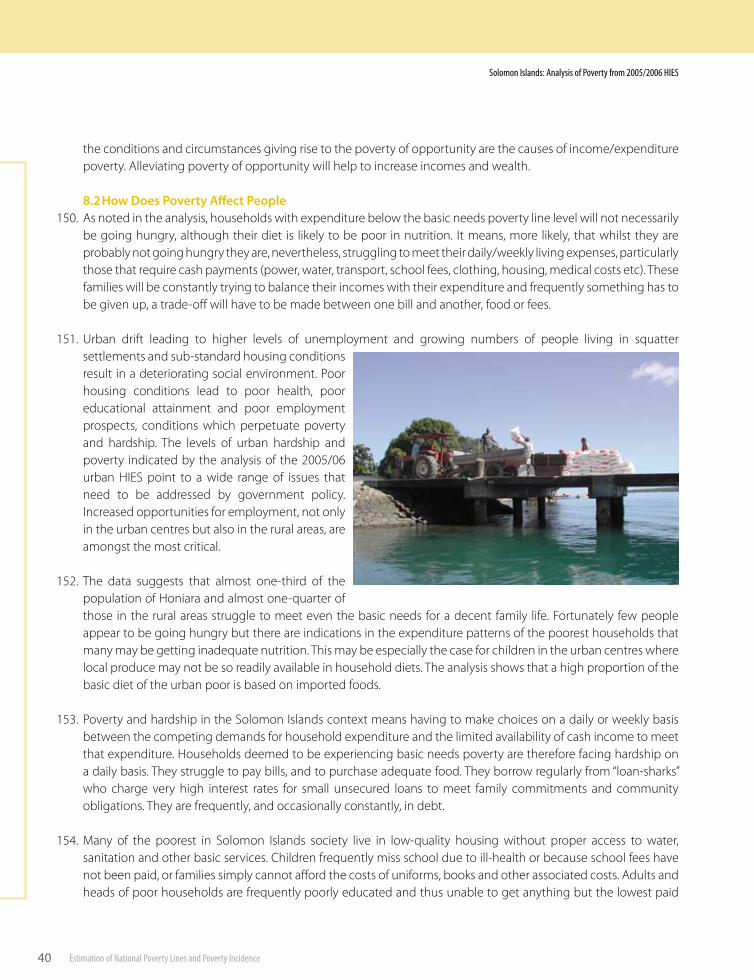
�0
Solomon Islands: Analysis of Poverty from 2005/2006 HIES
Estimation of National Poverty Lines and Poverty Incidence
the conditions and circumstances giving rise to the poverty of opportunity are the causes of income/expenditure poverty. Alleviating poverty of opportunity will help to increase incomes and wealth.
8.2 How Does Poverty Affect People150. As noted in the analysis, households with expenditure below the basic needs poverty line level will not necessarily
be going hungry, although their diet is likely to be poor in nutrition. It means, more likely, that whilst they are probably not going hungry they are, nevertheless, struggling to meet their daily/weekly living expenses, particularly those that require cash payments (power, water, transport, school fees, clothing, housing, medical costs etc). These families will be constantly trying to balance their incomes with their expenditure and frequently something has to be given up, a trade-off will have to be made between one bill and another, food or fees.
151. Urban drift leading to higher levels of unemployment and growing numbers of people living in squatter settlements and sub-standard housing conditions result in a deteriorating social environment. Poor housing conditions lead to poor health, poor educational attainment and poor employment prospects, conditions which perpetuate poverty and hardship. The levels of urban hardship and poverty indicated by the analysis of the 2005/06 urban HIES point to a wide range of issues that need to be addressed by government policy. Increased opportunities for employment, not only in the urban centres but also in the rural areas, are amongst the most critical.
152. The data suggests that almost one-third of the population of Honiara and almost one-quarter of those in the rural areas struggle to meet even the basic needs for a decent family life. Fortunately few people appear to be going hungry but there are indications in the expenditure patterns of the poorest households that many may be getting inadequate nutrition. This may be especially the case for children in the urban centres where local produce may not be so readily available in household diets. The analysis shows that a high proportion of the basic diet of the urban poor is based on imported foods.
153. Poverty and hardship in the Solomon Islands context means having to make choices on a daily or weekly basis between the competing demands for household expenditure and the limited availability of cash income to meet that expenditure. Households deemed to be experiencing basic needs poverty are therefore facing hardship on a daily basis. They struggle to pay bills, and to purchase adequate food. They borrow regularly from “loan-sharks” who charge very high interest rates for small unsecured loans to meet family commitments and community obligations. They are frequently, and occasionally constantly, in debt.
154. Many of the poorest in Solomon Islands society live in low-quality housing without proper access to water, sanitation and other basic services. Children frequently miss school due to ill-health or because school fees have not been paid, or families simply cannot afford the costs of uniforms, books and other associated costs. Adults and heads of poor households are frequently poorly educated and thus unable to get anything but the lowest paid
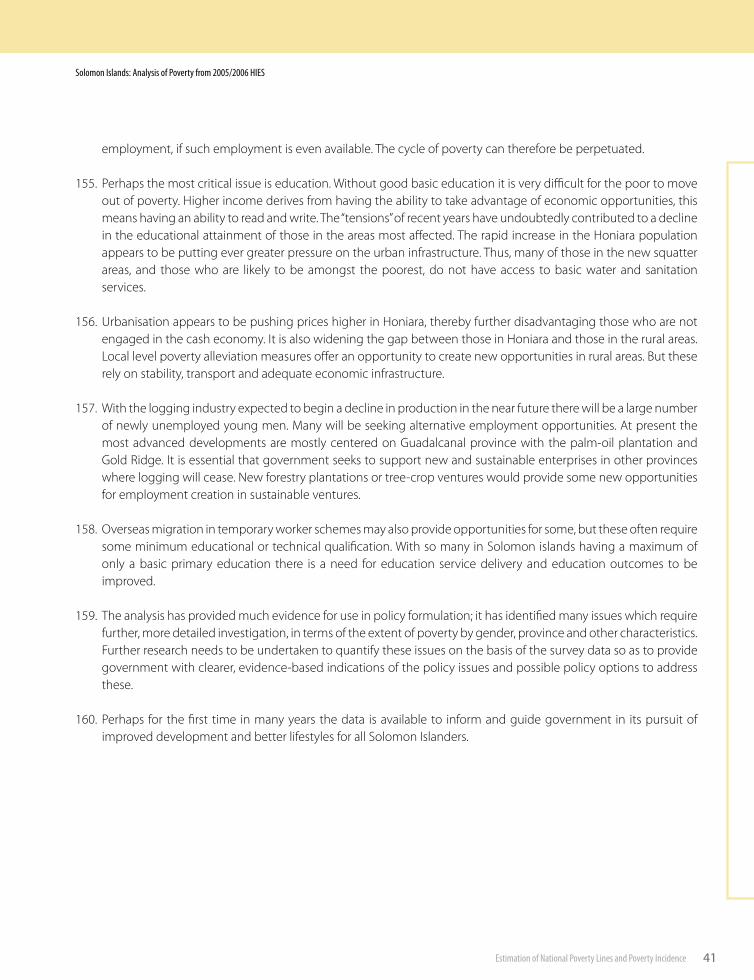
��
Solomon Islands: Analysis of Poverty from 2005/2006 HIES
Estimation of National Poverty Lines and Poverty Incidence
employment, if such employment is even available. The cycle of poverty can therefore be perpetuated.
155. Perhaps the most critical issue is education. Without good basic education it is very difficult for the poor to move out of poverty. Higher income derives from having the ability to take advantage of economic opportunities, this means having an ability to read and write. The “tensions” of recent years have undoubtedly contributed to a decline in the educational attainment of those in the areas most affected. The rapid increase in the Honiara population appears to be putting ever greater pressure on the urban infrastructure. Thus, many of those in the new squatter areas, and those who are likely to be amongst the poorest, do not have access to basic water and sanitation services.
156. Urbanisation appears to be pushing prices higher in Honiara, thereby further disadvantaging those who are not engaged in the cash economy. It is also widening the gap between those in Honiara and those in the rural areas. Local level poverty alleviation measures offer an opportunity to create new opportunities in rural areas. But these rely on stability, transport and adequate economic infrastructure.
157. With the logging industry expected to begin a decline in production in the near future there will be a large number of newly unemployed young men. Many will be seeking alternative employment opportunities. At present the most advanced developments are mostly centered on Guadalcanal province with the palm-oil plantation and Gold Ridge. It is essential that government seeks to support new and sustainable enterprises in other provinces where logging will cease. New forestry plantations or tree-crop ventures would provide some new opportunities for employment creation in sustainable ventures.
158. Overseas migration in temporary worker schemes may also provide opportunities for some, but these often require some minimum educational or technical qualification. With so many in Solomon islands having a maximum of only a basic primary education there is a need for education service delivery and education outcomes to be improved.
159. The analysis has provided much evidence for use in policy formulation; it has identified many issues which require further, more detailed investigation, in terms of the extent of poverty by gender, province and other characteristics. Further research needs to be undertaken to quantify these issues on the basis of the survey data so as to provide government with clearer, evidence-based indications of the policy issues and possible policy options to address these.
160. Perhaps for the first time in many years the data is available to inform and guide government in its pursuit of improved development and better lifestyles for all Solomon Islanders.
��
Solomon Islands: Analysis of Poverty from 2005/2006 HIES
Estimation of National Poverty Lines and Poverty Incidence
ADB, 2003a, Fiji Participatory Assessment of Hardship and Poverty, ADB RETA 6047: Consultation Workshops on Poverty Reduction Strategies in
Selected PDMCs, Zuniga L., June
____, 2003b, Samoa Assessment of Hardship and Poverty, RETA 6002, Manila
____, 2003c, Tonga Assessment of Hardship and Poverty, RETA 6047, Manila
____, 2003d, Issues in Setting Absolute Poverty Lines, Poverty and Social Development Papers No3/June 2003, Nanak Kakwani, Regional and
Sustainable Development Department, Manila
____, 2004a, Hardship and Poverty in the Pacific: Strengthening Poverty Analysis and Strategies, Pacific Department, Manila
____, 2004b, Poverty in Asia: Measurement, Estimates and Prospects, Economics and Research Department, Manila
____, 2004c, Federated States of Micronesia Assessment of Hardship and Poverty, RETA 6047, Manila
____, 2004d, Practices of Poverty Measurement and Poverty Profile in Nepal, ERD Working Paper Series No 57, Davendra Chhetry, Economics and
Research Department, September 2004, Manila
____, 2004e, Monetary Poverty Estimates in Sri Lanka: Selected Issues, ERD Working Paper Series No 58, Neranjana Gunetilleke and Dinushka
Senanyake, Economics and Research Department, October 2004, Manila
Deaton Angus, 2003, How to monitor poverty for the Millennium Development Goals, Research Program in Development Studies, Princeton
University
____________, 2004, Measuring poverty in a growing world (or measuring growth in a poor world), Research Program in Development Studies,
Woodrow Wilson School, Princeton University
Deaton A. and Zaidi S., 2002, Guidelines for Constructing Consumption Aggregates for Welfare Analysis, Living Standards Measurement Study
Working Paper No. 135, World Bank, May
FAO, Pacific Islands Food Composition Tables, Rome, 2004
International Labour Organisation, 2003, Report II; Household Income and Expenditure Statistics, Seventeenth International Conference of Labour
Statisticians, Geneva November - December 2003
Lanjouw J.O. and Lanjouw P., 1997, Poverty Comparisons with Noncompatible Data: Theory and Illustrations, Policy Research Working Paper 1709,
World Bank, January
Pradhan, Suryahadi, Sumarto and Pritchett, 2000, Measurements of Poverty in Indonesia: 1996, 1999 and Beyond, Social Monitoring and Early
Response Unit, June
Ravallion, Martin, 1994, A better way to set poverty lines, Outreach Number 15, Policy Views from the World bank Research Complex, March 1994
______________, 1998, Poverty Lines in Theory and Practice, Living Standards Measurement Study Working Paper No. 133, World Bank
Rio Group, Expert Group on Poverty Statistics, Compendium of Best Practices in Poverty Measurement, Rio de Janeiro, September 2006
Shaohua Chen and Martin Ravallion, 2004, How have the world’s poorest fared since the early 1980s?, Development Research Group, World Bank
Solomon Islands Government 2006: Household Income and Expenditure Survey 2005/06 National Report, Solomon Islands Statistics Office, Honiara,
September 2006
Stavenuiter, S. 1983. Income Distribution in Fiji; An Analysis of its Various Dimensions, With Implications for Future Employment, basic Needs and
Income Policies. WEP Research Working Paper, ILO, Geneva
UNDP 1997, and Government of Fiji, Fiji Poverty Report, UNDP
_____ 2000, Lanjouw, Jean Olson, Demystifying Poverty Lines, Poverty Reduction Series, UNDP, New York
_____ 2006, Abbott, David F, Preliminary Estimates of the Fiji Poverty Lines from 2002/03 HIES, UNDP Pacific Centre.
World Bank, 1994, Outreach #15, Policy Views from the World Bank Research Complex, March 1994
__________, 2003, Timor-Leste Poverty in a New National: Analysis for Action, Volume II: Technical Report, May
World Development Report 2000/01, 2001, World Bank
References
��
Solomon Islands: Analysis of Poverty from 2005/2006 HIES
Appendix tables

��
Solomon Islands: Analysis of Poverty from 2005/2006 HIES
Food item unit
food energy values
unitcalorie
value (kcal)number of
unitsnumber of units
number of units
calorie value in
diet
calorie value in
diet
Male Menu Female Menu Average adult
number of units
calorie value in
dietCPI Cost of
Menu
Solomon Islands Menu URBANSource: SPC Nutrition Programme and SI Ministry of Health
Breakfast
Sl�ces wh�te bread gram �00 ��� gram �00 �8�.0 �80 ���.� �90 ��9.8 �.7�
Butter/magar�ne gram �00 7�7 gram �0 7�.7 �0 7�.7 �0 7�.7 0.��
Jam/honey gram �00 ��� gram �0 ��.� �0 ��.� �0 ��.� 0.�7
Tea gram �00 0 ml ��0 0.0 ��0 0.0 �.� ��0 0.0 0.0�
M�lk gram �00 �� ml �0 ��.� �0 ��.� �.� �0 ��.� 0.�0
Sugar gram �00 �9� gram �0 �9.� �0 �9.� �0 �9.� 0.0�
Lunch
R�ce wh�te bo�led gram �00 ��� gram ��0 ���.8 ��0 �9�.� �00 ��9.0 �.��
T�nned tuna gram �00 �90 gram �0 ���.0 �0 ���.0 �0 ���.0 0.��
Bele leaves gram �00 �9 gram �00 �9.0 �00 �9.0 �00 �9.0 0.��
Coconut cream gram �00 ��� ml �0 �0�.� �0 �0�.� �0 �0�.� 0.0�
D�nner
Cassava/kumara(bo�led) gram �00 9� gram ��0 ��7.� �80 ���.8 ��� �9�.7 0.��
Fresh fish(baked/gr�lled) gram �00 ��0 gram ��0 �9�.0 ��0 �9�.0 ��0 �9�.0 �.8�
Coconut m�lk gram �00 �� ml �0 8.0 80 ��.8 �� �0.� 0.�9
Dr�nks
Tea gram �00 0 ml ��0 0.0 ��0 0.0 �.� ��0 0.0 0.0�
M�lk gram �00 �� ml �0 ��.� �0 ��.� �.� �0 ��.� 0.�0
Sugar gram �00 �9� gram �0 �9.� �0 �9.� �0 �9.� 0.0�
Coconut m�lk gram �00 �� nut ��� �0.0 ��� �0.0 ��� �0.0 �.��
Coconut flesh gram �00 8� gram �0 �0.� �0 �0.� �0 �0.� 0.70
Snacks
Sweet b�scu�t gram �00 ��� gram �� ���.8 �� ���.8 �� ���.8 0.��
Banana gram �00 �0� gram ��0 ���.� �00 �0�.0 �7� �80.� 0.��
Total calorie value 2197.5 1994.1 2095.8 9.11
Weekly cost 63.76
ANNEX 1
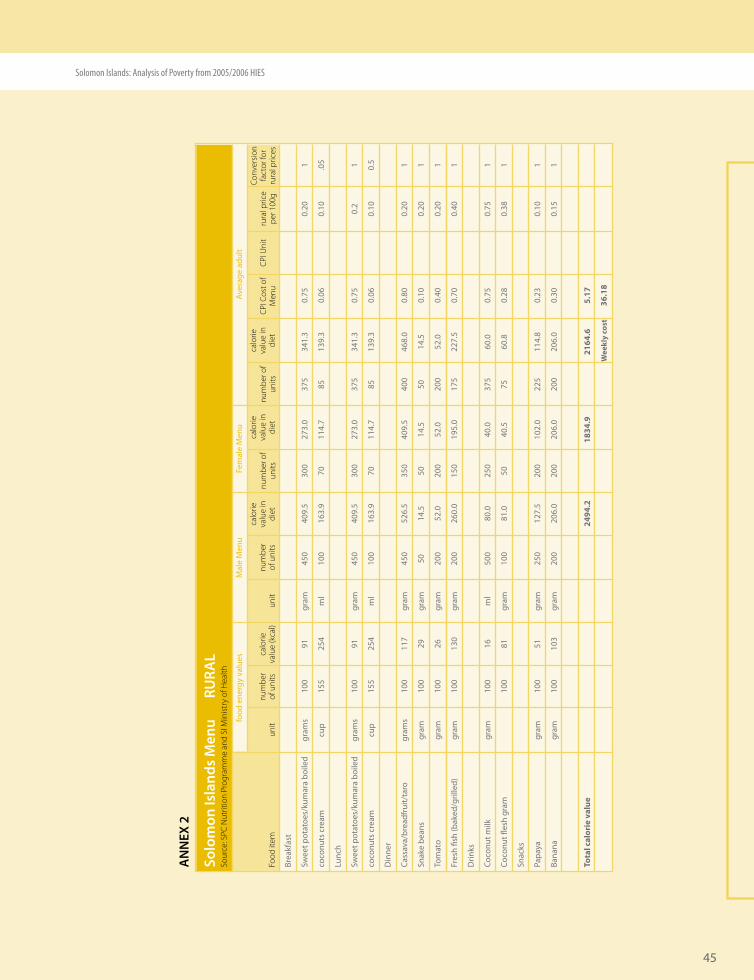
��
Solomon Islands: Analysis of Poverty from 2005/2006 HIES
Brea
kfas
t
Swee
t pot
atoe
s/ku
mar
a bo
�led
gram
s �0
0 9�
gr
am
��0
�09.
� �0
0 �7
�.0
�7�
���.
� 0.
7�
0.
�0
�
coco
nuts
cre
am
cup
���
���
ml
�00
���.
9 70
��
�.7
8�
��9.
� 0.
0�
0.
�0
.0�
Lunc
h
Swee
t pot
atoe
s/ku
mar
a bo
�led
gram
s �0
0 9�
gr
am
��0
�09.
� �0
0 �7
�.0
�7�
���.
� 0.
7�
0.
� �
coco
nuts
cre
am
cup
���
���
ml
�00
���.
9 70
��
�.7
8�
��9.
� 0.
0�
0.
�0
0.�
D�n
ner
Cass
ava/
brea
dfru
�t/ta
ro
gram
s �0
0 ��
7 gr
am
��0
���.
� ��
0 �0
9.�
�00
��8.
0 0.
80
0.
�0
�
Snak
e be
ans
gram
�0
0 �9
gr
am
�0
��.�
�0
��
.�
�0
��.�
0.
�0
0.
�0
�
Tom
ato
gram
�0
0 ��
gr
am
�00
��.0
�0
0 ��
.0
�00
��.0
0.
�0
0.
�0
�
Fres
h fis
h (b
aked
/gr�l
led)
gr
am
�00
��0
gram
�0
0 ��
0.0
��0
�9�.
0 �7
� ��
7.�
0.70
0.�0
�
Dr�n
ks
Coco
nut m
�lk
gram
�0
0 ��
m
l �0
0 80
.0
��0
�0.0
�7
� �0
.0
0.7�
0.7�
�
Coco
nut fl
esh
gram
�00
8�
gram
�0
0 8�
.0
�0
�0.�
7�
�0
.8
0.�8
0.�8
�
Snac
ks
Papa
ya
gram
�0
0 ��
gr
am
��0
��7.
� �0
0 �0
�.0
���
���.
8 0.
��
0.
�0
�
Bana
na
gram
�0
0 �0
� gr
am
�00
�0�.
0 �0
0 �0
�.0
�00
�0�.
0 0.
�0
0.
��
�
Tota
l cal
orie
val
ue
24
94.2
1834
.9
21
64.6
5.
17
Wee
kly
cost
36
.18
Food
item
unit
food
ene
rgy
valu
es
unit
calo
rie
valu
e (k
cal)
num
ber o
f un
itsnu
mbe
r of
uni
tsnu
mbe
r of
uni
ts
calo
rie
valu
e in
di
et
calo
rie
valu
e in
di
et
Mal
e M
enu
Fem
ale
Men
uAv
erag
e ad
ult
num
ber o
f un
its
calo
rie
valu
e in
di
etCP
I Cos
t of
Men
u
Solo
mon
Isla
nds
Men
uRU
RAL
Sour
ce: S
PC N
utrit
ion
Prog
ram
me
and
SI M
inist
ry o
f Hea
lth
CPI U
nit
rura
l pric
epe
r 100
g
Conv
ersio
n fa
ctor
for
rura
l pric
es
AN
NEX
2
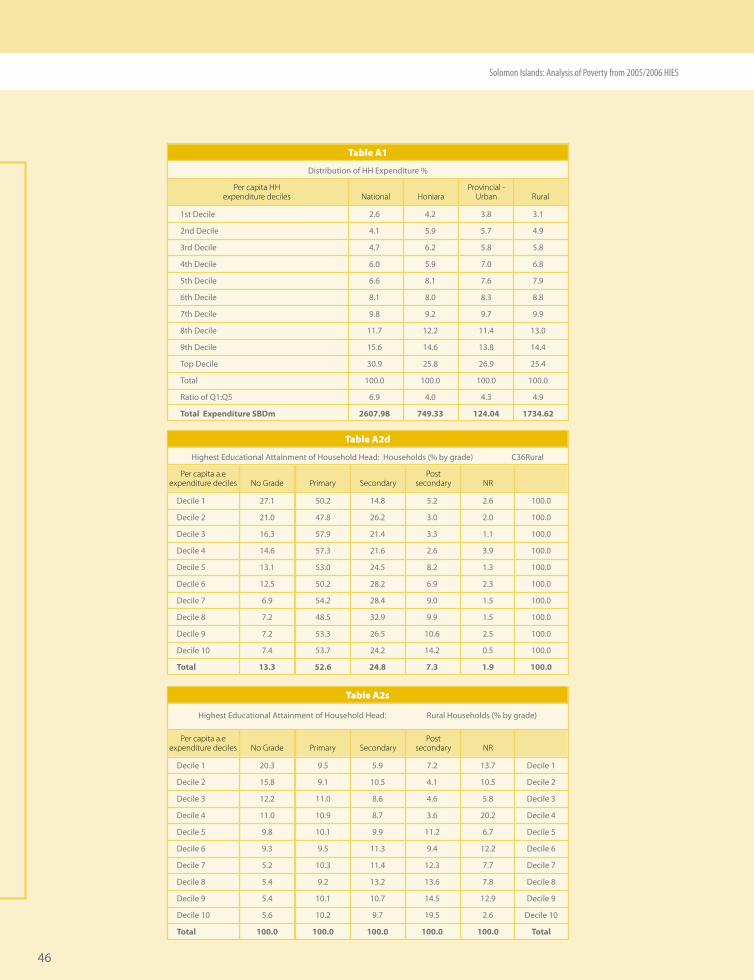
��
Solomon Islands: Analysis of Poverty from 2005/2006 HIES
D�str�but�on of HH Expend�ture %
Table A1
�st Dec�le �.� �.� �.8 �.�
�nd Dec�le �.� �.9 �.7 �.9
�rd Dec�le �.7 �.� �.8 �.8
�th Dec�le �.0 �.9 7.0 �.8
�th Dec�le �.� 8.� 7.� 7.9
�th Dec�le 8.� 8.0 8.� 8.8
7th Dec�le 9.8 9.� 9.7 9.9
8th Dec�le ��.7 ��.� ��.� ��.0
9th Dec�le ��.� ��.� ��.8 ��.�
Top Dec�le �0.9 ��.8 ��.9 ��.�
Total �00.0 �00.0 �00.0 �00.0
Rat�o of Q�:Q� �.9 �.0 �.� �.9
Total Expenditure SBDm 2607.98 749.33 124.04 1734.62
Per capita HH expenditure deciles National RuralHoniara
Provincial -Urban
H�ghest Educat�onal Atta�nment of Household Head: Households (% by grade) C��Rural
Table A2d
Dec�le � �7.� �0.� ��.8 �.� �.� �00.0
Dec�le � ��.0 �7.8 ��.� �.0 �.0 �00.0
Dec�le � ��.� �7.9 ��.� �.� �.� �00.0
Dec�le � ��.� �7.� ��.� �.� �.9 �00.0
Dec�le � ��.� ��.0 ��.� 8.� �.� �00.0
Dec�le � ��.� �0.� �8.� �.9 �.� �00.0
Dec�le 7 �.9 ��.� �8.� 9.0 �.� �00.0
Dec�le 8 7.� �8.� ��.9 9.9 �.� �00.0
Dec�le 9 7.� ��.� ��.� �0.� �.� �00.0
Dec�le �0 7.� ��.7 ��.� ��.� 0.� �00.0
Total 13.3 52.6 24.8 7.3 1.9 100.0
Per capita a.e expenditure deciles No Grade NRPrimary Secondary
Post secondary
Table A2s
Dec�le � �0.� 9.� �.9 7.� ��.7 Dec�le �
Dec�le � ��.8 9.� �0.� �.� �0.� Dec�le �
Dec�le � ��.� ��.0 8.� �.� �.8 Dec�le �
Dec�le � ��.0 �0.9 8.7 �.� �0.� Dec�le �
Dec�le � 9.8 �0.� 9.9 ��.� �.7 Dec�le �
Dec�le � 9.� 9.� ��.� 9.� ��.� Dec�le �
Dec�le 7 �.� �0.� ��.� ��.� 7.7 Dec�le 7
Dec�le 8 �.� 9.� ��.� ��.� 7.8 Dec�le 8
Dec�le 9 �.� �0.� �0.7 ��.� ��.9 Dec�le 9
Dec�le �0 �.� �0.� 9.7 �9.� �.� Dec�le �0
Total 100.0 100.0 100.0 100.0 100.0 Total
Per capita a.e expenditure deciles No Grade NRPrimary Secondary
Post secondary
H�ghest Educat�onal Atta�nment of Household Head: Rural Households (% by grade)
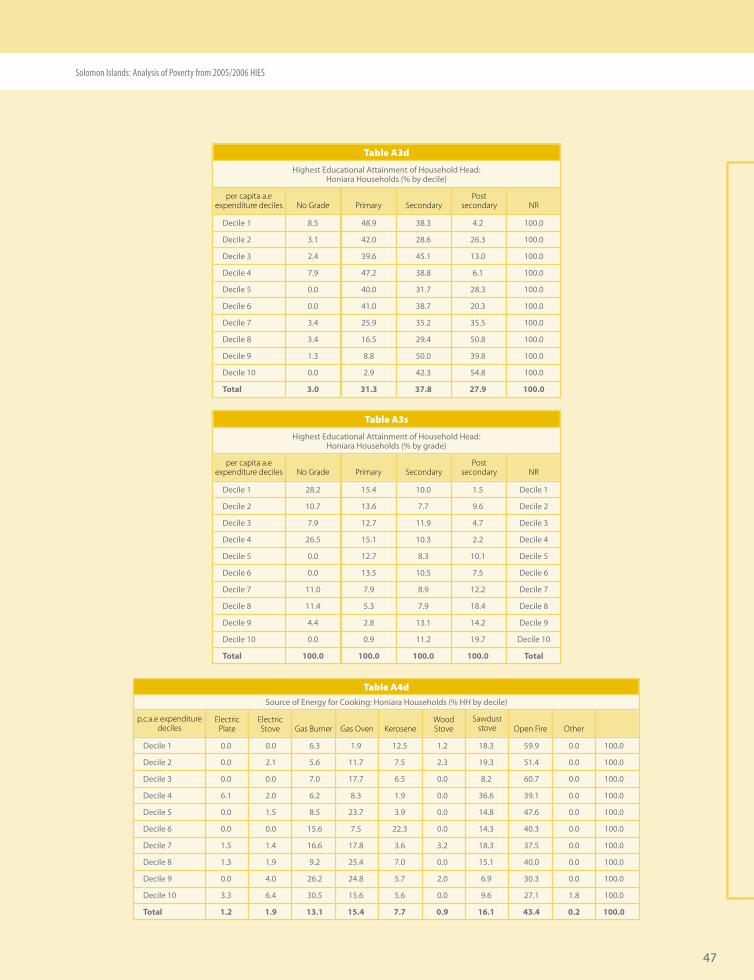
�7
Solomon Islands: Analysis of Poverty from 2005/2006 HIES
Dec�le � 0.0 0.0 �.� �.9 ��.� �.� �8.� �9.9 0.0 �00.0
Dec�le � 0.0 �.� �.� ��.7 7.� �.� �9.� ��.� 0.0 �00.0
Dec�le � 0.0 0.0 7.0 �7.7 �.� 0.0 8.� �0.7 0.0 �00.0
Dec�le � �.� �.0 �.� 8.� �.9 0.0 ��.� �9.� 0.0 �00.0
Dec�le � 0.0 �.� 8.� ��.7 �.9 0.0 ��.8 �7.� 0.0 �00.0
Dec�le � 0.0 0.0 ��.� 7.� ��.� 0.0 ��.� �0.� 0.0 �00.0
Dec�le 7 �.� �.� ��.� �7.8 �.� �.� �8.� �7.� 0.0 �00.0
Dec�le 8 �.� �.9 9.� ��.� 7.0 0.0 ��.� �0.0 0.0 �00.0
Dec�le 9 0.0 �.0 ��.� ��.8 �.7 �.0 �.9 �0.� 0.0 �00.0
Dec�le �0 �.� �.� �0.� ��.� �.� 0.0 9.� �7.� �.8 �00.0
Total 1.2 1.9 13.1 15.4 7.7 0.9 16.1 43.4 0.2 100.0
p.c.a.e expenditure deciles
ElectricPlate Gas Burner Gas Oven Kerosene
Wood Stove
Sawduststove Open Fire
ElectricStove Other
Table A4dSource of Energy for Cook�ng: Hon�ara Households (% HH by dec�le)
Table A3d
Dec�le � 8.� �8.9 �8.� �.� �00.0
Dec�le � �.� ��.0 �8.� ��.� �00.0
Dec�le � �.� �9.� ��.� ��.0 �00.0
Dec�le � 7.9 �7.� �8.8 �.� �00.0
Dec�le � 0.0 �0.0 ��.7 �8.� �00.0
Dec�le � 0.0 ��.0 �8.7 �0.� �00.0
Dec�le 7 �.� ��.9 ��.� ��.� �00.0
Dec�le 8 �.� ��.� �9.� �0.8 �00.0
Dec�le 9 �.� 8.8 �0.0 �9.8 �00.0
Dec�le �0 0.0 �.9 ��.� ��.8 �00.0
Total 3.0 31.3 37.8 27.9 100.0
per capita a.e expenditure deciles No Grade NRPrimary Secondary
Post secondary
H�ghest Educat�onal Atta�nment of Household Head: Hon�ara Households (% by dec�le)
Table A3s
Dec�le � �8.� ��.� �0.0 �.� Dec�le �
Dec�le � �0.7 ��.� 7.7 9.� Dec�le �
Dec�le � 7.9 ��.7 ��.9 �.7 Dec�le �
Dec�le � ��.� ��.� �0.� �.� Dec�le �
Dec�le � 0.0 ��.7 8.� �0.� Dec�le �
Dec�le � 0.0 ��.� �0.� 7.� Dec�le �
Dec�le 7 ��.0 7.9 8.9 ��.� Dec�le 7
Dec�le 8 ��.� �.� 7.9 �8.� Dec�le 8
Dec�le 9 �.� �.8 ��.� ��.� Dec�le 9
Dec�le �0 0.0 0.9 ��.� �9.7 Dec�le �0
Total 100.0 100.0 100.0 100.0 Total
per capita a.e expenditure deciles No Grade NRPrimary Secondary
Post secondary
H�ghest Educat�onal Atta�nment of Household Head: Hon�ara Households (% by grade)
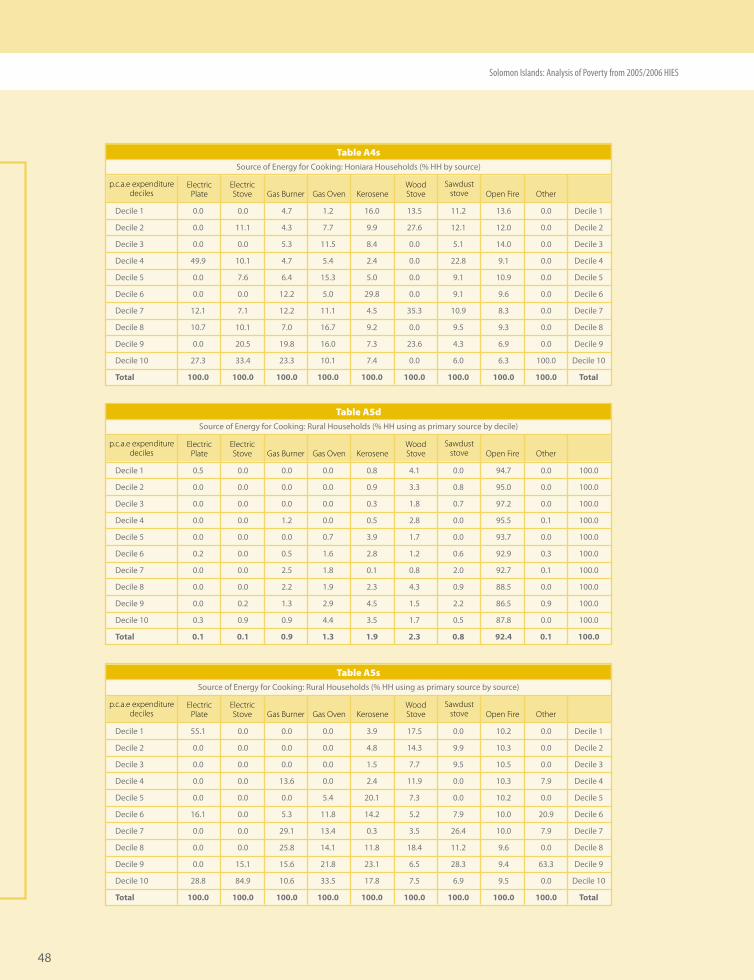
�8
Solomon Islands: Analysis of Poverty from 2005/2006 HIES
Dec�le � 0.0 0.0 �.7 �.� ��.0 ��.� ��.� ��.� 0.0 Dec�le �
Dec�le � 0.0 ��.� �.� 7.7 9.9 �7.� ��.� ��.0 0.0 Dec�le �
Dec�le � 0.0 0.0 �.� ��.� 8.� 0.0 �.� ��.0 0.0 Dec�le �
Dec�le � �9.9 �0.� �.7 �.� �.� 0.0 ��.8 9.� 0.0 Dec�le �
Dec�le � 0.0 7.� �.� ��.� �.0 0.0 9.� �0.9 0.0 Dec�le �
Dec�le � 0.0 0.0 ��.� �.0 �9.8 0.0 9.� 9.� 0.0 Dec�le �
Dec�le 7 ��.� 7.� ��.� ��.� �.� ��.� �0.9 8.� 0.0 Dec�le 7
Dec�le 8 �0.7 �0.� 7.0 ��.7 9.� 0.0 9.� 9.� 0.0 Dec�le 8
Dec�le 9 0.0 �0.� �9.8 ��.0 7.� ��.� �.� �.9 0.0 Dec�le 9
Dec�le �0 �7.� ��.� ��.� �0.� 7.� 0.0 �.0 �.� �00.0 Dec�le �0
Total 100.0 100.0 100.0 100.0 100.0 100.0 100.0 100.0 100.0 Total
p.c.a.e expenditure deciles
ElectricPlate Gas Burner Gas Oven Kerosene
Wood Stove
Sawduststove Open Fire
ElectricStove Other
Table A4sSource of Energy for Cook�ng: Hon�ara Households (% HH by source)
Dec�le � 0.� 0.0 0.0 0.0 0.8 �.� 0.0 9�.7 0.0 �00.0
Dec�le � 0.0 0.0 0.0 0.0 0.9 �.� 0.8 9�.0 0.0 �00.0
Dec�le � 0.0 0.0 0.0 0.0 0.� �.8 0.7 97.� 0.0 �00.0
Dec�le � 0.0 0.0 �.� 0.0 0.� �.8 0.0 9�.� 0.� �00.0
Dec�le � 0.0 0.0 0.0 0.7 �.9 �.7 0.0 9�.7 0.0 �00.0
Dec�le � 0.� 0.0 0.� �.� �.8 �.� 0.� 9�.9 0.� �00.0
Dec�le 7 0.0 0.0 �.� �.8 0.� 0.8 �.0 9�.7 0.� �00.0
Dec�le 8 0.0 0.0 �.� �.9 �.� �.� 0.9 88.� 0.0 �00.0
Dec�le 9 0.0 0.� �.� �.9 �.� �.� �.� 8�.� 0.9 �00.0
Dec�le �0 0.� 0.9 0.9 �.� �.� �.7 0.� 87.8 0.0 �00.0
Total 0.1 0.1 0.9 1.3 1.9 2.3 0.8 92.4 0.1 100.0
p.c.a.e expenditure deciles
ElectricPlate Gas Burner Gas Oven Kerosene
Wood Stove
Sawduststove Open Fire
ElectricStove Other
Table A5dSource of Energy for Cook�ng: Rural Households (% HH us�ng as pr�mary source by dec�le)
Dec�le � ��.� 0.0 0.0 0.0 �.9 �7.� 0.0 �0.� 0.0 Dec�le �
Dec�le � 0.0 0.0 0.0 0.0 �.8 ��.� 9.9 �0.� 0.0 Dec�le �
Dec�le � 0.0 0.0 0.0 0.0 �.� 7.7 9.� �0.� 0.0 Dec�le �
Dec�le � 0.0 0.0 ��.� 0.0 �.� ��.9 0.0 �0.� 7.9 Dec�le �
Dec�le � 0.0 0.0 0.0 �.� �0.� 7.� 0.0 �0.� 0.0 Dec�le �
Dec�le � ��.� 0.0 �.� ��.8 ��.� �.� 7.9 �0.0 �0.9 Dec�le �
Dec�le 7 0.0 0.0 �9.� ��.� 0.� �.� ��.� �0.0 7.9 Dec�le 7
Dec�le 8 0.0 0.0 ��.8 ��.� ��.8 �8.� ��.� 9.� 0.0 Dec�le 8
Dec�le 9 0.0 ��.� ��.� ��.8 ��.� �.� �8.� 9.� ��.� Dec�le 9
Dec�le �0 �8.8 8�.9 �0.� ��.� �7.8 7.� �.9 9.� 0.0 Dec�le �0
Total 100.0 100.0 100.0 100.0 100.0 100.0 100.0 100.0 100.0 Total
p.c.a.e expenditure deciles
ElectricPlate Gas Burner Gas Oven Kerosene
Wood Stove
Sawduststove Open Fire
ElectricStove Other
Table A5sSource of Energy for Cook�ng: Rural Households (% HH us�ng as pr�mary source by source)
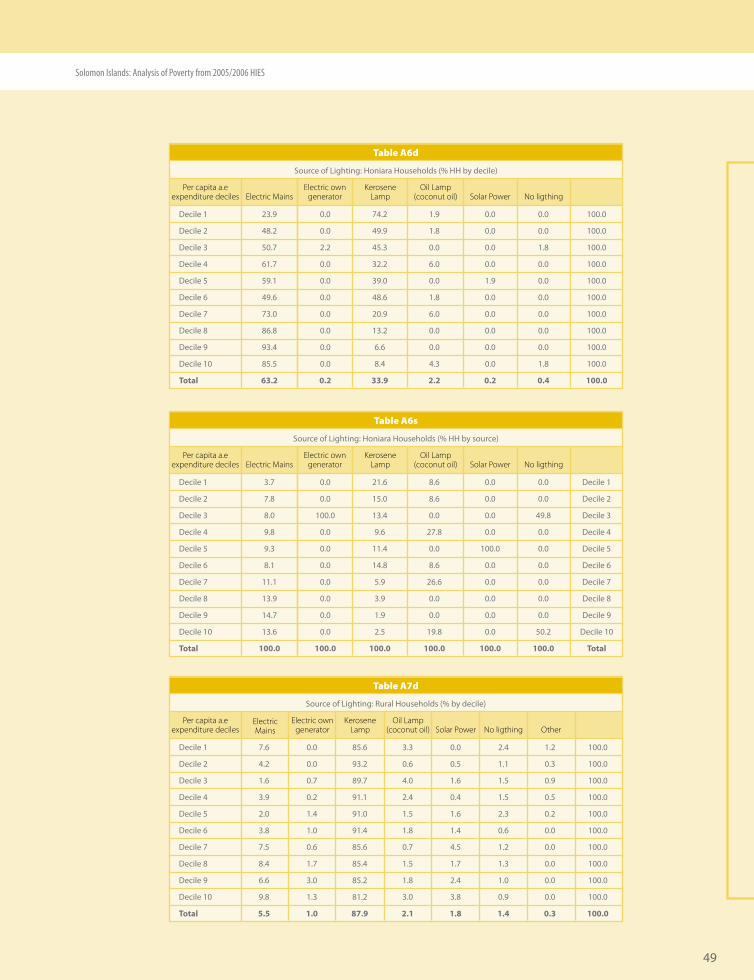
�9
Solomon Islands: Analysis of Poverty from 2005/2006 HIES
Source of L�ght�ng: Hon�ara Households (% HH by dec�le)
Table A6d
Dec�le � ��.9 0.0 7�.� �.9 0.0 0.0 �00.0
Dec�le � �8.� 0.0 �9.9 �.8 0.0 0.0 �00.0
Dec�le � �0.7 �.� ��.� 0.0 0.0 �.8 �00.0
Dec�le � ��.7 0.0 ��.� �.0 0.0 0.0 �00.0
Dec�le � �9.� 0.0 �9.0 0.0 �.9 0.0 �00.0
Dec�le � �9.� 0.0 �8.� �.8 0.0 0.0 �00.0
Dec�le 7 7�.0 0.0 �0.9 �.0 0.0 0.0 �00.0
Dec�le 8 8�.8 0.0 ��.� 0.0 0.0 0.0 �00.0
Dec�le 9 9�.� 0.0 �.� 0.0 0.0 0.0 �00.0
Dec�le �0 8�.� 0.0 8.� �.� 0.0 �.8 �00.0
Total 63.2 0.2 33.9 2.2 0.2 0.4 100.0
Per capita a.e expenditure deciles Electric Mains
Electric own generator
KeroseneLamp
Oil Lamp(coconut oil) Solar Power No ligthing
Source of L�ght�ng: Hon�ara Households (% HH by source)
Table A6s
Dec�le � �.7 0.0 ��.� 8.� 0.0 0.0 Dec�le �
Dec�le � 7.8 0.0 ��.0 8.� 0.0 0.0 Dec�le �
Dec�le � 8.0 �00.0 ��.� 0.0 0.0 �9.8 Dec�le �
Dec�le � 9.8 0.0 9.� �7.8 0.0 0.0 Dec�le �
Dec�le � 9.� 0.0 ��.� 0.0 �00.0 0.0 Dec�le �
Dec�le � 8.� 0.0 ��.8 8.� 0.0 0.0 Dec�le �
Dec�le 7 ��.� 0.0 �.9 ��.� 0.0 0.0 Dec�le 7
Dec�le 8 ��.9 0.0 �.9 0.0 0.0 0.0 Dec�le 8
Dec�le 9 ��.7 0.0 �.9 0.0 0.0 0.0 Dec�le 9
Dec�le �0 ��.� 0.0 �.� �9.8 0.0 �0.� Dec�le �0
Total 100.0 100.0 100.0 100.0 100.0 100.0 Total
Per capita a.e expenditure deciles Electric Mains
Electric own generator
KeroseneLamp
Oil Lamp(coconut oil) Solar Power No ligthing
Source of L�ght�ng: Rural Households (% by dec�le)
Table A7d
Dec�le � 7.� 0.0 8�.� �.� 0.0 �.� �.� �00.0
Dec�le � �.� 0.0 9�.� 0.� 0.� �.� 0.� �00.0
Dec�le � �.� 0.7 89.7 �.0 �.� �.� 0.9 �00.0
Dec�le � �.9 0.� 9�.� �.� 0.� �.� 0.� �00.0
Dec�le � �.0 �.� 9�.0 �.� �.� �.� 0.� �00.0
Dec�le � �.8 �.0 9�.� �.8 �.� 0.� 0.0 �00.0
Dec�le 7 7.� 0.� 8�.� 0.7 �.� �.� 0.0 �00.0
Dec�le 8 8.� �.7 8�.� �.� �.7 �.� 0.0 �00.0
Dec�le 9 �.� �.0 8�.� �.8 �.� �.0 0.0 �00.0
Dec�le �0 9.8 �.� 8�.� �.0 �.8 0.9 0.0 �00.0
Total 5.5 1.0 87.9 2.1 1.8 1.4 0.3 100.0
Per capita a.e expenditure deciles
ElectricMains
Electric own generator
KeroseneLamp
Oil Lamp(coconut oil) Solar Power No ligthing Other
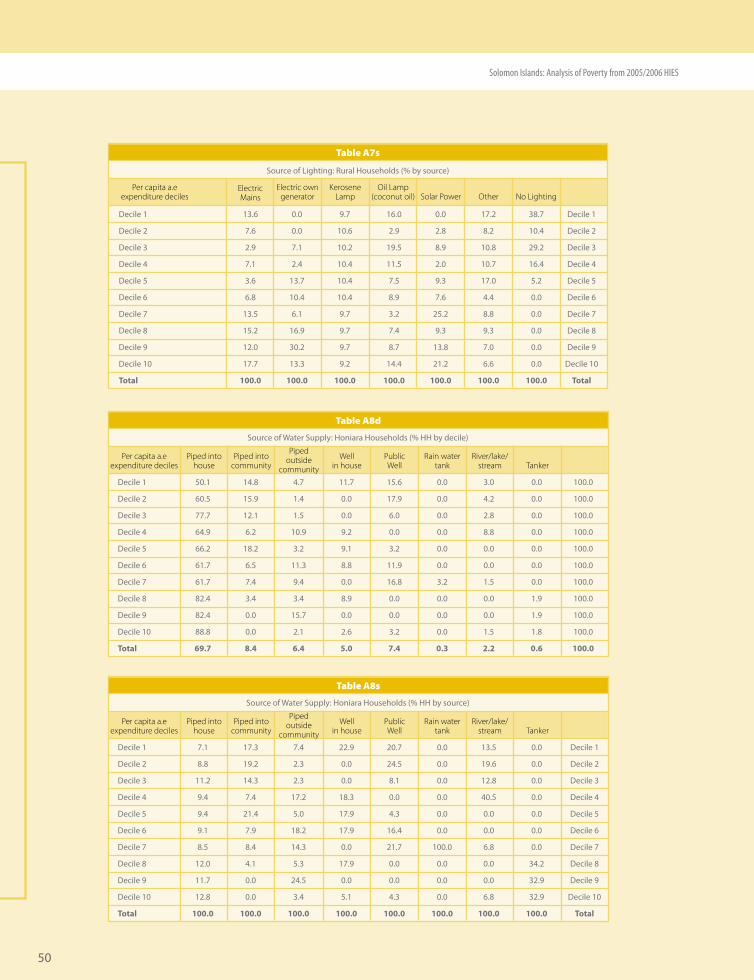
�0
Solomon Islands: Analysis of Poverty from 2005/2006 HIES
Source of L�ght�ng: Rural Households (% by source)
Table A7s
Dec�le � ��.� 0.0 9.7 ��.0 0.0 �7.� �8.7 Dec�le �
Dec�le � 7.� 0.0 �0.� �.9 �.8 8.� �0.� Dec�le �
Dec�le � �.9 7.� �0.� �9.� 8.9 �0.8 �9.� Dec�le �
Dec�le � 7.� �.� �0.� ��.� �.0 �0.7 ��.� Dec�le �
Dec�le � �.� ��.7 �0.� 7.� 9.� �7.0 �.� Dec�le �
Dec�le � �.8 �0.� �0.� 8.9 7.� �.� 0.0 Dec�le �
Dec�le 7 ��.� �.� 9.7 �.� ��.� 8.8 0.0 Dec�le 7
Dec�le 8 ��.� ��.9 9.7 7.� 9.� 9.� 0.0 Dec�le 8
Dec�le 9 ��.0 �0.� 9.7 8.7 ��.8 7.0 0.0 Dec�le 9
Dec�le �0 �7.7 ��.� 9.� ��.� ��.� �.� 0.0 Dec�le �0
Total 100.0 100.0 100.0 100.0 100.0 100.0 100.0 Total
Per capita a.e expenditure deciles
ElectricMains
Electric own generator
KeroseneLamp
Oil Lamp(coconut oil) Solar Power Other No Lighting
Source of Water Supply: Hon�ara Households (% HH by dec�le)
Table A8d
Dec�le � �0.� ��.8 �.7 ��.7 ��.� 0.0 �.0 0.0 �00.0
Dec�le � �0.� ��.9 �.� 0.0 �7.9 0.0 �.� 0.0 �00.0
Dec�le � 77.7 ��.� �.� 0.0 �.0 0.0 �.8 0.0 �00.0
Dec�le � ��.9 �.� �0.9 9.� 0.0 0.0 8.8 0.0 �00.0
Dec�le � ��.� �8.� �.� 9.� �.� 0.0 0.0 0.0 �00.0
Dec�le � ��.7 �.� ��.� 8.8 ��.9 0.0 0.0 0.0 �00.0
Dec�le 7 ��.7 7.� 9.� 0.0 ��.8 �.� �.� 0.0 �00.0
Dec�le 8 8�.� �.� �.� 8.9 0.0 0.0 0.0 �.9 �00.0
Dec�le 9 8�.� 0.0 ��.7 0.0 0.0 0.0 0.0 �.9 �00.0
Dec�le �0 88.8 0.0 �.� �.� �.� 0.0 �.� �.8 �00.0
Total 69.7 8.4 6.4 5.0 7.4 0.3 2.2 0.6 100.0
Per capita a.e expenditure deciles
Piped into house
Piped into community
Piped outside
community
Well in house
Rain water tank
River/lake/stream Tanker
Public Well
Source of Water Supply: Hon�ara Households (% HH by source)
Table A8s
Dec�le � 7.� �7.� 7.� ��.9 �0.7 0.0 ��.� 0.0 Dec�le �
Dec�le � 8.8 �9.� �.� 0.0 ��.� 0.0 �9.� 0.0 Dec�le �
Dec�le � ��.� ��.� �.� 0.0 8.� 0.0 ��.8 0.0 Dec�le �
Dec�le � 9.� 7.� �7.� �8.� 0.0 0.0 �0.� 0.0 Dec�le �
Dec�le � 9.� ��.� �.0 �7.9 �.� 0.0 0.0 0.0 Dec�le �
Dec�le � 9.� 7.9 �8.� �7.9 ��.� 0.0 0.0 0.0 Dec�le �
Dec�le 7 8.� 8.� ��.� 0.0 ��.7 �00.0 �.8 0.0 Dec�le 7
Dec�le 8 ��.0 �.� �.� �7.9 0.0 0.0 0.0 ��.� Dec�le 8
Dec�le 9 ��.7 0.0 ��.� 0.0 0.0 0.0 0.0 ��.9 Dec�le 9
Dec�le �0 ��.8 0.0 �.� �.� �.� 0.0 �.8 ��.9 Dec�le �0
Total 100.0 100.0 100.0 100.0 100.0 100.0 100.0 100.0 Total
Per capita a.e expenditure deciles
Piped into house
Piped into community
Piped outside
community
Well in house
Rain water tank
River/lake/stream Tanker
Public Well
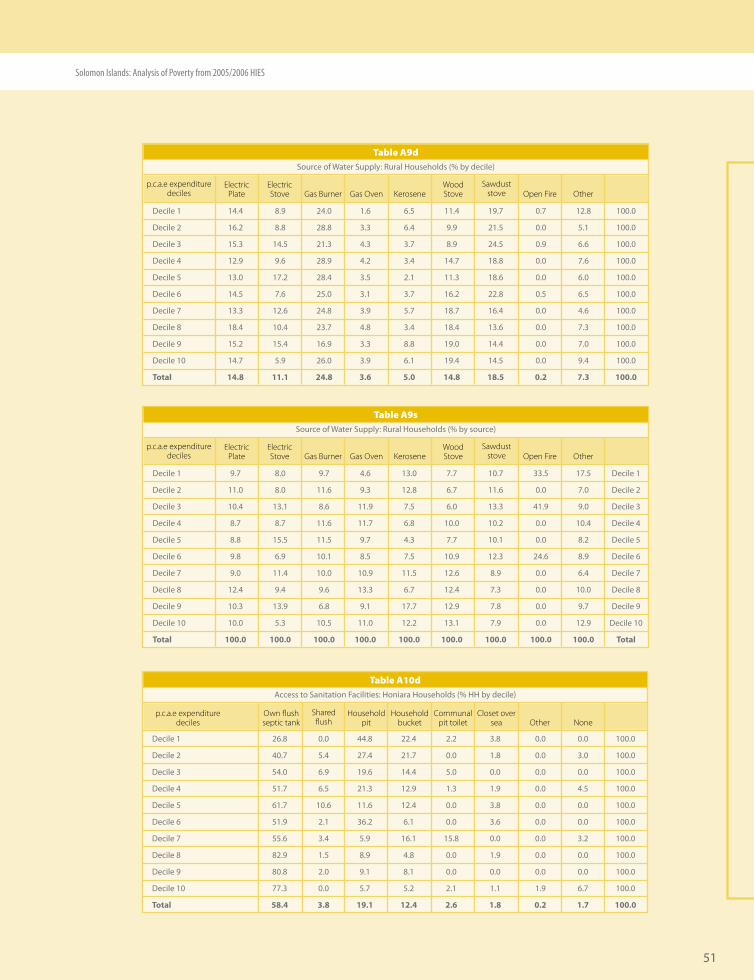
��
Solomon Islands: Analysis of Poverty from 2005/2006 HIES
Dec�le � ��.� 8.9 ��.0 �.� �.� ��.� �9.7 0.7 ��.8 �00.0
Dec�le � ��.� 8.8 �8.8 �.� �.� 9.9 ��.� 0.0 �.� �00.0
Dec�le � ��.� ��.� ��.� �.� �.7 8.9 ��.� 0.9 �.� �00.0
Dec�le � ��.9 9.� �8.9 �.� �.� ��.7 �8.8 0.0 7.� �00.0
Dec�le � ��.0 �7.� �8.� �.� �.� ��.� �8.� 0.0 �.0 �00.0
Dec�le � ��.� 7.� ��.0 �.� �.7 ��.� ��.8 0.� �.� �00.0
Dec�le 7 ��.� ��.� ��.8 �.9 �.7 �8.7 ��.� 0.0 �.� �00.0
Dec�le 8 �8.� �0.� ��.7 �.8 �.� �8.� ��.� 0.0 7.� �00.0
Dec�le 9 ��.� ��.� ��.9 �.� 8.8 �9.0 ��.� 0.0 7.0 �00.0
Dec�le �0 ��.7 �.9 ��.0 �.9 �.� �9.� ��.� 0.0 9.� �00.0
Total 14.8 11.1 24.8 3.6 5.0 14.8 18.5 0.2 7.3 100.0
p.c.a.e expenditure deciles
ElectricPlate Gas Burner Gas Oven Kerosene
Wood Stove
Sawduststove Open Fire
ElectricStove Other
Table A9dSource of Water Supply: Rural Households (% by dec�le)
Dec�le � 9.7 8.0 9.7 �.� ��.0 7.7 �0.7 ��.� �7.� Dec�le �
Dec�le � ��.0 8.0 ��.� 9.� ��.8 �.7 ��.� 0.0 7.0 Dec�le �
Dec�le � �0.� ��.� 8.� ��.9 7.� �.0 ��.� ��.9 9.0 Dec�le �
Dec�le � 8.7 8.7 ��.� ��.7 �.8 �0.0 �0.� 0.0 �0.� Dec�le �
Dec�le � 8.8 ��.� ��.� 9.7 �.� 7.7 �0.� 0.0 8.� Dec�le �
Dec�le � 9.8 �.9 �0.� 8.� 7.� �0.9 ��.� ��.� 8.9 Dec�le �
Dec�le 7 9.0 ��.� �0.0 �0.9 ��.� ��.� 8.9 0.0 �.� Dec�le 7
Dec�le 8 ��.� 9.� 9.� ��.� �.7 ��.� 7.� 0.0 �0.0 Dec�le 8
Dec�le 9 �0.� ��.9 �.8 9.� �7.7 ��.9 7.8 0.0 9.7 Dec�le 9
Dec�le �0 �0.0 �.� �0.� ��.0 ��.� ��.� 7.9 0.0 ��.9 Dec�le �0
Total 100.0 100.0 100.0 100.0 100.0 100.0 100.0 100.0 100.0 Total
p.c.a.e expenditure deciles
ElectricPlate Gas Burner Gas Oven Kerosene
Wood Stove
Sawduststove Open Fire
ElectricStove Other
Table A9sSource of Water Supply: Rural Households (% by source)
Dec�le � ��.8 0.0 ��.8 ��.� �.� �.8 0.0 0.0 �00.0
Dec�le � �0.7 �.� �7.� ��.7 0.0 �.8 0.0 �.0 �00.0
Dec�le � ��.0 �.9 �9.� ��.� �.0 0.0 0.0 0.0 �00.0
Dec�le � ��.7 �.� ��.� ��.9 �.� �.9 0.0 �.� �00.0
Dec�le � ��.7 �0.� ��.� ��.� 0.0 �.8 0.0 0.0 �00.0
Dec�le � ��.9 �.� ��.� �.� 0.0 �.� 0.0 0.0 �00.0
Dec�le 7 ��.� �.� �.9 ��.� ��.8 0.0 0.0 �.� �00.0
Dec�le 8 8�.9 �.� 8.9 �.8 0.0 �.9 0.0 0.0 �00.0
Dec�le 9 80.8 �.0 9.� 8.� 0.0 0.0 0.0 0.0 �00.0
Dec�le �0 77.� 0.0 �.7 �.� �.� �.� �.9 �.7 �00.0
Total 58.4 3.8 19.1 12.4 2.6 1.8 0.2 1.7 100.0
p.c.a.e expenditure deciles
Own flush septic tank None
Shared flush
Table A10dAccess to San�tat�on Fac�l�t�es: Hon�ara Households (% HH by dec�le)
Communal pit toilet
Household bucket
Closet over sea
Household pit Other
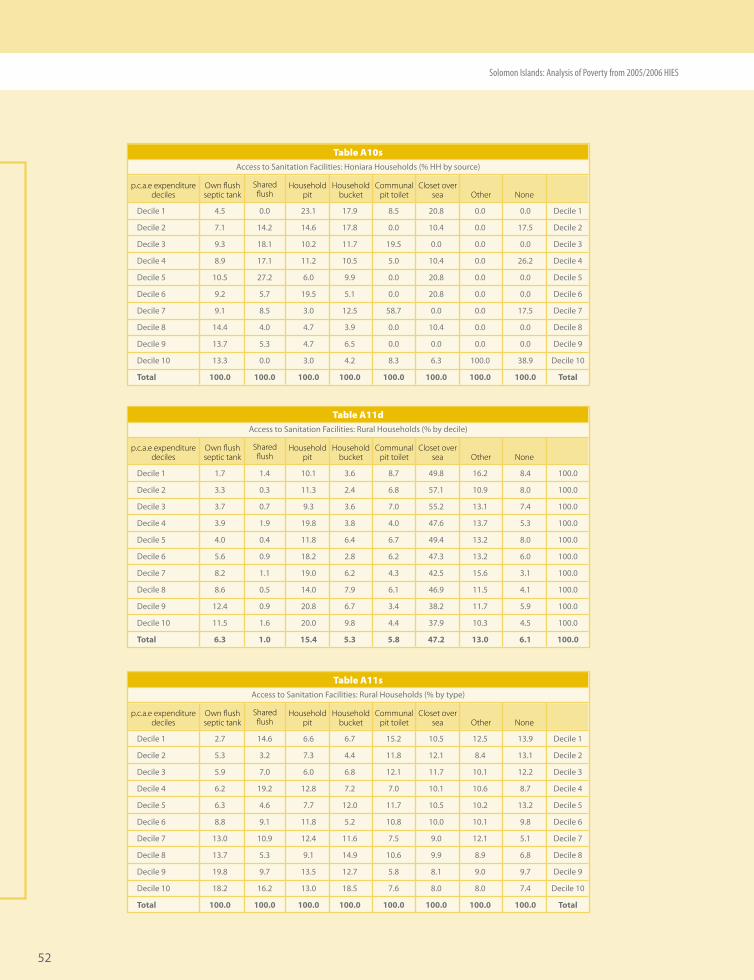
��
Solomon Islands: Analysis of Poverty from 2005/2006 HIES
Dec�le � �.� 0.0 ��.� �7.9 8.� �0.8 0.0 0.0 Dec�le �
Dec�le � 7.� ��.� ��.� �7.8 0.0 �0.� 0.0 �7.� Dec�le �
Dec�le � 9.� �8.� �0.� ��.7 �9.� 0.0 0.0 0.0 Dec�le �
Dec�le � 8.9 �7.� ��.� �0.� �.0 �0.� 0.0 ��.� Dec�le �
Dec�le � �0.� �7.� �.0 9.9 0.0 �0.8 0.0 0.0 Dec�le �
Dec�le � 9.� �.7 �9.� �.� 0.0 �0.8 0.0 0.0 Dec�le �
Dec�le 7 9.� 8.� �.0 ��.� �8.7 0.0 0.0 �7.� Dec�le 7
Dec�le 8 ��.� �.0 �.7 �.9 0.0 �0.� 0.0 0.0 Dec�le 8
Dec�le 9 ��.7 �.� �.7 �.� 0.0 0.0 0.0 0.0 Dec�le 9
Dec�le �0 ��.� 0.0 �.0 �.� 8.� �.� �00.0 �8.9 Dec�le �0
Total 100.0 100.0 100.0 100.0 100.0 100.0 100.0 100.0 Total
p.c.a.e expenditure deciles
Own flush septic tank None
Shared flush
Table A10sAccess to San�tat�on Fac�l�t�es: Hon�ara Households (% HH by source)
Communal pit toilet
Household bucket
Closet over sea
Household pit Other
Dec�le � �.7 �.� �0.� �.� 8.7 �9.8 ��.� 8.� �00.0
Dec�le � �.� 0.� ��.� �.� �.8 �7.� �0.9 8.0 �00.0
Dec�le � �.7 0.7 9.� �.� 7.0 ��.� ��.� 7.� �00.0
Dec�le � �.9 �.9 �9.8 �.8 �.0 �7.� ��.7 �.� �00.0
Dec�le � �.0 0.� ��.8 �.� �.7 �9.� ��.� 8.0 �00.0
Dec�le � �.� 0.9 �8.� �.8 �.� �7.� ��.� �.0 �00.0
Dec�le 7 8.� �.� �9.0 �.� �.� ��.� ��.� �.� �00.0
Dec�le 8 8.� 0.� ��.0 7.9 �.� ��.9 ��.� �.� �00.0
Dec�le 9 ��.� 0.9 �0.8 �.7 �.� �8.� ��.7 �.9 �00.0
Dec�le �0 ��.� �.� �0.0 9.8 �.� �7.9 �0.� �.� �00.0
Total 6.3 1.0 15.4 5.3 5.8 47.2 13.0 6.1 100.0
p.c.a.e expenditure deciles
Own flush septic tank None
Shared flush
Table A11dAccess to San�tat�on Fac�l�t�es: Rural Households (% by dec�le)
Communal pit toilet
Household bucket
Closet over sea
Household pit Other
Dec�le � �.7 ��.� �.� �.7 ��.� �0.� ��.� ��.9 Dec�le �
Dec�le � �.� �.� 7.� �.� ��.8 ��.� 8.� ��.� Dec�le �
Dec�le � �.9 7.0 �.0 �.8 ��.� ��.7 �0.� ��.� Dec�le �
Dec�le � �.� �9.� ��.8 7.� 7.0 �0.� �0.� 8.7 Dec�le �
Dec�le � �.� �.� 7.7 ��.0 ��.7 �0.� �0.� ��.� Dec�le �
Dec�le � 8.8 9.� ��.8 �.� �0.8 �0.0 �0.� 9.8 Dec�le �
Dec�le 7 ��.0 �0.9 ��.� ��.� 7.� 9.0 ��.� �.� Dec�le 7
Dec�le 8 ��.7 �.� 9.� ��.9 �0.� 9.9 8.9 �.8 Dec�le 8
Dec�le 9 �9.8 9.7 ��.� ��.7 �.8 8.� 9.0 9.7 Dec�le 9
Dec�le �0 �8.� ��.� ��.0 �8.� 7.� 8.0 8.0 7.� Dec�le �0
Total 100.0 100.0 100.0 100.0 100.0 100.0 100.0 100.0 Total
p.c.a.e expenditure deciles
Own flush septic tank None
Shared flush
Table A11sAccess to San�tat�on Fac�l�t�es: Rural Households (% by type)
Communal pit toilet
Household bucket
Closet over sea
Household pit Other
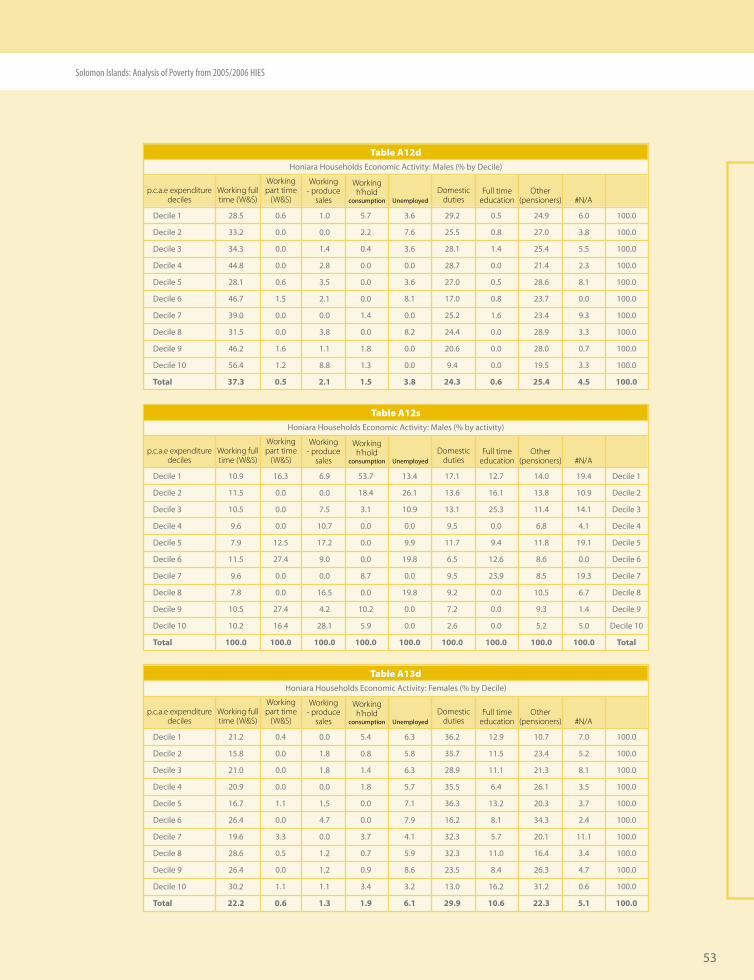
��
Solomon Islands: Analysis of Poverty from 2005/2006 HIES
Dec�le � �8.� 0.� �.0 �.7 �.� �9.� 0.� ��.9 �.0 �00.0
Dec�le � ��.� 0.0 0.0 �.� 7.� ��.� 0.8 �7.0 �.8 �00.0
Dec�le � ��.� 0.0 �.� 0.� �.� �8.� �.� ��.� �.� �00.0
Dec�le � ��.8 0.0 �.8 0.0 0.0 �8.7 0.0 ��.� �.� �00.0
Dec�le � �8.� 0.� �.� 0.0 �.� �7.0 0.� �8.� 8.� �00.0
Dec�le � ��.7 �.� �.� 0.0 8.� �7.0 0.8 ��.7 0.0 �00.0
Dec�le 7 �9.0 0.0 0.0 �.� 0.0 ��.� �.� ��.� 9.� �00.0
Dec�le 8 ��.� 0.0 �.8 0.0 8.� ��.� 0.0 �8.9 �.� �00.0
Dec�le 9 ��.� �.� �.� �.8 0.0 �0.� 0.0 �8.0 0.7 �00.0
Dec�le �0 ��.� �.� 8.8 �.� 0.0 9.� 0.0 �9.� �.� �00.0
Total 37.3 0.5 2.1 1.5 3.8 24.3 0.6 25.4 4.5 100.0
p.c.a.e expenditure deciles
Working full time (W&S)
Table A12dHon�ara Households Econom�c Act�v�ty: Males (% by Dec�le)
Unemployed
Working h’hold
consumpt�onDomestic
duties
Working - produce
salesFull time
education
Working part time
(W&S)Other
(pensioners) #N/A
Dec�le � �0.9 ��.� �.9 ��.7 ��.� �7.� ��.7 ��.0 �9.� Dec�le �
Dec�le � ��.� 0.0 0.0 �8.� ��.� ��.� ��.� ��.8 �0.9 Dec�le �
Dec�le � �0.� 0.0 7.� �.� �0.9 ��.� ��.� ��.� ��.� Dec�le �
Dec�le � 9.� 0.0 �0.7 0.0 0.0 9.� 0.0 �.8 �.� Dec�le �
Dec�le � 7.9 ��.� �7.� 0.0 9.9 ��.7 9.� ��.8 �9.� Dec�le �
Dec�le � ��.� �7.� 9.0 0.0 �9.8 �.� ��.� 8.� 0.0 Dec�le �
Dec�le 7 9.� 0.0 0.0 8.7 0.0 9.� ��.9 8.� �9.� Dec�le 7
Dec�le 8 7.8 0.0 ��.� 0.0 �9.8 9.� 0.0 �0.� �.7 Dec�le 8
Dec�le 9 �0.� �7.� �.� �0.� 0.0 7.� 0.0 9.� �.� Dec�le 9
Dec�le �0 �0.� ��.� �8.� �.9 0.0 �.� 0.0 �.� �.0 Dec�le �0
Total 100.0 100.0 100.0 100.0 100.0 100.0 100.0 100.0 100.0 Total
p.c.a.e expenditure deciles
Working full time (W&S)
Table A12sHon�ara Households Econom�c Act�v�ty: Males (% by act�v�ty)
Unemployed
Working h’hold
consumpt�onDomestic
duties
Working - produce
salesFull time
education
Working part time
(W&S)Other
(pensioners) #N/A
Dec�le � ��.� 0.� 0.0 �.� �.� ��.� ��.9 �0.7 7.0 �00.0
Dec�le � ��.8 0.0 �.8 0.8 �.8 ��.7 ��.� ��.� �.� �00.0
Dec�le � ��.0 0.0 �.8 �.� �.� �8.9 ��.� ��.� 8.� �00.0
Dec�le � �0.9 0.0 0.0 �.8 �.7 ��.� �.� ��.� �.� �00.0
Dec�le � ��.7 �.� �.� 0.0 7.� ��.� ��.� �0.� �.7 �00.0
Dec�le � ��.� 0.0 �.7 0.0 7.9 ��.� 8.� ��.� �.� �00.0
Dec�le 7 �9.� �.� 0.0 �.7 �.� ��.� �.7 �0.� ��.� �00.0
Dec�le 8 �8.� 0.� �.� 0.7 �.9 ��.� ��.0 ��.� �.� �00.0
Dec�le 9 ��.� 0.0 �.� 0.9 8.� ��.� 8.� ��.� �.7 �00.0
Dec�le �0 �0.� �.� �.� �.� �.� ��.0 ��.� ��.� 0.� �00.0
Total 22.2 0.6 1.3 1.9 6.1 29.9 10.6 22.3 5.1 100.0
p.c.a.e expenditure deciles
Working full time (W&S)
Table A13dHon�ara Households Econom�c Act�v�ty: Females (% by Dec�le)
Unemployed
Working h’hold
consumpt�onDomestic
duties
Working - produce
salesFull time
education
Working part time
(W&S)Other
(pensioners) #N/A
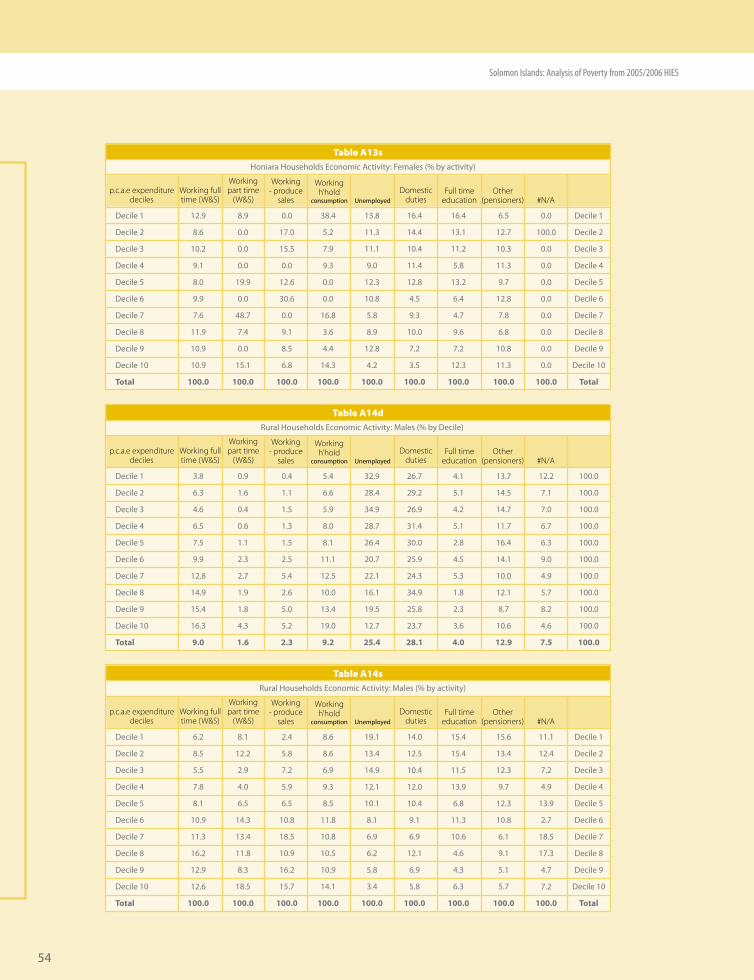
��
Solomon Islands: Analysis of Poverty from 2005/2006 HIES
Dec�le � ��.9 8.9 0.0 �8.� ��.8 ��.� ��.� �.� 0.0 Dec�le �
Dec�le � 8.� 0.0 �7.0 �.� ��.� ��.� ��.� ��.7 �00.0 Dec�le �
Dec�le � �0.� 0.0 ��.� 7.9 ��.� �0.� ��.� �0.� 0.0 Dec�le �
Dec�le � 9.� 0.0 0.0 9.� 9.0 ��.� �.8 ��.� 0.0 Dec�le �
Dec�le � 8.0 �9.9 ��.� 0.0 ��.� ��.8 ��.� 9.7 0.0 Dec�le �
Dec�le � 9.9 0.0 �0.� 0.0 �0.8 �.� �.� ��.8 0.0 Dec�le �
Dec�le 7 7.� �8.7 0.0 ��.8 �.8 9.� �.7 7.8 0.0 Dec�le 7
Dec�le 8 ��.9 7.� 9.� �.� 8.9 �0.0 9.� �.8 0.0 Dec�le 8
Dec�le 9 �0.9 0.0 8.� �.� ��.8 7.� 7.� �0.8 0.0 Dec�le 9
Dec�le �0 �0.9 ��.� �.8 ��.� �.� �.� ��.� ��.� 0.0 Dec�le �0
Total 100.0 100.0 100.0 100.0 100.0 100.0 100.0 100.0 100.0 Total
p.c.a.e expenditure deciles
Working full time (W&S)
Table A13sHon�ara Households Econom�c Act�v�ty: Females (% by act�v�ty)
Unemployed
Working h’hold
consumpt�onDomestic
duties
Working - produce
salesFull time
education
Working part time
(W&S)Other
(pensioners) #N/A
Dec�le � �.8 0.9 0.� �.� ��.9 ��.7 �.� ��.7 ��.� �00.0
Dec�le � �.� �.� �.� �.� �8.� �9.� �.� ��.� 7.� �00.0
Dec�le � �.� 0.� �.� �.9 ��.9 ��.9 �.� ��.7 7.0 �00.0
Dec�le � �.� 0.� �.� 8.0 �8.7 ��.� �.� ��.7 �.7 �00.0
Dec�le � 7.� �.� �.� 8.� ��.� �0.0 �.8 ��.� �.� �00.0
Dec�le � 9.9 �.� �.� ��.� �0.7 ��.9 �.� ��.� 9.0 �00.0
Dec�le 7 ��.8 �.7 �.� ��.� ��.� ��.� �.� �0.0 �.9 �00.0
Dec�le 8 ��.9 �.9 �.� �0.0 ��.� ��.9 �.8 ��.� �.7 �00.0
Dec�le 9 ��.� �.8 �.0 ��.� �9.� ��.8 �.� 8.7 8.� �00.0
Dec�le �0 ��.� �.� �.� �9.0 ��.7 ��.7 �.� �0.� �.� �00.0
Total 9.0 1.6 2.3 9.2 25.4 28.1 4.0 12.9 7.5 100.0
p.c.a.e expenditure deciles
Working full time (W&S)
Table A14dRural Households Econom�c Act�v�ty: Males (% by Dec�le)
Unemployed
Working h’hold
consumpt�onDomestic
duties
Working - produce
salesFull time
education
Working part time
(W&S)Other
(pensioners) #N/A
Dec�le � �.� 8.� �.� 8.� �9.� ��.0 ��.� ��.� ��.� Dec�le �
Dec�le � 8.� ��.� �.8 8.� ��.� ��.� ��.� ��.� ��.� Dec�le �
Dec�le � �.� �.9 7.� �.9 ��.9 �0.� ��.� ��.� 7.� Dec�le �
Dec�le � 7.8 �.0 �.9 9.� ��.� ��.0 ��.9 9.7 �.9 Dec�le �
Dec�le � 8.� �.� �.� 8.� �0.� �0.� �.8 ��.� ��.9 Dec�le �
Dec�le � �0.9 ��.� �0.8 ��.8 8.� 9.� ��.� �0.8 �.7 Dec�le �
Dec�le 7 ��.� ��.� �8.� �0.8 �.9 �.9 �0.� �.� �8.� Dec�le 7
Dec�le 8 ��.� ��.8 �0.9 �0.� �.� ��.� �.� 9.� �7.� Dec�le 8
Dec�le 9 ��.9 8.� ��.� �0.9 �.8 �.9 �.� �.� �.7 Dec�le 9
Dec�le �0 ��.� �8.� ��.7 ��.� �.� �.8 �.� �.7 7.� Dec�le �0
Total 100.0 100.0 100.0 100.0 100.0 100.0 100.0 100.0 100.0 Total
p.c.a.e expenditure deciles
Working full time (W&S)
Table A14sRural Households Econom�c Act�v�ty: Males (% by act�v�ty)
Unemployed
Working h’hold
consumpt�onDomestic
duties
Working - produce
salesFull time
education
Working part time
(W&S)Other
(pensioners) #N/A
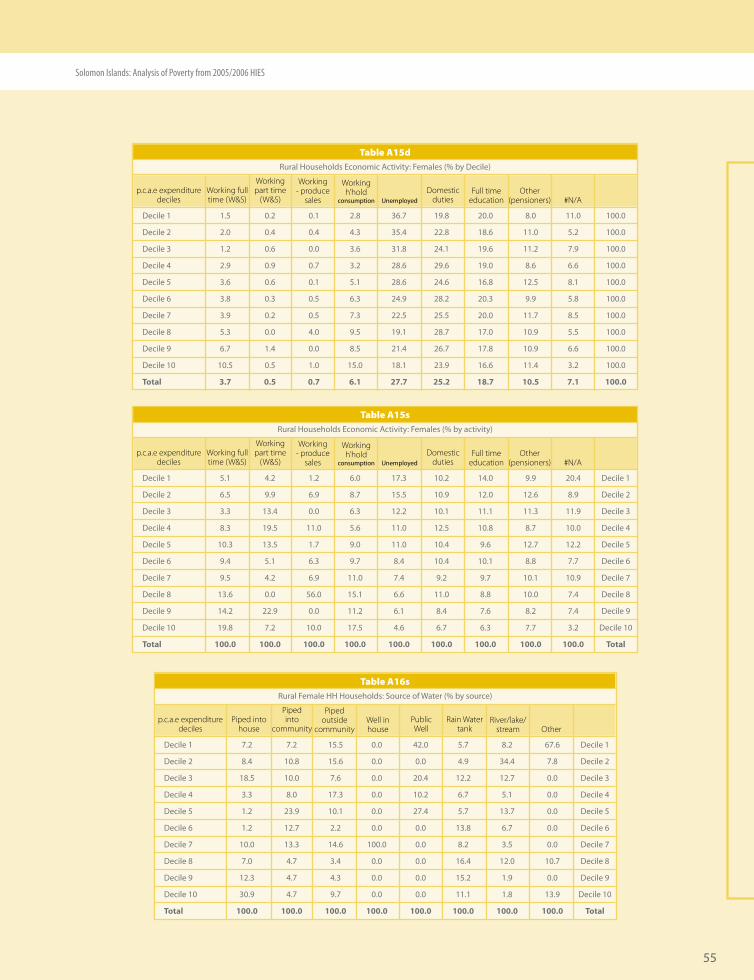
��
Solomon Islands: Analysis of Poverty from 2005/2006 HIES
Dec�le � �.� 0.� 0.� �.8 ��.7 �9.8 �0.0 8.0 ��.0 �00.0
Dec�le � �.0 0.� 0.� �.� ��.� ��.8 �8.� ��.0 �.� �00.0
Dec�le � �.� 0.� 0.0 �.� ��.8 ��.� �9.� ��.� 7.9 �00.0
Dec�le � �.9 0.9 0.7 �.� �8.� �9.� �9.0 8.� �.� �00.0
Dec�le � �.� 0.� 0.� �.� �8.� ��.� ��.8 ��.� 8.� �00.0
Dec�le � �.8 0.� 0.� �.� ��.9 �8.� �0.� 9.9 �.8 �00.0
Dec�le 7 �.9 0.� 0.� 7.� ��.� ��.� �0.0 ��.7 8.� �00.0
Dec�le 8 �.� 0.0 �.0 9.� �9.� �8.7 �7.0 �0.9 �.� �00.0
Dec�le 9 �.7 �.� 0.0 8.� ��.� ��.7 �7.8 �0.9 �.� �00.0
Dec�le �0 �0.� 0.� �.0 ��.0 �8.� ��.9 ��.� ��.� �.� �00.0
Total 3.7 0.5 0.7 6.1 27.7 25.2 18.7 10.5 7.1 100.0
p.c.a.e expenditure deciles
Working full time (W&S)
Table A15dRural Households Econom�c Act�v�ty: Females (% by Dec�le)
Unemployed
Working h’hold
consumpt�onDomestic
duties
Working - produce
salesFull time
education
Working part time
(W&S)Other
(pensioners) #N/A
Dec�le � �.� �.� �.� �.0 �7.� �0.� ��.0 9.9 �0.� Dec�le �
Dec�le � �.� 9.9 �.9 8.7 ��.� �0.9 ��.0 ��.� 8.9 Dec�le �
Dec�le � �.� ��.� 0.0 �.� ��.� �0.� ��.� ��.� ��.9 Dec�le �
Dec�le � 8.� �9.� ��.0 �.� ��.0 ��.� �0.8 8.7 �0.0 Dec�le �
Dec�le � �0.� ��.� �.7 9.0 ��.0 �0.� 9.� ��.7 ��.� Dec�le �
Dec�le � 9.� �.� �.� 9.7 8.� �0.� �0.� 8.8 7.7 Dec�le �
Dec�le 7 9.� �.� �.9 ��.0 7.� 9.� 9.7 �0.� �0.9 Dec�le 7
Dec�le 8 ��.� 0.0 ��.0 ��.� �.� ��.0 8.8 �0.0 7.� Dec�le 8
Dec�le 9 ��.� ��.9 0.0 ��.� �.� 8.� 7.� 8.� 7.� Dec�le 9
Dec�le �0 �9.8 7.� �0.0 �7.� �.� �.7 �.� 7.7 �.� Dec�le �0
Total 100.0 100.0 100.0 100.0 100.0 100.0 100.0 100.0 100.0 Total
p.c.a.e expenditure deciles
Working full time (W&S)
Table A15sRural Households Econom�c Act�v�ty: Females (% by act�v�ty)
Unemployed
Working h’hold
consumpt�onDomestic
duties
Working - produce
salesFull time
education
Working part time
(W&S)Other
(pensioners) #N/A
Dec�le � 7.� 7.� ��.� 0.0 ��.0 �.7 8.� �7.� Dec�le �
Dec�le � 8.� �0.8 ��.� 0.0 0.0 �.9 ��.� 7.8 Dec�le �
Dec�le � �8.� �0.0 7.� 0.0 �0.� ��.� ��.7 0.0 Dec�le �
Dec�le � �.� 8.0 �7.� 0.0 �0.� �.7 �.� 0.0 Dec�le �
Dec�le � �.� ��.9 �0.� 0.0 �7.� �.7 ��.7 0.0 Dec�le �
Dec�le � �.� ��.7 �.� 0.0 0.0 ��.8 �.7 0.0 Dec�le �
Dec�le 7 �0.0 ��.� ��.� �00.0 0.0 8.� �.� 0.0 Dec�le 7
Dec�le 8 7.0 �.7 �.� 0.0 0.0 ��.� ��.0 �0.7 Dec�le 8
Dec�le 9 ��.� �.7 �.� 0.0 0.0 ��.� �.9 0.0 Dec�le 9
Dec�le �0 �0.9 �.7 9.7 0.0 0.0 ��.� �.8 ��.9 Dec�le �0
Total 100.0 100.0 100.0 100.0 100.0 100.0 100.0 100.0 Total
p.c.a.e expenditure deciles
Piped into house
Table A16sRural Female HH Households: Source of Water (% by source)
Well in house
Rain Watertank
Piped outside
communityRiver/lake/
stream
Piped into
community OtherPublicWell
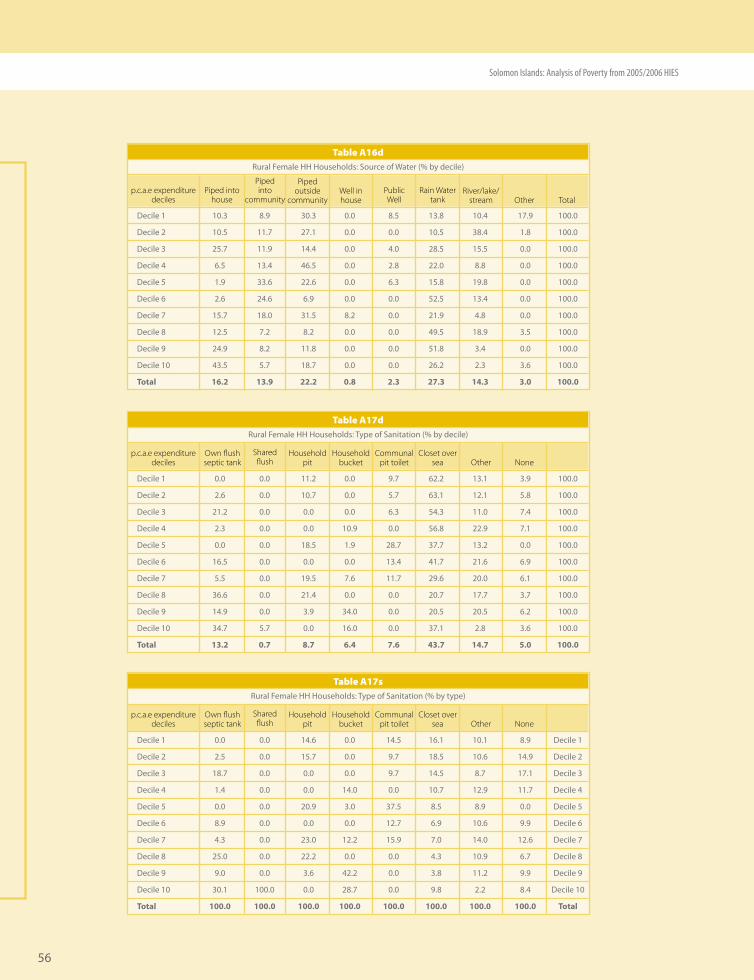
��
Solomon Islands: Analysis of Poverty from 2005/2006 HIES
Dec�le � �0.� 8.9 �0.� 0.0 8.� ��.8 �0.� �7.9 �00.0
Dec�le � �0.� ��.7 �7.� 0.0 0.0 �0.� �8.� �.8 �00.0
Dec�le � ��.7 ��.9 ��.� 0.0 �.0 �8.� ��.� 0.0 �00.0
Dec�le � �.� ��.� ��.� 0.0 �.8 ��.0 8.8 0.0 �00.0
Dec�le � �.9 ��.� ��.� 0.0 �.� ��.8 �9.8 0.0 �00.0
Dec�le � �.� ��.� �.9 0.0 0.0 ��.� ��.� 0.0 �00.0
Dec�le 7 ��.7 �8.0 ��.� 8.� 0.0 ��.9 �.8 0.0 �00.0
Dec�le 8 ��.� 7.� 8.� 0.0 0.0 �9.� �8.9 �.� �00.0
Dec�le 9 ��.9 8.� ��.8 0.0 0.0 ��.8 �.� 0.0 �00.0
Dec�le �0 ��.� �.7 �8.7 0.0 0.0 ��.� �.� �.� �00.0
Total 16.2 13.9 22.2 0.8 2.3 27.3 14.3 3.0 100.0
p.c.a.e expenditure deciles
Piped into house
Table A16dRural Female HH Households: Source of Water (% by dec�le)
Well in house
Rain Watertank
Piped outside
communityRiver/lake/
stream
Piped into
community Other TotalPublicWell
Dec�le � 0.0 0.0 ��.� 0.0 9.7 ��.� ��.� �.9 �00.0
Dec�le � �.� 0.0 �0.7 0.0 �.7 ��.� ��.� �.8 �00.0
Dec�le � ��.� 0.0 0.0 0.0 �.� ��.� ��.0 7.� �00.0
Dec�le � �.� 0.0 0.0 �0.9 0.0 ��.8 ��.9 7.� �00.0
Dec�le � 0.0 0.0 �8.� �.9 �8.7 �7.7 ��.� 0.0 �00.0
Dec�le � ��.� 0.0 0.0 0.0 ��.� ��.7 ��.� �.9 �00.0
Dec�le 7 �.� 0.0 �9.� 7.� ��.7 �9.� �0.0 �.� �00.0
Dec�le 8 ��.� 0.0 ��.� 0.0 0.0 �0.7 �7.7 �.7 �00.0
Dec�le 9 ��.9 0.0 �.9 ��.0 0.0 �0.� �0.� �.� �00.0
Dec�le �0 ��.7 �.7 0.0 ��.0 0.0 �7.� �.8 �.� �00.0
Total 13.2 0.7 8.7 6.4 7.6 43.7 14.7 5.0 100.0
p.c.a.e expenditure deciles
Own flush septic tank None
Shared flush
Table A17dRural Female HH Households: Type of San�tat�on (% by dec�le)
Communal pit toilet
Household bucket
Closet over sea
Household pit Other
Dec�le � 0.0 0.0 ��.� 0.0 ��.� ��.� �0.� 8.9 Dec�le �
Dec�le � �.� 0.0 ��.7 0.0 9.7 �8.� �0.� ��.9 Dec�le �
Dec�le � �8.7 0.0 0.0 0.0 9.7 ��.� 8.7 �7.� Dec�le �
Dec�le � �.� 0.0 0.0 ��.0 0.0 �0.7 ��.9 ��.7 Dec�le �
Dec�le � 0.0 0.0 �0.9 �.0 �7.� 8.� 8.9 0.0 Dec�le �
Dec�le � 8.9 0.0 0.0 0.0 ��.7 �.9 �0.� 9.9 Dec�le �
Dec�le 7 �.� 0.0 ��.0 ��.� ��.9 7.0 ��.0 ��.� Dec�le 7
Dec�le 8 ��.0 0.0 ��.� 0.0 0.0 �.� �0.9 �.7 Dec�le 8
Dec�le 9 9.0 0.0 �.� ��.� 0.0 �.8 ��.� 9.9 Dec�le 9
Dec�le �0 �0.� �00.0 0.0 �8.7 0.0 9.8 �.� 8.� Dec�le �0
Total 100.0 100.0 100.0 100.0 100.0 100.0 100.0 100.0 Total
p.c.a.e expenditure deciles
Own flush septic tank None
Shared flush
Table A17sRural Female HH Households: Type of San�tat�on (% by type)
Communal pit toilet
Household bucket
Closet over sea
Household pit Other


Pac�fic Centre
www.undppc.org.fj
United Nations Development Programme Pacific Centre2nd Floor YWCA Bldg (JJ’s on the Park)Private Mail Bag, SuvaFiji Islands
Augu
st �
008
http: //www.spc.int/prism/country/sb/stats
National Statistics OfficeDepartment of FinanceP.O. Box G6Honiara, Solomon Islands
Telephone: (+677) 330 0399Fax: (+679) 330 1976email: [email protected]
Telephone: (+677) 27835Fax: (+677) 23951email: [email protected]