Embed Size (px)
Citation preview
AMERICAN JOURNAL OF HUMAN BIOLOGY 3:281-287 (1991)
Somatic Comparisons: Baiga and Gond Males of Madhya Pradesh, India
SURINDER NATH’, KAREN E. FRENCH‘, AND JOHN H. SPURGEON2 ‘Department of Anthropolo y, University of Delhi, Delhi, India 110007; ’Department of Ph sical Ejucation, University of South Carolina, Columbia, South Zarolina 29208
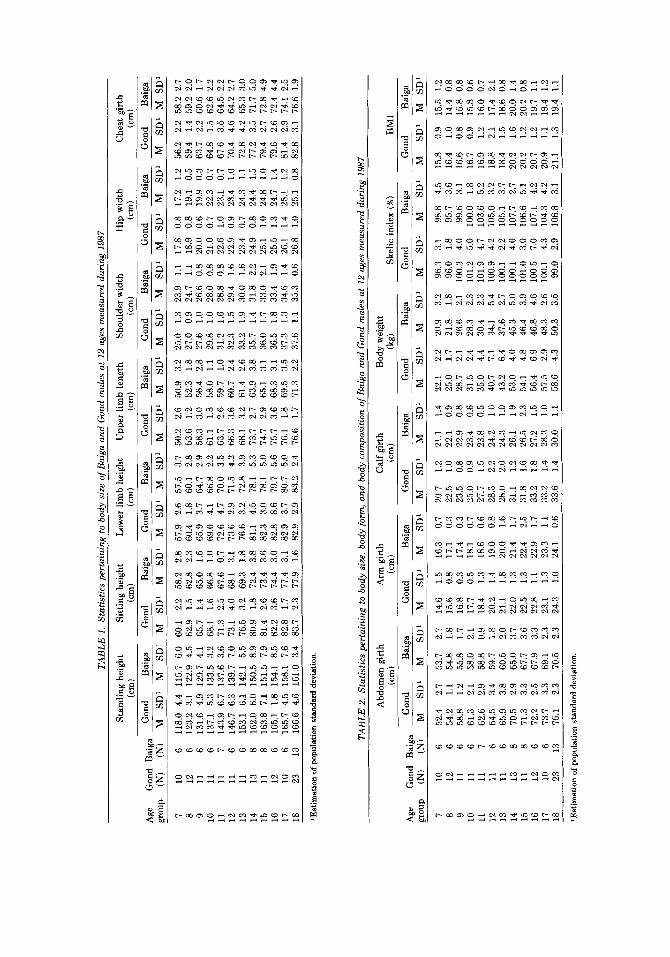
ABSTRACT Data were collected during 1987 on 84 Baiga and 146 Gond males, ages 7 years to 18 years, living in rural regions of Madhya Pradesh State (India). Comparisons are made between Baiga and Gond males for 11 measures of body size, one measure of body form, and the body mass index (BMI). Somatic compari- sons (standing height, body weight, and skelic index) were made at 5 ages with earlier samples of rural Indian males. Across all ages Gond males exceed their Baiga peers in standing height, sitting height, shoulder width, and body weight. Skelic index values (lower limb height expressed relative to sitting height) are similar for both ethnic groups through late childhood, but thereafter values are higher for Baiga males. Through age 15 years, Gond males exceed other rural Indian males from various tribes in standing height and body weight; lower limb height expressed relative to sitting height is highest for Baiga males.
There is great diversity amon Indian PO - ulations in different regions f Char et a f , 1989). Great socioeconomic diversit also ex-
owth status of children of different grou s. Kpresentative studies conducted in Incfia during the past two decades which deal with the growth progress of children with respect to socioeconomic status and in urban-rural settings include the following: Sharma and Kaul (1970), Mathur et al. (19721, Nath (1972), Sidhu and Phull(1974), Gar (1978),
Marya (1979), Haus ie et al. (1980), Singh
et al. (1987). The findings suggest that In- dian children residing in urban settings be- longing to high and middle socioeconomic groups exhibit better growth performance than their rural low socioeconomic eers.
the world indicate that children belonging to high and middle socioeconomic groups are larger in body size that those in lower socio- economic groups (Goldstein, 1971; Prasad et al., 1971; Banik et al., 1972; Boutourline- Young, 1971; Eveleth and Tanner, 1976). Similarly, urban children show better
owth performance than their rural peers. Kom reviews of numerous studies Meredith (1982) generalized that, on the average, dur-
ists in India which probably af P ects the
Malik and Singh (1978), Manoc a a and
(1980), Kumari and R. ath (19841, and Singh
Since 1950, studies from severa f parts of
ing the period 1950-1980, urban boys and girls at late childhood ages exceed their rural
standing height parents
nutrition, housing, clothing, medical care, and other services than those in poorer settings. Presumably these amenities that contribute to the “qualit of life” are, on the average, more accessi K le to urban than to rural children.
The state of Madhya Pradesh lies between latitudes 20‘ and 26’ and lon ‘tudes 76’ and
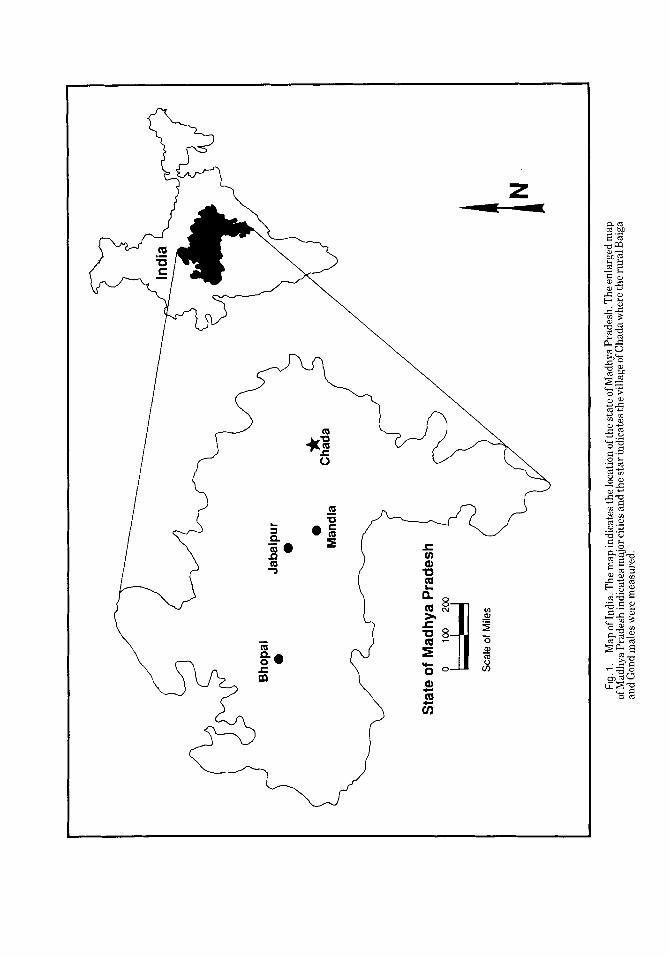
opportunity to investigate two almost un- studied groups, compares the growth status of Baiga and Gond males, ages 7 to 18 years, living in the Baigachak region. This region is very rural, about 490 to 975 m above sea level, with inadequate health and human services facilities. It is not linked to other parts of the state by railroad; only forest roads connect the villages. The entire area is covered by dense forests of saal trees and the villages where these people live are labeled forest villages (Fig. 1). “People of both tribes are employed not infrequently by the Forest Department as labourers in constructing for- est roads and other related work and this
84’. The present study, whic f provided the
Received June 14,1990; accepted February 18,1991.
01991 Wiley-Liss, Inc
W
Bho
pal
0
Jaba
lpur
0 0
M
andl
a h
Sta
te o
f M
adhy
a P
rade
sh
Scal
e of
Mile
s
V C
hada
* >P
Fig.
1.
Map
of In
dia.
The
map
indi
cate
s the
loca
tion
of th
e st
ate o
fMad
hya P
rade
sh. T
he en
larg
ed m
ap
of M
adhy
a Pra
desh
indi
cate
s maj
or ci
ties a
nd th
e st
ar in
dica
tes t
he vi
llage
of C
hada
whe
re th
e ru
ral B
aiga
an
d G
ond
mal
es w
ere
mea
sure
d.
ANTHROPOMETRY OF RURAL INDIA MALES 283
gives the labourer a chance of earning ten to twelve annas” a da ” (Roy and Rao, 1956).
Prior to World d r 11, Elwin (1939) trav- eled extensively throughout Madhya Pradesh and wrote ethnographic accounts of several tribes. Durin the 1950s, Roy and
the Baigas and Gonds. According to these authors, “the Gonds form the most impor- tant tribe in Madhya Pradesh. They are not, on the whole, so primitive as the Baigas and are mostly settled cultivators like other In- dian peasants.” Additionally, most Gonds have sufficient land for cultivation, whereas
recently have some daily wa e labour-
Pradesh covers an area with a population of
5,227,884. There are 45 districts within the state, 47 scheduled castes, and 46 scheduled tribes of which the Baigas and Gonds are but two.
MATERIALS AND METHODS The present cross-sectional study was con-
ducted on 230 clinically normal (free from overt disease) males (84 Baigas and 146 Gonds) 7 to 18 years of age, drawn from various government schools around Chada in the Bai achak region, district ofMandla of
lected at a villa e house in Chada during
bership were obtained from school records. Boys were ouped so that the whole year was the mi r point of an interval, e.g., 7 2 = 6.50 to 7.49 ears and so on. Interviews conducted at t H e time of measurement recon- firmed age accuracy. Gond parents appar- ently have a greater appreciation of formal education than Baiga parents, which results in the discre ancy between numbers of boys
ria. Althou h there is no question that this
come from a rural, low socioeconomic back- ound, the type of school attended by the
g y s can be used as a criterion of socioeco- nomic stratification. Parents who cannot af-
Rao (1956) conducted ! ietary surveys among
to the Census of In8a (1981),
Madhya 8 radesh state. The data were col-
November 1987. % irthdates and tribal mem-
attending sc R 001 and meeting the age crite-
sample o 7 Baiga and Gond male students
‘The annas was a monitary unit used prior to the current decimal system and worth approximately six cents; 12 annas or about 75 cents constituted a day’s wages.
ford to educate their children in private schools, which are considered to be better, tend to send them to overnment schools
(Singh et al., 1987). The diets of the students lack both quan-
tity and quality. They include primarily corn preparations, rice millet, certain pulsed (dried beans) and cicer crietinum (chick pea flour). Very few ve etables, including pota- toes, are consume 8 . The students do not consume fat in the form of vegetable oil, milk, or milk products. The latter are sold in exchange for salt and other necessities. The Baigas and Gonds are not vegetarians by
tion with forestry officials
which provide virtua B ly free education
istrators, dietary habits have not changed ap reciably over the past three decades.
$his study describes and compares 13 so- matometric traits of the two ethnic oups of
ing height, bod weight, and the skelic index of Baiga and 6 ond males at five ages are compared with other samples from rural areas of India.
Each subject was measured once by one anthro ometrist and remeasured by an- other. a h e n the two records for a particular dimension were in close agreement, the av- erage value was considered to estimate the true datum satisfactorily. The “close agree- ment” criteria required no greater difference between the two records than 0.4 cm for standing hei ht and sittin height; 0.3 cm for
len h, and calf girth; 0.5 cm for chest and ab c? omen girths; and 0.2 kg for body weight. When the initial determinations did not sat- isfy the applicable criterion, two additional determinations were made, with the value taken to represent the dimension being ei- ther the average of the four records or, in instances of an obvious misreading of the metric scale, the average of the homogenous three (Meredith, 1936). The 11 dimensions included standing height, sitting height, lower limb height, upper limb length, shoul- der width, hip width, chest girth (circumfer- ence of the thorax at nipple level, under conditions of normal respiration), abdominal
rth, arm girth, calf girth, and body weight. $ wo dimensions were used to derive the Shelic Index, lower limb hei ht x 100/sitting
geon et al., 1978). The body mass index was
male students. In addition, means F or stand-
shoulder wi Lf th, hip widt a , arm girth, arm
height (Knott, 1941; Mere P ith, 1960; Spur-
284 S. NATH ET AL.
used as a proxy for fatness (Cronk and Roche, 1982).
RESULTS AND DISCUSSION
Descriptive statistics for the total Sam les of Baiga and Gond males are presente ! in Tables 1 and 2. A two group by 12 a es
ences. The main effect for age was signifi- cant (P < .05) for all variables and indicated an increase in values across age. The main effect for group was also significant, with the Gonds having lar er dimensions than the Baigas for all varia % les except hip width and arm irth. The a e X group interaction was
width and lower limb height. Given the lim- ited sample sizes, discussion of age group comparisons must be interpreted with cau- tion.
Several trends are a parent in the com-
eral, Gond males are larger than Baiga males. Means for standing height, sitting height, shoulder width, and body weight are larger across all a e groups; while means for
girth, and calf girth are greater at all ages except ages 7 and 8 years.
Mean lower limb height is consistently greater for Gond males across all ages until age 18 years. Lower limb height expressed relative to sitting height (skelic index) is similar in both ethnic groups through late childhood. Thereafter, means for Baiga males are higher than those for Gond males
Across all ages, the BMI is greater in Gond than in Baiga males, which suggests greater fatness. This trend is consistent with greater body weight in Gonds across all age groups.
Little evidence exists that there are envi- ronmental differences between the Gond and Baiga students that would cause the “quality of life” to differ for either grou Therefore, the most likely reason for growtt differences is ethnic.
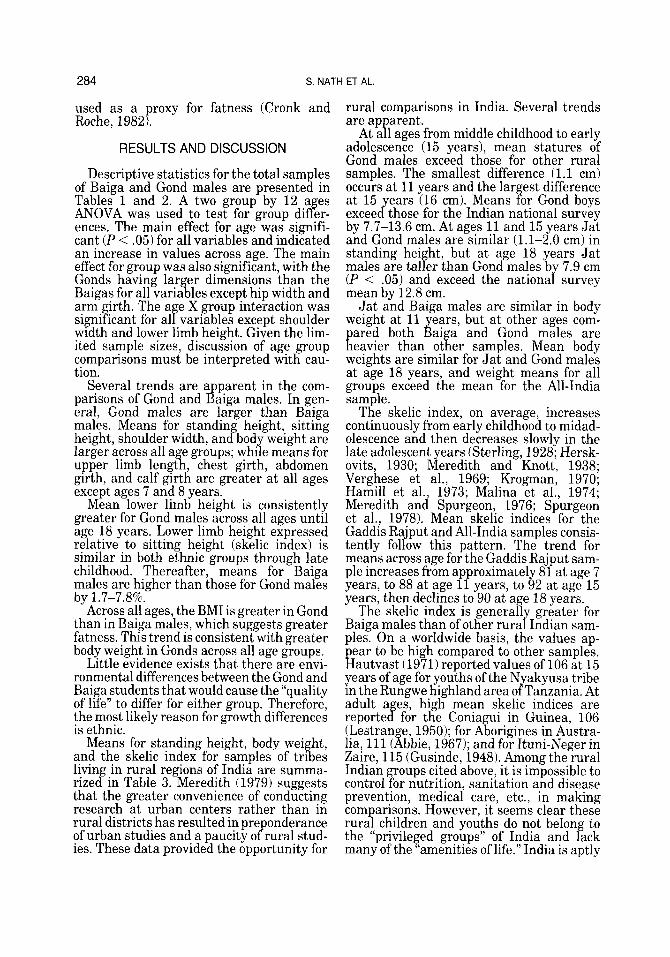
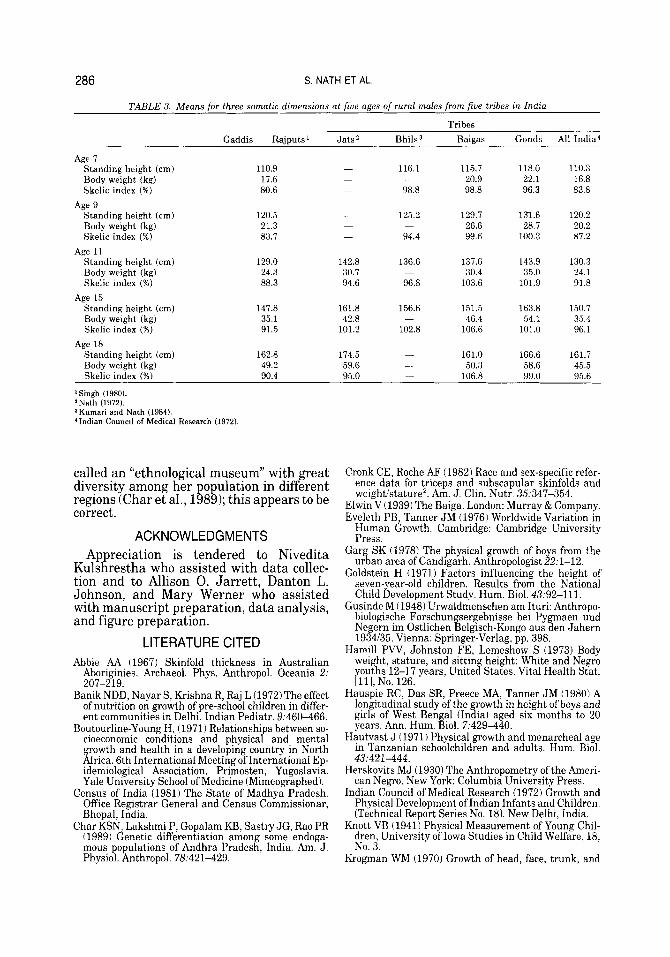
Means for standing height, body weight, and the skelic index for samples of tribes living in rural regions of India are summa- rized in Table 3. Meredith (1979) suggests that the greater convenience of conducting research at urban centers rather than in rural districts has resulted in pre onderance of urban studies and a paucity o P rural stud- ies. These data provided the opportunity for
ANOVA was used to test for group dif f er-
significant for a1 B variables except shoulder
parisons of Gond and 8 aiga males. In gen-
upper limb lengt a , chest girth, abdomen
by 1.7-7.8%.
rural comparisons in India. Several trends areap arent.
At a P 1 ages from middle childhood to early adolescence (15 years), mean statures of Gond males exceed those for other rural samples. The smallest difference (1.1 cm) occurs at 11 years and the lar est difference
exceed those for the Indian national survey by 7.7-13.6 cm. At ages 11 and 15 years Jat and Gond males are similar (1.1-2.0 cm) in standing hei ht, but at age 18 years Jat
(P < .05) and exceed the nationa survey mean by 12.8 cm.
Jat and Baiga males are similar in body
and Gond males are
weights are similar for Jat and Gond males at age 18 years, and weight means for all groups exceed the mean for the All-India sample.
The skelic index, on average, increases continuously from early childhood to midad- olescence and then decreases slowly in the late adolescent years (Sterling, 1928; Hersk- ovits, 1930; Meredith and Knott, 1938; Verghese et al., 1969; Krogman, 1970; Hamill et al., 1973; Malina et al., 1974; Meredith and Spurgeon, 1976; Spurgeon et al., 1978). Mean skelic indices for the Gaddis Rajput and All-India samples consis- tently follow this pattern. The trend for means across age for the Gaddis Rajput sam- ple increases from approximately 81 at age 7 years, to 88 at age 11 years, to 92 at age 15 years, then declines to 90 at age 18 years.
The skelic index is general1 greater for Baiga males than of other rura i“ Indian sam- ples. On a worldwide basis, the values ap-
ear to be high compared to other samples. hautvast (1971) reported values of 106 at 15 years of age for youths of the N akyusa tribe in the Rungwe highland area o P Tanzania. At adult a es, high mean skelic indices are
(Lestran e, 1950); for Aborigines in Austra-
Zaire, 115 (Gusinde, 1948). Among the rural Indian groups cited above, it is impossible to control for nutrition, sanitation and disease prevention, medical care, etc., in making comparisons. However, it seems clear these rural children and youths do not belong to the “privileged groups’’ of India and lack many of the “amenities of life.” India is aptly
at 15 years (16 cm). Means f or Gond boys
males are tal P er than Gond males b 7.9 cm i“ but at other ages com-
samples. Mean body
reporte C f for the Coniagui in Guinea, 106
lia, 111 ( !i bbie, 1967); and for Ituni-Neger in
TAB
LE 1
. St
atis
tics
pert
aini
ng to
bod
y si
ze o
f Bai
ga a
nd G
ond
mal
es a
t 12
age
s m
easu
red
duri
ng 1
987
Stan
ding
hei
ght
Sitt
ing
heig
ht
Low
er li
mb
heig
ht
Upp
er li
mb
leng
th
Shou
lder
wid
th
Hip
wid
th
Che
st g
irth
Gon
d B
aiga
G
ond
Bai
ga
Gon
d B
aiga
G
ond
Bai
ga
Gon
d B
aiga
G
ond
Bai
ga
Gon
d B
aiga
(c
m)
(cm
) (c
m)
(cm
) (c
m)
(cm
) (c
m)
Aee
G
ond
Bai
ea
~ ~
~ _
__
_
__
~
__
_ _
__
~
~ ~
~ ~
~
g&p
(N)
(NT
M
SD'
M
SD'
7 8 9 10
11
12
13
14
15
16
17
18 -
10
6 12
6
11
6 11
6
11
7 11
6
11
6 13
8
11
8 12
6
10
6 23
13
118.
0 4.
4 11
5.7
6.0
123.
2 3.
1 12
2.9
4.5
131.
6 4.
9 12
9.7
4.1
137.
1 5.
3 13
3.5
3.2
143.
9 6.
7 13
7.6
3.6
146.
7 6.
3 13
9.7
7.0
153.
1 6.
1 14
2.1
5.5
162.
0 6.
0 15
0.5
8.9
163.
8 7.
1 15
1.5
7.9
165.
1 1.
8 15
4.1
8.5
165.
7 4.
5 15
8.1
7.6
166.
6 4.
6 16
1.0
3.4
M
SD'
60.1
2.
2 62
.9
1.5
65.7
1.
4 68
.1
1.6
71.3
2.
5 73
.1
4.0
76.5
3.
2 80
.9
1.8
81.4
2.
6 82
.2
3.6
82.8
1.
7 83
.7
2.3
M
SD'
M
SD'
M
SD'
58.2
2.
8 57
.9
2.6
57.5
3.
7 62
.8
2.3
60.4
1.
8 60
.1
2.8
65.0
1.
5 65
.9
3.7
64.7
2.
9 66
.8
1.0
69.0
4.
1 66
.8
2.2
67.6
0.
7 72
.6
4.7
70.0
3.
5 68
.1
3.1
73.6
2.
9 71
.5
4.2
69.3
1.
8 76
.6
3.2
72.8
3.
9 72
.4
3.8
81.1
4.
5 78
.1
5.3
73.4
3.
6 82
.3
3.0
78.1
5.
0 74
.4
3.0
82.8
8.
6 79
.7
5.6
77.4
3.
1 82
.9
3.7
80.7
5.
0 77
.9
1.6
82.9
2.
9 83
.2
2.4
M
SD'
M
SD'
M
SD'
M
SD'
50.2
2.
6 50
.9
3.2
25.0
1.
3 23
.9
1.1
53.6
1.
2 52
.3
1.8
27.0
0.
9 24
.7
1.1
58.3
3.
0 56
.4
2.8
27.6
1.
0 26
.6
0.8
61.1
1.
8 58
.0
1.1
29.8
1.
0 28
.0
0.8
63.7
2.
6 59
.7
1.0
31.2
1.
6 28
.8
0.8
66.3
3.
6 60
.7
2.4
32.3
1.
5 29
.4
1.6
68.1
3.
2 61
.4
2.6
33.2
1.
9 30
.0
1.6
73.7
2.
7 63
.9
3.8
35.7
1.
4 31
.8
2.2
74.7
2.
9 65
.1
3.1
36.0
1.
7 33
.0
2.1
75.7
3.
6 68
.3
3.1
36.5
1.
8 33
.4
1.9
76.1
1.
8 69
.5
3.5
37.3
1.
3 34
.6
1.4
76.6
1.
7 71
.3
2.2
37.6
1.
1 35
.3
0.6
M
SD'
M
SD'
M
SD'
M S
D'
17.8
0.
8 18
.9
0.8
20.0
0.
6 21
.0
0.7
22.6
1.
0 22
.9
0.9
23.4
0.
7 24
.9
0.8
25.1
1.
0 25
.5
1.3
26.1
1.
4 26
.8
1.0
17.2
1.
2 56
.2
2.2
58.2
2.7
19
.1
0.5
59.4
1.
4 59
.2 2
.0
19.9
0.
3 63
.7
2.2
60.6
1.7
22
.3
0.7
64.8
1.
5 62
.6 2
.2 23
.1
0.7
67.6
3.
5 64
.5 2
.2
23.4
1.
0 70
.4
4.6
64.2
2.7
24
.3
1.1
72.8
4.
2 65
.3 3
.0
24.4
1.
5 77
.2
3.5
71.7
5.0
24
.8
1.0
79.4
2.
7 72
.8 4
.9
24.7
1.
4 79
.6
2.6
72.4
4.4
25
.1
1.2
81.4
2.
9 74
.1 2
.5
25.1
0.
8 82
.8
3.1
76.6
1.
9
1 Es
timat
ion
of p
opul
atio
n st
anda
rd d
evia
tion.
TAB
LE 2
. St
atis
tics
pert
aini
ng to
bod
y si
ze, b
ody
form
, and
bod
y co
mpo
sitio
n of
Bai
ga a
nd G
ond
mal
es a
t 12
age
s m
easu
red
duri
ng 1
987
Abd
omen
gir
th
Arm
gir
th
Cal
f gir
th
Bod
y w
eigh
t
11
12
13
14
15
16
17
18
Gon
d (N)
10
12
11
11
11
11
11
13
11
12
10
23
Bai
ga
IN)
~-
I
__
6 6 6 6 7 6 6 8 8 6 6 13
(cm
) G
ond
Bai
ga
M
SD
' M
S
D'
__
_~
52.4
2.
7 53
.7
2.7
54.2
1.
1 54
.8
1.8
58.8
1.
2 55
.8
1.7
61.3
2.
1 58
.0
2.1
62.6
2.
9 58
.8
0.9
64.5
3.
4 59
.7
1.8
65.9
3.
8 60
.5
2.0
70.5
2.
9 65
.0
3.7
71.3
3.
3 67
.7
3.6
72.2
2.
5 67
.9
3.3
73.7
3.
3 69
.1
2.3
7.5.
1 2.
3 70
.5
2.3
(cm
) G
ond
Bai
ga
M
SD
' M
SD
' ~~
M
SD'
M
SD'
14.6
1.
5 16
.3
0.7
15.6
0.
8 17
.1
0.3
16.8
0.
3 17
.4
0.3
17.7
0.
5 18
.1
0.7
18.4
1.
3 18
.6
0.6
20.2
1.
4 19
.0
0.8
21.1
1.
8 20
.0
1.6
22.0
1.
3 21
.4
1.7
22.5
1.
3 22
.4
2.5
22.8
1.
1 22
.9
1.7
23.1
1.
3 23
.3
1.1
24.3
1.
0 24
.1
0.6
20.7
1.
2 21
.1
1.4
22.5
1.
0 22
.1
0.9
23.5
0.
8 22
.9
0.8
25.0
0.
9 23
.4
0.6
27.7
1.
5 23
.8
0.5
28.3
2.
2 24
.2
1.0
28.0
2.
0 24
.3
1.0
31.1
1.
2 26
.1
1.9
31.8
1.
6 26
.5
2.3
33.2
1.
8 27
.2
1.5
33.2
1.
4 28
.3
1.0
33.6
1.
4 30
.0
1.1
(kg)
G
ond
Bai
ga
M
SD'
M
SD'
22.1
2.
2 20
.9
3.2
25.0
1.
7 21
.8
1.8
28.7
2.
1 26
.6
2.1
31.5
2.
4 28
.3
2.3
35.0
4.
4 30
.4
2.3
40.7
7.
1 34
.1
5.4
43.2
6.
4 37
.6
2.7
53.0
4.
0 45
.3
5.0
54.1
4.
8 46
.4
3.9
56.4
6.
9 46
.8
4.6
57.5
2.
9 48
.3
2.6
58.6
4.
3 50
.3
3.5
~~
Skel
ic in
dex
(%)
Gon
d B
aiga
~~
M
SD'
M
SD'
BM
I G
ond
Bai
ga
~_
__
M
S
D'
M
SD
'
96.3
3.
1 98
.8
4.5
96.0
1.
8 95
.7
3.6
100.
3 4.
0 99
.6
3.1
101.
2 5.
0 10
0.0
1.8
101.
9 4.
7 10
3.6
5.2
100.
9 4.
2 10
5.0
3.2
100.
1 2.
2 10
5.1
3.7
100.
1 4.
0 10
7.7
2.7
101.
0 3.
0 10
6.6
5.1
100.
5 7.
0 10
7.1
4.2
100.
1 4.
3 10
4.3
4.2
99.0
2.
9 10
6.8
3.1
15.8
0.
9 15
.5
1.2
16.4
1.
0 14
.4
0.8
16.6
0.
8 15
.8
0.8
16.7
0.
9 15
.8
0.6
16.9
1.
2 16
.0
0.7
18.8
2.
1 17
.4
2.1
18.4
1.
5 18
.6
0.8
20.2
1.
6 20
.0
1.4
20.2
1.
2 20
.2
0.8
20.7
1.
2 19
.7
1.1
20.9
1.
1 19
.4
1.2
21.1
1.
3 19
.4
1.1
'Est
imat
ion
of p
opul
atio
n st
anda
rd d
evia
tion
286 S. NATH ET AL.
TABLE 3. Means for three somatic dimensions at five ages of rural males from five tribes in India
Trihes Caddis Rajputs’ J a b 2 Bhils Baigas Gonds All India‘
Age 7 Standing height (cm) 110.9 - 116.1 115.7 118.0 110.3 Body weight (kg) 17.6 - - 20.9 22.1 16.8 Skelic index (%) 80.6 - 98.8 98.8 96.3 83.8
Standing height (cm) 120.5 - 125.2 129.7 131.6 120.2
Skelic index (w) 83.7 - 94.4 99.6 100.3 87.2
Standing height (cm) 129.0 142.8 136.6 137.6 143.9 130.3 Body weight (kg) 24.3 30.7 - 30.4 35.0 24.1 Skelic index (%) 88.3 94.6 96.8 103.6 101.9 91.8
Standing height (cm) 147.8 161.8 156.6 151.5 163.8 150.7
Skelic index (%) 91.5 101.2 102.8 106.6 101.0 96.1
161.0 166.6 161.7
Skelic index (%) 90.4 95.0 - 106.8 99.0 95.6
Age 9
Body weight (kg) 21.3 - ~ 26.6 28.7 20.2
Age 11
Age 15
Body weight (kg) 35.1 42.8 - 46.4 54.1 35.4
Age 18 Standing height (cm) 162.8 174.5 - Body weight (kg) 49.2 59.6 - 50.3 58.6 45.5
1Singh (1980). zNath (1972). 3Kumari and Nath (1984). ‘Indian Council of Medical Research (1972).
called an “ethnological museum” with great diversity among her population in different regions (Char et al., 1989); this appears to be correct.
ACKNOWLEDGMENTS Appreciation is tendered to Nivedita
Kulshrestha who assisted with data collec- tion and to Allison 0. Jarrett, Danton L. Johnson, and Mary Werner who assisted with manuscript preparation, data analysis, and figure preparation.
LITERATURE CITED Abbie AA (1967) Skinfold thickness in Australian
Aboriginies. Archaeol. Phys. Anthropol. Oceania 2:
Banik NDD, Nayar S, Krishna R, Raj L (1972) The effect of nutrition on growth of pre-school children in differ- ent communities in Delhi. Indian Pediatr. 9:460-466.
Boutourline-Young H, (1971) Relationshi s between so- cioeconomic conditions and physicaf and mental growth and health in a developing country in North Africa. 6th International Meeting of International Ep- idemiological Association. Primosten, Yugoslavia. Yale University School of Medicine (Mimeographed).
Census of India (1981) The State of Madhya Pradesh. Office Registrar General and Census Commissionar, Bhopal, India.
Char KSN, Lakshmi P, Gopalam KB, Sastry JG, Rao PR (1989) Genetic differentiation among some endoga- mous populations of Andhra Pradesh, India. Am. J. Physiol. Anthropol. 78r421-429.
207-219.
Cronk CE, Roche AF (19821 Race and sex-s ecific refer- ence data for triceps and subscapular &infolds and weightistature’. Am. J. Clin. Nutr. 35:347-354.
Elwin V (1939) The Baiga. London: Murray & Company. Eveleth PB, Tanner JM (1976) Worldwide Variation in
Human Growth. Cambridge: Cambridge University Press.
Gar SK (19781 The physical growth of boys from the u%an area of Candigarh. Anthropologist 22:l-12.
Goldstein H (1971) Factors influencing the height of seven- ear old children. Results from the National Child geveiopment Study. Hum. Biol. 43:92-111.
Gusinde M (1948) Urwaldmenschen am Ituri: Anthropo- biologische Forschun sergebnisse bei Pygmaen und Negern im Ostlichen telgisch-Kongo aus den Jahern 1934135. Vienna: Springer-Verlag, pp. 398.
Hamill P W , Johnston FE, Lemeshow S (1973) Body weight, stature, and sittin height White and Negro youths 12-17 years, Unitef States.:Vital Health Stat. [lll, No. 126.
Hauspie RC, Das SR, Preece MA, Tanner JM (1980) A longitudinal study of the growth in height of boys and girls of West Bengal (India) aged six months to 20 years. Ann. Hum. Biol. 7:429440.
Hautvast J (19711 Physical growth and menarcheal age in Tanzanian schoolchildren and adults. Hum. Biol. 43:421-444.
Herskovits MJ (1930) The Anthropometry of the Ameri- can Negro. New York: Columbia University Press.
Indian Council of Medical Research (1972) Growth and Physical Development of Indian Infants and Children. (Technical Report Series No. 18). New Delhi, India.
Knott VB (1941) Physical Measurement of Young Chil- dren, University of Iowa Studies in Child Welfare, 18, No. 3.
Krogman WM (1970) Growth of head, face, trunk, and
ANTHROPOMETRY OF RURAL INDIA MALES 287
limbs in Philadelphia White and Negro children of elementary and high school age. Monogr. SOC. Res. Child Dev. 35:Serial No. 136.
Kumari R, Nath S (1984) Progression of segmental growth among male Bhils of Udaipur. Spectra Anthro- pol. Prog. 6:15-22.
Lestrange M (1950) Contribution a l'etude de l'anthropologie sed noirs D'A. O.F.: 11. Anthropometrie de 1023 Coniagui, Bassarl, Badyaranke et Fulakunda de Guinee Franqaise. Bull. Mem. SOC. Anthropol. Paris
Malik SL, Singh IP (1978) Growth trends among male Bods of Ladakh-a high altitude population. Am. J. Phys. Anthropol. 48:171-176.
Malina RM, Hamill PW,, Lemeshow S (1974) Body dimensions and proportions, White and Negro chil- dren 6-11 years, United States. Vital Health Stat. [lll, No. 143.
Manocha KK, Marya RK (1979) Growth atterns of school children in Rohtak area. Indian f: Med. Sci.
Mathur YC, Gypta KB, Rao NP (1972) Study of growth patterns in pre-school children of low socio-economic status in a rural area near Hyderabad. Indian Pediatr.
Meredith HV (1936) The reliability of anthropological measurements taken on eight- and nine-year-old white males. Child Dev. 1:262-272.
Meredith HV (1960) Methods of stud ing physical owth. In PH Mussen (ed.): Handbooi of Research
gethods in Child Development. New York: Wiley, pp.
Meredith HV (1979) Com arative findings on body size of children and youths h i n g at urban centers and in rural areas. Growth 43:95-104.
Meredith HV(1982) Research between 1950 and 1980 on urban-rural differences in bod size and growth rates of children and youths. In HW Aeese (ed.): Advances in Child Development and Behavior, Volume 17. New York: Academic Press, pp. 83-138.
1:99-136.
33:87-90.
9:411-414.
201-251.
Meredith HV, Knott VB (1938) Changes in body ro or tions during infancy and the preschool years: {I. {he skelic index. Child Dev. 9:49-62.
Meredith HV, Spurgeon J H (1976) Comparative findings on the skelic index of Black and White children and youths residing in South Carolina. Growth 40:75-81.
Nath SA (1972) A study of a e changes of different biological variables in the JA'f boys of Meerut (U.P.). Doctoral Dissertation, Department of Anthropology, University of Delhi.
Prasad R, Kumar R, Dayal RS (1971) Physical growth and development from 1-5 years. Indian Pediatr.
Roy VK, Rao RK (1956) Diet surveys amon st the tribes of Madhya Pradesh. 1. Baigas and Gonfs of Madhya Pradesh. Bull. Department Anthropol., Government of India, Calcutta 5:2-31.
Sharma JC, Kaul SS (1970) Socio-economic differences in the growth of Punjabi boys. Anthropologist 17:43-55.
Sidhu LS, PhullAK(19741 Patterns ofphysical growth in rural boys. Arch. Child Health 15220-232.
Sin h SP (1980) Physical growth of Gaddi Rajputs of Dlaula Dhar Range of the Himalayas. Z. Morphol. Anthropol. 7I:5-81.
Singh SP, Sidhu LS, Malhatra P (1987) Growth perfor- mance of Punjabi children aged 6-12 years. Ann. Hum. Biol. 14:169-179.
Spurgeon JH, Meredith EM, Meredith HV (1978) Bod size and form of children of predominantly B l a d ancestry living in West and Central Africa, North and South America and the West Indies. Ann. Hum. Biol.
Sterling EB (1928) Health studies of Negro children: 11. The physical status ofthe urban Negro child, a study of 5,170 Negro school children in Atlanta, Ga. Public Health Rep. 43:2713-2774.
Verghese KF', Scott RB, Teixeira G, Ferguson AD (1969) Studies in growth and development: XII. Physical growth of North American Negro children. Pediatrics
8:105-120.
5:229-246.
44:243-247.