Embed Size (px)
Citation preview
Some Aspects of American Indian MigrationAuthor(s): Alan L. SorkinSource: Social Forces, Vol. 48, No. 2 (Dec., 1969), pp. 243-250Published by: Oxford University PressStable URL: http://www.jstor.org/stable/2575265 .
Accessed: 15/06/2014 05:52
Your use of the JSTOR archive indicates your acceptance of the Terms & Conditions of Use, available at .http://www.jstor.org/page/info/about/policies/terms.jsp
.JSTOR is a not-for-profit service that helps scholars, researchers, and students discover, use, and build upon a wide range ofcontent in a trusted digital archive. We use information technology and tools to increase productivity and facilitate new formsof scholarship. For more information about JSTOR, please contact [email protected].
.
Oxford University Press is collaborating with JSTOR to digitize, preserve and extend access to Social Forces.
http://www.jstor.org
This content downloaded from 91.229.229.111 on Sun, 15 Jun 2014 05:52:08 AMAll use subject to JSTOR Terms and Conditions
AMERICAN INDIAN MIGRATION 243
sure of the economic factor and number (and percentage of employed males) in armed forces as a measure of military concentration.
REFERENCES
Eldridge, Hope T. 1965 Net Intercensal Migration for States and
Geographic Divisions of the United States, 1950-60: Methodological and Substantive Aspects, Analytical and Technical Report No. 5. Philadelphia: Population Studies Center, University of Pennsylvania.
Lee, Everett S., et al. 1957 Population Redistribution and Economnic
Growth, United States, 1870-1950. Vol. 1. Methodological Considerations and Ref- erence Tables. Philadelphia: American Philosophical Society.
Miller, Ann Ratner
1964 Net Intercensal Migration to Large Ur- ban Areas of the United States, 1930-40, 1940-50, 1950-60. Analytical and Techl- nical Report No. 4. Philadelphia: Popu- lation Studies Center, University of Pennl- sylvania.
Thomas, Dorothy S. 1964 "Temporal and Spatial Interrelations be-
tween Migration and Economic Oppor- tunities." In Hope T. Eldridge and Dorothy S. Thomas, Population Redis- tribution and Economic Growth, Untited States, 1870-1950. Vol 3: Demogra.phic Analysis and Interrelations. Philadelphia: American Philosophical Society.
U.S. Bureau of Census 1962 Census of Population, 1960, Mobility for
States and State Economic Areas. Final Report PC (2) -2B. Washington, D.C.: Government Printing Office.
SOME ASPECTS OF AMERICAN INDIAN MIGRATION* ALAN L. SORKIN
The Johns Hopkins University
ABSTRACT
This paper is a study of federally assisted American Indian migration from the reservations to urban areas. The education of the migrants, their earnings before and after relocation, and the change in the degree of antisocial behavior after leaving the reservation are analyzed.
It is found that while relocation can enhance the standard of living of those participating in federal programs, budget limitations prevent these programs from assisting enough applicants, to markedly reduce the level of surplus labor on the reservations.
T he purpose of this paper is to present information on the magnitude and character of migration of American
Indians from the reservations to urban areas, and its effect on the reservation economy.
There are approximately 380,000 American Indians residing on or adjacent to reserva- tions (U.S. Public Health Service, 1966:10). These individuals comprise the most poverty- stricken minority group in the United States. The median family income for reservation In- dians is $1,800 per annum, with 76 percent of all reservation families earning incomes below
the poverty threshold (U.S. Bureau of Indian Affairs, 1967). Unemployment of reservation males in. 1967 was 37.3 percent of the labor force, or 50 percent higher than in the United States as a whole during the worst part of the Great Depression (U.S. Department of Labor, 1968:68). In 1966, according to a task force on Indian housing, over 75 percent of all res- ervation homes were substandard, with over 50 percent needing to be replaced (U.S. 13u- reau of Indian Affairs, 1966:5).
In order to ameliorate the problems of pov- erty and surplus labor on the reservations, the Bureau of Indian Affairs operates two sep- arate relocation or employment assistance pro- grams for reservation Indians. The first is a
* This study was in part financed by funds pro- vided by the William H. Donner Foundation, Inc., to the Brookings Institution where the author was a Research Associate.
This content downloaded from 91.229.229.111 on Sun, 15 Jun 2014 05:52:08 AMAll use subject to JSTOR Terms and Conditions
244 SOCI4L FORCES
direct employment program; the second, known as Adult Vocational Training, provides train- ing and subsequent employment in an off- reservation setting. Each of these programs will be described briefly.1
An Indian desiring to enter the direct em- ployment program simply files an application for employment assistance with a Bureau of Indian Affairs employment assistance officer located on the reservation. After aptitude test- ing and counseling, the Indian and his family are transported at government expense to one of seven urban areas in which the B.I.A. has employment assistance centers.2 When the fam- ily (or single individual) arrives at the center, they are given low-cost temporary housing, additional counseling and advice in job seek- ing. Later, the family is aided in moving into permanent housing. After the individual is placed in a position, he generally receives follow-up services for one year.
Partly as a result of the fact that so few Indians are employed in positions above the unskilled category, the Indian Vocational Training Act was enacted in 1956. This Act made available a wide variety of courses which permit the Indian to upgrade his vocational skills. In 1966, vocational training courses in 125 different occupations had been approved at accredited schools in 26 states. These schools are located in both urban centers and near In- dian reservations. However, whether or not the training is taken at an urban center, most graduates obtain employment (utilizing B.I.A. placement services) in urban off-reservation areas. The Bureau of Indian Affairs pays the trainee's and his family's (1) transportation to place of training and subsistence en route; (2) subsistence during the course of training (including clothing); (3) tuition, books, sup- plies and tools utilized in training.
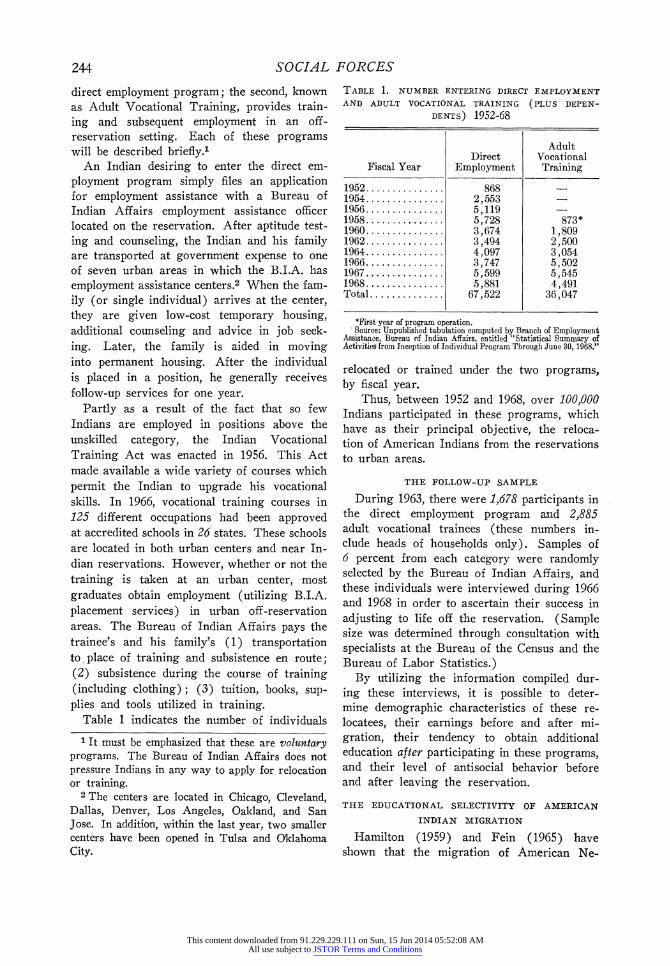
Table 1 indicates the number of individuals
relocated or trained under the two programs, by fiscal year.
Thus, between 1952 and 1968, over 100,000 Indians participated in these programs, which have as their principal objective, the reloca- tion of American Indians from the reservations to urban areas.
THE FOLLOW-UP SAMPLE
During 1963, there were 1,678 participants in the direct employment program and 2,885 adult vocational trainees (these numbers in- clude heads of households only). Samples of 6 percent from each category were randomly selected by the Bureau of Indian Affairs, and these individuals were interviewed during 1966 and 1968 in order to ascertain their success in adjusting to life off the reservation. (Sample size was determined through consultation with specialists at the Bureau of the Census and the Bureau of Labor Statistics.)
By utilizing the information compiled dur- ing these interviews, it is possible to deter- mine demographic characteristics of these re- locatees, their earnings before and after mi- gration, their tendency to obtain additional education after participating in these programs, and their level of antisocial behavior before and after leaving the reservation.
THE EDUCATIONAL SELECTIVITY OF AMERICAN
INDIAN MIGRATION
Hamilton (1959) and Fein (1965) have shown that the migration of American Ne-
TABLE 1. NUMBER ENTERING DIRECT EMPLOYMENT
AND ADULT VOCATIONAL TRAINING (PLUS DEPEN-
DENTS) 1952-68
Adult Direct Vocational
Fiscal Year Employment Training
1952 .. ......... 868 _ 1954. 2553 - 1956. 5,119 _ 1958. 5,728 873* 1960. 3,674 1,809 1962. 3,494 2,500 1964 .4,097 3,054 1966. 3,747 5,502 1967. 5,599 5,545 1968 .5,881 4,491 Total .67,522 36,047
*First year of program operation. Source: Unpublished tabulation computed by Branch of Employment
Assistance, Bureau of Indian Affairs, entitled "Statistical Summary of Activities from Inception of Individual Program Through June 30, 1968."
1 It must be emphasized that these are volsontary programs. The Bureau of Indian Affairs does not pressure Indians in any way to apply for relocation or training.
2 The centers are located in Chicago, Cleveland, Dallas, Denver, Los Angeles, Oakland, and San Jose. In addition, within the last year, two smaller centers have been opened in Tulsa and Oklahoma City.
This content downloaded from 91.229.229.111 on Sun, 15 Jun 2014 05:52:08 AMAll use subject to JSTOR Terms and Conditions
groes from the South to the North has been selective; that is, there is a tendency for the better-educated Negroes to have higher rates of net out-migration than less educated Negroes.
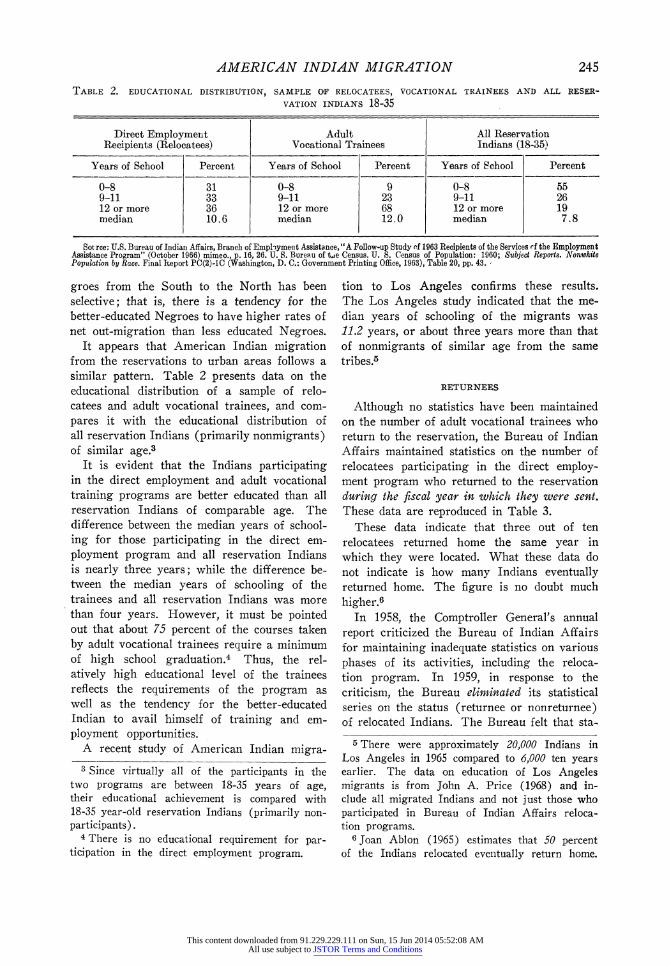
It appears that American Indian migration from the reservations to urban areas follows a similar pattern. Table 2 presents data on the educational distribution of a sample of relo- catees and adult vocational trainees, and com- pares it with the educational distribution of all reservation Indians (primarily nonmigrants) of similar age.3
It is evident that the Indians participating in the direct employment and adult vocational training programs are better educated than all reservation Indians of comparable age. The difference between the median years of school- ing for those participating in the direct em- ployment program and all reservation Indians is nearly three years; while the difference be- tween the median years of schooling of the trainees and all reservation Indians was more than four years. However, it must be pointed out that about 75 percent of the courses taken by adult vocational trainees require a minimum of high school graduation.4 Thus, the rel- atively high educational level of the trainees reflects the requirements of the program as well as the tendency for the better-educated Indian to avail himself of training and em- ployment opportunities.
A recent study of American Indian migra-
tion to Los Angeles confirms these results. The Los Angeles study indicated that the me- dian years of schooling of the migrants was 11.2 years, or about three years more than that of nonmigrants of similar age from the same tribes.5
RETURNEES
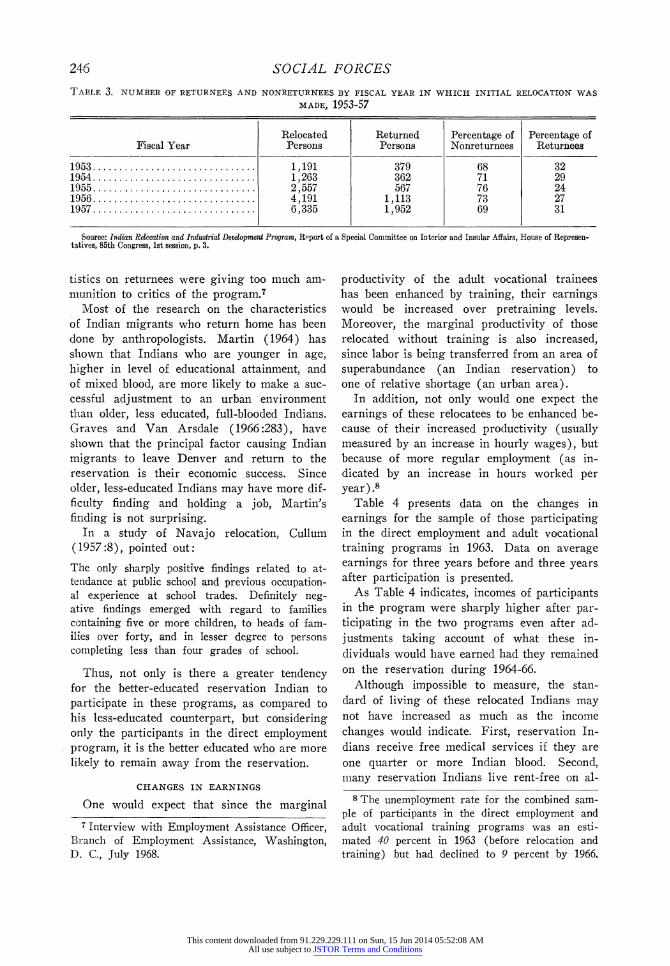
Although no statistics have been maintained on the number of adult vocational trainees who return to the reservation, the Bureau of Indian Affairs maintained statistics on the number of relocatees participating in the direct employ- ment program who returned to the reservation during the fiscal year in which they were sent. These data are reproduced in Table 3.
These data indicate that three out of ten relocatees returned home the same year in which they were located. What these data do not indicate is how many Indians eventually returned home. The figure is no doubt much higher.6
In 1958, the Comptroller General's annual report criticized the Bureau of Indian Affairs for maintaining inadequate statistics on various phases of its activities, including the reloca- tion program. In 1959, in response to the criticism, the Bureau eliminated its statistical series on the status (returnee or nonreturnee) of relocated Indians. The Bureau felt that sta-
AMERICAN INDIAN MIGRATION 245
TABLE 2. EDUCATIONAL DISTRIBUTION, SAMPLE OF RELOCATEES, VOCATIONAL TRAINEES AND ALL RESER-
VATION INDIANS 18-35
Direct Employmenrt Adult All Reservation Recipients (Relocatees) Vocational Trainees Indians (18-35)
Years of School Percent Years of School Percent Years of School Percent
0-8 31 0-8 9 0-8 55 9-11 33 9-11 23 9-11 26 12 or more 36 12 or more 68 12 or more 19 median 10.6 median 12.0 median 7.8
Sou rce: U.S. Bureau of Indian Affairs, Branch of Emplhymekt Assistance, "A Follow-up Study ef 1963 Recipients of the Services rf the Employment Assistance Program" (October 1966) mimeo., p. 16, 26. U. S. Bureau of tje Census. U. S. Census of Population: 1960; Subject Reports. Nonwhite Population by Race. Final IReport PC(2)-1C (Washington, D. C.: Government Printing Office, 1963), Table 20, pp. 43.
3 Since virtually all of the participants in the two programs are between 18-35 years of age, their educational achievement is compared with 18-35 year-old reservation Indians (primarily non- participants).
4 There is no educational requirement for par- ticipation in the direct employment program.
5 There were approximately 20,000 Indians in Los Angeles in 1965 compared to 6,000 ten years earlier. The data on education of Los Angeles migrants is from John A. Price (1968) and in- clude all migrated Indians and not just those who participated in Bureau of Indian Affairs reloca- tion programs.
6 Joan Ablon (1965) estimates that 50 percent of the Indians relocated eventually return home.
This content downloaded from 91.229.229.111 on Sun, 15 Jun 2014 05:52:08 AMAll use subject to JSTOR Terms and Conditions
246 SOCIAL FORCES
TABLE 3. NUMBER OF RETURNEES AND NONRETURNEES BY FISCAL YEAR IN WHICH INITIAL RELOCATION WAS
MADE, 1953-57
Relocated Returned Percentage of Percentage of Fiscal Year Persons Persons Nonreturnees Returnees
1953 .1,191 379 68 32 1954 .1,263 362 71 29 1955. 2557 567 76 24 1956. 4191 1,113 73 27 1957 .6,335 1,952 69 31
Source: Indian Relocation and Industrial Development Program, Report of a Special Committee on Interior and Insular Affairs, House of Represen- tatives, 85th Congress, 1st session, p. 3.
tistics on returnees were giving too much am- munition to critics of the program.7
Most of the research on the characteristics of Indian migrants who return home has been done by anthropologists. Martin (1964) has shown that Indians who are younger in age, higher in level of educational attainment, and of mixed blood, are more likely to make a suc- cessful adjustment to an urban environment than older, less educated, full-blooded Indians. Graves and Van Arsdale (1966:283), have shown that the principal factor causing Indian migrants to leave Denver and return to the reservation is their economic success. Since older, less-educated Indians may have more dif- ficulty finding and holding a job, Martin's finding is not surprising.
In a study of Navajo relocation, Cullum (1957:8), pointed out:
The only sharply positive findings related to at- tendance at public school and previous occupation- al experience at school trades. Definitely neg- ative findings emerged with regard to families containing five or more children, to heads of fam- ilies over forty, and in lesser degree to persons completing less than four grades of school.
Thus, not only is there a greater tendency for the better-educated reservation Indian to participate in these programs, as compared to his less-educated counterpart, but considering only the participants in the direct employment program, it is the better educated who are more likely to remain away from the reservation.
CHANGES IN EARNINGS
One would expect that since the marginal
productivity of the adult vocational trainees has been enhanced by training, their earnings would be increased over pretraining levels. Moreover, the marginal productivity of those relocated without training is also increased, since labor is being transferred from an area of superabundance (an Indian reservation) to one of relative shortage (an urban area).
In addition, not only would one expect the earnings of these relocatees to be enhanced be- cause of their increased productivity (usually measured by an increase in hourly wages), but because of more regular employment (as in- dicated by an increase in hours worked per year) .8
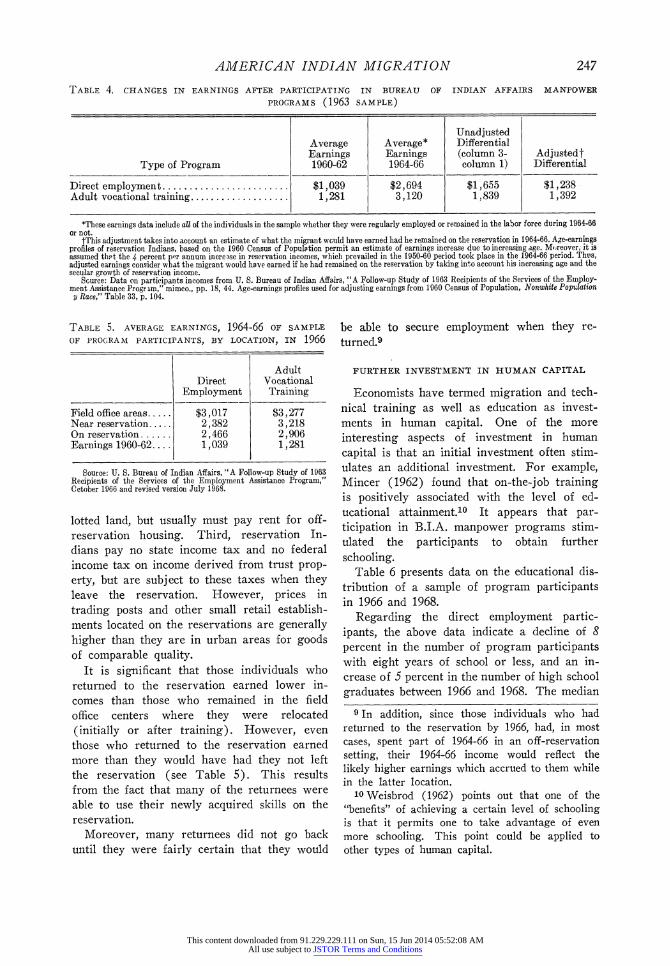
Table 4 presents data on the changes in earnings for the sample of those participating in the direct employment and adult vocational training programs in 1963. Data on average earnings for three years before and three years after participation is presented.
As Table 4 indicates, incomes of participants in the program were sharply higher after par- ticipating in the two programs even after ad- justments taking account of what these in- dividuals would have earned had they remained on the reservation during 1964-66.
Although impossible to measure, the stan- dard of living of these relocated Indians may not have increased as much as the income changes would indicate. First, reservation In- dians receive free medical services if they are one quarter or more Indian blood. Second, many reservation Indians live rent-free on al-
7 Interview with Employment Assistance Officer, Branch of Employment Assistance, Washington, D. C., July 1968.
8 The unemployment rate for the combined sam- ple of participants in the direct employment and adult vocational training programs was an esti- mated 40 percent in 1963 (before relocation and training) but had declined to 9 percent by 1966.
This content downloaded from 91.229.229.111 on Sun, 15 Jun 2014 05:52:08 AMAll use subject to JSTOR Terms and Conditions
lotted land, but usually must pay rent for off- reservation housing. Third, reservation In- dians pay no state income tax and no federal income tax on income derived from trust prop- erty, but are subj ect to these taxes when they leave the reservation. However, prices in trading posts and other small retail establish- ments located on the reservations are generally higher than they are in urban areas for goods of comparable quality.
It is significant that those individuals who returned to the reservation earned lower in- comes than those who remained in the field office centers where they were relocated (initially or after training). However, even those who returned to the reservation earned more than they would have had they not left the reservation (see Table 5). This results from the fact that many of the returnees were able to use their newly acquired skills on the reservation.
Moreover, many returnees did not go back until they were fairly certain that they would
be able to secure employment when they re- turned.9
FURTHER INVESTMENT IN HUMAN CAPITAL
Economists have termed migration and tech- nical training as well as education as invest- ments in human capital. One of the more interesting aspects of investment in human capital is that an initial investment often stim- ulates an additional investment. For example, Mincer (1962) found that on-the-job training is positively associated with the level of ed- ucational attainment.10 It appears that par- ticipation in B.I.A. manpower programs stim- ulated the participants to obtain further schooling.
Table 6 presents data on the educational dis- tribution of a sample of program participants in 1966 and 1968.
Regarding the direct employment partic- ipants, the above data indicate a decline of 8 percent in the number of program participants with eight years of school or less, and an in- crease of 5 percent in the number of high school graduates between 1966 and 1968. The median
AMERICAN INDIAN MIGRATION 247
TABLE 4. CHANGES IN EARNINGS AFTER PARTICIPATING IN BUREAU OF INDIAN AFFAIRS MANPOWER
PROGRAMS (1963 SAMPLE)
Unadjusted Average Average* Differential Earnings Earnings (column 3- Adjustedt
Type of Program 1960-62 1964-66 column 1) Differential
Direct employment .$1,039 $2,694 $1,655 $1,238 Adult vocational training .1,281 3,120 1,839 1,392
*These earnings data include all of the individuals in the sample whether they were regularly employed or remained in the labor force during 1964-66 or not.
tThis adjustment takes into account an estimate of what the migrant wcoild have earned had he remained on the reservation in 1964-66. Age-earnings profiles of reservation Indians, based on the 1960 Census of Population permit an estimate of earnings increase due to increasing age. Mreover, it is assumed thpt the 4 percent p,)r annum incre3se in reservation incomes, which prevailed in the 1950-60 period took place in the 1964-66 period. Thus, adjusted earnings consider what the migrant would have earned if he had remained on the reservation by taking into account his increasing age and the secular growth of reservation income.
Srurce: Data on participants incomes from U. S. Bureau of Indian Affairs, "A Follow-up Study of 1963 Recipients of the Services of the Employ- ment Assistance Progrim," mimeo., pp. 18, 44. Age-earnings profiles used for adjusting earnings from 1960 Census of Population, Nonwhite Population y Race," Table 33, p. 104.
TABLE 5. AVERAGE EARNINGS, 1964-66 OF SAMPLE
OF PROGRAM PARTICIPANTS, BY LOCATION, IN 1966
Adult Direct Vocational
Employment Training
Field office areas ..... $3,017 $3,277 Near reservation .... 2,382 3,218 On reservation ..... 2,466 2,906 Earnings 1960-62.... 1,039 1,281
Source: U. S. Bureau of Indian Affairs, "A Follow-up Study of 1963 Recipients of the Services of the Employment Assistance Program," October 1966 and revised version July 1968.
9 In addition, since those individuals who had returned to the reservation by 1966, had, in most cases, spent part of 1964-66 in an off-reservation setting, their 1964-66 income would reflect the likely higher earnings which accrued to them while in the latter location.
10 Weisbrod (1962) points out that one of the "benefits" of achieving a certain level of schooling is that it permits one to take advantage of even more schooling. This point could be applied to other types of human capital.
This content downloaded from 91.229.229.111 on Sun, 15 Jun 2014 05:52:08 AMAll use subject to JSTOR Terms and Conditions
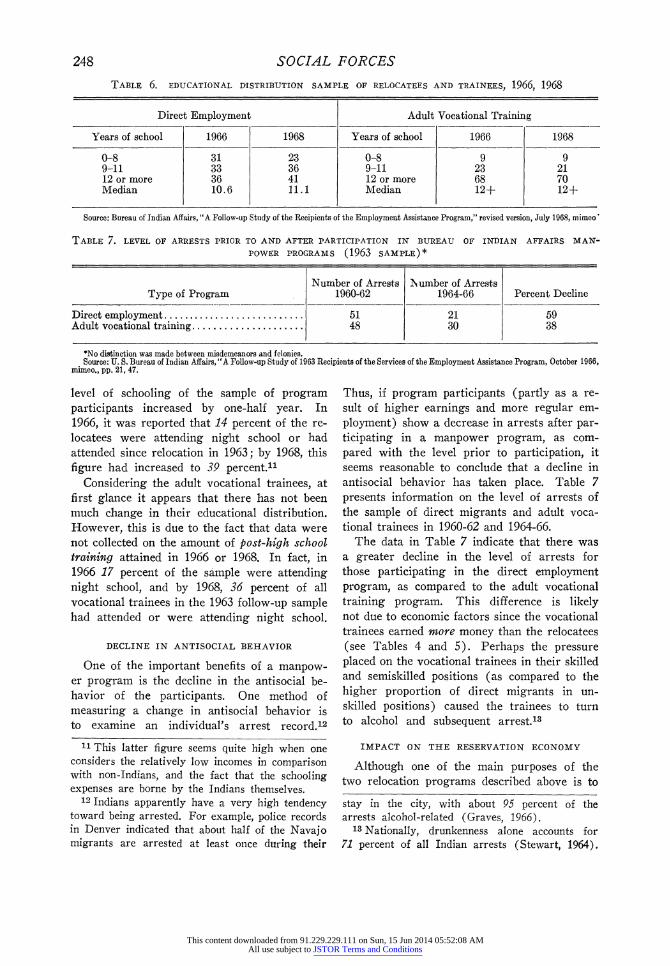
level of schooling of the sample of program participants increased by one-half year. In 1966, it was reported that 14 percent of the re- locatees were attending night school or had attended since relocation in 1963; by 1968, this figure had increased to 39 percent.11
Considering the adult vocational trainees, at first glance it appears that there has not been much change in their educational distribution. However, this is due to the fact that data were not collected on the amount of post-high school training attained in 1966 or 1968. In fact, in 1966 17 percent of the sample were attending night school, and by 1968, 36 percent of all vocational trainees in the 1963 follow-up sample had attended or were attending night school.
DECLINE IN ANTISOCIAL BEHAVIOR
One of the important benefits of a manpow- er program is the decline in the antisocial be- havior of the participants. One method of measuring a change in antisocial behavior is to examine an individual's arrest record.12
Thus, if program participants (partly as a re- sult of higher earnings and more regular em- ployment) show a decrease in arrests after par- ticipating in a manpower program, as com- pared with the level prior to participation, it seems reasonable to conclude that a decline in antisocial behavior has taken place. Table 7 presents information on the level of arrests of the sample of direct migrants and adult voca- tional trainees in 1960-62 and 1964-66.
The data in Table 7 indicate that there was a greater decline in the level of arrests for those participating in the direct employment program, as compared to the adult vocational training program. This difference is likely not due to economic factors since the vocational trainees earned more money than the relocatees (see Tables 4 and 5). Perhaps the pressure placed on the vocational trainees in their skilled and semiskilled positions (as compared to the higher proportion of direct migrants in un- skilled positions) caused the trainees to turn to alcohol and subsequent arrest.13
IMPACT ON THE RESERVATION ECONOMY
Although one of the main purposes of the two relocation programs described above is to
248 SOCIAL FORCES
TABLE 6. EDUCATIONAL DISTRIB1UTION SAMPLE OF RELOCATEES AND TRAINEES, 1966, 1968
Direct Employment Adult Vocational Training
Years of school 1966 1968 Years of school 1966 1968
0-8 31 23 0-8 9 9 9-11 33 36 9-11 23 21 12 or more 36 41 12 or more 68 70 Median 10.6 11.1 Median 12+ 12+
Source: Bureau of Indian Afairs, "A Follow-up Study of the Recipients of the Employment Assistance Program," revised version, July 1968, mimeo-
TABLE 7. LEVEL OF ARRESTS PRIOR TO AND AFTER PARTICIPATION IN BUREAU OF INDIAN AFFAIRS MAN- POWER PROGRAMS (1963 SAMPLE)*
Number of Arrests 1\umber of Arrests Type of Program 1960-62 1964-66 Percent Decline
Direct employment .51 21 59 Adult vocational training ..................... 48 30 38
*No distinction was made between misdemeanors and felonies. Source: U. S. Bureau of Indian Affairs, "A Follow-up Study of 1963 Recipients of the Services of the Employment Assistance Program, October 1966,
mimeo., pp. 21, 47.
11 This latter figure seems quite high when one considers the relatively low incomes in comparison with non-Indians, and the fact that the schooling expenses are borne by the Indians themselves.
12 Indians apparently have a very high tendency toward being arrested. For example, police records in Denver indicated that about half of the Navajo migrants are arrested at least once during their
stay in the city, with about 95 percent of the arrests alcohol-related (Gravres, 1966).
13 Nationally, drunkenness alone accounts for 71 percent of all Indian arrests (Stewart, 1964).
This content downloaded from 91.229.229.111 on Sun, 15 Jun 2014 05:52:08 AMAll use subject to JSTOR Terms and Conditions
AMERICAN INDIAN MIGRATION 249
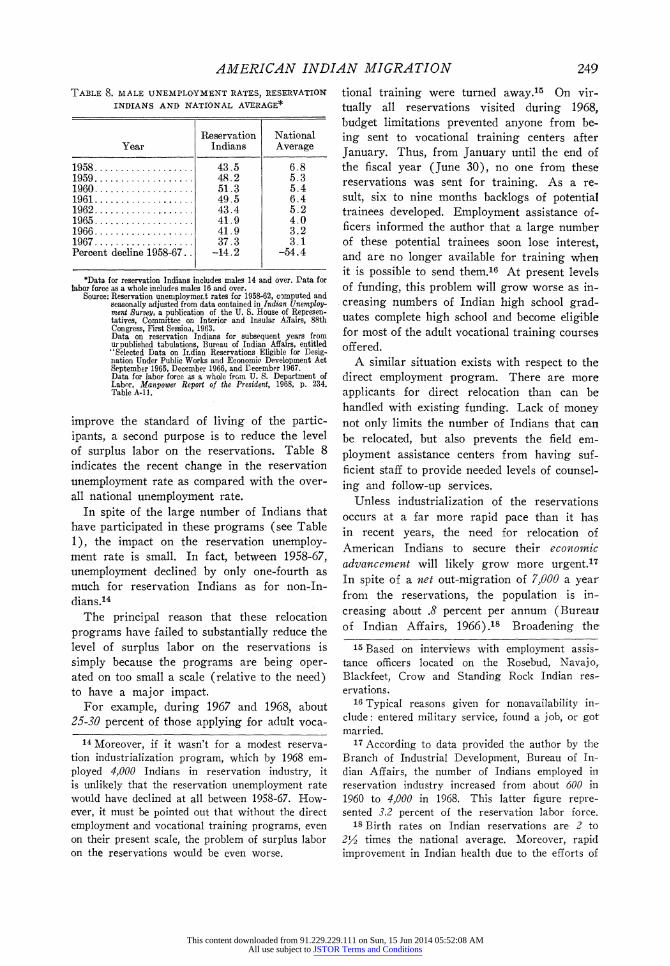
improve the standard of living of the partic- ipants, a second purpose is to reduce the level of surplus labor on the reservations. Table 8 indicates the recent change in the reservation unemployment rate as compared with the over- all national unemployment rate.
In spite of the large number of Indians that have participated in these programs (see Table 1), the impact on the reservation unemploy- ment rate is small. In fact, between 1958-67, unemployment declined by only one-fourth as much for reservation Indians as for non-In- dians.14
The principal reason that these relocation programs have failed to substantially reduce the level of surplus labor on the reservations is simply because the programs are being oper- ated on too small a scale (relative to the need) to have a major impact.
For example, during 1967 and 1968, about 25-30 percent of those applying for adult voca-
tional training were turned away.15 On vir- tually all reservations visited during 1968, budget limitations prevented anyone from be- ing sent to vocational training centers after January. Thus, from January until the end of the fiscal year (June 30), no one from these reservations was sent for training. As a re- sult, six to nine months backlogs of potential trainees developed. Employment assistance of- ficers informed the author that a large number of these potential trainees soon lose interest, and are no longer available for training when it is possible to send them.16 At present levels of funding, this problem will grow worse as in- creasing numbers of Indian high school grad- uates complete high school and become eligible for most of the adult vocational training courses offered.
A similar situation exists with respect to the direct employment program. There are more applicants for direct relocation than can be handled with existing funding. Lack of money not only limits the number of Indians that can be relocated, but also prevents the field em- ployment assistance centers from having suf- ficient staff to provide needed levels of counsel- ing and follow-up services.
Unless industrialization of the reservations occurs at a far more rapid pace than it has in recent years, the need for relocation of American Indians to secure their economic advancement will likely grow more urgent.1 In spite of a net out-migration of 7,000 a year from the reservations, the population is in- creasing about .8 percent per annum (Bureau of Indian Affairs, 1966).18 Broadening the
TABLE 8. MALE UNEMPLOYMENT RATES, RESERVATION
INDIANS AND NATIONAL AVERAGE*
Reservation National Year Indians Average
1958 .................. 43.5 6.8 1959 .................. 48.2 5.3 1960 . * 51.3 1 Q 5.4 1960 ..................4. 5 u 6.4
1961.~~~~~ ~~49.5 6.4 1962 ................. 43.4 5.2 1965 .................. 41.9 4.0 1966 .................. 41.9 3.2 1967 .................. 37.3 3.1 Percent decline 1958-67. -14.2 -54.4
*Data for reservation Indians includes males 14 and over. Data for labor force as a whole includes males 16 and over.
Source: Reservation unemploymert rates for 1958-62, c3mputed and seasonally adjusted from data contained in Indian Unemploy- ment Survey, a publication of the U. S. House of Represen- tatives, Committee on Interior and Insular A]fairs, 88th Congress, First Sessioii, 1963. Data on reservation Indians for subsequent years from urpublished tabulations, Bureau of Indian Affairs, entitled "Selected Data on ILdian Reservations Eligible for Desig- nation Under Public Works and Economic Development Act September 1965, December 1966, and December 1967. Data for labor force as a whole frrm U. S. Department of Labor, Manpower Report of the President, 1968, p. 234. Table A-1 1.
14 Moreover, if it wasn't for a modest reserva- tion industrialization program, which by 1968 em- ployed 4,000 Indians in reservation industry, it is unlikely that the reservation unemployment rate would have declined at all between 1958-67. How- ever, it must be pointed out that without the direct employment and vocational training programs, even on their present scale, the problem of surplus labor on the reservations would be even worse.
15 Based on interviews with employment assis- tance officers located on the Rosebud, Navajo,. Blackfeet, Crow and Standing Rock Indian res- ervations.
16 Typical reasons given for nonavailability in- clude: entered military service, found a job, or got married.
17 According to data provided the author by the Branch of Industrial Development, Bureau of In- dian Affairs, the number of Indians employed in reservation industry increased from about 600 in 1960 to 4,000 in 1968. This latter figure repre- sented 3.2 percent of the reservation labor force.
18 Birth rates on Indian reservations are 2 to 2X2 times the national average. Moreover, rapid improvement in Indian health due to the efforts of
This content downloaded from 91.229.229.111 on Sun, 15 Jun 2014 05:52:08 AMAll use subject to JSTOR Terms and Conditions
250 SOCIAL FORCES
opportunity for American Indian migration for those who wish to relocate would not only mitigate the increasing population pressure, but allow more of the first Americans a chance to participate in the American dream.
CONCLUSIONS
1. As in the case of southern Negroes, the migration of reservation Indians to urban areas is educationally selective; that is, there is a greater tendency for the better educated to mi- grate in comparison with the less educated.
2. Earnings data indicate that a sample of participants in these programs earn on the average more than twice as much (even after adjustment for increasing age and the secular rise in reservation income) for the three years after initial training and relocation, as com- pared to the three years before participation.
3. Earnings of relocatees who remained in the urban areas in which initial employment was secured earned somewhat more than those who returned to the reservation.
4. By 1968, over one-third of a sample of In- dians relocated or trained in 1963 had fur- thered their education by attending night school.
5. A significant decline in antisocial behavior, as measured by the number of arrests was ob- served for a sample of participants in these pro- grams.
6. Lack of funds prevents these programs from being operated on a sufficiently large scale to accommodate all applicants and markedly re- duce the level of surplus labor on the reserva- tions.
REFERENCES Albon, J.
1965 "American Indian Relocation, Problems of Dependency and Management in the City." Phylon 26(Winter) :362-368.
the Public Health Service has lowered the death rate on Indian reservations to approximately the national average.
Cullum, R. 1957 Assisted Navajo Relocation, 1952-56.
Mimeographed. Fein, R.
1965 "Educational Patterns in Southern Mi- gration." Southern Economic Joutrnal 34(July) :106-124.
Graves, T. 1966 "Alternative Models for the Study of Ur-
ban Migration." Human Organization 25 (Winter) :295-299.
Graves, T., and Van Arsdale, M. 1966 "Values, Expectation and Relocation:
The Navajo Migrant to Denver." Hutman Organization 26 (Winter) :300-307.
Hamilton, C. Horace 1959 "Educational Selectivity of Net Migration
from the South. Social Forces 38 (Oc- tober) :33-42.
Martin, H. 1964 "Correlates of Adjustment Among Amer-
ican Indians in An Urban Environment." Human Organization 23(Winter) :290-295.
Mincer, J. 1962 "On the Job Training, Costs, Returns and
Some Implications." Journal of Political Economy 70(October) :50-79.
Price, J. A. 1968 "The Migration and Adaptation of Amer-
ican Indians to Los Angeles." Human Organization 27 ( Summer) :168-175.
Stewart, 0. 1964 "Questions Regarding American Indian
Criminality." Hiumran Organization 23 (Winter) :61-66.
U.S. Bureau of Indian Affairs 1966 "Indian Housing, Needs, Alternatives,
Priorities and Program Recommenda- tions." Mimeographed.
1967 "Selected Reservations Eligible for Des- ignation Under Public Works and Eco- nomic Development Act." Unpublished tabulation.
U.S. Department of Labor 1968 Manpower Report of the Presidentt.
U.S. Public Health Service 1966 Indian Health Highlights.
Weisbrod, Burton 1962 "Education and Investment in Human
Capital." Journal of Political Economy 70 (October) :110-113.
This content downloaded from 91.229.229.111 on Sun, 15 Jun 2014 05:52:08 AMAll use subject to JSTOR Terms and Conditions