Embed Size (px)
Citation preview

Sophos Reporting Interface Creating Reports using Crystal Reports 2008
Sophos Reporting Interface-Using Crystal Reports
1
Creating Reports using Crystal Reports 2008 This document describes how to use Crystal Reports to create reports from data provided by the Sophos Reporting Interface, it consists of the following sections:
Contents 1. Setting up a connection to the reporting interface ........................................................... 1
2. Creating a ‘Top‐5 Virus Threats’ pie Chart ........................................................................ 4
3. Creating a Top Network Threat Report ............................................................................. 9
Note on using Crystal Reports: The Crystal Reports Wizard automatically links columns with identical names between views that have been included in a report. However, some of these connections will need to be removed as similarly named columns don’t necessarily have identical values for a single log event. For example, the InsertedAt column is present in every view and simply denotes when each entry was added to the database. However, a single event may have different InsertedAt times for its corresponding entries in each view. If the Crystal Reports Wizard automatically links these columns, the links must be removed to prevent missing data.
1. Setting up a connection to the reporting interface Step 1 To create a new report open Crystal Reports and select File | New | Standard Report. This opens the ‘Standard Report Creation Wizard’ window. Step 2 Click on ‘Create New Connection’ and then select ‘OLE DB (ADO)’
Sophos Reporting Interface-Using Crystal Reports
2
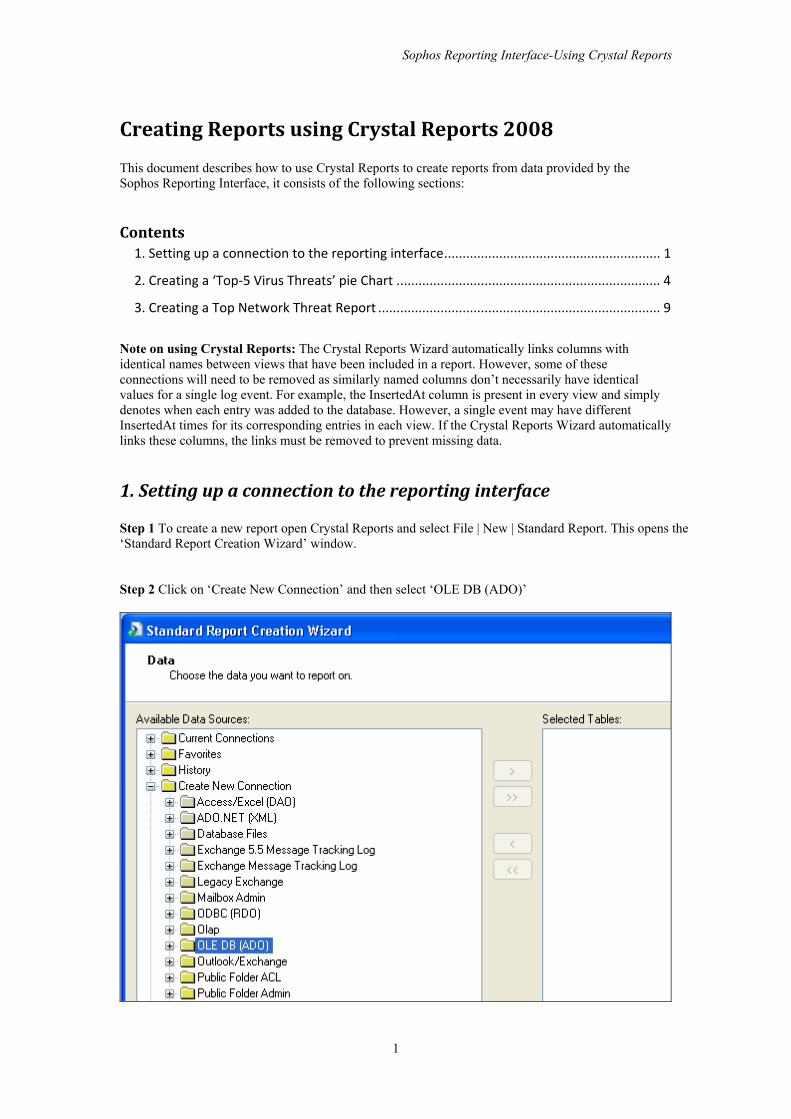
Step 3 In the OLE DB (ADO) dialog box, select ‘Microsoft OLE DB Provider for SQL Server’, then click ‘Next’.
Step 4 Enter the details for the ‘Server:’, the ‘Database:’, and ensure that ‘Integrated Security:’ is checked. Click ‘Next’.
Sophos Reporting Interface-Using Crystal Reports
3
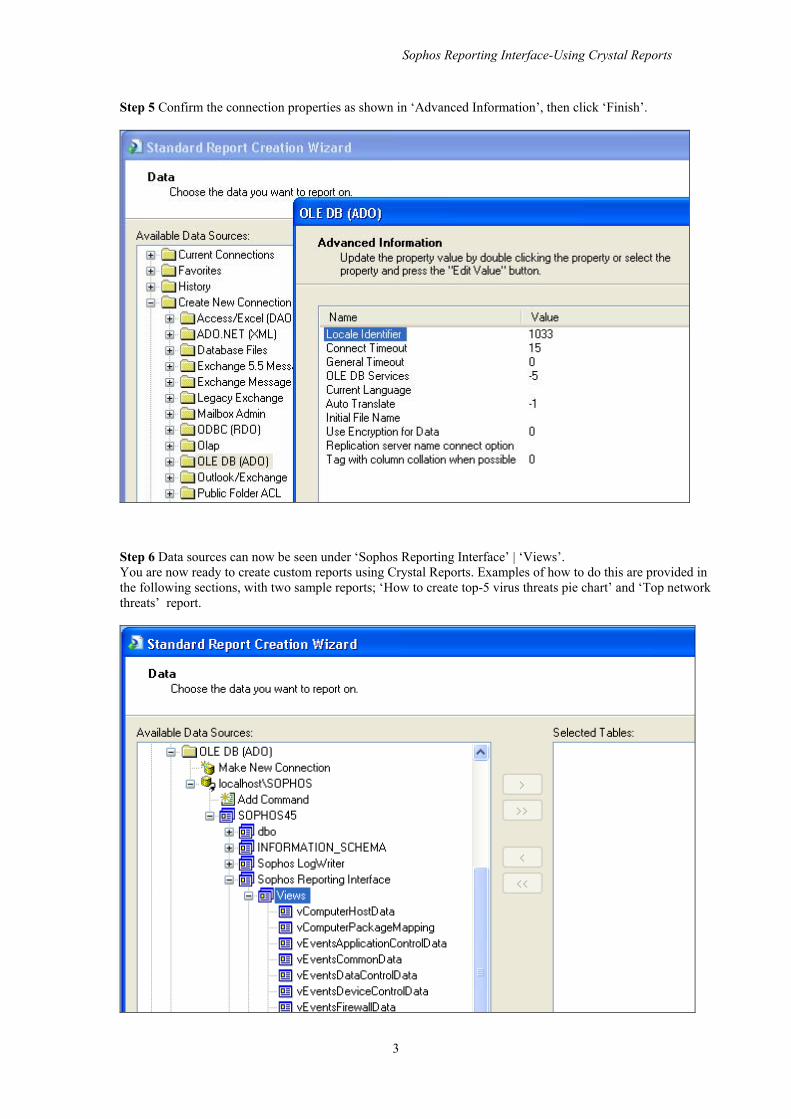
Step 5 Confirm the connection properties as shown in ‘Advanced Information’, then click ‘Finish’.
Step 6 Data sources can now be seen under ‘Sophos Reporting Interface’ | ‘Views’. You are now ready to create custom reports using Crystal Reports. Examples of how to do this are provided in the following sections, with two sample reports; ‘How to create top-5 virus threats pie chart’ and ‘Top network threats’ report.
Sophos Reporting Interface-Using Crystal Reports
4
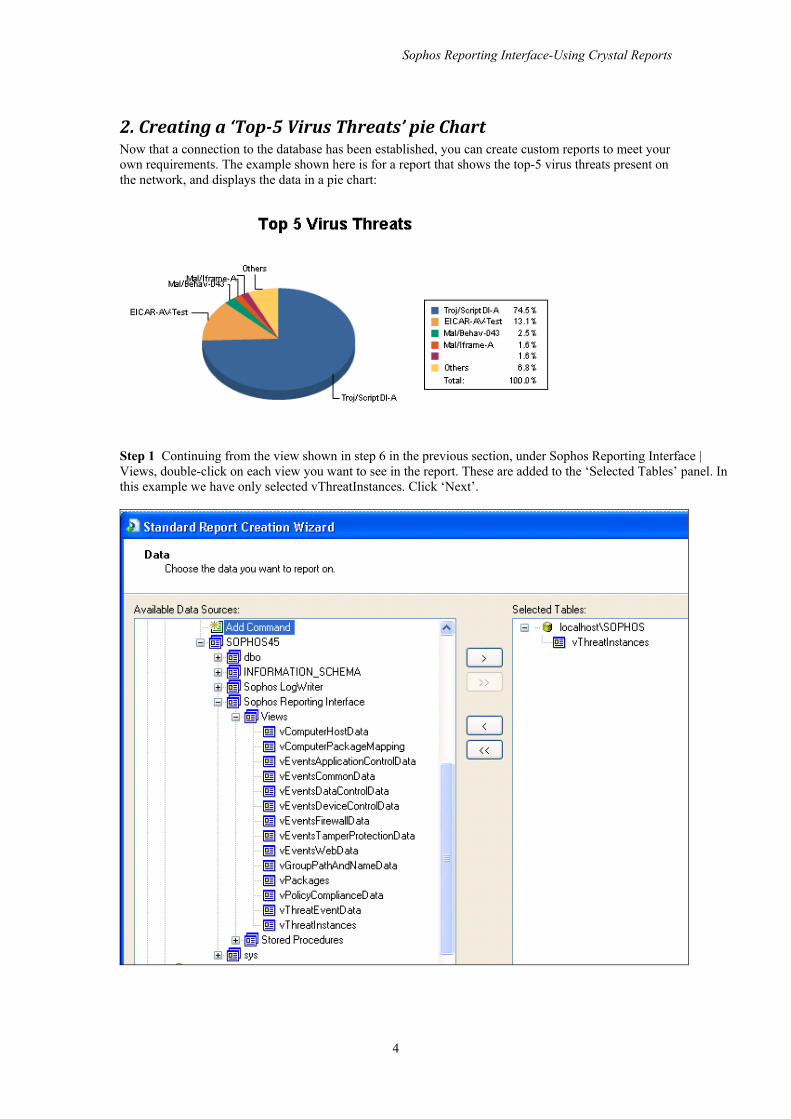
2. Creating a ‘Top-5 Virus Threats’ pie Chart Now that a connection to the database has been established, you can create custom reports to meet your own requirements. The example shown here is for a report that shows the top-5 virus threats present on the network, and displays the data in a pie chart:
Step 1 Continuing from the view shown in step 6 in the previous section, under Sophos Reporting Interface | Views, double-click on each view you want to see in the report. These are added to the ‘Selected Tables’ panel. In this example we have only selected vThreatInstances. Click ‘Next’.
Sophos Reporting Interface-Using Crystal Reports
5
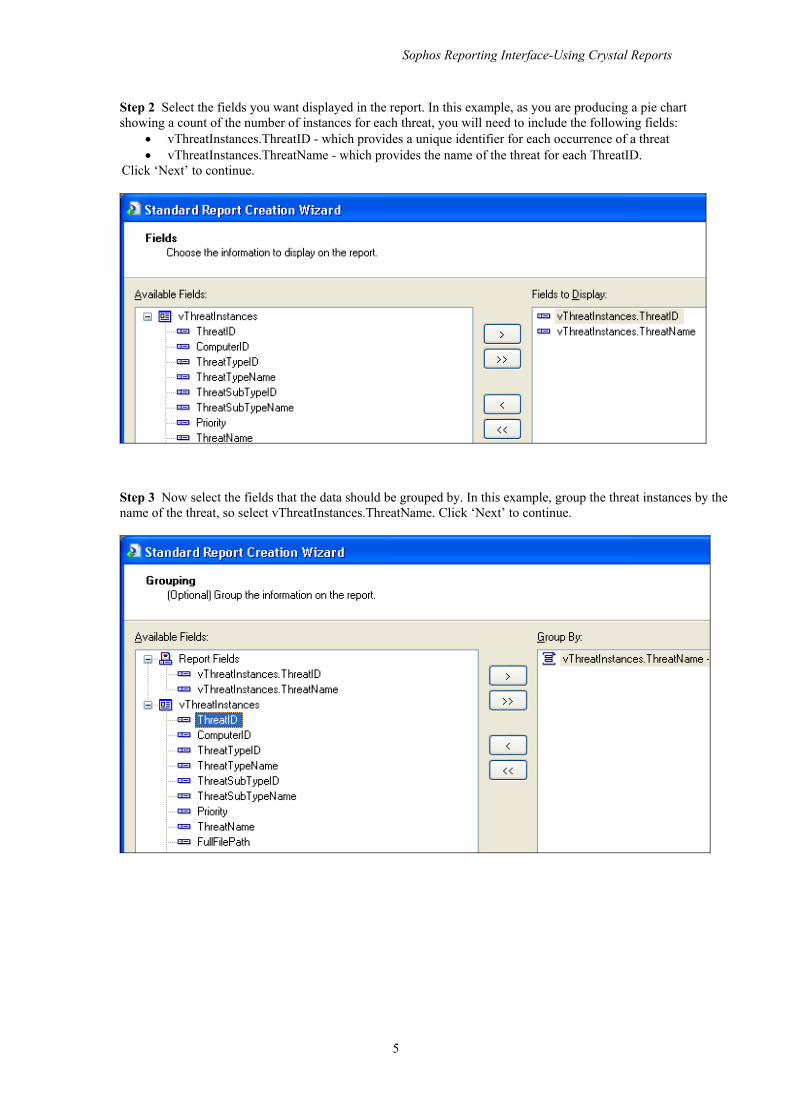
Step 2 Select the fields you want displayed in the report. In this example, as you are producing a pie chart showing a count of the number of instances for each threat, you will need to include the following fields:
• vThreatInstances.ThreatID - which provides a unique identifier for each occurrence of a threat • vThreatInstances.ThreatName - which provides the name of the threat for each ThreatID.
Click ‘Next’ to continue.
Step 3 Now select the fields that the data should be grouped by. In this example, group the threat instances by the name of the threat, so select vThreatInstances.ThreatName. Click ‘Next’ to continue.
Sophos Reporting Interface-Using Crystal Reports
6
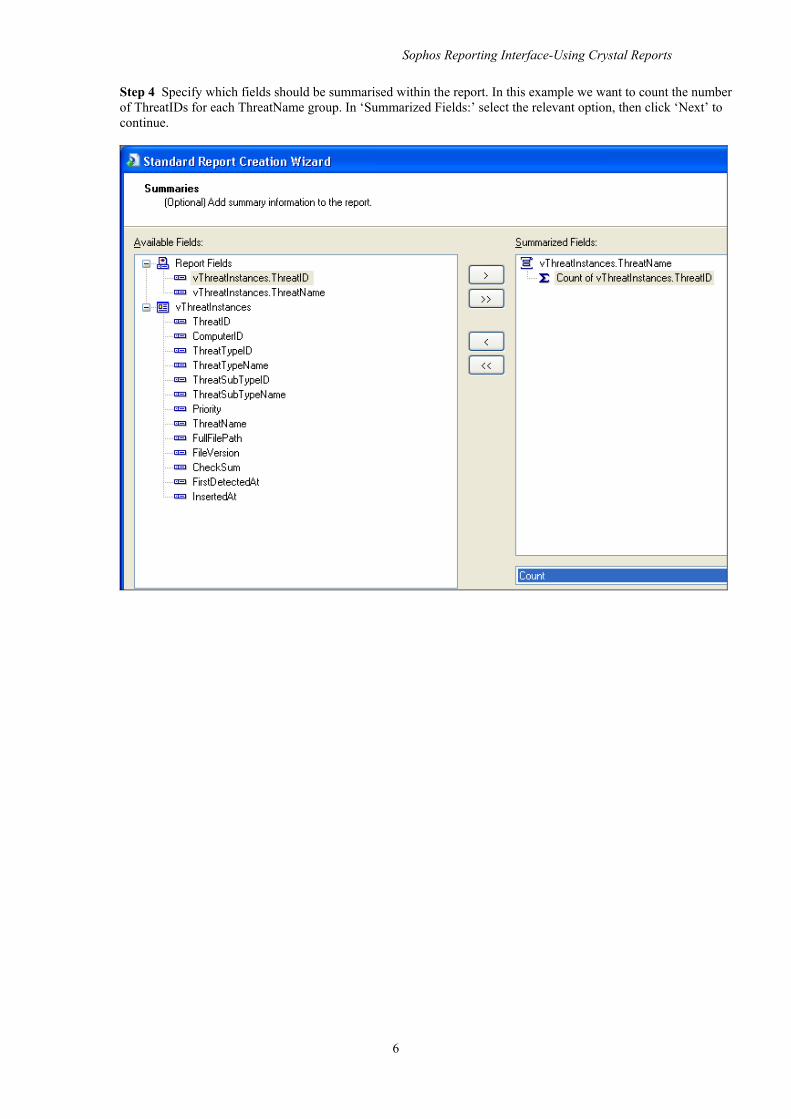
Step 4 Specify which fields should be summarised within the report. In this example we want to count the number of ThreatIDs for each ThreatName group. In ‘Summarized Fields:’ select the relevant option, then click ‘Next’ to continue.
Sophos Reporting Interface-Using Crystal Reports
7
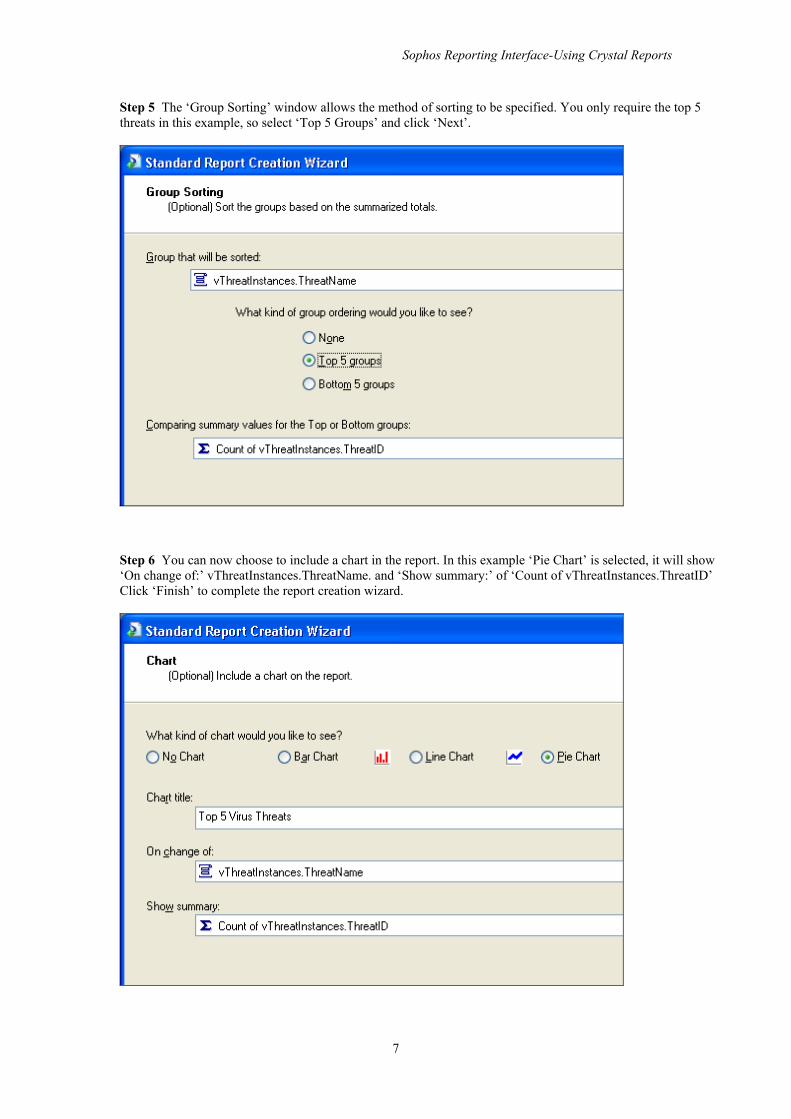
Step 5 The ‘Group Sorting’ window allows the method of sorting to be specified. You only require the top 5 threats in this example, so select ‘Top 5 Groups’ and click ‘Next’.
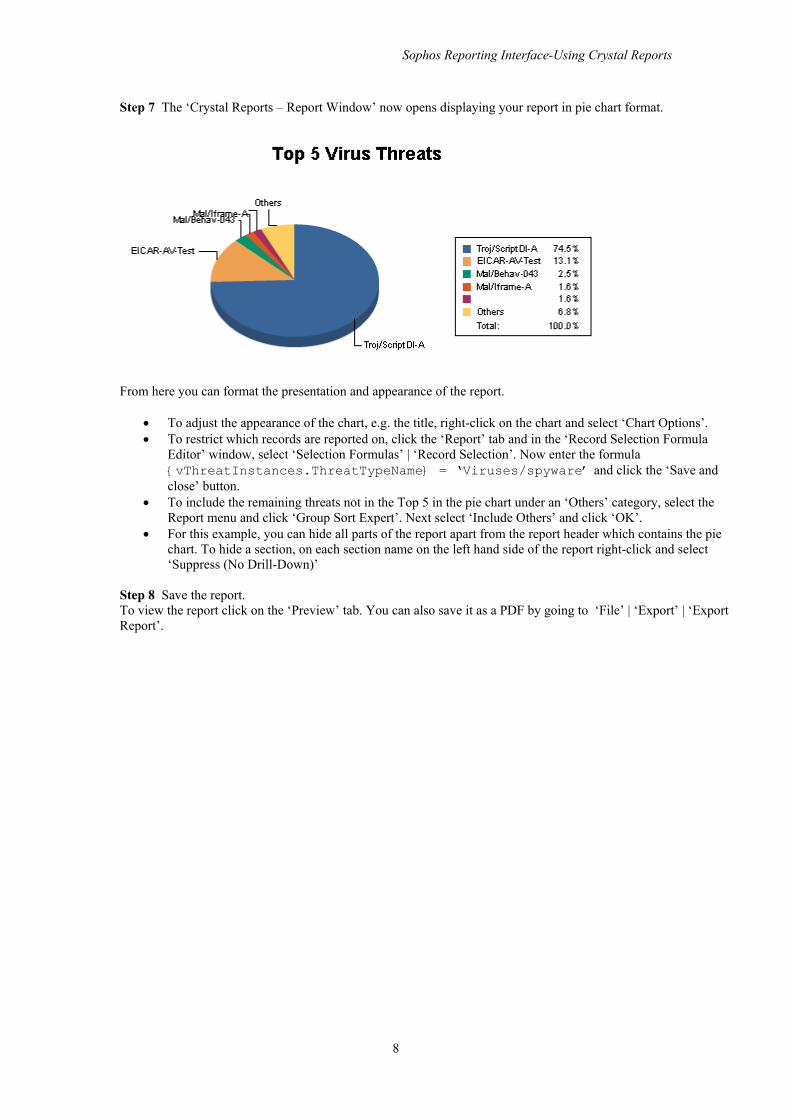
Step 6 You can now choose to include a chart in the report. In this example ‘Pie Chart’ is selected, it will show ‘On change of:’ vThreatInstances.ThreatName. and ‘Show summary:’ of ‘Count of vThreatInstances.ThreatID’ Click ‘Finish’ to complete the report creation wizard.
Sophos Reporting Interface-Using Crystal Reports
8
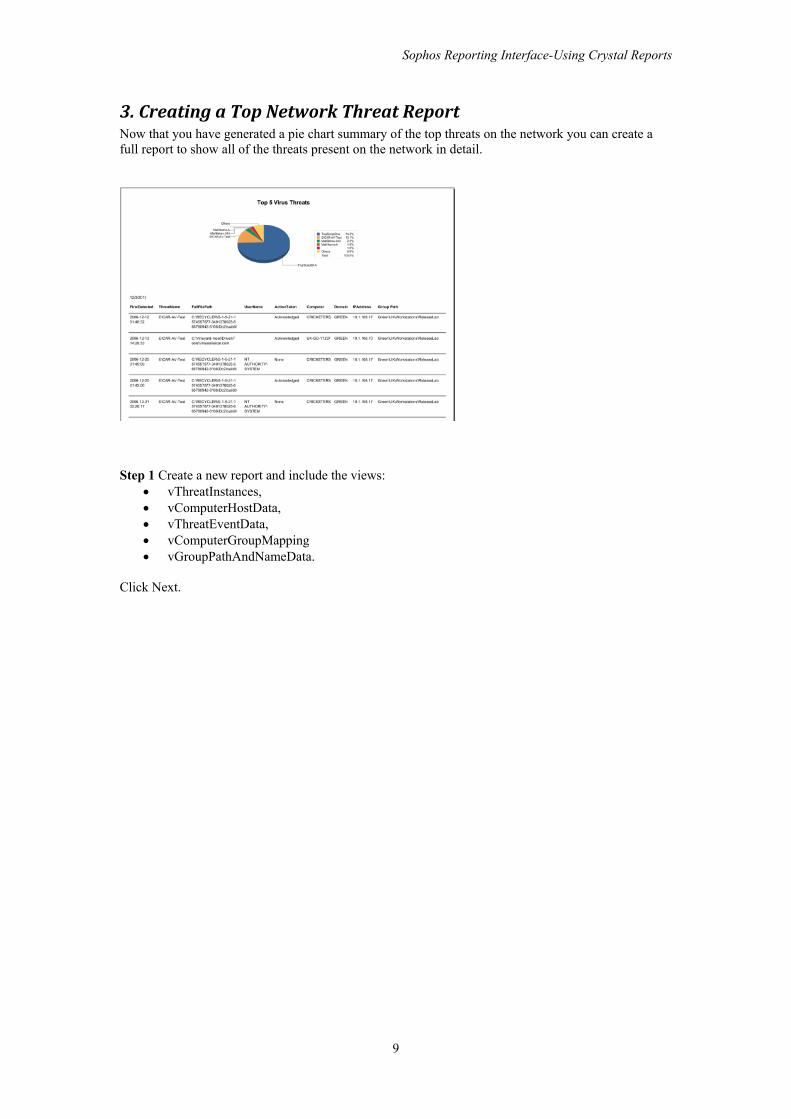
Step 7 The ‘Crystal Reports – Report Window’ now opens displaying your report in pie chart format.
From here you can format the presentation and appearance of the report.
• To adjust the appearance of the chart, e.g. the title, right-click on the chart and select ‘Chart Options’. • To restrict which records are reported on, click the ‘Report’ tab and in the ‘Record Selection Formula
Editor’ window, select ‘Selection Formulas’ | ‘Record Selection’. Now enter the formula {vThreatInstances.ThreatTypeName} = ‘Viruses/spyware’ and click the ‘Save and close’ button.
• To include the remaining threats not in the Top 5 in the pie chart under an ‘Others’ category, select the Report menu and click ‘Group Sort Expert’. Next select ‘Include Others’ and click ‘OK’.
• For this example, you can hide all parts of the report apart from the report header which contains the pie chart. To hide a section, on each section name on the left hand side of the report right-click and select ‘Suppress (No Drill-Down)’
Step 8 Save the report. To view the report click on the ‘Preview’ tab. You can also save it as a PDF by going to ‘File’ | ‘Export’ | ‘Export Report’.
Sophos Reporting Interface-Using Crystal Reports
9
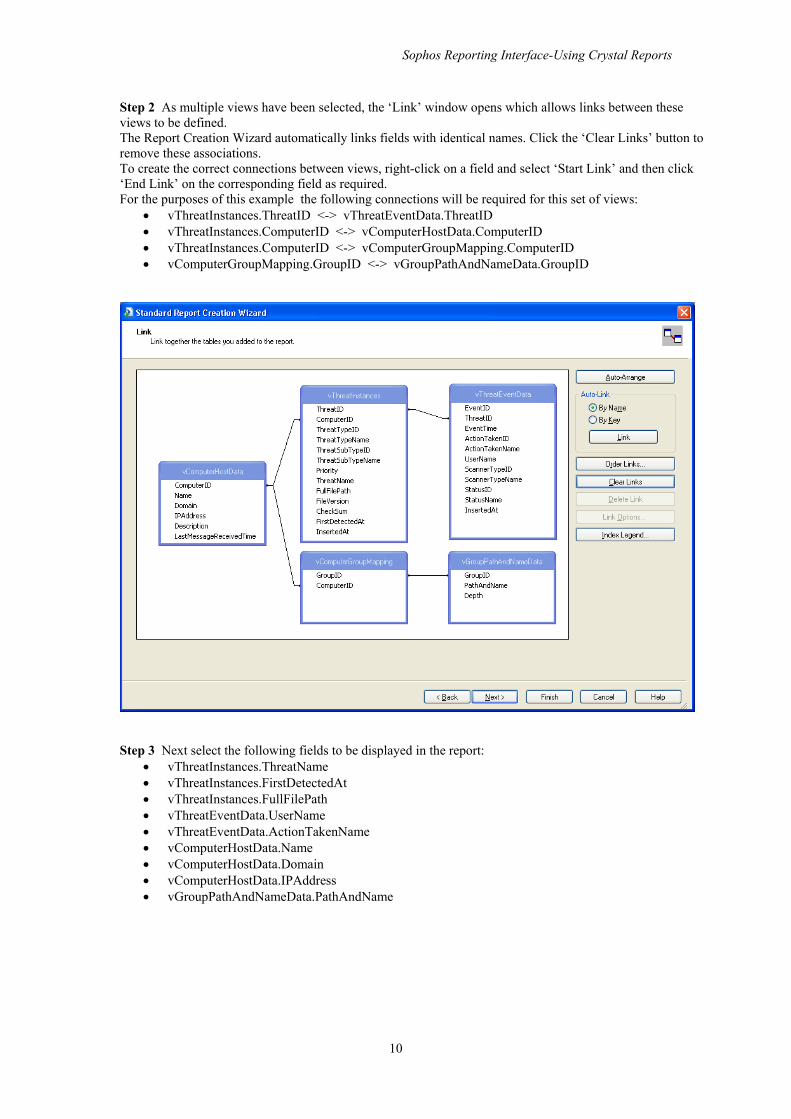
3. Creating a Top Network Threat Report Now that you have generated a pie chart summary of the top threats on the network you can create a full report to show all of the threats present on the network in detail.
Step 1 Create a new report and include the views:
• vThreatInstances, • vComputerHostData, • vThreatEventData, • vComputerGroupMapping • vGroupPathAndNameData.
Click Next.
Sophos Reporting Interface-Using Crystal Reports
10
Step 2 As multiple views have been selected, the ‘Link’ window opens which allows links between these views to be defined. The Report Creation Wizard automatically links fields with identical names. Click the ‘Clear Links’ button to remove these associations. To create the correct connections between views, right-click on a field and select ‘Start Link’ and then click ‘End Link’ on the corresponding field as required. For the purposes of this example the following connections will be required for this set of views:
• vThreatInstances.ThreatID <-> vThreatEventData.ThreatID • vThreatInstances.ComputerID <-> vComputerHostData.ComputerID • vThreatInstances.ComputerID <-> vComputerGroupMapping.ComputerID • vComputerGroupMapping.GroupID <-> vGroupPathAndNameData.GroupID
Step 3 Next select the following fields to be displayed in the report:
• vThreatInstances.ThreatName • vThreatInstances.FirstDetectedAt • vThreatInstances.FullFilePath • vThreatEventData.UserName • vThreatEventData.ActionTakenName • vComputerHostData.Name • vComputerHostData.Domain • vComputerHostData.IPAddress • vGroupPathAndNameData.PathAndName
Sophos Reporting Interface-Using Crystal Reports
11
Step 4 Now that you have a report which lists every virus event, you can now insert the pie chart created in the previous subsection. To do this,
1. Resize the report header section by clicking and dragging on the divider line. 2. From the main menu click ‘Insert’ and select ‘Subreport’. 3. Click the ‘Choose an existing report’ radio button and then select the pie chart file. Click ‘OK’ to
insert the Subreport. Step 5 Given that there are a number of columns present in this report, you can improve its presentation by changing to landscape orientation. To do this, from the ‘File’ menu, select ‘Page Setup’ | ‘Landscape’ | ‘OK’. Crystal Reports provides a number of useful drawing tools which can be used to make the report clearer. Consult the Crystal Reports documentation for more details.