Embed Size (px)
Citation preview
Sources of Industrial Growth in Kenya, Tanzania, Zambia and Zimbabwe : Some Estimates
Elfatih Shaaeldin*
Abstract: This paper utilizes a growth accounting production function approach to analyze the sources of industrial growth in Kenya, Tanzania, Zambia and Zimbabwe. Rates of Total Factor Productivity Growth (TFPG) are calculated for these countries during periods in between 1964 and 1983. The estimates indicate negative growth rates of TFP in Kenya, Tanzania and Zam- bia. For Zimbabwe the growth rate of TFP is found to be positive but insig- nificant. Hence, for all of these countries increase in factor inputs mostly accounts for manufacturing growth. By comparison studies for developed countries and some developing countries showed a relatively unimportant contribution from increased inputs and a significant contribution from TFPG. The paper, then considers some of the proximate causes of the poor perfor- mance in TFPG in the countries - studied. The roles of changes of capacity utilization, market size, macro-economic policies, market structures, level of development of technological capability are analyzed.
Resume: Pour etudier les sources de croissance industrielle au Kenya, en Tanzanie, en Zambie et au Zimbabwe, nous avons utilise dans cet ouvrage la methode de la formation de production appliquee a la croissance, le taux de croissance du facteur de la productivite globale (T.F.P.G.) sont calculees sur une periode allant de 1964 a 1983 pour ces pays. Pour le Zimbabwe le taux de croissance du T.F.P.G. est positif mais n’a aucune signification. Donc, pour tous ces pays une croissance de facteur des moyens de production influe en grande partie sur la croissance industrielle. En comparant des etudes faites sur les pays developpes avec celles faites sur les pays en developpement nous constatons que la contribution de l’augmentation des facteurs de production est relativement negligeable, mais celle du T.F.P.G. est significative. Puis, dans ce document nous considererons les causes approximatives de la performance nulle du T.F.P.G. dans ces pays etudies. Puis nous analyserons les variations de la capa- cite d‘exploitation, des tailles du marche, des politiques macro-economiques, des structures du marche, du niveau de developpement des capacites techno- logiques.
*The author, a graduate of the State University of New York at Buffalo, is an econ- omist in the Development Research and Policy Department of the African Development Bank. The author acknowledges with gratitude comments on an early version of this paper by several colleagues.
0 1989 by African Development Bank / Banque africaine de developpement
22 AFRICAN DEVELOPMENT REVIEW
Introduction
Industrial growth results from an increase in factor inputs and increases in the efficiency with which these are used, so that conceptually a rise in industrial output may be decomposed into that due to greater resource use and that reflecting productivity gains. Productivity is measured by the relationship between inputs and output. The impact of all inputs taken together is captured by Total Factor Productivity Growth (TFPG), where this is defined as the difference between the rates of growth of output and that of a weighted sum of factor inputs, including labour and capital stock. TFPG thus gives insight into the sources of industrial growth. It reflects changes in efficiency through time and captures technical progress, improvement in industrial organization, exter- nal and scale economies. It can be used in comparative studies. Differences in TFPG rates reflect changes in competitiveness between and within coun- tries.
Against this background, the main purpose of this paper is to provide an analysis of the sources of industrial growth in selected African countries namely Kenya, Tanzania, Zambia and Zimbabwe. This is done within the framework of a growth accounting production function approach. Section 2 gives a descrip- tion of the model. The concept of TFPG is introduced and a formula for its calculation is derived. The interpretation of results and limitations of the approach are then discussed and the estimates of TFPG and factor accumula- tion reported. A tentative attempt is then made to identity some of the hypo- theses to which TFPG may directly or indirectly be linked. Some policy implications of the results are subsequently discussed.
Theoretical Framework
Growth accounting models have been extensively used to explain the sources of growth in developed countries'. Few such studies have been made for developing countries and hardly any for Africa 2. In this section a production- function version of these models is described and a formula for estimating TFPG derived 3. This provides an analytical framework for segregating varia- tions in manufacturing output due to changes in inputs from those due to technical change or total productivity.
Various factors account for industrial growth. Abstracting from demand and so assuming that in the long-run supply factors are dominant, growth in output could be viewed as a function of the growth in factors of production and of
For a survey of these studies see Angus Maddison (1987), William Baumol and
For a survey of studies for developing countries see Thirlwall(l983). Most of the
For a survey of approaches to the measurement of TFPG, see W.E. Diewert
Kenneth McLennan (1985) and Thirlwall (1983).
studies for African countries were undertaken by the staff of the World Bank.
( 1 980).
REVUE AFRICAINE DE DEVELOPPEMENT 23
TFPG. The latter - as defined earlier - is the difference between the rate of growth of output and those of inputs appropriately weighted. In this sub-section we define the concept of TFPG more sharply and derive a formula for estima- tion by manipulating the input-output relationships at the level of the manu- facturing sector.
We assume the existence of a differential production function relating man- ufacturing output (Q) to capital (K), Labour (L) and a given parameter (A) which stands for other factors including technical change. (This could be a Cobb-Douglas production function). Assuming the shifts in the production function are (Hicks) neutral in the sense that they affect the level of output but not the marginal rates of substitution between inputs, the production function could be written in a general form as follows:
Q = A(t) f(K,L) (1) A(t) measures the cumulated effects of shifts in the isoquant over time.
Totally differentiating (1) with respect to time and dividing by Q, yields,
Q/Q = A/A+A .6f/6K . K/Q+A . 6F/6L. L/Q (2) where dots denote time derivatives.
Assuming labour and capital are paid their respective marginal products and defining the share of labour and capital respectively as:
sl = 6Q/6L . L/Q sk = 6Q/6K . K/Q, one obtains Q/Q = A/Q = A/A+sK. K/K+sl . L/L (3)
Rearranging (3), one obtains :
A/A = Q/Q - (sk . R/K + sl . L/L) (4) The right hand side of equation (4) is the difference between the percentage
change in output and the percentage change in inputs weighted by sk and sl. This is equal to A/A, which is the TFPG.
In practice, discrete time counterparts must replace the continuous growth rates derived above. To estimate the rates of growth of TFPG one needs growth rates of manufacturing output (Q), capital (K), labour (L) and estimates of capital and labour shares.
The growth accounting production function approach enables us to decom- pose the sources ofgrowth into factor increases and TFPG. Equation 3 provides a formula for calculating the relative importance of the growth of labour, capital and TFPG in output growth. This by itself is useful. Thus studies for developed countries show the relative unimportance of capital compared with other var- iables. Similarly quantifying the contribution of TFPG could be a useful first step in expiaining its role in output expansion.
24 AFRICAN DEVELOPMENT REVIEW
However, since TFPG is derived as a residual (from equation 4) it can be viewed as a ‘some sort of measure of our ignorance about the causes of econ- omic growth, (accounting for) a hodge-podge of factors that are difficult to surmount’. (Nelson, 1981, p. 1035). Nevertheless it can be suggestive in pointing to certain factors that need close examination. These include technical progress and efficiency gains (though not levels of efficiency). An increase in output which is more than proportionate to an increase in a weighted average ot inputs reflects disembodied technical progress, improvement in industrial organization, economies of scale or external economies. Fluctuations in TFGP may also result from changes in rates of capacity utilization.
The approach is constrained by the fact that it has ‘limited causal depth’ (Nelson, 198 1 p. 1035). ‘It deals with proximate rather than ultimate causality’ (Maddison, 1987, p. 651). Changes in factors of production and technical progress are treated as exogenous although in practice ‘the supply of most resources to an economic system is endogenous, responding to the demand for them’. (Thirlwall, 1983, p. 62). Thus, this approach ‘does not explain the elements of policy or circumstance, national or international, that underlie them’ (Maddision, p. 65 1) - or in other words it does not ‘discern broad factors or conditions that foster or hinder a generally stimulating environnment ’ (Nel- son 1981).
In addition to this fundamental methodological limitation, the production- function approach used above has several other drawbacks. First, if the assumption of neutrality of technical progress is not maintained there is bound to be difficulties in seperately identifying the effects of technical progress and changes in factor inputs. Neutral technical progress is reflected in shifts in the production function. When technical progress is not neutral it affects factor intensities. Thus the distinction between the contribution of factor inputs and total productivity growth is blurred. Second, if physical investment becomes a major vehicle of technical progress, the estimates of TFPG from equation 4 will be biased. This is so because of the existence of embodied technical progress which is not captured when capital is measured at constant prices. Third, a related problem arises from qualitative improvements in the labour input. Solow admitted that ‘a lot of what appears as shifts in the production function must represent improvement in the quality of the labour input, and therefore a result of real capital formation of an important kind’ (Solow, 1957, p. 329). To ignore these qualitative improvements will bias the results. Fourth, the general functional form used is assumed to be homogenous of degree one. This implies an assumption of constant returns to scale. Solow (1957) considered this assumption practically unavoidable and many other researchers followed his suit. Yet, it is evident that increasing economies of scale contribute significantly to output growth. Empirical evidence for the importance of scale economies is established as in Kwon, (1 986) and M. Brown and J. Popkin, (1962). Fifth, ‘an important empirical problem is that as derived, (TFPG) is a residual, thereby rendering estimates sensitive to errors of measurement in inputs and outputs and factor shares’ (Krueger and Tuncar 1980). Errors can result from inade- quate or inconsistent data. Prblems of aggregation and appropriate measures of
REVUE AFRICAINE DE DEVELOPPEMENT 25
capital and labour are numerous. Especially in the case of Africa data incon- sistency and other weaknesses are widespread.
Notwithstanding these limitations, the model provides an analytical frame- work which yields rough preliminary estimates of the contribution of labour, capital and the residual. After all, an awareness of the proximate causes could be a starting point for a search for the deeper determinants of growth. This optimistic view is encouraged by the fact that empirical tests of the assumption of neutrality of technical progress have confirmed its validity. (Thirlwall, 1983 and Solow, 1957). It is true that the other limitations mentioned above are likely to result in biases. The likelihood, however, of embodied technical progress, improvement in labour input and increasing economies of scale do not signif- icantly affect the argument of this paper, as explained below 3. Data limitations made it difficult to adjust for the quality of inputs. For this and other reasons our findings are to be regarded as first steps in what should be an ongoing process.
Industrial Expansion, Factor Accumulation and Productivity Growth
Initial economic conditions in post-independent Africa were characterized by limited levels of infrastructural and industrial development. Agriculture and in few cases mining predominated. The small industrial base which developed during the colonial era consisted of a few agro-processing and consumer goods industries. The post-independence governments were thus faced with the urgent need to establish the social, physical and technological infrastructures necessary for industrialization. Simultaneously, they embarked on ambitious programmes of industrialization which had been viewed as essential for attain- ing rapid and substained growth.
Some salient characteristics of the subsequent industrial development are captured in Table 1, with the data reflecting availability as well as purposive choice. They nevertheless show the rate of growth of real manufactured output in each of the four countries for something approaching the first two, post- independence, decades. As a first step to interpreting these, the data also cover the growth of factor inputs. In each country figures are given for a whole period ranging from 14 to 19 years and for two sub-periods defined by these boundaries and the year 1973.
Before considering the evidence, it is convenient to note that though all four countries assigned priority to industrialization, and consequently encouraged rapid capital formation in manufacturing industry, they differed in initial economic structure, domestic market size and nature of industrializing agents. Kenya and Tanzania were part of the East African Economic Community together with Uganda. Zimbabwe and Zambia were members of the Federation of Rhodesia and Nyasaland, as was Malawi.
26 AFRICAN DEVELOPMENT REVIEW
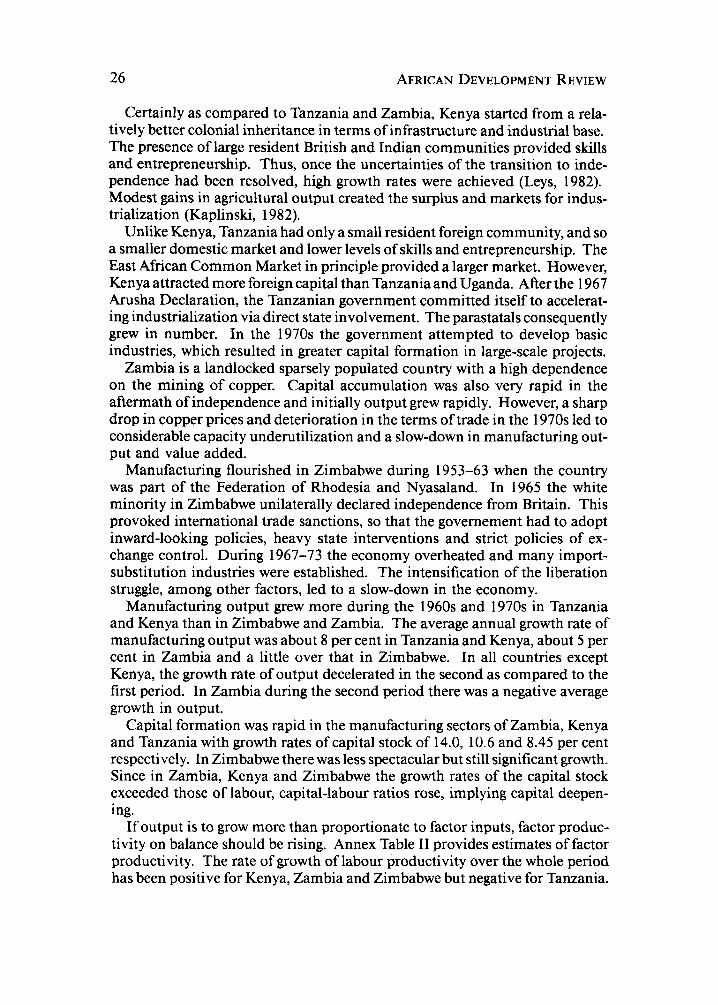
Certainly as compared to Tanzania and Zambia, Kenya started from a rela- tively better colonial inheritance in terms of infrastructure and industrial base. The presence of large resident British and Indian communities provided skills and entrepreneurship. Thus, once the uncertainties of the transition to inde- pendence had been resolved, high growth rates were achieved (Leys, 1982). Modest gains in agricultural output created the surplus and markets for indus- trialization (Kaplinski, 1982).
Unlike Kenya, Tanzania had only a small resident foreign community, and so a smaller domestic market and lower levels of skills and entrepreneurship. The East African Common Market in principle provided a larger market. However, Kenya attracted more foreign capital than Tanzania and Uganda. After the 1967 Arusha Declaration, the Tanzanian government committed itself to accelerat- ing industrialization via direct state involvement. The parastatals consequently grew in number. In the 1970s the government attempted to develop basic industries, which resulted in greater capital formation in large-scale projects.
Zambia is a landlocked sparsely populated country with a high dependence on the mining of copper. Capital accumulation was also very rapid in the aftermath of independence and initially output grew rapidly. However, a sharp drop in copper prices and deterioration in the terms of trade in the 1970s led to considerable capacity underutilization and a slow-down in manufacturing out- put and value added.
Manufacturing flourished in Zimbabwe during 1953-63 when the country was part of the Federation of Rhodesia and Nyasaland. In 1965 the white minority in Zimbabwe unilaterally declared independence from Britain. This provoked international trade sanctions, so that the governement had to adopt inward-looking policies, heavy state interventions and strict policies of ex- change control. During 1967-73 the economy overheated and many import- substitution industries were established. The intensification of the liberation struggle, among other factors, led to a slow-down in the economy.
Manufacturing output grew more during the 1960s and 1970s in Tanzania and Kenya than in Zimbabwe and Zambia. The average annual growth rate of manufacturing output was about 8 per cent in Tanzania and Kenya, about 5 per cent in Zambia and a little over that in Zimbabwe. In all countries except Kenya, the growth rate of output decelerated in the second as compared to the first period. In Zambia during the second period there was a negative average growth in output.
Capital formation was rapid in the manufacturing sectors of Zambia, Kenya and Tanzania with growth rates of capital stock of 14.0, 10.6 and 8.45 per cent respectively. In Zimbabwe there was less spectacular but still significant growth. Since in Zambia, Kenya and Zimbabwe the growth rates of the capital stock exceeded those of labour, capital-labour ratios rose, implying capital deepen- ing.
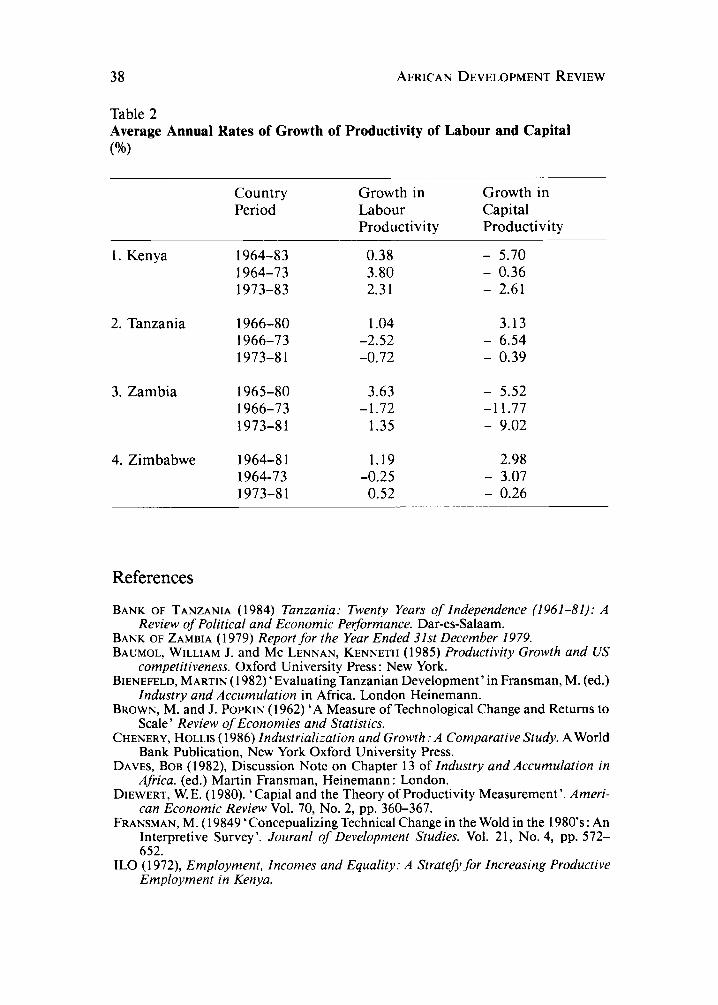
If output is to grow more than proportionate to factor inputs, factor produc- tivity on balance should be rising. Annex Table I1 provides estimates of factor productivity. The rate of growth of labour productivity over the whole period has been positive for Kenya, Zambia and Zimbabwe but negative for Tanzania.
REVUE AFRICAINE DE DEVELOPPEMENT 27
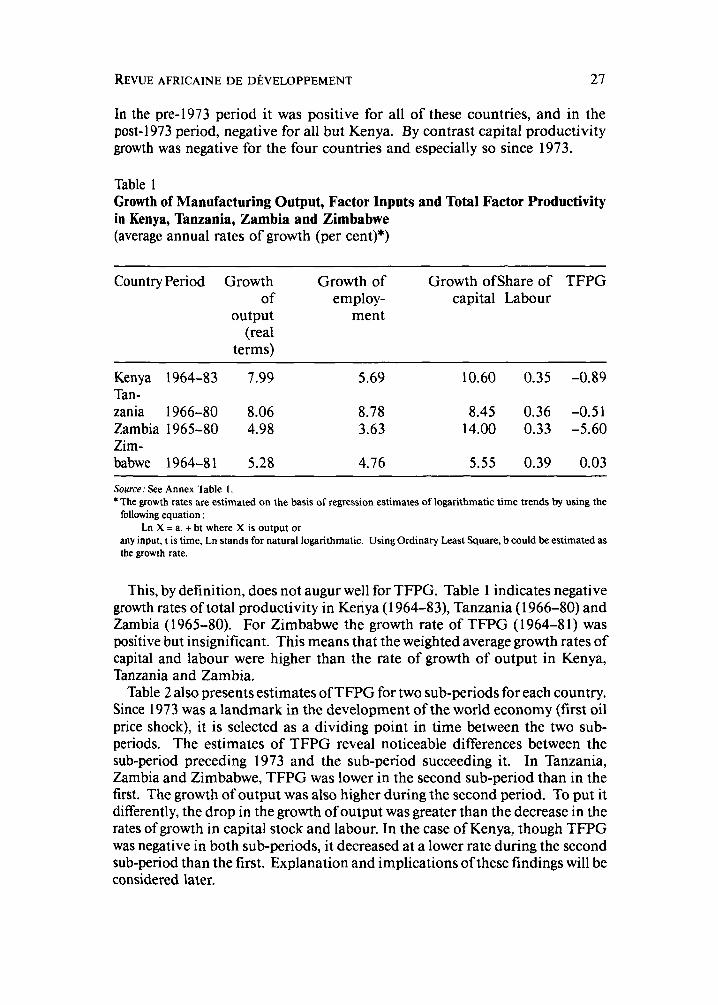
In the pre-1973 period it was positive for all of these countries, and in the post-1 973 period, negative for all but Kenya. By contrast capital productivity growth was negative for the four countries and especially so since 1973.
Table 1 Growth of Manufacturing Output, Factor Inputs and Total Factor Productivity in Kenya, Tanzania, Zambia and Zimbabwe (average annual rates of growth (per cent)*)
Country Period Growth Growth of Growth ofshare of TFPG of employ- capital Labour
output ment (real
terms)
Kenya 1964-83 7.99 5.69 10.60 0.35 -0.89
zania 1966-80 8.06 8.78 8.45 0.36 -0.51 Zambia 1965-80 4.98 3.63 14.00 0.33 -5.60
Tan-
Zim- babwe 1964-81 5.28 4.76 5.55 0.39 0.03
Source: See Annex Table I . *The growth rates are estimated on the basis of regression estimates of logarithmatic time trends by using the
following equation :
any input, t is time, Ln stands for natural logarithmatic. Using Ordinary Least Square, b could be estimated as the growth rate.
Ln X = a. + bt where X is output or
This, by definition, does not augur well for TFPG. Table 1 indicates negative growth rates of total productivity in Kenya (1 964-83), Tanzania ( 1966-80) and Zambia ( 1965-80). For Zimbabwe the growth rate of TFPG ( 1964-8 1) was positive but insignificant. This means that the weighted average growth rates of capital and labour were higher than the rate of growth of output in Kenya, Tanzania and Zambia.
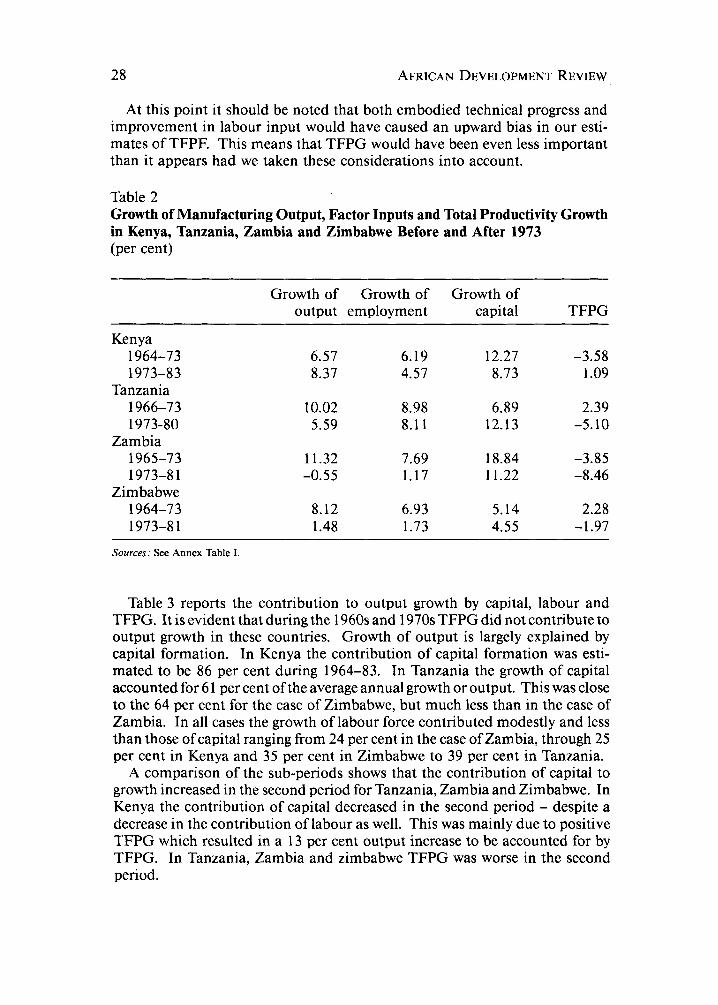
Table 2 also presents estimates ofTFPG for two sub-periods for each country. Since 1973 was a landmark in the development of the world economy (first oil price shock), it is selected as a dividing point in time between the two sub- periods. The estimates of TFPG reveal noticeable differences between the sub-period preceding 1973 and the sub-period succeeding it. In Tanzania, Zambia and Zimbabwe, TFPG was lower in the second sub-period than in the first. The growth of output was also higher during the second period. To put it differently, the drop in the growth of output was greater than the decrease in the rates of growth in capital stock and labour. In the case of Kenya, though TFPG was negative in both sub-periods, it decreased at a lower rate during the second sub-period than the first. Explanation and implications of these findings will be considered later.
28 AFRICAN DEVELOPMENT REVIEW
At this point it should be noted that both embodied technical progress and improvement in labour input would have caused an upward bias in our esti- mates of TFPF. This means that TFPG would have been even less important than it appears had we taken these considerations into account.
Table 2 Growth of Manufacturing Output, Factor Inputs and Total Productivity Growth in Kenya, Tanzania, Zambia and Zimbabwe Before and After 1973 (per cent)
Growth of Growth of Growth of output employment capital TFPG
Kenya 1964-73 1973-83
Tanzania 1966-73 1973-80
Zambia 1965-73 1973-8 1
Zimbabwe 1964-73 1973-8 1
6.57 8.37
10.02 5.59
11.32 -0.55
8.12 1.48
6.19 4.57
8.98 8.1 1
7.69 1.17
6.93 1.73
12.27 8.73
6.89 12.13
18.84 11.22
5.14 4.55
-3.58 1.09
2.39 -5.10
-3.85 -8.46
2.28 -1.97
Sources: See Annex Table I.
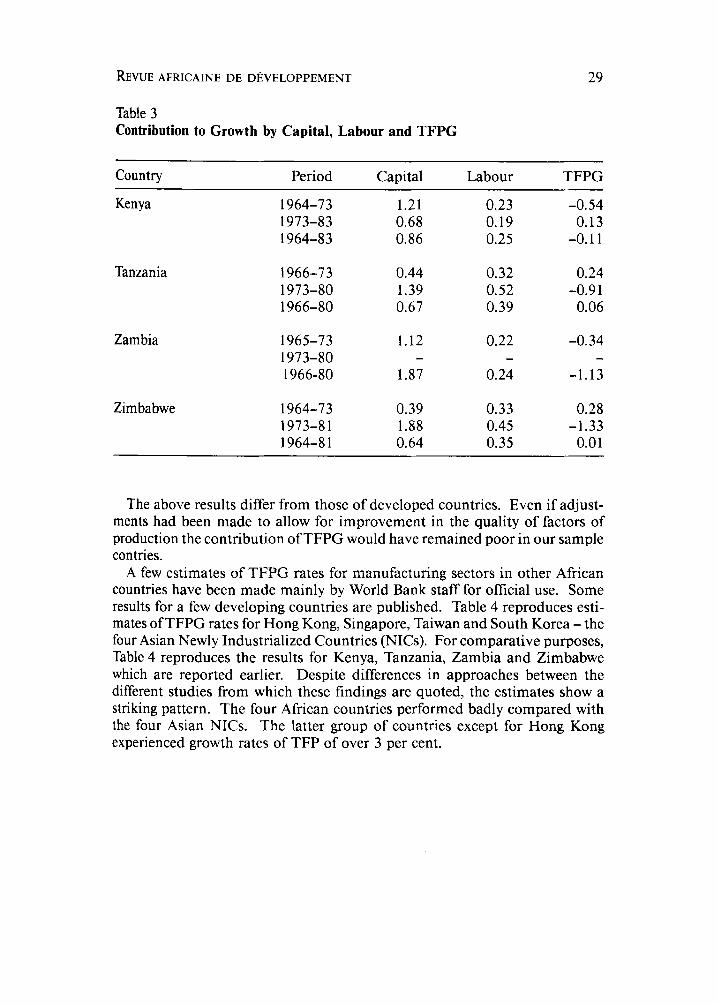
Table 3 reports the contribution to output growth by capital, labour and TFPG. It is evident that during the 1960s and 1970s TFPG did not contribute to output growth in these countries. Growth of output is largely explained by capital formation. In Kenya the contribution of capital formation was esti- mated to be 86 per cent during 1964-83. In Tanzania the growth of capital accounted for 6 1 per cent ofthe average annual growth or output. This was close to the 64 per cent for the case of Zimbabwe, but much less than in the case of Zambia. In all cases the growth of labour force contributed modestly and less than those of capital ranging from 24 per cent in the case of Zambia, through 25 per cent in Kenya and 35 per cent in Zimbabwe to 39 per cent in Tanzania.
A comparison of the sub-periods shows that the contribution of capital to growth increased in the second period for Tanzania, Zambia and Zimbabwe. In Kenya the contribution of capital decreased in the second period - despite a decrease in the contribution of labour as well. This was mainly due to positive TFPG which resulted in a 13 per cent output increase to be accounted for by TFPG. In Tanzania, Zambia and Zimbabwe TFPG was worse in the second period.
REVUE AFRICAINE DE DEVELOPPEMENT 29
Table 3 Contribution to Growth by Capital, Labour and TFPG
Country Period Capital Labour TFPG
Kenya
Tanzania
Zambia
Zimbabwe
1964-73 1973-83 1964-83
1966-73 1973-80 1966-80
1965-73 1973-80 1966-80
1964-73 1973-8 1 1964-8 1
1.21 0.68 0.86
0.44 1.39 0.67
1.12
1.87 -
0.39 1.88 0.64
0.23 0.19 0.25
0.32 0.52 0.39
0.22
0.24 -
0.33 0.45 0.35
-0.54 0.13
-0.1 1
0.24
0.06 -0.9 1
-0.34 -
-1.13
0.28 -1.33
0.01
The above results differ from those of developed countries. Even if adjust- ments had been made to allow for improvement in the quality of factors of production the contribution of TFPG would have remained poor in our sample contries.
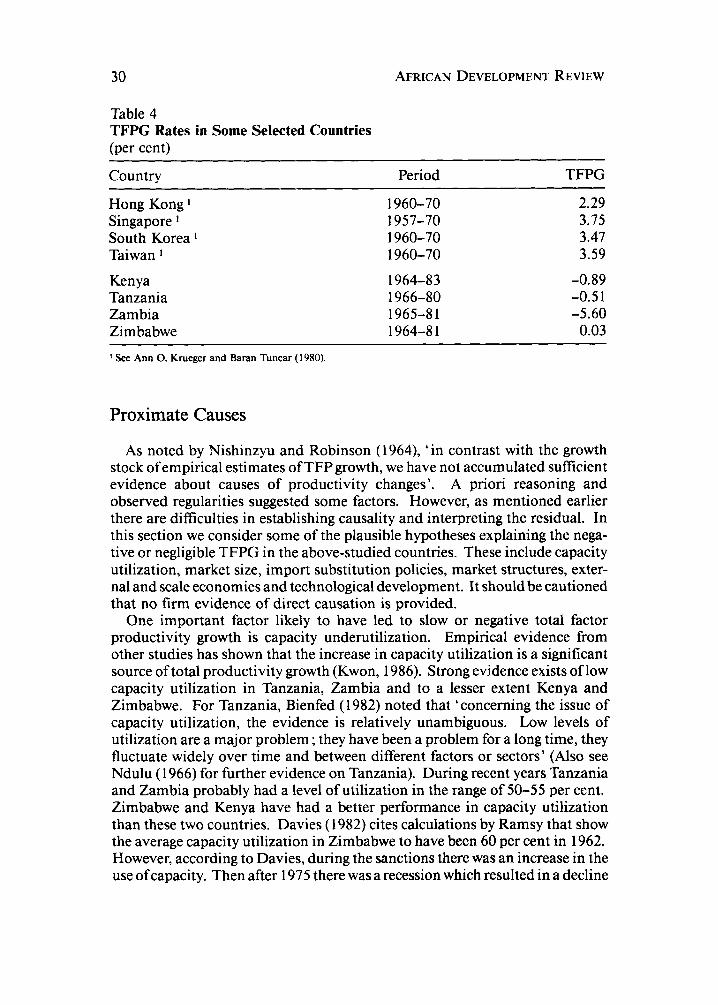
A few estimates of TFPG rates for manufacturing sectors in other African countries have been made mainly by World Bank staff for official use. Some results for a few developing countries are published. Table 4 reproduces esti- mates of TFPG rates for Hong Kong, Singapore, Taiwan and South Korea - the four Asian Newly Industrialized Countries (NICs). For comparative purposes, Table 4 reproduces the results for Kenya, Tanzania, Zambia and Zimbabwe which are reported earlier. Despite differences in approaches between the different studies from which these findings are quoted, the estimates show a striking pattern. The four African countries performed badly compared with the four Asian NICs. The latter group of countries except for Hong Kong experienced growth rates of TFP of over 3 per cent.
30 AFRICAN DEVELOPMENT REVIEW
Table 4 TFPG Rates in Some Selected Countries (per cent)
Country Period TFPG
Hong Kong Singapore South Korea I
Taiwan I
Kenya Tanzania Zambia Zimbabwe
1960-70 1957-70 1960-70 1960-70
1964-83 1966-80 1965-8 1 1964-8 1
2.29 3.75 3.47 3.59
-0.89 -0.51 -5.60
0.03
I See Ann 0. Krueger and Baran Tuncar (1 980).
Proximate Causes
As noted by Nishinzyu and Robinson (1964), ‘in contrast with the growth stock of empirical estimates of TFP growth, we have not accumulated sufficient evidence about causes of productivity changes’. A priori reasoning and observed regularities suggested some factors. However, as mentioned earlier there are difficulties in establishing causality and interpreting the residual. In this section we consider some of the plausible hypotheses explaining the nega- tive or negligible TFPG in the above-studied countries. These include capacity utilization, market size, import substitution policies, market structures, exter- nal and scale economies and technological development. It should be cautioned that no firm evidence of direct causation is provided.
One important factor likely to have led to slow or negative total factor productivity growth is capacity underutilization. Empirical evidence from other studies has shown that the increase in capacity utilization is a significant source of total productivity growth (Kwon, 1986). Strong evidence exists of low capacity utilization in Tanzania, Zambia and to a lesser extent Kenya and Zimbabwe. For Tanzania, Bienfed (1 982) noted that ‘concerning the issue of capacity utilization, the evidence is relatively unambiguous. Low levels of utilization are a major problem ; they have been a problem for a long time, they fluctuate widely over time and between different factors or sectors’ (Also see Ndulu (1 966) for further evidence on Tanzania). During recent years Tanzania and Zambia probably had a level of utilization in the range of 50-55 per cent. Zimbabwe and Kenya have had a better performance in capacity utilization than these two countries. Davies (1 982) cites calculations by Ramsy that show the average capacity utilization in Zimbabwe to have been 60 per cent in 1962. However, according to Davies, during the sanctions there was an increase in the use ofcapacity. Then after 1975 there was a recession which resulted in a decline
REVUE AFRICAINE DE DEVELOPPEMENT 31
in capacity utilization. However, recent estimates indicated capacity utilization in the range of 70-80 per cent in Zimbabwe and in Kenya.
In the period under review a shortage of foreign exchange leading to import compression was a factor that could have caused capacity utilization to fall (Wangwe, 1983 and Bank of Tanzania, 1984). So also could constraints oper- ating on domestic markets, particularly since industrial firms were largely established within a framework of import substitution.
The degree of capacity utilization is linked to trade-orientation in so far as the latter deterimines the size of market and the availability of foreign exchange. Kenya, Tanzania, Zambia and Zimbabwe have all shared inward-oriented stra- tegy of industrial development - especially after the collapse of the East African Common Market. In Tanzania, prior to the Arusha Declaration of 1967, import substituting industrialization was emphasized. Although the concept was extended to embrace the entire East African Common Market, the full benefits from economic integration were not realized due to sudden disengagement from the market. The Arusha Declaration emphasized self-reliance. In Zam- bia, similarly, before and after the Mulungushi Declaration ( 1968) policies concentrated primarily on import substituting consumer goods. Zimbabwe after the unilateral Declaration of Independence (1 965) had to rely on the domestic market. Kenya, though more outward oriented than many African countries, basically followed an import substitution policy.
In addition to their impact on the level of capacity utilization, import sub- stitution policies are linked to total productivity changes through other mechanisms and in different ways. In principle, import substitution policies are expected to create external and scale economies. The exploitation of these economies should be an important factor in growth and they depend on growth of output. It should be recalled that the estimates reported in this paper are based on a production function with constant returns to scale. This was done mainly for convenience. The assumption of linear homogenity of the produc- tion function makes it possible to assume the distribution of factor shares according to the marginal productivity theory (Euler’s theorem). In case of increasing returns, which are to be expected, the estimates of the residual will be biased upward.
Another mechanism through which import substitution policies could influence the change in productivity is through their effect on domestic effi- ciency. Nishimizu and Robinsin ( 1984) concluded from a study based on data from Japan, Korea, Turkey and Yugoslavia, that increased import substitution leads to lower TFPG growth, perhaps by reducing cost-reduction incentives. (See Chenery et al, 1986, p. 303). A study by Pack (1987) which examined cotton spinning and weaving in Kenya attributed productivity losses to import-substitution policies that resulted in excessive product variety and inadequate incentives to secure technical competence (see World Bank, 1987, p. 92).
The argument is that high levels of protection shelter domestic industry from foreign competition. In addition, the limited domestic market has resulted in market structures characterized by the existence of monopolistic and oligopol-
32 AFRICAN DEVELOPMENT REVIEW
istic industries. According to Whiteworth (1 978), in Tanzania all industries with the exception of the garment industry were either monopolistic or oligo- polistic. Similar conclusions were drawn by Seidman (1 972) for Kenya. For the case of Zimbabwe, Simson (1979) noted that in 1970 about 2,500 products or 65 per cent of the total were produced by one firm. A high degree of concentration affects TFPG through the impact on the efficient use of resources and on innovation. In a less competitive environment there is less inducement to reduce cost and improve technology.
The importance of technological change as a source of growth was empha- sized by Solow (1957). In his study of the US economy during the period 1909- 1947, he attributed a substantial portion of the growth in production to disembodied technological change. Technological change results in increase in Total Factor Productivity. The low growth of TFPG implies poor technical progress. However, instead of inferring such a conclusion we may search for circumstantial or other empirical evidence directly related to the accumulation of technological capabilities in the sense of the acquisition, mastery or adap- tation of technology.
Unfortunately, there are few studies which can be referred to in order to judge the extent of this development. Langdon ( 1 984) examined the development of indigenous technological changes in Kenya textiles and wood industries. He could not firmly establish a significant indigenous technical capabilities for adaptation and innovations. On the other hand Pack (1976, p. 53) noted in Kenya that substantial productivity growth has taken place simply ofas a matter of reorganization of production and better training and supervision.
For Tanzania, a Central Bank study indicated very little Tanzanian involve- ment in technology choices and limited effective transfer. Perkin (1 983) pro- vided evidence of the fact that there is little state-led transfer of technology in Tanzania. He compared the techniques employed by the newly established parastatals and the ‘nationalized’ parastatals. In the former the selection of technology was done by the officials while in the ‘nationalized’ parastatals the choice was made by the previous owners. Perkin found that the techniques employed by the new parastatals were less-suited to Tanzania than those chosen by previous owners. This shows that in parastatals there is less technical effort than in the private sector. Recall that both Zambia and Tanzania have large public sectors. Evidence for negative total factor productivity growth rates in parastatals is provided by Clark for the case of Tanzania during 1966-7 1 (see Silver, 1984, p. 273).
Presumably the state’s efforts in direct investment are designed for acquiring technology. But a distinction should be made between acquiring technology and acquiring technological capabilities. Expenditure by the state on research and development is crucial for developing technological capabilities. But in the countries studied above while there is virtually no expenditure on basic research, expenditure on applied research is largely devoted to the agricultural sector (see ILO, 1972, p. 148). The stock of scientists and technicians is small. Moreover, the absence of a significant capital sector in these countries meant lagged technical progress. This is because the capital goods sector has a central
REVUE AFRICAINE DE DEVELOPPEMENT 33
role in the process of technology generation and diffusion since all technical change requires the development of modified or new machinery and equipment (see Fransman, 1984). Evidently much of the efforts of acquiring, mastering and adapting technology are to be undertaken by the firm. The motivation of the firm conditions its efforts. This is partly influenced by the presence of competitve pressures. Moreover, it is a result of the scale of production.
Declining or slowly rising total factor productivity has serious implications. The lag in productivity growth is a major obstacle to economic growth and development. Productivity growth leads to the expansion of the capacity for production. It is an indicator of the efficiency in which resources are used. It causes an outward shift in the production possibility curve - and is the key to improving competitiveness and narrowing the gap between the African econ- omies and those at high levels.
It is, hence, essential to reverse the trends of declining or decreasing TFPG. This could be done by eliminating the causes and introducing growth-augment- ing measures. Increased capacity utilization is necessary for TFPG. To achieve this objective, foreign exchange is to be made available for the purchase of imported industrial inputs. Similarly the factors from the demand side which lead to unutilized capacity should be addressed.
An important determinant of productivity is efficiency in the use of resources both at the macro and micro levels, allocative and technical. Allocative effi- ciency can be achieved where the policy environment does not distort prices and suppress incentives. Technical or X-efficiency occurs where firms attempt to reduce the cost of production to the minimum level possible within the current state of technology. Over time, firms should be able to undertake technological efforts to reduce this possible minimum level. Where markets are not compe- titive, the incentives towards optimality and efficiency are weak. Absence of competitive pressures reduces the urge to improve X-efficiency and to under- take technological efforts. Another crucial requirement for the development of technological capability is investment in human capital and in research.
34 AFRICAN DEVELOPMENT REVIEW
Annex
Data
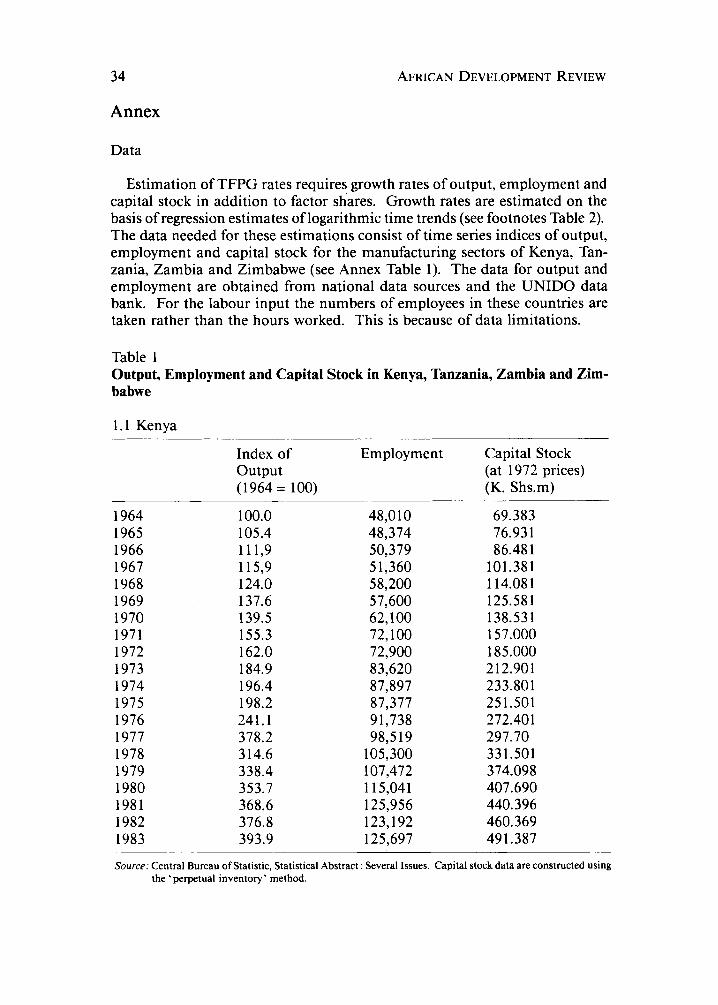
Estimation of TFPG rates requires growth rates of output, employment and capital stock in addition to factor shares. Growth rates are estimated on the basis of regression estimates of logarithmic time trends (see footnotes Table 2). The data needed for these estimations consist of time series indices of output, employment and capital stock for the manufacturing sectors of Kenya, Tan- zania, Zambia and Zimbabwe (see Annex Table 1). The data for output and employment are obtained from national data sources and the UNIDO data bank. For the labour input the numbers of employees in these countries are taken rather than the hours worked. This is because of data limitations.
Table 1 Output, Employment and Capital Stock in Kenya, Tanzania, Zambia and Zim- babwe
1.1 Kenya
Index of
(1964 = 100) output
Employment
1964 1965 1966 1967 1968 1969 1970 1971 1972 1973 1974 1975 1976 1977 1978 1979 1980 1981 1982 1983
100.0 105.4 11 1,9 115,9 124.0 137.6 139.5 155.3 162.0 184.9 196.4 198.2 241.1 378.2 314.6 338.4 353.7 368.6 376.8 393.9
48,O 10 48,374 50,379 51,360 58,200 57,600 62,100 72,100 72,900 83,620 87,897 87,377 9 1,738 983 19
105,300 107,472 115,041 125,956 123,192 125,697
Capital Stock (at 1972 prices) (K. Shs.m)
69.383 76.93 1 86.48 1
101.38 1 1 14.08 1 125.58 1 138.53 1 157.000 185.000 212.901 233.801 251.501 272.401 297.70 33 1 S O 1 374.098 407.690 440.396 460.369 491.387
Source: Central Bureau of Statistic, Statistical Abstract : Several Issues. Capital stock data are constructed using the 'perpetual inventory' method.
REVUE AFRICAINE DE DEVELOPPEMENT 35
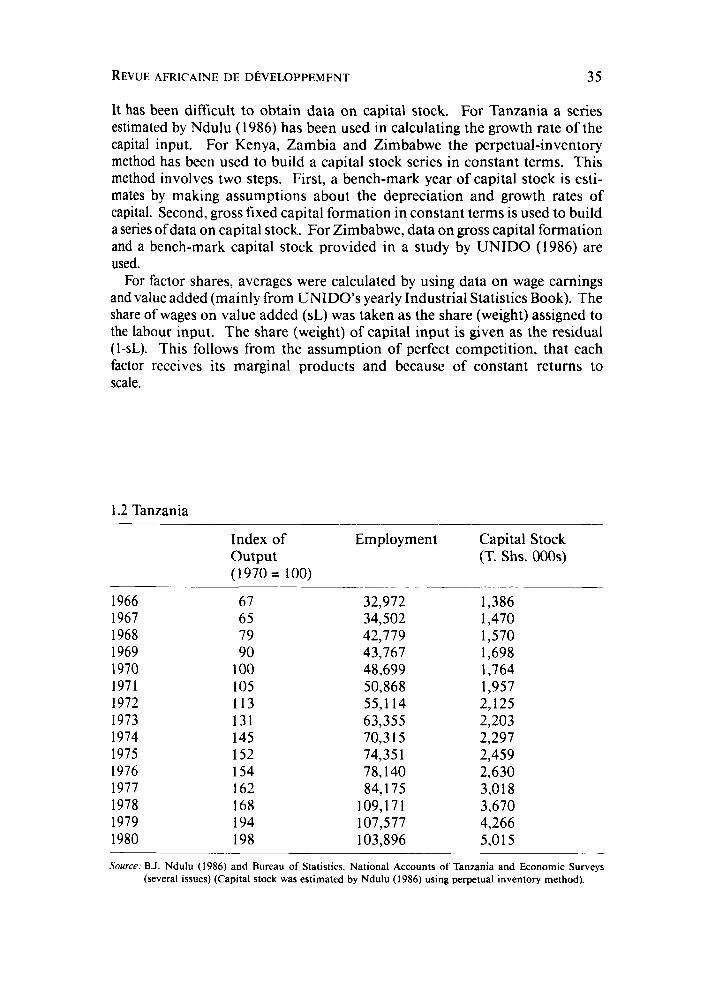
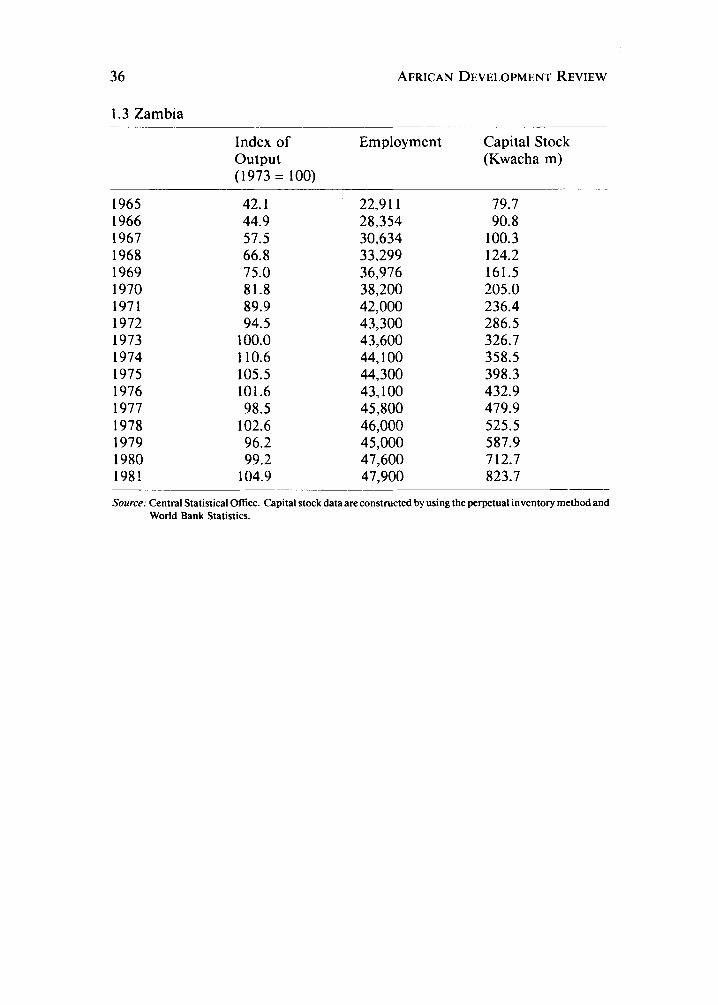
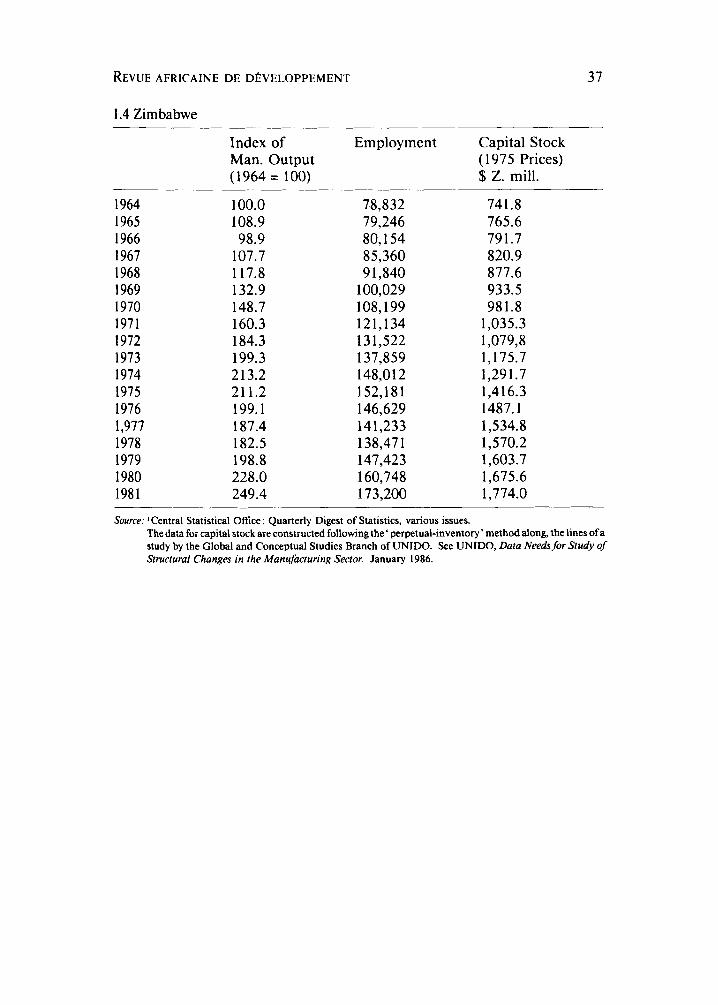
It has been difficult to obtain data on capital stock. For Tanzania a series estimated by Ndulu ( 1986) has been used in calculating the growth rate of the capital input. For Kenya, Zambia and Zimbabwe the perpetual-inventory method has been used to build a capital stock series in constant terms. This method involves two steps. First, a bench-mark year of capital stock is esti- mates by making assumptions about the depreciation and growth rates of capital. Second, gross fixed capital formation in constant terms is used to build a series of data on capital stock. For Zimbabwe, data on gross capital formation and a bench-mark capital stock provided in a study by UNIDO (1986) are used.
For factor shares, averages were calculated by using data on wage earnings and value added (mainly from UNIDO’s yearly Industrial Statistics Book). The share of wages on value added (sL) was taken as the share (weight) assigned to the labour input. The share (weight) of capital input is given as the residual (I-sL). This follows from the assumption of perfect competition, that each factor receives its marginal products and because of constant returns to scale.
1.2 Tanzania
Index of Employment Capital Stock output (T. Shs. 000s) (1970 = 100)
1966 1967 1968 1969 1970 1971 1972 I973 1974 1975 1976 1977 1978 1979 1980
67 65 79 90
100 105 I13 131 145 I52 154 162 168 194 198
32,972 34,502 42,779 43,767 48,699 50,868 55,114 63,355 70,3 I5 74,35 1 78,140 84,175
109,17 1 107,577 103,896
1,386 1,470 1,570 1,698 1,764 1,957 2,125 2,203 2,297 2,459 2,630 3,018 3,670 4,266 5,015
~
Source: B.J. Ndulu (1986) and Bureau of Statistics, National Accounts of Tanzania and Economic Surveys (several issues) (Capital stock was estimated by Ndulu (1986) using perpetual inventory method).
36 AFRICAN DEVELOPMENT REVIEW
1.3 Zambia
Index of Employment Capital Stock output (Kwacha m) (1973 = 100)
1965 1966 1967 1968 1969 1970 1971 1972 1973 1974 1975 1976 1977 1978 1979 1980 1981
42.1 44.9 57.5 66.8 75.0 81.8 89.9 94.5
100.0 110.6 105.5 101.6 98.5
102.6 96.2 99.2
104.9
22,9 1 1 28,354 30,634 33,299 36,?76 38,200 42,000 43,300 43,600 44,100 44,300 43,100 45,800 46,000 45,000 47,600 47,900
79.7 90.8
100.3 124.2 161.5 205.0 236.4 286.5 326.7 358.5 398.3 432.9 479.9 525.5 587.9 712.7 823.7
Source: Central Statistical Office. Capital stock data are constructed by using the perpetual inventory method and World Bank Statistics.
REVUE AFRICAINE DE DEVELOPPEMENT 37
1.4 Zimbabwe
Index of Employment Capital Stock Man. Output (1 975 Prices) (1964 = 100) $ Z. mill.
1964 1965 1966 1967 1968 1969 1970 1971 1972 1973 1974 1975 1976 1,977 1978 1979 1980 1981
~~
100.0 108.9 98.9
107.7 117.8 132.9 148.7 160.3 184.3 199.3 2 13.2 21 1.2 199.1 187.4 182.5 198.8 228.0 249.4
~
78,832 79,246 80,154 85,360 9 1,840
100,029 108,199 12 1,134 131,522 137,859 148,012 152,181 146,629 141,233 138,47 1 147,423 160,748 173,200
74 1.8 765.6 791.7 820.9 877.6 933.5 98 1.8
1,035.3 1,079,8 1,175.7 1,29 1.7 1,416.3 1487.1 1,534.8 1,570.2 1,603.7 1,675.6 1,774.0
Source: Central Statistical Office : Quarterly Digest of Statistics, various issues. The data for capital stock are constructed following the' perpetual-inventory ' method along, the lines of a study by the Global and Conceptual Studies Branch of UNIDO. See UNIDO, Data Needs for Study of Structural Changes in the Manufacturing Sector. January 1986.
38 AFRICAN DEVELOPMENT REVIEW
Table 2 Average Annual Rates of Growth of Productivity of Labour and Capital (Yo)
Country Growth in Growth in Period Labour Capital
Productivity Productivity
1. Kenya 1964-83 1964-73 1973-83
2. Tanzania 1966-80 1966-73 1973-8 1
3. Zambia 1965-80 1966-73 1973-8 1
4. Zimbabwe 1964-8 1 1964-73 1973-8 1
0.38 3.80 2.3 1
1.04 -2.52 -0.72
3.63
1.35 -1.72
1.19
0.52 -0.25
- 5.70 - 0.36 - 2.61
3.13 - 6.54 - 0.39
- 5.52 -1 1.77 - 9.02
2.98 - 3.07 - 0.26
References
BANK OF TANZANIA (1984) Tanzania: Twenty Years of Independence (1961-81): A Review of Political and Economic Performance. Dar-es-Salaam.
BANK OF ZAMBIA (1979) Report for the Year Ended 31st December 1979. BAUMOL, WILLIAM J. and Mc LENNAN, KENNETH (1985) i‘roductivity Growth and US
competitiveness. Oxford University Press : New York. BIENEFELD, MARTIN (1 982) ‘ Evaluating Tanzanian Development’ in Fransman, M. (ed.)
Industry and Accumulation in Africa. London Heinemann. BROWN, M. and J. POPKIN (1962) ‘A Measure of Technological Change and Returns to
Scale’ Review of Economies and Statistics. CHENERY, HOLLIS (1986) Industrialization and Growth: A Comparative Study. A World
Bank Publication, New York Oxford University Press. DAVES, BOB (1 982), Discussion Note on Chapter 13 of Industry and Accumulation in
Africa. (ed.) Martin Fransman, Heinemann : London. DIEWERT, W.E. (1980). ‘Capial and the Theory of Productivity Measurement’. Ameri-
can Economic Review Vol. 70, No. 2, pp. 360-367. FRANSMAN, M. ( 19849 ‘Concepualizing Technical Change in the Wold in the 1980’s : An
Interpretive Survey’. Jouranl of Development Studies. Vol. 21, No. 4, pp. 572- 652.
ILO (1972), Employment, Incomes and Equality: A Stratefy for Increasing Productive Employment in Kenya.
REVUE AFRICAINE DE DEVELOPPEMENT 39
~ P L I N S K Y , RAPHIE( 1982) ‘Capital Accumulation in the Periphery: Kenya’ in Martin Fransman (ed.). Industry and Accumulation in Africa, Heinemann, London,
KRUEGER, A. And B. TUNCAR (1 980) Estimating Total Factor Productivity Growth in a Developing Country. World Bank Staff Working Paper No. 422, Washington, D.C.
KWON, J. K. (1 986) ‘Capital Utilization, Economies ofscale and Technical Change in the Growth of Total Factor Productivity: An Explanation of the South Korean Man- ufacturing Growth’ Journal of Development Economics, Vol. 24, No. 1, pp. 75- 89.
LANGDON, STEVEN (1984) ‘Indigenous Technological Capability in Africa: The Case of Textiles and Wood Products in Kenya’ in Fransman, M. and K. King (eds.). Tech- nological Capability in the Third World. Macmillan : Hong Kong, pp. 355-374.
LEYS, COLIN (1 982) ‘Accumulation Class Formation and Dependency: Kenya’ in Martin Fransman (ed.). Industry and Accumulation in Africa, Heinemann, London,
MADDISON, ANGUS (1 987) ‘Growth and Slowdown in Advanced Capitalist Economies’ Journal of Economic Literature. Vol. XXV, No. 2, pp. 649-698.
NISHIMIZU, MICKO and SHERMAN ROBINSON (1984) ‘Trade Policies and Productivity Change in Semi-Industrialized Countries’ Journal of Development Economics Vol. 16, No. 1.
NDULU, B. J. ( 1986) ‘Investment, Output Growth and Capacity utilization in an African Economy : The Case for Manufacturing Sector in Tanzania’. Eastern Africa Econ- omic Review. Vol. 2, No. 1, pp. 14-30.
NELSON, RICHARD R. ( I 98 1) ‘Research on Productivity Growth and Productivity Dif- ferences : Dead Ends and New Departures’ Journal of Economic Literature. Vol.
PACK, HOWARD (1 976) ‘The Substitution of Labour for Capital in Kenyan Manufac- turing’. Yale University, Economic Growth Centre, Centre Paper No. 240.
PERKINS, F. C. ( 1983) ‘Technology Choice, Industrialization and Development Exper- iences in Tanzania’ Journal of Development Studies Vol. 19, NO. 2. SEIDMAN, ANN (1 972) Comparative Development Strategies in East Africa East African Publishing House.
SILVER, M. S. (1984) The Growth OfManufacturing Industry in Tanzania: An Economic History. Boulder A Westwiew Replica Edition.
SIMSON, HOWARD (1 979) Zimbabwe: A Country Study. Scandinavian Institute of Afri- can Studies. Research Report No. 53 Uppasala.
SOLOW, ROBERT (1 957) ‘Technical Change and the Aggregate Production Function’ The Review of Economics and Statistics, Vol 39 August, pp. 3 12-320.
THIRLWALL, A. P. (1 983) Growth and Development with Special Reference to Developing Economies Macmillan.
WANGWE, SAMUEL M. (1 983) ‘ Industrialization and Resource Allocation in a Develop- ing Country: The Case of Recent Experiences in Tanzania’ World Development,
WHITWORTH, ALAN (1978) The Case for Price Control in Tanzania with Particular Reference to Locally Manufactured Products. University of Dar-es-Salaam. Econ- omic Reserarch Bureau Paper 78.2.
UNIDO (1983) ‘The Changing Role of Manufacturing in African Economic Develop- ment : Trends, Prospects and Issues’ Industry and Development, No. 8.
- - (1986) Data Needs for Study of Structural Changes in the Manufacturing Sector, Prepared by the Global and Conceptual Studies Branch (UNIDO/IS.60).
pp. 193-221.
pp. 170-92.
XIX, NO. 3, pp. 2 13-243.
VOI. 11, NO. 6, pp. 483-492.