Embed Size (px)
Citation preview
South Africa’s readiness to integrate ICTinto mathematics and science pedagogyin secondary schools
Sarah J. Howie & A. Seugnet Blignaut
Published online: 15 September 2009# Springer Science + Business Media, LLC 2009
Abstract One of South Africa’s identified priorities is the implementation of ICT ineducation. To this end a phased implementation plan was initiated in 2004 for ICT tobe implemented into schools across the country over eight years. During this timeSouth Africa also participated in three international studies undertaken by theInternational Association for the Evaluation of Educational Achievement (IEA)focusing on ICT in Education. Each of these permitted the country to benchmark itsprogress in terms of other countries and their implementation of ICT in education.The latest study, SITES 2006 provides a useful set of indicators against which SouthAfrica can evaluate its progress with regard to its implementation of ICT. This paperseeks to evaluate South Africa’s readiness to integrate ICT into mathematics andscience classrooms. This was done using a number of indicators of “sustainablechange” derived from SITES 2006 and then comparing these to countries such asChile, Thailand and Norway, the former two with similar context and conditions andthe latter with contrasting conditions. The findings reveal that whilst South Africahas made some progress since 1998 in terms of the implementation of ICT ineducation, that the majority of schools are still in their infancy regarding theacquisition of ICT and most of those who have access are still in the process oftrying to integrate the ICT into their teaching and learning. It would appear thatmore fundamental needs in South Africa’s education system have dominated itspriorities.
Keywords ICT in education . Digital divide . Mathematics . Science . SITES
Educ Inf Technol (2009) 14:345–363DOI 10.1007/s10639-009-9105-0
S. J. Howie (*)University of Pretoria, Pretoria, South Africae-mail: [email protected]
A. S. BlignautNorth–West University, Potchefstroom Campus, South Africa
1 Introduction
The focus of this paper is the analysis of the status quo with regard to theimplementation and use of Information and Communication Technology (ICT) insecondary schools in a largely developing environment, South Africa. This isdiscussed against the backdrop that ICT in education can be considered a luxury or apriority in terms of its implementation across the education system given the seriousand systemic education quality issues facing South Africa currently (Howie 2008;Fleisch 2008). Whilst the challenges of IT for education have been studied for40 years (Voogt and Knezek 2008, p. xxix) South Africa is a relative newcomer toboth studying and implementing ICT in education. This paper presents findings fromSouth Africa’s participation in the International Association for the Evaluation ofEducational Achievement’s (IEA) Second Information in Technology in EducationStudy (SITES) 2006.
SITES 2006 (Law et al. 2008) is the third international study in Information andCommunication Technology that South Africa has participated in over the pastdecade, the previous two being Second Information in Technology in EducationStudy Module 1 (SITES-M1) (Pelgrum and Anderson 1999) and Second Informationin Technology in Education Study Module 2 (SITES-M2) (Kozma 2003). SITES M1was an international cross-sectional survey carried out between 1997 and 1999 andincluded data from principals and technology coordinators in schools in theparticipating countries. This study focused on ICT resources and the extent towhich schools had adopted and implemented pedagogical practices consideredimportant to education in an information society. SITES M2 was a set ofinternational case studies of innovative ICT pedagogical practices conductedbetween 2000 and 2002 in 28 countries and identified 174 innovative ICTclassrooms. Research teams in each country collected data on the pedagogicalpractices of teachers and learners, the role that ICT played in these practices, and thecontextual factors that supported and influenced them (Kozma 2003). South Africacontributed case study data for eight schools showing exemplary innovations inclassrooms across the country. The latest study, SITES 2006, is an internationalcross-sectional survey focusing on the integration of ICT into mathematics andscience classrooms with particular reference to grade 8. In South Africa, a sample of500 schools was selected to participate and more than 600 mathematics and morethan 600 science teachers participated.
There are 33 million Internet users in Africa (Internet World Stats 2007 http://www.internetworldstats.com in Resta and Laferriere 2008, p. 768). The Internetpenetration is a mere four percent of the population in Africa (World Internet UsageStatistics News and Population Statistics 2007). In comparison, the Internetpenetration is 9.4% in South Africa with more than two million users and the useof the Internet has grown by 91% between 2000 and 2008 (Internet World Stats2007, http://www.internetworldstats.com). South Africa faces considerable chal-lenges where first and third world conditions prevail in Africa’s second largesteconomy. Many refer to the contrasts between the North and the South or the inter-country divides (Campbell 2001; Warchauer 2002), however, South Africa facesboth an intra and inter-country digital divide with huge differences in access to ICTwithin the country and vast disparities in resources. Two key indicators of this are
346 Educ Inf Technol (2009) 14:345–363
electricity and having a land line available in the school. In Gauteng (regarded as thecountry’s richest province) 98% of schools have electricity, this is not the same forother provinces such as KwaZulu-Natal that has the largest number of schools in thecountry and only 72% of schools have electricity (Department of Education 2007).While 93% of Gauteng schools have access to a land line connection which allowsaccess to the Internet, only 24% of schools in the Eastern Cape (the poorest provincewith a large number of rural schools) have a land line connection. Nationally, 46% ofschools have an operational land line connection (Department of Education 2007).
South Africa is considerably ahead of most countries in Africa. South Africa’sGNP per capita is higher than most other African countries and 34% of SouthAfricans live on less than U$2 per day compares to the next lowest country is Congowith 38% of its people living at this level (UNESCO 2007, p. 229). South Africaspends a reasonably high percentage of GNP in its total public expenditure oneducation at 5.5% it compares well to most African countries, with the exception ofKenya (7.1%) and Lesotho (7.3%). South Africa has also since its new democracytraditionally spent a large percentage of the budget on education although it hasdropped from 22% to 19% in the past few years (UNESCO 2007, p. 320). The adultliteracy rates are much higher than for other African countries and especially withreference to the female population where South Africa’s rate is 81% compared to therates of sub-Saharan Africa at 53% for females.
However, it is notably far behind many developed nations and other developingnations in other parts of the world as is evident in Table 1. Norway’s wealth is obviousgiven the GNP per capita as well as the significant proportion spent on education.
Differences between countries, other than those outlined above, are reflected indifferent ways. In terms of the differences existing for ICT in Education, there areconsiderable differences and gaps in terms of countries that are well-resourced andare utilizing the latest technologies and those that do not or cannot. The digitaldivide is seen by some as an issue of social justice meaning the marked gap in accessto use of ICT devices (Campbell 2001, p. 1). This debate has evolved further whenthe notion of social inclusion and the concept of technology for social inclusioncoined (Warchauer 2002, p. 2). Furthermore concerns about the divide or exclusionfrom society resulted in the World Summit on the Information Society in 2005emphasising the importance of removing the barriers to bridging the digital divide
Table 1 International development indicators from the global monitoring report 2007
Country GNP per capita 2004 In U$ Total public expenditure oneducation as % of GNP
Adult literacy 2004
(%) (%)
South Africa 3690 5.5 82
Sub-Saharan Africa 601 – 61
Chile 5220 4.1 96
Norway 51810 7.6 100
Thailand 2490 4.3 96
UNESCO, Global Monitoring Report 2007, p. 225–320
Educ Inf Technol (2009) 14:345–363 347347
(Resta and Laferriere 2008, 765). More discussion on this can be found in Section 3on the conceptual framework after providing some contextual information on SouthAfrica. However, before describing the specific context and the issues related to ICTpolicy development in South Africa, the main research questions are given and thestructure of the article outlined below.
The questions addressed by this article are: 1. to what extent is South Africaadequately prepared to integrate ICT into mathematics and science grade 8 class-rooms 2. To what extent is ICT integrated in South African mathematics and sciencegrade 8 classrooms? These questions are investigated by means of the SITES 2006data, which comprise data from school principals, teachers of mathematics andscience and technical coordinators. Specifically the data about computers andInternet access; availability of technology’ obstacles to pedagogical goals; locationof ICT in the school; provision of staffing; channels for teachers to acquire skills andknowledge were analysed to gain a closer look at the mathematics and scienceclassrooms in relation to ICT.
The article first describes the South African education context and discusses theICT policy in education in South Africa. To address the main questions in this paper,the conceptual framework of Resta and Laferriere (2008) is described in Section 3.Their framework is used in order to reflect upon the data and the factors listed above.This is followed by key findings from SITES 2006 and finally conclusions basedupon these findings are drawn and discussed.
2 ICT and the South African education context
South Africa has more than 47 million people across its nine provinces. The countryrecognizes 11 official languages, which are implemented as the languages ofinstruction in the first three years of primary schooling. Out of approximately 12million students in school, more than 90% of children attend school during thecompulsory phase in 26 592 schools. Of these schools, 40% are classified as beingpoor to very poor. This is reflected by 40% of schools not having electricity, 33% donot have telephone lines and generally in these poor schools, academic performanceis generally low (Blignaut and Howie 2009, p. 658). The average class size is 49–50students (Howie 2001, p. xxvi) at secondary school level and 42 at primary schoollevel (Howie et al. 2009, p. 54).
Given the characteristics of the schools above, it is not surprising that only 13%of schools were found to have one or more computers in 1999 (Howie et al. 2005,p. 35). Only 2% of schools may be characterized as being highly resourced. The twomost highly developed and wealthiest provinces, Gauteng and the Western Cape,have a policy of implementing ICT in education into every school and have madeprogress in implementing ICT. SITES M1 conducted in 1999 was the firstcomprehensive national study of ICT in Education in secondary schools in SouthAfrica (Howie et al. 2005, p. xviii). The main constraints of ICT in Education foundin SITES M1 in South Africa, were financial constraints, a lack of computer literacyamongst teachers, a lack of training regarding integration of computers into differentlearning areas and the absence of a properly developed curriculum for teachingcomputer skills.
348 Educ Inf Technol (2009) 14:345–363
The only document presenting a framework of strategic, political, pedagogical anddevelopmental facets of implementing e-education in South Africa is theWhite paper one-Education—August 2004 Transforming Learning and Teaching through Informationand Communication Technologies with the strategic objective: Every South Africanmanager, educator and learner in the general and further education and trainingbands will be ICT capable by 2013 (Department of Education 2004, p. 17). There arethree phases envisaged:
Phase 1. Enhancing of a system-wide and institutional readiness to use ICTs forlearning, teaching and administration (2004–2007).
In all the provincial departments of education, ICT coordinators have beenappointed; ICT business plans have been approved; more than 2200 “ICTchampions” (leaders of ICT implementation) in schools have been appointed; morethan 48,000 educators have undergone basic ICT training; and more than 46,000educators have undergone training on integrating ICT in the curriculum (Departmentof Education 2006). These figures indicate that a little more than 15% of SouthAfrican teachers received ICT training during Phase 1. Teacher training, as well asother individual targets not met are continuously addressed (Blignaut and Howie2009).
Phase 2. System-wide integration of ICTs into teaching and learning (2007–2010).
This phase requires that educators and managers integrate ICT into the curriculumand management. ICT is widely present in schools; schools use education content ofhigh quality; institutions are electronically connected, access the Internet andcommunicate electronically; and local communities use and support schools’ ICTfacilities (Blignaut and Howie 2009, p. 660).
Phase 3. ICTs should be integrated at all levels of the education system. The roll-out is aimed for 2010–2013.
The e-education policy framework supports four key elements for use of ICT inteaching and learning, namely equity, access to ICT infrastructure, capacity building,and norms and standards. Equal access and equal competence require thedevelopment of a technology baseline for the use of ICT in education. This phaseaims for all provincial departments of education to use ICT seamlessly in theirplanning, management, communication, monitoring and evaluation; learners andeducators are ICT capable; educators integrate ICT into teaching and learning in allinstitutions; all institutions use the education portal for teaching and learning; andthat research informs ICT interventions (Blignaut and Howie 2009, p. 660).
The outline of the policy above provides the essential context against which theSITES 2006 data, collected in South Africa in 2006, can provide some measure ofprogress which will be discussed in the final section of this paper.
3 Conceptual framework
As mentioned earlier the digital divide debate is well-known and much has beenwritten about it (Campbell 2001, Haddad and Draxler 2002; Solomon 2002;
Educ Inf Technol (2009) 14:345–363 349349
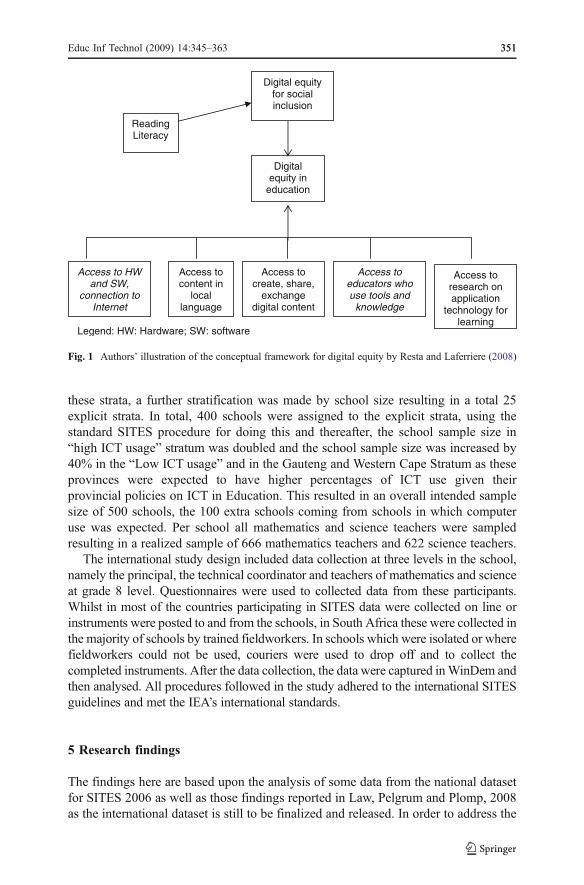
Warchauer 2002). South Africa is atypical as the digital divide is at its greatestwithin the country (Howie et al. 2005, p. xiii). With very few exceptions, the bestICT is available in several urban areas in contrast to scarce, primitive technology or acomplete lack of ICT in rural areas and some peri-urban areas. What is very pertinentto South Africa with its political history is the notion of digital equity (Solomon2002) being a social justice goal (Resta and Laferriere 2008, p. 766). Another factorunderpinning the digital divide is the knowledge divide (Anderson 2008, Binde2005) that is particularly prevalent within South Africa compared to countries withmore equitable societies. Whilst it is the aspiration for many countries to aspire tobeing knowledge societies, the world knowledge base doubles every two to threeyears as does the Internet (Haddad and Draxler 2002). Furthermore, as nationaleconomies become more internationalized and there is a greater demand for higherlevels of education, technology reduces the need for many types of unskilled or low-skilled workers (Haddad and Draxler 2002). This has dire consequences for Africancountries in general and particularly for South Africa with its high levels of illiterateadults (Howie 2002). Resta and Laferriere (2008) presented their conceptualframework within a context of developing countries to present and discuss digitalequity. An illustration of this framework is presented below as interpreted by theauthors of this paper.
According to Resta and Laferriere (2008), the framework reflecting digital equityis dependent on high levels of reading literacy to ensure digital equity and socialinclusion which in turn is strongly related to digital equity in education. The issue ofreading literacy has been identified as one of the biggest challenges facing SouthAfrica. In a recent IEA study of reading literacy, Progress in International ReadingLiteracy (PIRLS 2006), South African grade 5 learners attained the lowest scores outof 40 participating countries and scored almost than 200 points below theinternational set mean score of 500 points (Howie et al. 2009, p. 32).
Digital Equity in education comprises five components related to access as seenin Fig. 1. In this paper two of these components are the focus, namely access tohardware and software and the connectivity to the Internet (see Sections 5.1–5.4) andsecondly access to educators who know how to use tools and knowledge (seeSections 5.5–5.6). The SITES 2006 study, from which the data for the findingsrepresents the empirical evidence, could also be considered as the access to researchon application technology for learning. The framework will be discussed in relationto the findings in the final section.
4 Methodology
SITES 2006 was conducted in South Africa in 2006 (see Howie et al. 2005) where495 schools participated across all nine provinces. The sample for SITES 2006 wasrelatively complex given the fact that ICT is only significantly implemented in twoout of nine provinces in South Africa. Four categories of computer usage wereidentified, namely High ICT usage expected, Low ICT usage expected, Nocomputers available, and unknown. Where the computer availability was unknown,a further stratification was made by “Region” covering Gauteng and Western Cape(advanced provinces), and other regions, and resulted in five explicit strata. Within
350 Educ Inf Technol (2009) 14:345–363
these strata, a further stratification was made by school size resulting in a total 25explicit strata. In total, 400 schools were assigned to the explicit strata, using thestandard SITES procedure for doing this and thereafter, the school sample size in“high ICT usage” stratum was doubled and the school sample size was increased by40% in the “Low ICT usage” and in the Gauteng and Western Cape Stratum as theseprovinces were expected to have higher percentages of ICT use given theirprovincial policies on ICT in Education. This resulted in an overall intended samplesize of 500 schools, the 100 extra schools coming from schools in which computeruse was expected. Per school all mathematics and science teachers were sampledresulting in a realized sample of 666 mathematics teachers and 622 science teachers.
The international study design included data collection at three levels in the school,namely the principal, the technical coordinator and teachers of mathematics and scienceat grade 8 level. Questionnaires were used to collected data from these participants.Whilst in most of the countries participating in SITES data were collected on line orinstruments were posted to and from the schools, in South Africa these were collected inthe majority of schools by trained fieldworkers. In schools which were isolated or wherefieldworkers could not be used, couriers were used to drop off and to collect thecompleted instruments. After the data collection, the data were captured inWinDem andthen analysed. All procedures followed in the study adhered to the international SITESguidelines and met the IEA’s international standards.
5 Research findings
The findings here are based upon the analysis of some data from the national datasetfor SITES 2006 as well as those findings reported in Law, Pelgrum and Plomp, 2008as the international dataset is still to be finalized and released. In order to address the
Legend: HW: Hardware; SW: software
Reading Literacy
Digital equity in
education
Access to HW and SW,
connection to Internet
Access to educators who use tools and
knowledge
Access to research on application
technology for learning
Access to create, share,
exchange digital content
Access to content in
local language
Digital equity for social inclusion
Fig. 1 Authors’ illustration of the conceptual framework for digital equity by Resta and Laferriere (2008)
Educ Inf Technol (2009) 14:345–363 351351
first main question to what extent is South Africa adequately prepared to integrateICT into mathematics and science grade 8 classes, this paper used data generated byone of the questions in the original international SITES 2006, namely “Areimportant conditions for implementing sustainable change present in schools?” (Lawet al. 2008, p. 67). Some of the data generated by this question comprised thefollowing factors and were analysed by means of descriptive statistics: the access tocomputers (see Section 5.1), the availability of technology (5.2), the obstacles torealize pedagogical goals (5.3), the location of ICT (5.4), staffing (5.5) and thechannels for teachers to acquire skills and knowledge (5.6).
Data were also analysed in relation to the second main question “to what extent isICT integrated into South African grade mathematics and science classrooms.” Thisis reported in Section 5.7, the integration of ICT in mathematics and science classes.The results follow in the following sections.
5.1 Access to computers and the Internet
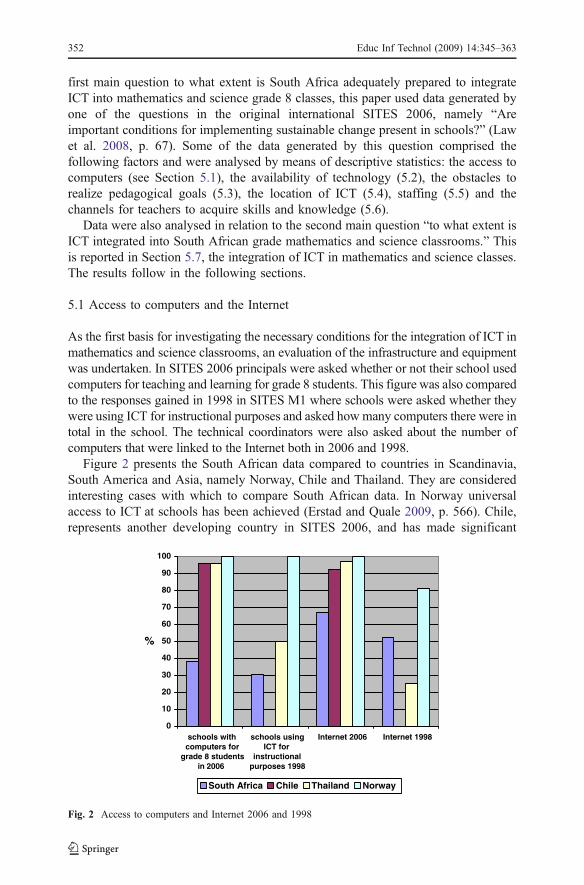
As the first basis for investigating the necessary conditions for the integration of ICT inmathematics and science classrooms, an evaluation of the infrastructure and equipmentwas undertaken. In SITES 2006 principals were asked whether or not their school usedcomputers for teaching and learning for grade 8 students. This figure was also comparedto the responses gained in 1998 in SITES M1 where schools were asked whether theywere using ICT for instructional purposes and asked how many computers there were intotal in the school. The technical coordinators were also asked about the number ofcomputers that were linked to the Internet both in 2006 and 1998.
Figure 2 presents the South African data compared to countries in Scandinavia,South America and Asia, namely Norway, Chile and Thailand. They are consideredinteresting cases with which to compare South African data. In Norway universalaccess to ICT at schools has been achieved (Erstad and Quale 2009, p. 566). Chile,represents another developing country in SITES 2006, and has made significant
0
10
20
30
40
50
60
70
80
90
100
schools withcomputers for
grade 8 studentsin 2006
schools usingICT for
instructionalpurposes 1998
Internet 2006 Internet 1998
%
South Africa Chile Thailand Norway
Fig. 2 Access to computers and Internet 2006 and 1998
352 Educ Inf Technol (2009) 14:345–363
gains in the implementation of ICT in education (Hinostroza et al. 2009, p. 158).Thailand also has a developing context and has made great progress in itsimplementation (Waitayangkoon 2009, p. 687). The data also provide somecomparisons between 1998 and 2006 for three of the four countries (the exceptionbeing Chile).
Despite its tremendous progress in providing computers to schools and access toInternet from 1998 to 2006, South Africa does not yet provide universal access ofICT in education to its students with more than half (62%) of the schools nothaving access to computers. Of these South African schools having access tocomputers, more than 60% had access to the Internet. This compared to about 50%in 1999.
Almost all schools in both Thailand (96%) and Chile (96%) have access to ICTand a significant percentage of schools in Thailand have connection to the Internetdespite considerable and comparable contextual challenges similar to South Africa(Waitayangkoon 2009, Hinostroza et al. 2009). What is interesting from a SouthAfrican perspective is that the Chilean education system is one-third the size ofSouth Africa’s education system and began in 1992 with a pilot project and by1995 a national project was underway. Twelve years later, by 2007, 90% of primaryand secondary schools had implemented ICT (Hinostroza et al. 2009, p. 160).Similarly, the Thailand system, which is slightly larger than South Africa with30,000 schools developed its computer curriculum in 1984 and by 2006, 95%schools had ICT (Waitayangkoon 2009, p. 690). Clearly there are relevant andsignificant lessons in terms of strategy and implementation that can be learn fromthese two countries.
SITES 2006 revealed that almost all the education systems in the study, whereschools had access to computers, also had access to the Internet, The mainexceptions were South Africa and the Russian Federation. Where access to theInternet was low in 1998/1999, Thailand has made major progress in less than adecade. Hardly any schools in South Africa have computer: student ratios lower than1:10 and more schools had ratios greater than 40 in 2006. This is despite the numberof schools possessing any computers increased dramatically from 1998 (Law et al.2008). Equipment and hands-on material1 was available in more than 75% ofschools internationally, except for eight countries, including South Africa 17%,Chile, 47% and Thailand 40% (Law et al. 2008, p. 80).
5.2 Availability of technology
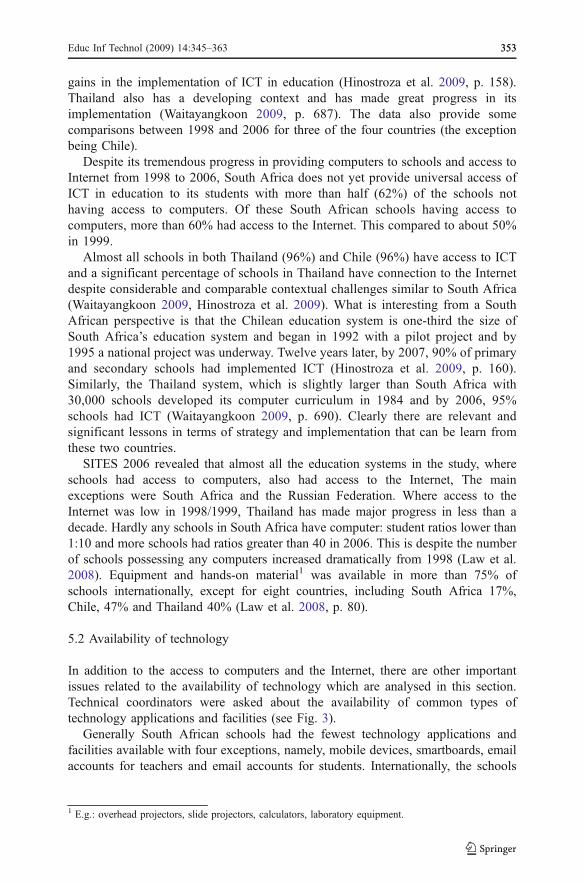
In addition to the access to computers and the Internet, there are other importantissues related to the availability of technology which are analysed in this section.Technical coordinators were asked about the availability of common types oftechnology applications and facilities (see Fig. 3).
Generally South African schools had the fewest technology applications andfacilities available with four exceptions, namely, mobile devices, smartboards, emailaccounts for teachers and email accounts for students. Internationally, the schools
1 E.g.: overhead projectors, slide projectors, calculators, laboratory equipment.
Educ Inf Technol (2009) 14:345–363 353353
that reported needing many of the listed technology applications were found inSouth Africa, Chile and Thailand.
In addition to listing what technology was available and needed, principals wereasked to indicate what priority they would allocate to a list of needs (from not apriority, low, medium and high priority).
South African principals gave a high priority rating to a number of needs. Firstlyalmost half of the principals reported the need to obtain more computers and Internet(49%); secondly, 43% of the principals reported increasing the range of digitalresources as a high priority and then equal percentages of principals reporteddecreasing the student:computer ratio (40%), increasing the bandwith (40%), andincreasing the online support platforms (40%) as a high priority.
5.3 ICT related and other obstacles to realizing pedagogical goals
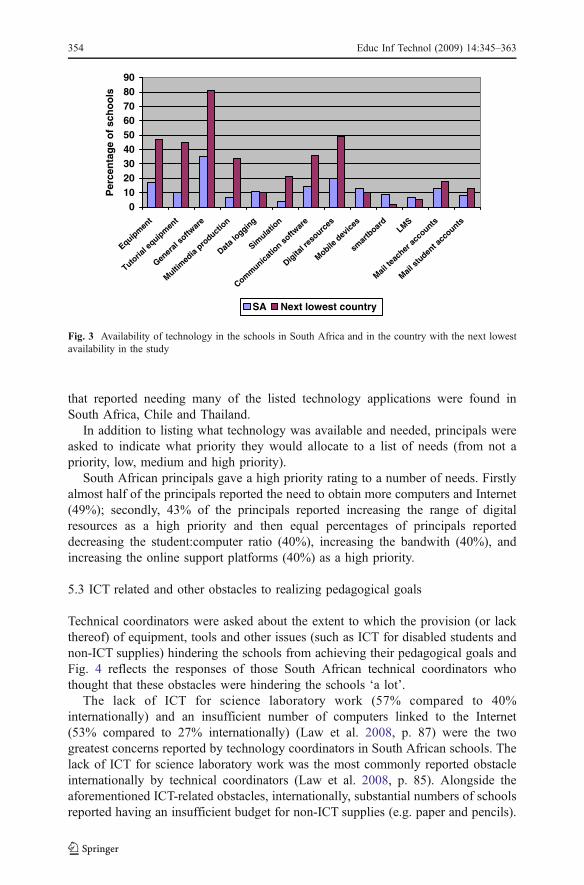
Technical coordinators were asked about the extent to which the provision (or lackthereof) of equipment, tools and other issues (such as ICT for disabled students andnon-ICT supplies) hindering the schools from achieving their pedagogical goals andFig. 4 reflects the responses of those South African technical coordinators whothought that these obstacles were hindering the schools ‘a lot’.
The lack of ICT for science laboratory work (57% compared to 40%internationally) and an insufficient number of computers linked to the Internet(53% compared to 27% internationally) (Law et al. 2008, p. 87) were the twogreatest concerns reported by technology coordinators in South African schools. Thelack of ICT for science laboratory work was the most commonly reported obstacleinternationally by technical coordinators (Law et al. 2008, p. 85). Alongside theaforementioned ICT-related obstacles, internationally, substantial numbers of schoolsreported having an insufficient budget for non-ICT supplies (e.g. paper and pencils).
0102030405060708090
Equipm
ent
Tutoria
l equip
men
t
Genera
l softw
are
Multim
edia
product
ion
Data lo
gging
Simulat
ion
Comm
unicatio
n softw
are
Digita
l reso
urces
Mobile d
evice
s
smar
tboard
LMS
Mail te
acher
accounts
Mail st
udent a
ccounts
Per
cen
tag
e o
f sc
ho
ols
SA Next lowest country
Fig. 3 Availability of technology in the schools in South Africa and in the country with the next lowestavailability in the study
354 Educ Inf Technol (2009) 14:345–363
These schools were largely found in South Africa, Russian Federation, Chile andThailand. This is significant where there are clearly still countries that do not havesufficient basic educational supplies in their schools in contrast to so many othercountries participating in SITES 2006 where ICT has been extensively implementedand for whom fundamental supplies are not an issue. There are even claims that “fewschools (in Africa) have the inputs necessary for effective instruction” and thatattempts to improve the quality of education are often hampered by “absence of eventhe most basic instructional materials and supplies” (Verspoor 2008, p. 37).
5.4 Location of the ICT in schools
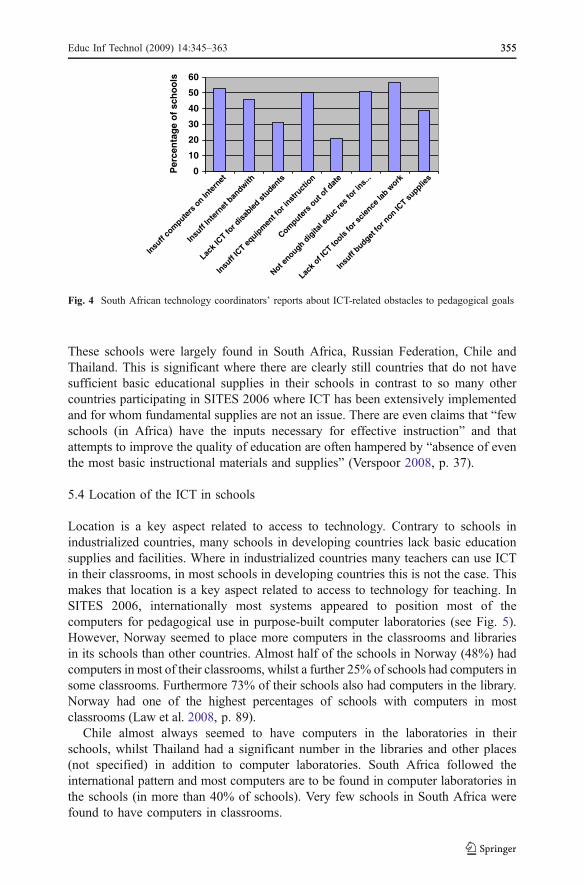
Location is a key aspect related to access to technology. Contrary to schools inindustrialized countries, many schools in developing countries lack basic educationsupplies and facilities. Where in industrialized countries many teachers can use ICTin their classrooms, in most schools in developing countries this is not the case. Thismakes that location is a key aspect related to access to technology for teaching. InSITES 2006, internationally most systems appeared to position most of thecomputers for pedagogical use in purpose-built computer laboratories (see Fig. 5).However, Norway seemed to place more computers in the classrooms and librariesin its schools than other countries. Almost half of the schools in Norway (48%) hadcomputers in most of their classrooms, whilst a further 25% of schools had computers insome classrooms. Furthermore 73% of their schools also had computers in the library.Norway had one of the highest percentages of schools with computers in mostclassrooms (Law et al. 2008, p. 89).
Chile almost always seemed to have computers in the laboratories in theirschools, whilst Thailand had a significant number in the libraries and other places(not specified) in addition to computer laboratories. South Africa followed theinternational pattern and most computers are to be found in computer laboratories inthe schools (in more than 40% of schools). Very few schools in South Africa werefound to have computers in classrooms.
0
10
20
30
40
50
60
Insu
ff co
mpute
rs o
n Inte
rnet
Insu
ff In
tern
et b
andwith
Lack
ICT fo
r disa
bled s
tuden
ts
Insu
ff IC
T equip
men
t for i
nstru
ctio
n
Compute
rs o
ut of d
ate
Not enough d
igita
l educ r
es fo
r ins..
.
Lack o
f ICT to
ols fo
r scie
nce la
b work
Insu
ff budget
for n
on ICT su
pplies
Per
cen
tag
e o
f sc
ho
ols
Fig. 4 South African technology coordinators’ reports about ICT-related obstacles to pedagogical goals
Educ Inf Technol (2009) 14:345–363 355355
5.5 Provision of staffing
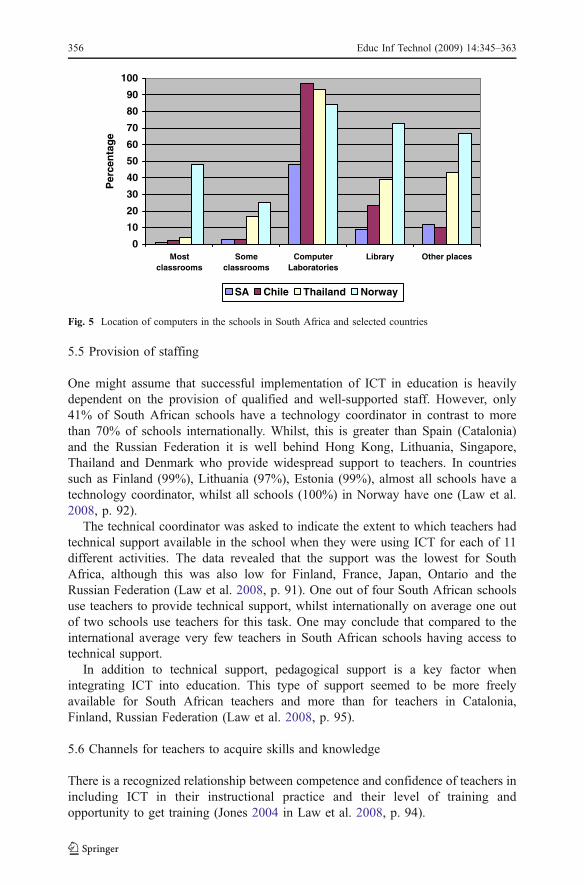
One might assume that successful implementation of ICT in education is heavilydependent on the provision of qualified and well-supported staff. However, only41% of South African schools have a technology coordinator in contrast to morethan 70% of schools internationally. Whilst, this is greater than Spain (Catalonia)and the Russian Federation it is well behind Hong Kong, Lithuania, Singapore,Thailand and Denmark who provide widespread support to teachers. In countriessuch as Finland (99%), Lithuania (97%), Estonia (99%), almost all schools have atechnology coordinator, whilst all schools (100%) in Norway have one (Law et al.2008, p. 92).
The technical coordinator was asked to indicate the extent to which teachers hadtechnical support available in the school when they were using ICT for each of 11different activities. The data revealed that the support was the lowest for SouthAfrica, although this was also low for Finland, France, Japan, Ontario and theRussian Federation (Law et al. 2008, p. 91). One out of four South African schoolsuse teachers to provide technical support, whilst internationally on average one outof two schools use teachers for this task. One may conclude that compared to theinternational average very few teachers in South African schools having access totechnical support.
In addition to technical support, pedagogical support is a key factor whenintegrating ICT into education. This type of support seemed to be more freelyavailable for South African teachers and more than for teachers in Catalonia,Finland, Russian Federation (Law et al. 2008, p. 95).
5.6 Channels for teachers to acquire skills and knowledge
There is a recognized relationship between competence and confidence of teachers inincluding ICT in their instructional practice and their level of training andopportunity to get training (Jones 2004 in Law et al. 2008, p. 94).
0
10
20
30
40
50
60
70
80
90
100
Mostclassrooms
Someclassrooms
ComputerLaboratories
Library Other places
Per
cen
tag
e
SA Chile Thailand Norway
Fig. 5 Location of computers in the schools in South Africa and selected countries
356 Educ Inf Technol (2009) 14:345–363
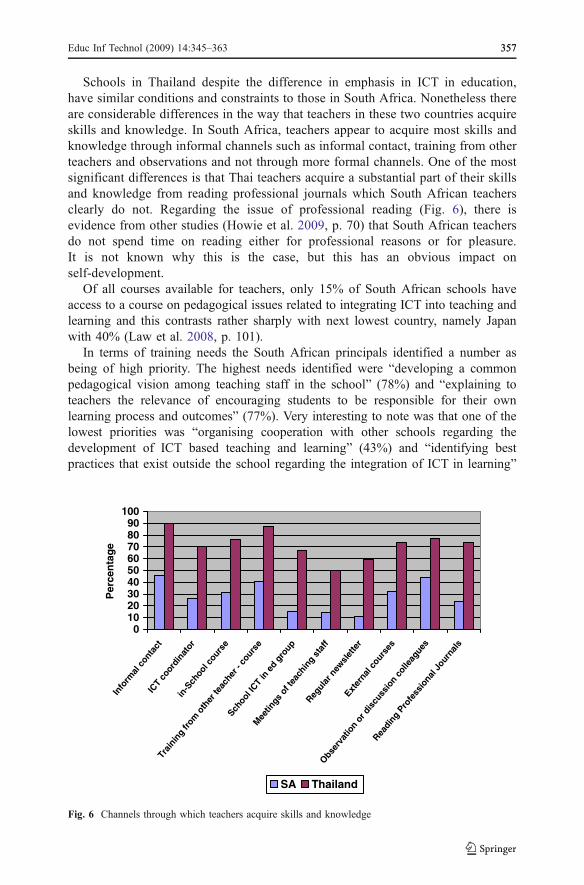
Schools in Thailand despite the difference in emphasis in ICT in education,have similar conditions and constraints to those in South Africa. Nonetheless thereare considerable differences in the way that teachers in these two countries acquireskills and knowledge. In South Africa, teachers appear to acquire most skills andknowledge through informal channels such as informal contact, training from otherteachers and observations and not through more formal channels. One of the mostsignificant differences is that Thai teachers acquire a substantial part of their skillsand knowledge from reading professional journals which South African teachersclearly do not. Regarding the issue of professional reading (Fig. 6), there isevidence from other studies (Howie et al. 2009, p. 70) that South African teachersdo not spend time on reading either for professional reasons or for pleasure.It is not known why this is the case, but this has an obvious impact onself-development.
Of all courses available for teachers, only 15% of South African schools haveaccess to a course on pedagogical issues related to integrating ICT into teaching andlearning and this contrasts rather sharply with next lowest country, namely Japanwith 40% (Law et al. 2008, p. 101).
In terms of training needs the South African principals identified a number asbeing of high priority. The highest needs identified were “developing a commonpedagogical vision among teaching staff in the school” (78%) and “explaining toteachers the relevance of encouraging students to be responsible for their ownlearning process and outcomes” (77%). Very interesting to note was that one of thelowest priorities was “organising cooperation with other schools regarding thedevelopment of ICT based teaching and learning” (43%) and “identifying bestpractices that exist outside the school regarding the integration of ICT in learning”
0102030405060708090
100
Info
rmal
con
tact
ICT
coor
dina
tor
in-S
choo
l cou
rse
Trai
ning
from
oth
er te
ache
r - c
ours
e
Schoo
l ICT
in e
d gr
oup
Mee
tings
of t
each
ing
staf
f
Regul
ar n
ewsl
ette
rExt
erna
l cou
rses
Obser
vatio
n or
dis
cuss
ion
colle
ague
s
Readi
ng P
rofe
ssio
nal J
ourn
als
Per
cen
tag
e
SA Thailand
Fig. 6 Channels through which teachers acquire skills and knowledge
Educ Inf Technol (2009) 14:345–363 357357
(46%), suggesting a far more parochial attitude from almost half of the schools asthere seemed to be little interest in obtaining any information available outside theschool.
5.7 Integration of ICT in maths and science classes
With regard to the integration of ICTs into grade 8 mathematics and scienceclassrooms, fewer than 20% of mathematics (18%) and science teachers (16%)reported using ICT in teaching and learning activities. The largest impact on SouthAfrican teachers regarding ICT was found to be on their administrative efficiency,followed by better monitoring of feedback of students.
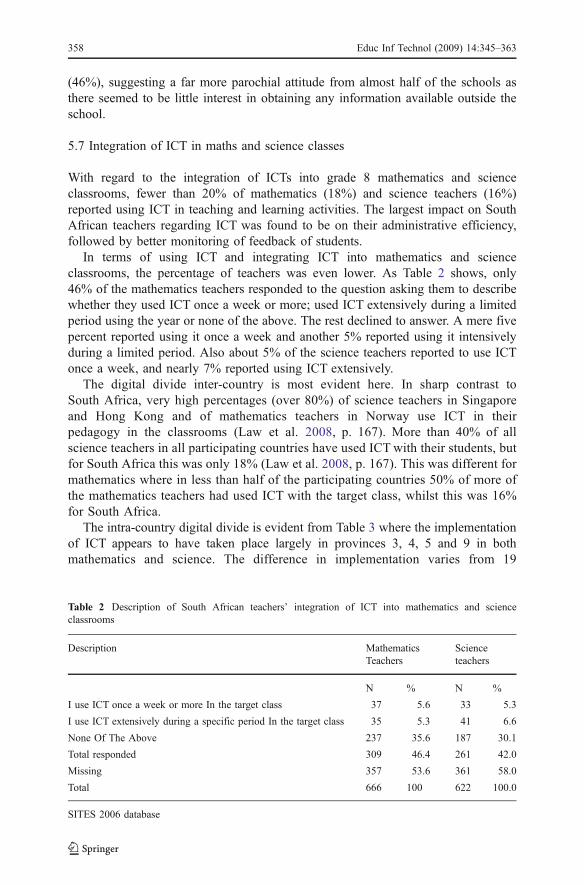
In terms of using ICT and integrating ICT into mathematics and scienceclassrooms, the percentage of teachers was even lower. As Table 2 shows, only46% of the mathematics teachers responded to the question asking them to describewhether they used ICT once a week or more; used ICT extensively during a limitedperiod using the year or none of the above. The rest declined to answer. A mere fivepercent reported using it once a week and another 5% reported using it intensivelyduring a limited period. Also about 5% of the science teachers reported to use ICTonce a week, and nearly 7% reported using ICT extensively.
The digital divide inter-country is most evident here. In sharp contrast toSouth Africa, very high percentages (over 80%) of science teachers in Singaporeand Hong Kong and of mathematics teachers in Norway use ICT in theirpedagogy in the classrooms (Law et al. 2008, p. 167). More than 40% of allscience teachers in all participating countries have used ICT with their students, butfor South Africa this was only 18% (Law et al. 2008, p. 167). This was different formathematics where in less than half of the participating countries 50% of more ofthe mathematics teachers had used ICT with the target class, whilst this was 16%for South Africa.
The intra-country digital divide is evident from Table 3 where the implementationof ICT appears to have taken place largely in provinces 3, 4, 5 and 9 in bothmathematics and science. The difference in implementation varies from 19
Table 2 Description of South African teachers’ integration of ICT into mathematics and scienceclassrooms
Description MathematicsTeachers
Scienceteachers
N % N %
I use ICT once a week or more In the target class 37 5.6 33 5.3
I use ICT extensively during a specific period In the target class 35 5.3 41 6.6
None Of The Above 237 35.6 187 30.1
Total responded 309 46.4 261 42.0
Missing 357 53.6 361 58.0
Total 666 100 622 100.0
SITES 2006 database
358 Educ Inf Technol (2009) 14:345–363
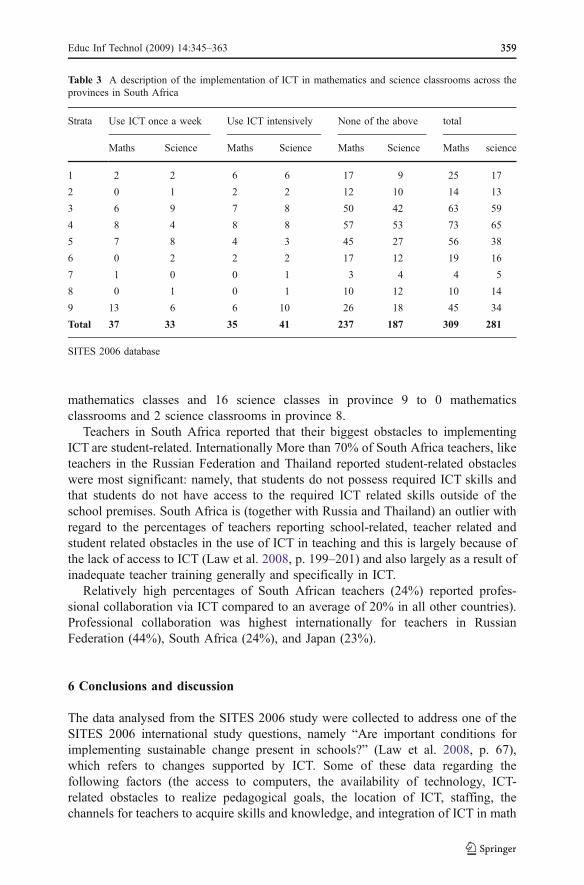
mathematics classes and 16 science classes in province 9 to 0 mathematicsclassrooms and 2 science classrooms in province 8.
Teachers in South Africa reported that their biggest obstacles to implementingICT are student-related. Internationally More than 70% of South Africa teachers, liketeachers in the Russian Federation and Thailand reported student-related obstacleswere most significant: namely, that students do not possess required ICT skills andthat students do not have access to the required ICT related skills outside of theschool premises. South Africa is (together with Russia and Thailand) an outlier withregard to the percentages of teachers reporting school-related, teacher related andstudent related obstacles in the use of ICT in teaching and this is largely because ofthe lack of access to ICT (Law et al. 2008, p. 199–201) and also largely as a result ofinadequate teacher training generally and specifically in ICT.
Relatively high percentages of South African teachers (24%) reported profes-sional collaboration via ICT compared to an average of 20% in all other countries).Professional collaboration was highest internationally for teachers in RussianFederation (44%), South Africa (24%), and Japan (23%).
6 Conclusions and discussion
The data analysed from the SITES 2006 study were collected to address one of theSITES 2006 international study questions, namely “Are important conditions forimplementing sustainable change present in schools?” (Law et al. 2008, p. 67),which refers to changes supported by ICT. Some of these data regarding thefollowing factors (the access to computers, the availability of technology, ICT-related obstacles to realize pedagogical goals, the location of ICT, staffing, thechannels for teachers to acquire skills and knowledge, and integration of ICT in math
Table 3 A description of the implementation of ICT in mathematics and science classrooms across theprovinces in South Africa
Strata Use ICT once a week Use ICT intensively None of the above total
Maths Science Maths Science Maths Science Maths science
1 2 2 6 6 17 9 25 17
2 0 1 2 2 12 10 14 13
3 6 9 7 8 50 42 63 59
4 8 4 8 8 57 53 73 65
5 7 8 4 3 45 27 56 38
6 0 2 2 2 17 12 19 16
7 1 0 0 1 3 4 4 5
8 0 1 0 1 10 12 10 14
9 13 6 6 10 26 18 45 34
Total 37 33 35 41 237 187 309 281
SITES 2006 database
Educ Inf Technol (2009) 14:345–363 359359
and science classes) were analyzed for the purpose of addressing the researchquestions posed for this paper, namely:
& to what extent is South Africa adequately prepared to integrate ICT intomathematics and science grade 8 classes;
& to what extent is ICT integrated in South African mathematics and science grade8 classrooms.
These questions were also addressed against a backdrop of the South Africannational policy on ICT in Education that set out a number of phases in terms ofimplementing ICT in South African primary and secondary schools. These are:
& Enhancing of a system-wide and institutional readiness to use ICT for learning,teaching and administration (2004–2007).
& System-wide integration of ICT into teaching and learning (2007–2010).& ICT should be integrated at all levels of the education system. The roll-out is
aimed for 2010–2013.
These phases cannot be evaluated comprehensively by the data collected inSITES 2006 given that the South African data were collected in 2006 and the firstphase was due to have ended in 2007. However, the data do provide an indication ofthe extent to which aspects of each of the phases had been implemented at the timeof the study. The reflection on these phases is integrated with the findings in relationto the research questions set out in this research.
An analysis of the data on the conditions necessary to integrate ICT intomathematics and science classrooms took into account essential circumstancesnecessary to make the integration of ICT viable. These included: access to hardwareand software as well as connectivity to the Internet and specific data on access tocomputers, availability of technology, obstacles to pedagogical goals, location ofICT, provision of staffing and channels for teachers to acquire skills and technology.Based upon these data, the conclusion is that the essential conditions are not yet inplace in the majority of schools in South Africa and that where the hardware andsoftware is in place, significant attention is required regarding the location of ICT,provision of staffing and the acquisition of skills and pedagogy.
Secondly, in addressing the question to what extent is ICT integrated in SouthAfrican mathematics and science grade 8 classrooms. The answer is simply, that it isnot yet integrated widely but this is not surprising given the fact that the phasesrelated to the integration as planned for by South Africa’s national policy had notstarted by the time the study was implemented. The data do however reveal that asmall proportion of classrooms (fewer than 20%) have already integrated ICT intomathematics and science classes. Policymakers can learn from these few examplesfor the implementation of the policy on ICT in education.
Although a review of the results from SITES 2006 suggests that the conditions forimplementing ICT are not yet in place to ensure sustainable change in education bymeans of ICT (Law et al. 2008, p. 85), there are a number of indications thatconditions for implementing sustainable change have improved since 1998. Thepolicy is in place and ICT is officially on the long list of priorities in education.However, the progress is very slow when compared with peer countries with similardeveloping conditions, namely Chile and Thailand, who appear to have made
360 Educ Inf Technol (2009) 14:345–363
extraordinary progress in their implementation. This is despite having a lower GNPper capita and spending a smaller percentage of their budget on education comparedto South Africa. Whilst there are clearly budgetary constraints for South Africa, thisis possibly not the greatest impediment.
There are serious financial challenges with achieving digital equity. The ongoingcosts of providing access to the technology, educator development strategies,pedagogical and technical support, digital content, escalating telecommunicationcharges, as well as maintenance, upgrades and repairs to infrastructure are costs thusfar not fully reckoned with as part of the national educational budget. Given themagnitude of budgetary demand for additional resources, realistically investment inICT cannot be the sole responsibility of the government. National education reliesconsiderably on the investment from the private sector and other donors. Sources offunding include licensing obligations of telecommunication providers, donationsfrom the private sector, support from international development assistance agencies;partnerships with the public and private sector; and research frameworks foracademic research and development funding for research in e-education. Examplesof public-private partnerships are the negotiated e-rate for schools for connectivitywith telecommunication providers, as well as the negotiated rates for electricity withthe national electricity provider (Department of Education 2004).
Given this and other challenges, if one takes South Africa as exemplary for acountry in the South, the South African SITES 2006 data suggests that there is avery obvious and growing gap between the North and the South in ICT in Educationand ICT usage generally as mentioned in the introduction. Just one example of this isthat 97% homes in Netherlands have ICT compared to 11% homes in South Africa.Another example is that 38% of South African secondary schools have ICTcompared to 100% in Norway. Nonetheless it is a fair question to ask whether in acountry where more than 75% of 11 year olds have not yet reached the basic readinglevel (Howie et al. 2009), ICT is a priority or a luxury. If one takes the distalconsequences of illiteracy and its relationship to digital equity for social inclusionresulting in digital equity in education (Resta and Laferriere 2008, p. 766) seriously,one may conclude that South Africa simply cannot afford to ignore the importanceof ICT in education and its ultimate impact on the country’s well-being. However, itis apparent that the policy’s implementation plan is optimistic given the progress todate with 68% of schools nationally having no access to computers for teaching andlearning (Department of Education 2007). It would appear that the stated timelineswill have to be revised or alternatively the implementation accelerated to achieve theplan’s goals. Only two out of nine provinces are currently committed to implementICT into the classrooms and have the necessary policies and strategies in place to dothis and these being the wealthiest provinces, this does not bode well for the intra-country digital divide mentioned earlier. An indication of this divide is that schoolsin Gauteng, probably the wealthiest province in South Africa, have access tocomputers for learning in 67% of schools but only 48% of those have fewer than 100learners per computer. In contrast schools in Limpopo, one of the poorest provinces,have learner access to computers in 18% of its schools and only 10% of the schoolsin Limpopo have less than 100 learners per computer (Department of Education2007). Clearly the strategies for the less well resourced provinces will have to beaddressed differently if the country as a whole is to succeed.
Educ Inf Technol (2009) 14:345–363 361361
References
Anderson, R. (2008). Implications of the information and knowledge society for education. In J. Voogt &G. Knezek (Eds.), International handbook of information technology in primary and secondaryeducation (pp. 5–22). Berlin: Springer.
Binde, J. (2005). Towards knowledge societies: UNESCO world report. Paris: United Nations EducationalScientific and Cultural Organisation.
Blignaut, A. S., & Howie, S. J. (2009). National policies and practices on ICT in education: South Africa.In T. Plomp, R. E. Anderson, N. Law & A. Quale (Eds.), Cross-national ICT policies and practices ineducation (pp. 653–670). Charlotte: Information Age.
Campbell, D. (2001). Can the digital divide be contained? International Labour Review, 140(2), 119–141.doi:10.1111/j.1564-913X.2001.tb00217.x.
Department of Education. (2004). White paper on e-education: Transforming learning and teachingthrough information and communication technologies (ICTs). Retrieved July 26, 2006, from http://www.info.gov.za/whitepapers/2003/e-education.pdf.
Department of Education. (2006). National targets for ICT implementation during Phase 1 as aggregatedfrom provincial targets. Pretoria: Department of Education.
Department of Education. (2007). National education infrastructure management system. Pretoria:Government Printers.
Erstad, O., & Quale, A. (2009). National policies and practices on ICT in education: Norway. In T. Plomp,R. E. Anderson, N. Law & A. Quale (Eds.), Cross-national ICT policies and practices in education(pp. 551–568). Charlotte: Information Age.
Fleisch, B. (2008). Primary education in crisis: Why South African schoolchildren underachieve inreading and mathematics. Cape Town: Juta.
Haddad, W., & Draxler, A. (2002). Technologies for education: Potentials, parameters and prospects.Paris: United Nations Educational Scientific and Cultural Organisation.
Hinostroza, J. E., Hepp, P., & Cox, C. (2009). National policies and practices on ICT in education: Chile.In T. Plomp, R. E. Anderson, N. Law & A. Quale (Eds.), Cross-national ICT policies and practices ineducation (pp. 153–170). Charlotte: Information Age.
Howie, S. J. (2001).Mathematics and Science performance in grade 8 in South Africa 1998/1999: TIMSS-R. Pretoria: HSRC report.
Howie, S. J., Muller, A., & Paterson, A. (2005). Information and communication technologies in SouthAfrican secondary schools. Pretoria: HSRC.
Howie, S. J., Venter, E. J., van Staden, S., Zimmerman, L., Long, C., Scherman, V., et al. (2009). SouthAfrican children’s reading achievement: Summary report on PIRLS 2006. Published report. Pretoria:Centre for Evaluation and Assessment.
Howie, S. J. (2008). Measuring the health of the education system: lessons from international studies forSouth Africa. Keynote address, presented at Association for the Study of Evaluation and Assessmentnational conference, Pretoria, South Africa, July 2008.
Jones, A. (2004). A review of the research literature on barriers to the uptake of ICT by teachers.Coventry: Becta.
Kozma, R. B. (Ed.). (2003). Technology, innovation, and education change: A global perspective (Firsted.): ISTE.
Law, N. Pelgrum, W. J. & Plomp, T. (2008). Pedagogy and ICT use in schools around the world: Findingsfrom the IEA SITES 2006 Study. Comparative Education Research Centre. Springer: The University ofHong Kong.
Pelgrum, W. J., & Anderson, R. E. (Eds.). (1999). ICT and emerging paradigm for life-long learning: Aworldwide educational assessment of infrastructure, goals and practices. Amsterdam The InternationalAssociation for the Evaluation of Educational Achievement (IEA).
Resta, P., & Laferriere, T. (2008). Issues and challenges related to digital equity. In J. Voogt & G. Knezek(Eds.), International handbook of information technology in primary and secondary education (pp.765–798). Berlin: Springer.
Solomon, G. (2002). Digital equity: it’s not just about access anymore. Technology & Learning, 22(9), 22–26.
UNESCO. (2007). Global monitoring report. Paris: UNESCO.Verspoor, A. M. (2008). The challenge of learning: improving the quality of basic education in sub-
Saharan Africa. In D. Johnson (Ed.), The changing landscape of education in Africa. SymposiumBooks: Oxford.
362 Educ Inf Technol (2009) 14:345–363
Voogt, J., & Knezek, G. (eds). (2008). International handbook of information technology in primary andsecondary education. Berlin: Springer.
Waitayangkoon, P. (2009). National policies and practices on ICT in education: Thailand. In T. Plomp, R.E. Anderson, N. Law & A. Quale (Eds.), Cross-national ICT policies and practices in education (pp.681–695). Charlotte: Information Age.
Warchauer, M. (2002). Reconceptualising the digital divide. First Monday, 7(7). Retrieved July 9, 2005,from http://www.firstmonday.org/issues/issue7_7/warschauer/
World Internet Usage Statistics News and Population Statistics. (2007). Retrieved March 6, 2007 fromhttp://www.internetworldstats.com./stats.htm.
Educ Inf Technol (2009) 14:345–363 363363