Embed Size (px)
Citation preview
Fishery Management Report No. 16-02
South Alaska Peninsula Salmon Annual Management Report, 2015
by
Matthew D. Keyse
Charles W. Russell
and
Elisabeth K. C. Fox
January 2016
Alaska Department of Fish and Game Divisions of Sport Fish and Commercial Fisheries
Symbols and Abbreviations The following symbols and abbreviations, and others approved for the Système International d'Unités (SI), are used without definition in the following reports by the Divisions of Sport Fish and of Commercial Fisheries: Fishery Manuscripts, Fishery Data Series Reports, Fishery Management Reports, and Special Publications. All others, including deviations from definitions listed below, are noted in the text at first mention, as well as in the titles or footnotes of tables, and in figure or figure captions. Weights and measures (metric) centimeter cm deciliter dL gram g hectare ha kilogram kg kilometer km liter L meter m milliliter mL millimeter mm Weights and measures (English) cubic feet per second ft3/s foot ft gallon gal inch in mile mi nautical mile nmi ounce oz pound lb quart qt yard yd Time and temperature day d degrees Celsius °C degrees Fahrenheit °F degrees kelvin K hour h minute min second s Physics and chemistry all atomic symbols alternating current AC ampere A calorie cal direct current DC hertz Hz horsepower hp hydrogen ion activity pH (negative log of) parts per million ppm parts per thousand ppt, ‰ volts V watts W
General Alaska Administrative Code AAC all commonly accepted abbreviations e.g., Mr., Mrs.,
AM, PM, etc. all commonly accepted professional titles e.g., Dr., Ph.D., R.N., etc. at @ compass directions:
east E north N south S west W
copyright corporate suffixes:
Company Co. Corporation Corp. Incorporated Inc. Limited Ltd.
District of Columbia D.C. et alii (and others) et al. et cetera (and so forth) etc. exempli gratia (for example) e.g. Federal Information Code FIC id est (that is) i.e. latitude or longitude lat or long monetary symbols (U.S.) $, ¢ months (tables and figures): first three letters Jan,...,Dec registered trademark trademark United States (adjective) U.S. United States of America (noun) USA U.S.C. United States
Code U.S. state use two-letter
abbreviations (e.g., AK, WA)
Mathematics, statistics all standard mathematical signs, symbols and abbreviations alternate hypothesis HA base of natural logarithm e catch per unit effort CPUE coefficient of variation CV common test statistics (F, t, χ2, etc.) confidence interval CI correlation coefficient (multiple) R correlation coefficient (simple) r covariance cov degree (angular ) ° degrees of freedom df expected value E greater than > greater than or equal to ≥ harvest per unit effort HPUE less than < less than or equal to ≤ logarithm (natural) ln logarithm (base 10) log logarithm (specify base) log2, etc. minute (angular) ' not significant NS null hypothesis HO percent % probability P probability of a type I error (rejection of the null hypothesis when true) α probability of a type II error (acceptance of the null hypothesis when false) β second (angular) " standard deviation SD standard error SE variance population Var sample var
FISHERY MANAGEMENT REPORT NO. 16-02
SOUTH ALASKA PENINSULA SALMON ANNUAL MANAGEMENT REPORT, 2015
by
Matthew D. Keyse
Charles W. Russell
and
Elisabeth K. C. Fox
Alaska Department of Fish and Game Division of Sport Fish, Research and Technical Services 333 Raspberry Road, Anchorage, Alaska, 99518-1565
January 2016
The Fishery Management Reports series was established in 1989 by the Division of Sport Fish for the publication of an overview of management activities and goals in a specific geographic area, and became a joint divisional series in 2004 with the Division of Commercial Fisheries. Fishery Management Reports are intended for fishery and other technical professionals, as well as lay persons. Fishery Management Reports are available through the Alaska State Library and on the Internet: http://www.adfg.alaska.gov/sf/publications/. This publication has undergone regional peer review.
Matthew D. Keyse, Charles W. Russell,
and Elisabeth K. C. Fox
Alaska Department of Fish and Game, Division of Commercial Fisheries 351 Research Court, Kodiak, AK 99615, USA
This document should be cited as follows: Keyse, M. D., C. W. Russell, and E. K. C. Fox. 2016. South Alaska Peninsula salmon annual management report,
2015. Alaska Department of Fish and Game, Fishery Management Report No. 16-02, Anchorage.
The Alaska Department of Fish and Game (department) administers all programs and activities free from discrimination based on race, color, national origin, age, sex, religion, marital status, pregnancy, parenthood, or disability. The department administers all programs and activities in compliance with Title VI of the Civil Rights Act of 1964, Section 504 of the Rehabilitation Act of 1973, Title II of the Americans with Disabilities Act (ADA) of 1990, the Age Discrimination Act of 1975, and Title IX of the Education Amendments of 1972.
If you believe you have been discriminated against in any program, activity, or facility please write: ADF&G ADA Coordinator, P.O. Box 115526, Juneau, AK 99811-5526
U.S. Fish and Wildlife Service, 4401 N. Fairfax Drive, MS 2042, Arlington, VA 22203 Office of Equal Opportunity, U.S. Department of the Interior, 1849 C Street NW MS 5230, Washington DC 20240
The department’s ADA Coordinator can be reached via phone at the following numbers: (VOICE) 907-465-6077, (Statewide Telecommunication Device for the Deaf) 1-800-478-3648,
(Juneau TDD) 907-465-3646, or (FAX) 907-465-6078 For information on alternative formats and questions on this publication, please contact:
ADF&G Division of Sport Fish, Research and Technical Services, 333 Raspberry Road, Anchorage AK 99518 (907) 267-2375.
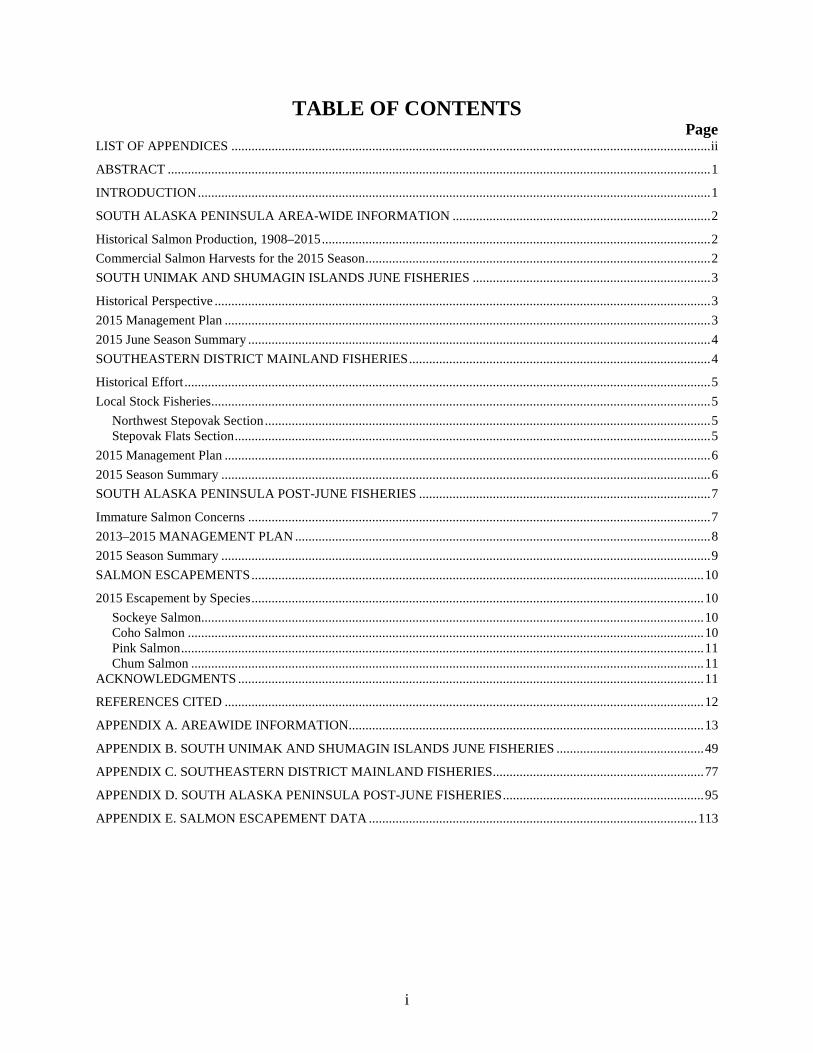
TABLE OF CONTENTS Page
LIST OF APPENDICES ............................................................................................................................................... ii
ABSTRACT .................................................................................................................................................................. 1
INTRODUCTION ......................................................................................................................................................... 1
SOUTH ALASKA PENINSULA AREA-WIDE INFORMATION ............................................................................. 2
Historical Salmon Production, 1908–2015 .................................................................................................................... 2 Commercial Salmon Harvests for the 2015 Season ....................................................................................................... 2 SOUTH UNIMAK AND SHUMAGIN ISLANDS JUNE FISHERIES ....................................................................... 3
Historical Perspective .................................................................................................................................................... 3 2015 Management Plan ................................................................................................................................................. 3 2015 June Season Summary .......................................................................................................................................... 4 SOUTHEASTERN DISTRICT MAINLAND FISHERIES .......................................................................................... 4
Historical Effort ............................................................................................................................................................. 5 Local Stock Fisheries ..................................................................................................................................................... 5
Northwest Stepovak Section ..................................................................................................................................... 5 Stepovak Flats Section .............................................................................................................................................. 5
2015 Management Plan ................................................................................................................................................. 6 2015 Season Summary .................................................................................................................................................. 6 SOUTH ALASKA PENINSULA POST-JUNE FISHERIES ....................................................................................... 7
Immature Salmon Concerns .......................................................................................................................................... 7 2013–2015 MANAGEMENT PLAN ............................................................................................................................ 8 2015 Season Summary .................................................................................................................................................. 9 SALMON ESCAPEMENTS ....................................................................................................................................... 10
2015 Escapement by Species ....................................................................................................................................... 10 Sockeye Salmon...................................................................................................................................................... 10 Coho Salmon .......................................................................................................................................................... 10 Pink Salmon ............................................................................................................................................................ 11 Chum Salmon ......................................................................................................................................................... 11
ACKNOWLEDGMENTS ........................................................................................................................................... 11
REFERENCES CITED ............................................................................................................................................... 12
APPENDIX A. AREAWIDE INFORMATION .......................................................................................................... 13
APPENDIX B. SOUTH UNIMAK AND SHUMAGIN ISLANDS JUNE FISHERIES ............................................ 49
APPENDIX C. SOUTHEASTERN DISTRICT MAINLAND FISHERIES ............................................................... 77
APPENDIX D. SOUTH ALASKA PENINSULA POST-JUNE FISHERIES ............................................................ 95
APPENDIX E. SALMON ESCAPEMENT DATA .................................................................................................. 113
i
LIST OF APPENDICES Appendix Page A1. Map of Alaska Peninsula Management Area with the North and South Peninsula defined. ......................... 14 A2. Map of Alaska Peninsula Management Area from Kupreanof Point to Scotch Cap with South
Peninsula salmon fishing districts defined. ................................................................................................... 15 A3. Map of Alaska Peninsula Area from Kupreanof Point to McGinty Point (Southeastern District) with
statistical salmon fishing areas shown. .......................................................................................................... 16 A4. Map of Alaska Peninsula Area from McGinty Point to Arch Point (South Central District) with
statistical salmon fishing areas shown. .......................................................................................................... 17 A5. Map of Alaska Peninsula Area from Arch Point to Cape Pankof Light (Southwestern District) with
statistical salmon fishing areas shown. .......................................................................................................... 18 A6. Map of Alaska Peninsula Area from Cape Pankof Light to Scotch Cap (Unimak District) with
statistical salmon fishing areas shown. .......................................................................................................... 19 A7. Map of Alaska Peninsula Management Area from Kupreanof Point to Scotch Cap with legal gear types
shown during June. ........................................................................................................................................ 20 A8. Map of Alaska Peninsula Management Area from Kupreanof Point to Scotch Cap with legal gear types
shown from July 1 through October 31. ........................................................................................................ 21 A9. Number of actively fished limited entry permits in the South Alaska Peninsula, 1975–2015. ..................... 22 A10. South Alaska Peninsula salmon harvest, all gear combined, by species and year, 1908–2015 ..................... 23 A11. South Alaska Peninsula pink salmon catch and escapement by year, 1962–2015. ....................................... 26 A12. South Alaska Peninsula chum salmon catch and escapement by year, 1962–2015. ..................................... 31 A13. South Alaska Peninsula commercial salmon harvest, all gear combined, by species and day, 2015. ........... 36 A14. South Alaska Peninsula commercial salmon harvest by species, statistical area, section, and district,
2015. .............................................................................................................................................................. 39 A15. South Alaska Peninsula commercial salmon harvest by species, district, and gear, 2015. ........................... 42 A16. South Peninsula emergency order summary, 2015........................................................................................ 43 B1. Map of South Unimak and Shumagin Islands June fisheries with areas open to fishing defined. ................ 50 B2. South Unimak and Shumagin Islands June commercial salmon fisheries history, 1962–2015. .................... 51 B3. South Unimak and Shumagin Islands June commercial salmon harvest by species and year, 1975–
2015. .............................................................................................................................................................. 60 B4. South Unimak and Shumagin Islands June commercial sockeye and chum salmon harvest by year,
1975–2015. .................................................................................................................................................... 61 B5. Number and type of commercial salmon permits fished in the South Unimak and Shumagin Islands
June fisheries, by year, 1975–2015. .............................................................................................................. 62 B6. South Unimak June commercial salmon harvest by species and year, 1975–2015. ...................................... 63 B7. South Unimak June commercial salmon harvest, all gear combined, by species and day, 2015. .................. 64 B8. South Unimak June commercial purse seine salmon harvest by species and day, 2015. .............................. 65 B9. South Unimak June commercial drift gillnet salmon harvest by species and day, 2015. .............................. 66 B10. South Unimak June commercial set gillnet salmon harvest by species and day, 2015. ................................ 67 B11. Shumagin Islands June commercial salmon harvest by species and year, 1975–2015. ................................. 68 B12. Shumagin Islands June commercial salmon harvest, all gear combined, by species and day, 2015. ............ 69 B13. Shumagin Islands June commercial purse seine salmon harvest by species and day, 2015. ......................... 70 B14. Shumagin Islands June commercial set gillnet salmon harvest by species and day, 2015. ........................... 71 B15. South Unimak June fishery commercial sockeye salmon harvests in number of fish and percent by gear
type and year, 1975–2015. ............................................................................................................................ 72 B16. South Unimak June fishery commercial chum salmon harvests in number of fish and percent by gear
type and year, 1975–2015. ............................................................................................................................ 73 B17. Shumagin Islands June fishery commercial sockeye salmon harvests in number of fish and percent by
gear type and year, 1975–2015. ..................................................................................................................... 74 B18. Shumagin Islands June fishery commercial chum salmon harvests in number of fish and percent by
gear type and year, 1975–2015. ..................................................................................................................... 75
ii
LIST OF APPENDICES (Continued) Appendix Page C1. Map of South Alaska Peninsula Management Area from Kupreanof Point to Scotch Cap with
Southeastern District Mainland highlighted. ................................................................................................. 78 C2. Map of Southeastern District Mainland fishery from Kupreanof Point to McGinty Point with salmon
fishing sections defined. ................................................................................................................................ 79 C3. SEDM fishery regulatory history. ................................................................................................................. 80 C4. Harvest of sockeye salmon, in number of fish and percent, considered to be Chignik-bound by
regulation in the Chignik, Cape Igvak, and Southeastern District Mainland Areas from 1974–2015. .......... 84 C5. Harvest comparison of Chignik-bound sockeye salmon June 1 through July 25, 1974–2015. ..................... 86 C6. Southeastern District Mainland salmon harvest by species, all gear combined, June 1–July 25, 1974–
2015. .............................................................................................................................................................. 87 C7. Southeastern District Mainland salmon harvest by species, set gillnet gear, June 1–July 25, 1974–2015. ... 88 C8. Southeastern District Mainland salmon harvest by species, purse seine gear, June 1–July 25, 1974–
2015. .............................................................................................................................................................. 89 C9. Southeastern District Mainland commercial fishing effort and assignment of sockeye salmon harvests
June 1 through July 25, 1985–2015. .............................................................................................................. 90 C10. Southeastern District Mainland commercial salmon harvest, all gear combined, by species and day,
2015. .............................................................................................................................................................. 92 C11. Northwest Stepovak Section commercial salmon harvest, all gear combined, by species and day, July 1
through July 25, 2015. ................................................................................................................................... 94 D1. South Alaska Peninsula post-June commercial salmon fishery regulatory history. ...................................... 96 D2. Map of the South Peninsula Post-June fishery with terminal areas defined during July 6–21. ..................... 98 D3. Map of the South Peninsula Post-June fishery with terminal areas defined during July 22–31. ................... 99 D4. Map of Popof Island with test fishing sites defined. ................................................................................... 100 D5. Summary of the Shumagin Islands July salmon test fishery, 2015. ............................................................ 101 D6. South Peninsula Post-June commercial salmon harvest, all gear combined, by species, July 6–July 21,
2015. ............................................................................................................................................................ 102 D7. South Peninsula Post-June commercial salmon harvest, all gear combined, by species, July 22–July 31,
2015. ............................................................................................................................................................ 103 D8. South Peninsula Post-June commercial salmon harvest, by species, by day, August 1–August 31, 2015. . 104 D9. South Peninsula fall fishery commercial salmon harvest, by species and year, 1975–2015. ...................... 105 D10. South Peninsula Post-June commercial salmon harvest, by species and year, 1975–2015. ........................ 106 D11. South Peninsula Post-June commercial salmon harvest, by species and year, 1975–2015. ....................... 107 D12. South Peninsula Post-June commercial Chinook salmon harvest by gear and year, 1975–2015. ............... 108 D13. South Peninsula Post-June commercial sockeye salmon harvest by gear and year, 1975–2015. ................ 109 D14. South Peninsula Post-June commercial coho salmon harvest by gear and year, 1975–2015. ..................... 110 D15. South Peninsula Post-June commercial pink salmon harvest by gear and year, 1975–2015. ...................... 111 D16. South Peninsula Post-June commercial chum salmon harvest by gear and year, 1975–2015. .................... 112 E1. Method for calculating indexed total escapement. ...................................................................................... 114 E2. South Peninsula total indexed salmon escapements by species and year, 1974–2015. ............................... 115 E3. South Peninsula total indexed salmon escapements by species, district, section, and stream, 2015. .......... 116 E4. South Peninsula total indexed sockeye salmon escapement by year, 1974–2015. ...................................... 123 E5. South Peninsula total indexed pink salmon escapement by year, 1974–2015. ............................................ 124 E6. South Peninsula total indexed chum salmon escapement by year, 1974–2015. .......................................... 125 E7. Sockeye salmon cumulative escapement counts through the Orzinski Lake weir, 2015 with upper and
lower escapement goals defined. ................................................................................................................. 126 E8. Sockeye, pink, and chum salmon daily and cumulative escapement counts through the Orzinski Lake
weir 2015. .................................................................................................................................................... 127
iii

iv
ABSTRACT This report summarizes the 2015 season and historical information regarding commercial salmon fisheries of the South Alaska Peninsula Management Area (Area M).
The total commercial salmon harvest in the South Alaska Peninsula was 51,077 Chinook salmon Oncorhynchus tshawytscha, 3,207,360 sockeye salmon O. nerka, 265,652 coho salmon O. kisutch, 16,683,602 pink salmon O. gorbuscha, and 675,603 chum salmon O. keta. Harvest of Chinook, sockeye, coho, and pink salmon were above recent 10-year averages (2005–2014). Harvest of chum salmon was below recent 10-year averages (2005-2014). The number of permit holders participating in the fishery was 244. The June commercial salmon harvest included 44,389 Chinook, 1,115,504 sockeye, 20,193 coho, 573,104 pink, and 178,715 chum salmon. Harvest in the South Unimak fishery was 6,643 Chinook, 618,485 sockeye, 740 coho, 67,604 pink, and 42,306 chum salmon, whereas the Shumagin Islands accounted for 37,746 Chinook, 497,019 sockeye, 19,453 coho, 505,500 pink, and 136,409 chum salmon.
There was one 48-hour commercial salmon fishery in the Southeastern District Mainland (SEDM) during the allocation period, June 1 through July 25. The total commercial harvest in the SEDM in 2015 was 231 Chinook, 233,618 sockeye, 7,813 coho, 78,212 pink, and 12,244 chum salmon. The total commercial harvest for the Northwest Stepovak Section, from July 1 through July 25, was 44 Chinook, 110,527 sockeye, 1,306 coho, 18,223 pink, and 4,448 chum salmon. The South Alaska Peninsula Post-June salmon harvest from July 1 through October 31 (minus the SEDM fishery July 1–25) was 6,457 Chinook, 1,858,238 sockeye, 237,646 coho, 16,032,286 pink, and 484,644 chum salmon.
In 2015, the sockeye salmon sustainable escapement goal (SEG) for Orzinski Lake (26,934) was met. Total escapement of pink salmon (7,820,800) was above the South Alaska Peninsula SEG range of 1,637,800–3,275,700 fish. The chum salmon escapement in the Southeastern (250,370 fish), Southwestern (351,150 fish), and South Central (298,900 fish) districts was above the SEGs of 106,400–212,800, 133,400–266,800, and 89,800–179,600, respectively. Limited coho salmon surveys were conducted due to their late season run timing.
Key words: South Alaska Peninsula, commercial salmon fishery, South Unimak, Shumagin Islands, salmon harvest, salmon escapement, Alaska Board of Fisheries, board, salmon, Oncorhynchus, management plan, Chinook O. tshawytscha, sockeye O. nerka, coho O. kisutch, pink O. gorbuscha, chum O. keta, AMR
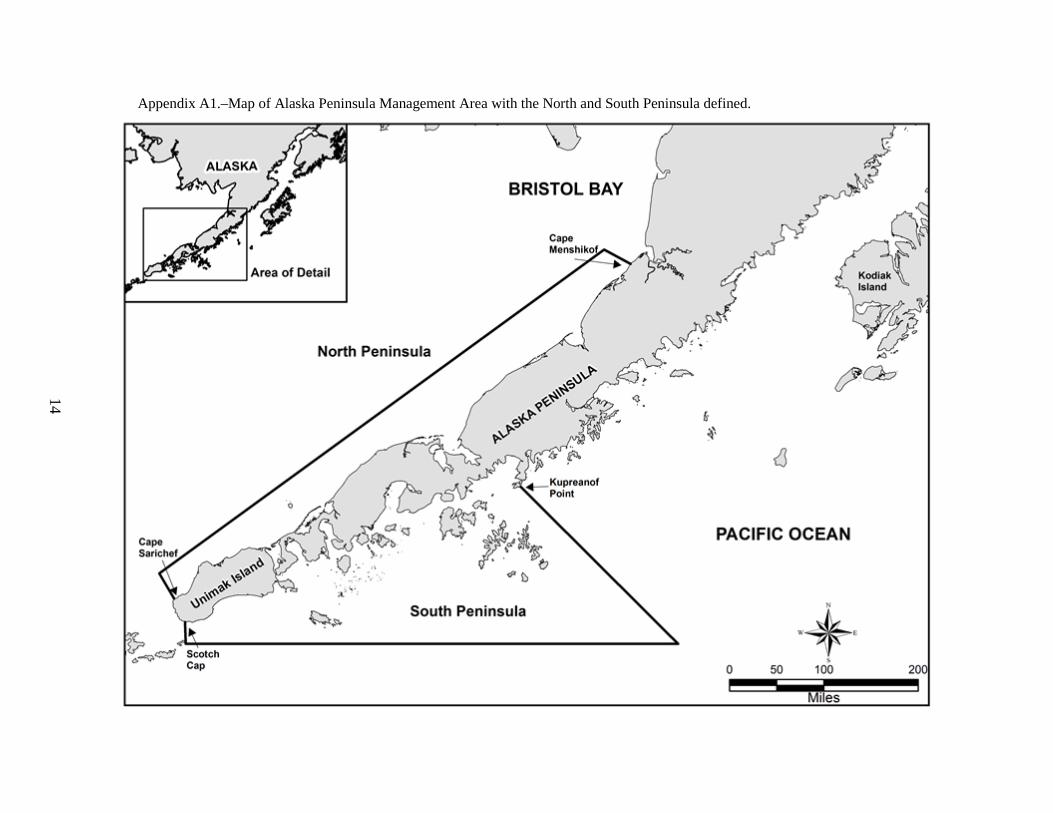
INTRODUCTION The Alaska Peninsula Salmon Management Area is that portion of Area M including waters of the North Alaska Peninsula from Cape Menshikof west to Cape Sarichef, and waters of the South Alaska Peninsula from Kupreanof Point west to Scotch Cap on Unimak Island (Appendix A1). This report describes commercial salmon fisheries located in South Alaska Peninsula waters, further divided into 4 districts: (1) Southeastern District, consisting of waters between Kupreanof Point and McGinty Point; (2) South Central District, consisting of waters between McGinty Point and Arch Point Light; (3) Southwestern District, consisting of waters between Arch Point Light, False Pass, and Cape Pankof Light; and (4) Unimak District, consisting of waters between Cape Pankof Light and Scotch Cap, including Sanak Island (Appendices A2–A6). The Southeastern District is further subdivided into 2 areas with different management plans: (1) the Shumagin Islands Section, consisting of the Shumagin Islands archipelago, and (2) the Southeastern District Mainland (SEDM), consisting of Stepovak, Balboa, and Beaver bays (Appendix A3). Data within this report supersedes data published in previous reports by the Alaska Department of Fish and Game (ADF&G).
Legal gear types in South Alaska Peninsula waters include purse seine, drift gillnet, and set gillnet (Appendix A7–A8). In 2015, 57 of 121 purse seine permits, 119 of 162 drift gillnet permits, and 68 of 116 set gillnet permits reported landings in South Alaska Peninsula waters
1
(Appendix A9). Most of the purse seine and set gillnet permit holders fished South Alaska Peninsula waters throughout the season, whereas most of the drift gillnet permit holders fished South Unimak waters during June and North Alaska Peninsula waters from July into September.
SOUTH ALASKA PENINSULA AREA-WIDE INFORMATION
There are 5 species of Pacific salmon commercially harvested in the South Alaska Peninsula Salmon Management Area: Chinook salmon Oncorhynchus tshawytscha, sockeye salmon O. nerka, coho salmon O. kisutch, pink salmon O. gorbuscha, and chum salmon O. keta. Although commercial salmon fisheries in South Peninsula waters date back to at least 1888, when canneries were operated at Orzinski Bay and Thin Point Cove, catch records are only available since 1908 (Appendix A10). Fish ticket information starting in 1970 is stored in the ADF&G database.
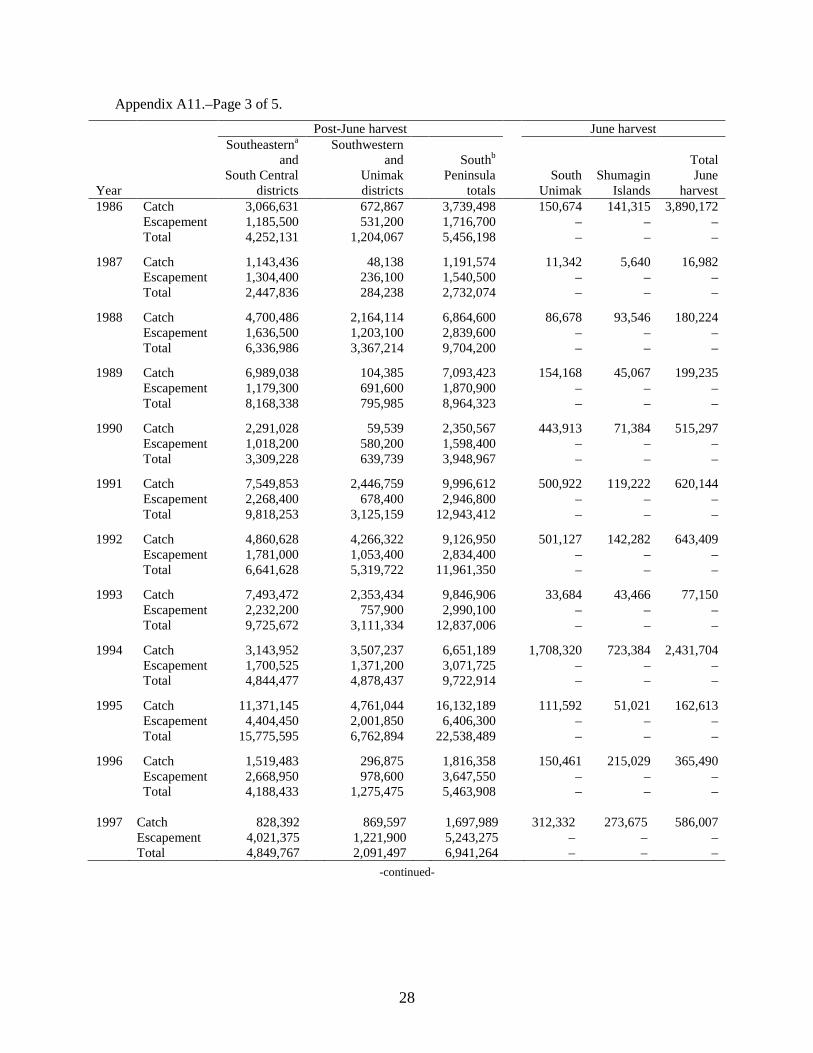
HISTORICAL SALMON PRODUCTION, 1908–2015 Historically, South Alaska Peninsula salmon production has fluctuated dramatically. Since 1962, annual pink salmon total run (catch and escapement and excluding June harvest, which are not considered local stocks for management purposes) ranged from 149,421 fish in 1973 to 23,931,288 fish in 2015 (Appendix A11). Since 1962, annual chum salmon total run (excluding June harvests) ranged from 223,228 fish in 1975 to 2,175,347 fish in 1994 (Appendix A12).
From 1947 to 1977, South Alaska Peninsula annual harvest (including June harvest) averaged 2,896,285 salmon and was composed of 2,567 Chinook, 591,844 sockeye, 26,747 coho, 1,523,900 pink, and 751,226 chum salmon (Appendix A10). From 1978 to 1999, South Alaska Peninsula annual harvest averaged 10,667,192 salmon and was composed of 9,142 Chinook, 2,258,138 sockeye, 257,550 coho, 6,813,576 pink, and 1,328,786 chum salmon (Appendix A10). From 2005 through 2014, South Alaska Peninsula annual harvest averaged 8,680,465 salmon and was composed of 6,215 Chinook, 1,946,132 sockeye, 193,908 coho, 5,641,881 pink, and 892,329 chum salmon (Appendix A10). Pink and sockeye salmon are currently the most abundant salmon species harvested in the South Alaska Peninsula (Appendix A10).
COMMERCIAL SALMON HARVESTS FOR THE 2015 SEASON The first South Alaska Peninsula commercial salmon landing in 2015 occurred on June 7 and the last landing occurred on September 20 (Appendix A13). Commercial harvest (including harvest from the test fishery) of 20,925,351 salmon was composed of 53,236 Chinook, 3,208,911 sockeye, 271,531 coho, 16,711,506 pink, and 680,167 chum salmon (Appendix A13). The Southeastern District had the largest commercial salmon harvest in the South Alaska Peninsula, with a harvest of 13,258,258 fish (63.5%; Appendix A14–A15). South Central, Unimak, and Southwestern districts had harvests of 2,930,475 (14.0%), 4,289,488 (20.5%), and 405,073 (1.9%) fish (Appendix A14–A15). By gear type, seine permit holders accounted for 89.7% of the harvest while drift gillnet permit holders accounted for 2.4%, and set gillnet permit holders accounted for 7.9% of the harvest (Appendix A15). Specific management actions for the South Alaska Peninsula Management Area, as directed by emergency order (EO), are summarized in Appendix A16.
2
SOUTH UNIMAK AND SHUMAGIN ISLANDS JUNE FISHERIES
HISTORICAL PERSPECTIVE The first documented commercial harvests from the South Unimak and Shumagin Islands June fisheries occurred in 1911 (Appendix B1). During the early to mid-1960s, the South Unimak and Shumagin Islands fisheries were open to commercial salmon fishing 5 days per week. From 1967–1970, fishing occurred 7 days per week. Special regulatory meetings were held annually and resulted in different regulations every year from 1971–1974 (Appendix B2).
In 1975, the Alaska Board of Fisheries (BOF) implemented an allocation plan in which the South Unimak and Shumagin Islands June fisheries were granted an annual guideline harvest level (GHL) relative to the projected Bristol Bay inshore sockeye salmon harvest (Appendix B2). Based on historical catch data, 6.8% of the forecasted inshore Bristol Bay harvest was allocated to the South Unimak June fishery and 1.5% was allocated to the Shumagin Islands June fishery. Portions of the GHL were assigned to discrete time periods so the harvest would be spread throughout June. Concerns over large harvests of chum salmon in the early 1980s, combined with a weak Yukon River fall chum salmon run, resulted in a chum salmon cap that, if reached, would result in closure of the fishery for the remainder of June. Between 1986 and 2000, the chum salmon cap was as high as 700,000 fish (1992–1997) and as low as 350,000 fish (1998–2000; Appendix B2).
In January 2001, the BOF modified the South Unimak and Shumagin Islands June salmon fishery management plan. These modifications were in effect through the 2003 season and included eliminating the sockeye salmon GHL and the chum salmon cap. From June 10 through June 24, fishing time for any gear group was limited to 16 hours per day. Gear type constraints were also imposed on the number of consecutive fishing days allowed within a 7-day period (Appendix B2). After June 24, in either the South Unimak or Shumagin Islands fisheries, if the sockeye-to-chum salmon ratio for all gear types was 2:1 or less on any day, the next fishing period was 6 hours in duration for all gear groups in that fishery. If the sockeye-to-chum salmon ratio was 2:1 or less for 2 consecutive fishing periods in either fishery, the season was closed for the remainder of June for all gear types. If the sockeye-to-chum salmon ratio was greater than 2:1, a 6-hour fishing period could be extended to a maximum of 16 hours.
In February 2004, the board modified the South Unimak and Shumagin Islands June Fisheries Management Plan (5 AAC 09.365) by establishing a fishing schedule that began at 6:00 AM on June 7 and ended at 10:00 PM on June 29. Fishing periods were 88 hours in duration interspersed by 32-hour closures, except for the final fishing period of 64 hours. This schedule provided 416 hours of concurrent opportunity for all gear types. In addition, the South Unimak fishery was expanded to include the entire Southwestern District and the West and East Pavlof Bay sections of the South Central District (Appendix B1and B2).
2015 MANAGEMENT PLAN In 2013, the BOF discussed proposed changes to the June Management Plan. During the meeting, discussions focused on chum salmon harvest and Chinook salmon harvest in June. A number of proposals and amendments were put before the board that included, but were not
3
limited to, complete closure of the June fishery, reinstatement of the chum salmon cap, and ratio based management.
The BOF modified the June schedule for seine and drift gillnet gear by delaying the start date to June 10, which reduced fishing time by 64 hours. The June fishing schedule for set gillnet gear remained unchanged (Appendix B2).
2015 JUNE SEASON SUMMARY The 2015 South Unimak and Shumagin Islands June fishing schedule began at 6:00 AM on June 7 for set gillnet gear and at 6:00 AM on June 10 for seine and drift gillnet gear. A total of 227 permit holders harvested 44,389 Chinook, 1,115,504 sockeye, 20,193 coho, 573,104 pink, and 178,715 chum salmon during the 2015 June fisheries (Appendices B3–B5).
During the 2015 South Unimak June fishery, 163 permit holders harvested 6,643 Chinook, 618,485 sockeye, 740 coho, 67,604 pink, and 42,306 chum salmon (Appendices B6 and B7). In the South Unimak June fishery, 23 purse seine permit holders harvested 5,536 Chinook 305,014 sockeye, 368 coho, 63,350 pink, and 6,038 chum salmon (Appendix B8); 117 drift gillnet permit holders harvested 784 Chinook, 130,580 sockeye, 146 coho, 3,702 pink, and 35,285 chum salmon (Appendix B9); and 23 set gillnet permit holders harvested 323 Chinook, 182,891 sockeye, 226 coho, 552 pink, and 983 chum salmon (Appendix B10).
During the 2015 Shumagin Islands June fishery, 88 permit holders harvested 37,746 Chinook, 497,019 sockeye, 19,453 coho, 505,500 pink, and 136,409 chum salmon (Appendices B11 and B12). Landings by 43 purse seine permit holders accounted for 37,639 Chinook, 282,466 sockeye, 16,912 coho, 503,617 pink, and 126,339 chum salmon (Appendix B13); and 45 set gillnet permit holders harvested 107 Chinook, 214,553 sockeye, 2,541 coho, 1,833 pink, and 10,070 chum salmon (Appendix B14).
Purse seine permit holders harvested 49.3% of sockeye and 14.3% of chum salmon in the South Unimak June fishery (Appendix B15 and B16) and 56.8% of sockeye and 92.6% of chum salmon in the Shumagin Islands fishery (Appendices B17–B18). Drift gillnet permit holders harvested 21.1% of sockeye and 83.4% of chum salmon in the South Unimak fishery (Appendices B15 and B16). Set gillnet permit holders harvested 29.6% of sockeye and 2.3% of chum salmon in the South Unimak fishery (Appendix B15 and B16) and 43.2% of sockeye and 7.4% of chum salmon in the Shumagin Islands June fishery (Appendices B17–B18).
SOUTHEASTERN DISTRICT MAINLAND FISHERIES The SEDM salmon fishery occurs in South Alaska Peninsula mainland waters from Kupreanof Point in the east, to McGinty Point in the west (Appendix C1). The SEDM is subdivided into East Stepovak, Stepovak Flats, Northwest Stepovak, Southwest Stepovak, Balboa Bay, and Beaver Bay sections (Appendix C2).
The Southeastern District Management Plan (5 AAC 09.360) was formally adopted in 1980. Although it closely followed similar guidelines as previous seasons, it established that 80% of sockeye salmon harvested are considered destined for Chignik River. In 1985, June 1 through July 25 sockeye salmon harvest allocation criteria were added to the management plan. Harvest allocation has fluctuated between 6.0% and 7.6% of the total Chignik harvest since it was introduced (Appendix C3). Currently, SEDM is managed on a 7.6% allocation of sockeye salmon harvested in the Chignik Management Area (CMA) through July 25.
4
Since 1985, when allocation criteria were put in place, SEDM harvest has ranged from 0.9% in 1989 to 11.5% in 2005 of sockeye salmon harvested in the CMA (Appendix C4) In 1997, 2007, 2008, and 2014, there was no fishery due to a weak sockeye salmon return to Chignik River. The recent 10-year (2005–2014) SEDM sockeye salmon harvest averaged 82,525 fish or 5.4% of sockeye salmon harvested in the CMA (Appendices C4 and C5).
The current plan stipulates that 80% of sockeye salmon harvested in SEDM before July 1 are considered Chignik-bound. Beginning July 1, sockeye salmon harvested in Northwest Stepovak Section (NWSS) are considered 100% local fish and NWSS is managed on the Orzinski Lake sockeye salmon run. After July 25, commercial fishery openings are based on the strength of local pink, chum, and coho salmon stocks.
HISTORICAL EFFORT In 1972, the State of Alaska adopted limited entry management. With limited entry, a fixed number of permits were created and only people with these new permits were allowed to fish. However, because many South Alaska Peninsula fishermen participated in both set gillnet and purse seine fisheries prior to limited entry, they received a permit card for each gear type. Many dual permit holders sold or transferred their set gillnet permits and retained their purse seine permits. Sold or transferred permits increased effort in the SEDM fishery (Appendices C6 and C7) because many set gillnet permits that were previously used part-time were then fished full-time. This increase was reflected in both the number of set gillnet permits fished and the number of landings. The number of set gillnet permits fished increased from a low of 7 permits in 1975 to a high of 64 permits in 1993, 1996, and 2000 (Appendix C7). The numbers of set gillnet landings from SEDM increased from a low of 14 in 1975 to a high of 1,657 in 1984 (Appendix C7). Between 2005 and 2014, the number of set gillnet permits fished in the SEDM averaged 37 with an average of 731 total landings (Appendix C7).
The number of purse seine permits fished has fluctuated since 1974, from 6 in 1975, 1987, and 1992, to 69 in 1990. In the most recent 10 years (2005–2014) the number of permits has averaged 14 (Appendix C8). Purse seine landings in SEDM have fluctuated between 9 and 145 since 1985 but have averaged 27 landings over the most recent 10 years (2005–2014; Appendix C8).
LOCAL STOCK FISHERIES Northwest Stepovak Section Prior to July 1, 80% of sockeye salmon harvested in NWSS are attributed to the Chignik-bound sockeye salmon allocation (5 AAC 09.360 (f)). After July 1, sockeye salmon caught within the NWSS are considered Orzinski Lake bound. Orzinski Lake sockeye salmon escapements are assessed using a weir, with an escapement goal developed from historical aerial surveys and weir counts (Appendix E8). The sockeye salmon escapement goal for Orzinski Lake is 15,000–20,000 fish (Sagalkin and Erickson 2013).
Stepovak Flats Section Prior to July 26, Stepovak Flats may open to commercial salmon fishing concurrently with the rest of the SEDM. Eighty percent of sockeye salmon harvested in the Stepovak Flats Section are considered Chignik-bound and assigned to the 7.6% allocation criteria stated in the SEDM salmon management plan. From July 26 to July 28, commercial salmon fishing is managed based
5
on run strength of pink and chum salmon returning to Stepovak Flats streams. The entire section is closed from July 29 through September 30 to protect schooling chum salmon. A more detailed regulatory history can be found in Appendix C3.
2015 MANAGEMENT PLAN Under the current SEDM management plan (5 AAC 09.360):
1. The percentage of Chignik-bound sockeye salmon allocated to the SEDM fishery was 7.6% of the total number of sockeye salmon harvested in the CMA through July 25.
2. Prior to July 1, 80% of sockeye salmon caught in the SEDM were considered to be Chignik-bound salmon.
3. Beginning July 1, sockeye salmon caught in the NWSS (Appendix C2) were considered 100% local fish and not counted toward the Chignik allocation. Fishing time in NWSS beginning on July 1, excluding Orzinski Bay, could not be more than four 24-hour periods with no more than 48 hours continuous fishing during a 7-day period. Fishing time in Orzinski Bay, after June 30, was based on sockeye salmon escapement into Orzinski Lake.
4. If Orzinski Lake escapement met or exceeded 25,000 sockeye salmon, NWSS and Orzinski Bay could be opened concurrently as follows:
(A) set gillnet gear could be operated continuously until midnight July 25, and
(B) purse seine and hand purse seine gear could be operated for no more than an aggregate of 96 hours during a 7-day period.
5. A limited portion of Orzinski Bay could open to purse seine gear prior to July 11 if the department determined the interim escapement objectives had been exceeded.
6. The Stepovak Flats Section was managed for chum salmon returning to Stepovak Flats streams for the entire season. However, 80% of the sockeye salmon caught in this section through July 25 were considered Chignik-bound fish.
7. The area encompassing Kupreanof Point was closed to commercial salmon fishing from July 6 through August 31. The department could extend the Kupreanof Point closed waters area through the end of the season by emergency order.
8. From July 26 through October 31, the fishery was managed for local sockeye, pink, chum, and coho salmon stocks.
9. From July 26 through October 31, the fishery was closed for at least one 36-hour period within a 7-day period.
2015 SEASON SUMMARY The 2015 forecast for the total run estimate of Chignik-bound sockeye salmon was 1,320,000 fish for early run (Black Lake) and 1,217,000 fish for late run (Chignik Lake) (Munro 2015).
Due to late run timing of the early run in the CMA, harvest did not exceed 600,000 until July 15. On July 16, one 48-hour commercial fishing period was permitted, for both set gillnet and seine gear, within the SEDM. Sockeye salmon harvest in the SEDM, of fish considered to be Chignik bound, was 98,473 fish and represented 9.7% of the total sockeye salmon harvest in the CMA (Appendices C4 and C9) A total of 231 Chinook, 233,618 sockeye, 7,813 coho, 78,212 pink
6
salmon and 12,214 chum salmon were harvested in the SEDM during the June 1–July 25 timeframe (Appendices C6 and C10).
In 2015, Orzinski Lake weir was operated from June 6 through August 6 and passed 26,934 sockeye salmon (Appendix E8). Aerial surveys were conducted after the weir was removed but no additional sockeye salmon were observed in Orzinski Lake. Due to strong Orzinski Lake sockeye salmon escapement, commercial fishing was permitted in the Northwest Stepovak Section with the first opening on July 10 (Appendix C11). There were a total of three 96-hour fishing periods in the NWSS prior to July 26. Due to high escapement levels, Orzinski Bay was open continuously from July 10 through the end of the season. Closed-waters markers were reduced to the stream mouth on July 28 (Appendix A16). The total harvest in the NWSS from July 1 through July 25 was 44 Chinook, 110,527 sockeye, 1,306 coho, 18,223 pink, and 4,448 chum salmon (Appendix C11).
Between July 26 and August 31, SEDM is managed on the abundance of local pink, chum, and coho salmon. Due to strong returns of pink and chum salmon into SEDM streams, weekly fishing periods were established throughout the month of August and September that were interspersed by 36-hour closures (Appendix A16). The total harvest in SEDM for the 2015 season was 261 Chinook, 624,096 sockeye, 22,646 coho, 1,595,876 pink, and 56,299 chum salmon (Appendix C10).
SOUTH ALASKA PENINSULA POST-JUNE FISHERIES The South Alaska Peninsula Post-June salmon fishery takes place in Southeastern (excluding SEDM prior to July 26), South Central, Southwestern, and Unimak districts from July 1 through the end of the season (Appendix A2; 5 AAC 09.366).
The Post-June Salmon Management Plan (5 AAC 09.366) was formally adopted in 1991. Before 1991, the Post-June fishery was divided into 3 time frames: July 6 to approximately July 18, July 18 to approximately August 20, and from September 1 until the end of the season. These date ranges were based on run strengths of local chum, pink, and coho salmon respectively (Appendix D1).
In 1991, after the management plan was put into place by the BOF, commercial fishing was restricted to terminal areas from July 6 to July 19. These terminal areas included Zachary Bay, the northern portion of Pavlof Bay and Cold Bay, Thin Point, Canoe Bay, and Morzhovoi Bay sections (Appendices D1). From July 20 until the close of the season, the entire South Peninsula could be opened to commercial salmon fishing by EO based on local run strength (except in the SEDM through July 25).
Since 1991, the BOF has made changes to the management plan. The opening date that allows fishing in non-terminal areas was moved from July 20 to July 6. Also, time periods for Post-June fisheries were changed to July 6–July 21 and July 22–July 31, each with distinct fishing periods, specific closures in non-terminal areas, and additional terminal areas in the latter period. In 2010, the BOF extended the fishing season through October 31.
IMMATURE SALMON CONCERNS The 1991 BOF decision to allow commercial salmon fishing in limited areas within South Peninsula waters was made partially due to concerns for immature Chinook, sockeye, and chum salmon that were inadvertently gilled during purse seine gear fishing operations (McCullough
7
and Shaul 1992). The presence of immature salmon in South Peninsula waters, which the department first became aware of in 1962, has warranted restrictions to commercial fishing in some years. These restrictions were applied to all gear types in affected areas from late June into July in 1963, 1968, 1969, 1974, and 1979, and for purse seine fishing only during the 1989–1992, 1999, 2001, 2003, 2008, and 2015 seasons (McCullough and Shaul 1992 and Poetter 2009).
A high incidence of immature salmon has been prevalent in the Shumagin Islands Section where concern for catching immature salmon is restricted to purse seine gear. Under current regulations, seine mesh size may not exceed 3½ inches except for the first 25 meshes above the lead line, which may not exceed 7 inches (5 AAC 09.332(a)). Set gillnet gear has larger mesh size (minimum of 5¼ inches; 5 AAC 09.331(b)(3)), which allows immature salmon to pass through the gear. Immature salmon usually migrate out of the area by July 23, although in 1992 closures were necessary until July 29.
In 1990, the department test fishing program was instituted in the Shumagin Islands to determine presence and abundance of immature salmon in South Peninsula waters prior to July commercial fishing periods. In the Shumagin Islands Section, most purse seine fishing effort has occurred in the nearshore waters of Popof Island from Popof Head to Red Bluff, and thus test fishing sites were established in those areas (Appendix D4).
In 2001, the BOF adopted a regulation that defined immature salmon and required the department to conduct an immature salmon test fishery in July (5 AAC 09.366(i)). A more detailed regulatory history can be found in Appendix D1.
2013–2015 MANAGEMENT PLAN The Post-June Salmon Management Plan (5 AAC 09.366) had 3 major components:
1. From July 6 through July 21, there was one 33-hour fishing period followed by a 63-hour closure. After the first fishing period, there were four 36-hour fishing periods interspersed by 60-hour closures in the Shumagin Islands Section of the Southeastern District, and the South Central, Southwestern, and Unimak districts (Appendix D1 and D2). Additional fishing time could be allowed in terminal fishing areas based on local salmon run strength. During July 6 through July 21, terminal areas included the northern portion of Pavlof Bay (north of the latitude of Black Point; Appendix A4), the southern portion of Zachary Bay (statistical area 282-35), and the Canoe Bay, Cold Bay, Morzhovoi Bay, and Thin Point sections (Appendix D2).
2. From July 22 through July 31, there were three 36-hour fishing periods interspersed by 60-hour closures. In addition to those terminal areas identified for the time frame of July 6 through July 21, the Deer Island, Belkofski Bay, and Mino Creek–Little Coal Bay sections were added (Appendices D1 and D3). Fishing in non-terminal areas could not begin before noon on July 23.
3. From August 1 through August 31, fishing periods were based on abundance of local sockeye, coho, pink, and chum salmon stocks. From September 1 through October 31, fishing periods were based on abundance of coho salmon stocks, although the department could consider abundance of late pink and chum salmon stocks.
8
2015 SEASON SUMMARY The test fishery was conducted on 3 days: July 2, 8, and 9. Test fishery results for July 2 showed numbers of immature salmon above the regulatory threshold (100 per set; Appendix D5). Because numbers of immature salmon were above the regulatory threshold, purse seines were restricted from fishing within the Shumagin Islands Section of the Southeastern District during the 33-hour fishing period July 6. On July 8 and 9, test fishery results indicated the numbers of immature salmon had dropped below the regulatory threshold and the Shumagin Islands Section of the Southeastern District was reopened to purse seines during subsequent fishing periods (Appendix D5).
In 2015, 158 permit holders fished in the South Peninsula Post-June fishery (Appendix D11). The July 6–21 commercial salmon harvest from South Peninsula non-terminal areas was composed of 5,280 Chinook, 705,240 sockeye, 112,636 coho, 1,308,854 pink, and 96,644 chum salmon (Appendix D6). Terminal area harvests during this time frame totaled 0 Chinook, 16,647 sockeye, 715 coho, 9,323 pink, and 6,047 chum salmon (Appendix D6). The July 22–31 commercial salmon harvest from South Peninsula non-terminal areas (including SEDM after July 25) was 1,001 Chinook, 489,735 sockeye, 64,132 coho, 1,952,237 pink, and 92,965 chum salmon (Appendix D7). Terminal area harvests during this time frame totaled 6 Chinook, 43,763 sockeye, 869 coho, 403,407 pink, and 34,825 chum salmon (Appendix D7).
Beginning August 1, commercial salmon fishing opportunity is provided at the discretion of the department based on escapement, run timing, and commercial harvest. Large escapements of pink salmon into South Peninsula systems allowed ample fishing opportunity in August and September. Due to late returns of chum salmon, commercial fishing was limited in Bechevin Bay, Belkofski Bay, Volcano Bay, and the Stepovak Flats Section. The commercial salmon harvest during August consisted of 170 Chinook, 589,291 sockeye, 56,035 coho, 11,414,274 pink, and 224,916 chum salmon (Appendix D8).
In September, continued presence of large numbers of pink salmon allowed ongoing commercial fishing. During September, 0 Chinook, 13,554 sockeye, 3,036 coho, 944,181 pink, and 29,238 chum salmon were harvested (Appendix D9).
The 2015 South Alaska Peninsula (minus the SEDM July 1–25 harvest) Post-June total commercial salmon harvest was 6,457 Chinook, 1,858,238 sockeye, 237,646 coho, 16,032,286 pink, and 484,644 chum salmon (Appendix D10). The Post-June total harvest including the SEDM harvest was 6,688 Chinook, 2,091,848 sockeye, 245,236 coho, 16,110,488 pink, and 496,879 chum salmon (Appendix D11).
In 2015, purse seine, drift gillnet, and set gillnet gear commercially harvested Chinook, sockeye, coho, pink, and chum salmon in the South Peninsula during the Post-June fishery (including the SEDM fishery). Chinook salmon were caught incidentally by all 3 gear groups during the 2015 Post-June fishery with 6,541 (97.8%) caught by purse seine, 26 (0.4%) caught by drift gillnet, and 121 (1.8%) caught by set gillnet for a total of 6,688 fish (Appendix D12). A total of 2,091,848 sockeye salmon were harvested, of which 1,234,053 (59.0 %) were caught by purse seine, 56,781 (2.7%) were caught by drift gillnet, and 801,014 (38.3%) were caught by set gillnet (Appendix D13). Coho salmon were harvested by all gear groups with 196,071 (80.0%) caught by purse seine, 17,492 (7.1%) by drift gillnet, and 31,673 (12.9%) by set gillnet for a total of 245,236 fish (Appendix D14). A total of 16,110,488 pink salmon were harvested, of which 15,553,122 (96.5%) were caught by purse seine, 231,340 (1.4%) were caught by drift gillnet, and
9
326,026 (2.0%) were caught set gillnet (Appendix D15). Chum salmon were harvested by all 3 gear groups with 394,706 (79.4%) caught by purse seine, 29,108 (5.9%) by drift gillnet, and 73,065 (14.7%) by set gillnet for a total of 496,879 fish (Appendix D16).
The 2015 harvests of Chinook, sockeye, coho, pink, and chum salmon were above the recent 10-year average (2005–2014) during the South Alaska Peninsula Post-June commercial salmon fishery harvests (Appendix D10 and D11).
SALMON ESCAPEMENTS The South Alaska Peninsula has approximately 224 salmon streams, with sockeye salmon found in 37, pink salmon in at least 204, chum salmon in 136, and coho salmon in 81 streams (McCullough 2001). In 2015, most salmon escapements were monitored by aerial surveys using small fixed-wing aircraft. The Orzinski Lake system was monitored with a salmon weir operated by the department. Pink and chum salmon escapements were estimated with the indexed total escapement method, and sockeye salmon systems were estimated using peak escapements (Appendix E1).
Alaska salmon production was low during the 1960s and early 1970s. The Alaska salmon runs began to rebuild in the mid-1970s, and most Alaska Peninsula salmon stocks recovered by 1977. From 1962–1976, South Alaska Peninsula total indexed salmon escapement averaged 1,280,100 fish composed of 27,813 sockeye salmon, 957,887 pink salmon, and 294,400 chum salmon (Appendix E2 in Poetter and Nichols, 2014). There are no known Chinook salmon spawning streams along South Alaska Peninsula waters, and coho salmon escapement data are inconsistent.
It is beyond the scope of this report to publish detailed escapement goals for each species by location and the methodologies used in their development. Additional information on escapement goals and escapements by stream or district used in the following discussion can be found in McCullough (2001) and Sagalkin and Erickson (2013).
2015 ESCAPEMENT BY SPECIES Sockeye Salmon The total 2015 estimated South Alaska Peninsula sockeye salmon escapement of 96,110 fish (Appendices E2 and E3) was above the recent 10-year average (2005–2014) of 73,429 fish. Escapement into Mortensen Lagoon (20 fish) was below its sustainable escapement goal (SEG) range of 3,200–6,400 fish. Survey conditions were poor throughout most of the season, but subsistence harvest combined with the late timing of the sockeye salmon run indicated that the escapement was much larger than could be verified by aerial surveys. Escapement into Thin Point Lagoon (19,900 fish) was within its SEG range of 14,000–28,000 fish. The Orzinski Lake sockeye salmon escapement for 2015 was 26,934 fish through August 5, which exceeded the SEG range of 15,000–20,000 (Appendices E7 and E8; Sagalkin and Erickson 2013).
Coho Salmon The total indexed coho salmon escapement for 2015 was 2,320 (Appendix E3). Many streams were not surveyed, surveyed once, or not surveyed during times of peak abundance. The coho salmon escapement goal for Thin Point Lake was eliminated at the 2013 board meeting (Sagalkin and Erickson 2013).
10
Pink Salmon The total 2015 indexed South Alaska Peninsula pink salmon escapement of 7,820,800 fish (Appendices E2, E3, and E5) was above the South Peninsula odd-year pink salmon SEG range of 1,637,800–3,275,700 fish (Sagalkin and Erickson 2013). From 2005–2014, the South Alaska Peninsula total pink salmon indexed escapement averaged 2,549,141 fish (Appendix E2).
Chum Salmon In 2015, the total estimated South Alaska Peninsula chum salmon escapement of 906,420 fish (Appendices E2, E3, and E6) was above the recent 10-year average (2005–2014) of 537,700 fish. Escapement of chum salmon into the Southeastern (250,370 fish), Southwestern (351,150 fish), and South Central (298,900 fish) districts was above their SEG ranges of 106,400–212,800, 133,400–266,800, and 89,800–179,600 (Sagalkin and Erickson 2013; Appendix E3). The Unimak District chum salmon escapement goal was removed prior to the 2013 season.
ACKNOWLEDGMENTS The authors would like to thank Kirsten Woodard and Kaarle Strailey for their work at the Orzinski Weir; our pilots, Mark Patterson and Paul Horn, for aerial logistics and survey support; and the crew of the R/V Resolution for providing logistical support. The authors also thank Amanda Dorner, Kathy Greer, Ric Shepard, Neil Moomey, Doug Dorner, and Darren Asuncion for their technical support. Special thanks go to Todd Anderson, Dawn Wilburn, Reid Johnson, Jeff Wadle, and Kevin Schaberg for editing this publication.
11
REFERENCES CITED McCullough, J. N. 2001. Alaska Peninsula Management Area salmon systems: managers manual. Alaska
Department of Fish and Game, Division of Commercial Fisheries, Regional Information Report 4K01-1, Kodiak.
McCullough, J. N., and A. R. Shaul. 1992. The incidence of immature salmon in South Peninsula purse seine fisheries, 1963-91. Alaska Department of Fish and Game, Division of Commercial Fisheries, Regional Information Report 4K92-17, Kodiak.
Munro, A. R., editor. 2015. Run forecasts and harvest projections for 2015 Alaska salmon fisheries and review of the 2014 season. Alaska Department of Fish and Game, Special Publication No. 15-04, Anchorage.
Poetter, A. D. 2009. South Alaska Peninsula annual salmon management report, 2008. Alaska Department of Fish and Game, Division of Commercial Fisheries, Fishery Management Report No. 09-10, Anchorage.
Poetter, A. D., and N. W. Nichols. 2014. South Alaska Peninsula salmon annual management report, 2013. Alaska Department of Fish and Game, Fishery Management Report No. 14-15, Anchorage.
Sagalkin, N. H., and J. W. Erickson. 2013 Review of salmon escapement goals in the Alaska Peninsula and Aleutian Islands Management Areas, 2012. Alaska Department of Fish and Game, Fishery Manuscript No. 13-01, Anchorage.
12
APPENDIX A. AREAWIDE INFORMATION
13
14
Appendix A1.–Map of Alaska Peninsula Management Area with the North and South Peninsula defined.
15
Appendix A2.–Map of Alaska Peninsula Management Area from Kupreanof Point to Scotch Cap with South Peninsula salmon fishing districts defined.
Appendix A3.–Map of Alaska Peninsula Area from Kupreanof Point to McGinty Point (Southeastern District) with statistical salmon fishing areas shown.
16
17
Appendix A4.–Map of Alaska Peninsula Area from McGinty Point to Arch Point (South Central District) with statistical salmon fishing areas shown.
18
Appendix A5.–Map of Alaska Peninsula Area from Arch Point to Cape Pankof Light (Southwestern District) with statistical salmon fishing areas shown.
19
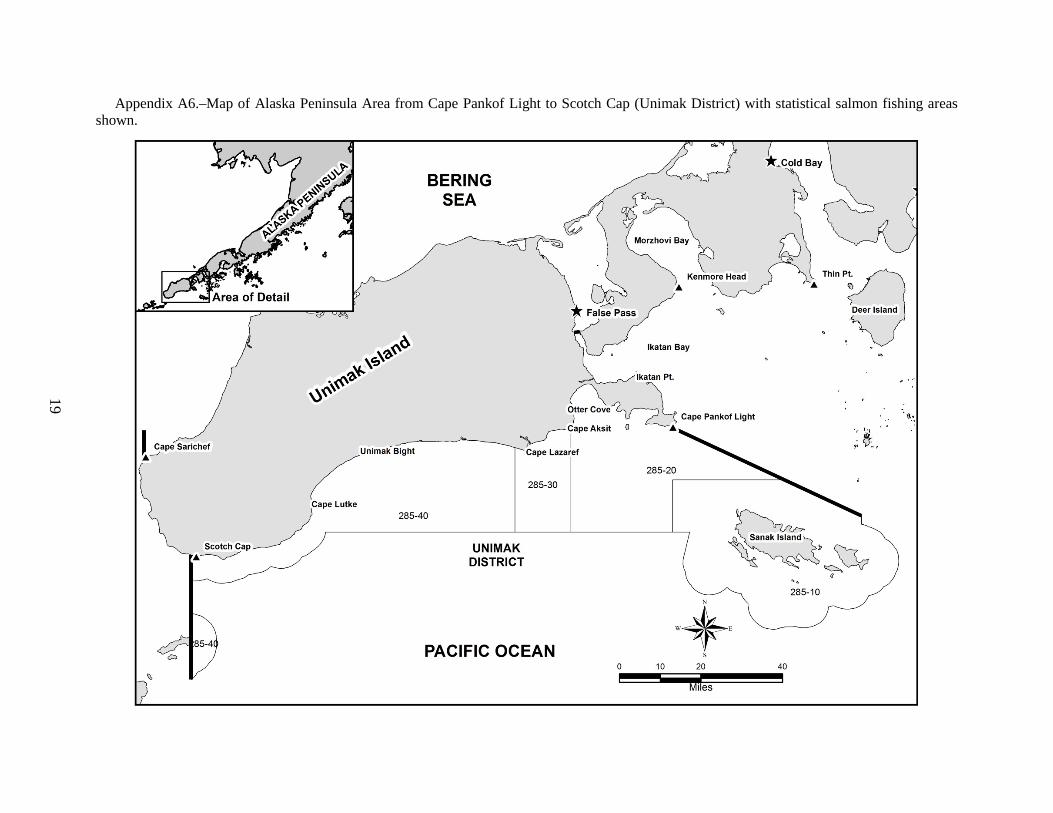
Appendix A6.–Map of Alaska Peninsula Area from Cape Pankof Light to Scotch Cap (Unimak District) with statistical salmon fishing areas shown.
20
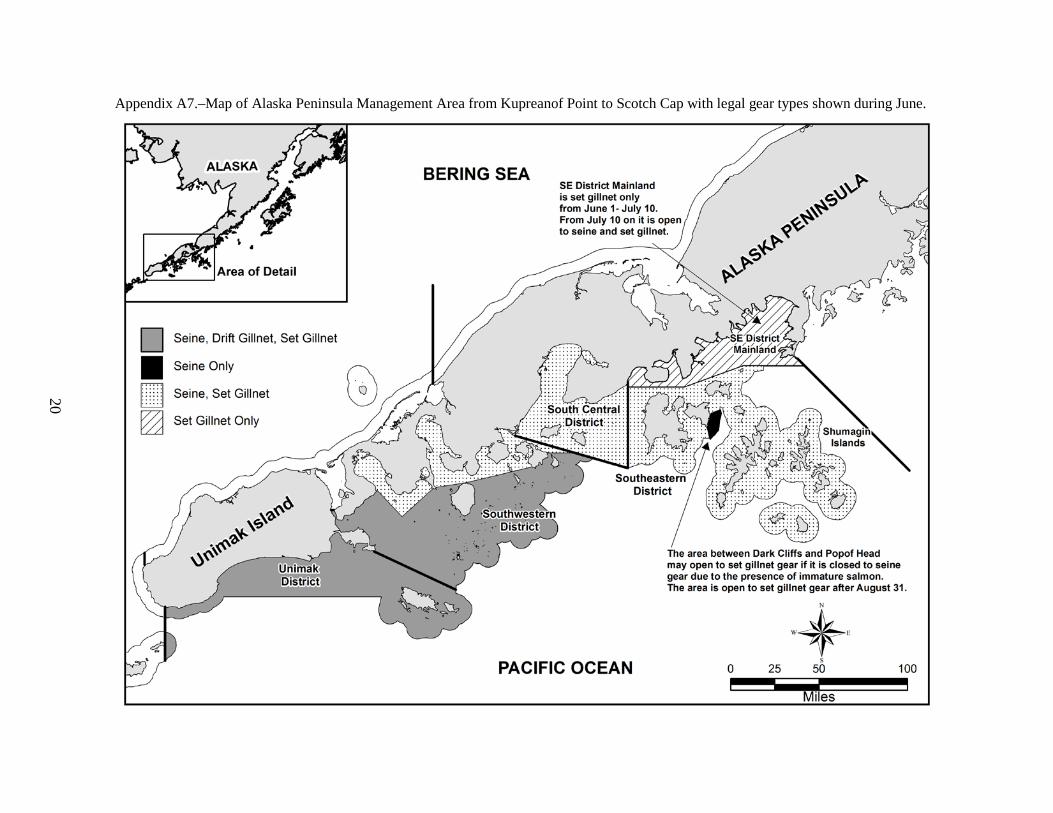
Appendix A7.–Map of Alaska Peninsula Management Area from Kupreanof Point to Scotch Cap with legal gear types shown during June.
21
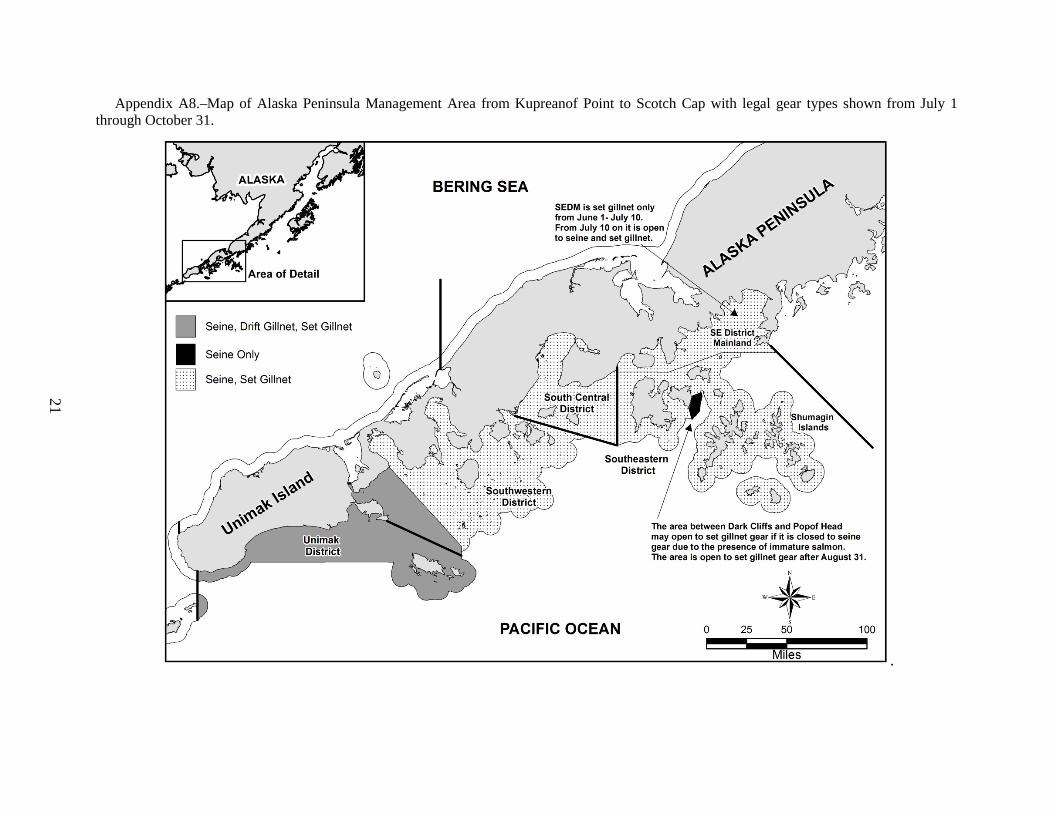
Appendix A8.–Map of Alaska Peninsula Management Area from Kupreanof Point to Scotch Cap with legal gear types shown from July 1 through October 31.
.
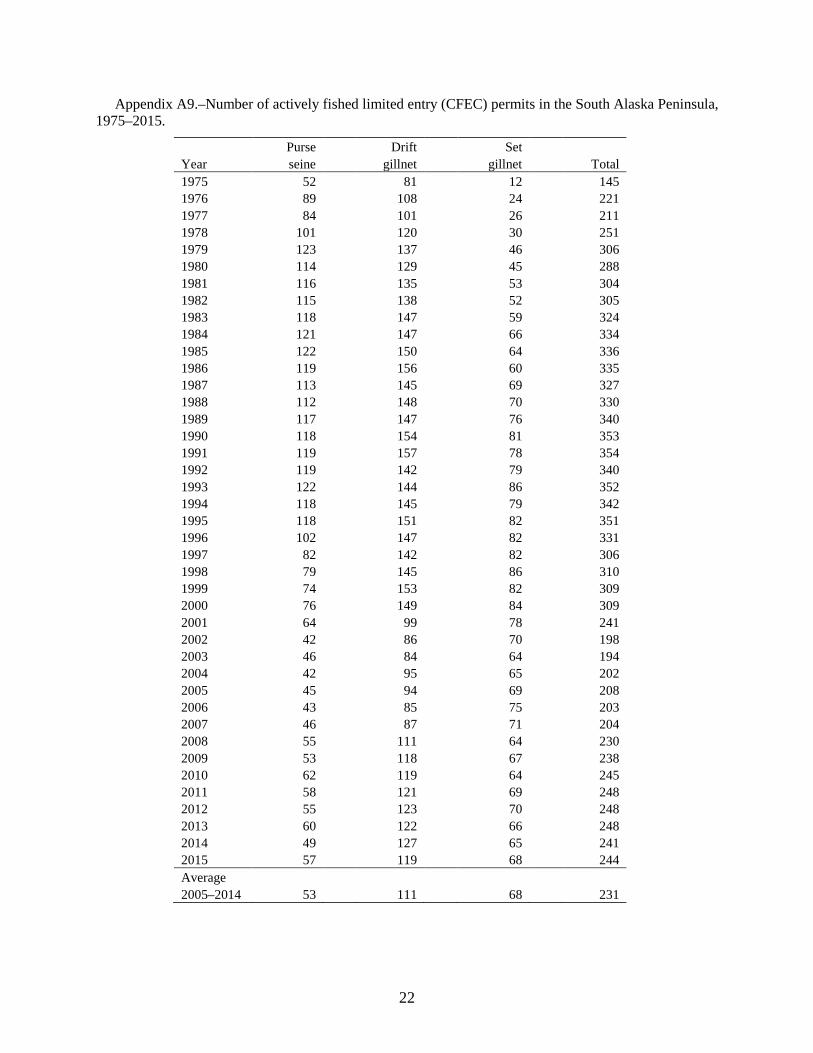
Appendix A9.–Number of actively fished limited entry (CFEC) permits in the South Alaska Peninsula, 1975–2015.
Purse Drift Set Year seine gillnet gillnet Total 1975 52
81
12
145
1976 89
108
24
221 1977 84
101
26
211
1978 101
120
30
251 1979 123
137
46
306
1980 114
129
45
288 1981 116
135
53
304
1982 115
138
52
305 1983 118
147
59
324
1984 121
147
66
334 1985 122
150
64
336
1986 119
156
60
335 1987 113
145
69
327
1988 112
148
70
330 1989 117
147
76
340
1990 118
154
81
353 1991 119
157
78
354
1992 119
142
79
340 1993 122
144
86
352
1994 118
145
79
342 1995 118
151
82
351
1996 102
147
82
331 1997 82
142
82
306
1998 79
145
86
310 1999 74
153
82
309
2000 76
149
84
309 2001 64
99
78
241
2002 42
86
70
198 2003 46
84
64
194
2004 42
95
65
202 2005 45
94
69
208
2006 43
85
75
203 2007 46
87
71
204
2008 55
111
64
230 2009 53
118
67
238
2010 62
119
64
245 2011 58
121
69
248
2012 55
123
70
248 2013 60
122
66
248
2014 49
127
65
241 2015 57 119 68 244 Average
2005–2014 53 111 68 231
22
Appendix A10.–South Alaska Peninsula salmon harvest (number of fish), all gear combined, by species and year, 1908–2015 (excluding test fishery harvest).
Year a, b Permits Landings Chinook Sockeye Coho Pink Chum Total 1908 – – 0 69,400 0 0 0 69,400 1909 – – 0 108,400 7,200 0 0 115,600 1910 – – 0 46,300 5,500 0 0 51,800 1911 – – 0 240,800 12,400 25,200 83,000 361,400 1912 – – 0 334,400 27,000 40,400 195,000 596,800 1913 – – 1,800 299,700 0 0 7,000 308,500 1914 – – 600 628,900 0 311,000 221,100 1,161,600 1915 – – 4,800 367,900 16,200 120,100 333,100 842,100 1916 – – 6,800 730,900 34,100 576,100 508,900 1,856,800 1917 – – 6,400 1,486,100 4,600 72,100 415,500 1,984,700 1918 – – 8,700 1,014,100 16,300 2,150,000 1,501,000 4,690,100 1919 – – 9,600 619,100 56,100 80,200 921,400 1,686,400 1920 – – 7,800 1,142,300 47,700 2,109,800 934,000 4,241,600 1921 – – 700 830,700 1,500 47,300 84,600 964,800 1922 – – 6,900 3,376,800 2,200 756,700 349,300 4,491,900 1923 – – 4,100 1,827,200 75,300 143,600 538,900 2,589,100 1924 – – 3,900 1,352,000 127,300 3,931,300 1,330,700 6,745,200 1925 – – 10,700 820,500 127,100 382,100 1,116,800 2,457,200 1926 – – 9,500 3,071,500 193,800 3,719,700 1,179,800 8,174,300 1927 – – 9,600 714,700 125,300 1,455,500 1,299,700 3,604,800 1928 – – 7,700 971,500 96,600 900,900 2,416,300 4,393,000 1929 – – 10,500 935,800 84,500 1,793,500 2,429,000 5,253,300 1930 – – 10,900 935,200 161,100 6,094,800 1,278,100 8,480,100 1931 – – 11,000 1,863,200 128,700 997,900 1,216,000 4,216,800 1932 – – 17,400 2,977,300 112,300 3,604,800 817,300 7,529,100 1933 – – 12,600 1,996,700 190,000 3,109,200 1,173,900 6,482,400 1934 – – 17,600 1,372,400 247,100 6,538,500 1,940,300 10,115,900 1935 – – 13,900 978,400 117,200 5,386,200 2,003,100 8,498,800 1936 – – 14,400 3,662,600 284,600 9,471,000 2,310,900 15,743,500 1937 – – 9,300 1,558,000 73,900 9,302,000 1,506,700 12,449,900 1938 – – 6,400 772,100 220,700 7,169,100 1,476,600 9,644,900 1939 – – 16,500 1,881,700 98,900 6,005,300 1,440,600 9,443,000 1940 – – 9,100 1,040,300 184,200 7,182,800 2,326,300 10,742,700 1941 – – 13,000 1,072,000 183,000 5,347,000 1,542,000 8,157,000 1942 – – 4,800 810,100 123,000 6,762,600 1,321,100 9,021,600 1943 – – 21,700 2,397,700 90,600 4,360,200 924,500 7,794,700 1944 – – 9,900 538,600 238,700 2,653,800 985,600 4,426,600 1945 – – 21,400 813,400 116,100 3,639,600 948,900 5,539,400 1946 – – 6,100 752,300 151,400 1,964,000 1,219,900 4,093,700 1947 – – 3,400 1,137,100 55,800 2,319,600 1,219,200 4,735,100 1948 – – 1,200 285,900 39,200 1,683,700 1,139,600 3,149,600 1949 – – 3,800 637,500 19,500 1,544,000 560,900 2,765,700 1950 – – 4,000 1,745,300 70,700 1,613,700 562,500 3,996,200
-continued-
23
Appendix A10.–Page 2 of 3.
Year a,b Permits Landings Chinook Sockeye Coho Pink Chum Total 1951 – – 1,500 264,200 55,700 2,844,800 683,100 3,849,300 1952 – – 9,200 894,500 39,200 908,500 1,040,800 2,892,200 1953 – – 7,200 1,039,200 47,900 2,743,900 1,464,600 5,302,800 1954 – – 4,200 636,300 49,400 2,033,300 1,413,400 4,136,600 1955 – – 5,400 550,100 44,800 2,529,200 688,200 3,817,700 1956 – – 4,800 641,400 61,900 2,740,700 1,618,700 5,067,500 1957 – – 5,800 341,900 49,900 913,100 1,281,400 2,592,100 1958 – – 800 186,100 70,600 1,385,200 841,000 2,483,700 1959 – – 900 217,500 8,500 915,600 711,700 1,854,200 1960 – – 1,700 379,000 1,800 1,197,500 904,400 2,484,400 1961 – – 900 456,800 10,400 1,727,800 748,600 2,944,500 1962 – – 3,300 420,000 12,500 1,965,500 824,800 3,226,100 1963 – – 1,900 204,400 16,500 2,367,700 461,300 3,051,800 1964 – – 2,000 370,800 13,600 2,740,400 751,000 3,877,800 1965 – – 2,100 915,700 34,200 2,884,100 556,400 4,392,500 1966 – – 1,400 606,200 6,300 302,300 494,400 1,410,600 1967 – – 1,600 294,100 2,900 77,800 245,200 621,600 1968 – – 1,400 699,800 31,100 1,287,100 325,300 2,344,700 1969 – – 1,900 912,800 10,900 1,219,400 389,200 2,534,200 1970 295 4,679 1,806 1,779,525 32,571 1,737,985 993,349 4,545,236 1971 259 4,444 2,174 716,087 16,907 1,445,031 1,365,957 3,546,156 1972 266 3,124 1,332 557,422 8,021 78,221 731,814 1,376,810 1973 202 1,795 415 330,091 6,599 58,051 292,943 688,099 1974 134 853 581 197,153 9,366 100,601 71,826 379,527 1975 145 600 117 243,548 67 60,642 130,750 435,124 1976 221 2,705 2,196 375,027 216 2,366,833 532,503 3,276,775 1977 211 2,168 559 311,722 2,108 1,448,648 243,167 2,006,204 1978 251 3,860 773 579,411 60,774 5,590,145 546,182 6,777,285 1979 306 4,476 2,141 1,149,927 356,867 6,564,914 482,930 8,556,779 1980 288 5,107 4,794 3,613,025 274,181 7,861,470 1,353,112 13,106,582 1981 304 5,617 11,182 2,241,513 162,223 5,033,028 1,768,475 9,216,421 1982 305 6,286 9,845 2,345,981 256,046 6,734,905 2,272,495 11,619,272 1983 324 5,241 26,571 2,556,557 127,657 2,827,622 1,704,072 7,242,479 1984 334 6,378 9,198 2,318,028 310,950 11,589,258 1,654,622 15,882,056 1985 336 5,325 6,642 2,144,416 172,514 4,431,016 1,348,726 8,103,314 1986 335 5,137 5,589 1,223,565 235,854 4,031,487 1,749,811 7,246,306 1987 327 5,256 9,174 1,449,747 225,117 1,208,556 1,376,040 4,268,634 1988 330 6,476 11,075 1,473,611 505,531 7,044,824 1,908,507 10,943,548 1989 341 5,592 7,065 2,660,597 443,839 7,292,658 994,229 11,398,388 1990 354 6,401 16,522 2,386,370 307,184 2,865,864 1,237,935 6,813,875 1991 355 6,440 7,975 2,319,957 317,129 10,616,756 1,588,791 14,850,608 1992 341 6,511 8,026 3,445,854 418,204 9,770,386 1,316,709 14,959,179 1993 353 6,201 14,413 3,689,004 220,107 9,928,107 1,048,256 14,899,887 1994 343 6,750 10,002 2,107,233 255,905 9,179,853 2,192,079 13,745,072 1995 352 8,186 17,453 3,015,319 264,236 16,311,942 1,728,321 21,337,271 1996 331 5,865 5,520 1,541,734 293,258 2,207,503 794,642 4,842,657
-continued-
24
Appendix A10.–Page 3 of 3.
Year a,b Permits Landings Chinook Sockeye Coho Pink Chum Total 1997 306 5,724 7,161 2,243,409 111,894 2,303,926 606,254 5,272,644 1998 311 8,008 4,919 2,181,961 154,128 8,047,998 721,063 11,110,069 1999 310 7,021 5,074 2,991,819 192,503 8,456,449 840,030 12,485,875 2000 311 7,110 5,445 2,006,487 257,245 3,562,866 1,066,653 6,898,696 2001 242 3,277 2,620 614,080 214,252 4,021,381 933,014 5,785,347 2002 198 3,879 6,399 1,035,181 202,717 2,170,376 819,030 4,233,703 2003 194 3,899 2,712 1,053,603 131,007 4,258,274 637,305 6,082,901 2004 202 4,662 7,050 2,200,331 235,600 6,665,831 790,109 9,898,921 2005 208 4,944 4,487 2,337,097 143,617 9,416,197 739,460 12,640,858 2006 203 4,918 5,412 1,850,029 169,620 4,261,824 1,177,806 7,464,691 2007 204 5,298 5,312 2,438,672 150,955 7,299,330 679,787 10,574,056 2008 230 5,546 4,366 2,239,210 225,659 12,710,050 802,404 15,981,689 2009 238 5,820 5,847 1,724,029 248,552 7,900,018 1,680,719 11,559,165 2010 245 4,255 7,848 1,274,112 164,640 833,788 790,131 3,070,519 2011 248 5,609 7,207 1,916,839 153,433 4,992,228 977,755 8,047,462 2012 248 5,327 7,693 2,015,016 91,918 490,334 622,775 3,227,736 2013 248 6,842 6,701 2,239,939 293,865 7,793,830 950,528 11,284,863 2014 241 4,399 7,280 1,426,380 296,819 721,209 501,927 2,953,615 2015 244 6,094 51,077 3,207,360 265,652 16,683,602 675,603 20,883,294 Averages
1918–1929 c – – 7,475 1,389,683 79,475 1,455,883 1,175,125 4,107,642
1930–1946 c – – 12,706 1,495,412 160,088 5,269,929 1,437,165 8,375,300
1947–1977 c 217 2,546 2,567 591,844 26,747 1,523,900 751,226 2,896,285
1978–1999 c 324 5,994 9,142 2,258,138 257,550 6,813,576 1,328,786 10,667,191
2005–2014 231 5,296 6,215 1,946,132 193,908 5,641,881 892,329 8,680,465 Note: Permit and landing numbers are only available from 1970 through present. a From 1928 through 1950, commercial salmon catches in the Aleutian Islands and the South Peninsula were combined.
Aleutian Islands catches are generally much smaller than South Peninsula harvests. South Peninsula harvests were generally dominated by pink salmon. The 1978–1999 Aleutian Islands average salmon harvest was 510,317 fish, whereas the 1978–1999 average harvest for the South Peninsula was 10,671,164 salmon.
b Since 1989, salmon numbers include test fish harvests. c These historical averages are intended to illustrate how salmon productivity has fluctuated in the South Peninsula.
25
Appendix A11.–South Alaska Peninsula pink salmon catch and escapement by year, 1962–2015.
Post-June harvest June harvest
Southeasterna Southwestern
and
and
Southb
Total
South Central
Unimak
Peninsula
South Shumagin June
Year districts districts totals Unimak Islands harvest 1962 Catch 922,100
977,300
1,899,400
42,000 24,000 66,000
Escapement 826,100
772,700
1,598,800
– – –
Total 1,748,200
1,750,000
3,498,200
– – –
1963 Catch 1,733,900
590,800
2,324,700
14,000 29,000 43,000
Escapement 886,500
431,400
1,317,900
– – –
Total 2,620,400
1,022,200
3,642,600
– – –
1964 Catch 1,514,600
1,190,700
2,705,300
18,000 17,000 35,000
Escapement 902,400
534,000
1,436,400
– – –
Total 2,417,000
1,724,700
4,141,700
– – –
1965 Catch 2,331,400
474,700
2,806,100
43,000 35,000 78,000
Escapement 789,900
245,500
1,035,400
– – –
Total 3,121,300
720,200
3,841,500
– – –
1966 Catch 220,300
68,500
288,800
15,000 2,000 17,000
Escapement 627,400
92,000
719,400
– – –
Total 847,700
160,500
1,008,200
– – –
1967 Catch 53,100
4,200
57,300
11,000 10,000 21,000
Escapement 327,300
118,200
445,500
– – –
Total 380,400
122,400
502,800
– – –
1968 Catch 863,300
277,800
1,141,100
34,000 112,000 146,000
Escapement 528,100
295,200
823,300
– – –
Total 1,391,400
573,000
1,964,400
– – –
1969 Catch 862,800
265,300
1,128,100
68,000 23,000 91,000
Escapement 1,906,200
568,700
2,474,900
– – –
Total 2,769,000
834,000
3,603,000
– – –
1970 Catch 1,378,510
252,030
1,630,540
83,325 19,728 103,053
Escapement 1,007,900
291,000
1,298,900
– – –
Total 2,386,410
543,030
2,929,440
– – –
1971 Catch 1,211,982
213,809
1,425,791
11,608 7,632 19,240
Escapement 488,000
214,700
702,700
– – –
Total 1,699,982
428,509
2,128,491
– – –
1972 Catch 53,339
6,958
60,297
11,906 6,018 17,924
Escapement 81,800
29,600
111,400
– – –
Total 135,139
36,558
171,697
– – –
1973 Catch 36,548
2,073
38,621
11,152 8,278 19,430
Escapement 85,700
25,100
110,800
– – –
Total 122,248 27,173 149,421 – – – -continued-
26
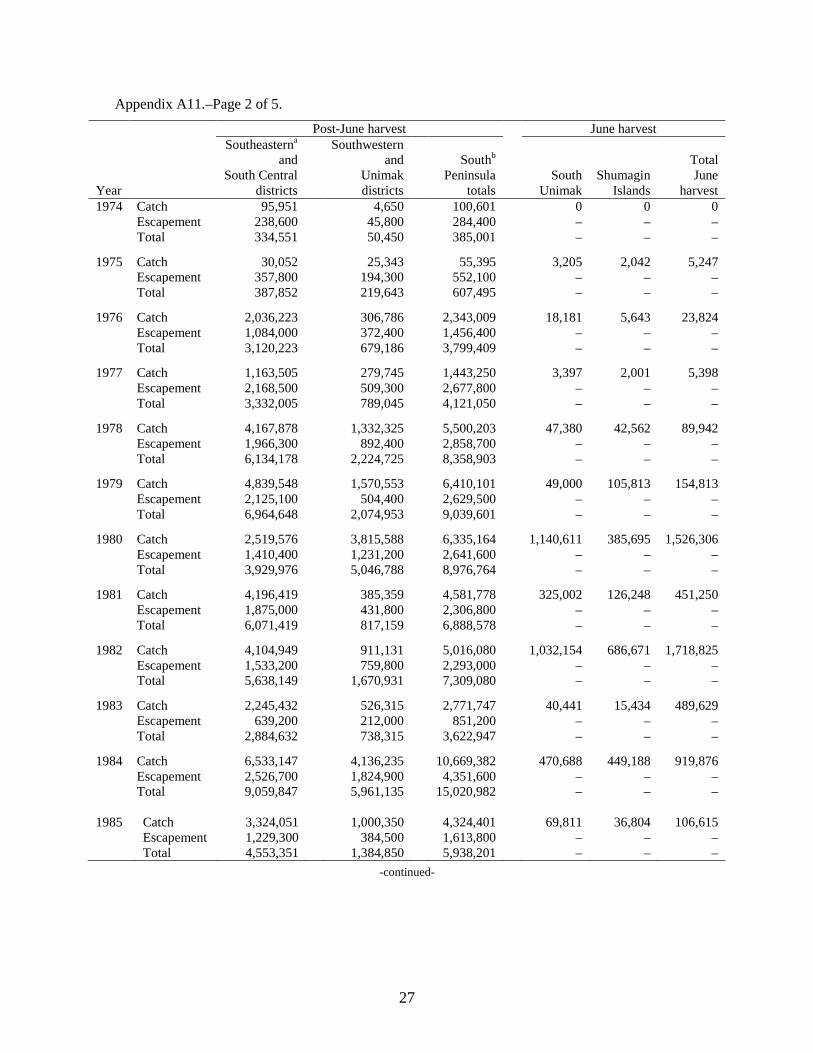
Appendix A11.–Page 2 of 5.
Post-June harvest June harvest
Southeasterna
Southwestern
and
and
Southb
Total
South Central
Unimak
Peninsula
South Shumagin June
Year districts districts totals Unimak Islands harvest 1974 Catch 95,951
4,650
100,601
0 0 0
Escapement 238,600
45,800
284,400
– – –
Total 334,551
50,450
385,001
– – –
1975 Catch 30,052
25,343
55,395
3,205 2,042 5,247
Escapement 357,800
194,300
552,100
– – –
Total 387,852
219,643
607,495
– – –
1976 Catch 2,036,223
306,786
2,343,009
18,181 5,643 23,824
Escapement 1,084,000
372,400
1,456,400
– – –
Total 3,120,223
679,186
3,799,409
– – –
1977 Catch 1,163,505
279,745
1,443,250
3,397 2,001 5,398
Escapement 2,168,500
509,300
2,677,800
– – –
Total 3,332,005
789,045
4,121,050
– – –
1978 Catch 4,167,878
1,332,325
5,500,203
47,380 42,562 89,942
Escapement 1,966,300
892,400
2,858,700
– – –
Total 6,134,178
2,224,725
8,358,903
– – –
1979 Catch 4,839,548
1,570,553
6,410,101
49,000 105,813 154,813
Escapement 2,125,100
504,400
2,629,500
– – –
Total 6,964,648
2,074,953
9,039,601
– – –
1980 Catch 2,519,576
3,815,588
6,335,164
1,140,611 385,695 1,526,306
Escapement 1,410,400
1,231,200
2,641,600
– – –
Total 3,929,976
5,046,788
8,976,764
– – –
1981 Catch 4,196,419
385,359
4,581,778
325,002 126,248 451,250
Escapement 1,875,000
431,800
2,306,800
– – –
Total 6,071,419
817,159
6,888,578
– – –
1982 Catch 4,104,949
911,131
5,016,080
1,032,154 686,671 1,718,825
Escapement 1,533,200
759,800
2,293,000
– – –
Total 5,638,149
1,670,931
7,309,080
– – –
1983 Catch 2,245,432
526,315
2,771,747
40,441 15,434 489,629
Escapement 639,200
212,000
851,200
– – –
Total 2,884,632
738,315
3,622,947
– – –
1984 Catch 6,533,147
4,136,235
10,669,382
470,688 449,188 919,876
Escapement 2,526,700
1,824,900
4,351,600
– – –
Total 9,059,847 5,961,135 15,020,982 – – – 1985 Catch 3,324,051
1,000,350
4,324,401
69,811 36,804 106,615
Escapement 1,229,300
384,500
1,613,800
– – –
Total 4,553,351
1,384,850
5,938,201
– – –
-continued-
27
Appendix A11.–Page 3 of 5. Post-June harvest June harvest
Southeasterna
Southwestern
and
and
Southb
Total
South Central
Unimak
Peninsula
South Shumagin June
Year districts districts totals Unimak Islands harvest 1986 Catch 3,066,631
672,867
3,739,498
150,674 141,315 3,890,172
Escapement 1,185,500
531,200
1,716,700
– – –
Total 4,252,131
1,204,067
5,456,198
– – –
1987 Catch 1,143,436
48,138
1,191,574
11,342 5,640 16,982
Escapement 1,304,400
236,100
1,540,500
– – –
Total 2,447,836
284,238
2,732,074
– – –
1988 Catch 4,700,486
2,164,114
6,864,600
86,678 93,546 180,224
Escapement 1,636,500
1,203,100
2,839,600
– – –
Total 6,336,986
3,367,214
9,704,200
– – –
1989 Catch 6,989,038
104,385
7,093,423
154,168 45,067 199,235
Escapement 1,179,300
691,600
1,870,900
– – –
Total 8,168,338
795,985
8,964,323
– – –
1990 Catch 2,291,028
59,539
2,350,567
443,913 71,384 515,297
Escapement 1,018,200
580,200
1,598,400
– – –
Total 3,309,228
639,739
3,948,967
– – –
1991 Catch 7,549,853
2,446,759
9,996,612
500,922 119,222 620,144
Escapement 2,268,400
678,400
2,946,800
– – –
Total 9,818,253
3,125,159
12,943,412
– – –
1992 Catch 4,860,628
4,266,322
9,126,950
501,127 142,282 643,409
Escapement 1,781,000
1,053,400
2,834,400
– – –
Total 6,641,628
5,319,722
11,961,350
– – –
1993 Catch 7,493,472
2,353,434
9,846,906
33,684 43,466 77,150
Escapement 2,232,200
757,900
2,990,100
– – –
Total 9,725,672
3,111,334
12,837,006
– – –
1994 Catch 3,143,952
3,507,237
6,651,189
1,708,320 723,384 2,431,704
Escapement 1,700,525
1,371,200
3,071,725
– – –
Total 4,844,477
4,878,437
9,722,914
– – –
1995 Catch 11,371,145
4,761,044
16,132,189
111,592 51,021 162,613
Escapement 4,404,450
2,001,850
6,406,300
– – –
Total 15,775,595
6,762,894
22,538,489
– – –
1996 Catch 1,519,483
296,875
1,816,358
150,461 215,029 365,490
Escapement 2,668,950
978,600
3,647,550
– – –
Total 4,188,433 1,275,475 5,463,908 – – – 1997 Catch 828,392
869,597
1,697,989
312,332 273,675 586,007
Escapement 4,021,375
1,221,900
5,243,275
– – –
Total 4,849,767
2,091,497
6,941,264
– – –
-continued-
28
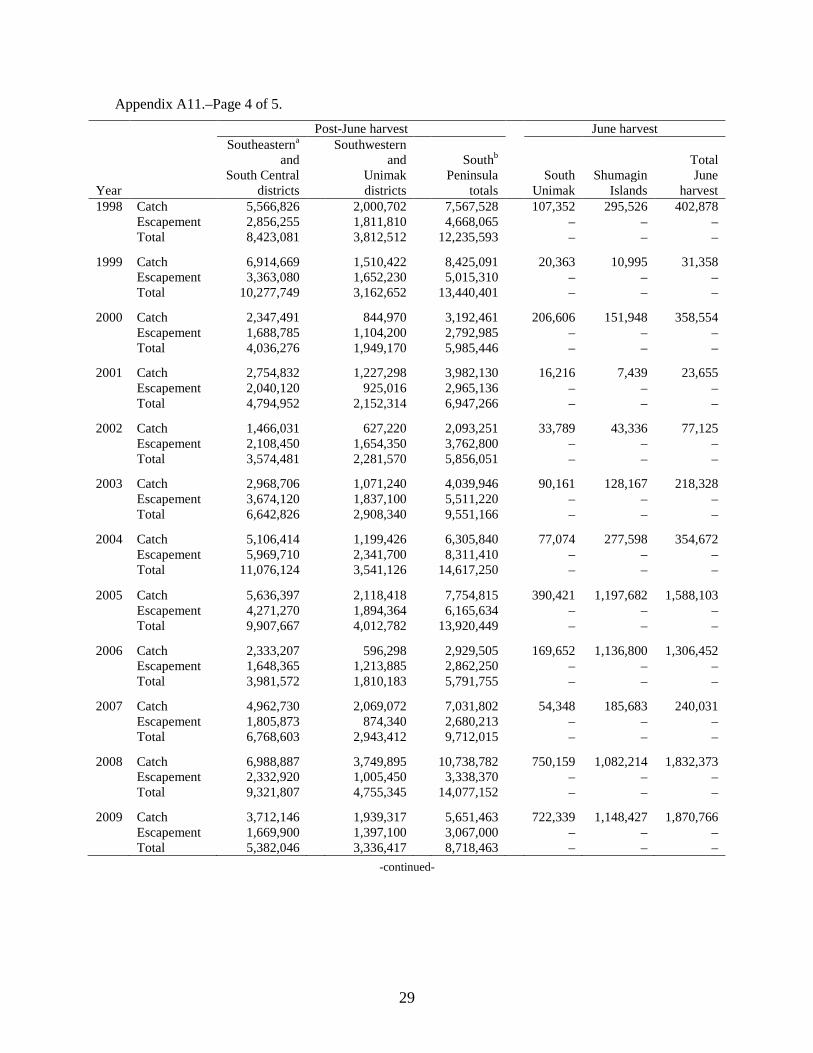
Appendix A11.–Page 4 of 5.
Post-June harvest June harvest
Southeasterna
Southwestern
and
and
Southb
Total
South Central
Unimak
Peninsula
South Shumagin June
Year districts districts totals Unimak Islands harvest 1998 Catch 5,566,826
2,000,702
7,567,528
107,352 295,526 402,878
Escapement 2,856,255
1,811,810
4,668,065
– – –
Total 8,423,081
3,812,512
12,235,593
– – –
1999 Catch 6,914,669
1,510,422
8,425,091
20,363 10,995 31,358
Escapement 3,363,080
1,652,230
5,015,310
– – –
Total 10,277,749
3,162,652
13,440,401
– – –
2000 Catch 2,347,491
844,970
3,192,461 206,606 151,948 358,554
Escapement 1,688,785
1,104,200
2,792,985 – – –
Total 4,036,276
1,949,170
5,985,446
– – –
2001 Catch 2,754,832
1,227,298
3,982,130
16,216 7,439 23,655
Escapement 2,040,120
925,016
2,965,136
– – –
Total 4,794,952
2,152,314
6,947,266
– – –
2002 Catch 1,466,031
627,220
2,093,251
33,789 43,336 77,125
Escapement 2,108,450
1,654,350
3,762,800
– – –
Total 3,574,481
2,281,570
5,856,051
– – –
2003 Catch 2,968,706
1,071,240
4,039,946
90,161 128,167 218,328
Escapement 3,674,120
1,837,100
5,511,220
– – –
Total 6,642,826
2,908,340
9,551,166
– – –
2004 Catch 5,106,414
1,199,426
6,305,840
77,074 277,598 354,672
Escapement 5,969,710
2,341,700
8,311,410
– – –
Total 11,076,124
3,541,126
14,617,250
– – –
2005 Catch 5,636,397
2,118,418
7,754,815
390,421 1,197,682 1,588,103
Escapement 4,271,270
1,894,364
6,165,634
– – –
Total 9,907,667
4,012,782
13,920,449
– – –
2006 Catch 2,333,207
596,298
2,929,505
169,652 1,136,800 1,306,452
Escapement 1,648,365
1,213,885
2,862,250
– – –
Total 3,981,572
1,810,183
5,791,755
– – –
2007 Catch 4,962,730
2,069,072
7,031,802
54,348 185,683 240,031
Escapement 1,805,873
874,340
2,680,213
– – –
Total 6,768,603
2,943,412
9,712,015
– – –
2008 Catch 6,988,887
3,749,895
10,738,782
750,159 1,082,214 1,832,373
Escapement 2,332,920
1,005,450
3,338,370
– – –
Total 9,321,807
4,755,345
14,077,152
– – –
2009 Catch 3,712,146
1,939,317
5,651,463
722,339 1,148,427 1,870,766
Escapement 1,669,900
1,397,100
3,067,000
– – –
Total 5,382,046
3,336,417
8,718,463
– – –
-continued-
29
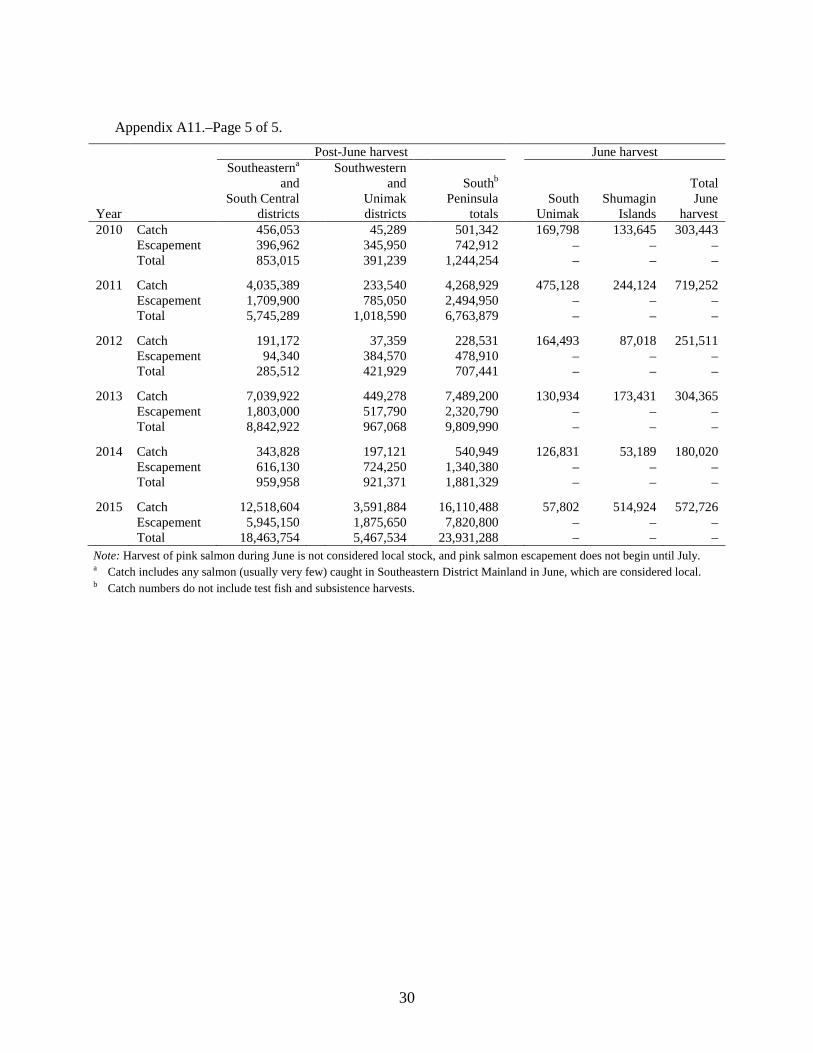
Appendix A11.–Page 5 of 5. Post-June harvest June harvest
Southeasterna
Southwestern
and
and
Southb
Total
South Central
Unimak
Peninsula
South Shumagin June
Year districts districts totals Unimak Islands harvest 2010 Catch 456,053
45,289
501,342
169,798 133,645 303,443
Escapement 396,962
345,950
742,912
– – –
Total 853,015
391,239
1,244,254
– – –
2011 Catch 4,035,389
233,540
4,268,929
475,128 244,124 719,252
Escapement 1,709,900
785,050
2,494,950
– – –
Total 5,745,289
1,018,590
6,763,879
– – –
2012 Catch 191,172
37,359
228,531
164,493 87,018 251,511
Escapement 94,340
384,570
478,910
– – –
Total 285,512
421,929
707,441
– – –
2013 Catch 7,039,922
449,278
7,489,200
130,934 173,431 304,365
Escapement 1,803,000
517,790
2,320,790
– – –
Total 8,842,922
967,068
9,809,990
– – –
2014 Catch 343,828
197,121
540,949
126,831 53,189 180,020
Escapement 616,130
724,250
1,340,380
– – –
Total 959,958
921,371
1,881,329
– – –
2015 Catch 12,518,604
3,591,884
16,110,488
57,802 514,924 572,726
Escapement 5,945,150
1,875,650
7,820,800
– – –
Total 18,463,754 5,467,534 23,931,288 – – – Note: Harvest of pink salmon during June is not considered local stock, and pink salmon escapement does not begin until July. a Catch includes any salmon (usually very few) caught in Southeastern District Mainland in June, which are considered local. b Catch numbers do not include test fish and subsistence harvests.
30

Appendix A12.–South Alaska Peninsula chum salmon catch and escapement by year, 1962–2015.
Post-June harvest June harvest
Southeasterna
Southwestern
and
and
Southb
Total
South Central
Unimak
Peninsula
South Shumagin June
Year districts districts totals Unimak Islands harvest 1962 Catch 409,500
155,300
564,800
199,000 61,000 260,000
Escapement 238,600
160,800
399,400
– – –
Total 648,100
316,100
964,200
– – –
1963 Catch 278,000
80,300
358,300
67,000 36,000 103,000
Escapement 263,000
183,700
446,700
– – –
Total 541,000
264,000
805,000
– – –
1964 Catch 378,800
153,300
532,100
153,000 67,000 220,000
Escapement 160,800
294,000
454,800
– – –
Total 539,600
447,300
986,900
– – –
1965 Catch 221,700
150,700
372,400
139,000 45,000 184,000
Escapement 203,300
24,200
227,500
– – –
Total 425,000
174,900
599,900
– – –
1966 Catch 221,400
36,000
257,400
220,000 17,000 237,000
Escapement 354,800
67,200
422,000
– – –
Total 576,200
103,200
679,400
– – –
1967 Catch 118,700
4,500
123,200
71,000 51,000 122,000
Escapement 132,800
50,100
182,900
– – –
Total 251,500
54,600
306,100
– – –
1968 Catch 121,400
47,600
169,000
105,000 51,000 156,000
Escapement 191,700
87,400
279,100
– – –
Total 313,100
135,000
448,100
– – –
1969 Catch 95,100
43,300
138,400
238,000 13,000 251,000
Escapement 96,900
37,700
134,600
– – –
Total 192,000
81,000
273,000
– – –
1970 Catch 486,183
65,254
551,437
391,568 44,909 436,477
Escapement 171,700
108,800
280,500
– – –
Total 657,883
174,054
831,937
– – –
1971 Catch 647,092
209,668
856,760
405,311 103,886 509,197
Escapement 199,100
144,100
343,200
– – –
Total 846,192
353,768
1,199,960
– – –
1972 Catch 151,283
61,721
213,004
411,000 107,810 518,810
Escapement 145,000
109,500
254,500
– – –
Total 296,283
171,221
467,504
– – –
1973 Catch 79,872
12,441
92,313
177,720 22,910 200,630
Escapement 130,900
81,600
212,500
– – –
Total 210,772
94,041
304,813
– – –
-continued-
31
Appendix A12.–Page 2 of 5.
Post-June harvest June harvest
Southeasterna
Southwestern
and
and
Southb
Total
South Central
Unimak
Peninsula
South Shumagin June
Year districts districts totals Unimak Islands harvest 1974 Catch 56,509
15,317
71,826
0 0 0
Escapement 169,800
87,500
257,300
– – –
Total 226,309
102,817
329,126
– – –
1975 Catch 29,419
509
29,928
65,279 35,543 100,822
Escapement 160,200
33,100
193,300
– – –
Total 189,619
33,609
223,228
– – –
1976 Catch 107,319
14,914
122,233
336,161 74,109 410,270
Escapement 225,300
101,900
327,200
– – –
Total 332,619
116,814
449,433
– – –
1977 Catch 109,541
17,630
127,171
94,097 21,899 115,996
Escapement 500,900
274,000
774,900
– – –
Total 610,441
291,630
902,071
– – –
1978 Catch 341,077
83,213
424,290
103,413 18,479 121,892
Escapement 386,200
214,300
600,500
– – –
Total 727,277
297,513
1,024,790
– – –
1979 Catch 280,401
98,426
378,827
63,150 40,953 104,103
Escapement 302,700
108,400
411,100
– – –
Total 583,101
206,826
789,927
– – –
1980 Catch 675,106
169,141
844,247
458,499 50,366 508,865
Escapement 241,600
120,800
362,400
– – –
Total 916,706
289,941
1,206,647
– – –
1981 Catch 964,530
239,998
1,204,528
509,876 54,071 563,947
Escapement 234,500
146,800
381,300
– – –
Total 1,199,030
386,798
1,585,828
– – –
1982 Catch 921,790
255,661
1,177,451
933,728 161,316 1,095,044
Escapement 203,000
183,900
386,900
– – –
Total 1,124,790
439,561
1,564,351
– – –
1983 Catch 597,295
321,145
918,440
616,354 169,277 785,631
Escapement 328,900
117,600
446,500
– – –
Total 926,195
438,745
1,364,940
– – –
1984 Catch 832,872
484,630
1,317,502
227,913 109,207 337,120
Escapement 446,000
253,700
699,700
– – –
Total 1,278,872
738,330
2,017,202
– – –
1985 Catch 539,065
375,832
914,897
324,825 109,004 433,829
Escapement 284,700
218,800
503,500
– – –
Total 823,765
594,632
1,418,397
– – –
-continued-
32
Appendix A12.–Page 3 of 5. Post-June harvest June harvest
Southeasterna
Southwestern
and
and
Southb
Total
South Central
Unimak
Peninsula
South Shumagin June
Year districts districts totals Unimak Islands harvest 1986 Catch 981,185
416,697
1,397,882
252,721 99,048 351,769
Escapement 239,600
305,000
544,600
– – –
Total 1,220,785
721,697
1,942,482
– – –
1987 Catch 753,246
179,500
932,746
405,955 37,064 443,019
Escapement 329,200
291,500
620,700
– – –
Total 1,082,446
471,000
1,553,446
– – –
1988 Catch 829,518
552,278
1,381,796
464,765 61,946 526,711
Escapement 269,100
227,300
496,400
– – –
Total 1,098,618
779,578
1,878,196
– – –
1989 Catch 466,728
72,188
538,916
407,635 47,680 455,315
Escapement 189,200
121,300
310,500
– – –
Total 655,928
193,488
849,416
– – –
1990 Catch 664,339
54,851
719,190
445,670 73,085 518,755
Escapement 210,900
143,800
354,700
– – –
Total 875,239
198,651
1,073,890
– – –
1991 Catch 571,802
237,695
809,497
670,409 108,885 779,294
Escapement 345,400
242,200
587,600
– – –
Total 917,202
479,895
1,397,097
– – –
1992 Catch 592,893
291,612
884,505
323,891 107,402 431,293
Escapement 194,100
141,400
335,500
– – –
Total 786,993
433,012
1,220,005
– – –
1993 Catch 331,003
183,403
514,406
372,961 151,910 524,871
Escapement 172,400
224,630
397,030
– – –
Total 503,403
408,033
911,436
– – –
1994 Catch 690,666
905,581
1,596,247
362,875 184,485 547,360
Escapement 211,700
367,400
579,100
– – –
Total 902,366
1,272,981
2,175,347
– – –
1995 Catch 664,266
511,290
1,175,556
333,887 191,697 525,584
Escapement 324,750
401,650
726,400
– – –
Total 989,016
912,940
1,901,956
– – –
1996 Catch 285,399
128,126
413,525
122,278 228,634 350,912
Escapement 307,400
302,900
610,300
– – –
Total 592,799
431,026
1,023,825
– – –
1997 Catch 101,370
182,559
283,929
192,289 126,309 318,598
Escapement 542,050
267,000
809,050
– – –
Total 643,420
449,559
1,092,979
– – –
-continued-
33
Appendix A12.–Page 4 of 5.
Post-June harvest June harvest
Southeasterna
Southwestern
and
and
Southb
Total
South Central
Unimak
Peninsula
South Shumagin June
Year districts districts totals Unimak Islands harvest 1998 Catch 293,345
173,045
466,390
184,369 46,351 230,720
Escapement 390,325
351,910
742,235
– – –
Total 683,670
524,955
1,208,625
– – –
1999 Catch 397,380
175,229
572,609
190,142 77,279 267,421
Escapement 336,050
389,130
725,180
– – –
Total 733,430
564,359
1,297,789
– – –
2000 Catch 438,642
377,454
816,096
159,147 76,122 235,269
Escapement 264,050
258,025
522,075
– – –
Total 702,692
635,479
1,338,171
– – –
2001 Catch 452,394
432,199
884,593
29,079 12,322 41,401
Escapement 473,800
277,421
751,221
– – –
Total 926,194
709,620
1,635,814
– – –
2002 Catch 206,587
230,946
437,533
201,211 180,286 381,497
Escapement 333,550
269,200
602,750
– – –
Total 540,137
500,146
1,040,283
– – –
2003 Catch 124,578
229,126
353,704
121,169 162,432 283,601
Escapement 297,810
193,230
491,040
– – –
Total 422,388
422,356
844,744
– – –
2004 Catch 244,638
62,174
306,812
129,449 348,849 478,298
Escapement 552,000
180,400
732,400
– – –
Total 796,638
242,574
1,039,212
– – –
2005 Catch 224,093
85,458
309,551
143,179 280,358 423,537
Escapement 648,200
322,110
970,310
– – –
Total 872,293
407,568
1,279,861
– – –
2006 Catch 567,641
310,338
877,979
92,737 199,687 292,424
Escapement 524,900
239,850
764,750
– – –
Total 1,092,541
550,188
1,642,729
– – –
2007 Catch 250,104
132,144
382,248
152,432 131,650 284,082
Escapement 327,451
399,210
726,661
– – –
Total 577,555
531,354
1,108,909
– – –
2008 Catch 281,940
109,532
391,472
274,872 118,636 393,508
Escapement 417,900
174,050
591,950
– – –
Total 699,840
283,582
983,422
– – –
-continued-
34
Appendix A12.–Page 5 of 5.
Post-June harvest June harvest
Southeasterna
Southwestern
and
and
Southb
Total
South Central
Unimak
Peninsula
South Shumagin June
Year districts districts totals Unimak Islands harvest 2009 Catch 445,088
538,856
983,944
183,793 478,147 661,940
Escapement 125,100
387,130
512,230
– – –
Total 570,188
925,986
1,496,174
– – –
2010 Catch 400,599
114,661
515,260
96,552 168,710 265,262
Escapement 147,912
143,700
291,612
– – –
Total 548,511
258,361
806,872
– – –
2011 Catch 399,514
142,271
541,785
230,794 200,783 431,577
Escapement 314,300
183,425
497,725
– – –
Total 713,814
325,696
1,039,510
– – –
2012 Catch 143,025
83,227
226,252
206,002 177,786 383,788
Escapement 117,262
87,980
205,242
– – –
Total 260,287
171,207
431,494
– – –
2013 Catch 370,043
179,492
549,535
188,888 211,583 400,471
Escapement 339,400
163,200
502,600
– – –
Total 709,443
342,692
1,052,135
– – –
2014 Catch 65,095
46,693
111,788
216,193 169,605 385,798
Escapement 177,370
136,175
313,545
– – –
Total 242,465
182,868
425,333
– – –
2015 Catch 298,824
198,055
496,879
40,664 137,101 177,765
Escapement 549,270
357,150
906,420
– – –
Total 848,094 555,205 1,403,299 – – – Note: Harvest of chum salmon during June is not considered local stock, and chum salmon escapement does not begin until July. a Catch includes any salmon (usually very few) caught in the Southeastern District Mainland in June, which are considered
local. b Catch numbers do not include test fish or subsistence harvests.
35
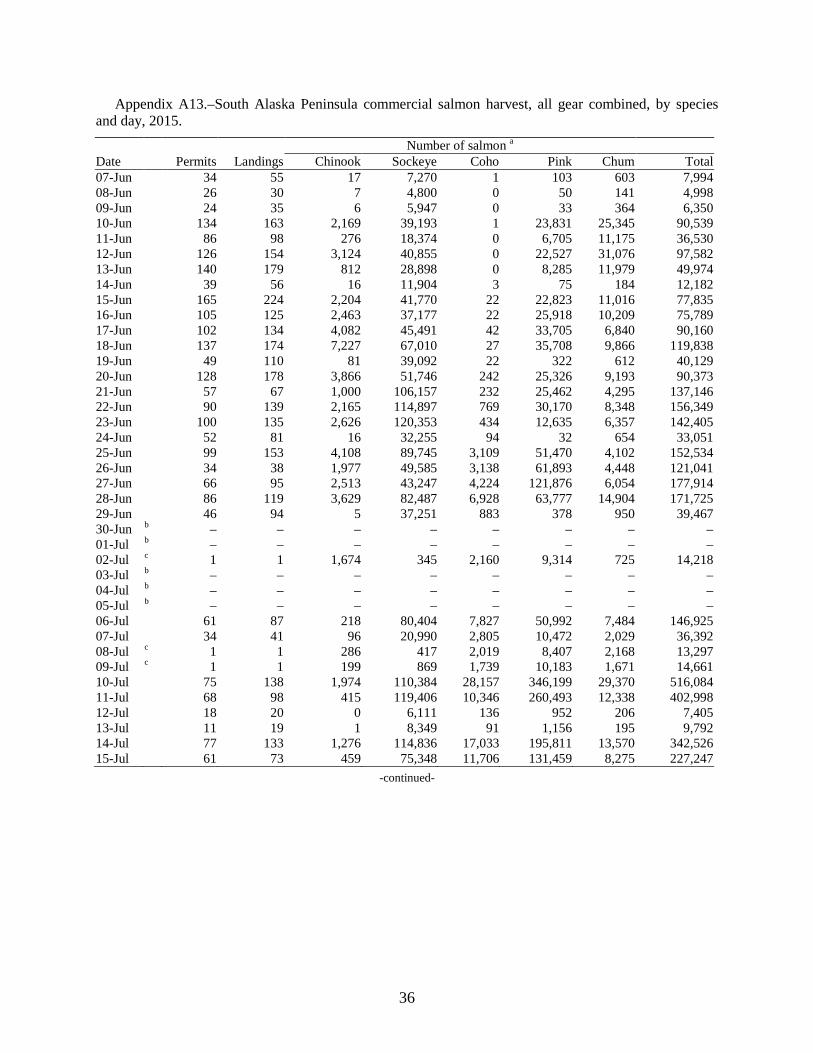
Appendix A13.–South Alaska Peninsula commercial salmon harvest, all gear combined, by species and day, 2015.
Number of salmon a Date Permits Landings Chinook Sockeye Coho Pink Chum Total 07-Jun
34 55 17 7,270 1 103 603 7,994
08-Jun
26 30 7 4,800 0 50 141 4,998 09-Jun
24 35 6 5,947 0 33 364 6,350
10-Jun
134 163 2,169 39,193 1 23,831 25,345 90,539 11-Jun
86 98 276 18,374 0 6,705 11,175 36,530
12-Jun
126 154 3,124 40,855 0 22,527 31,076 97,582 13-Jun
140 179 812 28,898 0 8,285 11,979 49,974
14-Jun
39 56 16 11,904 3 75 184 12,182 15-Jun
165 224 2,204 41,770 22 22,823 11,016 77,835
16-Jun
105 125 2,463 37,177 22 25,918 10,209 75,789 17-Jun
102 134 4,082 45,491 42 33,705 6,840 90,160
18-Jun
137 174 7,227 67,010 27 35,708 9,866 119,838 19-Jun
49 110 81 39,092 22 322 612 40,129
20-Jun
128 178 3,866 51,746 242 25,326 9,193 90,373 21-Jun
57 67 1,000 106,157 232 25,462 4,295 137,146
22-Jun
90 139 2,165 114,897 769 30,170 8,348 156,349 23-Jun
100 135 2,626 120,353 434 12,635 6,357 142,405
24-Jun
52 81 16 32,255 94 32 654 33,051 25-Jun
99 153 4,108 89,745 3,109 51,470 4,102 152,534
26-Jun
34 38 1,977 49,585 3,138 61,893 4,448 121,041 27-Jun
66 95 2,513 43,247 4,224 121,876 6,054 177,914
28-Jun
86 119 3,629 82,487 6,928 63,777 14,904 171,725 29-Jun
46 94 5 37,251 883 378 950 39,467
30-Jun b – – – – – – – – 01-Jul b – – – – – – – – 02-Jul c 1 1 1,674 345 2,160 9,314 725 14,218 03-Jul b – – – – – – – – 04-Jul b – – – – – – – – 05-Jul b – – – – – – – – 06-Jul
61 87 218 80,404 7,827 50,992 7,484 146,925
07-Jul
34 41 96 20,990 2,805 10,472 2,029 36,392 08-Jul c 1 1 286 417 2,019 8,407 2,168 13,297 09-Jul c 1 1 199 869 1,739 10,183 1,671 14,661 10-Jul
75 138 1,974 110,384 28,157 346,199 29,370 516,084
11-Jul
68 98 415 119,406 10,346 260,493 12,338 402,998 12-Jul
18 20 0 6,111 136 952 206 7,405
13-Jul
11 19 1 8,349 91 1,156 195 9,792 14-Jul
77 133 1,276 114,836 17,033 195,811 13,570 342,526
15-Jul 61 73 459 75,348 11,706 131,459 8,275 227,247 -continued-
36
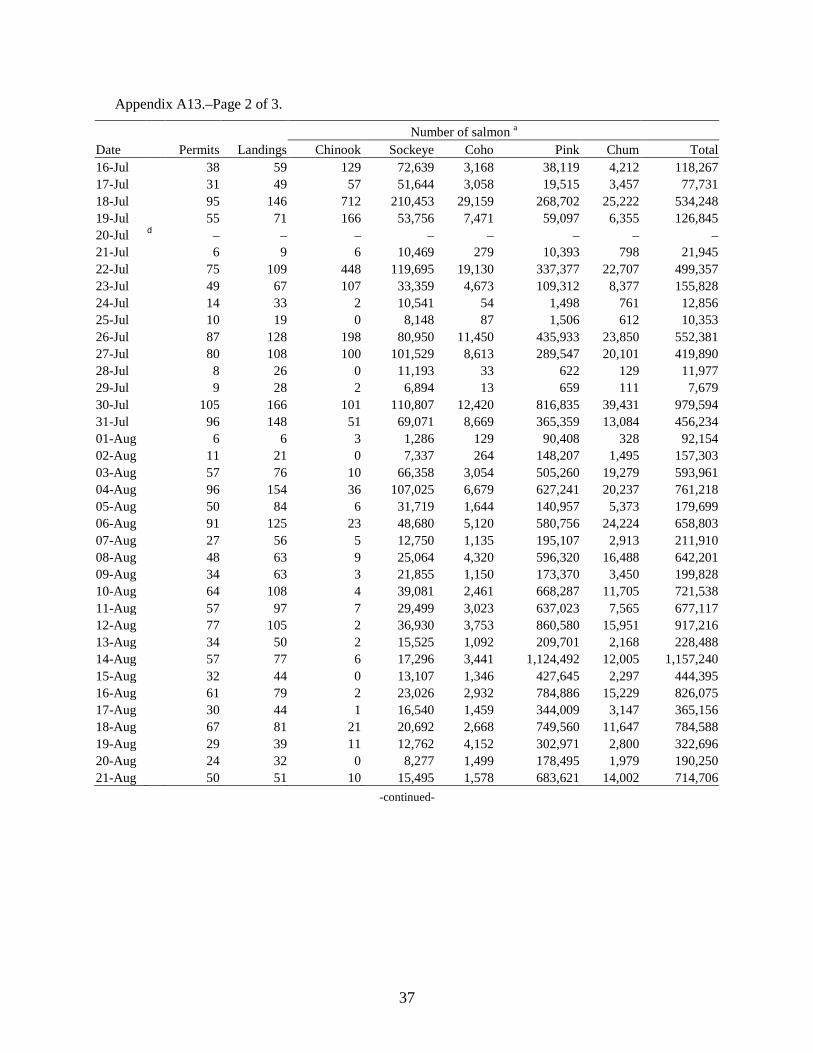
Appendix A13.–Page 2 of 3.
Number of salmon a
Date Permits Landings Chinook Sockeye Coho Pink Chum Total 16-Jul
38 59 129 72,639 3,168 38,119 4,212 118,267
17-Jul
31 49 57 51,644 3,058 19,515 3,457 77,731 18-Jul
95 146 712 210,453 29,159 268,702 25,222 534,248
19-Jul
55 71 166 53,756 7,471 59,097 6,355 126,845 20-Jul d – – – – – – – – 21-Jul
6 9 6 10,469 279 10,393 798 21,945
22-Jul
75 109 448 119,695 19,130 337,377 22,707 499,357 23-Jul
49 67 107 33,359 4,673 109,312 8,377 155,828
24-Jul
14 33 2 10,541 54 1,498 761 12,856 25-Jul
10 19 0 8,148 87 1,506 612 10,353
26-Jul
87 128 198 80,950 11,450 435,933 23,850 552,381 27-Jul
80 108 100 101,529 8,613 289,547 20,101 419,890
28-Jul
8 26 0 11,193 33 622 129 11,977 29-Jul
9 28 2 6,894 13 659 111 7,679
30-Jul
105 166 101 110,807 12,420 816,835 39,431 979,594 31-Jul
96 148 51 69,071 8,669 365,359 13,084 456,234
01-Aug
6 6 3 1,286 129 90,408 328 92,154 02-Aug
11 21 0 7,337 264 148,207 1,495 157,303
03-Aug
57 76 10 66,358 3,054 505,260 19,279 593,961 04-Aug
96 154 36 107,025 6,679 627,241 20,237 761,218
05-Aug
50 84 6 31,719 1,644 140,957 5,373 179,699 06-Aug
91 125 23 48,680 5,120 580,756 24,224 658,803
07-Aug
27 56 5 12,750 1,135 195,107 2,913 211,910 08-Aug
48 63 9 25,064 4,320 596,320 16,488 642,201
09-Aug
34 63 3 21,855 1,150 173,370 3,450 199,828 10-Aug
64 108 4 39,081 2,461 668,287 11,705 721,538
11-Aug
57 97 7 29,499 3,023 637,023 7,565 677,117 12-Aug
77 105 2 36,930 3,753 860,580 15,951 917,216
13-Aug
34 50 2 15,525 1,092 209,701 2,168 228,488 14-Aug
57 77 6 17,296 3,441 1,124,492 12,005 1,157,240
15-Aug
32 44 0 13,107 1,346 427,645 2,297 444,395 16-Aug
61 79 2 23,026 2,932 784,886 15,229 826,075
17-Aug
30 44 1 16,540 1,459 344,009 3,147 365,156 18-Aug
67 81 21 20,692 2,668 749,560 11,647 784,588
19-Aug
29 39 11 12,762 4,152 302,971 2,800 322,696 20-Aug
24 32 0 8,277 1,499 178,495 1,979 190,250
21-Aug 50 51 10 15,495 1,578 683,621 14,002 714,706 -continued-
37
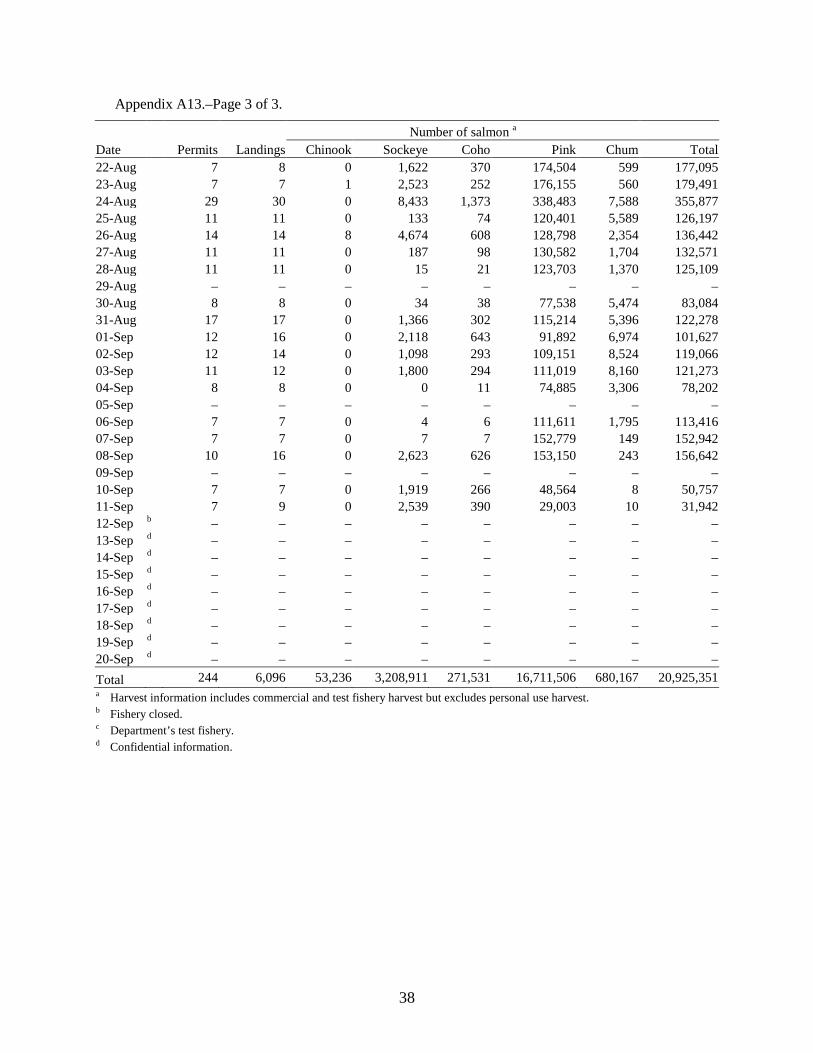
Appendix A13.–Page 3 of 3.
Number of salmon a
Date Permits Landings Chinook Sockeye Coho Pink Chum Total 22-Aug
7 8 0 1,622 370 174,504 599 177,095
23-Aug
7 7 1 2,523 252 176,155 560 179,491 24-Aug
29 30 0 8,433 1,373 338,483 7,588 355,877
25-Aug
11 11 0 133 74 120,401 5,589 126,197 26-Aug
14 14 8 4,674 608 128,798 2,354 136,442
27-Aug
11 11 0 187 98 130,582 1,704 132,571 28-Aug
11 11 0 15 21 123,703 1,370 125,109
29-Aug – – – – – – – – 30-Aug
8 8 0 34 38 77,538 5,474 83,084
31-Aug
17 17 0 1,366 302 115,214 5,396 122,278 01-Sep
12 16 0 2,118 643 91,892 6,974 101,627
02-Sep
12 14 0 1,098 293 109,151 8,524 119,066 03-Sep
11 12 0 1,800 294 111,019 8,160 121,273
04-Sep
8 8 0 0 11 74,885 3,306 78,202 05-Sep – – – – – – – – 06-Sep
7 7 0 4 6 111,611 1,795 113,416
07-Sep
7 7 0 7 7 152,779 149 152,942 08-Sep
10 16 0 2,623 626 153,150 243 156,642
09-Sep – – – – – – – – 10-Sep
7 7 0 1,919 266 48,564 8 50,757
11-Sep
7 9 0 2,539 390 29,003 10 31,942 12-Sep b – – – – – – – – 13-Sep d – – – – – – – – 14-Sep d – – – – – – – – 15-Sep d – – – – – – – – 16-Sep d – – – – – – – – 17-Sep d – – – – – – – – 18-Sep d – – – – – – – – 19-Sep d – – – – – – – – 20-Sep d – – – – – – – – Total 244 6,096 53,236 3,208,911 271,531 16,711,506 680,167 20,925,351 a Harvest information includes commercial and test fishery harvest but excludes personal use harvest. b Fishery closed. c Department’s test fishery. d Confidential information.
38
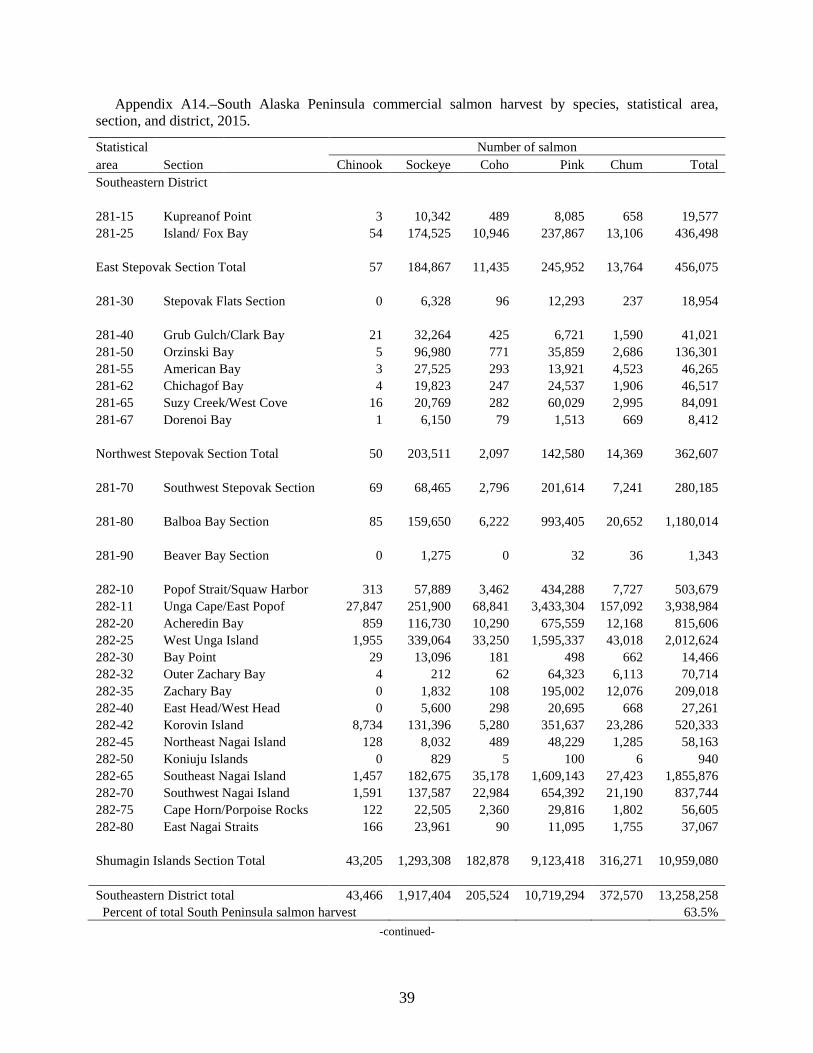
Appendix A14.–South Alaska Peninsula commercial salmon harvest by species, statistical area, section, and district, 2015.
Statistical Number of salmon area Section Chinook Sockeye Coho Pink Chum Total Southeastern District
281-15 Kupreanof Point 3 10,342 489 8,085 658 19,577 281-25 Island/ Fox Bay 54 174,525 10,946 237,867 13,106 436,498
East Stepovak Section Total 57 184,867 11,435 245,952 13,764 456,075
281-30 Stepovak Flats Section 0 6,328 96 12,293 237 18,954
281-40 Grub Gulch/Clark Bay 21 32,264 425 6,721 1,590 41,021 281-50 Orzinski Bay 5 96,980 771 35,859 2,686 136,301 281-55 American Bay 3 27,525 293 13,921 4,523 46,265 281-62 Chichagof Bay 4 19,823 247 24,537 1,906 46,517 281-65 Suzy Creek/West Cove 16 20,769 282 60,029 2,995 84,091 281-67 Dorenoi Bay 1 6,150 79 1,513 669 8,412
Northwest Stepovak Section Total 50 203,511 2,097 142,580 14,369 362,607
281-70 Southwest Stepovak Section 69 68,465 2,796 201,614 7,241 280,185
281-80 Balboa Bay Section 85 159,650 6,222 993,405 20,652 1,180,014
281-90 Beaver Bay Section 0 1,275 0 32 36 1,343
282-10 Popof Strait/Squaw Harbor 313 57,889 3,462 434,288 7,727 503,679 282-11 Unga Cape/East Popof 27,847 251,900 68,841 3,433,304 157,092 3,938,984 282-20 Acheredin Bay 859 116,730 10,290 675,559 12,168 815,606 282-25 West Unga Island 1,955 339,064 33,250 1,595,337 43,018 2,012,624 282-30 Bay Point
29 13,096 181 498 662 14,466
282-32 Outer Zachary Bay 4 212 62 64,323 6,113 70,714 282-35 Zachary Bay 0 1,832 108 195,002 12,076 209,018 282-40 East Head/West Head 0 5,600 298 20,695 668 27,261 282-42 Korovin Island 8,734 131,396 5,280 351,637 23,286 520,333 282-45 Northeast Nagai Island 128 8,032 489 48,229 1,285 58,163 282-50 Koniuju Islands 0 829 5 100 6 940 282-65 Southeast Nagai Island 1,457 182,675 35,178 1,609,143 27,423 1,855,876 282-70 Southwest Nagai Island 1,591 137,587 22,984 654,392 21,190 837,744 282-75 Cape Horn/Porpoise Rocks 122 22,505 2,360 29,816 1,802 56,605 282-80 East Nagai Straits 166 23,961 90 11,095 1,755 37,067
Shumagin Islands Section Total 43,205 1,293,308 182,878 9,123,418 316,271 10,959,080
Southeastern District total 43,466 1,917,404 205,524 10,719,294 372,570 13,258,258 Percent of total South Peninsula salmon harvest 63.5%
-continued-
39
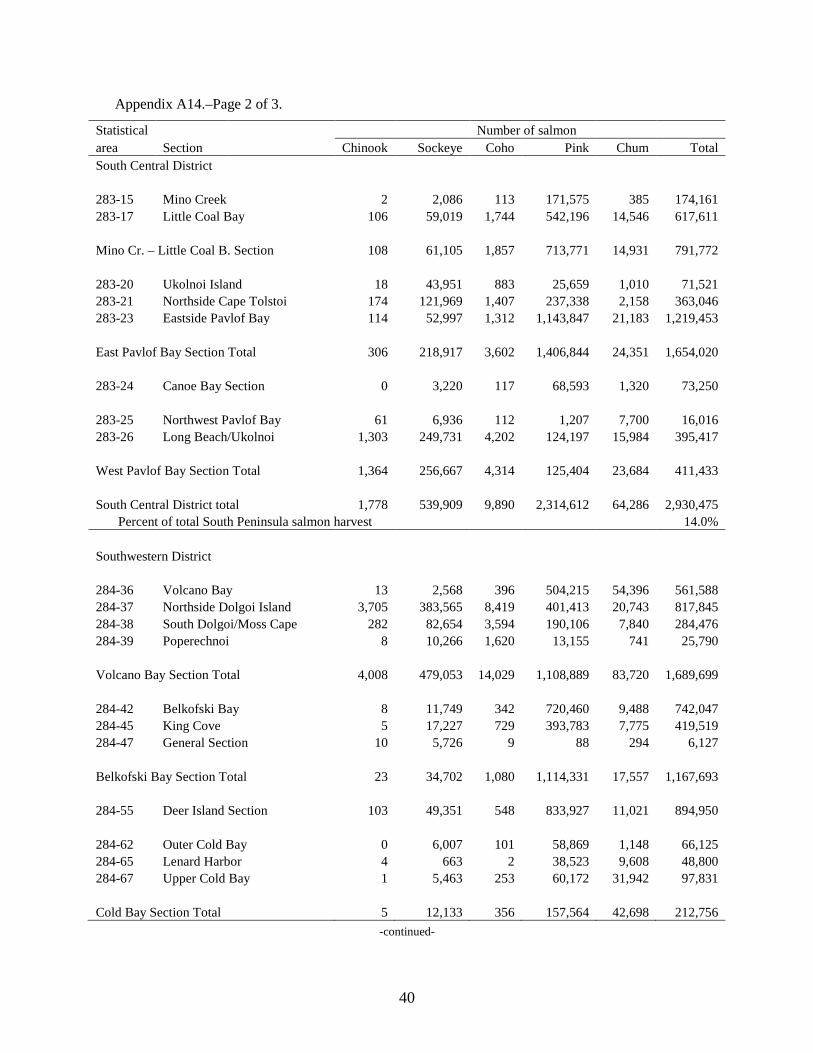
Appendix A14.–Page 2 of 3.
Statistical Number of salmon area Section Chinook Sockeye Coho Pink Chum Total South Central District
283-15 Mino Creek 2 2,086 113 171,575 385 174,161 283-17 Little Coal Bay 106 59,019 1,744 542,196 14,546 617,611
Mino Cr. – Little Coal B. Section 108 61,105 1,857 713,771 14,931 791,772
283-20 Ukolnoi Island 18 43,951 883 25,659 1,010 71,521 283-21 Northside Cape Tolstoi 174 121,969 1,407 237,338 2,158 363,046 283-23 Eastside Pavlof Bay 114 52,997 1,312 1,143,847 21,183 1,219,453
East Pavlof Bay Section Total 306 218,917 3,602 1,406,844 24,351 1,654,020
283-24 Canoe Bay Section 0 3,220 117 68,593 1,320 73,250
283-25 Northwest Pavlof Bay 61 6,936 112 1,207 7,700 16,016 283-26 Long Beach/Ukolnoi 1,303 249,731 4,202 124,197 15,984 395,417
West Pavlof Bay Section Total 1,364 256,667 4,314 125,404 23,684 411,433
South Central District total 1,778 539,909 9,890 2,314,612 64,286 2,930,475 Percent of total South Peninsula salmon harvest
14.0%
Southwestern District
284-36 Volcano Bay 13 2,568 396 504,215 54,396 561,588 284-37 Northside Dolgoi Island 3,705 383,565 8,419 401,413 20,743 817,845 284-38 South Dolgoi/Moss Cape 282 82,654 3,594 190,106 7,840 284,476 284-39 Poperechnoi 8 10,266 1,620 13,155 741 25,790
Volcano Bay Section Total 4,008 479,053 14,029 1,108,889 83,720 1,689,699
284-42 Belkofski Bay 8 11,749 342 720,460 9,488 742,047 284-45 King Cove
5 17,227 729 393,783 7,775 419,519
284-47 General Section 10 5,726 9 88 294 6,127
Belkofski Bay Section Total 23 34,702 1,080 1,114,331 17,557 1,167,693
284-55 Deer Island Section 103 49,351 548 833,927 11,021 894,950
284-62 Outer Cold Bay 0 6,007 101 58,869 1,148 66,125 284-65 Lenard Harbor 4 663 2 38,523 9,608 48,800 284-67 Upper Cold Bay 1 5,463 253 60,172 31,942 97,831
Cold Bay Section Total 5 12,133 356 157,564 42,698 212,756 -continued-
40
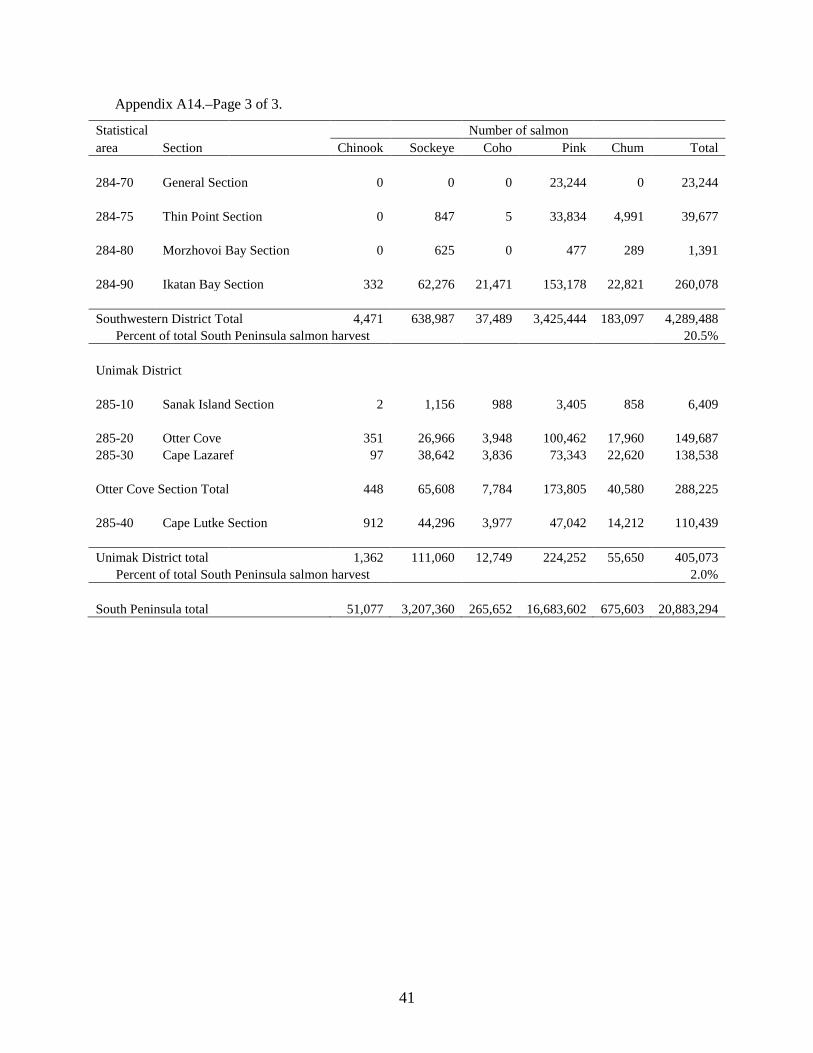
Appendix A14.–Page 3 of 3.
Statistical
Number of salmon area Section Chinook Sockeye Coho Pink Chum Total
284-70 General Section 0 0 0 23,244 0 23,244
284-75 Thin Point Section 0 847 5 33,834 4,991 39,677
284-80 Morzhovoi Bay Section 0 625 0 477 289 1,391
284-90 Ikatan Bay Section 332 62,276 21,471 153,178 22,821 260,078
Southwestern District Total 4,471 638,987 37,489 3,425,444 183,097 4,289,488 Percent of total South Peninsula salmon harvest
20.5%
Unimak District
285-10 Sanak Island Section 2 1,156 988 3,405 858 6,409
285-20 Otter Cove
351 26,966 3,948 100,462 17,960 149,687 285-30 Cape Lazaref 97 38,642 3,836 73,343 22,620 138,538
Otter Cove Section Total 448 65,608 7,784 173,805 40,580 288,225
285-40 Cape Lutke Section 912 44,296 3,977 47,042 14,212 110,439
Unimak District total 1,362 111,060 12,749 224,252 55,650 405,073 Percent of total South Peninsula salmon harvest
2.0%
South Peninsula total 51,077 3,207,360 265,652 16,683,602 675,603 20,883,294
41
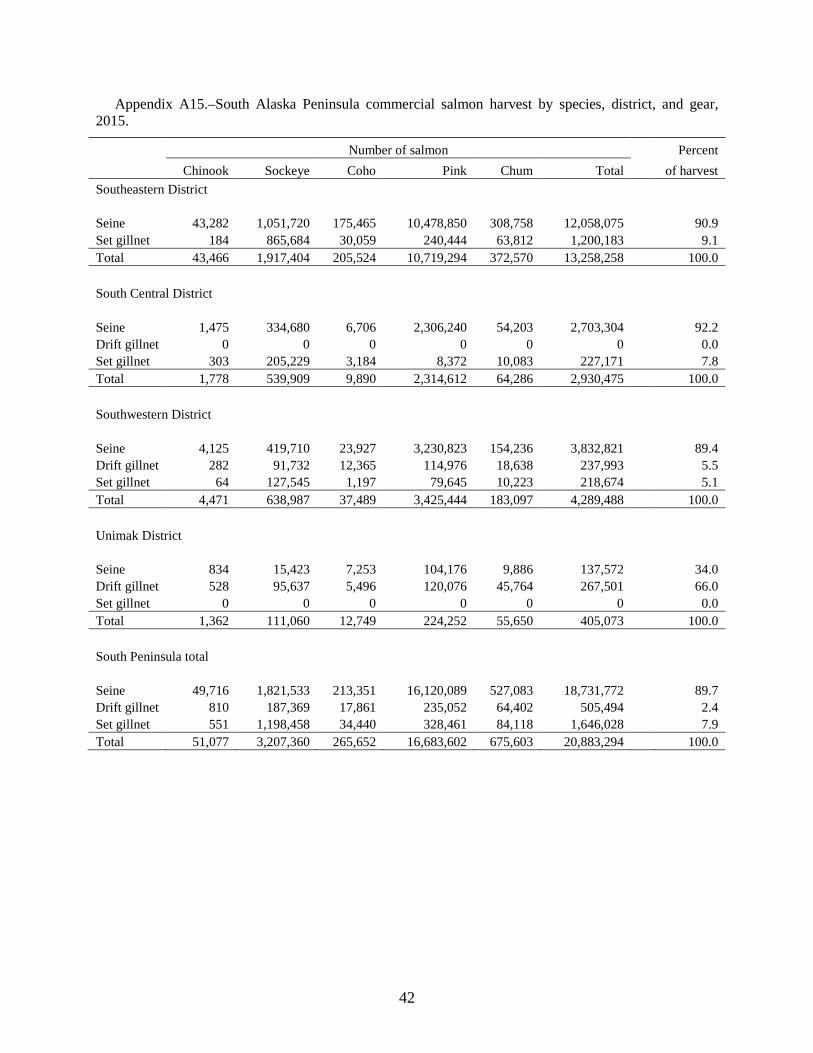
Appendix A15.–South Alaska Peninsula commercial salmon harvest by species, district, and gear, 2015.
Number of salmon Percent Chinook Sockeye Coho Pink Chum Total of harvest Southeastern District
Seine 43,282 1,051,720 175,465 10,478,850 308,758 12,058,075
90.9
Set gillnet 184 865,684 30,059 240,444 63,812 1,200,183 9.1 Total 43,466 1,917,404 205,524 10,719,294 372,570 13,258,258 100.0
South Central District
Seine 1,475 334,680 6,706 2,306,240 54,203 2,703,304
92.2 Drift gillnet 0 0 0 0 0 0
0.0
Set gillnet 303 205,229 3,184 8,372 10,083 227,171 7.8 Total 1,778 539,909 9,890 2,314,612 64,286 2,930,475 100.0
Southwestern District
Seine 4,125 419,710 23,927 3,230,823 154,236 3,832,821
89.4 Drift gillnet 282 91,732 12,365 114,976 18,638 237,993
5.5
Set gillnet 64 127,545 1,197 79,645 10,223 218,674 5.1 Total 4,471 638,987 37,489 3,425,444 183,097 4,289,488 100.0
Unimak District
Seine 834 15,423 7,253 104,176 9,886 137,572
34.0 Drift gillnet 528 95,637 5,496 120,076 45,764 267,501
66.0
Set gillnet 0 0 0 0 0 0 0.0 Total 1,362 111,060 12,749 224,252 55,650 405,073 100.0
South Peninsula total
Seine 49,716 1,821,533 213,351 16,120,089 527,083 18,731,772
89.7 Drift gillnet 810 187,369 17,861 235,052 64,402 505,494
2.4
Set gillnet 551 1,198,458 34,440 328,461 84,118 1,646,028 7.9 Total 51,077 3,207,360 265,652 16,683,602 675,603 20,883,294 100.0
42
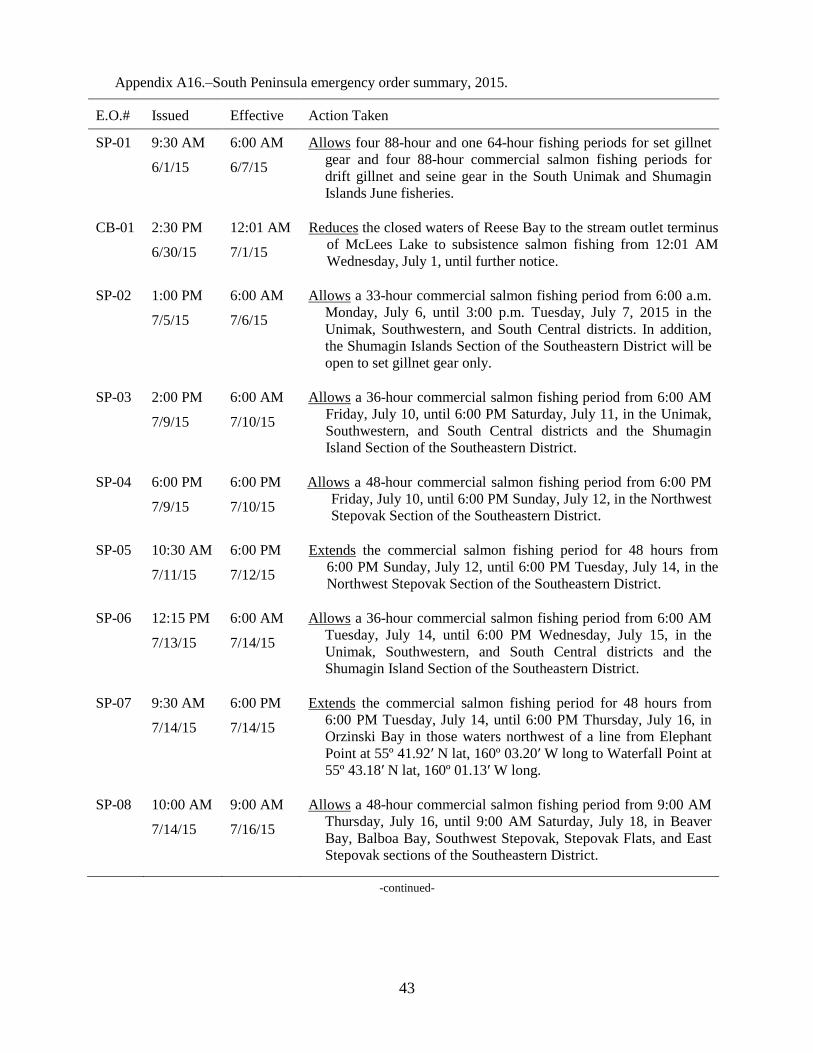
Appendix A16.–South Peninsula emergency order summary, 2015.
E.O.# Issued Effective Action Taken
SP-01 9:30 AM
6/1/15
6:00 AM
6/7/15
Allows four 88-hour and one 64-hour fishing periods for set gillnet gear and four 88-hour commercial salmon fishing periods for drift gillnet and seine gear in the South Unimak and Shumagin Islands June fisheries.
CB-01 2:30 PM
6/30/15
12:01 AM
7/1/15
Reduces the closed waters of Reese Bay to the stream outlet terminus of McLees Lake to subsistence salmon fishing from 12:01 AM Wednesday, July 1, until further notice.
SP-02 1:00 PM
7/5/15
6:00 AM
7/6/15
Allows a 33-hour commercial salmon fishing period from 6:00 a.m. Monday, July 6, until 3:00 p.m. Tuesday, July 7, 2015 in the Unimak, Southwestern, and South Central districts. In addition, the Shumagin Islands Section of the Southeastern District will be open to set gillnet gear only.
SP-03 2:00 PM
7/9/15
6:00 AM
7/10/15
Allows a 36-hour commercial salmon fishing period from 6:00 AM Friday, July 10, until 6:00 PM Saturday, July 11, in the Unimak, Southwestern, and South Central districts and the Shumagin Island Section of the Southeastern District.
SP-04 6:00 PM
7/9/15
6:00 PM
7/10/15
Allows a 48-hour commercial salmon fishing period from 6:00 PM Friday, July 10, until 6:00 PM Sunday, July 12, in the Northwest Stepovak Section of the Southeastern District.
SP-05 10:30 AM
7/11/15
6:00 PM
7/12/15
Extends the commercial salmon fishing period for 48 hours from 6:00 PM Sunday, July 12, until 6:00 PM Tuesday, July 14, in the Northwest Stepovak Section of the Southeastern District.
SP-06 12:15 PM
7/13/15
6:00 AM
7/14/15
Allows a 36-hour commercial salmon fishing period from 6:00 AM Tuesday, July 14, until 6:00 PM Wednesday, July 15, in the Unimak, Southwestern, and South Central districts and the Shumagin Island Section of the Southeastern District.
SP-07 9:30 AM
7/14/15
6:00 PM
7/14/15
Extends the commercial salmon fishing period for 48 hours from 6:00 PM Tuesday, July 14, until 6:00 PM Thursday, July 16, in Orzinski Bay in those waters northwest of a line from Elephant Point at 55º 41.92′ N lat, 160º 03.20′ W long to Waterfall Point at 55º 43.18′ N lat, 160º 01.13′ W long.
SP-08 10:00 AM
7/14/15
9:00 AM
7/16/15
Allows a 48-hour commercial salmon fishing period from 9:00 AM Thursday, July 16, until 9:00 AM Saturday, July 18, in Beaver Bay, Balboa Bay, Southwest Stepovak, Stepovak Flats, and East Stepovak sections of the Southeastern District.
-continued-
43
Appendix A16.–Page 2 of 5.
E.O.# Issued Effective Action Taken
SP-09 9:15 AM
7/16/15
6:00 PM
7/16/15
Extends the commercial salmon fishing period for 24 hours from 6:00 PM Thursday, July 16, until 6:00 PM Friday, July 17, in Orzinski Bay in those waters northwest of a line from Elephant Point at 55º 41.92′ N lat, 160º 03.20′ W long to Waterfall Point at 55º 43.18′ N lat, 160º 01.13′ W long.
Allows a 48-hour commercial fishing period from 6:00 PM Friday, July 17, until 6:00 PM Sunday, July 19, in the Northwest Stepovak Section of the Southeastern District.
SP-10 4:00 PM
7/16/15
6:00 AM
7/18/15
Allows a 36-hour commercial salmon fishing period from 6:00 AM Saturday, July 18, until 6:00 PM Sunday, July 19, in the Unimak, Southwestern, and South Central districts and the Shumagin Island Section of the Southeastern District.
SP-11 4:00 PM
7/18/15
6:00 PM
7/19/15
Extends the commercial salmon fishing period for 48 hours from 6:00 PM Sunday, July 19, until 6:00 PM Tuesday, July 21, in the Northwest Stepovak Section of the Southeastern District.
SP-12 6:00 PM
7/20/15
6:00 PM
7/22/15
Allows a 36-hour commercial salmon fishing period from 6:00 AM Wednesday, July 22, until 6:00 PM Thursday, July 23, in the Unimak, Southwestern, and South Central districts and the Shumagin Island Section of the Southeastern District.
SP-13 9:30 AM
7/21/15
6:00 PM
7/21/15
Extends the commercial salmon fishing period for 72 hours from 6:00 PM Tuesday, July 21, until 6:00 PM Friday, July 24, in Orzinski Bay in those waters northwest of a line from Elephant Point at 55º 41.92′ N lat, 160º 03.20′ W long to Waterfall Point at 55º 43.18′ N lat, 160º 01.13′ W long.
SP-14 10:00 AM
7/23/15
6:00 PM
7/24/15
Allows an approximately 30-hour commercial salmon fishing period from 6:00 PM Friday, July 24, until 11:59 PM Saturday, July 25, in the Northwest Stepovak Section of the Southeastern District, including Orzinski Bay.
SP-15 9:15 AM
7/25/15
6:00 AM
7/26/15
Allows a 36-hour commercial salmon fishing period from 6:00 AM Sunday, July 26, until 6:00 PM Monday, July 27, in the Unimak, Southwestern, and South Central districts and the Shumagin Island Section of the Southeastern District.
Extends the commercial salmon fishing period from 11:59 PM Saturday, July 25, until further notice in Orzinski Bay in those waters northwest of a line from Elephant Point at 55º 41.92′ N lat, 160º 03.20′ W long to Waterfall Point at 55º 43.18′ N lat, 160º 01.13′ W long.
SP-16 9:30 AM
7/28/15
9:30 AM
7/28/15
Reduces closed waters of Orzinski Bay to the stream mouth.
-continued-
44
Appendix A16.–Page 3 of 5.
E.O.# Issued Effective Action Taken
SP-17 2:00 PM
7/29/15
6:00 AM
7/30/15
Allows a 36-hour commercial salmon fishing period from 6:00 AM Thursday, July 30, until 6:00 PM Friday, July 31, in the Unimak, Southwestern, and South Central districts and the Shumagin Island Section of the Southeastern District.
SP-18 2:30 PM
7/30/15
6:00 PM
7/31/15
Extends the commercial salmon fishing period from 6:00 PM Friday, July 31 until further notice in the Canoe Bay, East Pavlof Bay (north of the latitude of Black Point at 55º 24.48′ N lat), and Mino Creek-Little Coal Bay sections of the South Central District.
SP-19 5:00 PM
7/31/15
8:00 AM
8/3/15
Allows an 85-hour commercial salmon fishing period from 8:00 AM Monday, August 3, until 9:00 PM Thursday, August 6, in the Unimak, Southwestern, and South Central districts and the Shumagin Island Section of the Southeastern District.
SP-20 5:00 PM
7/31/15
8:00 AM
8/3/15
Allows an 85-hour commercial salmon fishing period from 8:00 AM Monday, August 3, until 9:00 PM Thursday, August 6, in Beaver Bay, Balboa Bay, Southwest Stepovak, Northwest Stepovak, and East Stepovak sections of the Southeastern District.
Closes The Volcano Bay Section as well as the Belkofski Bay Section north of a line extending from Belkofski Point at 55º 04.31′ N lat, 162º 03.40′W long to Slavna Point at 55º 03.72′ N lat, 162º 11.42′W long.
SP-21 9:00 AM
8/6/15
9:00 PM
8/6/15
Extends the commercial salmon fishing period for 72 hours from 9:00 PM Thursday, August 6, until 9:00 PM Sunday, August 9, in the Unimak, Southwestern, and South Central districts and the Shumagin Island Section of the Southeastern District.
SP-22 9:00 AM
8/8/15
8:00 AM
8/9/15
Allows a 109-hour commercial salmon fishing period from 8:00 AM Sunday, August 8, until 9:00 PM Thursday, August 13, in Beaver Bay, Balboa Bay, Southwest Stepovak, Northwest Stepovak, and East Stepovak sections of the Southeastern District.
SP-23 4:00 PM
8/8/15
9:00 PM
8/9/15
Extends the commercial salmon fishing period for 96 hours from 9:00 PM Sunday, August 9, until 9:00 PM Thursday, August 13, in the Unimak, Southwestern, and South Central districts and the Shumagin Island Section of the Southeastern District.
CB-01 9:00 AM
8/11/15
6:00 AM
8/12/15
Allows a 60-hour commercial salmon fishing period from 6:00 a.m. Wednesday, August 12, until 6:00 p.m. Friday, August 14, in the Urilia Bay Section of the Northwestern District.
-continued-
45
Appendix A16.–Page 4 of 5.
E.O.# Issued Effective Action Taken
SP-24 4:00 PM
8/12/15
9:00 PM
8/13/15
Extends the commercial salmon fishing period from 9:00 PM Thursday, August 13, until further notice in the Unimak, Southwestern, and South Central districts and the Shumagin Island Section of the Southeastern District.
Reduces the closed waters of Mino Creek, those waters of Coal Bay north of a line extending from Seal Cape at 55º 21.53′ N lat, 161º 19.90′ W long, and Settlements Point Creek to the stream outlet terminus with the ocean shoreline.
SP-25 4:30 PM
8/13/15
9:00 AM
8/15/15
Allows a 132-hour commercial salmon fishing period from 9:00 AM Saturday, August 15, until 9:00 PM Thursday, August 20, in Beaver Bay, Balboa Bay, Southwest Stepovak, Northwest Stepovak, and East Stepovak sections of the Southeastern District.
SP-26 9:00 AM
8/21/15
9:00 AM
8/22/15
Allows a 132-hour commercial salmon fishing period from 9:00 AM Saturday, August 22, until 9:00 PM Thursday, August 27, in Beaver Bay, Balboa Bay, Southwest Stepovak, Northwest Stepovak, and East Stepovak sections of the Southeastern District.
Allows a commercial salmon fishing period from 9:00 AM Friday, August 21, until further notice in The Volcano Bay Section and the Belkofski Bay Section north of a line extending from Belkofski Point at 55º 04.31′ N lat, 162º 03.40′ W long to Slavna Point at 55º 03.72′ N lat, 162º 11.42′ W long.
Reduces the closed waters of Beaver Bay, Balboa Bay, Southwest Stepovak, Northwest Stepovak, and East Stepovak sections of the Southeastern District to the stream outlet terminus with the ocean shoreline and waters of the Deer Island Section of the Southwestern District and the Shumagin Islands Section of the Southeastern District to the stream mouths.
SP-27 11:45 AM
8/21/15
1:00 PM
8/21/15
Increases the closed waters of Red Cove of Popof Island to the stream markers at 500 yards from the stream outlet from 1:00 PM Friday, August 21, until further notice.
SP-28 4:00 PM
8/27/15
9:00 AM
8/29/15
Allows a 131-hour commercial salmon fishing period from 9:00 AM Saturday, August 29, until 8:00 PM Thursday, September 3, in Beaver Bay, Balboa Bay, Southwest Stepovak, Northwest Stepovak, and East Stepovak sections of the Southeastern District.
SP-29 12:00 PM
9/1/15
8:00 AM
9/2/15
Reduces the closed waters of Volcano Bay, north of a line from 55º 04.31′ N lat, 162º 01.40′ W long to 55º 13.83′N lat, 162º 58.20′ W long to the stream outlet terminus with the ocean shoreline from Wednesday, September 2, until further notice.
-continued-
46
Appendix A16.–Page 5 of 5.
E.O.# Issued Effective Action Taken
SP-30 9:00 AM
9/5/15
9:00 AM
9/6/15
Allows a 131-hour commercial salmon fishing period from 9:00 AM Sunday, September 6, until 8:00 PM Friday, September 11, in Beaver Bay, Balboa Bay, Southwest Stepovak, Northwest Stepovak, and East Stepovak sections of the Southeastern District.
SP-31 4:00 PM
9/11/15
9:00 AM
9/13/15
Allows a 131-hour commercial salmon fishing period from 9:00 AM Sunday, September 13, until 8:00 PM Friday, September 18, in Beaver Bay, Balboa Bay, Southwest Stepovak, Northwest Stepovak, and East Stepovak sections of the Southeastern District.
SP-32 4:00 PM
9/18/15
8:00 PM
9/18/15
Extends commercial salmon fishing from 8:00 PM Friday, September 18, until further notice in Beaver Bay, Balboa Bay, Southwest Stepovak, Northwest Stepovak, and East Stepovak sections of the Southeastern District.
SP-33 11:30 AM
9/29/15
11:30 AM
9/29/15
Closes commercial salmon fishing in Unimak, Southwestern, South Central, and Southeastern districts until further notice.
47

48
APPENDIX B. SOUTH UNIMAK AND SHUMAGIN
ISLANDS JUNE FISHERIES
49
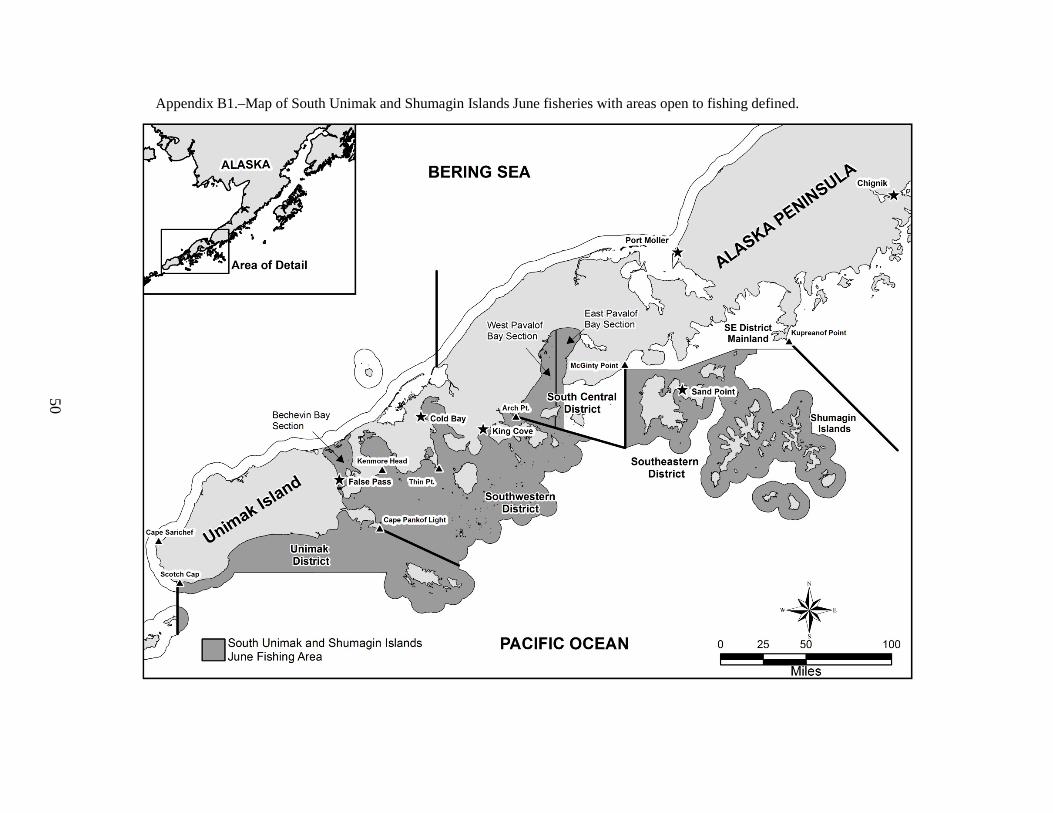
50
Appendix B1.–Map of South Unimak and Shumagin Islands June fisheries with areas open to fishing defined.
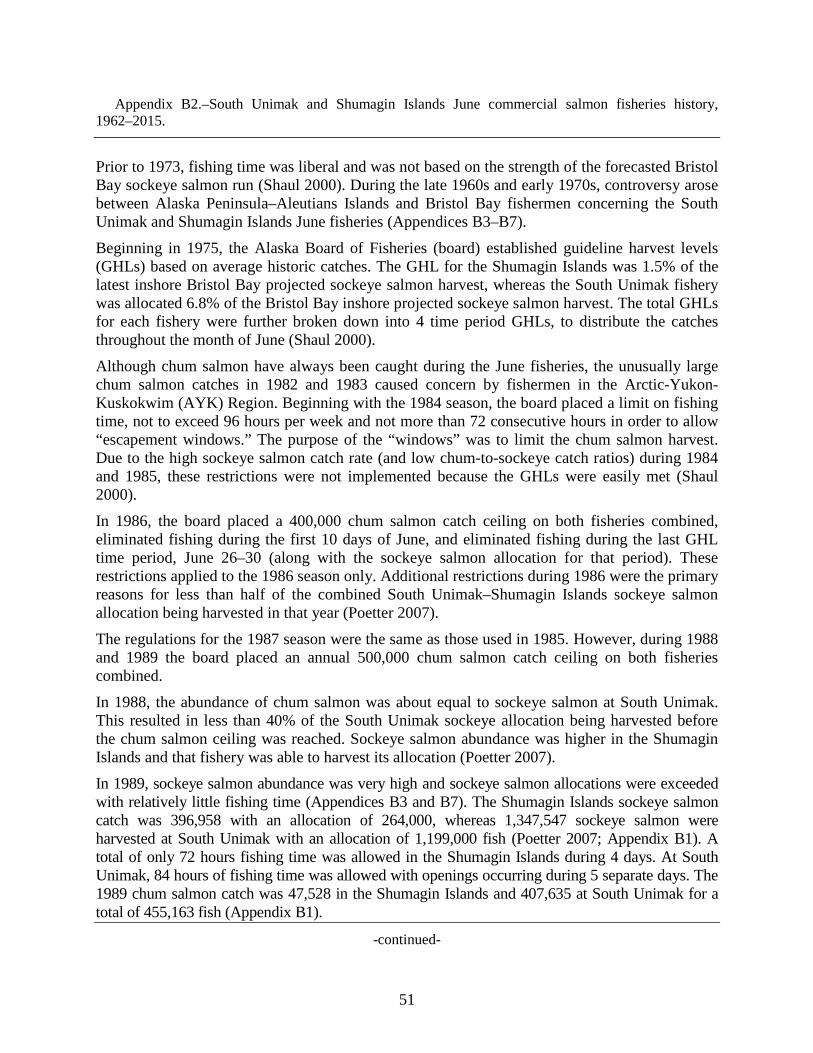
Appendix B2.–South Unimak and Shumagin Islands June commercial salmon fisheries history, 1962–2015.
Prior to 1973, fishing time was liberal and was not based on the strength of the forecasted Bristol Bay sockeye salmon run (Shaul 2000). During the late 1960s and early 1970s, controversy arose between Alaska Peninsula–Aleutians Islands and Bristol Bay fishermen concerning the South Unimak and Shumagin Islands June fisheries (Appendices B3–B7).
Beginning in 1975, the Alaska Board of Fisheries (board) established guideline harvest levels (GHLs) based on average historic catches. The GHL for the Shumagin Islands was 1.5% of the latest inshore Bristol Bay projected sockeye salmon harvest, whereas the South Unimak fishery was allocated 6.8% of the Bristol Bay inshore projected sockeye salmon harvest. The total GHLs for each fishery were further broken down into 4 time period GHLs, to distribute the catches throughout the month of June (Shaul 2000).
Although chum salmon have always been caught during the June fisheries, the unusually large chum salmon catches in 1982 and 1983 caused concern by fishermen in the Arctic-Yukon-Kuskokwim (AYK) Region. Beginning with the 1984 season, the board placed a limit on fishing time, not to exceed 96 hours per week and not more than 72 consecutive hours in order to allow “escapement windows.” The purpose of the “windows” was to limit the chum salmon harvest. Due to the high sockeye salmon catch rate (and low chum-to-sockeye catch ratios) during 1984 and 1985, these restrictions were not implemented because the GHLs were easily met (Shaul 2000).
In 1986, the board placed a 400,000 chum salmon catch ceiling on both fisheries combined, eliminated fishing during the first 10 days of June, and eliminated fishing during the last GHL time period, June 26–30 (along with the sockeye salmon allocation for that period). These restrictions applied to the 1986 season only. Additional restrictions during 1986 were the primary reasons for less than half of the combined South Unimak–Shumagin Islands sockeye salmon allocation being harvested in that year (Poetter 2007).
The regulations for the 1987 season were the same as those used in 1985. However, during 1988 and 1989 the board placed an annual 500,000 chum salmon catch ceiling on both fisheries combined.
In 1988, the abundance of chum salmon was about equal to sockeye salmon at South Unimak. This resulted in less than 40% of the South Unimak sockeye allocation being harvested before the chum salmon ceiling was reached. Sockeye salmon abundance was higher in the Shumagin Islands and that fishery was able to harvest its allocation (Poetter 2007).
In 1989, sockeye salmon abundance was very high and sockeye salmon allocations were exceeded with relatively little fishing time (Appendices B3 and B7). The Shumagin Islands sockeye salmon catch was 396,958 with an allocation of 264,000, whereas 1,347,547 sockeye salmon were harvested at South Unimak with an allocation of 1,199,000 fish (Poetter 2007; Appendix B1). A total of only 72 hours fishing time was allowed in the Shumagin Islands during 4 days. At South Unimak, 84 hours of fishing time was allowed with openings occurring during 5 separate days. The 1989 chum salmon catch was 47,528 in the Shumagin Islands and 407,635 at South Unimak for a total of 455,163 fish (Appendix B1).
-continued-
51
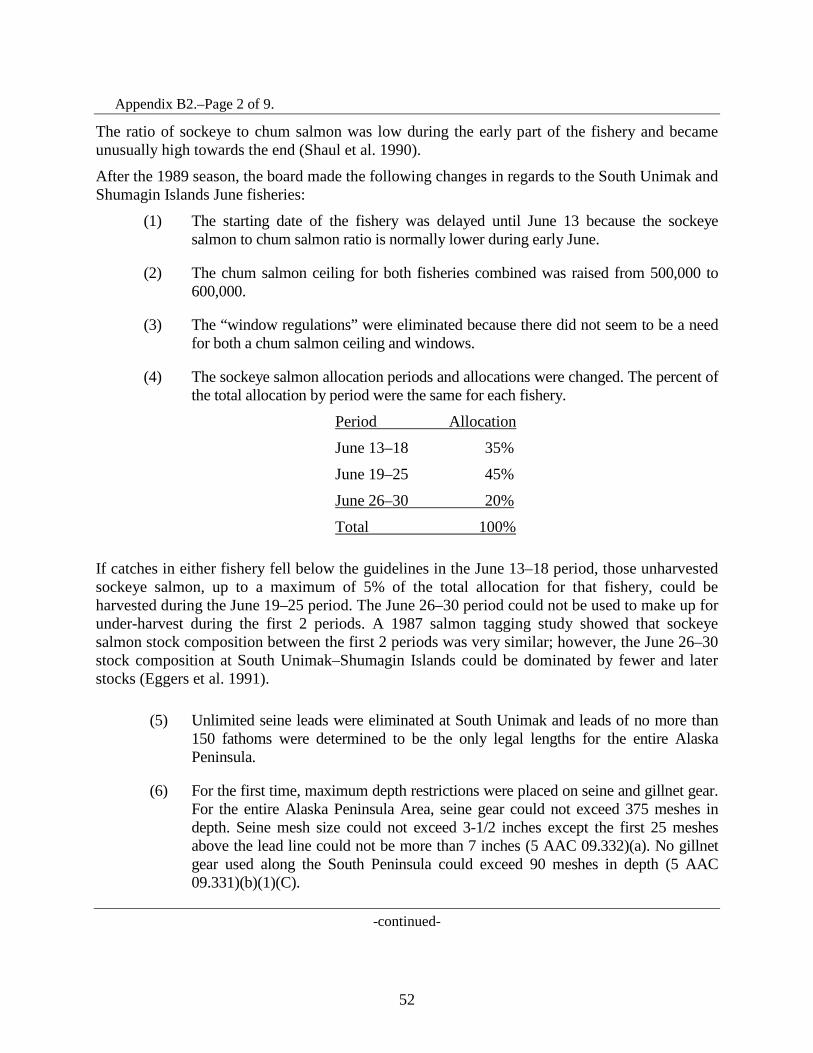
Appendix B2.–Page 2 of 9.
The ratio of sockeye to chum salmon was low during the early part of the fishery and became unusually high towards the end (Shaul et al. 1990).
After the 1989 season, the board made the following changes in regards to the South Unimak and Shumagin Islands June fisheries:
(1) The starting date of the fishery was delayed until June 13 because the sockeye salmon to chum salmon ratio is normally lower during early June.
(2) The chum salmon ceiling for both fisheries combined was raised from 500,000 to
600,000.
(3) The “window regulations” were eliminated because there did not seem to be a need for both a chum salmon ceiling and windows.
(4) The sockeye salmon allocation periods and allocations were changed. The percent of
the total allocation by period were the same for each fishery.
Period Allocation
June 13–18 35%
June 19–25 45%
June 26–30 20%
Total 100% If catches in either fishery fell below the guidelines in the June 13–18 period, those unharvested sockeye salmon, up to a maximum of 5% of the total allocation for that fishery, could be harvested during the June 19–25 period. The June 26–30 period could not be used to make up for under-harvest during the first 2 periods. A 1987 salmon tagging study showed that sockeye salmon stock composition between the first 2 periods was very similar; however, the June 26–30 stock composition at South Unimak–Shumagin Islands could be dominated by fewer and later stocks (Eggers et al. 1991).
(5) Unlimited seine leads were eliminated at South Unimak and leads of no more than 150 fathoms were determined to be the only legal lengths for the entire Alaska Peninsula.
(6) For the first time, maximum depth restrictions were placed on seine and gillnet gear.
For the entire Alaska Peninsula Area, seine gear could not exceed 375 meshes in depth. Seine mesh size could not exceed 3-1/2 inches except the first 25 meshes above the lead line could not be more than 7 inches (5 AAC 09.332)(a). No gillnet gear used along the South Peninsula could exceed 90 meshes in depth (5 AAC 09.331)(b)(1)(C).
-continued-
52
Appendix B2.–Page 3 of 9.
(7) The area making up the South Unimak fishery was expanded to include the following portions of Southwestern District located outside the Ikatan Bay Section: (a) all waters north and west of a line from Cape Pankof Light to Thin Point. (b) all waters enclosed by a line from Thin Point to Stag Point on Deer Island to
Dolgoi Cape and from Bluff Point on Dolgoi Island to Arch Point.
In 1990, sockeye salmon were not available in large numbers in the Shumagin Islands or at South Unimak despite the fact that Bristol Bay experienced one of its largest runs on record (Shaul et al. 1991). If the Bristol Bay run had been forecasted correctly, the sockeye salmon GHL for the Shumagin Islands and South Unimak would have been 497,000 and 2,255,000 respectively (Shaul et al. 1991). Windy weather plagued fishing operations but fish abundance also seemed low, especially in view of the huge run that arrived in Bristol Bay.
Harvesting the total sockeye salmon allocations in the South Unimak and Shumagin Islands June fisheries with a chum salmon cap in place was often difficult and sometimes impossible, especially when sockeye salmon allocations were large. At the fall 1991 board meeting, the chum salmon cap was changed to 40% of the combined South Unimak and Shumagin Islands sockeye salmon allocation, not to exceed 900,000 fish (Shaul 2000). This change generated much controversy from fishermen in the AYK Region because the chum salmon cap was likely to be 900,000 fish in 1992–1994, based on initial long-range Bristol Bay sockeye salmon projections. The board addressed the chum salmon cap issue again at their spring 1992 meeting and changed the cap to 700,000 chum salmon, regardless of the sockeye salmon allocation. The board also stipulated that unless the chum salmon cap was in danger of being exceeded, set gillnet fishing periods would not be less than 16 hours even if it was necessary to restrict seine and drift gillnet gear periods to less than 16 hours due to chum salmon conservation. This was due to set gillnet gear selectivity favoring sockeye salmon. Regardless of gear selectivity, the board directed the Alaska Department of Fish and Game (department) to manage the fishery so that the cap would not be exceeded.
In 1992, the respective sockeye salmon allocations were 1,959,000 and 432,000 fish for the South Unimak and Shumagin Islands fisheries (Poetter 2007). The fishery was delayed until June 15 because of the high number of chum salmon caught in the Shumagin Islands test fishery. From June 15 until the end of the fishery on June 26, sockeye to chum salmon ratios were very high (Poetter 2007). A total of 2,046,022 sockeye salmon were harvested at South Unimak, whereas the Shumagin Islands sockeye salmon harvest was 411,834 fish (Appendix B1). The chum salmon harvest from both fisheries combined was 426,203 fish.
In 1993, South Unimak and Shumagin Islands sockeye salmon allocations were 2,375,000 and 524,000 fish, respectively (Poetter 2007). Test fishing in the Shumagin Islands during June 7–11 indicated sockeye to chum salmon ratios greater than 2.0. Consequently, fishing began on June 13, the earliest date allowed by the South Unimak and Shumagin Islands June Management Plan.
-continued-
53
Appendix B2.–Page 4 of 9.
In 1993, AYK chum salmon stocks were at low levels, resulting in very little commercial fishing targeting chum salmon (Francisco et al. 1994). Subsistence fishing for AYK chum salmon was not allowed in some locations. Consequently, during 1993 and 1994, the board conducted 2 out-of-cycle meetings devoted to the South Unimak–Shumagin Islands June fishery. The first meeting was non-regulatory but resulted in the second meeting in which regulatory changes were made.
During its spring 1994 meeting, the board allowed the department to open the South Unimak-Shumagin Islands fisheries prior to June 13 if sockeye to chum salmon ratios were greater than 2.0, and eliminated the time period allocations. Elimination of time period allocations would have resulted in a substantially lower harvest of chum salmon in 1993 (McCullough and Pengilly 1994).
The 1994 sockeye salmon allocations were a record high, totaling 2,938,000 fish at South Unimak and 648,000 fish in the Shumagin Islands (Poetter 2007). Test fishing in the Shumagin Islands indicated that sockeye to chum salmon ratios were low and no fishing was allowed in the Shumagin Islands until June 18. Test fishing indicated that sockeye to chum salmon ratios at South Unimak on June 15 and 16 were higher than those in the Shumagin Islands, and fishing started on June 17.
The 1994 fishery was characterized by low catch rates of sockeye and chum salmon but record June pink salmon catches (Appendix B4). Sockeye to chum ratios were slightly better than 2 to 1 during most of the fishery and were lower at the end of June (Poetter 2007). Total sockeye salmon harvest was very disappointing to industry in the Alaska Peninsula Area. At South Unimak, 1,001,250 sockeye salmon (34% of allocation) were harvested. In the Shumagin Islands, 460,013 sockeye salmon (71% of allocation) were harvested. The combined chum salmon catch was 582,165 fish (Appendix B1).
The 1994 Bristol Bay sockeye salmon run was below forecast but still a very strong run and produced an inshore harvest of over 35 million fish. However, sockeye salmon were not available in large numbers in the South Unimak and Shumagin Islands fisheries. Fishermen reported a drastic change in currents and colder inshore water temperatures, which they believe may have affected the migratory pattern of sockeye salmon.
Large numbers of chum salmon were reported to be in the South Unimak fishery throughout June but fishermen avoided areas with high chum salmon concentrations. These tactics apparently not only decreased the chum salmon catch but reduced the fleets’ ability to harvest sockeye salmon because the 2 species were reported to be traveling together in large numbers at some locations.
-continued-
54
Appendix B2.–Page 5 of 9.
Following the 1994 season, the board implemented the following changes to the management plan.
1. June fishery cannot begin prior to June 11.
2. After June 24, in either the South Unimak or Shumagin Islands fisheries, if the sockeye salmon guideline harvest level and the maximum allowable harvest of chum salmon have not been attained, and if the ratio of sockeye to chum salmon is 2:1 or less on any day, the next daily fishing period for seine and drift gillnet gear shall be of 6-hour duration in that fishery. After June 24, the South Unimak or Shumagin Islands fishery shall close for all gear types if the ratio of sockeye to chum salmon is 2:1 or less for any 3 aggregate days.
3. The board stated its intent that keeping the chum salmon harvest below the cap supersedes any attempt to reach the sockeye salmon GHLs.
4. The board eliminated minimum mesh size requirements for gillnets during the June fisheries.
In 1995, the sockeye salmon GHL was 2,987,000 fish allocated to South Unimak and 659,000 fish to Shumagin Islands for a total of 3,646,000 fish (Poetter 2007). Test fishing in the Shumagin Islands and at South Unimak indicated that sockeye to chum salmon ratios were slightly higher than in 1994. Consequently, both fisheries opened on June 13. However, the sockeye salmon harvest rates were again low. Virtually continuous fishing was allowed in both fisheries, through June 30 at South Unimak, and through June 29 in the Shumagin Islands where the sockeye salmon allocation was achieved. The 1995 South Unimak harvest was 1,451,490 sockeye salmon and 342,307 chum salmon; the fishery was about 1,536,000 fish under the sockeye salmon GHL (Appendix B1). Shumagin Islands catch totaled 653,831 sockeye and 195,126 chum salmon and was only 5,000 fish under the sockeye salmon GHL. The combined harvest of both fisheries was 2,105,321 sockeye and 537,433 chum salmon, which was 1,541,000 sockeye salmon less than the GHL (Poetter 2007) and about 163,000 chum salmon less than the 700,000 cap. The combined sockeye salmon GHL was not achieved because sockeye salmon were not available in large numbers at South Unimak. The actual Bristol Bay sockeye salmon harvest was slightly larger than the forecast.
The 1996 South Unimak sockeye salmon GHL was 2,564,000 fish while that of the Shumagin Islands was 566,000 fish (Poetter 2007). Based on test fishing results, the South Unimak fishery did not begin until June 15 and the Shumagin Islands did not open until June 18. The purpose of test fishing was to determine the sockeye to chum salmon ratio as an indication of when the sockeye salmon harvest could be maximized without reaching the chum salmon cap. Salmon harvest rates were extremely low in both South Unimak and Shumagin Islands fisheries and almost continuous fishing was allowed. At South Unimak, despite continuous fishing from June 18 through June 30, only 572,495 sockeye salmon (23.3% of the allocation) were harvested (Appendix B1). In the Shumagin Islands 456,475 sockeye salmon were caught, bringing the combined South Unimak–Shumagin Islands sockeye salmon harvest to 1,028,970 (33% of the allocation). A total of 359,820 chum salmon were harvested (129,889 at South Unimak and 229,931 in the Shumagin Islands), about 340,000 fish below the 700,000 cap (Appendix B1).
-continued-
55
Appendix B2.–Page 6 of 9.
In 1997, the South Unimak fishery opened on June 13. Because of a price dispute, fishing effort ranged from 58 to 97 drift gillnet permit holders from June 13 through June 17 (Poetter 2007). The dispute was settled on June 18, and continuous fishing was allowed through June 30. The sockeye salmon harvest was 1,179,179 fish, 36% below the 1,840,000 GHL (Poetter 2007). The 1997 Shumagin Islands fishery opened on June 19, and fishing was allowed daily until June 26 when the sockeye salmon GHL of 406,000 was exceeded (Poetter 2007). Shumagin Islands harvest was 449,002 sockeye salmon. A total of 322,325 chum salmon were harvested (196,016 at South Unimak and 126,309 in the Shumagin Islands), 377,675 fish below the 700,000 cap (Appendix B1).
After the 1997 season, the board lowered the chum salmon cap from 700,000 fish to a “floating cap” that could range from 350,000 to 650,000 depending on the projected strength of harvests of summer chum salmon in AYK Area in relation to the 1970–1997 average. If the projected AYK chum salmon harvest was less than 33% of the average catches, the South Peninsula cap would be 350,000 to 450,000 fish. If the projected AYK summer run chum salmon harvest was between 33% and 67% of the 1970–1997 average, the South Peninsula cap would be between 450,001 and 550,000 chum salmon. If the AYK summer chum salmon harvest exceeded 67% of the 1970–1997 average, the South Peninsula chum salmon cap would be 550,001 to 650,000 fish. If the department identified a summer chum salmon stock of concern, the upper end of the cap would be reduced by 50,000 fish. The earliest opening date was changed from June 11 to June 10. In the Unimak District, the shoreward end of a set gillnet had to be within one half-mile of shore. All salmon caught had to be retained and reported. The use of aircraft to locate salmon was prohibited for the entire Alaska Peninsula Area for the entire season.
In 1998, the South Unimak and Shumagin Islands fisheries both opened to commercial salmon fishing on June 13. However, the entire seine fleet and approximately 80% of the set gillnet fleet did not fish because of a dispute over salmon prices. The drift gillnet fleet at South Unimak started fishing on June 13. As the fishery progressed more set gillnet permit holders participated and on June 17 the purse seine fleet and the balance of the set gillnet fleet went fishing. The 1998 sockeye salmon harvest rates were low in both South Unimak and Shumagin Islands fisheries. Despite continuous fishing from June 13 through June 30, only 974,628 sockeye (63.7% of the allocation) and 195,454 chum salmon were harvested at South Unimak. A total of 314,097 sockeye salmon (93.5% of the allocation) and 50,165 chum salmon were harvested in Shumagin Islands (Appendix B1).
In 1999, the South Unimak fishery was opened for 16 hours on June 11, reopened on June 13, and was repeatedly extended until June 21 when the sockeye salmon GHL was reached. The Shumagin Islands fishery opened on June 13 and was repeatedly extended until June 18 when the GHL was reached (Shaul 2000). The 1999 sockeye salmon daily harvest rates were higher than in the past 3 years in both South Unimak and Shumagin Islands fisheries. After nearly continuous fishing from June 11 through June 21, 1,106,208 sockeye (8.0% over the allocation) and 186,886 chum salmon were harvested at South Unimak (Appendix B1). A total of 269,191 sockeye (19.1% over the allocation) and 58,420 chum salmon were harvested in the 1999 Shumagin Islands fishery.
-continued-
56
Appendix B2.–Page 7 of 9.
Based on the Bristol Bay forecast, the respective 2000 June GHLs were 1,650,000 and 363,000 sockeye salmon for South Unimak and Shumagin Islands fisheries (Poetter 2007). Test fishing results in the Shumagin Islands indicated that a fishing period could be allowed on June 11. However, no commercial fishing occurred during June 11 and June 12 because of a price dispute between fishermen and processors and test fishing continued (Shaul 2000). The South Unimak test fish sockeye to chum salmon ratio was less than the 2 to 1 needed to justify a fishery on June 11. After the announced Shumagin Islands opening for June 11, all 3 of the South Unimak test fish boats quit test fishing and departed for the Shumagin Islands commercial fishery. A price settlement was reached on June 13 and commercial fishing began. During June 13, sockeye to chum salmon ratios were high and both fisheries were repeatedly extended. The South Unimak fishery remained open through June 30. Shumagin Islands closed on June 18 when it was estimated that the sockeye salmon GHL would be reached. The 2000 South Unimak harvest was 892,016 sockeye salmon (54.1% of the GHL) and 168,888 chum salmon (Appendix B1). The Shumagin Islands harvest was 359,212 sockeye salmon (99.0% of the allocation) and 70,469 chum salmon. The combined South Unimak-Shumagin Islands chum salmon harvest in 2000 was 239,357 fish, well below the chum salmon GHL of 350,000 to 400,000 (Shaul 2000).
The fishing power of the fleet participating in the South Unimak and Shumagin Islands June fishery appeared to be substantially lower for all species during recent years (2005–2014) than it was during the 1980s due to the following factors:
1. The gear depth restrictions implemented in 1990.
2. Cape Lutke is no longer as productive an area for the purse seine and drift gillnet fleets, and the prices paid for salmon were low. The purse seine fleet is substantially smaller than the 1982–1996 fleet (Appendix A9).
3. Because of low salmon prices, the drift gillnet fleet decreased from 157 permit holders in 1991 to about 85 permit holders participating in 2006 (Appendix A9).
4. Salmon may have changed their migration routes and/or timing because of oceanographic or climatic factors, and may not be as abundant in areas where the June fisheries occur.
From 1990 through 2003, drift gillnet permit holders generally had higher sockeye to chum salmon ratios than seine permit holders in South Unimak. Prior to 1990, the seine fleet had higher ratios than the drift gillnet fleet.
There have been substantial shifts in the percentage of catches taken by various gear types over the years (Appendix B15–B18). The amount of set gillnet gear and percentages of the harvests taken by set gillnets have increased since the 1970s in both fisheries. Drift gillnet gear dominated the South Unimak catches during the 1970s. Purse seiners dominated the South Unimak harvests during most years between 1979 and 1994. Since 1995, drift gillnetters have again dominated the South Unimak fishery.
-continued-
57
Appendix B2.–Page 8 of 9.
At its 2001 board meeting, major changes were made to the South Unimak and Shumagin Islands June Salmon Management Plan (5 AAC 09.365). These changes included the following:
1. Elimination of the sockeye salmon guideline harvest levels;
2. Elimination of the chum salmon guideline harvest levels;
3. Limiting fishing time to no more than 16 hours per day by any gear group;
4. Limiting total fishing time by seine and drift gillnet gear to no more than 48 hours in a floating 7-day period with no more than two 16-hour periods on consecutive days in any 7-day period;
5. From June 10 through June 24 in the South Unimak and/or Shumagin Islands fisheries, set gillnet gear may fish on consecutive days for 16-hour periods as long as the set gillnet sockeye to chum salmon ratios in that fishery are equal to or greater than the recent 10-year average for that fishery. If the set gillnet sockeye to chum salmon ratio falls below the recent 10-year average in either fishery, that fishery will be closed for one period. From June 10 through June 24, daily fishing periods for set gillnet gear will be from 6:00 AM until 10:00 PM;
6. Purse seine and drift gillnet fishing periods through June 24 will occur at the same time in the South Unimak and Shumagin Islands fisheries; and
7. After June 24, in either the South Unimak or Shumagin Islands fishery, if the ratio of sockeye to chum salmon by all gear combined is less than 2.0 on any day, the next fishing period shall be of 6 hours duration for all gear in that fishery. If the sockeye to chum salmon ratio is 2.0 or greater, a 6-hour fishing period can be extended to a maximum of 16 hours. The South Unimak or Shumagin Islands fishery shall close for all gear groups if the ratio of sockeye to chum salmon is less than 2.0 for 2 consecutive fishing periods.
During its 2004 board meeting, the board agreed that actions restricting the June fishery taken during the 2001 board cycle were unnecessary and caused undue hardship on the fishermen of the Area M. Changes to the South Unimak and Shumagin Islands June Salmon Management Plan (5 AAC 09.365) were adopted. These changes included the following:
1. Fishery to begin at 6:00 AM on June 7;
2. Fishing periods are 88 hours in length separated by 32-hour closures. The fishery closes at 10:00 PM. on June 29. The last fishing period is 64 hours in duration;
3. Concurrent fishing time for all gear types;
4. Area open to fishing expanded to include the entire Unimak and Southwestern districts, East and West Pavlof Bay, and Bechevin Bay and Shumagin Islands sections; and
5. Eliminated all sockeye to chum salmon harvest ratio requirements.
-continued-
58
Appendix B2.–Page 9 of 9.
In February 2007, the board made modifications to the June Fishery Management Plan including:
1. Changing the description of the Sanak Island Section;
2. Expanding the use of drift gillnets to the following portion of the Southwestern District; south and east of a line from Cape Pankof Light (54°39.60′ N lat, 163°03.70′ W long) to Thin Point (54°57.32′ N lat, 162°33.50′ W long); south of a line from Thin Point (54°57.32′ N lat, 162°33.50′ W long) to the northernmost tip of Stag Point (54°59.10′ N lat, 162°18.10′ W long) on Deer Island to the southernmost tip of Dolgoi Cape (55°03.15′ N lat, 161°44.35′ W long) on Dolgoi Island and south of the latitude of the northeastern tip of Dolgoi Island (55°07.50′ N lat, 161°38.30′ W long) (Appendix B1);
3. Allowing the use of salmon net pens; and
4. Allowing 2 Commercial Fisheries Entry Commission (CFEC) set gillnet permit holders aboard a registered set gillnet fishing vessel, to tow a second registered CFEC set gillnet vessel that has a second aggregate of set gillnet gear onboard.
In February 2013, the board made changes to the June fishing schedule. The fishing schedule for set gillnet gear did not change (beginning 6:00 AM June 7; four 88-hour fishing periods interspersed with 32-hour closures with a final 64-hour fishing period that closes at 10:00 PM on June 29). The June schedule for seine and drift gillnet gear was reduced by 64 hours with the initial opening delayed until June 10 (beginning 6:00 AM June 10; four 88-hour fishing periods interspersed with 32-hour closures).
59
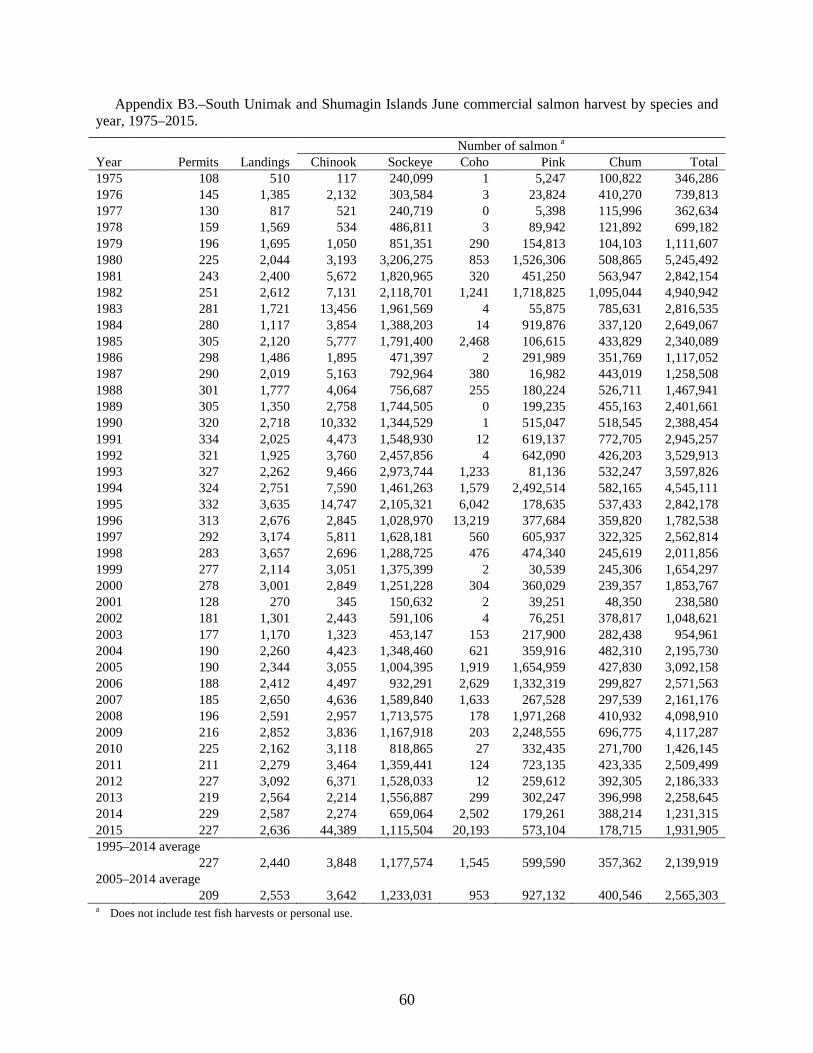
Appendix B3.–South Unimak and Shumagin Islands June commercial salmon harvest by species and year, 1975–2015.
Number of salmon a Year Permits Landings Chinook Sockeye Coho Pink Chum Total 1975
108 510 117 240,099 1 5,247 100,822 346,286
1976
145 1,385 2,132 303,584 3 23,824 410,270 739,813 1977
130 817 521 240,719 0 5,398 115,996 362,634
1978
159 1,569 534 486,811 3 89,942 121,892 699,182 1979
196 1,695 1,050 851,351 290 154,813 104,103 1,111,607
1980
225 2,044 3,193 3,206,275 853 1,526,306 508,865 5,245,492 1981
243 2,400 5,672 1,820,965 320 451,250 563,947 2,842,154
1982
251 2,612 7,131 2,118,701 1,241 1,718,825 1,095,044 4,940,942 1983
281 1,721 13,456 1,961,569 4 55,875 785,631 2,816,535
1984
280 1,117 3,854 1,388,203 14 919,876 337,120 2,649,067 1985
305 2,120 5,777 1,791,400 2,468 106,615 433,829 2,340,089
1986
298 1,486 1,895 471,397 2 291,989 351,769 1,117,052 1987
290 2,019 5,163 792,964 380 16,982 443,019 1,258,508
1988
301 1,777 4,064 756,687 255 180,224 526,711 1,467,941 1989
305 1,350 2,758 1,744,505 0 199,235 455,163 2,401,661
1990
320 2,718 10,332 1,344,529 1 515,047 518,545 2,388,454 1991
334 2,025 4,473 1,548,930 12 619,137 772,705 2,945,257
1992
321 1,925 3,760 2,457,856 4 642,090 426,203 3,529,913 1993
327 2,262 9,466 2,973,744 1,233 81,136 532,247 3,597,826
1994
324 2,751 7,590 1,461,263 1,579 2,492,514 582,165 4,545,111 1995
332 3,635 14,747 2,105,321 6,042 178,635 537,433 2,842,178
1996
313 2,676 2,845 1,028,970 13,219 377,684 359,820 1,782,538 1997
292 3,174 5,811 1,628,181 560 605,937 322,325 2,562,814
1998
283 3,657 2,696 1,288,725 476 474,340 245,619 2,011,856 1999
277 2,114 3,051 1,375,399 2 30,539 245,306 1,654,297
2000
278 3,001 2,849 1,251,228 304 360,029 239,357 1,853,767 2001
128 270 345 150,632 2 39,251 48,350 238,580
2002
181 1,301 2,443 591,106 4 76,251 378,817 1,048,621 2003
177 1,170 1,323 453,147 153 217,900 282,438 954,961
2004
190 2,260 4,423 1,348,460 621 359,916 482,310 2,195,730 2005
190 2,344 3,055 1,004,395 1,919 1,654,959 427,830 3,092,158
2006
188 2,412 4,497 932,291 2,629 1,332,319 299,827 2,571,563 2007
185 2,650 4,636 1,589,840 1,633 267,528 297,539 2,161,176
2008
196 2,591 2,957 1,713,575 178 1,971,268 410,932 4,098,910 2009
216 2,852 3,836 1,167,918 203 2,248,555 696,775 4,117,287
2010
225 2,162 3,118 818,865 27 332,435 271,700 1,426,145 2011
211 2,279 3,464 1,359,441 124 723,135 423,335 2,509,499
2012
227 3,092 6,371 1,528,033 12 259,612 392,305 2,186,333 2013
219 2,564 2,214 1,556,887 299 302,247 396,998 2,258,645
2014
229 2,587 2,274 659,064 2,502 179,261 388,214 1,231,315 2015 227 2,636 44,389 1,115,504 20,193 573,104 178,715 1,931,905 1995–2014 average
227 2,440 3,848 1,177,574 1,545 599,590 357,362 2,139,919 2005–2014 average
209 2,553 3,642 1,233,031 953 927,132 400,546 2,565,303 a Does not include test fish harvests or personal use.
60
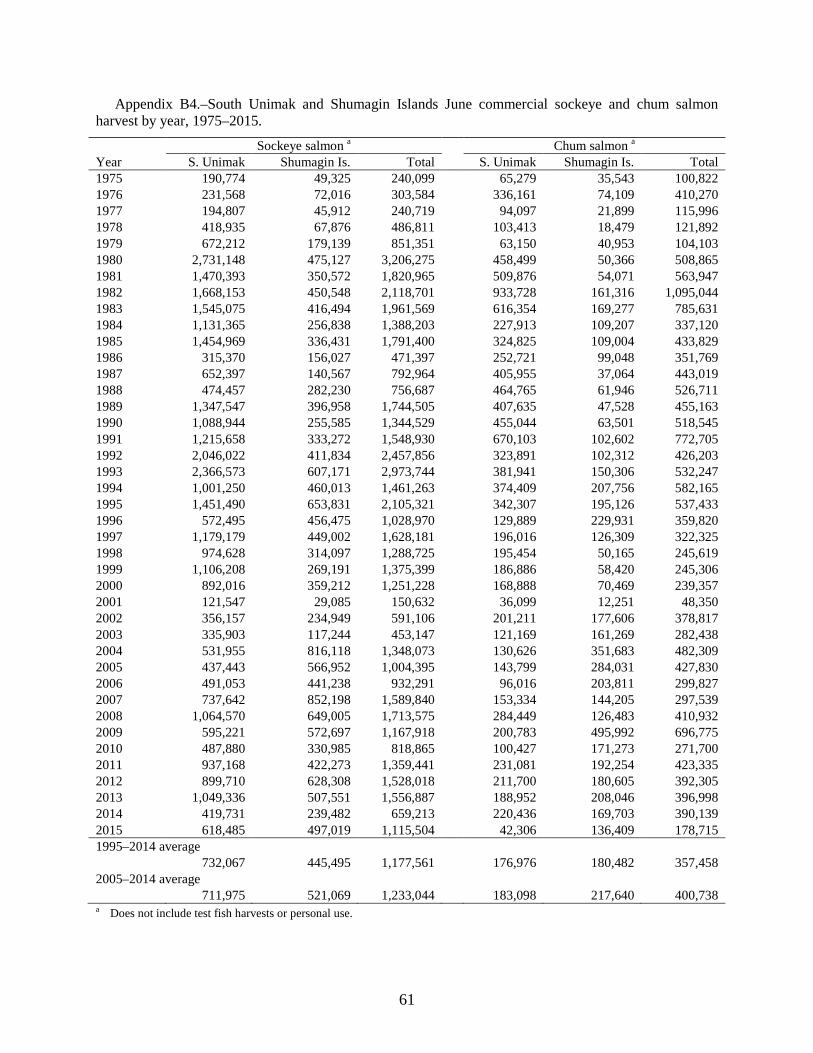
Appendix B4.–South Unimak and Shumagin Islands June commercial sockeye and chum salmon harvest by year, 1975–2015.
Sockeye salmon a Chum salmon a Year S. Unimak Shumagin Is. Total S. Unimak Shumagin Is. Total 1975 190,774 49,325 240,099
65,279 35,543 100,822
1976 231,568 72,016 303,584
336,161 74,109 410,270 1977 194,807 45,912 240,719
94,097 21,899 115,996
1978 418,935 67,876 486,811
103,413 18,479 121,892 1979 672,212 179,139 851,351
63,150 40,953 104,103
1980 2,731,148 475,127 3,206,275
458,499 50,366 508,865 1981 1,470,393 350,572 1,820,965
509,876 54,071 563,947
1982 1,668,153 450,548 2,118,701
933,728 161,316 1,095,044 1983 1,545,075 416,494 1,961,569
616,354 169,277 785,631
1984 1,131,365 256,838 1,388,203
227,913 109,207 337,120 1985 1,454,969 336,431 1,791,400
324,825 109,004 433,829
1986 315,370 156,027 471,397
252,721 99,048 351,769 1987 652,397 140,567 792,964
405,955 37,064 443,019
1988 474,457 282,230 756,687
464,765 61,946 526,711 1989 1,347,547 396,958 1,744,505
407,635 47,528 455,163
1990 1,088,944 255,585 1,344,529
455,044 63,501 518,545 1991 1,215,658 333,272 1,548,930
670,103 102,602 772,705
1992 2,046,022 411,834 2,457,856
323,891 102,312 426,203 1993 2,366,573 607,171 2,973,744
381,941 150,306 532,247
1994 1,001,250 460,013 1,461,263
374,409 207,756 582,165 1995 1,451,490 653,831 2,105,321
342,307 195,126 537,433
1996 572,495 456,475 1,028,970
129,889 229,931 359,820 1997 1,179,179 449,002 1,628,181
196,016 126,309 322,325
1998 974,628 314,097 1,288,725
195,454 50,165 245,619 1999 1,106,208 269,191 1,375,399
186,886 58,420 245,306
2000 892,016 359,212 1,251,228
168,888 70,469 239,357 2001 121,547 29,085 150,632
36,099 12,251 48,350
2002 356,157 234,949 591,106
201,211 177,606 378,817 2003 335,903 117,244 453,147
121,169 161,269 282,438
2004 531,955 816,118 1,348,073
130,626 351,683 482,309 2005 437,443 566,952 1,004,395
143,799 284,031 427,830
2006 491,053 441,238 932,291
96,016 203,811 299,827 2007 737,642 852,198 1,589,840
153,334 144,205 297,539
2008 1,064,570 649,005 1,713,575
284,449 126,483 410,932 2009 595,221 572,697 1,167,918
200,783 495,992 696,775
2010 487,880 330,985 818,865
100,427 171,273 271,700 2011 937,168 422,273 1,359,441
231,081 192,254 423,335
2012 899,710 628,308 1,528,018
211,700 180,605 392,305 2013 1,049,336 507,551 1,556,887
188,952 208,046 396,998
2014 419,731 239,482 659,213
220,436 169,703 390,139 2015 618,485 497,019 1,115,504 42,306 136,409 178,715 1995–2014 average
732,067 445,495 1,177,561
176,976 180,482 357,458 2005–2014 average
711,975 521,069 1,233,044 183,098 217,640 400,738 a Does not include test fish harvests or personal use.
61
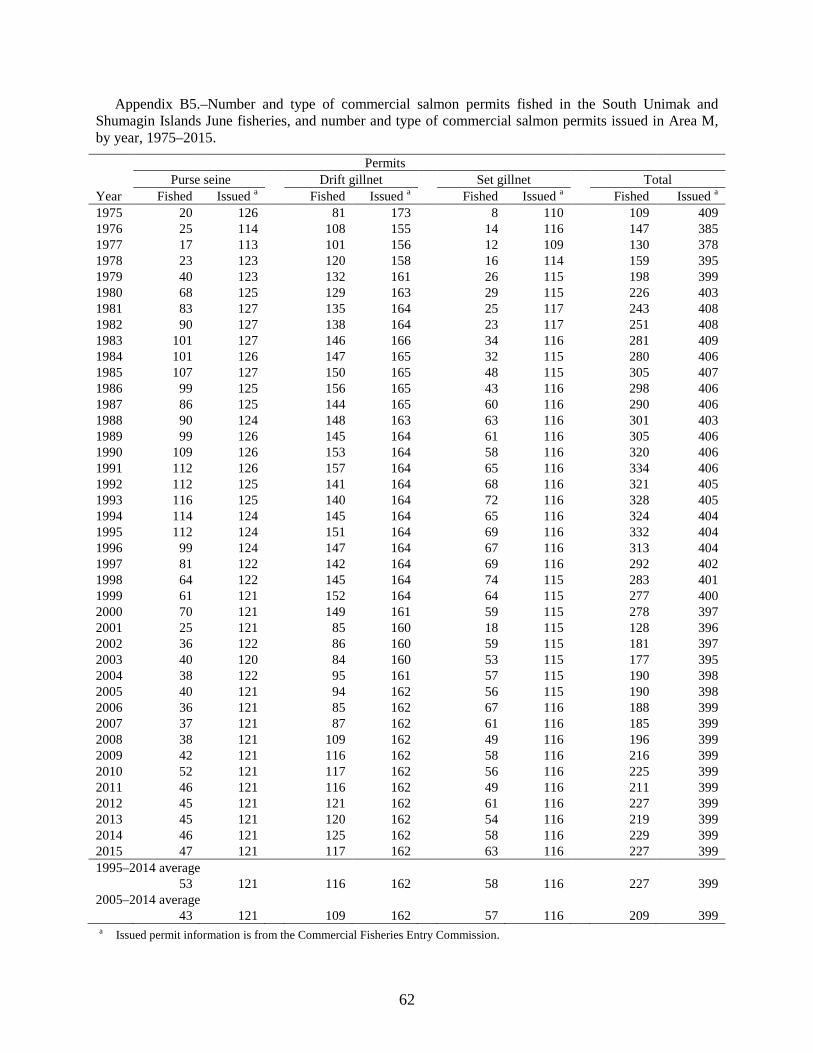
Appendix B5.–Number and type of commercial salmon permits fished in the South Unimak and Shumagin Islands June fisheries, and number and type of commercial salmon permits issued in Area M, by year, 1975–2015.
Permits
Purse seine
Drift gillnet
Set gillnet
Total
Year Fished Issued a Fished Issued a Fished Issued a Fished Issued a 1975 20 126
81 173
8 110
109 409
1976 25 114
108 155
14 116
147 385 1977 17 113
101 156
12 109
130 378
1978 23 123
120 158
16 114
159 395 1979 40 123
132 161
26 115
198 399
1980 68 125
129 163
29 115
226 403 1981 83 127
135 164
25 117
243 408
1982 90 127
138 164
23 117
251 408 1983 101 127
146 166
34 116
281 409
1984 101 126
147 165
32 115
280 406 1985 107 127
150 165
48 115
305 407
1986 99 125
156 165
43 116
298 406 1987 86 125
144 165
60 116
290 406
1988 90 124
148 163
63 116
301 403 1989 99 126
145 164
61 116
305 406
1990 109 126
153 164
58 116
320 406 1991 112 126
157 164
65 116
334 406
1992 112 125
141 164
68 116
321 405 1993 116 125
140 164
72 116
328 405
1994 114 124
145 164
65 116
324 404 1995 112 124
151 164
69 116
332 404
1996 99 124
147 164
67 116
313 404 1997 81 122
142 164
69 116
292 402
1998 64 122
145 164
74 115
283 401 1999 61 121
152 164
64 115
277 400
2000 70 121
149 161
59 115
278 397 2001 25 121
85 160
18 115
128 396
2002 36 122
86 160
59 115
181 397 2003 40 120
84 160
53 115
177 395
2004 38 122
95 161
57 115
190 398 2005 40 121
94 162
56 115
190 398
2006 36 121
85 162
67 116
188 399 2007 37 121
87 162
61 116
185 399
2008 38 121
109 162
49 116
196 399 2009 42 121
116 162
58 116
216 399
2010 52 121
117 162
56 116
225 399 2011 46 121
116 162
49 116
211 399
2012 45 121
121 162
61 116
227 399 2013 45 121
120 162
54 116
219 399
2014 46 121
125 162
58 116
229 399 2015 47 121 117 162 63 116 227 399 1995–2014 average
53 121
116 162
58 116
227 399 2005–2014 average
43 121 109 162 57 116 209 399 a Issued permit information is from the Commercial Fisheries Entry Commission.
62
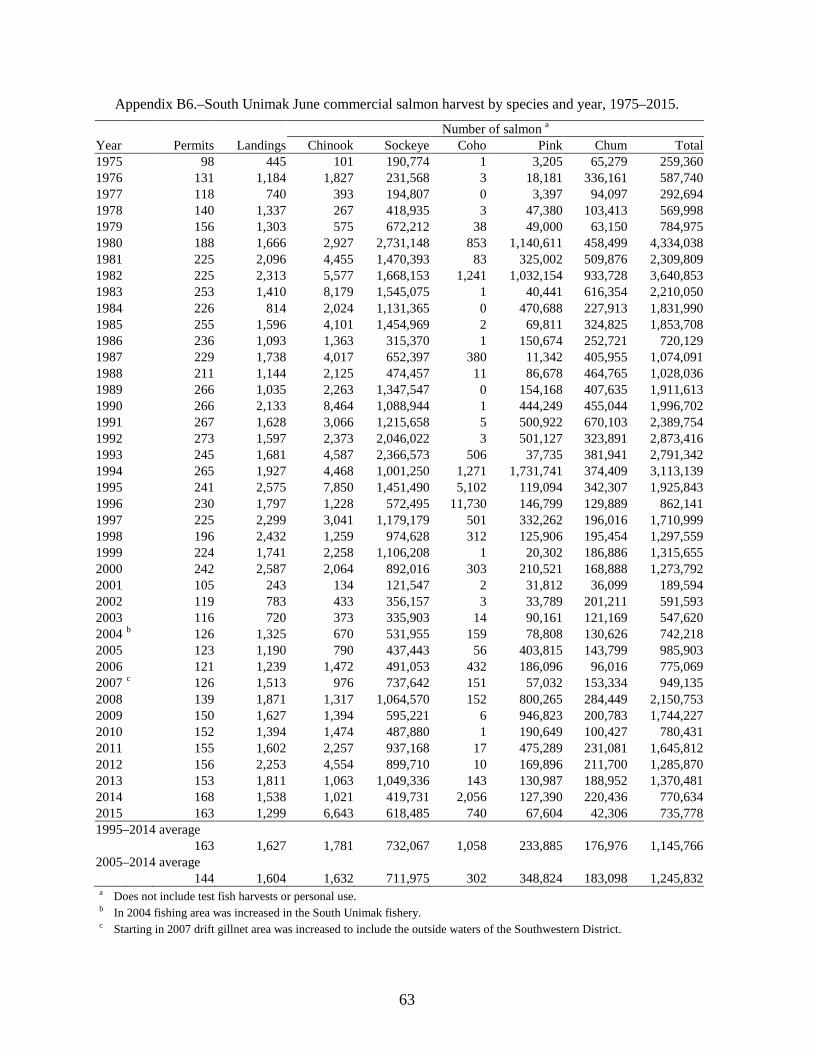
Appendix B6.–South Unimak June commercial salmon harvest by species and year, 1975–2015.
Number of salmon a Year Permits Landings Chinook Sockeye Coho Pink Chum Total 1975
98 445 101 190,774 1 3,205 65,279 259,360
1976
131 1,184 1,827 231,568 3 18,181 336,161 587,740 1977
118 740 393 194,807 0 3,397 94,097 292,694
1978
140 1,337 267 418,935 3 47,380 103,413 569,998 1979
156 1,303 575 672,212 38 49,000 63,150 784,975
1980
188 1,666 2,927 2,731,148 853 1,140,611 458,499 4,334,038 1981
225 2,096 4,455 1,470,393 83 325,002 509,876 2,309,809
1982
225 2,313 5,577 1,668,153 1,241 1,032,154 933,728 3,640,853 1983
253 1,410 8,179 1,545,075 1 40,441 616,354 2,210,050
1984
226 814 2,024 1,131,365 0 470,688 227,913 1,831,990 1985
255 1,596 4,101 1,454,969 2 69,811 324,825 1,853,708
1986
236 1,093 1,363 315,370 1 150,674 252,721 720,129 1987
229 1,738 4,017 652,397 380 11,342 405,955 1,074,091
1988
211 1,144 2,125 474,457 11 86,678 464,765 1,028,036 1989
266 1,035 2,263 1,347,547 0 154,168 407,635 1,911,613
1990
266 2,133 8,464 1,088,944 1 444,249 455,044 1,996,702 1991
267 1,628 3,066 1,215,658 5 500,922 670,103 2,389,754
1992
273 1,597 2,373 2,046,022 3 501,127 323,891 2,873,416 1993
245 1,681 4,587 2,366,573 506 37,735 381,941 2,791,342
1994
265 1,927 4,468 1,001,250 1,271 1,731,741 374,409 3,113,139 1995
241 2,575 7,850 1,451,490 5,102 119,094 342,307 1,925,843
1996
230 1,797 1,228 572,495 11,730 146,799 129,889 862,141 1997
225 2,299 3,041 1,179,179 501 332,262 196,016 1,710,999
1998
196 2,432 1,259 974,628 312 125,906 195,454 1,297,559 1999
224 1,741 2,258 1,106,208 1 20,302 186,886 1,315,655
2000
242 2,587 2,064 892,016 303 210,521 168,888 1,273,792 2001
105 243 134 121,547 2 31,812 36,099 189,594
2002
119 783 433 356,157 3 33,789 201,211 591,593 2003
116 720 373 335,903 14 90,161 121,169 547,620
2004 b 126 1,325 670 531,955 159 78,808 130,626 742,218 2005
123 1,190 790 437,443 56 403,815 143,799 985,903
2006
121 1,239 1,472 491,053 432 186,096 96,016 775,069 2007 c 126 1,513 976 737,642 151 57,032 153,334 949,135 2008
139 1,871 1,317 1,064,570 152 800,265 284,449 2,150,753
2009
150 1,627 1,394 595,221 6 946,823 200,783 1,744,227 2010
152 1,394 1,474 487,880 1 190,649 100,427 780,431
2011
155 1,602 2,257 937,168 17 475,289 231,081 1,645,812 2012
156 2,253 4,554 899,710 10 169,896 211,700 1,285,870
2013
153 1,811 1,063 1,049,336 143 130,987 188,952 1,370,481 2014
168 1,538 1,021 419,731 2,056 127,390 220,436 770,634
2015 163 1,299 6,643 618,485 740 67,604 42,306 735,778 1995–2014 average
163 1,627 1,781 732,067 1,058 233,885 176,976 1,145,766 2005–2014 average
144 1,604 1,632 711,975 302 348,824 183,098 1,245,832 a Does not include test fish harvests or personal use. b In 2004 fishing area was increased in the South Unimak fishery. c Starting in 2007 drift gillnet area was increased to include the outside waters of the Southwestern District.
63
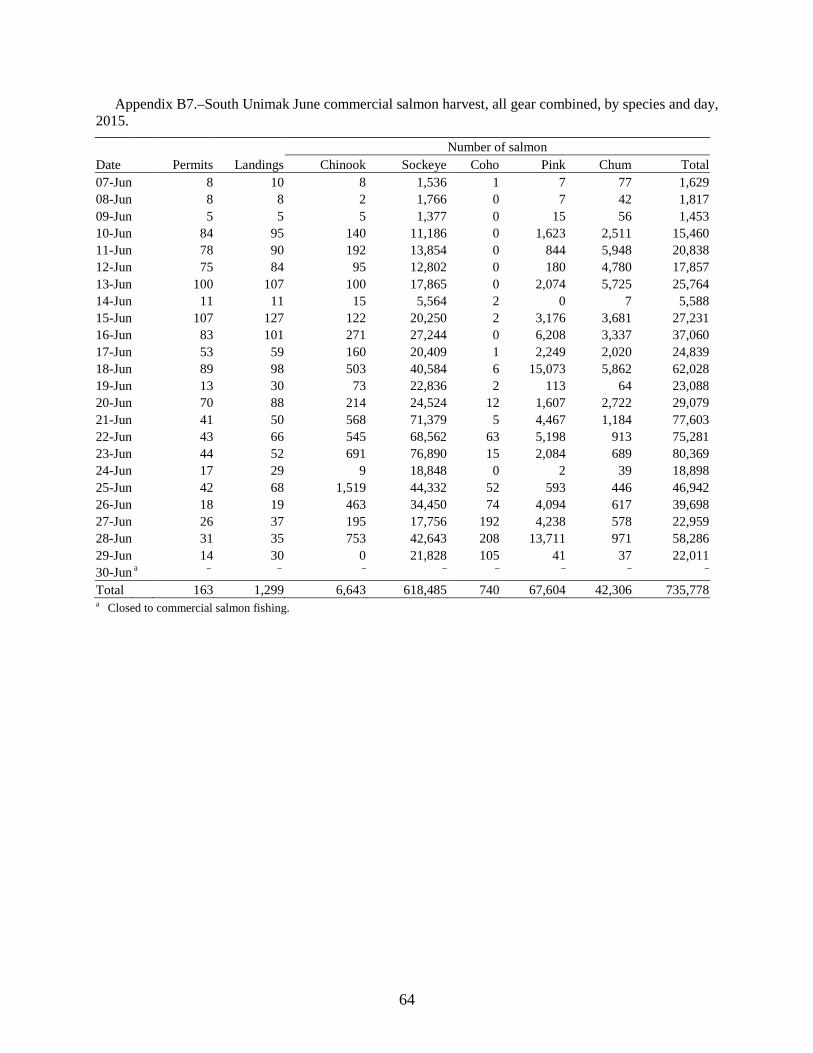
Appendix B7.–South Unimak June commercial salmon harvest, all gear combined, by species and day, 2015.
Number of salmon Date Permits Landings Chinook Sockeye Coho Pink Chum Total 07-Jun
8 10 8 1,536 1 7 77 1,629
08-Jun
8 8 2 1,766 0 7 42 1,817 09-Jun
5 5 5 1,377 0 15 56 1,453
10-Jun
84 95 140 11,186 0 1,623 2,511 15,460 11-Jun
78 90 192 13,854 0 844 5,948 20,838
12-Jun
75 84 95 12,802 0 180 4,780 17,857 13-Jun
100 107 100 17,865 0 2,074 5,725 25,764
14-Jun
11 11 15 5,564 2 0 7 5,588 15-Jun
107 127 122 20,250 2 3,176 3,681 27,231
16-Jun
83 101 271 27,244 0 6,208 3,337 37,060 17-Jun
53 59 160 20,409 1 2,249 2,020 24,839
18-Jun
89 98 503 40,584 6 15,073 5,862 62,028 19-Jun
13 30 73 22,836 2 113 64 23,088
20-Jun
70 88 214 24,524 12 1,607 2,722 29,079 21-Jun
41 50 568 71,379 5 4,467 1,184 77,603
22-Jun
43 66 545 68,562 63 5,198 913 75,281 23-Jun
44 52 691 76,890 15 2,084 689 80,369
24-Jun
17 29 9 18,848 0 2 39 18,898 25-Jun
42 68 1,519 44,332 52 593 446 46,942
26-Jun
18 19 463 34,450 74 4,094 617 39,698 27-Jun
26 37 195 17,756 192 4,238 578 22,959
28-Jun
31 35 753 42,643 208 13,711 971 58,286 29-Jun
14 30 0 21,828 105 41 37 22,011
30-Jun a – – – – – – – – Total 163 1,299 6,643 618,485 740 67,604 42,306 735,778 a Closed to commercial salmon fishing.
64
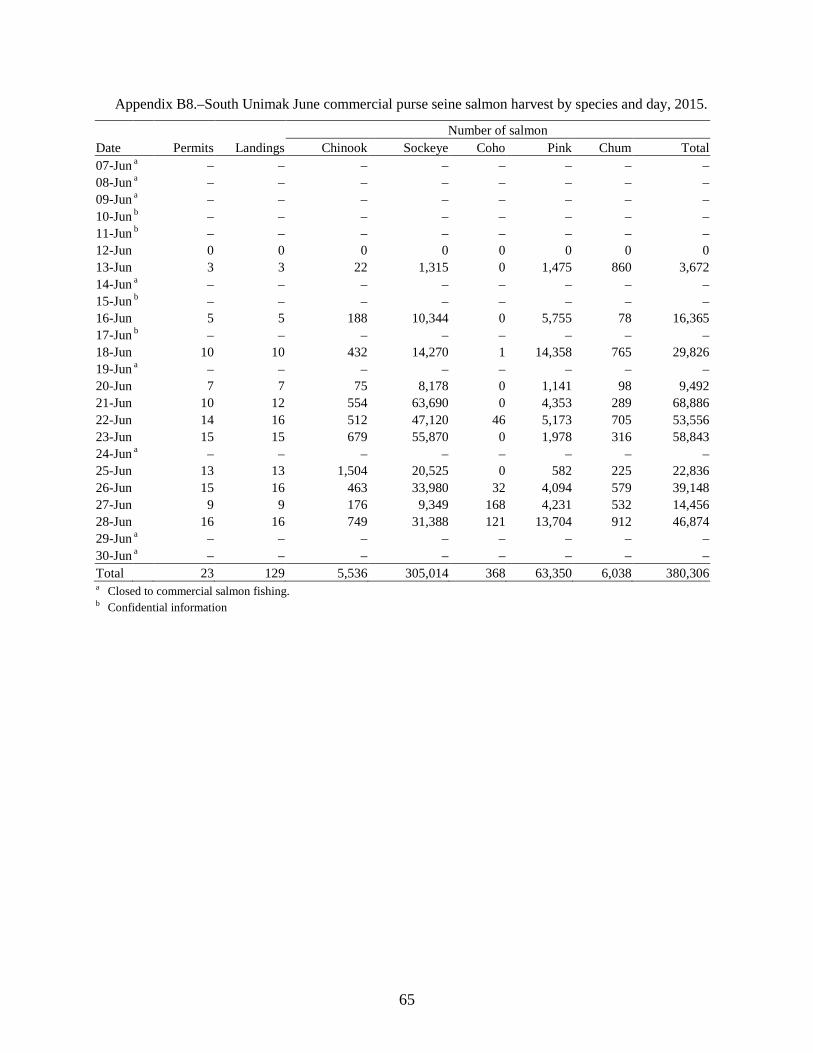
Appendix B8.–South Unimak June commercial purse seine salmon harvest by species and day, 2015.
Number of salmon Date Permits Landings Chinook Sockeye Coho Pink Chum Total 07-Jun a – – – – – – – – 08-Jun a – – – – – – – – 09-Jun a – – – – – – – – 10-Jun b – – – – – – – – 11-Jun b – – – – – – – – 12-Jun
0 0 0 0 0 0 0 0
13-Jun
3 3 22 1,315 0 1,475 860 3,672 14-Jun a – – – – – – – – 15-Jun b – – – – – – – – 16-Jun
5 5 188 10,344 0 5,755 78 16,365
17-Jun b – – – – – – – – 18-Jun
10 10 432 14,270 1 14,358 765 29,826
19-Jun a – – – – – – – – 20-Jun
7 7 75 8,178 0 1,141 98 9,492
21-Jun
10 12 554 63,690 0 4,353 289 68,886 22-Jun
14 16 512 47,120 46 5,173 705 53,556
23-Jun
15 15 679 55,870 0 1,978 316 58,843 24-Jun a – – – – – – – – 25-Jun
13 13 1,504 20,525 0 582 225 22,836
26-Jun
15 16 463 33,980 32 4,094 579 39,148 27-Jun
9 9 176 9,349 168 4,231 532 14,456
28-Jun
16 16 749 31,388 121 13,704 912 46,874 29-Jun a – – – – – – – – 30-Jun a – – – – – – – – Total 23 129 5,536 305,014 368 63,350 6,038 380,306 a Closed to commercial salmon fishing. b Confidential information
65
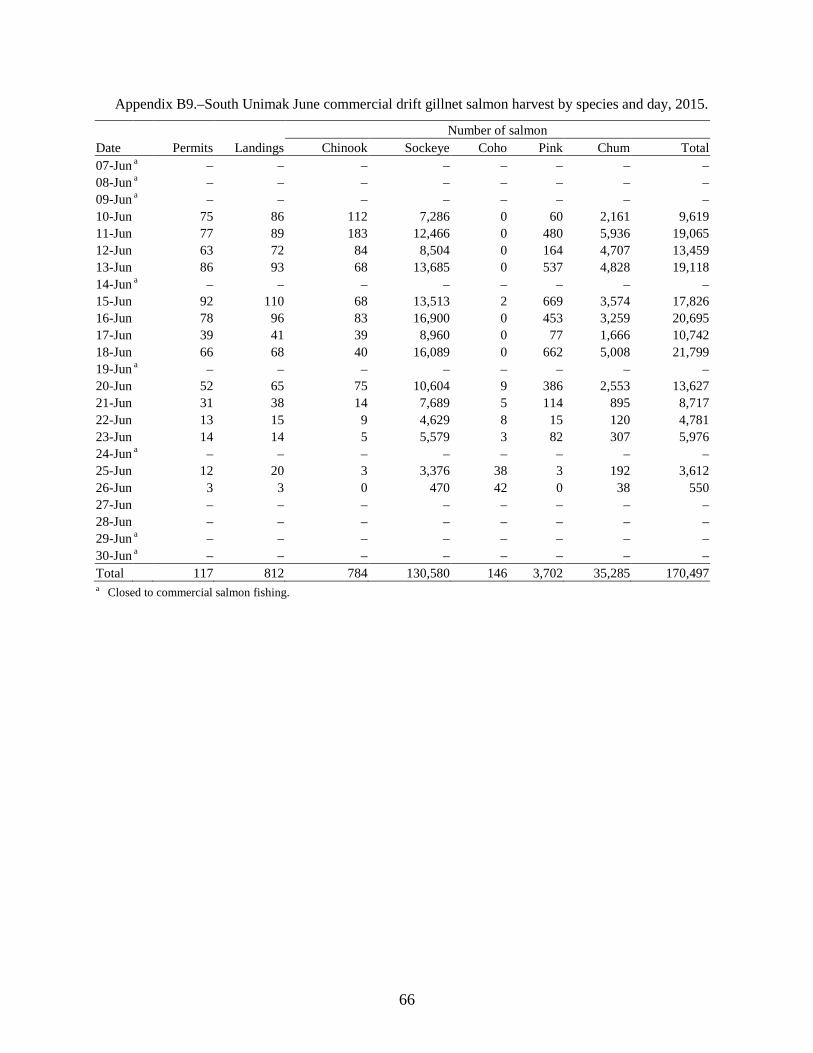
Appendix B9.–South Unimak June commercial drift gillnet salmon harvest by species and day, 2015.
Number of salmon Date Permits Landings Chinook Sockeye Coho Pink Chum Total 07-Jun a – – – – – – – – 08-Jun a – – – – – – – – 09-Jun a – – – – – – – – 10-Jun
75 86 112 7,286 0 60 2,161 9,619
11-Jun
77 89 183 12,466 0 480 5,936 19,065 12-Jun
63 72 84 8,504 0 164 4,707 13,459
13-Jun
86 93 68 13,685 0 537 4,828 19,118 14-Jun a – – – – – – – – 15-Jun
92 110 68 13,513 2 669 3,574 17,826
16-Jun
78 96 83 16,900 0 453 3,259 20,695 17-Jun
39 41 39 8,960 0 77 1,666 10,742
18-Jun
66 68 40 16,089 0 662 5,008 21,799 19-Jun a – – – – – – – – 20-Jun
52 65 75 10,604 9 386 2,553 13,627
21-Jun
31 38 14 7,689 5 114 895 8,717 22-Jun
13 15 9 4,629 8 15 120 4,781
23-Jun
14 14 5 5,579 3 82 307 5,976 24-Jun a – – – – – – – – 25-Jun
12 20 3 3,376 38 3 192 3,612
26-Jun
3 3 0 470 42 0 38 550 27-Jun
– – – – – – – –
28-Jun
– – – – – – – – 29-Jun a – – – – – – – – 30-Jun a – – – – – – – – Total 117 812 784 130,580 146 3,702 35,285 170,497 a Closed to commercial salmon fishing.
66
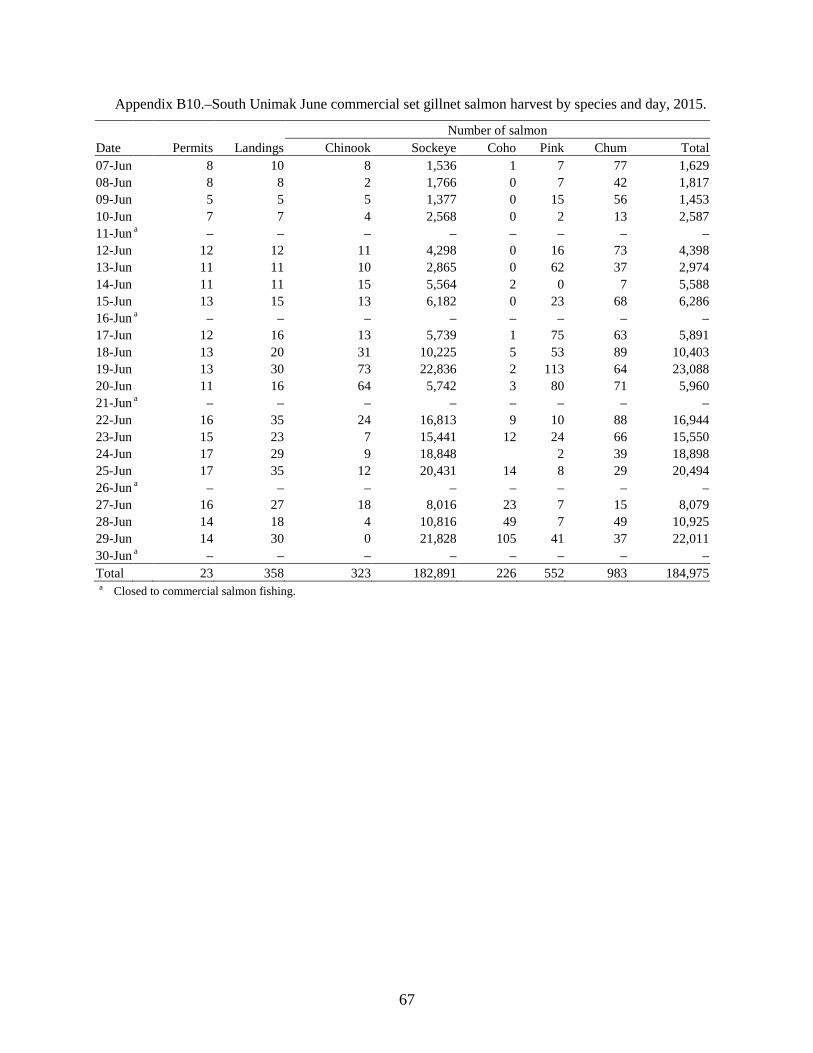
Appendix B10.–South Unimak June commercial set gillnet salmon harvest by species and day, 2015.
Number of salmon Date Permits Landings Chinook Sockeye Coho Pink Chum Total 07-Jun
8 10 8 1,536 1 7 77 1,629
08-Jun
8 8 2 1,766 0 7 42 1,817 09-Jun
5 5 5 1,377 0 15 56 1,453
10-Jun
7 7 4 2,568 0 2 13 2,587 11-Jun a – – – – – – – – 12-Jun
12 12 11 4,298 0 16 73 4,398
13-Jun
11 11 10 2,865 0 62 37 2,974 14-Jun
11 11 15 5,564 2 0 7 5,588
15-Jun
13 15 13 6,182 0 23 68 6,286 16-Jun a – – – – – – – – 17-Jun
12 16 13 5,739 1 75 63 5,891
18-Jun
13 20 31 10,225 5 53 89 10,403 19-Jun
13 30 73 22,836 2 113 64 23,088
20-Jun
11 16 64 5,742 3 80 71 5,960 21-Jun a – – – – – – – – 22-Jun
16 35 24 16,813 9 10 88 16,944
23-Jun
15 23 7 15,441 12 24 66 15,550 24-Jun
17 29 9 18,848
2 39 18,898
25-Jun
17 35 12 20,431 14 8 29 20,494 26-Jun a – – – – – – – – 27-Jun
16 27 18 8,016 23 7 15 8,079
28-Jun
14 18 4 10,816 49 7 49 10,925 29-Jun
14 30 0 21,828 105 41 37 22,011
30-Jun a – – – – – – – – Total 23 358 323 182,891 226 552 983 184,975 a Closed to commercial salmon fishing.
67
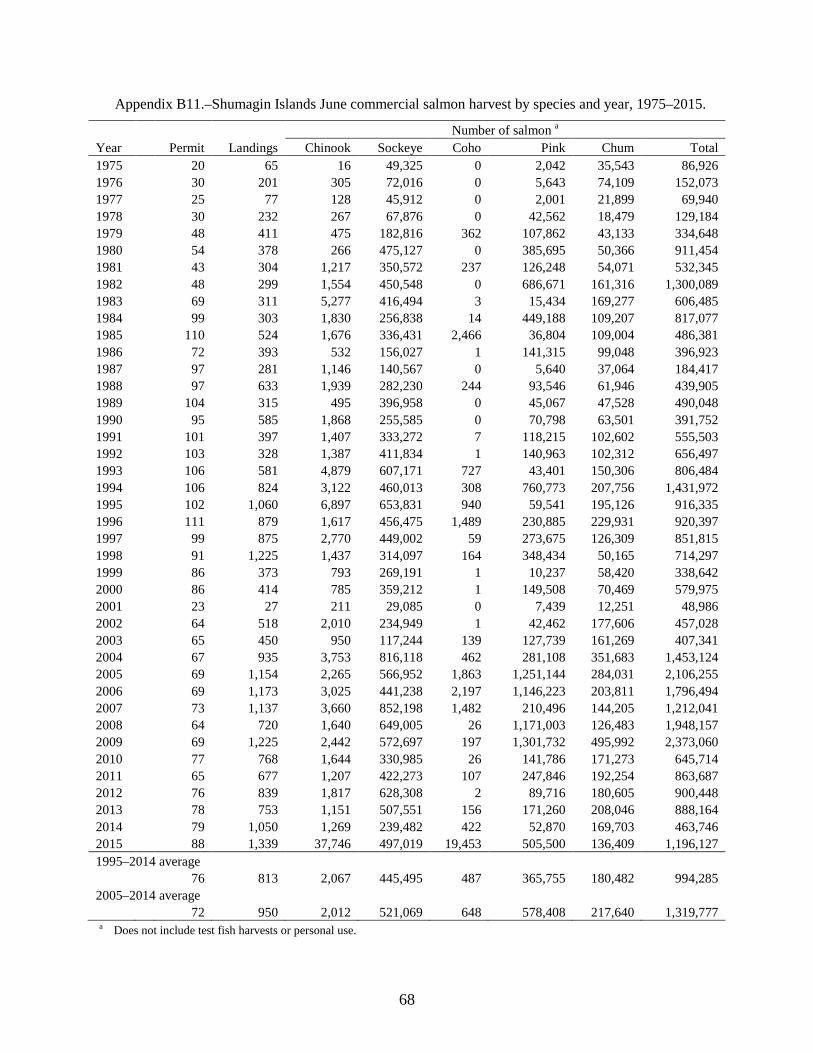
Appendix B11.–Shumagin Islands June commercial salmon harvest by species and year, 1975–2015.
Number of salmon a Year Permit Landings Chinook Sockeye Coho Pink Chum Total 1975
20 65 16 49,325 0 2,042 35,543 86,926
1976
30 201 305 72,016 0 5,643 74,109 152,073 1977
25 77 128 45,912 0 2,001 21,899 69,940
1978
30 232 267 67,876 0 42,562 18,479 129,184 1979
48 411 475 182,816 362 107,862 43,133 334,648
1980
54 378 266 475,127 0 385,695 50,366 911,454 1981
43 304 1,217 350,572 237 126,248 54,071 532,345
1982
48 299 1,554 450,548 0 686,671 161,316 1,300,089 1983
69 311 5,277 416,494 3 15,434 169,277 606,485
1984
99 303 1,830 256,838 14 449,188 109,207 817,077 1985
110 524 1,676 336,431 2,466 36,804 109,004 486,381
1986
72 393 532 156,027 1 141,315 99,048 396,923 1987
97 281 1,146 140,567 0 5,640 37,064 184,417
1988
97 633 1,939 282,230 244 93,546 61,946 439,905 1989
104 315 495 396,958 0 45,067 47,528 490,048
1990
95 585 1,868 255,585 0 70,798 63,501 391,752 1991
101 397 1,407 333,272 7 118,215 102,602 555,503
1992
103 328 1,387 411,834 1 140,963 102,312 656,497 1993
106 581 4,879 607,171 727 43,401 150,306 806,484
1994
106 824 3,122 460,013 308 760,773 207,756 1,431,972 1995
102 1,060 6,897 653,831 940 59,541 195,126 916,335
1996
111 879 1,617 456,475 1,489 230,885 229,931 920,397 1997
99 875 2,770 449,002 59 273,675 126,309 851,815
1998
91 1,225 1,437 314,097 164 348,434 50,165 714,297 1999
86 373 793 269,191 1 10,237 58,420 338,642
2000
86 414 785 359,212 1 149,508 70,469 579,975 2001
23 27 211 29,085 0 7,439 12,251 48,986
2002
64 518 2,010 234,949 1 42,462 177,606 457,028 2003
65 450 950 117,244 139 127,739 161,269 407,341
2004
67 935 3,753 816,118 462 281,108 351,683 1,453,124 2005
69 1,154 2,265 566,952 1,863 1,251,144 284,031 2,106,255
2006
69 1,173 3,025 441,238 2,197 1,146,223 203,811 1,796,494 2007
73 1,137 3,660 852,198 1,482 210,496 144,205 1,212,041
2008
64 720 1,640 649,005 26 1,171,003 126,483 1,948,157 2009
69 1,225 2,442 572,697 197 1,301,732 495,992 2,373,060
2010
77 768 1,644 330,985 26 141,786 171,273 645,714 2011
65 677 1,207 422,273 107 247,846 192,254 863,687
2012
76 839 1,817 628,308 2 89,716 180,605 900,448 2013
78 753 1,151 507,551 156 171,260 208,046 888,164
2014
79 1,050 1,269 239,482 422 52,870 169,703 463,746 2015 88 1,339 37,746 497,019 19,453 505,500 136,409 1,196,127 1995–2014 average
76 813 2,067 445,495 487 365,755 180,482 994,285 2005–2014 average
72 950 2,012 521,069 648 578,408 217,640 1,319,777 a Does not include test fish harvests or personal use.
68
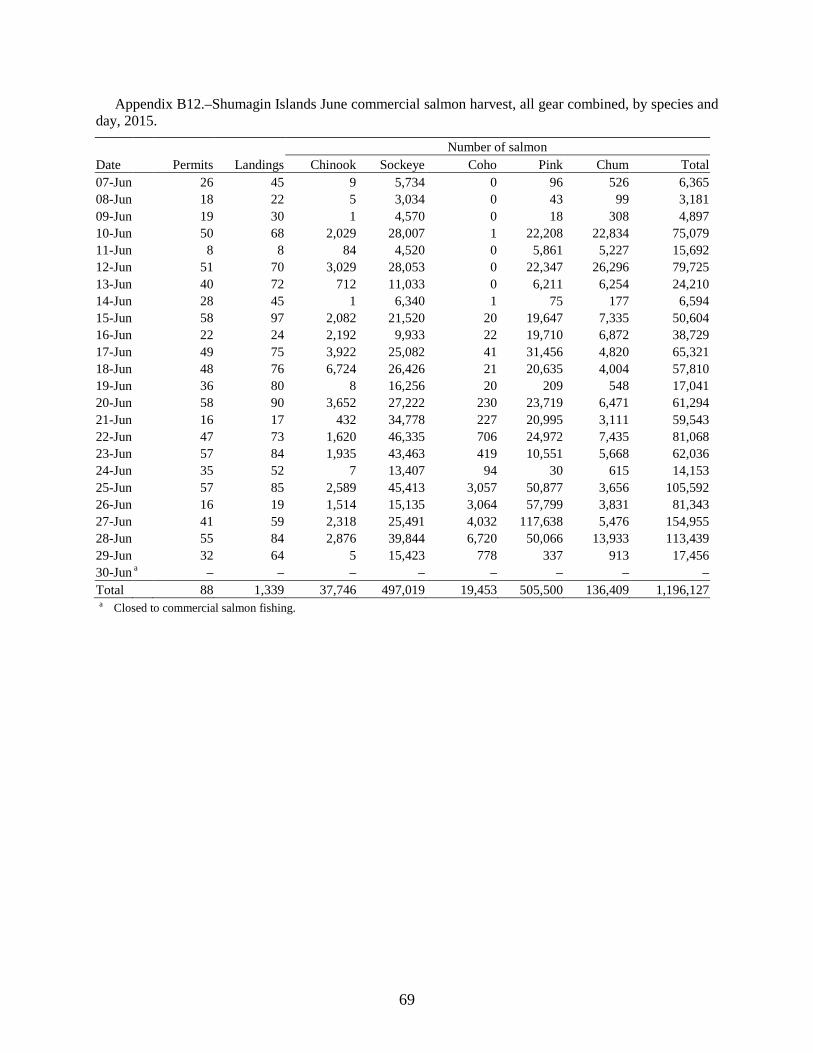
Appendix B12.–Shumagin Islands June commercial salmon harvest, all gear combined, by species and day, 2015.
Number of salmon Date Permits Landings Chinook Sockeye Coho Pink Chum Total 07-Jun
26 45 9 5,734 0 96 526 6,365
08-Jun
18 22 5 3,034 0 43 99 3,181 09-Jun
19 30 1 4,570 0 18 308 4,897
10-Jun
50 68 2,029 28,007 1 22,208 22,834 75,079 11-Jun
8 8 84 4,520 0 5,861 5,227 15,692
12-Jun
51 70 3,029 28,053 0 22,347 26,296 79,725 13-Jun
40 72 712 11,033 0 6,211 6,254 24,210
14-Jun
28 45 1 6,340 1 75 177 6,594 15-Jun
58 97 2,082 21,520 20 19,647 7,335 50,604
16-Jun
22 24 2,192 9,933 22 19,710 6,872 38,729 17-Jun
49 75 3,922 25,082 41 31,456 4,820 65,321
18-Jun
48 76 6,724 26,426 21 20,635 4,004 57,810 19-Jun
36 80 8 16,256 20 209 548 17,041
20-Jun
58 90 3,652 27,222 230 23,719 6,471 61,294 21-Jun
16 17 432 34,778 227 20,995 3,111 59,543
22-Jun
47 73 1,620 46,335 706 24,972 7,435 81,068 23-Jun
57 84 1,935 43,463 419 10,551 5,668 62,036
24-Jun
35 52 7 13,407 94 30 615 14,153 25-Jun
57 85 2,589 45,413 3,057 50,877 3,656 105,592
26-Jun
16 19 1,514 15,135 3,064 57,799 3,831 81,343 27-Jun
41 59 2,318 25,491 4,032 117,638 5,476 154,955
28-Jun
55 84 2,876 39,844 6,720 50,066 13,933 113,439 29-Jun
32 64 5 15,423 778 337 913 17,456
30-Jun a – – – – – – – – Total 88 1,339 37,746 497,019 19,453 505,500 136,409 1,196,127 a Closed to commercial salmon fishing.
69
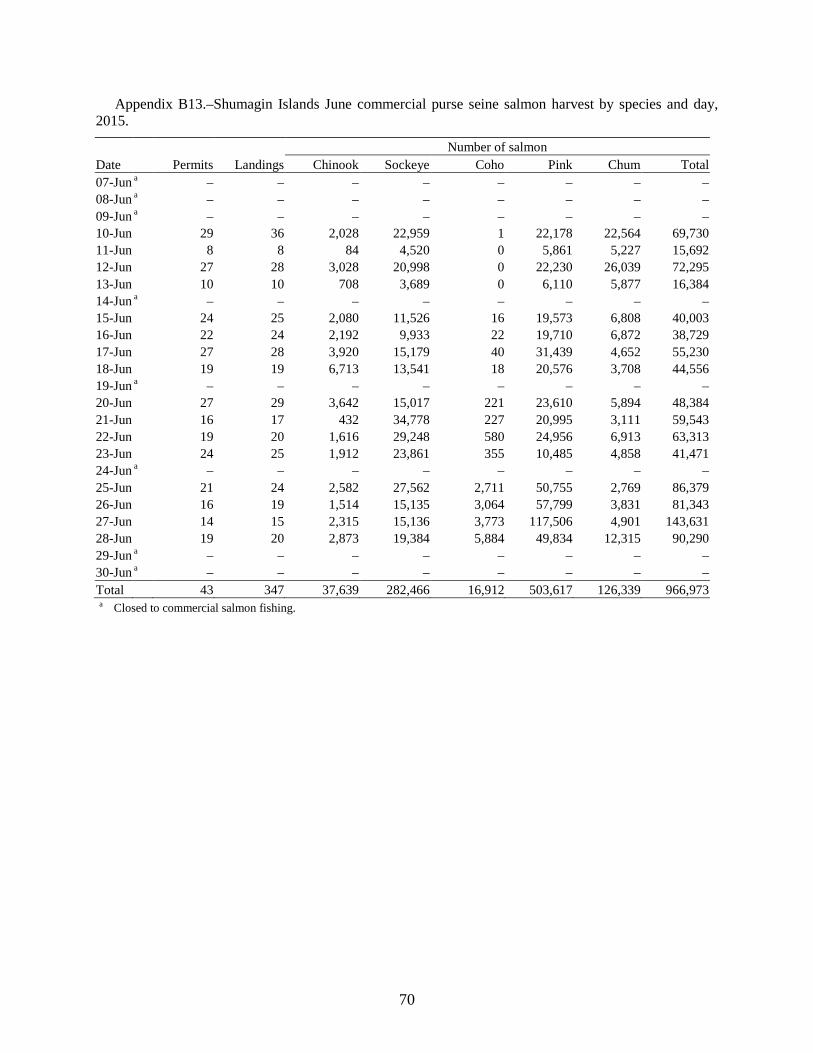
Appendix B13.–Shumagin Islands June commercial purse seine salmon harvest by species and day, 2015.
Number of salmon Date Permits Landings Chinook Sockeye Coho Pink Chum Total 07-Jun a – – – – – – – – 08-Jun a – – – – – – – – 09-Jun a – – – – – – – – 10-Jun
29 36 2,028 22,959 1 22,178 22,564 69,730
11-Jun
8 8 84 4,520 0 5,861 5,227 15,692 12-Jun
27 28 3,028 20,998 0 22,230 26,039 72,295
13-Jun
10 10 708 3,689 0 6,110 5,877 16,384 14-Jun a – – – – – – – – 15-Jun
24 25 2,080 11,526 16 19,573 6,808 40,003
16-Jun
22 24 2,192 9,933 22 19,710 6,872 38,729 17-Jun
27 28 3,920 15,179 40 31,439 4,652 55,230
18-Jun
19 19 6,713 13,541 18 20,576 3,708 44,556 19-Jun a – – – – – – – – 20-Jun
27 29 3,642 15,017 221 23,610 5,894 48,384
21-Jun
16 17 432 34,778 227 20,995 3,111 59,543 22-Jun
19 20 1,616 29,248 580 24,956 6,913 63,313
23-Jun
24 25 1,912 23,861 355 10,485 4,858 41,471 24-Jun a – – – – – – – – 25-Jun
21 24 2,582 27,562 2,711 50,755 2,769 86,379
26-Jun
16 19 1,514 15,135 3,064 57,799 3,831 81,343 27-Jun
14 15 2,315 15,136 3,773 117,506 4,901 143,631
28-Jun
19 20 2,873 19,384 5,884 49,834 12,315 90,290 29-Jun a – – – – – – – – 30-Jun a – – – – – – – – Total 43 347 37,639 282,466 16,912 503,617 126,339 966,973 a Closed to commercial salmon fishing.
70
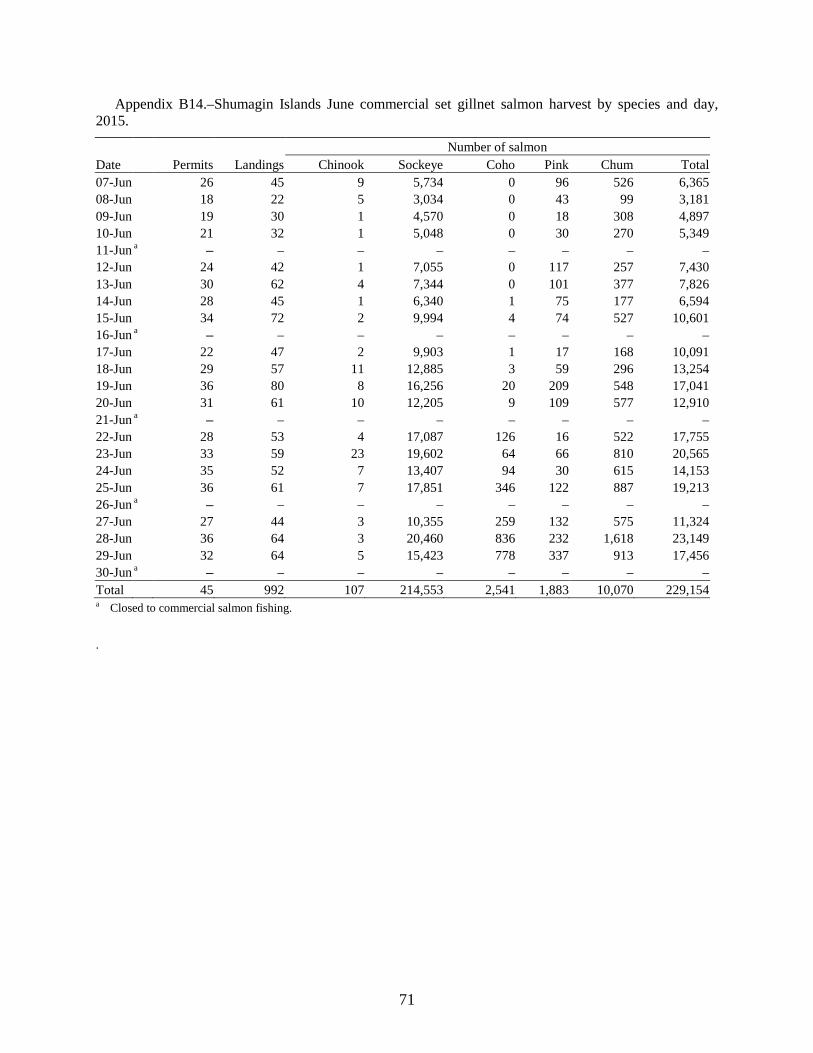
Appendix B14.–Shumagin Islands June commercial set gillnet salmon harvest by species and day, 2015.
Number of salmon Date Permits Landings Chinook Sockeye Coho Pink Chum Total 07-Jun
26 45 9 5,734 0 96 526 6,365
08-Jun
18 22 5 3,034 0 43 99 3,181 09-Jun
19 30 1 4,570 0 18 308 4,897
10-Jun
21 32 1 5,048 0 30 270 5,349 11-Jun a – – – – – – – – 12-Jun
24 42 1 7,055 0 117 257 7,430
13-Jun
30 62 4 7,344 0 101 377 7,826 14-Jun
28 45 1 6,340 1 75 177 6,594
15-Jun
34 72 2 9,994 4 74 527 10,601 16-Jun a – – – – – – – – 17-Jun
22 47 2 9,903 1 17 168 10,091
18-Jun
29 57 11 12,885 3 59 296 13,254 19-Jun
36 80 8 16,256 20 209 548 17,041
20-Jun
31 61 10 12,205 9 109 577 12,910 21-Jun a – – – – – – – – 22-Jun
28 53 4 17,087 126 16 522 17,755
23-Jun
33 59 23 19,602 64 66 810 20,565 24-Jun
35 52 7 13,407 94 30 615 14,153
25-Jun
36 61 7 17,851 346 122 887 19,213 26-Jun a – – – – – – – – 27-Jun
27 44 3 10,355 259 132 575 11,324
28-Jun
36 64 3 20,460 836 232 1,618 23,149 29-Jun
32 64 5 15,423 778 337 913 17,456
30-Jun a – – – – – – – – Total 45 992 107 214,553 2,541 1,883 10,070 229,154 a Closed to commercial salmon fishing.
.
71
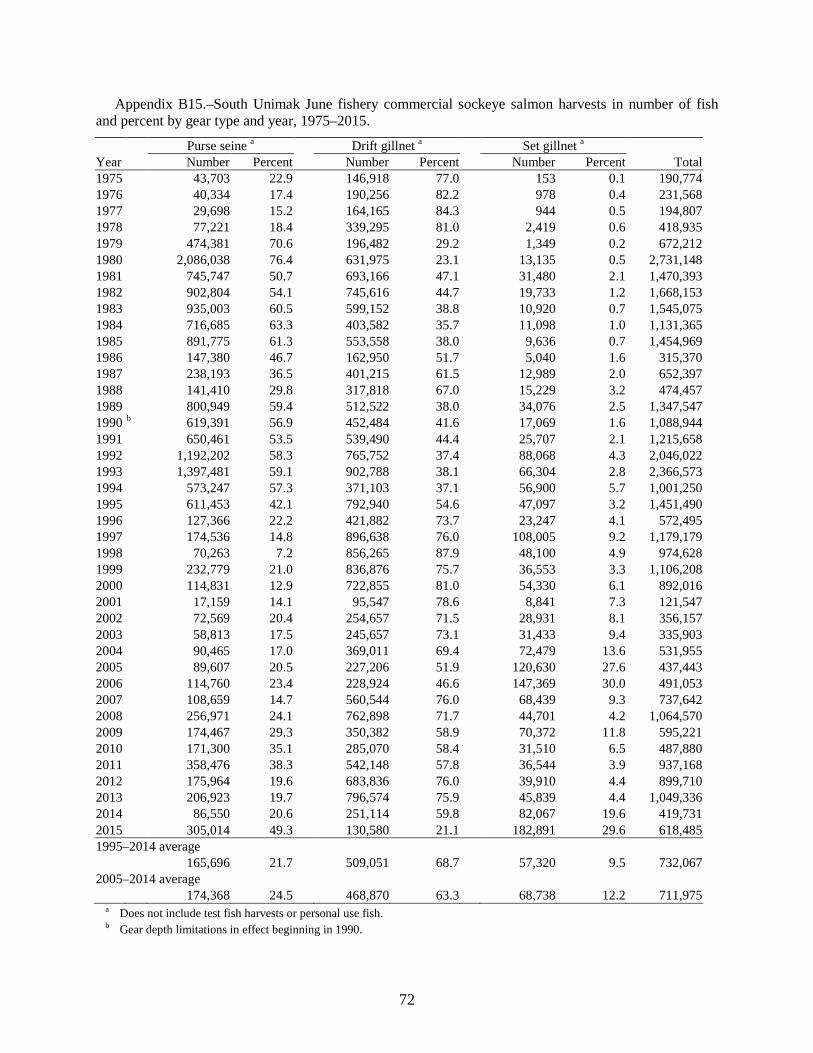
Appendix B15.–South Unimak June fishery commercial sockeye salmon harvests in number of fish and percent by gear type and year, 1975–2015.
Purse seine a Drift gillnet a Set gillnet a Year Number Percent Number Percent Number Percent Total 1975
43,703 22.9
146,918 77.0
153 0.1 190,774
1976
40,334 17.4
190,256 82.2
978 0.4 231,568 1977
29,698 15.2
164,165 84.3
944 0.5 194,807
1978
77,221 18.4
339,295 81.0
2,419 0.6 418,935 1979
474,381 70.6
196,482 29.2
1,349 0.2 672,212
1980
2,086,038 76.4
631,975 23.1
13,135 0.5 2,731,148 1981
745,747 50.7
693,166 47.1
31,480 2.1 1,470,393
1982
902,804 54.1
745,616 44.7
19,733 1.2 1,668,153 1983
935,003 60.5
599,152 38.8
10,920 0.7 1,545,075
1984
716,685 63.3
403,582 35.7
11,098 1.0 1,131,365 1985
891,775 61.3
553,558 38.0
9,636 0.7 1,454,969
1986
147,380 46.7
162,950 51.7
5,040 1.6 315,370 1987
238,193 36.5
401,215 61.5
12,989 2.0 652,397
1988
141,410 29.8
317,818 67.0
15,229 3.2 474,457 1989
800,949 59.4
512,522 38.0
34,076 2.5 1,347,547
1990 b 619,391 56.9
452,484 41.6
17,069 1.6 1,088,944 1991
650,461 53.5
539,490 44.4
25,707 2.1 1,215,658
1992
1,192,202 58.3
765,752 37.4
88,068 4.3 2,046,022 1993
1,397,481 59.1
902,788 38.1
66,304 2.8 2,366,573
1994
573,247 57.3
371,103 37.1
56,900 5.7 1,001,250 1995
611,453 42.1
792,940 54.6
47,097 3.2 1,451,490
1996
127,366 22.2
421,882 73.7
23,247 4.1 572,495 1997
174,536 14.8
896,638 76.0
108,005 9.2 1,179,179
1998
70,263 7.2
856,265 87.9
48,100 4.9 974,628 1999
232,779 21.0
836,876 75.7
36,553 3.3 1,106,208
2000
114,831 12.9
722,855 81.0
54,330 6.1 892,016 2001
17,159 14.1
95,547 78.6
8,841 7.3 121,547
2002
72,569 20.4
254,657 71.5
28,931 8.1 356,157 2003
58,813 17.5
245,657 73.1
31,433 9.4 335,903
2004
90,465 17.0
369,011 69.4
72,479 13.6 531,955 2005
89,607 20.5
227,206 51.9
120,630 27.6 437,443
2006
114,760 23.4
228,924 46.6
147,369 30.0 491,053 2007
108,659 14.7
560,544 76.0
68,439 9.3 737,642
2008
256,971 24.1
762,898 71.7
44,701 4.2 1,064,570 2009
174,467 29.3
350,382 58.9
70,372 11.8 595,221
2010
171,300 35.1
285,070 58.4
31,510 6.5 487,880 2011
358,476 38.3
542,148 57.8
36,544 3.9 937,168
2012
175,964 19.6
683,836 76.0
39,910 4.4 899,710 2013
206,923 19.7
796,574 75.9
45,839 4.4 1,049,336
2014
86,550 20.6
251,114 59.8
82,067 19.6 419,731 2015 305,014 49.3 130,580 21.1 182,891 29.6 618,485 1995–2014 average
165,696 21.7
509,051 68.7
57,320 9.5 732,067 2005–2014 average
174,368 24.5 468,870 63.3 68,738 12.2 711,975 a Does not include test fish harvests or personal use fish. b Gear depth limitations in effect beginning in 1990.
72
Appendix B16.–South Unimak June fishery commercial chum salmon harvests in number of fish and percent by gear type and year, 1975–2015.
Purse seine a Drift gillnet a Set gillnet a Year Number Percent Number Percent Number Percent Total 1975
18,833 28.9
46,446 71.1
0 0.0 65,279
1976
47,623 14.2
288,300 85.8
238 0.1 336,161 1977
9,852 10.5
84,052 89.3
193 0.2 94,097
1978
10,210 9.9
93,115 90.0
88 0.1 103,413 1979
19,007 30.1
44,051 69.8
92 0.1 63,150
1980
363,360 79.2
94,900 20.7
239 0.1 458,499 1981
323,817 63.5
184,586 36.2
1,473 0.3 509,876
1982
430,661 46.1
501,282 53.7
1,785 0.2 933,728 1983
405,903 65.9
209,600 34.0
851 0.1 616,354
1984
137,110 60.2
90,498 39.7
305 0.1 227,913 1985
125,813 38.7
198,361 61.1
651 0.2 324,825
1986
110,666 43.8
141,299 55.9
756 0.3 252,721 1987
155,447 38.3
247,934 61.1
2,574 0.6 405,955
1988
155,895 33.5
305,967 65.8
2,903 0.6 464,765 1989
212,310 52.1
192,650 47.3
2,675 0.7 407,635
1990 b 263,532 57.9
190,002 41.8
1,510 0.3 455,044 1991
410,034 61.2
256,132 38.2
3,937 0.6 670,103
1992
204,717 63.2
115,401 35.6
3,773 1.2 323,891 1993
252,798 66.2
120,820 31.6
8,323 2.2 381,941
1994
239,286 63.9
129,530 34.6
5,593 1.5 374,409 1995
161,199 47.1
172,715 50.5
8,393 2.5 342,307
1996
41,516 32.0
86,103 66.3
2,270 1.7 129,889 1997
58,999 30.1
127,646 65.1
9,371 4.8 196,016
1998
26,777 13.7
162,566 83.2
6,111 3.1 195,454 1999
52,314 28.0
128,723 68.9
5,849 3.1 186,886
2000
46,728 27.7
114,812 68.0
7,348 4.4 168,888 2001
5,701 15.8
28,651 79.4
1,747 4.8 36,099
2002
46,036 22.9
145,079 72.1
10,096 5.0 201,211 2003
23,435 19.3
92,730 76.5
5,004 4.1 121,169
2004
18,142 13.9
109,227 83.6
3,257 2.5 130,626 2005
26,253 18.3
112,144 78.0
5,402 3.8 143,799
2006
7,479 7.8
83,752 87.2
4,785 5.0 96,016 2007
34,534 22.5
115,461 75.3
3,339 2.2 153,334
2008
96,576 34.0
181,758 63.9
6,115 2.1 284,449 2009
85,945 42.8
105,764 52.7
9,074 4.5 200,783
2010
25,144 25.0
70,358 70.1
4,925 4.9 100,427 2011
142,028 61.5
74,990 32.5
14,063 6.1 231,081
2012
75,087 35.5
134,350 63.5
2,263 1.1 211,700 2013
83,100 44.0
103,912 55.0
1,940 1.0 188,952
2014
113,157 51.3
99,003 44.9
8,276 3.8 220,436 2015 6,038 14.3 35,285 83.4 983 2.3 42,306 1995–2014 average
58,508 29.7
112,487 66.8
5,981 3.5 176,976 2005–2014 average
68,930 34.3 108,149 62.3 6,018 3.4 183,098 a Does not include test fish harvests. b Gear depth limitations in effect beginning in 1990.
73
Appendix B17.–Shumagin Islands June fishery commercial sockeye salmon harvests in number of fish and percent by gear type and year, 1975–2015.
Purse seine a Set gillnet a Year Number Percent Number Percent Total 1975
48,065 97.4
1,260 2.6 49,325
1976
68,755 95.5
3,261 4.5 72,016 1977
43,579 94.9
2,333 5.1 45,912
1978
65,826 97.0
2,050 3.0 67,876 1979
165,605 92.4
13,534 7.6 179,139
1980
458,069 96.4
17,058 3.6 475,127 1981
332,300 94.8
18,272 5.2 350,572
1982
438,420 97.3
12,128 2.7 450,548 1983
405,757 97.4
10,737 2.6 416,494
1984
243,136 94.7
13,702 5.3 256,838 1985
318,878 94.8
17,553 5.2 336,431
1986
132,580 85.0
23,447 15.0 156,027 1987
106,799 76.0
33,768 24.0 140,567
1988
203,391 72.1
78,839 27.9 282,230 1989
360,860 90.9
36,098 9.1 396,958
1990 b 217,968 85.3
37,617 14.7 255,585 1991
268,539 80.6
64,733 19.4 333,272
1992
374,258 90.9
37,576 9.1 411,834 1993
531,258 87.5
75,913 12.5 607,171
1994
346,923 75.4
113,090 24.6 460,013 1995
532,952 81.5
120,879 18.5 653,831
1996
342,317 75.0
114,158 25.0 456,475 1997
338,803 75.5
110,199 24.5 449,002
1998
155,216 49.4
158,881 50.6 314,097 1999
200,108 74.3
69,083 25.7 269,191
2000
277,974 77.4
81,238 22.6 359,212 2001
24,705 84.9
4,380 15.1 29,085
2002
180,135 76.7
54,814 23.3 234,949 2003
82,608 70.5
34,636 29.5 117,244
2004
608,775 74.6
207,343 25.4 816,118 2005
347,114 61.2
219,838 38.8 566,952
2006
302,729 68.6
138,509 31.4 441,238 2007
707,696 83.0
144,502 17.0 852,198
2008
556,696 85.8
92,309 14.2 649,005 2009
423,423 73.9
149,274 26.1 572,697
2010
268,986 81.3
61,999 18.7 330,985 2011
358,698 84.9
63,575 15.1 422,273
2012
551,760 87.8
76,548 12.2 628,308 2013
437,689 86.2
69,862 13.8 507,551
2014
133,462 55.7
106,020 44.3 239,482 2015 282,466 56.8 214,553 43.2 497,019 1995–2014 average
341,592 75.4
103,902 24.6 445,495 2005–2014 average
408,825 76.9 112,244 23.1 521,069 a Does not include test fish harvests. b Gear depth limitations in effect beginning in 1990.
74
Appendix B18.–Shumagin Islands June fishery commercial chum salmon harvests in number of fish and percent by gear type and year, 1975–2015.
Purse seine a Set gillnet a Year Number Percent Number Percent Total 1975
34,614 97.4
929 2.6 35,543
1976
71,946 97.1
2,163 2.9 74,109 1977
21,678 99.0
221 1.0 21,899
1978
17,793 96.3
686 3.7 18,479 1979
39,196 95.7
1,757 4.3 40,953
1980
48,990 97.3
1,376 2.7 50,366 1981
53,351 98.7
720 1.3 54,071
1982
159,518 98.9
1,798 1.1 161,316 1983
168,618 99.6
659 0.4 169,277
1984
108,495 99.3
712 0.7 109,207 1985
104,619 96.0
4,385 4.0 109,004
1986
94,080 95.0
4,968 5.0 99,048 1987
34,617 93.4
2,447 6.6 37,064
1988
51,154 82.6
10,792 17.4 61,946 1989
44,498 93.6
3,030 6.4 47,528
1990 b 59,111 93.1
4,390 6.9 63,501 1991
95,756 93.3
6,846 6.7 102,602
1992
98,509 96.3
3,803 3.7 102,312 1993
147,160 97.9
3,146 2.1 150,306
1994
200,577 96.5
7,179 3.5 207,756 1995
182,894 93.7
12,232 6.3 195,126
1996
220,449 95.9
9,482 4.1 229,931 1997
118,418 93.8
7,891 6.2 126,309
1998
39,464 78.7
10,701 21.3 50,165 1999
54,439 93.2
3,981 6.8 58,420
2000
66,580 94.5
3,889 5.5 70,469 2001
11,402 93.1
849 6.9 12,251
2002
168,405 94.8
9,201 5.2 177,606 2003
154,445 95.8
6,824 4.2 161,269
2004
336,753 95.8
14,930 4.2 351,683 2005
261,261 92.0
22,770 8.0 284,031
2006
183,192 89.9
20,619 10.1 203,811 2007
133,379 92.5
10,826 7.5 144,205
2008
112,924 89.3
13,559 10.7 126,483 2009
451,820 91.1
44,172 8.9 495,992
2010
159,153 92.9
12,120 7.1 171,273 2011
181,291 94.3
10,963 5.7 192,254
2012
169,989 94.1
10,616 5.9 180,605 2013
197,600 95.0
10,446 5.0 208,046
2014
147,710 87.0
21,993 13.0 169,703 2015 126,339 92.6 10,070 7.4 136,409 1995–2014 average
167,578 92.4
12,903 7.6 180,482 2005–2014 average
199,832 91.8 17,808 8.2 217,640 a Does not include test fish harvests. b Gear depth limitations in effect beginning in 1990.
75

76
APPENDIX C. SOUTHEASTERN DISTRICT MAINLAND
FISHERIES
77
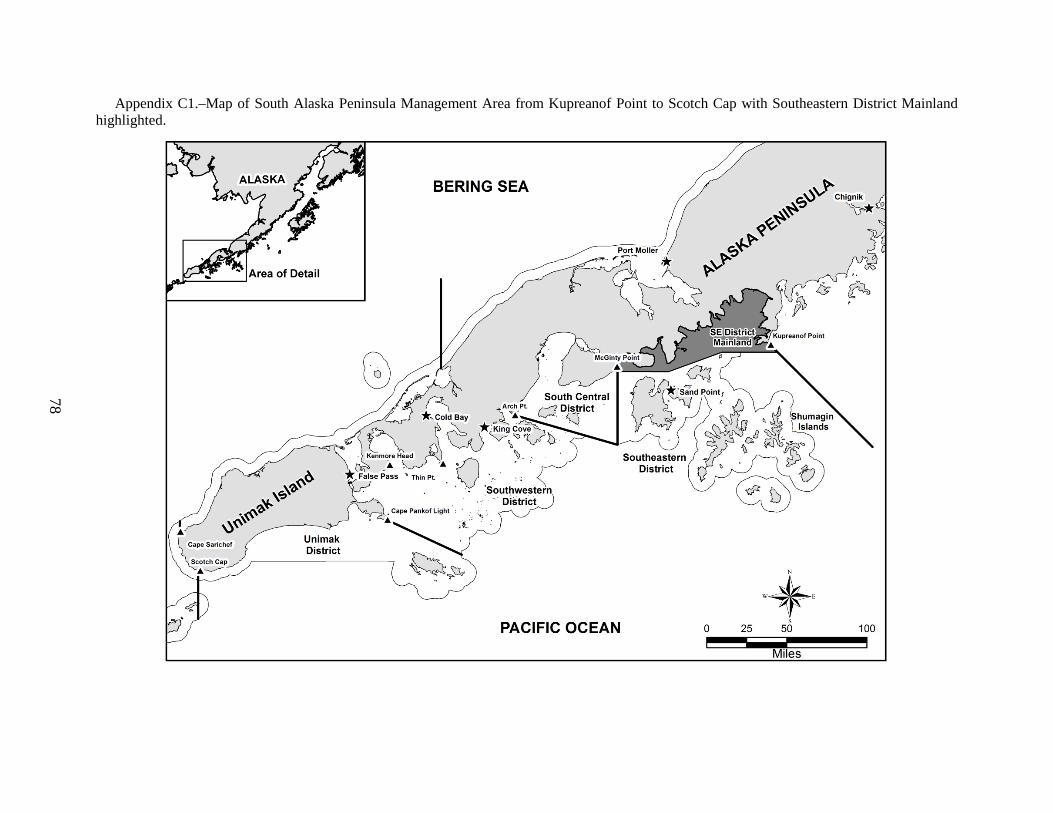
78
Appendix C1.–Map of South Alaska Peninsula Management Area from Kupreanof Point to Scotch Cap with Southeastern District Mainland highlighted.
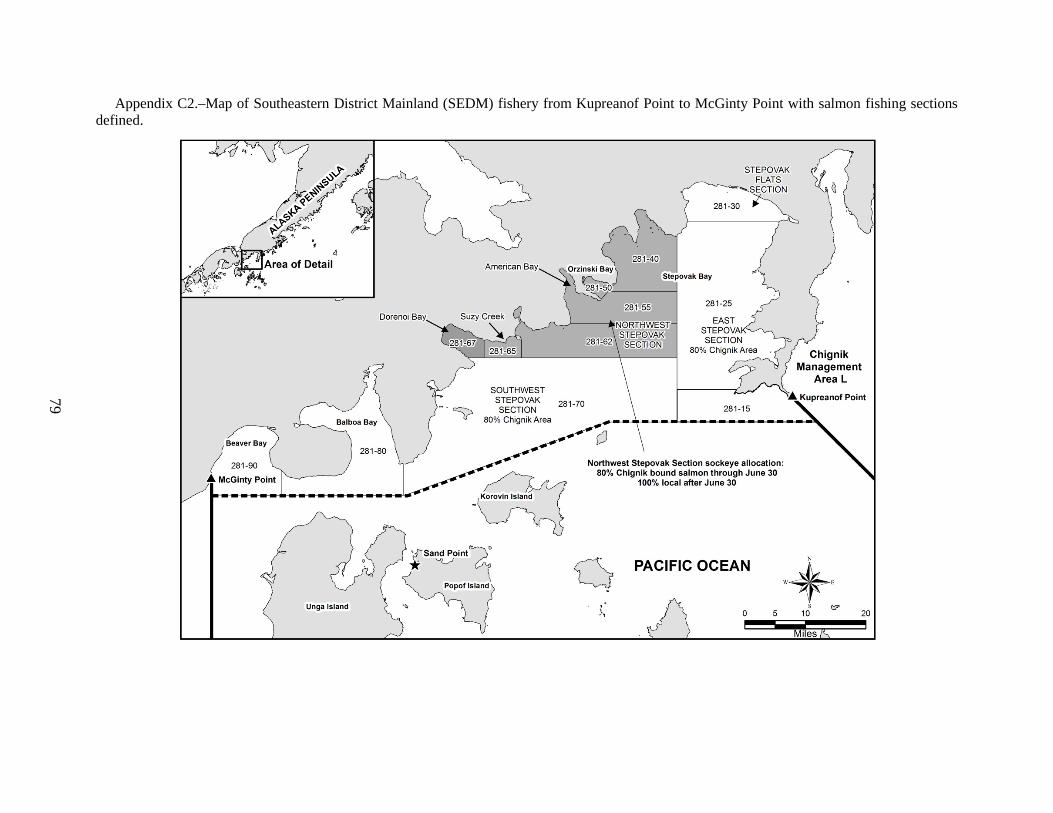
79
Appendix C2.–Map of Southeastern District Mainland (SEDM) fishery from Kupreanof Point to McGinty Point with salmon fishing sections defined.
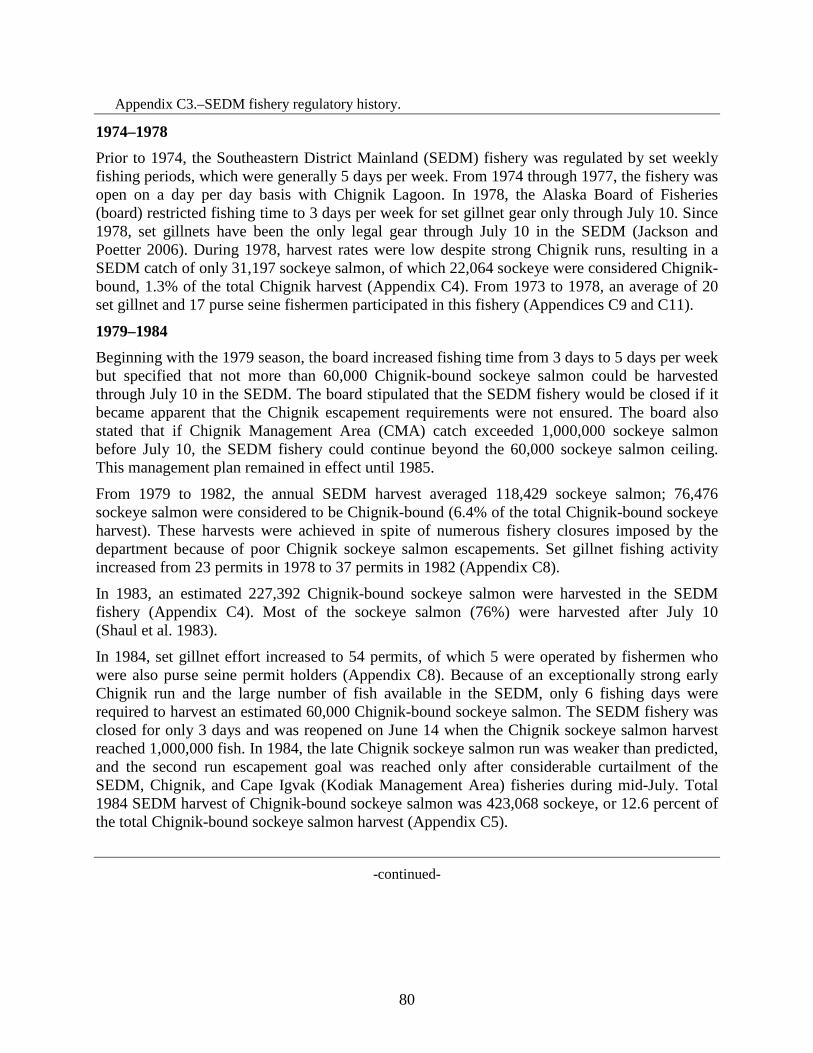
Appendix C3.–SEDM fishery regulatory history.
1974–1978 Prior to 1974, the Southeastern District Mainland (SEDM) fishery was regulated by set weekly fishing periods, which were generally 5 days per week. From 1974 through 1977, the fishery was open on a day per day basis with Chignik Lagoon. In 1978, the Alaska Board of Fisheries (board) restricted fishing time to 3 days per week for set gillnet gear only through July 10. Since 1978, set gillnets have been the only legal gear through July 10 in the SEDM (Jackson and Poetter 2006). During 1978, harvest rates were low despite strong Chignik runs, resulting in a SEDM catch of only 31,197 sockeye salmon, of which 22,064 sockeye were considered Chignik-bound, 1.3% of the total Chignik harvest (Appendix C4). From 1973 to 1978, an average of 20 set gillnet and 17 purse seine fishermen participated in this fishery (Appendices C9 and C11).
1979–1984 Beginning with the 1979 season, the board increased fishing time from 3 days to 5 days per week but specified that not more than 60,000 Chignik-bound sockeye salmon could be harvested through July 10 in the SEDM. The board stipulated that the SEDM fishery would be closed if it became apparent that the Chignik escapement requirements were not ensured. The board also stated that if Chignik Management Area (CMA) catch exceeded 1,000,000 sockeye salmon before July 10, the SEDM fishery could continue beyond the 60,000 sockeye salmon ceiling. This management plan remained in effect until 1985.
From 1979 to 1982, the annual SEDM harvest averaged 118,429 sockeye salmon; 76,476 sockeye salmon were considered to be Chignik-bound (6.4% of the total Chignik-bound sockeye harvest). These harvests were achieved in spite of numerous fishery closures imposed by the department because of poor Chignik sockeye salmon escapements. Set gillnet fishing activity increased from 23 permits in 1978 to 37 permits in 1982 (Appendix C8).
In 1983, an estimated 227,392 Chignik-bound sockeye salmon were harvested in the SEDM fishery (Appendix C4). Most of the sockeye salmon (76%) were harvested after July 10 (Shaul et al. 1983).
In 1984, set gillnet effort increased to 54 permits, of which 5 were operated by fishermen who were also purse seine permit holders (Appendix C8). Because of an exceptionally strong early Chignik run and the large number of fish available in the SEDM, only 6 fishing days were required to harvest an estimated 60,000 Chignik-bound sockeye salmon. The SEDM fishery was closed for only 3 days and was reopened on June 14 when the Chignik sockeye salmon harvest reached 1,000,000 fish. In 1984, the late Chignik sockeye salmon run was weaker than predicted, and the second run escapement goal was reached only after considerable curtailment of the SEDM, Chignik, and Cape Igvak (Kodiak Management Area) fisheries during mid-July. Total 1984 SEDM harvest of Chignik-bound sockeye salmon was 423,068 sockeye, or 12.6 percent of the total Chignik-bound sockeye salmon harvest (Appendix C5).
-continued-
80
Appendix C3.–Page 2 of 4.
1985–1991 For the 1985 season, the board modified the SEDM Management Plan based on the Cape Igvak Salmon Management Plan from the Kodiak Management Area, instead of using a set fishing schedule. The board plan directed the department to manage the fishery so that the number of sockeye salmon taken in the SEDM fishery (exclusive of the Northwest Stepovak Section) approached as near as possible to 6.2% of the total Chignik-bound sockeye salmon harvest, June 1 through July 25. In the fall of 1987, the department re-evaluated the data used to calculate the allocation and determined that 6.0% was appropriate. The board changed the allocation, based on the re-evaluated data, beginning with the 1988 season.
However, before the SEDM fishery could open, certain criteria had to be met. In years when a harvestable surplus for the early and late runs of Chignik River system sockeye salmon was expected to be less than 600,000 fish, no commercial salmon fishery targeting Chignik-bound sockeye salmon would be allowed in the SEDM fishery until a harvest of 300,000 sockeye salmon was achieved in the CMA. After July 8, fishing in the SEDM might occur provided at least 300,000 sockeye salmon had been harvested in the CMA, escapement objectives were being met, and the Chignik Area harvest was anticipated to total at least 600,000 sockeye salmon. In addition, the number of sockeye salmon taken in the SEDM fishery needed to be as near as possible to 6.0% of the total Chignik-bound sockeye salmon harvest from June 1 through July 25.
From 1985 through 1991, the harvest of Chignik-bound sockeye salmon in the SEDM averaged 88,776 salmon, 5.5% of the total Chignik-bound sockeye salmon harvest, and ranged from 4,485 fish in 1989 to 152,714 fish in 1991 (Appendix C5).
1992–1995 The board revised the SEDM Management Plan prior to the 1992 season. The revised plan was in effect from 1992 through 1995, and included 2 significant changes:
1. The Northwest Stepovak Section (NWSS) to be managed on a local stock basis was reduced to include only waters of Orzinski Bay; the Stepovak Flats Section would continue to be managed on the basis of Stepovak River chum salmon stock.
2. The allowable harvest of Chignik-bound sockeye salmon in the SEDM fishery (exclusive of Orzinski Bay) was increased from 6.0% to 7.0% of the total Chignik-bound sockeye salmon catch.
From 1992 to 1995, the harvest of Chignik-bound sockeye in the SEDM averaged 113,258 salmon and 7.0% of the total Chignik-bound sockeye salmon harvest (Appendix C5).
-continued-
81
Appendix C3.–Page 3 of 4.
1996–1997 In January 1996, the board made the following changes to the SEDM Management Plan:
1. The area to be managed for local Orzinski Lake sockeye salmon increased to include Orzinski Bay and the entire NWSS (Appendix C2). Prior to July 1, the entire Northwest Stepovak Section was managed on an allocation based on the strength of the Chignik sockeye salmon runs as described in 5 AAC 09.360(a)(1) and (b)–(h). Beginning July 1, the NWSS would be managed entirely on local stocks. Stepovak Flats would continue to be managed on the basis of the Stepovak River chum salmon stocks.
2. The percentage of Chignik-bound sockeye salmon allocated to the SEDM fishery was decreased from 7.0% to 6.0% of the total Chignik-bound sockeye salmon harvest from June 1 through July 25. This board action was taken in an attempt to maintain traditional harvest levels of Chignik-bound sockeye salmon in the SEDM fishery and to compensate for the increased area managed for local Orzinski Lake sockeye salmon.
3. The board established a closed waters area encompassing Kupreanof Point, as described in 5 AAC 09.350(37), from July 6 through at least August 31 (Jackson and Poetter 2006).
1998–2006 In January 1998, the board made the following changes to the SEDM Management Plan:
1. Prior to July 1, the SEDM (Appendix C2) is managed on an allocation based on the strength of the CMA sockeye salmon runs as described in 5 AAC 09.360 and 80% of the sockeye salmon caught are considered Chignik-bound. However, beginning July 1, all sockeye salmon caught in NWSS are considered local fish and are not counted toward the allocation. The NWSS, outside Orzinski Bay, may open to commercial salmon fishing during July 1–July 25 if Orzinski Lake sockeye salmon interim escapement objectives are being met and the CMA sockeye salmon harvest is expected to be more than 600,000 fish through July 25. The board mandated fishing schedule for NWSS, excluding Orzinski Bay from July 1–July 25, cannot exceed 4 days during a 7-day period. The maximum number of consecutive fishing days allowed is 2 (Figure 8 in Jackson and Poetter 2007).
2. Beginning July 1, the NWSS is managed entirely on local stocks. All sockeye salmon harvested in the NWSS after July 1 are considered to be from Orzinski Lake stocks. The Stepovak Flats Section is managed for chum salmon returning to local streams throughout the entire season. However, 80% of the sockeye salmon caught in the Stepovak Flats Section through July 25 are considered Chignik-bound fish (Jackson and Poetter 2006).
3. The board allocated 6% of the total Chignik-bound sockeye salmon harvest from June 1 through July 25 to the SEDM fishery.
-continued-
82
Appendix C3.–Page 4 of 4.
1. The board directed the department to consider an extension of the Kupreanof Point closed waters area, as described in 5 AAC 09.350(37), by emergency order (Figure 7 in Jackson and Poetter 2006). The Kupreanof Point closed waters extension remains in effect through October 31 if waters specified in 5 AAC 15.350(20) are closed to conserve coho salmon in the CMA.
2. Orzinski Bay may open to purse seine gear prior to July 11 if the department determines the interim escapement objectives have been exceeded (Appendix C13).
The total Chignik-bound sockeye salmon harvest from June 1 through July 25 is calculated by adding 100% of CMA sockeye salmon harvest, 90% of Cape Igvak Section (KMA), and 80% of SEDM sockeye salmon harvests from June 1–July 25, excluding 100% of the sockeye salmon caught within the NWSS from July 1–25.
2007–Present In January 2007, the board made the following changes to the SEDM Management Plan (5 AAC 09.360):
1. The percentage of Chignik-bound sockeye salmon allocated to the SEDM fishery was changed from 6% to 7.6% of the total number of sockeye salmon harvested in the CMA from June 1 through July 25, and Cape Igvak is no longer contributing to the allocation.
2. If the Orzinski Lake escapement met or exceeded 25,000 sockeye salmon, the NWSS and Orzinski Bay may be opened concurrently as follows:
(A) set gillnet gear may be operated continuously until midnight July 25, and
(B) purse seine and hand purse seine gear will be operated as specified in 5 AAC 09.360(e)(1).
3. From July 26 through October 31, the fishery is managed for local pink, chum, and coho salmon stocks.
4. From July 26 through October 31, the fishery will be closed for at least one 36-hour period within a 7-day period.
83
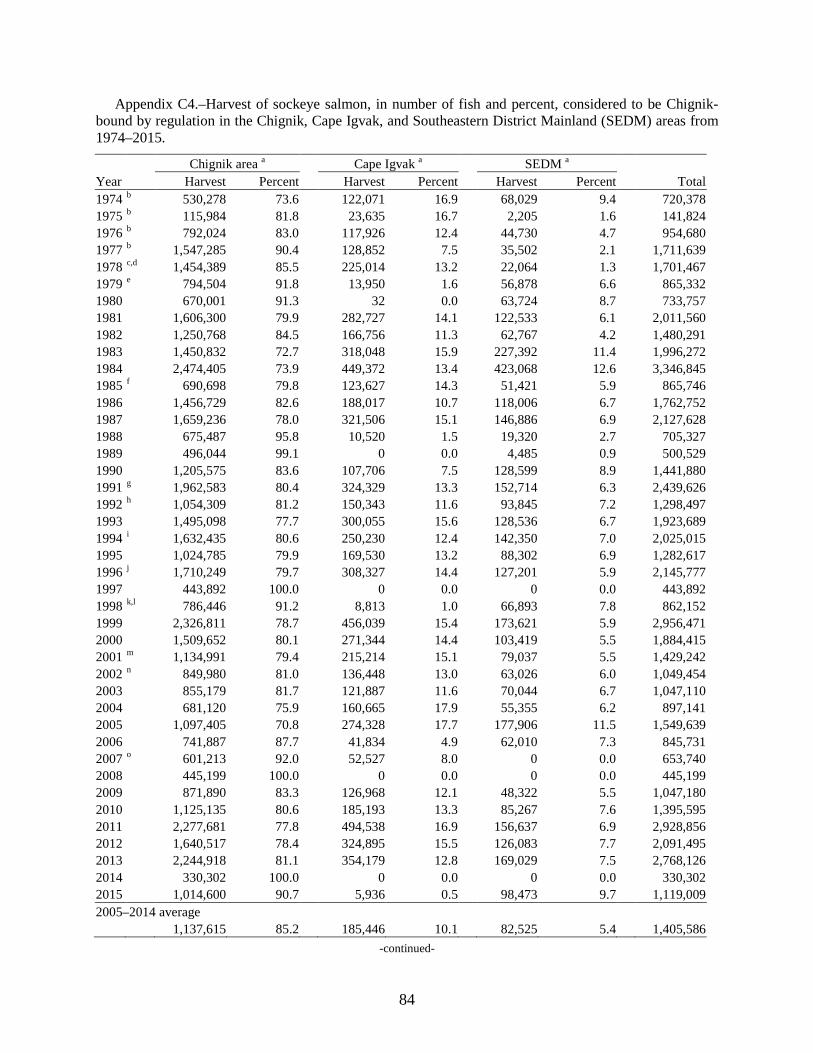
Appendix C4.–Harvest of sockeye salmon, in number of fish and percent, considered to be Chignik-bound by regulation in the Chignik, Cape Igvak, and Southeastern District Mainland (SEDM) areas from 1974–2015.
Chignik area a
Cape Igvak a
SEDM a
Year Harvest Percent Harvest Percent Harvest Percent Total 1974 b 530,278 73.6
122,071 16.9
68,029 9.4
720,378
1975 b 115,984 81.8
23,635 16.7
2,205 1.6
141,824 1976 b 792,024 83.0
117,926 12.4
44,730 4.7
954,680
1977 b 1,547,285 90.4
128,852 7.5
35,502 2.1
1,711,639 1978 c,d 1,454,389 85.5
225,014 13.2
22,064 1.3
1,701,467
1979 e 794,504 91.8
13,950 1.6
56,878 6.6
865,332 1980
670,001 91.3
32 0.0
63,724 8.7
733,757
1981
1,606,300 79.9
282,727 14.1
122,533 6.1
2,011,560 1982
1,250,768 84.5
166,756 11.3
62,767 4.2
1,480,291
1983
1,450,832 72.7
318,048 15.9
227,392 11.4
1,996,272 1984
2,474,405 73.9
449,372 13.4
423,068 12.6
3,346,845
1985 f 690,698 79.8
123,627 14.3
51,421 5.9
865,746 1986
1,456,729 82.6
188,017 10.7
118,006 6.7
1,762,752
1987
1,659,236 78.0
321,506 15.1
146,886 6.9
2,127,628 1988
675,487 95.8
10,520 1.5
19,320 2.7
705,327
1989
496,044 99.1
0 0.0
4,485 0.9
500,529 1990
1,205,575 83.6
107,706 7.5
128,599 8.9
1,441,880
1991 g 1,962,583 80.4
324,329 13.3
152,714 6.3
2,439,626 1992 h 1,054,309 81.2
150,343 11.6
93,845 7.2
1,298,497
1993
1,495,098 77.7
300,055 15.6
128,536 6.7
1,923,689 1994 i 1,632,435 80.6
250,230 12.4
142,350 7.0
2,025,015
1995
1,024,785 79.9
169,530 13.2
88,302 6.9
1,282,617 1996 j 1,710,249 79.7
308,327 14.4
127,201 5.9
2,145,777
1997
443,892 100.0
0 0.0
0 0.0
443,892 1998 k,l 786,446 91.2
8,813 1.0
66,893 7.8
862,152
1999
2,326,811 78.7
456,039 15.4
173,621 5.9
2,956,471 2000
1,509,652 80.1
271,344 14.4
103,419 5.5
1,884,415
2001 m 1,134,991 79.4
215,214 15.1
79,037 5.5
1,429,242 2002 n 849,980 81.0
136,448 13.0
63,026 6.0
1,049,454
2003
855,179 81.7
121,887 11.6
70,044 6.7
1,047,110 2004
681,120 75.9
160,665 17.9
55,355 6.2
897,141
2005
1,097,405 70.8
274,328 17.7
177,906 11.5
1,549,639 2006
741,887 87.7
41,834 4.9
62,010 7.3
845,731
2007 o 601,213 92.0
52,527 8.0
0 0.0
653,740 2008
445,199 100.0
0 0.0
0 0.0
445,199
2009
871,890 83.3
126,968 12.1
48,322 5.5
1,047,180 2010
1,125,135 80.6
185,193 13.3
85,267 7.6
1,395,595
2011
2,277,681 77.8
494,538 16.9
156,637 6.9
2,928,856 2012
1,640,517 78.4
324,895 15.5
126,083 7.7
2,091,495
2013
2,244,918 81.1
354,179 12.8
169,029 7.5
2,768,126 2014 330,302 100.0 0 0.0 0 0.0 330,302 2015 1,014,600 90.7 5,936 0.5 98,473 9.7 1,119,009 2005–2014 average
1,137,615 85.2 185,446 10.1 82,525 5.4 1,405,586 -continued-
84
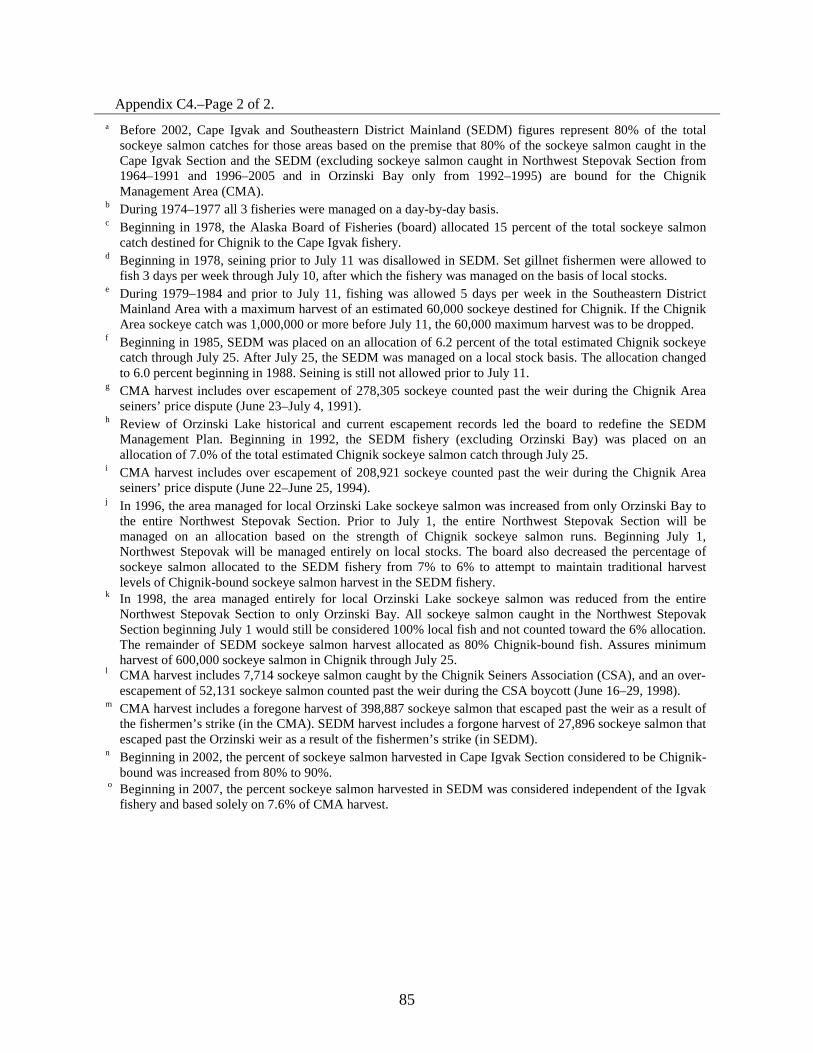
Appendix C4.–Page 2 of 2. a Before 2002, Cape Igvak and Southeastern District Mainland (SEDM) figures represent 80% of the total
sockeye salmon catches for those areas based on the premise that 80% of the sockeye salmon caught in the Cape Igvak Section and the SEDM (excluding sockeye salmon caught in Northwest Stepovak Section from 1964–1991 and 1996–2005 and in Orzinski Bay only from 1992–1995) are bound for the Chignik Management Area (CMA).
b During 1974–1977 all 3 fisheries were managed on a day-by-day basis. c Beginning in 1978, the Alaska Board of Fisheries (board) allocated 15 percent of the total sockeye salmon
catch destined for Chignik to the Cape Igvak fishery. d Beginning in 1978, seining prior to July 11 was disallowed in SEDM. Set gillnet fishermen were allowed to
fish 3 days per week through July 10, after which the fishery was managed on the basis of local stocks. e During 1979–1984 and prior to July 11, fishing was allowed 5 days per week in the Southeastern District
Mainland Area with a maximum harvest of an estimated 60,000 sockeye destined for Chignik. If the Chignik Area sockeye catch was 1,000,000 or more before July 11, the 60,000 maximum harvest was to be dropped.
f Beginning in 1985, SEDM was placed on an allocation of 6.2 percent of the total estimated Chignik sockeye catch through July 25. After July 25, the SEDM was managed on a local stock basis. The allocation changed to 6.0 percent beginning in 1988. Seining is still not allowed prior to July 11.
g CMA harvest includes over escapement of 278,305 sockeye counted past the weir during the Chignik Area seiners’ price dispute (June 23–July 4, 1991).
h Review of Orzinski Lake historical and current escapement records led the board to redefine the SEDM Management Plan. Beginning in 1992, the SEDM fishery (excluding Orzinski Bay) was placed on an allocation of 7.0% of the total estimated Chignik sockeye salmon catch through July 25.
i CMA harvest includes over escapement of 208,921 sockeye counted past the weir during the Chignik Area seiners’ price dispute (June 22–June 25, 1994).
j In 1996, the area managed for local Orzinski Lake sockeye salmon was increased from only Orzinski Bay to the entire Northwest Stepovak Section. Prior to July 1, the entire Northwest Stepovak Section will be managed on an allocation based on the strength of Chignik sockeye salmon runs. Beginning July 1, Northwest Stepovak will be managed entirely on local stocks. The board also decreased the percentage of sockeye salmon allocated to the SEDM fishery from 7% to 6% to attempt to maintain traditional harvest levels of Chignik-bound sockeye salmon harvest in the SEDM fishery.
k In 1998, the area managed entirely for local Orzinski Lake sockeye salmon was reduced from the entire Northwest Stepovak Section to only Orzinski Bay. All sockeye salmon caught in the Northwest Stepovak Section beginning July 1 would still be considered 100% local fish and not counted toward the 6% allocation. The remainder of SEDM sockeye salmon harvest allocated as 80% Chignik-bound fish. Assures minimum harvest of 600,000 sockeye salmon in Chignik through July 25.
l CMA harvest includes 7,714 sockeye salmon caught by the Chignik Seiners Association (CSA), and an over-escapement of 52,131 sockeye salmon counted past the weir during the CSA boycott (June 16–29, 1998).
m CMA harvest includes a foregone harvest of 398,887 sockeye salmon that escaped past the weir as a result of the fishermen’s strike (in the CMA). SEDM harvest includes a forgone harvest of 27,896 sockeye salmon that escaped past the Orzinski weir as a result of the fishermen’s strike (in SEDM).
n Beginning in 2002, the percent of sockeye salmon harvested in Cape Igvak Section considered to be Chignik-bound was increased from 80% to 90%.
o Beginning in 2007, the percent sockeye salmon harvested in SEDM was considered independent of the Igvak fishery and based solely on 7.6% of CMA harvest.
85
86
Appendix C5.–Harvest comparison of Chignik-bound sockeye salmon June 1 through July 25, 1974–2015.
Appendix C6.–Southeastern District Mainland salmon harvest by species, all gear combined, June 1–July 25, 1974–2015.
Number of salmon
Year Permits Landings Chinook Sockeye Coho Pink Chum Total 1974
42 363 50 92,562 216 29,769 7,783 130,380
1975
13 25 0 3,156 63 3,020 770 7,009 1976
41 221 58 59,844 37 20,059 6,759 86,757
1977
52 266 33 48,589 940 43,301 11,454 104,317 1978
42 213 39 31,197 354 33,140 16,104 80,834
1979
42 344 119 90,658 5,857 45,582 7,561 149,777 1980
36 420 79 96,665 1,608 40,779 59,441 198,572
1981
69 718 1,320 202,540 3,058 17,347 172,340 396,605 1982
67 893 401 86,793 1,920 209,898 134,473 433,485
1983
78 852 1,387 302,387 3,222 11,295 101,873 420,164 1984
87 1,736 1,054 595,044 4,414 199,990 141,452 941,954
1985
72 418 177 80,957 909 74,592 87,116 243,751 1986
60 645 219 206,532 770 40,771 51,003 299,295
1987
59 537 130 244,895 197 2,363 21,332 268,917 1988
57 345 214 81,160 2,318 97,534 74,743 255,969
1989
67 248 145 89,224 1,226 210,017 6,570 307,182 1990
115 408 694 166,322 16,809 48,999 43,479 276,303
1991
98 818 614 289,727 1,386 24,788 12,113 328,628 1992
65 664 170 215,444 135 15,939 20,629 252,317
1993
117 845 1,093 210,927 4,207 78,278 9,266 303,771 1994
56 678 242 221,657 1,041 11,158 5,651 239,749
1995
84 718 321 159,381 2,286 52,772 21,809 236,569 1996
89 1,210 325 284,076 3,846 71,856 36,478 396,581
1997
69 1,194 146 304,629 1,380 16,613 6,368 329,136 1998
65 365 307 117,131 2,959 125,030 9,929 255,356
1999
90 679 184 217,026 898 42,905 8,390 269,403 2000
90 1,194 174 202,435 6,968 57,176 27,261 294,014
2001
67 571 177 106,607 1,314 42,220 50,211 200,529 2002
65 1,026 545 153,469 5,390 143,365 18,752 321,521
2003
59 1,055 309 222,651 2,234 129,458 12,272 366,924 2004
44 773 389 210,545 4,536 57,617 5,827 278,914
2005
64 510 97 245,153 6,030 312,207 9,633 573,120 2006
37 117 29 77,513 2,805 77,685 13,259 171,291
2007 a – – – – – – – – 2008
28 299 29 31,669 505 34,137 6,139 72,479
2009
61 742 120 151,765 1,999 59,799 15,630 229,313 2010
61 938 882 167,756 2,915 14,605 74,186 260,344
2011
66 1,516 395 222,515 2,300 47,178 51,496 323,884 2012
65 1,105 99 219,132 1,287 42,503 31,835 294,856
2013
70 1,592 697 241,031 17,681 326,858 41,359 627,626 2014 a – – – – – – – – 2015
52 344 231 233,618 7,813 78,212 12,244 332,118
2005–2014 average 50 758 261 150,726 3,947 101,664 27,060 283,657
a No fishery.
87
Appendix C7.–Southeastern District Mainland salmon harvest by species, set gillnet gear, June 1–July 25, 1974–2015.
Number of salmon
Year Permits Landings Chinook Sockeye Coho Pink Chum Total 1974
32 278 32 70,433 144 8,147 3,675 82,431
1975
7 14 0 1,807 29 960 592 3,388 1976
19 167 51 54,120 0 5,147 2,154 61,472
1977
22 158 20 33,943 0 5,791 5,041 44,795 1978
23 189 28 29,070 33 1,785 5,733 36,649
1979
29 318 100 79,432 3,036 11,245 5,881 99,694 1980
24 384 75 89,769 597 5,972 28,894 125,307
1981
32 604 1,203 182,527 333 4,339 22,121 210,523 1982
37 753 273 79,442 947 19,204 32,729 132,595
1983
36 707 365 215,280 1,030 1,840 14,718 233,233 1984
54 1,657 708 567,043 1,481 45,542 32,007 646,781
1985
49 367 157 78,347 184 8,075 9,579 96,342 1986
42 616 177 196,545 449 9,540 20,350 227,061
1987
53 528 111 244,413 102 1,555 12,944 259,125 1988
41 300 84 77,204 731 16,595 11,532 106,146
1989
42 194 87 46,977 105 11,100 1,449 59,718 1990
46 277 191 85,368 829 1,465 9,064 96,917
1991
59 747 439 275,768 857 6,128 7,733 290,925 1992
59 650 166 214,638 115 11,129 5,797 231,845
1993
64 763 557 186,656 664 14,757 3,416 206,050 1994
56 678 242 221,657 1,041 11,158 5,651 239,749
1995
58 688 268 139,515 182 13,097 8,184 161,246 1996
64 1,164 252 276,212 2,869 52,785 31,859 363,977
1997
57 1,171 102 293,750 889 12,288 5,874 312,903 1998
45 340 97 74,069 1,439 33,880 3,413 112,898
1999
63 649 164 205,706 351 8,495 6,772 221,488 2000
64 1,163 160 199,605 5,612 42,700 24,572 272,649
2001
51 551 113 102,213 1,146 27,790 43,962 175,224 2002
53 1,001 476 145,656 1,127 82,515 14,660 244,434
2003
48 1,035 268 211,069 1,574 76,530 10,570 300,011 2004
42 763 389 206,316 4,397 55,202 5,827 272,131
2005
43 474 58 152,978 1,003 30,855 4,440 189,334 2006
24 102 4 39,849 339 7,910 4,701 52,803
2007 a – – – – – – – – 2008
27 299 29 30,861 505 28,566 6,072 66,033
2009
44 701 64 133,526 1,134 22,826 11,151 168,701 2010
45 906 46 161,675 1,534 7,607 27,466 198,328
2011
52 1,498 266 214,853 849 8,008 34,283 258,259 2012
48 1,065 69 190,065 440 9,172 13,038 212,784
2013
46 1,531 344 219,365 9,677 53,505 15,468 298,359 2014 a – – – – – – – – 2015
31 306 37 130,527 1,613 3,531 4,570 140,278
2005–2014 average 37 731 98 127,078 1,721 18,719 12,959 160,575
a No fishery.
88
Appendix C8.–Southeastern District Mainland salmon harvest by species, purse seine gear, June 1–July 25, 1974–2015.
Number of salmon
Year Permits Landings Chinook Sockeye Coho Pink Chum Total 1974
18 85 18 22,129 72 21,622 4,108 47,949
1975
6 11 0 1,349 34 2,060 178 3,621 1976
22 54 7 5,724 37 14,912 4,605 25,285
1977
30 108 13 14,646 940 37,510 6,413 59,522 1978
19 24 11 2,267 321 31,355 10,371 44,325
1979
12 23 19 11,159 2,821 34,331 1,676 50,006 1980
12 36 4 6,896 1,011 34,807 30,547 73,265
1981
35 112 117 19,883 2,725 12,984 149,523 185,232 1982
30 140 128 7,351 973 190,694 101,744 300,890
1983
42 145 1,022 87,107 2,192 9,455 87,155 186,931 1984
33 79 346 28,001 2,933 154,448 109,445 295,173
1985
23 51 20 2,610 725 66,517 77,537 147,409 1986
18 29 42 9,987 321 31,231 30,653 72,234
1987
6 9 19 482 95 808 8,388 9,792 1988
16 45 130 3,956 1,587 80,939 63,211 149,823
1989
25 54 58 42,247 1,121 198,917 5,121 247,464 1990
69 131 503 80,954 15,980 47,534 34,415 179,386
1991
39 71 175 13,959 529 18,660 4,380 37,703 1992
6 14 4 806 20 4,810 14,832 20,472
1993
53 82 536 24,271 3,543 63,521 5,850 97,721 1994 a – – – – – – – – 1995
26 30 53 19,866 2,104 39,677 13,625 75,325
1996
25 46 73 7,864 977 19,071 4,619 32,604 1997
12 23 44 11,115 491 4,325 494 16,469
1998
20 25 210 43,062 1,520 91,150 6,516 142,458 1999
27 30 20 11,320 547 34,410 1,618 47,915
2000
26 31 14 2,830 1,356 14,476 2,689 21,365 2001
16 20 64 4,394 168 14,430 6,249 25,305
2002
12 25 69 7,813 4,263 60,850 4,092 77,087 2003
11 20 41 11,582 660 52,928 1,702 66,913
2004 b – – – – – – – – 2005
21 36 39 92,175 5,027 281,352 5,193 383,786
2006
13 15 25 37,664 2,466 69,775 8,558 118,488 2007 a – – – – – – – – 2008 b – – – – – – – – 2009
17 41 13 18,239 865 36,973 4,479 60,569
2010
16 32 836 6,081 1,381 6,998 46,720 62,016 2011
14 18 96 7,662 1,451 39,170 17,213 65,592
2012
17 35 30 28,536 837 33,311 18,785 81,499 2013
24 61 353 21,666 8,004 273,353 25,891 329,267
2014 a – – – – – – – – 2015
21 38 194 103,091 6,200 71,681 7,674 188,840
2005–2014 average 14 27 155 23,648 2,226 82,945 14,101 123,074
a No fishery. b Numbers may not be released due to state confidentiality requirements.
89
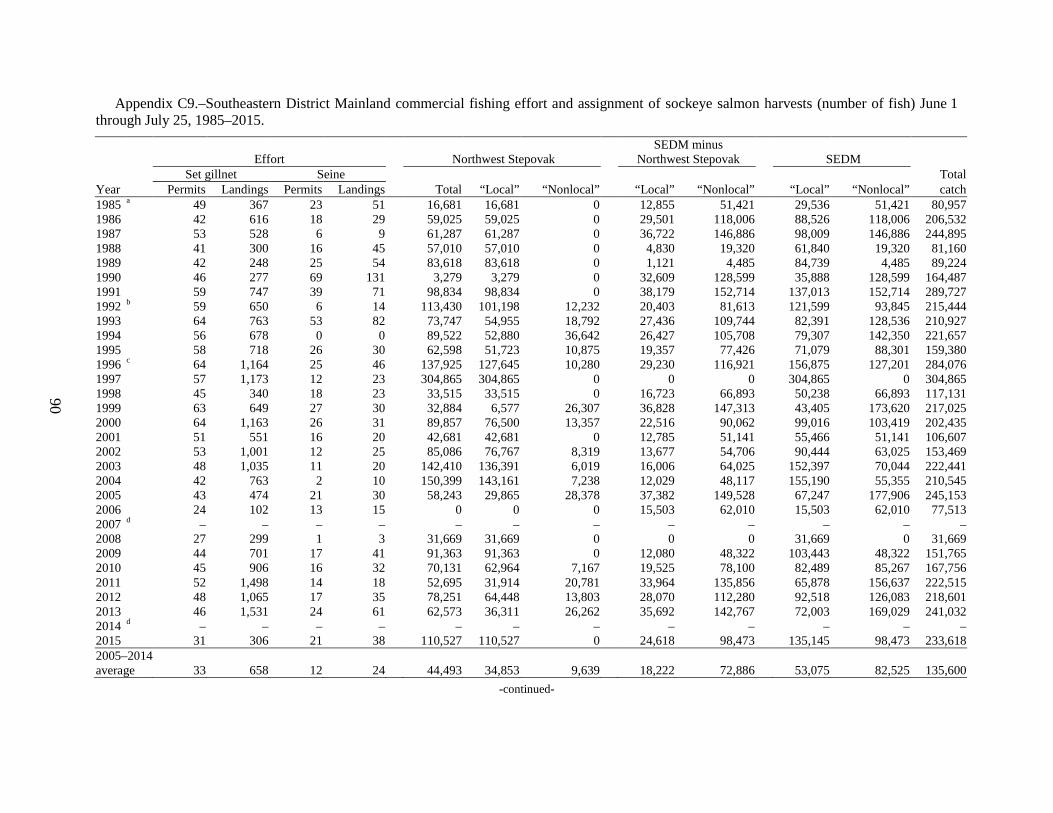
90
Appendix C9.–Southeastern District Mainland commercial fishing effort and assignment of sockeye salmon harvests (number of fish) June 1 through July 25, 1985–2015. SEDM minus
Effort
Northwest Stepovak
Northwest Stepovak
SEDM
Set gillnet Seine
Total Year Permits Landings Permits Landings Total “Local” “Nonlocal” “Local” “Nonlocal” “Local” “Nonlocal” catch 1985 a 49 367 23 51
16,681 16,681 0
12,855 51,421
29,536 51,421 80,957
1986 42 616 18 29
59,025 59,025 0
29,501 118,006
88,526 118,006 206,532 1987 53 528 6 9
61,287 61,287 0
36,722 146,886
98,009 146,886 244,895
1988 41 300 16 45
57,010 57,010 0
4,830 19,320
61,840 19,320 81,160 1989 42 248 25 54
83,618 83,618 0
1,121 4,485
84,739 4,485 89,224
1990 46 277 69 131
3,279 3,279 0
32,609 128,599
35,888 128,599 164,487 1991 59 747 39 71
98,834 98,834 0
38,179 152,714
137,013 152,714 289,727
1992 b 59 650 6 14
113,430 101,198 12,232
20,403 81,613
121,599 93,845 215,444 1993 64 763 53 82
73,747 54,955 18,792
27,436 109,744
82,391 128,536 210,927
1994 56 678 0 0
89,522 52,880 36,642
26,427 105,708
79,307 142,350 221,657 1995 58 718 26 30
62,598 51,723 10,875
19,357 77,426
71,079 88,301 159,380
1996 c 64 1,164 25 46
137,925 127,645 10,280
29,230 116,921
156,875 127,201 284,076 1997 57 1,173 12 23
304,865 304,865 0
0 0
304,865 0 304,865
1998 45 340 18 23
33,515 33,515 0
16,723 66,893
50,238 66,893 117,131 1999 63 649 27 30
32,884 6,577 26,307
36,828 147,313
43,405 173,620 217,025
2000 64 1,163 26 31
89,857 76,500 13,357
22,516 90,062
99,016 103,419 202,435 2001 51 551 16 20
42,681 42,681 0
12,785 51,141
55,466 51,141 106,607
2002 53 1,001 12 25
85,086 76,767 8,319
13,677 54,706
90,444 63,025 153,469 2003 48 1,035 11 20
142,410 136,391 6,019
16,006 64,025
152,397 70,044 222,441
2004 42 763 2 10
150,399 143,161 7,238
12,029 48,117
155,190 55,355 210,545 2005 43 474 21 30
58,243 29,865 28,378
37,382 149,528
67,247 177,906 245,153
2006 24 102 13 15
0 0 0
15,503 62,010
15,503 62,010 77,513 2007 d – – – – – – – – – – – – 2008
27 299 1 3
31,669 31,669 0
0 0
31,669 0 31,669
2009
44 701 17 41
91,363 91,363 0
12,080 48,322
103,443 48,322 151,765 2010
45 906 16 32
70,131 62,964 7,167
19,525 78,100
82,489 85,267 167,756
2011
52 1,498 14 18
52,695 31,914 20,781
33,964 135,856
65,878 156,637 222,515 2012
48 1,065 17 35
78,251 64,448 13,803
28,070 112,280
92,518 126,083 218,601
2013
46 1,531 24 61
62,573 36,311 26,262
35,692 142,767
72,003 169,029 241,032 2014 d – – – – – – – – – – – – 2015 31 306 21 38 110,527 110,527 0 24,618 98,473 135,145 98,473 233,618 2005–2014
average 33 658 12 24 44,493 34,853 9,639 18,222 72,886 53,075 82,525 135,600 -continued-
91
Appendix C9.–Page 2 of 2. a From 1970 through 1991, the Chignik contribution was 80% of the sockeye salmon harvested in the Beaver Bay, Balboa Bay, Southwest Stepovak, Stepovak
Flats, and East Stepovak sections. b From 1992 through 1995, the Chignik contribution was 80% of the sockeye salmon harvested in the Southeastern District Mainland (SEDM) fishery, except
Orzinski Bay where 100% of the sockeye salmon were considered local production. c Since 1996, the Chignik contribution is 80% of the sockeye salmon harvested in the SEDM fishery, except beginning July 1 in the Northwest Stepovak
Section where 100% of the sockeye salmon are considered local production. d No fishery.
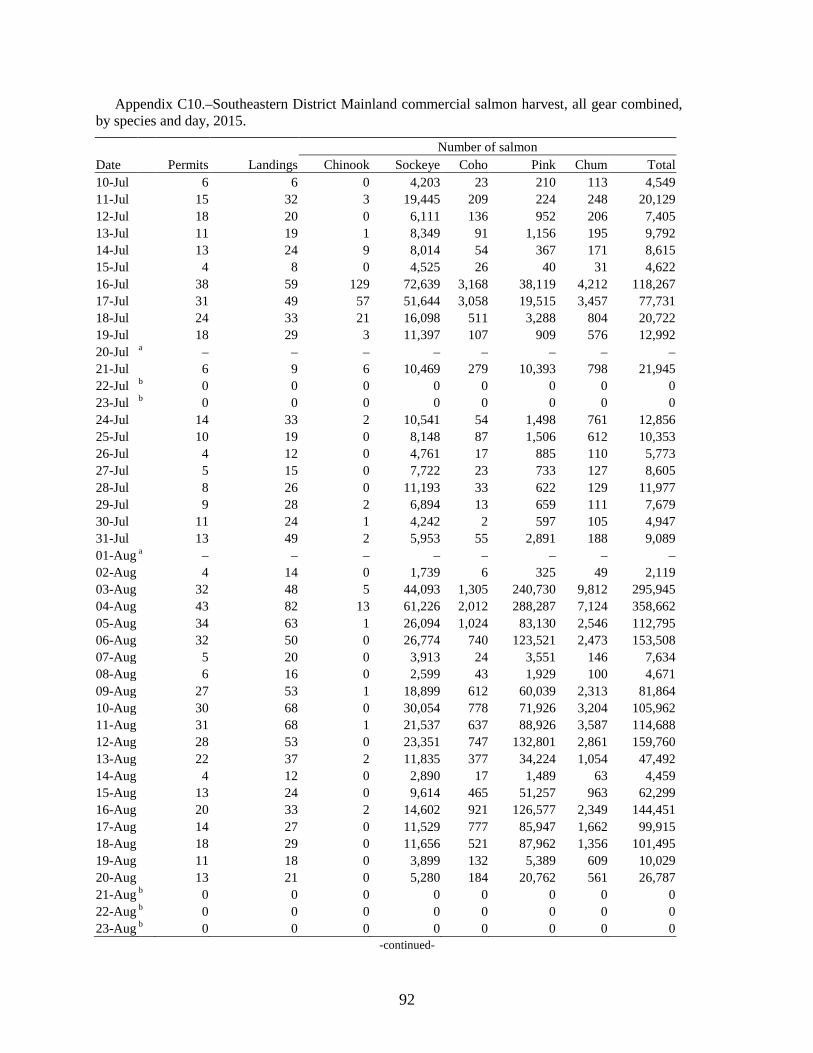
Appendix C10.–Southeastern District Mainland commercial salmon harvest, all gear combined, by species and day, 2015.
Number of salmon Date Permits Landings Chinook Sockeye Coho Pink Chum Total 10-Jul
6 6 0 4,203 23 210 113 4,549
11-Jul
15 32 3 19,445 209 224 248 20,129 12-Jul
18 20 0 6,111 136 952 206 7,405
13-Jul
11 19 1 8,349 91 1,156 195 9,792 14-Jul
13 24 9 8,014 54 367 171 8,615
15-Jul
4 8 0 4,525 26 40 31 4,622 16-Jul
38 59 129 72,639 3,168 38,119 4,212 118,267
17-Jul
31 49 57 51,644 3,058 19,515 3,457 77,731 18-Jul
24 33 21 16,098 511 3,288 804 20,722
19-Jul
18 29 3 11,397 107 909 576 12,992 20-Jul a – – – – – – – – 21-Jul
6 9 6 10,469 279 10,393 798 21,945
22-Jul b 0 0 0 0 0 0 0 0 23-Jul b 0 0 0 0 0 0 0 0 24-Jul
14 33 2 10,541 54 1,498 761 12,856
25-Jul
10 19 0 8,148 87 1,506 612 10,353 26-Jul
4 12 0 4,761 17 885 110 5,773
27-Jul
5 15 0 7,722 23 733 127 8,605 28-Jul
8 26 0 11,193 33 622 129 11,977
29-Jul
9 28 2 6,894 13 659 111 7,679 30-Jul
11 24 1 4,242 2 597 105 4,947
31-Jul
13 49 2 5,953 55 2,891 188 9,089 01-Aug a – – – – – – – – 02-Aug
4 14 0 1,739 6 325 49 2,119
03-Aug
32 48 5 44,093 1,305 240,730 9,812 295,945 04-Aug
43 82 13 61,226 2,012 288,287 7,124 358,662
05-Aug
34 63 1 26,094 1,024 83,130 2,546 112,795 06-Aug
32 50 0 26,774 740 123,521 2,473 153,508
07-Aug
5 20 0 3,913 24 3,551 146 7,634 08-Aug
6 16 0 2,599 43 1,929 100 4,671
09-Aug
27 53 1 18,899 612 60,039 2,313 81,864 10-Aug
30 68 0 30,054 778 71,926 3,204 105,962
11-Aug
31 68 1 21,537 637 88,926 3,587 114,688 12-Aug
28 53 0 23,351 747 132,801 2,861 159,760
13-Aug
22 37 2 11,835 377 34,224 1,054 47,492 14-Aug
4 12 0 2,890 17 1,489 63 4,459
15-Aug
13 24 0 9,614 465 51,257 963 62,299 16-Aug
20 33 2 14,602 921 126,577 2,349 144,451
17-Aug
14 27 0 11,529 777 85,947 1,662 99,915 18-Aug
18 29 0 11,656 521 87,962 1,356 101,495
19-Aug
11 18 0 3,899 132 5,389 609 10,029 20-Aug
13 21 0 5,280 184 20,762 561 26,787
21-Aug b 0 0 0 0 0 0 0 0 22-Aug b 0 0 0 0 0 0 0 0 23-Aug b 0 0 0 0 0 0 0 0
-continued-
92
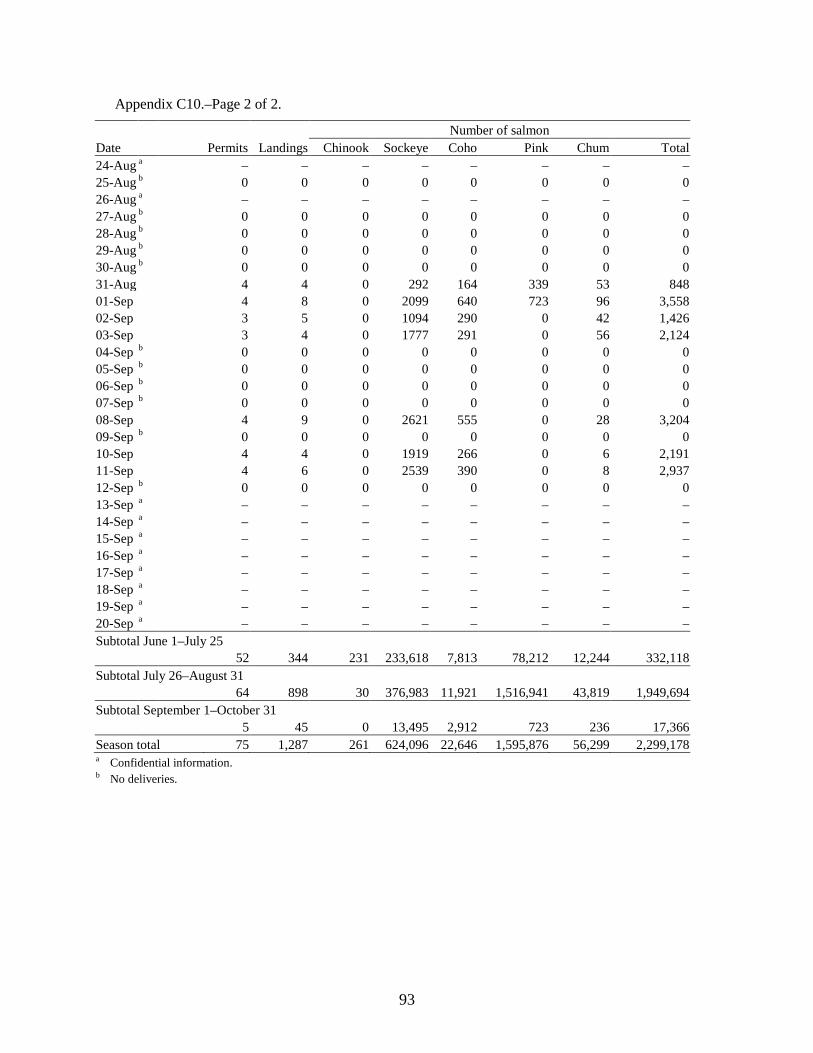
Appendix C10.–Page 2 of 2.
Number of salmon Date Permits Landings Chinook Sockeye Coho Pink Chum Total 24-Aug a – – – – – – – – 25-Aug b 0 0 0 0 0 0 0 0 26-Aug a – – – – – – – – 27-Aug b 0 0 0 0 0 0 0 0 28-Aug b 0 0 0 0 0 0 0 0 29-Aug b 0 0 0 0 0 0 0 0 30-Aug b 0 0 0 0 0 0 0 0 31-Aug
4 4 0 292 164 339 53 848
01-Sep
4 8 0 2099 640 723 96 3,558 02-Sep
3 5 0 1094 290 0 42 1,426
03-Sep
3 4 0 1777 291 0 56 2,124 04-Sep b 0 0 0 0 0 0 0 0 05-Sep b 0 0 0 0 0 0 0 0 06-Sep b 0 0 0 0 0 0 0 0 07-Sep b 0 0 0 0 0 0 0 0 08-Sep
4 9 0 2621 555 0 28 3,204
09-Sep b 0 0 0 0 0 0 0 0 10-Sep
4 4 0 1919 266 0 6 2,191
11-Sep
4 6 0 2539 390 0 8 2,937 12-Sep b 0 0 0 0 0 0 0 0 13-Sep a – – – – – – – – 14-Sep a – – – – – – – – 15-Sep a – – – – – – – – 16-Sep a – – – – – – – – 17-Sep a – – – – – – – – 18-Sep a – – – – – – – – 19-Sep a – – – – – – – – 20-Sep a – – – – – – – – Subtotal June 1–July 25 52 344 231 233,618 7,813 78,212 12,244 332,118 Subtotal July 26–August 31
64 898 30 376,983 11,921 1,516,941 43,819 1,949,694 Subtotal September 1–October 31
5 45 0 13,495 2,912 723 236 17,366 Season total 75 1,287 261 624,096 22,646 1,595,876 56,299 2,299,178 a Confidential information. b No deliveries.
93
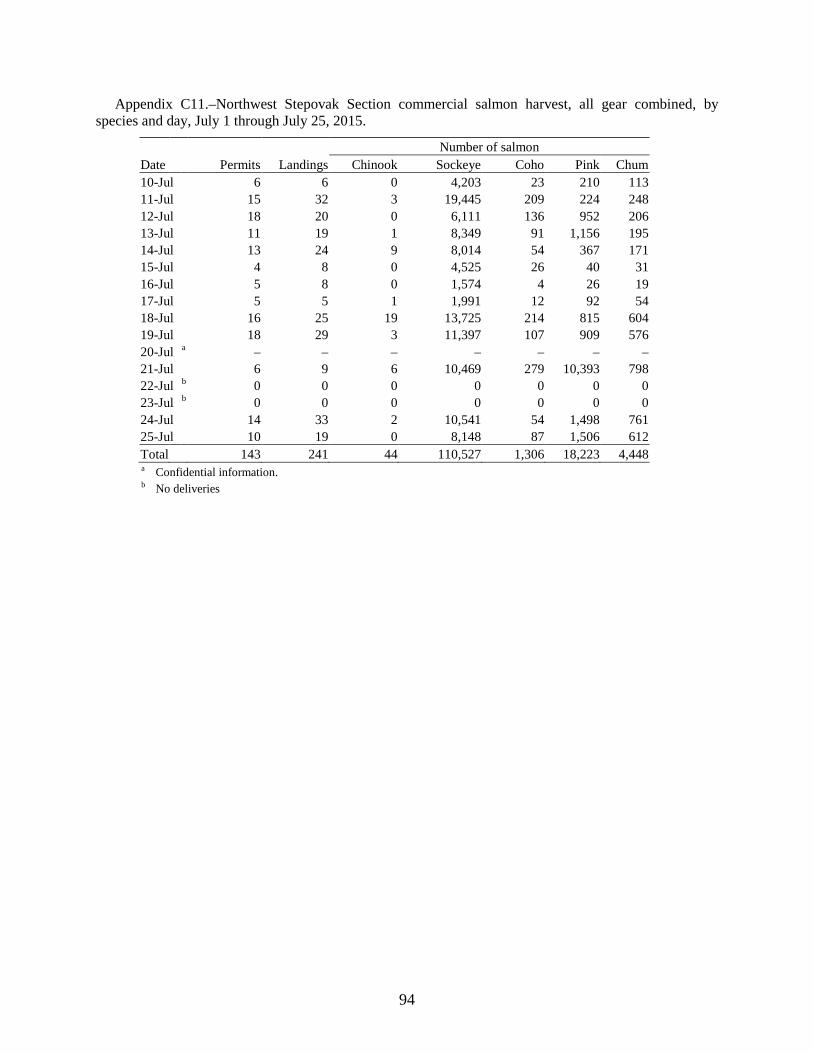
Appendix C11.–Northwest Stepovak Section commercial salmon harvest, all gear combined, by species and day, July 1 through July 25, 2015.
Number of salmon Date Permits Landings Chinook Sockeye Coho Pink Chum 10-Jul
6 6 0 4,203 23 210 113
11-Jul
15 32 3 19,445 209 224 248 12-Jul
18 20 0 6,111 136 952 206
13-Jul
11 19 1 8,349 91 1,156 195 14-Jul
13 24 9 8,014 54 367 171
15-Jul
4 8 0 4,525 26 40 31 16-Jul
5 8 0 1,574 4 26 19
17-Jul
5 5 1 1,991 12 92 54 18-Jul
16 25 19 13,725 214 815 604
19-Jul
18 29 3 11,397 107 909 576 20-Jul a – – – – – – – 21-Jul
6 9 6 10,469 279 10,393 798
22-Jul b 0 0 0 0 0 0 0 23-Jul b 0 0 0 0 0 0 0 24-Jul
14 33 2 10,541 54 1,498 761
25-Jul
10 19 0 8,148 87 1,506 612 Total 143 241 44 110,527 1,306 18,223 4,448 a Confidential information. b No deliveries
94
APPENDIX D. SOUTH ALASKA PENINSULA POST-JUNE
FISHERIES
95
Appendix D1.–South Alaska Peninsula post-June commercial salmon fishery regulatory history.
Before 1974, post-June South Alaska Peninsula fisheries were generally open 5 days per week, with a total season closure on August 10 to provide adequate local escapement and maintain product quality (McCullough 1995). During 1974 and 1975, the fishery was severely restricted to rebuild pink salmon runs. From about 1976 to 1991, the salmon fishery was managed by emergency order based on local stock run strength. Fishing periods from July 6 to about July 18 were based on chum salmon run strength, and from July 18 to about August 20 on pink salmon run strength. Fishing continued into late August during years of strong pink or chum salmon runs. Before 1992, South Alaska Peninsula waters east of the Cape Lutke Section (Appendix A6) were opened to commercial salmon fishing about July 6, except in the SEDM fishery. Prior to July 26, SEDM is managed on a separate management plan (5 AAC 09.360 Southeastern District Mainland Salmon Management Plan). Beginning September 1, fishing periods were established by emergency order and based on local coho salmon run strength and, to a lesser degree, on chum salmon runs.
In November 1991, the board established the Post-June Salmon Management Plan for the South Alaska Peninsula (5 AAC 09.366). This plan allowed the harvest of local stocks through July 19 in terminal fishing areas only, which included Zachary Bay, northern portion of Pavlof Bay, and Canoe Bay, Cold Bay, Thin Point, and Morzhovoi Bay sections, closing the remainder of the South Alaska Peninsula formerly opened in July. The board decision was partially based on allowing the harvest of local pink and chum salmon stocks to be caught in terminal areas early in the season without sacrificing product quality, while simultaneously allowing nonlocal salmon to pass through South Alaska Peninsula waters. After July 19, the board concluded that South Alaska Peninsula fishermen needed to harvest pink salmon in their traditional cape fishing areas to maintain product quality and to better accommodate the available processing capacity. Under this plan, commercial salmon fishing from July 6–19 was restricted to terminal fishing areas opened by emergency order, and was based on local stock run strength as determined by harvests and escapements. (Appendix D2). From July 20, through the remainder of the commercial salmon season, the entire South Alaska Peninsula could be opened to commercial salmon fishing by emergency order if warranted by local run stock strength (except in the SEDM fishery through July 25; 5 AAC 09.366)
The Stepovak-Shumagin Setnet Association sued the board in early 1992, to stop the implementation of the Post-June Salmon Management Plan for the South Alaska Peninsula (5 AAC 09.366). On July 10, 1992, Alaska State Superior Court Judge Hopwood (Third Judicial District, Kodiak) granted an injunction staying implementation of the new management plan. On July 13, traditional commercial salmon fishing periods resumed, and additional fishing time was provided as conditions warranted (Shaul et al. 1993).
In March 1993, the Alaska State Superior Court reconsidered the 1992 injunction. After reconsideration, the court agreed with the board and the Post-June Salmon Management Plan was reinstated. The Post-June South Alaska Peninsula Management Plan was in effect from 1993 to 1997.
-continued-
96
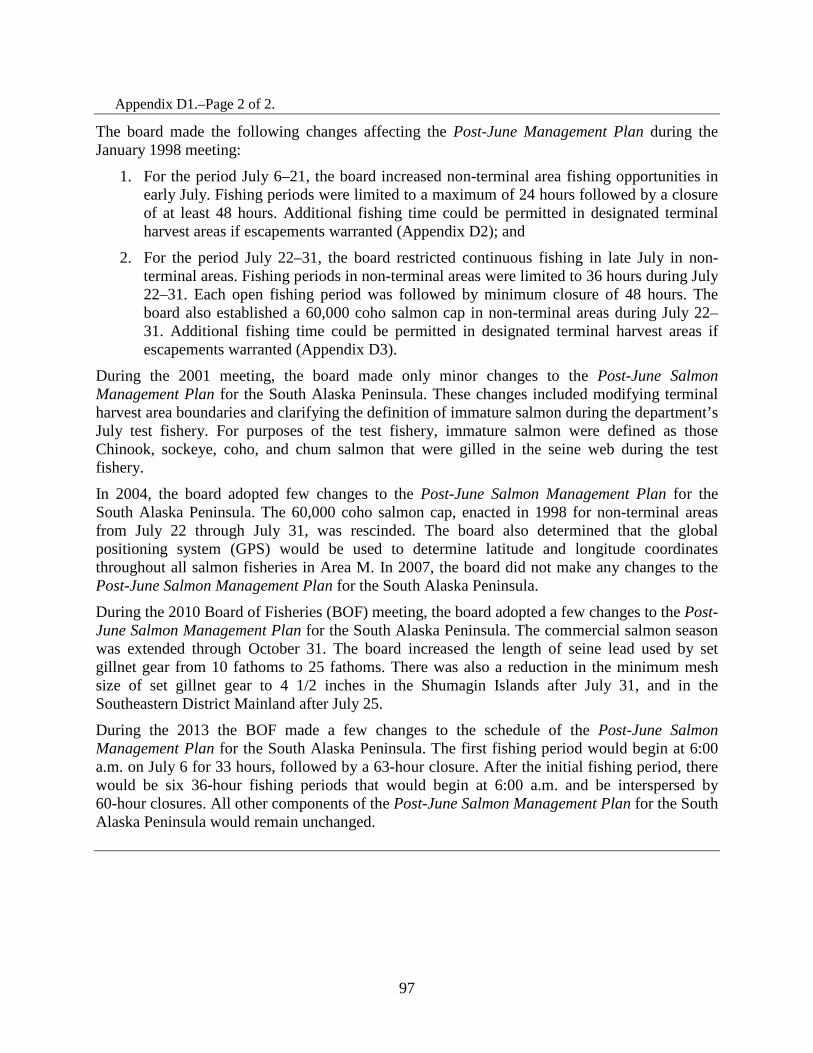
Appendix D1.–Page 2 of 2.
The board made the following changes affecting the Post-June Management Plan during the January 1998 meeting:
1. For the period July 6–21, the board increased non-terminal area fishing opportunities in early July. Fishing periods were limited to a maximum of 24 hours followed by a closure of at least 48 hours. Additional fishing time could be permitted in designated terminal harvest areas if escapements warranted (Appendix D2); and
2. For the period July 22–31, the board restricted continuous fishing in late July in non-terminal areas. Fishing periods in non-terminal areas were limited to 36 hours during July 22–31. Each open fishing period was followed by minimum closure of 48 hours. The board also established a 60,000 coho salmon cap in non-terminal areas during July 22–31. Additional fishing time could be permitted in designated terminal harvest areas if escapements warranted (Appendix D3).
During the 2001 meeting, the board made only minor changes to the Post-June Salmon Management Plan for the South Alaska Peninsula. These changes included modifying terminal harvest area boundaries and clarifying the definition of immature salmon during the department’s July test fishery. For purposes of the test fishery, immature salmon were defined as those Chinook, sockeye, coho, and chum salmon that were gilled in the seine web during the test fishery.
In 2004, the board adopted few changes to the Post-June Salmon Management Plan for the South Alaska Peninsula. The 60,000 coho salmon cap, enacted in 1998 for non-terminal areas from July 22 through July 31, was rescinded. The board also determined that the global positioning system (GPS) would be used to determine latitude and longitude coordinates throughout all salmon fisheries in Area M. In 2007, the board did not make any changes to the Post-June Salmon Management Plan for the South Alaska Peninsula.
During the 2010 Board of Fisheries (BOF) meeting, the board adopted a few changes to the Post-June Salmon Management Plan for the South Alaska Peninsula. The commercial salmon season was extended through October 31. The board increased the length of seine lead used by set gillnet gear from 10 fathoms to 25 fathoms. There was also a reduction in the minimum mesh size of set gillnet gear to 4 1/2 inches in the Shumagin Islands after July 31, and in the Southeastern District Mainland after July 25.
During the 2013 the BOF made a few changes to the schedule of the Post-June Salmon Management Plan for the South Alaska Peninsula. The first fishing period would begin at 6:00 a.m. on July 6 for 33 hours, followed by a 63-hour closure. After the initial fishing period, there would be six 36-hour fishing periods that would begin at 6:00 a.m. and be interspersed by 60-hour closures. All other components of the Post-June Salmon Management Plan for the South Alaska Peninsula would remain unchanged.
97
98
Appendix D2.–Map of the South Peninsula Post-June fishery with terminal areas defined during July 6–21.
99
Appendix D3.–Map of the South Peninsula Post-June fishery with terminal areas defined during July 22–31.
100
Appendix D4.–Map of Popof Island with test fishing sites defined.
101
Appendix D5.–Summary of the Shumagin Islands July salmon test fishery, 2015.
Number of sets a
Number of adult salmon
Number of immature salmon Date Chinook Sockeye Coho Pink Chum Total Chinook Sockeye Coho Chum Total
2-Jul 6
46 291 2,160 9,314 521 12,332
985 54 19 194 1,252
Avg/Set
7.7 48.5 360.0 1,552.3 86.8 2,055.3
164.2 9.0 3.2 32.3 208.7
8-Jul 7
45 396 2,019 8,407 1,851 12,718
322 87 29 254 692
Avg/Set
6.4 56.6 288.4 1,201.0 264.4 1,816.9
46.0 12.4 4.1 36.3 98.9
9-Jul 8
25 815 1,736 10,183 1,436 14,195
191 95 9 168 463
Avg/Set
3.1 101.9 217.0 1,272.9 179.5 1,774.4
23.9 11.9 1.1 21.0 57.9
Total 21 116 1,502 5,915 27,904 3,808 39,245 1,498 236 57 616 2,407 a Test fishing is standardized to purse seine gear, conducting 20-minute sets at Popof Head, Middle Set, and Red Bluff located on Popof Island.
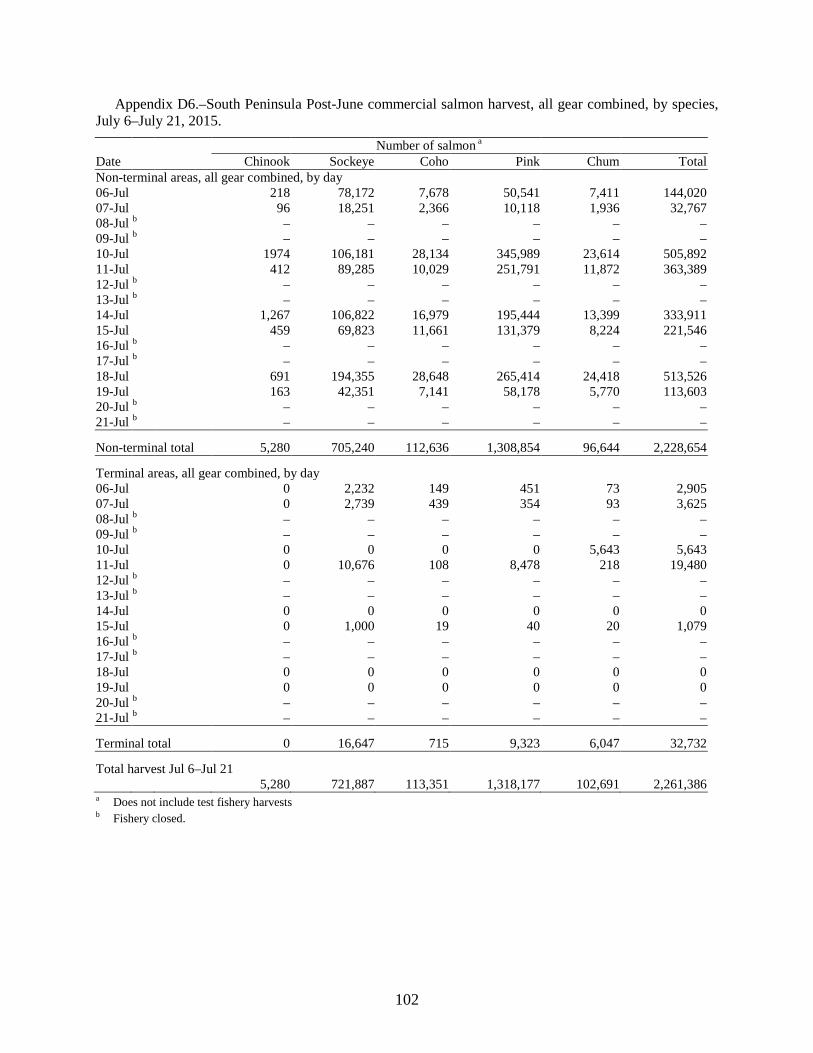
Appendix D6.–South Peninsula Post-June commercial salmon harvest, all gear combined, by species, July 6–July 21, 2015.
Number of salmon a Date Chinook Sockeye Coho Pink Chum Total Non-terminal areas, all gear combined, by day
06-Jul
218 78,172 7,678 50,541 7,411 144,020 07-Jul 96 18,251 2,366 10,118 1,936 32,767 08-Jul b – – – – – – 09-Jul b – – – – – – 10-Jul 1974 106,181 28,134 345,989 23,614 505,892 11-Jul
412 89,285 10,029 251,791 11,872 363,389
12-Jul b – – – – – – 13-Jul b – – – – – – 14-Jul
1,267 106,822 16,979 195,444 13,399 333,911
15-Jul
459 69,823 11,661 131,379 8,224 221,546 16-Jul b – – – – – – 17-Jul b – – – – – – 18-Jul
691 194,355 28,648 265,414 24,418 513,526
19-Jul 163 42,351 7,141 58,178 5,770 113,603 20-Jul b – – – – – – 21-Jul b – – – – – –
Non-terminal total 5,280 705,240 112,636 1,308,854 96,644 2,228,654
Terminal areas, all gear combined, by day 06-Jul
0 2,232 149 451 73 2,905
07-Jul 0 2,739 439 354 93 3,625 08-Jul b – – – – – – 09-Jul b – – – – – – 10-Jul 0 0 0 0 5,643 5,643 11-Jul
0 10,676 108 8,478 218 19,480
12-Jul b – – – – – – 13-Jul b – – – – – – 14-Jul
0 0 0 0 0 0
15-Jul
0 1,000 19 40 20 1,079 16-Jul b – – – – – – 17-Jul b – – – – – – 18-Jul
0 0 0 0 0 0
19-Jul 0 0 0 0 0 0 20-Jul b – – – – – – 21-Jul b – – – – – –
Terminal total 0 16,647 715 9,323 6,047 32,732
Total harvest Jul 6–Jul 21 5,280 721,887 113,351 1,318,177 102,691 2,261,386
a Does not include test fishery harvests b Fishery closed.
102
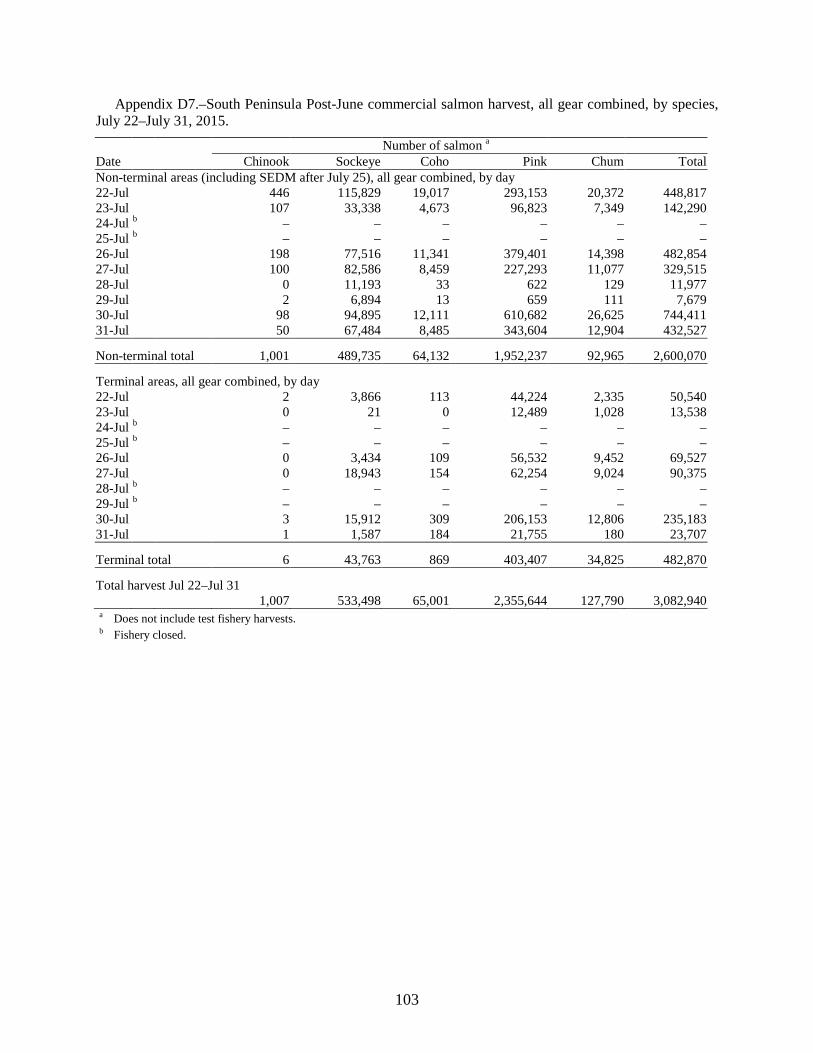
Appendix D7.–South Peninsula Post-June commercial salmon harvest, all gear combined, by species, July 22–July 31, 2015.
Number of salmon a Date Chinook Sockeye Coho Pink Chum Total Non-terminal areas (including SEDM after July 25), all gear combined, by day 22-Jul
446 115,829 19,017 293,153 20,372 448,817
23-Jul
107 33,338 4,673 96,823 7,349 142,290 24-Jul b – – – – – – 25-Jul b – – – – – – 26-Jul 198 77,516 11,341 379,401 14,398 482,854 27-Jul
100 82,586 8,459 227,293 11,077 329,515
28-Jul 0 11,193 33 622 129 11,977 29-Jul 2 6,894 13 659 111 7,679 30-Jul
98 94,895 12,111 610,682 26,625 744,411
31-Jul 50 67,484 8,485 343,604 12,904 432,527
Non-terminal total 1,001 489,735 64,132 1,952,237 92,965 2,600,070
Terminal areas, all gear combined, by day 22-Jul 2 3,866 113 44,224 2,335 50,540
23-Jul
0 21 0 12,489 1,028 13,538 24-Jul b
– – – – – –
25-Jul b – – – – – – 26-Jul
0 3,434 109 56,532 9,452 69,527
27-Jul
0 18,943 154 62,254 9,024 90,375 28-Jul b
– – – – – –
29-Jul b – – – – – – 30-Jul
3 15,912 309 206,153 12,806 235,183
31-Jul 1 1,587 184 21,755 180 23,707
Terminal total 6 43,763 869 403,407 34,825 482,870
Total harvest Jul 22–Jul 31 1,007 533,498 65,001 2,355,644 127,790 3,082,940
a Does not include test fishery harvests. b Fishery closed.
103
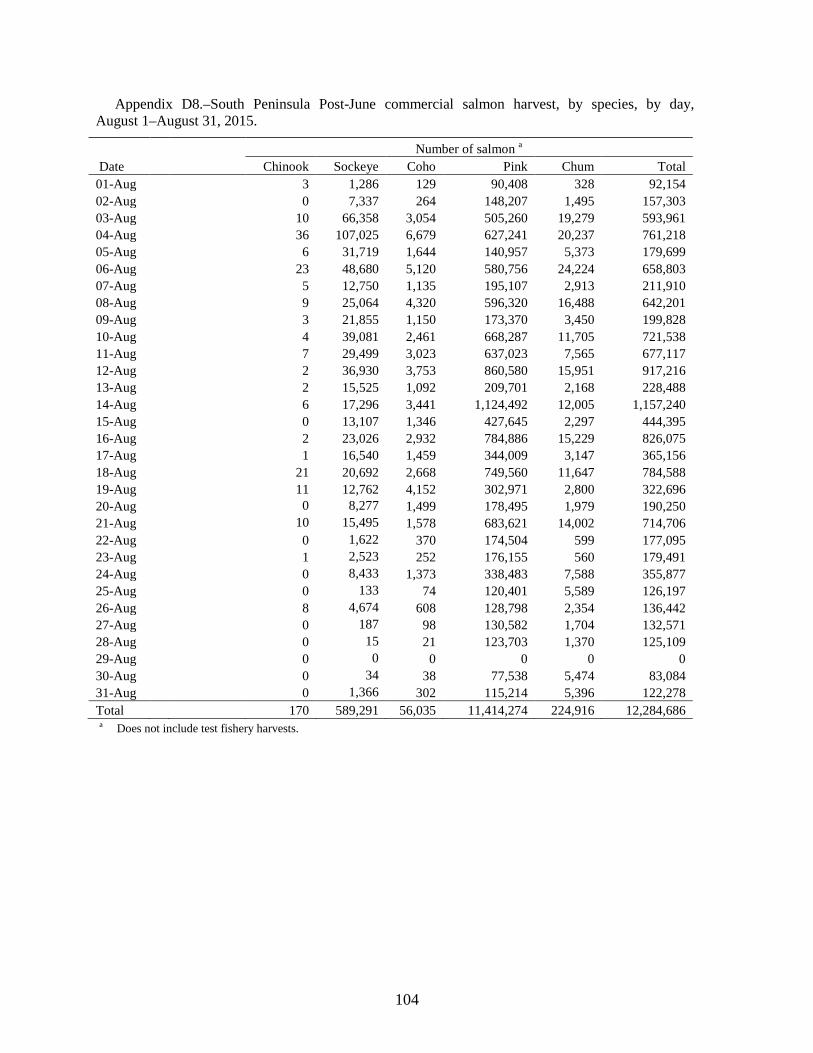
Appendix D8.–South Peninsula Post-June commercial salmon harvest, by species, by day, August 1–August 31, 2015.
Number of salmon a Date Chinook Sockeye Coho Pink Chum Total 01-Aug
3 1,286 129 90,408 328 92,154
02-Aug
0 7,337 264 148,207 1,495 157,303 03-Aug
10 66,358 3,054 505,260 19,279 593,961
04-Aug
36 107,025 6,679 627,241 20,237 761,218 05-Aug
6 31,719 1,644 140,957 5,373 179,699
06-Aug
23 48,680 5,120 580,756 24,224 658,803 07-Aug
5 12,750 1,135 195,107 2,913 211,910
08-Aug
9 25,064 4,320 596,320 16,488 642,201 09-Aug
3 21,855 1,150 173,370 3,450 199,828
10-Aug
4 39,081 2,461 668,287 11,705 721,538 11-Aug
7 29,499 3,023 637,023 7,565 677,117
12-Aug
2 36,930 3,753 860,580 15,951 917,216 13-Aug
2 15,525 1,092 209,701 2,168 228,488
14-Aug
6 17,296 3,441 1,124,492 12,005 1,157,240 15-Aug
0 13,107 1,346 427,645 2,297 444,395
16-Aug
2 23,026 2,932 784,886 15,229 826,075 17-Aug
1 16,540 1,459 344,009 3,147 365,156
18-Aug
21 20,692 2,668 749,560 11,647 784,588 19-Aug
11 12,762 4,152 302,971 2,800 322,696
20-Aug
0 8,277 1,499 178,495 1,979 190,250 21-Aug
10 15,495 1,578 683,621 14,002 714,706
22-Aug
0 1,622 370 174,504 599 177,095 23-Aug
1 2,523 252 176,155 560 179,491
24-Aug
0 8,433 1,373 338,483 7,588 355,877 25-Aug
0 133 74 120,401 5,589 126,197
26-Aug
8 4,674 608 128,798 2,354 136,442 27-Aug
0 187 98 130,582 1,704 132,571
28-Aug
0 15 21 123,703 1,370 125,109 29-Aug
0 0 0 0 0 0
30-Aug
0 34 38 77,538 5,474 83,084 31-Aug
0 1,366 302 115,214 5,396 122,278
Total 170 589,291 56,035 11,414,274 224,916 12,284,686 a Does not include test fishery harvests.
104
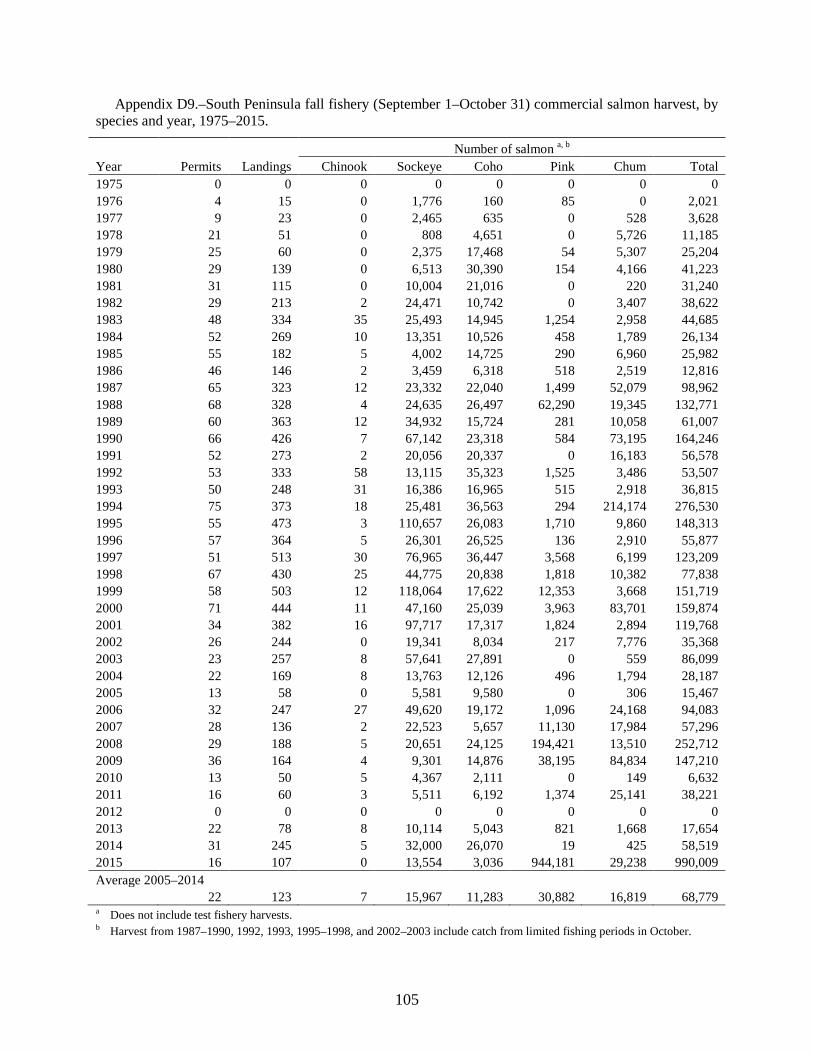
Appendix D9.–South Peninsula fall fishery (September 1–October 31) commercial salmon harvest, by species and year, 1975–2015.
Number of salmon a, b Year Permits Landings Chinook Sockeye Coho Pink Chum Total 1975 0 0 0 0 0 0 0 0 1976 4 15 0 1,776 160 85 0 2,021 1977 9 23 0 2,465 635 0 528 3,628 1978 21 51 0 808 4,651 0 5,726 11,185 1979 25 60 0 2,375 17,468 54 5,307 25,204 1980 29 139 0 6,513 30,390 154 4,166 41,223 1981 31 115 0 10,004 21,016 0 220 31,240 1982 29 213 2 24,471 10,742 0 3,407 38,622 1983 48 334 35 25,493 14,945 1,254 2,958 44,685 1984 52 269 10 13,351 10,526 458 1,789 26,134 1985 55 182 5 4,002 14,725 290 6,960 25,982 1986 46 146 2 3,459 6,318 518 2,519 12,816 1987 65 323 12 23,332 22,040 1,499 52,079 98,962 1988 68 328 4 24,635 26,497 62,290 19,345 132,771 1989 60 363 12 34,932 15,724 281 10,058 61,007 1990 66 426 7 67,142 23,318 584 73,195 164,246 1991 52 273 2 20,056 20,337 0 16,183 56,578 1992 53 333 58 13,115 35,323 1,525 3,486 53,507 1993 50 248 31 16,386 16,965 515 2,918 36,815 1994 75 373 18 25,481 36,563 294 214,174 276,530 1995 55 473 3 110,657 26,083 1,710 9,860 148,313 1996 57 364 5 26,301 26,525 136 2,910 55,877 1997 51 513 30 76,965 36,447 3,568 6,199 123,209 1998 67 430 25 44,775 20,838 1,818 10,382 77,838 1999 58 503 12 118,064 17,622 12,353 3,668 151,719 2000 71 444 11 47,160 25,039 3,963 83,701 159,874 2001 34 382 16 97,717 17,317 1,824 2,894 119,768 2002 26 244 0 19,341 8,034 217 7,776 35,368 2003 23 257 8 57,641 27,891 0 559 86,099 2004 22 169 8 13,763 12,126 496 1,794 28,187 2005 13 58 0 5,581 9,580 0 306 15,467 2006 32 247 27 49,620 19,172 1,096 24,168 94,083 2007 28 136 2 22,523 5,657 11,130 17,984 57,296 2008 29 188 5 20,651 24,125 194,421 13,510 252,712 2009 36 164 4 9,301 14,876 38,195 84,834 147,210 2010 13 50 5 4,367 2,111 0 149 6,632 2011 16 60 3 5,511 6,192 1,374 25,141 38,221 2012 0 0 0 0 0 0 0 0 2013 22 78 8 10,114 5,043 821 1,668 17,654 2014 31 245 5 32,000 26,070 19 425 58,519 2015 16 107 0 13,554 3,036 944,181 29,238 990,009 Average 2005–2014
22 123 7 15,967 11,283 30,882 16,819 68,779 a Does not include test fishery harvests. b Harvest from 1987–1990, 1992, 1993, 1995–1998, and 2002–2003 include catch from limited fishing periods in October.
105
Appendix D10.–South Peninsula (minus the Southeastern District Mainland fishery July 1–July 25) Post-June (July 1–October 31) commercial salmon harvest, by species and year, 1975–2015.
Number of salmon a,b Year Permits Landings Chinook Sockeye Coho Pink Chum Total 1975 46 65 0 293 3 52,375 29,158 81,829 1976 125 1,102 6 11,674 176 2,324,547 116,355 2,452,758 1977 103 1,131 7 26,545 1,168 1,425,107 119,646 1,572,473 1978 123 2,081 203 61,379 60,417 5,467,134 408,544 5,997,677 1979 165 2,446 972 209,755 350,770 6,365,911 371,358 7,298,766 1980 152 2,646 1,522 310,278 271,738 6,295,345 785,026 7,663,909 1981 167 2,502 4,190 218,667 158,846 4,564,926 1,033,055 5,979,684 1982 182 2,781 2,313 140,487 252,885 4,806,182 1,042,978 6,244,845 1983 201 2,667 11,726 292,536 124,431 2,760,452 816,567 4,005,712 1984 217 3,525 4,290 334,781 306,522 10,469,392 1,176,050 12,291,035 1985 213 2,787 688 272,059 169,137 4,249,809 827,781 5,519,474 1986 202 3,001 3,475 545,160 235,082 3,698,727 1,346,879 5,829,323 1987 233 2,692 3,881 410,755 224,543 1,189,211 911,414 2,739,804 1988 243 4,356 6,797 635,804 502,960 6,767,066 1,307,053 9,219,680 1989 274 3,993 4,106 825,372 440,171 6,879,878 531,759 8,681,286 1990 261 3,257 5,480 875,237 288,728 2,299,161 672,937 4,141,543 1991 234 3,573 2,423 465,874 311,825 9,952,671 788,955 11,521,748 1992 234 3,919 4,096 767,735 418,065 9,111,099 867,944 11,168,939 1993 221 3,089 3,768 499,624 214,667 9,768,653 505,720 10,992,432 1994 214 3,309 1,741 409,303 253,285 6,648,561 1,593,751 8,906,641 1995 207 3,823 2,128 734,744 255,908 16,079,640 1,158,417 18,230,837 1996 178 1,962 2,075 216,234 276,193 1,744,707 381,522 2,620,731 1997 165 1,355 1,204 310,481 109,950 1,681,374 277,559 2,380,568 1998 210 3,971 1,793 763,810 150,693 7,442,498 456,456 8,815,250 1999 185 4,211 1,612 1,368,315 191,603 8,382,239 567,950 10,511,719 2000 180 2,897 2,088 532,467 249,973 3,135,286 790,817 4,710,631 2001 175 2,436 2,098 356,841 212,936 3,939,910 834,453 5,346,238 2002 112 1,556 3,411 290,606 197,323 1,950,760 421,461 2,863,561 2003 102 1,673 1,079 377,805 128,620 3,910,916 342,595 4,761,015 2004 103 1,629 2,238 641,326 230,443 6,248,298 301,972 7,424,277 2005 111 2,090 1,335 1,087,549 135,668 7,449,031 301,997 8,975,580 2006 116 2,392 886 840,225 164,186 2,851,820 864,720 4,721,837 2007 116 2,648 676 848,832 149,322 7,031,802 382,248 8,412,880 2008 134 2,653 1,380 493,966 224,976 10,704,645 385,333 11,810,300 2009 124 2,228 1,891 404,346 246,350 5,591,664 968,314 7,212,565 2010 139 1,165 3,848 287,491 161,698 486,748 444,245 1,384,030 2011 167 1,823 3,348 334,883 151,009 4,221,915 502,924 5,214,079 2012 181 1,113 1,197 253,841 90,619 186,045 195,880 727,582 2013 198 2,685 3,767 436,059 275,885 7,162,950 510,111 8,388,772 2014 156 1,811 4,990 767,167 294,341 540,949 111,788 1,719,235 2015 155 3,115 6,457 1,858,238 237,646 16,032,286 484,644 18,619,271 Average 2005–2014
144 2,061 2,332 575,436 189,405 4,622,757 466,756 5,856,686 a Does not include test fishery harvests. b Harvest from 1987–1990, 1992, 1993, 1995, and 2002–2003 include catch from limited fishing periods in October.
106
Appendix D11.–South Peninsula (including the Southeastern District Mainland fishery) Post-June (July 1–October 31) commercial salmon harvest, by species and year, 1975–2015.
Number of salmon a,b Year Permits Landings Chinook Sockeye Coho Pink Chum Total 1975 46 90 0 3,449 66 55,395 29,928 88,838 1976 125 1,181 14 20,707 213 2,342,600 121,282 2,484,816 1977 103 1,315 35 60,669 2,108 1,443,245 126,762 1,632,819 1978 123 2,187 222 74,839 60,771 5,500,177 423,532 6,059,541 1979 165 2,699 1,049 283,352 356,562 6,409,584 378,712 7,429,259 1980 152 2,948 1,569 371,638 273,328 6,335,159 843,988 7,825,682 1981 168 2,940 4,415 316,945 161,899 4,581,643 1,201,454 6,266,356 1982 183 3,361 2,566 177,160 254,798 5,016,065 1,171,508 6,622,097 1983 210 3,210 12,833 522,913 127,157 2,771,744 917,198 4,351,845 1984 217 4,251 4,913 525,275 310,910 10,668,889 1,312,347 12,822,334 1985 213 2,970 724 294,782 170,046 4,323,885 912,580 5,702,017 1986 202 3,444 3,586 687,525 235,852 3,739,423 1,394,332 6,060,718 1987 233 2,926 3,935 463,090 224,740 1,191,512 929,782 2,813,059 1988 243 4,701 7,011 716,964 505,278 6,864,600 1,381,796 9,475,649 1989 274 4,185 4,225 909,393 441,397 7,089,895 538,177 8,983,087 1990 261 3,663 6,164 1,039,265 305,509 2,346,043 715,940 4,412,921 1991 234 3,889 2,807 570,688 313,210 9,977,423 797,890 11,662,018 1992 234 4,329 4,133 872,847 418,189 9,126,950 884,505 11,306,624 1993 222 3,686 4,545 641,103 218,871 9,846,906 514,405 11,225,830 1994 214 3,745 1,825 542,322 254,298 6,657,000 1,596,247 9,051,692 1995 208 4,227 2,197 827,772 258,131 16,132,189 1,175,556 18,395,845 1996 180 2,821 2,285 392,551 280,033 1,816,358 413,525 2,904,752 1997 168 2,550 1,350 615,228 111,334 1,697,989 283,929 2,709,830 1998 210 4,336 2,100 880,941 153,652 7,567,528 466,385 9,070,606 1999 186 4,357 1,651 1,415,509 192,498 8,425,091 572,609 10,607,358 2000 180 3,805 2,183 656,086 256,940 3,192,461 816,096 4,923,766 2001 178 3,006 2,275 461,136 214,250 3,982,130 884,593 5,544,384 2002 116 2,321 3,724 407,582 202,712 2,093,251 437,533 3,144,802 2003 106 2,492 1,289 553,301 130,852 4,039,946 353,704 5,079,092 2004 108 2,229 2,507 804,977 234,971 6,305,840 306,812 7,655,107 2005 111 2,253 1,379 1,244,326 141,692 7,754,815 309,551 9,451,763 2006 116 2,506 915 917,738 166,991 2,929,505 877,979 4,893,128 2007 116 2,648 676 848,832 149,322 7,031,802 382,248 8,412,880 2008 135 2,955 1,409 525,635 225,481 10,738,782 391,472 11,882,779 2009 127 2,968 2,011 556,111 248,349 5,651,463 983,944 7,441,878 2010 142 1,886 4,712 417,791 164,610 501,342 515,260 1,603,715 2011 175 2,589 3,595 452,133 153,291 4,268,929 541,785 5,419,733 2012 193 1,847 1,247 409,338 91,906 228,531 226,252 957,274 2013 206 3,670 4,372 572,909 293,524 7,489,200 549,535 8,909,540 2014 156 1,811 4,990 767,167 294,341 540,949 111,788 1,719,235 2015 158 3,457 6,688 2,091,848 245,236 16,110,488 496,879 18,951,139 Average 2005–2014
148 2,513 2,531 671,198 192,951 4,713,532 488,981 6,069,193 a Does not include test fishery harvests. b Harvest from 1987–1990, 1992, 1993, 1995–1998, and 2002–2003 include catch from limited openings in October.
107
Appendix D12.–South Peninsula (including Southeastern District Mainland fishery) Post-June (July 1–October 31) commercial Chinook salmon harvest by gear and year, 1975–2015.
Purse seine Drift gillnet Set gillnet Year a Number b Percent Number b Percent Number b Percent Total 1975 0 0.0
0 0.0
0 0.0
0
1976 5 35.7
1 7.1
8 57.1
14 1977 18 51.4
0 0.0
17 48.6
35
1978 204 91.9
0 0.0
18 8.1
222 1979 981 93.5
2 0.2
66 6.3
1,049
1980 1,495 95.3
0 0.0
74 4.7
1,569 1981 4,280 96.9
0 0.0
135 3.1
4,415
1982 2,294 89.4
90 3.5
182 7.1
2,566 1983 12,552 97.8
78 0.6
203 1.6
12,833
1984 4,338 88.3
161 3.3
414 8.4
4,913 1985 625 86.3
24 3.3
75 10.4
724
1986 3,395 94.7
24 0.7
167 4.7
3,586 1987 3,700 94.0
64 1.6
171 4.3
3,935
1988 6,586 93.9
142 2.0
283 4.0
7,011 1989 3,584 84.8
295 7.0
346 8.2
4,225
1990 5,605 90.9
122 2.0
437 7.1
6,164 1991 2,085 74.3
62 2.2
660 23.5
2,807
1992 3,724 92.2
47 1.2
269 6.7
4,040 1993 3,666 85.2
111 2.6
524 12.2
4,301
1994 1,321 76.5
25 1.4
380 22.0
1,726 1995 1,556 74.8
34 1.6
489 23.5
2,079
1996 1,839 86.6
28 1.3
257 12.1
2,124 1997 1,161 86.0
18 1.3
171 12.7
1,350
1998 1,768 84.2
18 0.9
314 15.0
2,100 1999 1,367 84.4
15 0.9
237 14.6
1,619
2000 1,983 91.1
19 0.9
174 8.0
2,176 2001 1,732 88.5
19 1.0
206 10.5
1,957
2002 3,245 87.1
2 0.1
477 12.8
3,724 2003 961 74.6
7 0.5
321 24.9
1,289
2004 2,088 83.3
1 0.0
418 16.7
2,507 2005 1,296 94.0
2 0.1
81 5.9
1,379
2006 674 73.7
1 0.1
240 26.2
915 2007 570 84.3
1 0.1
105 15.5
676
2008 1,236 87.7
15 1.1
158 11.2
1,409 2009 1,819 90.5
11 0.5
181 9.0
2,011
2010 4,571 97.0
31 0.7
110 2.3
4,712 2011 3,158 87.8
123 3.4
314 8.7
3,595
2012 1,002 80.4
206 16.5
39 3.1
1,247 2013 3,665 83.8
343 7.8
364 8.3
4,372
2014 4,924 98.7
34 0.7
32 0.6
4,990 2015 6,541 97.8 26 0.4 121 1.8 6,688 Average 2005–2014
2,292 87.8 77 3.1 162 9.1 2,531 a Harvest from 1987–1990, 1992, 1993, 1995–1998, and 2002–2003 include catch from limited openings in October. b Does not include test fishery harvest.
108
Appendix D13.–South Peninsula (including Southeastern District Mainland fishery) Post-June (July 1–October 31) commercial sockeye salmon harvest by gear and year, 1975–2015.
Purse seine Drift gillnet Set gillnet Year a Number b Percent Number b Percent Number b Percent Total 1975 1,642 47.6
0 0.0
1,807 52.4
3,449
1976 9,630 46.5
2,649 12.8
8,428 40.7
20,707 1977 32,051 52.8
0 0.0
28,618 47.2
60,669
1978 57,448 76.8
0 0.0
17,391 23.2
74,839 1979 193,629 68.3
1,097 0.4
88,626 31.3
283,352
1980 260,433 70.1
398 0.1
110,807 29.8
371,638 1981 171,658 54.2
1,388 0.4
143,899 45.4
316,945
1982 92,784 52.4
13,472 7.6
70,904 40.0
177,160 1983 258,763 49.5
19,005 3.6
245,145 46.9
522,913
1984 240,959 45.9
26,698 5.1
257,618 49.0
525,275 1985 178,953 60.7
18,441 6.3
97,388 33.0
294,782
1986 412,251 60.0
30,261 4.4
245,013 35.6
687,525 1987 238,678 51.5
39,360 8.5
185,052 40.0
463,090
1988 423,852 59.1
44,657 6.2
248,455 34.7
716,964 1989 470,465 51.7
86,343 9.5
352,585 38.8
909,393
1990 524,630 50.5
132,907 12.8
381,728 36.7
1,039,265 1991 232,338 40.7
21,721 3.8
316,629 55.5
570,688
1992 443,201 50.9
44,935 5.2
382,491 43.9
870,627 1993 288,648 45.1
23,421 3.7
327,273 51.2
639,342
1994 147,337 27.2
18,134 3.4
375,637 69.4
541,108 1995 368,688 44.8
21,505 2.6
433,594 52.6
823,787
1996 80,819 20.7
5,776 1.5
304,043 77.8
390,638 1997 123,940 20.1
24,278 3.9
467,010 75.9
615,228
1998 381,734 43.4
35,569 4.0
462,960 52.6
880,263 1999 680,344 48.5
35,100 2.5
687,592 49.0
1,403,036
2000 212,658 32.5
20,587 3.1
421,287 64.4
654,532 2001 96,249 21.2
28,932 6.4
329,631 72.5
454,812
2002 118,441 29.1
15,783 3.9
273,358 67.1
407,582 2003 162,365 29.3
16,093 2.9
374,843 67.7
553,301
2004 400,982 49.8
21,452 2.7
382,543 47.5
804,977 2005 657,543 52.8
8,492 0.7
578,291 46.5
1,244,326
2006 414,302 45.1
2,702 0.3
500,734 54.6
917,738 2007 477,594 56.3
6,626 0.8
364,612 43.0
848,832
2008 321,396 61.1
12,629 2.4
191,610 36.5
525,635 2009 248,639 44.7
7,800 1.4
299,672 53.9
556,111
2010 175,804 42.1
13,877 3.3
228,110 54.6
417,791 2011 210,003 46.4
23,941 5.3
218,189 48.3
452,133
2012 168,419 41.1
56,039 13.7
184,880 45.2
409,338 2013 297,320 51.9
51,316 9.0
224,273 39.1
572,909
2014 415,107 54.1
60,662 7.9
291,398 38.0
767,167 2015 1,234,053 59.0 56,781 2.7 801,014 38.3 2,091,848 Average 2005–2014
338,613 49.6 24,408 4.5 308,177 45.9 671,198 a Harvest from 1987–1990, 1992, 1993, 1995–1998, and 2002–2003 include catch from limited openings in October. b Does not include test fishery harvest.
109
Appendix D14.–South Peninsula (including Southeastern District Mainland fishery) Post-June (July 1–October 31) commercial coho salmon harvest by gear and year, 1975–2015.
Purse seine Drift gillnet Set gillnet Year a Number b Percent Number b Percent Number b Percent Total 1975 37 56.1
0 0.0
29 43.9
66
1976 53 24.9
0 0.0
160 75.1
213 1977 1,034 49.1
0 0.0
1,074 50.9
2,108
1978 57,842 95.2
0 0.0
2,929 4.8
60,771 1979 346,021 97.0
33 0.0
10,508 2.9
356,562
1980 249,602 91.3
0 0.0
23,726 8.7
273,328 1981 155,653 96.1
10 0.0
6,236 3.9
161,899
1982 219,462 86.1
19,202 7.5
16,134 6.3
254,798 1983 109,822 86.4
3,658 2.9
13,677 10.8
127,157
1984 247,342 79.6
37,805 12.2
25,763 8.3
310,910 1985 128,931 75.8
18,033 10.6
23,082 13.6
170,046
1986 203,505 86.3
18,901 8.0
13,446 5.7
235,852 1987 169,763 75.5
30,445 13.5
24,532 10.9
224,740
1988 389,723 77.1
75,445 14.9
40,110 7.9
505,278 1989 305,558 69.2
88,376 20.0
47,463 10.8
441,397
1990 224,354 73.4
42,659 14.0
38,496 12.6
305,509 1991 199,104 63.6
51,215 16.4
62,891 20.1
313,210
1992 294,100 70.9
58,621 14.1
62,184 15.0
414,905 1993 148,565 69.4
26,364 12.3
39,050 18.2
213,979
1994 161,903 64.7
24,980 10.0
63,196 25.3
250,079 1995 185,974 73.1
26,020 10.2
42,477 16.7
254,471
1996 197,800 74.0
22,561 8.4
47,017 17.6
267,378 1997 47,254 42.4
19,855 17.8
44,225 39.7
111,334
1998 83,205 54.2
30,219 19.7
40,204 26.2
153,628 1999 143,560 74.6
11,734 6.1
37,186 19.3
192,480
2000 180,030 70.1
33,632 13.1
43,179 16.8
256,841 2001 149,064 70.7
30,125 14.3
31,708 15.0
210,897
2002 165,305 81.5
11,567 5.7
25,840 12.7
202,712 2003 74,947 57.3
11,253 8.6
44,652 34.1
130,852
2004 174,961 74.5
9,115 3.9
50,895 21.7
234,971 2005 105,844 74.7
3,829 2.7
32,019 22.6
141,692
2006 120,089 71.9
2,353 1.4
44,549 26.7
166,991 2007 120,881 81.0
4,126 2.8
24,315 16.3
149,322
2008 166,130 73.7
21,815 9.7
37,536 16.6
225,481 2009 213,281 85.9
10,549 4.2
24,519 9.9
248,349
2010 143,675 87.3
10,552 6.4
10,383 6.3
164,610 2011 110,317 72.0
20,241 13.2
22,733 14.8
153,291
2012 52,121 56.7
36,106 39.3
3,679 4.0
91,906 2013 158,785 54.1
108,273 36.9
26,466 9.0
293,524
2014 195,597 66.5
59,795 20.3
38,949 13.2
294,341 2015 196,071 80.0 17,492 7.1 31,673 12.9 245,236 Average 2005–2014
138,672 72.4 27,764 13.7 26,515 13.9 192,951 a Harvest from 1987–1990, 1992, 1993, 1995–1998, and 2002–2003 include catch from limited openings in October. b Does not include test fishery harvest.
110
Appendix D15.–South Peninsula (including Southeastern District Mainland fishery) Post-June (July 1–October 31) commercial pink salmon harvest by gear and year, 1975–2015.
Purse seine Drift gillnet Set gillnet Year a Number b Percent Number b Percent Number b Percent Total 1975 54,435 98.3
0 0.0
960 1.7
55,395
1976 2,337,109 99.8
65 0.0
5,426 0.2
2,342,600 1977 1,427,176 98.9
0 0.0
16,069 1.1
1,443,245
1978 5,470,855 99.5
0 0.0
29,322 0.5
5,500,177 1979 6,310,680 98.5
12,365 0.2
86,539 1.4
6,409,584
1980 6,236,027 98.4
12 0.0
99,120 1.6
6,335,159 1981 4,461,903 97.4
7,176 0.2
112,564 2.5
4,581,643
1982 4,852,553 96.7
50,748 1.0
112,764 2.2
5,016,065 1983 2,688,187 97.0
5,586 0.2
77,971 2.8
2,771,744
1984 10,324,380 96.8
78,575 0.7
265,934 2.5
10,668,889 1985 4,096,285 94.7
21,803 0.5
205,797 4.8
4,323,885
1986 3,602,769 96.3
27,772 0.7
108,882 2.9
3,739,423 1987 1,135,252 95.3
3,025 0.3
53,235 4.5
1,191,512
1988 6,427,823 93.6
145,106 2.1
291,671 4.2
6,864,600 1989 6,641,815 93.7
85,946 1.2
362,134 5.1
7,089,895
1990 2,256,837 96.2
32,089 1.4
57,117 2.4
2,346,043 1991 9,614,533 96.4
26,740 0.3
336,150 3.4
9,977,423
1992 8,616,933 94.5
91,106 1.0
409,440 4.5
9,117,479 1993 9,494,663 96.5
12,037 0.1
337,262 3.4
9,843,962
1994 6,317,708 95.0
53,701 0.8
277,061 4.2
6,648,470 1995 15,404,768 95.5
41,868 0.3
677,097 4.2
16,123,733
1996 1,523,636 84.1
17,593 1.0
269,395 14.9
1,810,624 1997 1,627,495 95.8
14,435 0.9
56,059 3.3
1,697,989
1998 6,803,002 89.9
192,352 2.5
570,987 7.5
7,566,341 1999 8,016,735 95.3
12,045 0.1
383,971 4.6
8,412,751
2000 2,871,880 90.0
15,979 0.5
301,656 9.5
3,189,515 2001 3,629,078 91.3
20,999 0.5
322,729 8.1
3,972,806
2002 1,831,099 87.5
9,664 0.5
252,488 12.1
2,093,251 2003 3,679,093 91.1
13,377 0.3
347,476 8.6
4,039,946
2004 6,051,523 96.0
24,360 0.4
229,957 3.6
6,305,840 2005 7,386,836 95.3
6,258 0.1
361,721 4.7
7,754,815
2006 2,629,811 89.8
5,520 0.2
294,174 10.0
2,929,505 2007 6,485,719 92.2
5,134 0.1
540,949 7.7
7,031,802
2008 10,056,235 93.6
83,287 0.8
599,260 5.6
10,738,782 2009 5,350,718 94.7
47,711 0.8
253,034 4.5
5,651,463
2010 443,498 88.5
4,823 1.0
53,021 10.6
501,342 2011 4,013,553 94.0
33,045 0.8
222,331 5.2
4,268,929
2012 187,337 82.0
13,546 5.9
27,648 12.1
228,531 2013 7,192,644 96.0
81,475 1.1
215,081 2.9
7,489,200
2014 439,352 81.2
38,880 7.2
62,717 11.6
540,949 2015 15,553,122 96.5 231,340 1.4 326,026 2.0 16,110,488 Average 2005–2014
4,418,570 90.7 31,968 1.8 262,994 7.5 4,713,532 a Harvest from 1987–1990, 1992, 1993, 1995–1998, and 2002–2003 include catch from limited openings in October. b Does not include test fishery harvest.
111
Appendix D16.–South Peninsula (including Southeastern District Mainland fishery) Post-June (July 1–October 31) commercial chum salmon harvest by gear and year, 1975–2015.
Purse seine Drift gillnet Set gillnet Year a Number b Percent Number b Percent Number b Percent Total 1975 29,336 98.0
0 0.0
592 2.0
29,928
1976 118,482 97.7
1,390 1.1
1,410 1.2
121,282 1977 114,058 90.0
0 0.0
12,704 10.0
126,762
1978 403,352 95.2
0 0.0
20,180 4.8
423,532 1979 346,006 91.4
2,834 0.7
29,872 7.9
378,712
1980 758,344 89.9
8 0.0
85,636 10.1
843,988 1981 1,105,265 92.0
4,125 0.3
92,064 7.7
1,201,454
1982 1,060,812 90.6
15,587 1.3
95,109 8.1
1,171,508 1983 829,281 90.4
19,913 2.2
68,004 7.4
917,198
1984 1,186,753 90.4
30,941 2.4
94,653 7.2
1,312,347 1985 828,645 90.8
18,521 2.0
65,414 7.2
912,580
1986 1,300,638 93.3
22,294 1.6
71,400 5.1
1,394,332 1987 811,464 87.3
43,115 4.6
75,203 8.1
929,782
1988 1,228,987 88.9
68,066 4.9
84,743 6.1
1,381,796 1989 417,978 77.7
44,605 8.3
75,594 14.0
538,177
1990 600,040 83.8
46,700 6.5
69,200 9.7
715,940 1991 635,031 79.6
25,465 3.2
137,394 17.2
797,890
1992 776,939 88.3
29,252 3.3
73,875 8.4
880,066 1993 448,204 87.3
17,871 3.5
47,503 9.2
513,578
1994 1,458,898 91.5
26,262 1.6
108,430 6.8
1,593,590 1995 1,039,506 88.6
22,517 1.9
110,941 9.5
1,172,964
1996 315,357 76.6
14,306 3.5
81,918 19.9
411,581 1997 239,619 84.4
13,278 4.7
31,032 10.9
283,929
1998 333,693 71.6
35,723 7.7
96,486 20.7
465,902 1999 427,414 75.3
21,247 3.7
119,268 21.0
567,929
2000 653,132 80.2
26,134 3.2
134,711 16.5
813,977 2001 696,166 79.7
25,762 2.9
151,637 17.4
873,565
2002 381,423 87.2
12,325 2.8
43,785 10.0
437,533 2003 287,757 81.4
11,867 3.4
54,080 15.3
353,704
2004 254,545 83.0
6,655 2.2
45,612 14.9
306,812 2005 260,703 84.2
1,818 0.6
47,030 15.2
309,551
2006 777,244 88.5
1,561 0.2
99,174 11.3
877,979 2007 327,484 85.7
2,059 0.5
52,705 13.8
382,248
2008 316,076 80.7
13,457 3.4
61,939 15.8
391,472 2009 851,190 86.5
19,509 2.0
113,245 11.5
983,944
2010 418,693 81.3
19,051 3.7
77,516 15.0
515,260 2011 416,883 76.9
44,251 8.2
80,651 14.9
541,785
2012 162,178 71.7
37,558 16.6
26,516 11.7
226,252 2013 405,997 73.9
84,073 15.3
59,465 10.8
549,535
2014 78,642 70.3
15,790 14.1
17,356 15.5
111,788 2015 394,706 79.4 29,108 5.9 73,065 14.7 496,879 Average 2005–2014
401,509 80.0 23,913 6.5 63,560 13.6 488,981 a Harvest from 1987–1990, 1992, 1993, 1995–1998, and 2002–2003 include catch from limited openings in October. b Does not include test fishery harvest.
112
APPENDIX E. SALMON ESCAPEMENT DATA
113
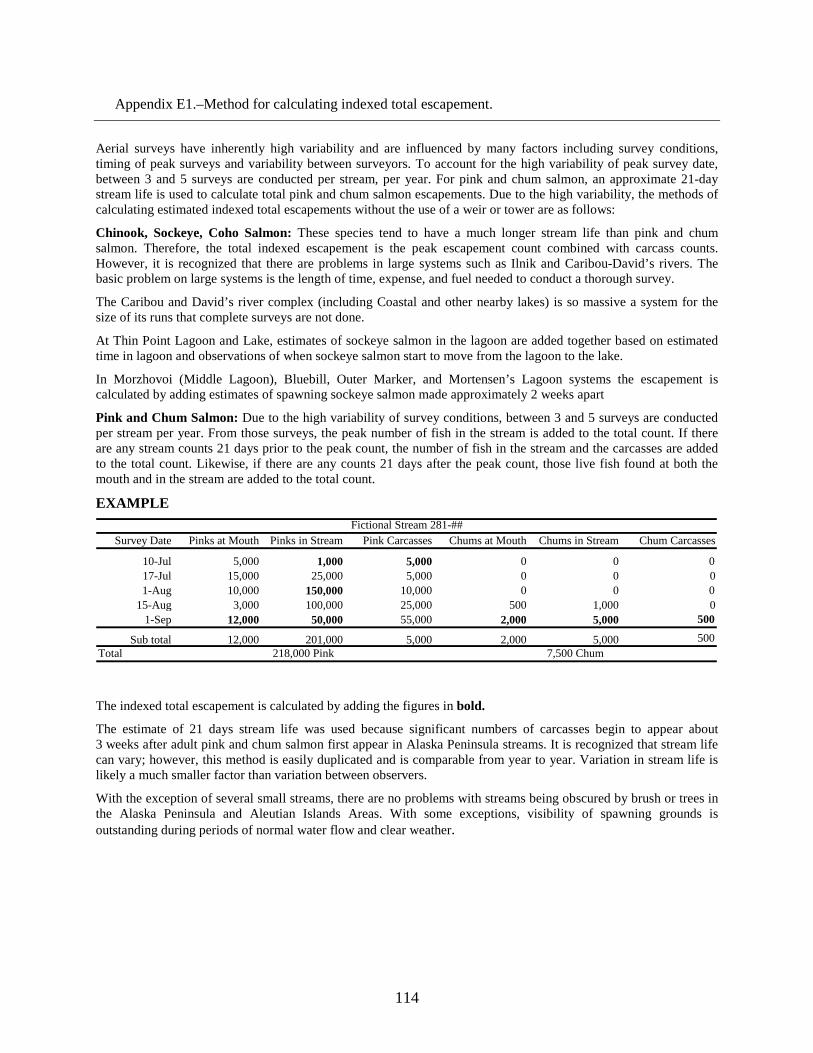
Appendix E1.–Method for calculating indexed total escapement.
Aerial surveys have inherently high variability and are influenced by many factors including survey conditions, timing of peak surveys and variability between surveyors. To account for the high variability of peak survey date, between 3 and 5 surveys are conducted per stream, per year. For pink and chum salmon, an approximate 21-day stream life is used to calculate total pink and chum salmon escapements. Due to the high variability, the methods of calculating estimated indexed total escapements without the use of a weir or tower are as follows:
Chinook, Sockeye, Coho Salmon: These species tend to have a much longer stream life than pink and chum salmon. Therefore, the total indexed escapement is the peak escapement count combined with carcass counts. However, it is recognized that there are problems in large systems such as Ilnik and Caribou-David’s rivers. The basic problem on large systems is the length of time, expense, and fuel needed to conduct a thorough survey.
The Caribou and David’s river complex (including Coastal and other nearby lakes) is so massive a system for the size of its runs that complete surveys are not done.
At Thin Point Lagoon and Lake, estimates of sockeye salmon in the lagoon are added together based on estimated time in lagoon and observations of when sockeye salmon start to move from the lagoon to the lake.
In Morzhovoi (Middle Lagoon), Bluebill, Outer Marker, and Mortensen’s Lagoon systems the escapement is calculated by adding estimates of spawning sockeye salmon made approximately 2 weeks apart
Pink and Chum Salmon: Due to the high variability of survey conditions, between 3 and 5 surveys are conducted per stream per year. From those surveys, the peak number of fish in the stream is added to the total count. If there are any stream counts 21 days prior to the peak count, the number of fish in the stream and the carcasses are added to the total count. Likewise, if there are any counts 21 days after the peak count, those live fish found at both the mouth and in the stream are added to the total count.
EXAMPLE
The indexed total escapement is calculated by adding the figures in bold.
The estimate of 21 days stream life was used because significant numbers of carcasses begin to appear about 3 weeks after adult pink and chum salmon first appear in Alaska Peninsula streams. It is recognized that stream life can vary; however, this method is easily duplicated and is comparable from year to year. Variation in stream life is likely a much smaller factor than variation between observers.
With the exception of several small streams, there are no problems with streams being obscured by brush or trees in the Alaska Peninsula and Aleutian Islands Areas. With some exceptions, visibility of spawning grounds is outstanding during periods of normal water flow and clear weather.
Survey Date Pinks at Mouth Pinks in Stream Pink Carcasses Chums at Mouth Chums in Stream Chum Carcasses
10-Jul 5,000 1,000 5,000 0 0 017-Jul 15,000 25,000 5,000 0 0 01-Aug 10,000 150,000 10,000 0 0 0
15-Aug 3,000 100,000 25,000 500 1,000 01-Sep 12,000 50,000 55,000 2,000 5,000 500
Sub total 12,000 201,000 5,000 2,000 5,000 500Total 218,000 Pink 7,500 Chum
Fictional Stream 281-##
114
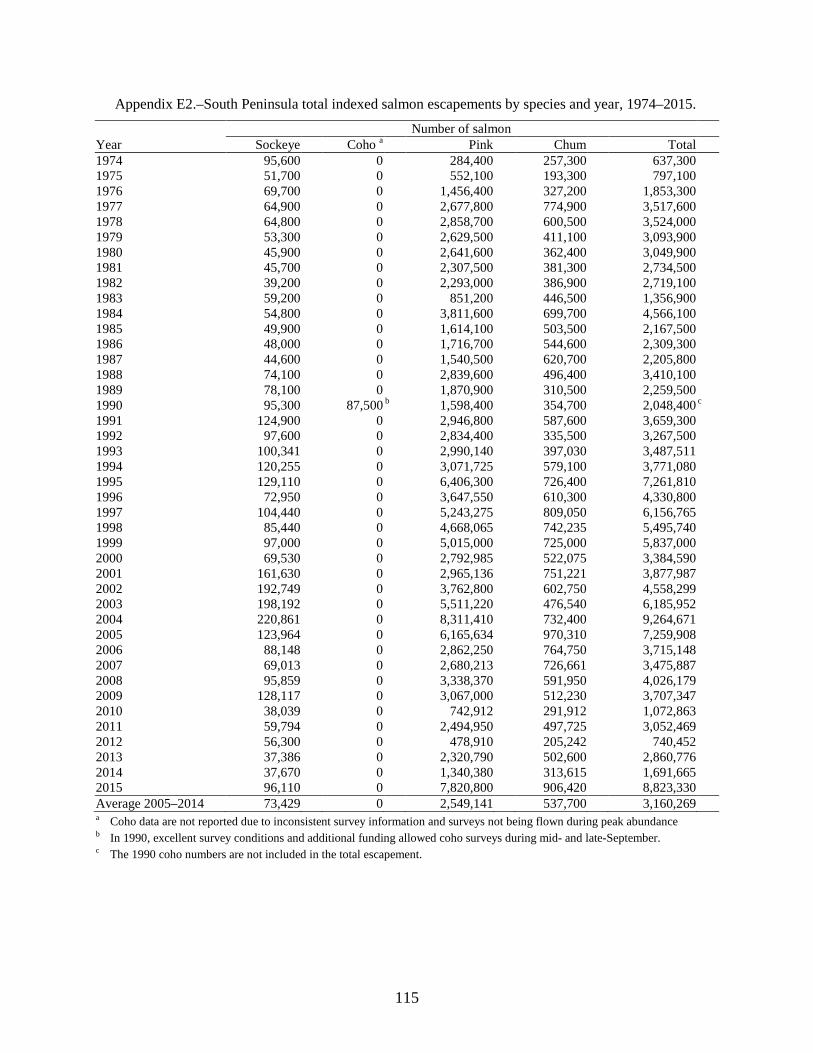
Appendix E2.–South Peninsula total indexed salmon escapements by species and year, 1974–2015.
Number of salmon
Year Sockeye Coho a Pink Chum Total 1974 95,600
0
284,400
257,300
637,300
1975 51,700
0
552,100
193,300
797,100 1976 69,700
0
1,456,400
327,200
1,853,300
1977 64,900
0
2,677,800
774,900
3,517,600 1978 64,800
0
2,858,700
600,500
3,524,000
1979 53,300
0
2,629,500
411,100
3,093,900 1980 45,900
0
2,641,600
362,400
3,049,900
1981 45,700
0
2,307,500
381,300
2,734,500 1982 39,200
0
2,293,000
386,900
2,719,100
1983 59,200
0
851,200
446,500
1,356,900 1984 54,800
0
3,811,600
699,700
4,566,100
1985 49,900
0
1,614,100
503,500
2,167,500 1986 48,000
0
1,716,700
544,600
2,309,300
1987 44,600
0
1,540,500
620,700
2,205,800 1988 74,100
0
2,839,600
496,400
3,410,100
1989 78,100
0
1,870,900
310,500
2,259,500 1990 95,300
87,500 b 1,598,400
354,700
2,048,400 c
1991 124,900
0
2,946,800
587,600
3,659,300 1992 97,600
0
2,834,400
335,500
3,267,500
1993 100,341
0
2,990,140
397,030
3,487,511 1994 120,255
0
3,071,725
579,100
3,771,080
1995 129,110
0
6,406,300
726,400
7,261,810 1996 72,950
0
3,647,550
610,300
4,330,800
1997 104,440
0
5,243,275
809,050
6,156,765 1998 85,440
0
4,668,065
742,235
5,495,740
1999 97,000
0
5,015,000
725,000
5,837,000 2000 69,530
0
2,792,985
522,075
3,384,590
2001 161,630
0
2,965,136
751,221
3,877,987 2002 192,749
0
3,762,800
602,750
4,558,299
2003 198,192
0
5,511,220
476,540
6,185,952 2004 220,861
0
8,311,410
732,400
9,264,671
2005 123,964
0
6,165,634
970,310
7,259,908 2006 88,148
0
2,862,250
764,750
3,715,148
2007 69,013
0
2,680,213
726,661
3,475,887 2008 95,859
0
3,338,370
591,950
4,026,179
2009 128,117
0
3,067,000
512,230
3,707,347 2010 38,039
0
742,912
291,912
1,072,863
2011 59,794
0
2,494,950
497,725
3,052,469 2012 56,300
0
478,910
205,242
740,452
2013 37,386
0
2,320,790
502,600
2,860,776 2014 37,670
0
1,340,380
313,615
1,691,665
2015 96,110 0 7,820,800 906,420 8,823,330 Average 2005–2014 73,429 0 2,549,141 537,700 3,160,269 a Coho data are not reported due to inconsistent survey information and surveys not being flown during peak abundance b In 1990, excellent survey conditions and additional funding allowed coho surveys during mid- and late-September. c The 1990 coho numbers are not included in the total escapement.
115
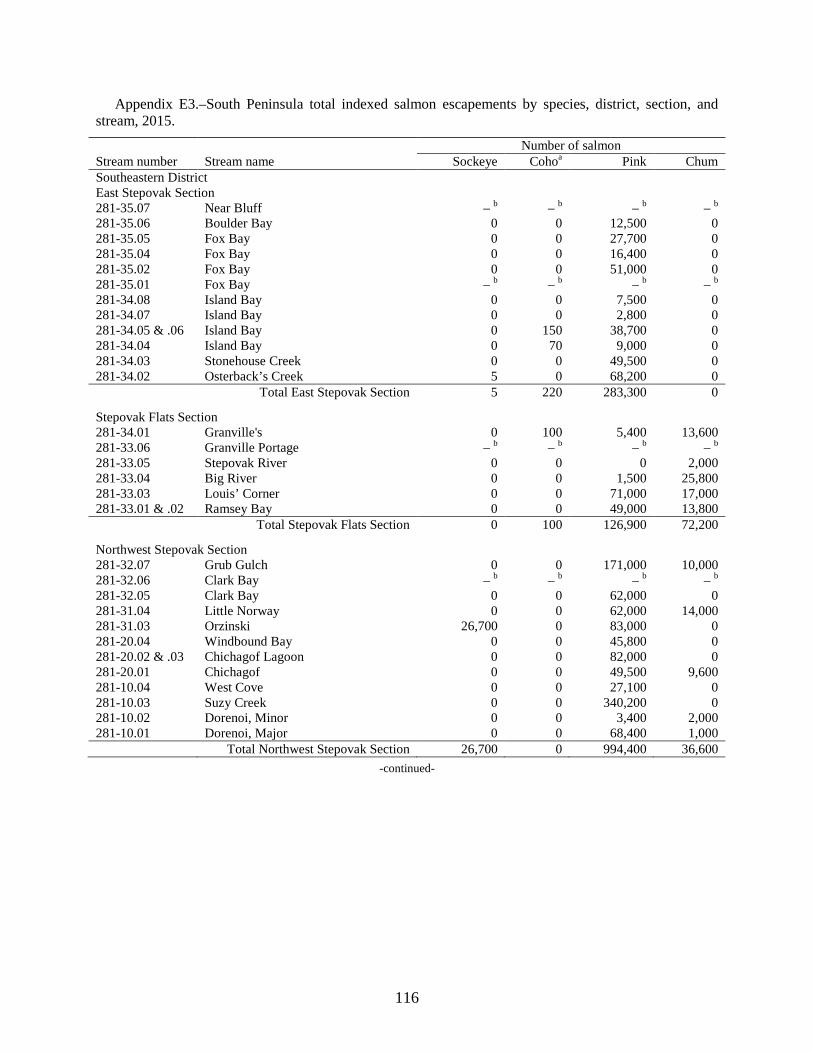
Appendix E3.–South Peninsula total indexed salmon escapements by species, district, section, and stream, 2015.
Number of salmon Stream number Stream name Sockeye Cohoa Pink Chum Southeastern District
East Stepovak Section 281-35.07 Near Bluff – b – b – b – b
281-35.06 Boulder Bay 0 0 12,500 0 281-35.05 Fox Bay 0 0 27,700 0 281-35.04 Fox Bay 0 0 16,400 0 281-35.02 Fox Bay 0 0 51,000 0 281-35.01 Fox Bay – b – b – b – b 281-34.08 Island Bay 0 0 7,500 0 281-34.07 Island Bay 0 0 2,800 0 281-34.05 & .06 Island Bay 0 150 38,700 0 281-34.04 Island Bay 0 70 9,000 0 281-34.03 Stonehouse Creek 0 0 49,500 0 281-34.02 Osterback’s Creek 5 0 68,200 0
Total East Stepovak Section 5 220 283,300 0
Stepovak Flats Section 281-34.01 Granville's 0 100 5,400 13,600
281-33.06 Granville Portage – b – b – b – b 281-33.05 Stepovak River 0 0 0 2,000 281-33.04 Big River 0 0 1,500 25,800 281-33.03 Louis’ Corner 0 0 71,000 17,000 281-33.01 & .02 Ramsey Bay 0 0 49,000 13,800
Total Stepovak Flats Section 0 100 126,900 72,200
Northwest Stepovak Section 281-32.07 Grub Gulch 0 0 171,000 10,000
281-32.06 Clark Bay – b – b – b – b 281-32.05 Clark Bay 0 0 62,000 0 281-31.04 Little Norway 0 0 62,000 14,000 281-31.03 Orzinski 26,700 0 83,000 0 281-20.04 Windbound Bay 0 0 45,800 0 281-20.02 & .03 Chichagof Lagoon 0 0 82,000 0 281-20.01 Chichagof 0 0 49,500 9,600 281-10.04 West Cove 0 0 27,100 0 281-10.03 Suzy Creek 0 0 340,200 0 281-10.02 Dorenoi, Minor 0 0 3,400 2,000 281-10.01 Dorenoi, Major 0 0 68,400 1,000
Total Northwest Stepovak Section 26,700 0 994,400 36,600
-continued-
116
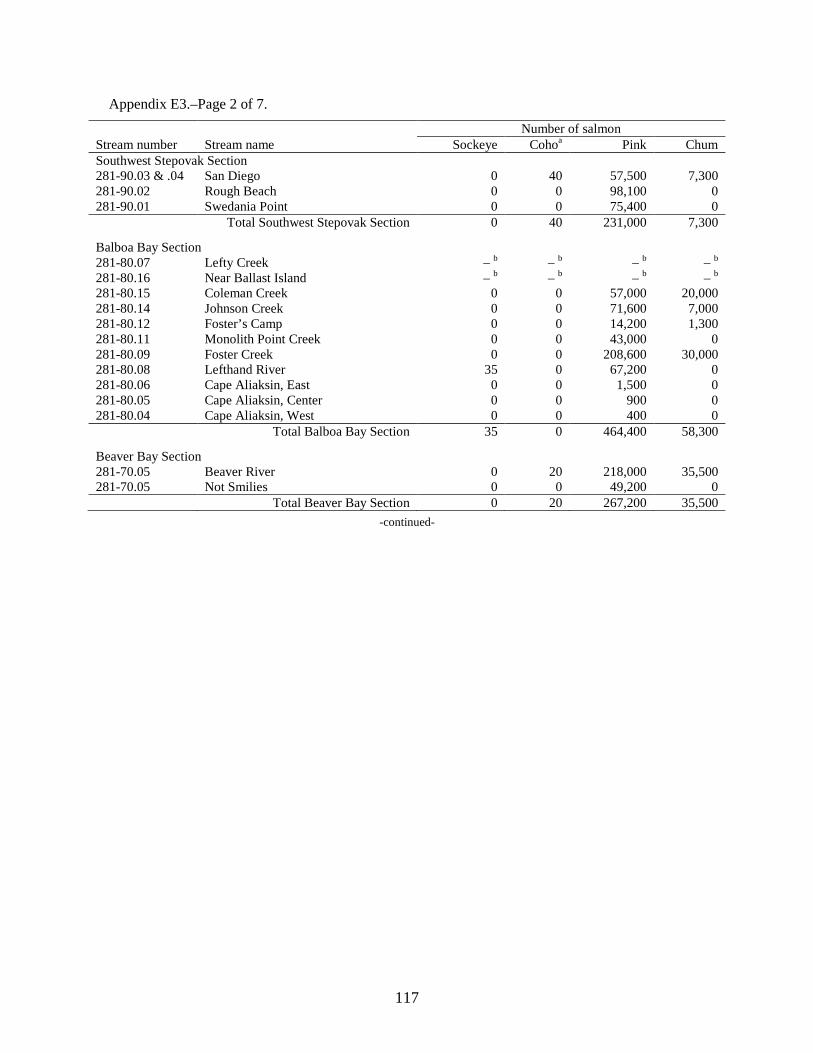
Appendix E3.–Page 2 of 7.
Number of salmon Stream number Stream name Sockeye Cohoa Pink Chum Southwest Stepovak Section
281-90.03 & .04 San Diego 0 40 57,500 7,300 281-90.02 Rough Beach 0 0 98,100 0 281-90.01 Swedania Point 0 0 75,400 0
Total Southwest Stepovak Section 0 40 231,000 7,300
Balboa Bay Section 281-80.07 Lefty Creek – b – b – b – b
281-80.16 Near Ballast Island – b – b – b – b 281-80.15 Coleman Creek 0 0 57,000 20,000 281-80.14 Johnson Creek 0 0 71,600 7,000 281-80.12 Foster’s Camp 0 0 14,200 1,300 281-80.11 Monolith Point Creek 0 0 43,000 0 281-80.09 Foster Creek 0 0 208,600 30,000 281-80.08 Lefthand River 35 0 67,200 0 281-80.06 Cape Aliaksin, East 0 0 1,500 0 281-80.05 Cape Aliaksin, Center 0 0 900 0 281-80.04 Cape Aliaksin, West 0 0 400 0
Total Balboa Bay Section 35 0 464,400 58,300
Beaver Bay Section 281-70.05 Beaver River 0 20 218,000 35,500
281-70.05 Not Smilies 0 0 49,200 0
Total Beaver Bay Section 0 20 267,200 35,500
-continued-
117
Appendix E3.–Page 3 of 7.
Number of salmon Stream number Stream name Sockeye Cohoa Pink Chum Shumagin Islands Section
282-11.06 Korvin Lake 0 0 200 0 282-11.05 West Korovin 0 0 4,500 0 282-11.03 Foxhole 0 0 45,000 0 282-11.01 Salmon Ranch 0 0 0 0 282-10.18 Humbolt Creek – b – b – b – b 282-10xx Simeon’s Bight – b – b – b – b 282-10.20 Red Cove Lake 700 20 0 0 282-12.10 Zachary Bay 0 0 600 0 282-12.09 Zachary Bay 0 0 100 0 282-12.08 Zachary Bay 0 0 3,300 0 282-12.07 & .06 Zachary Bay 0 0 2,000 0 282-12.05 & .04 Zachary Bay 0 0 7,700 380 282-12.03 Zachary Bay 0 0 4,400 90 282-12.02 Zachary Bay 0 0 2,850 0 282-12.01 Zachary Bay 0 0 1,700 0 282-13.01 Unga Spit 0 0 0 0 282-13.02 Dry Lagoon 0 100 54,100 0 282-13.03 Bay Point 0 300 248,100 40,000 282-13.04 Pinnacle Point 0 0 54,000 0 282-13.05 2nd Stream S. of Pinn Point 0 0 5,000 0 282-13.06 3rd Stream S. of Pinn Point 0 0 3,000 0 282-10.02 Little Apollo 0 0 102,200 0 282-10.03 Big Apollo 0 150 128,200 0 282-10.04 Acheredin 15,000 80 5,000 0 282-10.12 Unga Cape – b – b – b – b 282-10.10 Delarof Harbor 0 0 2,000 0 282-10.11 Apollo Gold Mine Creek 0 0 26,500 0 282-10.13 John Nelson 0 250 30,000 0 282-10.14 Squaw Harbor, Minor 0 0 12,000 0 282-10.15 Squaw Harbor, Major 0 0 107,000 0 282-10.16 Farm 0 20 12,400 0 282-20.01 Porpoise Rocks – b – b – b – b 282-20.02 Porpoise Harbor – b – b – b – b 282-20.03 Sanborn Lagoon-Lake – b – b – b – b 282-20.04 Sanborn Harbor – b – b – b – b 282-20.xx Falmouth Harbor – b – b – b – b 282-20.06 Falmouth Harbor – b – b – b – b 282-20.08 East Bight – b – b – b – b 282-20.09 West Bight – b – b – b – b
Total Shumagin Islands Section 15,700 920 861,850 40,470
Southeastern District total 42,440 1,300 3,229,050 250,370 -continued-
118
Appendix E3.–Page 4 of 7.
Number of salmon Stream number Stream name Sockeye Cohoa Pink Chum South Central District
Mino Creek–Little Coal Bay Section 283-70.03 McGinty Point Creek 0 0 166,000 0
283-70.02 East of Mino Creek 0 0 204,800 0 283-70.01 Mino’s Creek 700 200 815,300 12,000 283-62.06 Wosnesenski Lake – b – b – b – b 283-62.05 Coal Bay, Main 0 0 193,200 0 283-62.04 Coal Bay, #2 0 0 73,600 0 283-62.03 Coal Bay, #3 0 0 20,300 0 283-62.02 Coal Bay, #4 0 0 19,000 0 283-62.01 Cape Tolstoi Creek – b – b – b – b
Total Mino Creek–Little Coal Bay Section 700 200 1,492,200 12,000
East Pavlof Bay Section 283-63.16 Settlement Point Creek 0 0 599,500 100
283-63.15 Middle Creek 0 0 95,000 0
Total East Pavlof Bay Section 0 0 694,500 100
Canoe Bay Section 283-64.10 Ness Creek 0 0 17,400 0
283-64.09
– b – b – b – b 283-64.08 Entrance Creek 0 0 58,000 0 283-64.07 Wolverine Gulch – b – b – b – b 283-64.06 Canoe Bay River 9,500 0 336,000 225,000 283-64.05 Bluff Point Creek 0 0 29,000 0
Total Canoe Bay Section 9,500 0 440,400 225,000
West Pavlof Bay Section 283-63.14 Dry Lagoon 283-63.13 Ruby’s Lagoon 0 0 0 12,500
283-63.11 Chinaman Lagoon, North 0 0 0 0 283-63.10 Chinaman Lagoon, Main 0 0 5,000 5,000 283-63.09 Chinaman Lagoon 6309 0 0 0 0 283-63.05 & .06 Chinaman Lagoon, South 0 0 0 0 283-63.04 Stream S. of Chinaman Lagoon 0 0 0 0 283-61.05 Long John Lagoon, East 0 0 6,000 24,000 283-61.04 Long John Lagoon, Spring Fed Lakes 400 320 13,000 8,000 283-61.03 Long John Lagoon, 2 South 0 0 0 300 283-61.02 Long John Lagoon, Southwest 0 0 65,000 12,000
Total West Pavlof Bay Section 400 320 89,000 61,800
South Central District total 10,600 520 2,716,100 298,900 -continued-
119
Appendix E3.–Page 5 of 7.
Number of salmon Stream number Stream name Sockeye Cohoa Pink Chum Southwestern District
Volcano Bay Section 284-52.10 Dushkin Lagoon 0 0 0 200
284-52.08 Volcano River 0 0 77,000 14,700 284-52.07 Volcano Bay Center Sloughs 0 500 20,000 20,000 284-52.06 Volcano Bay West Spring Holes 0 0 100,000 85,000 284-52.05 Streamguard Creek 0 0 0 3,000 284-52.04 Stub Creek 0 0 27,000 0 284-52.03 Little Bear Bay 0 0 15,000 5,000 284-52.01 Nikolaski 0 0 3,000 0 284-52.00 Little Nikolaski – b – b – b – b 284-51.03 Dolgoi Harbor, North 0 0 11,000 0 284-51.04 Dolgoi Harbor, Northeast 0 0 5,000 0 284-51.05 Dolgoi Harbor, East 0 0 7,000 0 284-51.06 Dolgoi Harbor, South 0 0 3,000 0
Total Volcano Bay Section 0 500 268,000 127,900
Belkofski Bay Section 284-41.01 Belkofski Village Creek 0 0 2,000 0
284-42.12 Rocky River 0 0 0 0 284-42.10 Kitchen Anchorage 0 0 0 0 284-42.09 Captain's Harbor 0 0 0 0 284-42.07 Belkofski River 0 0 89,000 76,000 284-42.06 Belkofski Beach 0 0 17,000 4,300 284-42.05 Belkofski Bay, West 0 0 72,000 500 284-42.04 Belkofski Bay 4204 0 0 0 0 284-42.03 Indian Head Creek – b – b – b – b 284-33.05 Rams Creek 0 0 18,000 0 284-33.04 King Cove Lagoon, North – b – b – b – b 284-33.03 King Cove Lagoon, West – b – b – b – b
Total Belkofski Bay Section 0 0 198,000 80,800
Deer Island Section 284-31.01 Deer Island, North – b – b – b – b
284-31.02 Fox Island Anchorage Center 0 0 84,200 0 284-31.03 Fox Island Anchorage 0 0 64,300 0 284-31.05 Paw Cape 0 0 95,250 0 284-31.06 Southern Creek 0 0 376,500 0 284-31.010 Eastern Creek 0 0 61,500 0
Total Deer Island Section 0 0 681,750 0
-continued-
120
Appendix E3.–Page 6 of 7.
Number of salmon Stream number Stream name Sockeye Cohoa Pink Chum Cold Bay Section
284-34.11 Outer Lenard Harbor 0 0 10,700 0 284-34.13
– b – b – b – b
284-34.12
0 0 8,000 0 284-34.10 Delta Creek 0 0 64,000 11,350 284-34.09 Barney’s Creek 0 0 55,000 15,000 284-34.07 Kinzarof Lagoon, East – b – b – b – b 284-34.06 Kinzarof Lagoon, Center 300 0 0 0 284-34.05 Kinzarof Lagoon, West 250 0 0 0 284-34.03 Trout Creek – b – b – b – b 284-34.02 Russel Creek 0 0 29,000 18,800 284-34.01 Mortensen Lagoon 20c 0 0 0 284-32.01 Old Man Lagoon 500 0 0 0
Total Cold Bay Section 1,070 0 166,700 45,150
Thin Point Section 284-20.06 Thin Point Lagoon 0 0 0 0
284-20.07 Thin Point Lagoon SW 0 0 0 0 284-20.10 Thin Point Lake 19,900 0 0 0 284-20.09 Thin Point Stream 0 0 0 0 284-20.04 Southwest Bight 0 0 36,700 0 284-20.03 McGinty’s Creek 0 0 107,000 0 284-20.01 Sandy Cove 0 0 2,000 30,000
Total Thin Point Section 19,900 0 145,700 30,000
Morzhovoi Bay Section 284-11.01 Near Egg Island 0 0 12,000 0
284-12.13 Little John Lagoon 0 0 37,000 66,000 284-12.12 Little John Sandpit 0 0 0 1,300 284-12.10 Little John Rock – b – b – b – b 284-12.11 Cannery Creek – b – b – b – b 284-12.05 Middle Lagoon 1,000 0 0 0 284-12.01 Hansen’s Creek 6,500 0 34,000 0 Total Morzhovoi Bay Section 7,500 0 83,000 67,300
-continued-
121
Appendix E3.–Page 7 of 7.
Number of salmon Stream number Stream name Sockeye Cohoa Pink Chum
Ikatan Bay Section 284-60.08 Deadman’s Cove 0 0 64,400 0
284-60.07 Whalebone Bay 2,600 0 14,000 0 284-60.06 Sankin Bay 0 0 5,000 0 284-60.05 Whirl Point 0 0 3,200 0 284-60.04 Ikatan River 0 0 25,500 0 284-60.03 Swede’s Lake 9,000 0 0 0 284-60.01 Ikatan Point 0 0 11,000 0
Total Ikatan Bay Section 11,600 0 123,100 0
Southwestern District total 40,070 500 1,666,250 351,150
Unimak District Otter Cove Section
285-50.00 Dora Harbor 0 0 0 0 285-40.09 Otter Cove, East 0 0 145,700 0 285-40.08 Otter Cove, West 0 0 36,200 6,000 285-30.07 Conocal Red Hill Stream – b – b – b – b 285-40.05 Lazaref River 2,500 0 27,500 0
Total Otter Cove Section 2,500 0 209,400 6,000
Sanak Island Section 285-10.02 Pauloff Harbor 100 0 0 0
285-10.03 Johnson Bay 0 0 0 0 285-10.04 Unimak Cove 0 0 0 0 285-10.10 Salmon Bay 0 0 0 0 285-10.09 Sandy Bay 0 0 0 0 285-10.05 Dodd’s Bay, East 0 0 0 0 285-10.08 Wahwoman Creek 0 0 0 0 285-10.07 West Sanak Island, Trinity 200 0 0 0 285-10.06 Near Sanak Village 200 0 0 0
Total Sanak Island Section 500 0 0 0
Unimak District total 3,000 0 209,400 6,000
South Peninsula total 96,110 2,320 7,820,800 906,420 a Only indexed coho salmon escapement is estimated due to their late run timing. b Aerial survey not conducted on stream. c Mortensen Lagoon estimate of 20 sockeye salmon is an underestimate due to poor aerial survey conditions.
122
123
Appendix E4.–South Peninsula total indexed sockeye salmon escapement by year, 1974–2015.
0
50
100
150
200
250
1974 1976 1978 1980 1982 1984 1986 1988 1990 1992 1994 1996 1998 2000 2002 2004 2006 2008 2010 2012 2014
Upper Escapement Objective 115,200
Lower Escapement Objective 62,250
Year
Num
ber o
f Soc
keye
Sal
mon
(Tho
usan
ds)
124
Appendix E5.–South Peninsula total indexed pink salmon escapement by year, 1974–2015.
0
1
2
3
4
5
6
7
8
9
1974 1976 1978 1980 1982 1984 1986 1988 1990 1992 1994 1996 1998 2000 2002 2004 2006 2008 2010 2012 2014
Upper Even Year Goal 3,729,300
Upper Odd Year Goal 3,275,700
Lower Even Year Goal 1,864,600
Year
Num
ber o
f Pin
k Sa
lmon
(Mill
ions
)
Lower Odd Year Goal 1,637,800
125
Appendix E6.–South Peninsula total indexed chum salmon escapement by year, 1974–2015.
0.0
0.2
0.4
0.6
0.8
1.0
1.2
1974 1976 1978 1980 1982 1984 1986 1988 1990 1992 1994 1996 1998 2000 2002 2004 2006 2008 2010 2012 2014
Upper Escapement Objective 659,200
Lower Escapement Objective 330,400
Year
Num
ber o
f Chu
m S
alm
on (M
illio
ns)
125
126
Appendix E7.–Sockeye salmon cumulative escapement counts through the Orzinski Lake weir, 2015 with upper and lower escapement goals defined.
0
2
4
6
8
10
12
14
16
18
20
22
24
26
6/7 6/10 6/13 6/16 6/19 6/22 6/25 6/28 7/1 7/4 7/7 7/10 7/13 7/16 7/19 7/22 7/25 7/28 7/31 8/3 8/6 8/9
2015 Sockeye Escapement
July 1 Objective: (1,500–2,000)
July 9 Objective: (3,750–5,000)
July 16 Objective: (7,500–10,000)
July 23 Objective: (11,250–15,000)
August 7 Objective: (15,000–20,000)
Date
Num
ber o
f Soc
keye
Sal
mon
(Tho
usan
ds)
Appendix E8.–Sockeye, pink, and chum salmon daily and cumulative escapement counts through the Orzinski Lake weir 2015. Sockeye Pink
Chum
Date Adults Jacks Total Cumulative Daily Cumulative Daily Cumulative 04-Jun a Weir Installed
05-Jun
0 0 0 0
0 0
0 0 06-Jun
0 0 0 0
0 0
0 0
07-Jun
0 0 0 0
0 0
0 0 08-Jun
0 0 0 0
0 0
0 0
09-Jun
0 0 0 0
0 0
0 0 10-Jun
0 0 0 0
0 0
0 0
11-Jun
0 0 0 0
0 0
0 0 12-Jun
0 0 0 0
0 0
0 0
13-Jun
0 0 0 0
0 0
0 0 14-Jun
0 0 0 0
0 0
0 0
15-Jun
0 0 0 0
0 0
0 0 16-Jun
2 0 2 2
0 0
0 0
17-Jun
0 0 0 2
0 0
0 0 18-Jun
57 0 57 59
0 0
0 0
19-Jun
49 2 51 110
0 0
0 0 20-Jun
0 0 0 110
0 0
0 0
21-Jun
103 5 108 218
0 0
0 0 22-Jun
32 2 34 252
0 0
0 0
23-Jun
121 2 123 375
0 0
0 0 24-Jun
34 1 35 410
0 0
0 0
25-Jun
65 0 65 475
0 0
0 0 26-Jun
111 5 116 591
0 0
0 0
27-Jun
145 3 148 739
0 0
0 0 28-Jun
14 1 15 754
0 0
0 0
29-Jun
305 9 314 1,068
0 0
0 0 30-Jun
253 9 262 1,330
0 0
0 0
01-Jul
180 7 187 1,517
0 0
0 0 02-Jul
175 15 190 1,707
0 0
0 0
03-Jul
787 46 833 2,540
1 1
0 0 04-Jul
1,111 49 1,160 3,700
1 2
0 0
05-Jul b 538 0 538 4,238
0 2
0 0 06-Jul
8 0 8 4,246
0 2
0 0
07-Jul
864 57 921 5,167
1 3
0 0 08-Jul
737 64 801 5,968
6 9
0 0
09-Jul
498 48 546 6,514
3 12
2 2 10-Jul
817 90 907 7,421
3 15
1 3
11-Jul
194 22 216 7,637
3 18
2 5 12-Jul
897 62 959 8,596
2 20
0 5
13-Jul
456 25 481 9,077
4 24
0 5 14-Jul 1,149 70 1,219 10,296 13 37 0 5
-continued-
127
Appendix E8.–Page 2 of 2.
Sockeye Pink Chum Date Adults Jacks Total Cumulative Daily Cumulative Daily Cumulative 15-Jul
801 56 857 10,296
21 58
0 5
16-Jul
913 52 965 11,261
13 71
0 5 17-Jul
1,023 77 1,100 12,361
17 88
0 5
18-Jul
180 13 193 12,554
0 88
0 5 19-Jul
450 45 495 13,049
6 94
0 5
20-Jul
998 116 1,114 14,163
7 101
0 5 21-Jul
486 45 531 14,694
6 107
0 5
22-Jul
159 39 198 14,892
5 112
0 5 23-Jul
567 42 609 15,501
5 117
0 5
24-Jul
479 53 532 16,033
3 120
0 5 25-Jul
255 31 286 16,319
7 127
0 5
26-Jul
787 93 880 17,199
10 137
0 5 27-Jul
1,295 79 1,374 18,573
60 197
1 6
28-Jul
1,558 84 1,642 20,215
68 265
0 6 29-Jul
417 35 452 20,667
79 344
0 6
30-Jul
856 60 916 21,583
352 696
0 6 31-Jul
658 48 706 22,289
327 1,023
1 7
1-Aug
850 48 898 23,187
443 1,466
1 8 2-Aug
371 37 408 23,595
79 1,545
0 8
3-Aug
641 60 701 24,296
951 2,496
2 10 4-Aug
1,105 85 1,190 25,486
2,943 5,439
3 13
5-Aug
550 41 591 26,077
1,261 6,700
0 13 6-Aug Weir Pulled
Total 25,101 1,833 26,934 6,700 13
Estimated total sockeye escapement 26,934
a Weir fish tight on June 7. b Includes estimated sockeye salmon escapement when weir was breached due to flooding.
128