Embed Size (px)
Citation preview
South Bay Coastal Ocean Observing SystemCalifornia Clean Beaches Initiative
Quarterly ReportMarch 2004
toCity of Imperial Beach
Eric Terrill1
1 Scripps Institution of Oceanography, University of California, San Diego
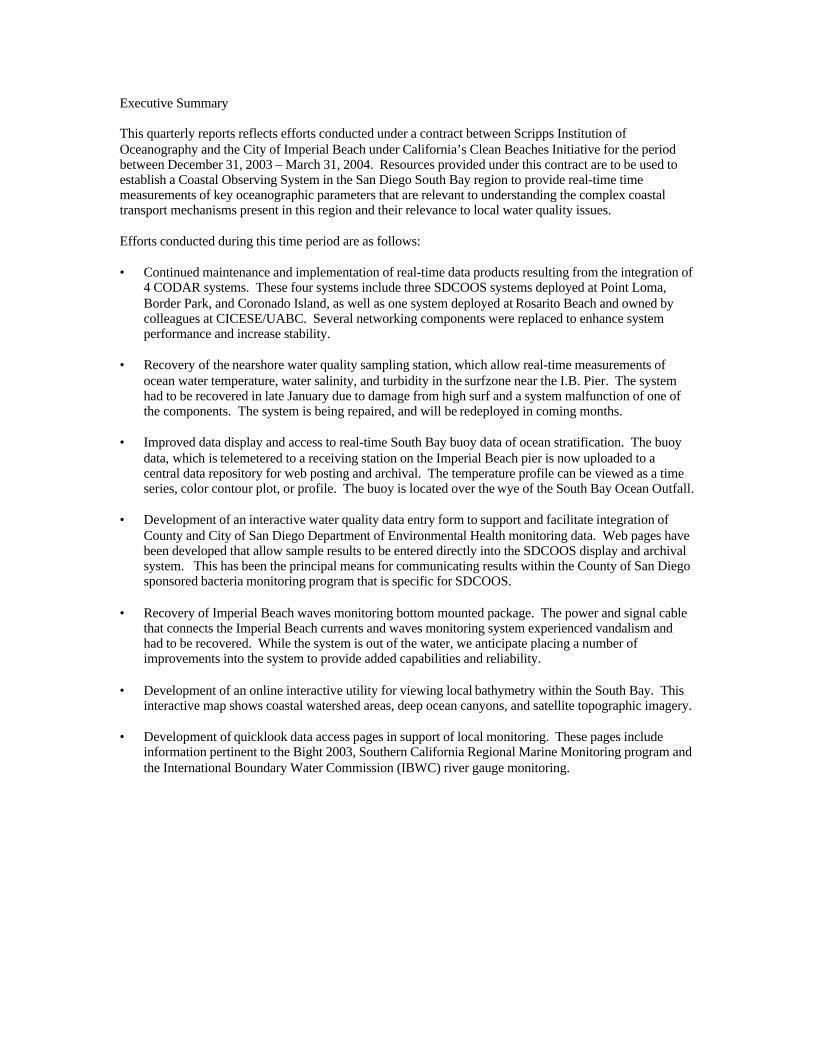
Executive Summary
This quarterly reports reflects efforts conducted under a contract between Scripps Institution ofOceanography and the City of Imperial Beach under California’s Clean Beaches Initiative for the periodbetween December 31, 2003 – March 31, 2004. Resources provided under this contract are to be used toestablish a Coastal Observing System in the San Diego South Bay region to provide real-time timemeasurements of key oceanographic parameters that are relevant to understanding the complex coastaltransport mechanisms present in this region and their relevance to local water quality issues.
Efforts conducted during this time period are as follows:
• Continued maintenance and implementation of real-time data products resulting from the integration of4 CODAR systems. These four systems include three SDCOOS systems deployed at Point Loma,Border Park, and Coronado Island, as well as one system deployed at Rosarito Beach and owned bycolleagues at CICESE/UABC. Several networking components were replaced to enhance systemperformance and increase stability.
• Recovery of the nearshore water quality sampling station, which allow real-time measurements ofocean water temperature, water salinity, and turbidity in the surfzone near the I.B. Pier. The systemhad to be recovered in late January due to damage from high surf and a system malfunction of one ofthe components. The system is being repaired, and will be redeployed in coming months.
• Improved data display and access to real-time South Bay buoy data of ocean stratification. The buoydata, which is telemetered to a receiving station on the Imperial Beach pier is now uploaded to acentral data repository for web posting and archival. The temperature profile can be viewed as a timeseries, color contour plot, or profile. The buoy is located over the wye of the South Bay Ocean Outfall.
• Development of an interactive water quality data entry form to support and facilitate integration ofCounty and City of San Diego Department of Environmental Health monitoring data. Web pages havebeen developed that allow sample results to be entered directly into the SDCOOS display and archivalsystem. This has been the principal means for communicating results within the County of San Diegosponsored bacteria monitoring program that is specific for SDCOOS.
• Recovery of Imperial Beach waves monitoring bottom mounted package. The power and signal cablethat connects the Imperial Beach currents and waves monitoring system experienced vandalism andhad to be recovered. While the system is out of the water, we anticipate placing a number ofimprovements into the system to provide added capabilities and reliability.
• Development of an online interactive utility for viewing local bathymetry within the South Bay. Thisinteractive map shows coastal watershed areas, deep ocean canyons, and satellite topographic imagery.
• Development of quicklook data access pages in support of local monitoring. These pages includeinformation pertinent to the Bight 2003, Southern California Regional Marine Monitoring program andthe International Boundary Water Commission (IBWC) river gauge monitoring.
Project Timeline – Schedule update
TASK ITEM Schedule completion date based on a July 1, 2002start
1.1. Coastal Ocean Dynamics ApplicationRadar 1.1.1 – 1.1.3 site planning, array design, ordersystem
September 15, 2002 (2.5 months)
1.1.4 – 1.1.6 system installation January 31, 2003 (6.5 months) 1.1.5 – 1.1.8 system calibrations andoptimization
September 15, 2003 (14.5 months)
1.1.9 data integration continuous effort through June 30, 2004 (24 months)
1.2. Nearshore Currents and Water TypeSampling 1.2.1 – 1.2.2 system fabrication, site planning December 15, 2002 (5.5 months) 1.2.3 – 1.2.4 system installation January 15, 2003 (6.5 months) 1.2.5 – 1.2.6 data integration continuous effort through June 30, 2004 (24 months)
1.3. Surf-zone Currents and Water QualitySampling System 1.3.1 fabricate system December 15, 2002 (5.5 months) 1.3.2 install system January 15, 2003 (6.5 months) 1.3.3 install data cable / logging computers January 15, 2003 (6.5 months) 1.3.4 data integration continuous effort through June 30, 2004 (24 months)
1.4. Water Column Stratification MeasurementSystem 1.4.1 – 1.4.2 system fabrication andinstallation
January 1, 2003 (6 months)
1.4.3 data integration continuous effort through June 30, 2004 (24 months)
1.5. Central Data Acquisition and Real-TimeData Distribution System 1.5.1 – 1.5.3 database development, datamerger, online access tool development
continuous effort through June 30, 2004 (24 months)
1.6. Data Integration and Interpretation continuous effort through June 30, 2004 (24 months)
1.7. Reporting 1.7.1-1.7.3 progress reports of activities,milestones, data summaries, and interpretationefforts
continuous effort through June 30, 2004 (24 months)
Activities undertaken for the above timeline during the time period of this report:
Tasks 1.1 Coastal Ocean Dynamics Application Radar
CODAR sites continue to be operational providing real-time surface currents for the South Bay region.Throughout this quarter, we focused efforts on development of an improved archiving method for theCoastal Radar data. This method includes an Object Ring Buffer, which consistently queries severaldatabases for file updates and changes, triggering an automatic data transfer and population of an offsitedata repository at the San Diego SuperComputing Center.
Task 1.2 Nearshore Currents and Water Type Sampling System
In order to provide real-time data products, we have our instruments cabled the length of the ImperialBeach pier to a computer system in the tower. This cabling became a source of intrigue to local teens whentheir fishing lines caught, and tested the strength of the cable ultimately causing irreparable damage. Werecovered nearshore current meter sampling system in early March for overhaul.
Task 1.3 Surf-zone Currents and Water Quality Sampling System
The surf-zone can be an extremely challenging environment for maintaining oceanographic equipment. Inlate January, we had to recover our water sampling system due to storm damage. The instruments weresecurely mounted to a pier piling directly below the lifeguard tower, but unfortunately the communicationscables were damaged and began transmitting faulty data readings. The instruments were sent back to thefactory for repair and recalibration, as we devised a new deployment mechanism. With the bottommounted waves system and water sampling systems recovered, we were able to engineer an integratedsystem. We anticipate redeploying the system in the following quarter.
Task 1.4 Water Column Stratification Measurement System
In an effort to provide improved user-friendly data products, we expanded our water column stratificationdisplay. Users are now able to view the data in several formats including time series, contour, and verticalprofile images. This system remained operational throughout the quarter.
Task 1.5 Central Data Acquisition and Real-Time Data Distribution System
A development and maintenance effort for the SDCOOS real-time data distribution system continuesthrough this quarter. We were able to provide online support to the Bight '03 Southern California RegionalMarine Monitoring program by tailoring our Real-Time Data Distribution System to fit their needs.Participants were able to review the synoptic situation each day prior to collection events. We provided theessential products need on one easy access page specifically designed for their needs. The page stillremains at http://www.sdcoos.ucsd.edu/bight03/
Task 1.6 Data Integration and Interpretation
As the installation of the San Diego Coastal Observing System progresses, we are able to utilize our dataproducts for further integration, interpretation, and analysis. We have assimilated Tijuana river gauge dataand information provided by the International Boundary Water Commission (IBWC) for quick referenceduring storm water overflows: http://www.sdcoos.ucsd.edu/data/CurrentRiver.cfm We have also haveobtained and provide to the public ocean color satellite imager from the Ocean Color Monitor (OCM) dataover the South Bay coastline through March 2004. This data has been geo-referenced to the coastline.In an effort to facilitate ease of water quality data reporting, we structured a web entry system based on thereporting scheme of the San Diego County Department of Environmental Health.
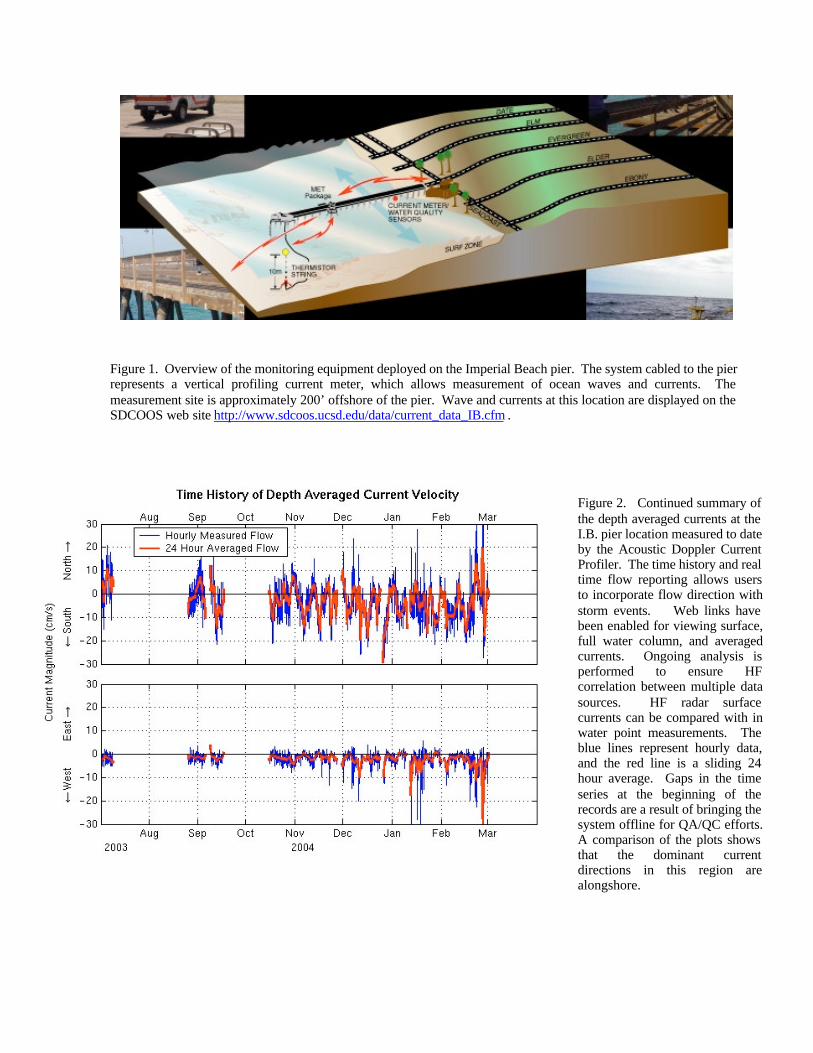
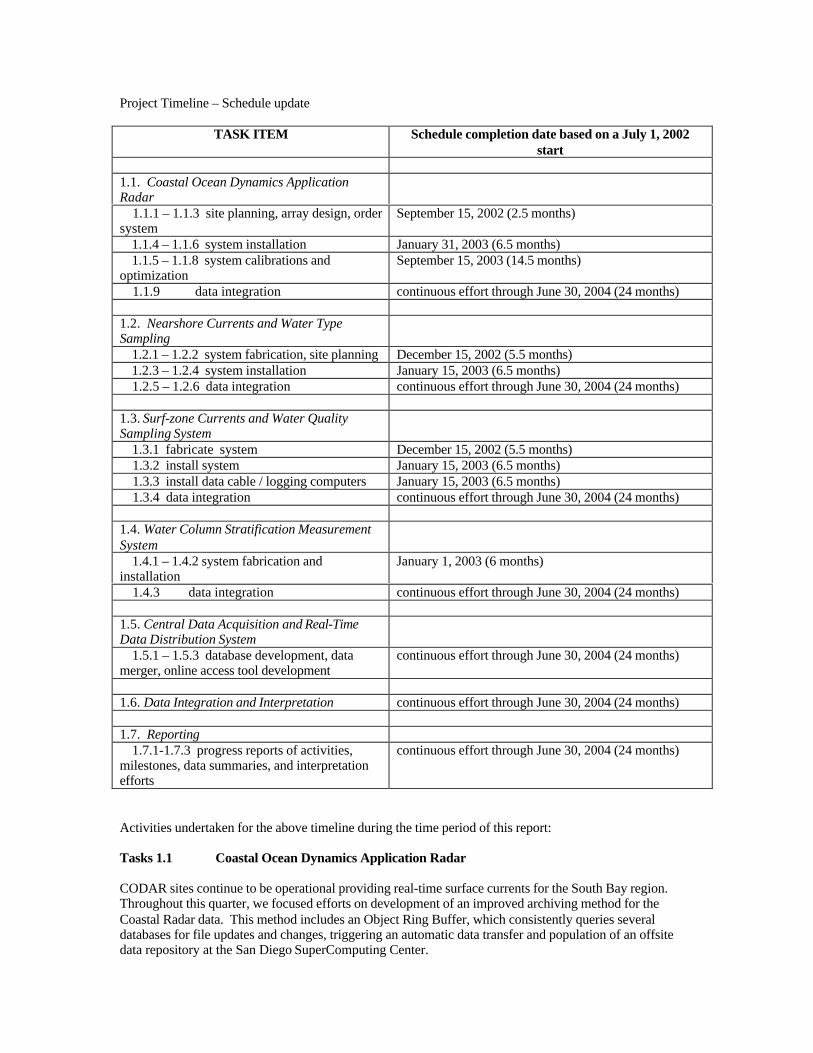
Figure 1. Overview of the monitoring equipment deployed on the Imperial Beach pier. The system cabled to the pierrepresents a vertical profiling current meter, which allows measurement of ocean waves and currents. Themeasurement site is approximately 200’ offshore of the pier. Wave and currents at this location are displayed on theSDCOOS web site http://www.sdcoos.ucsd.edu/data/current_data_IB.cfm .
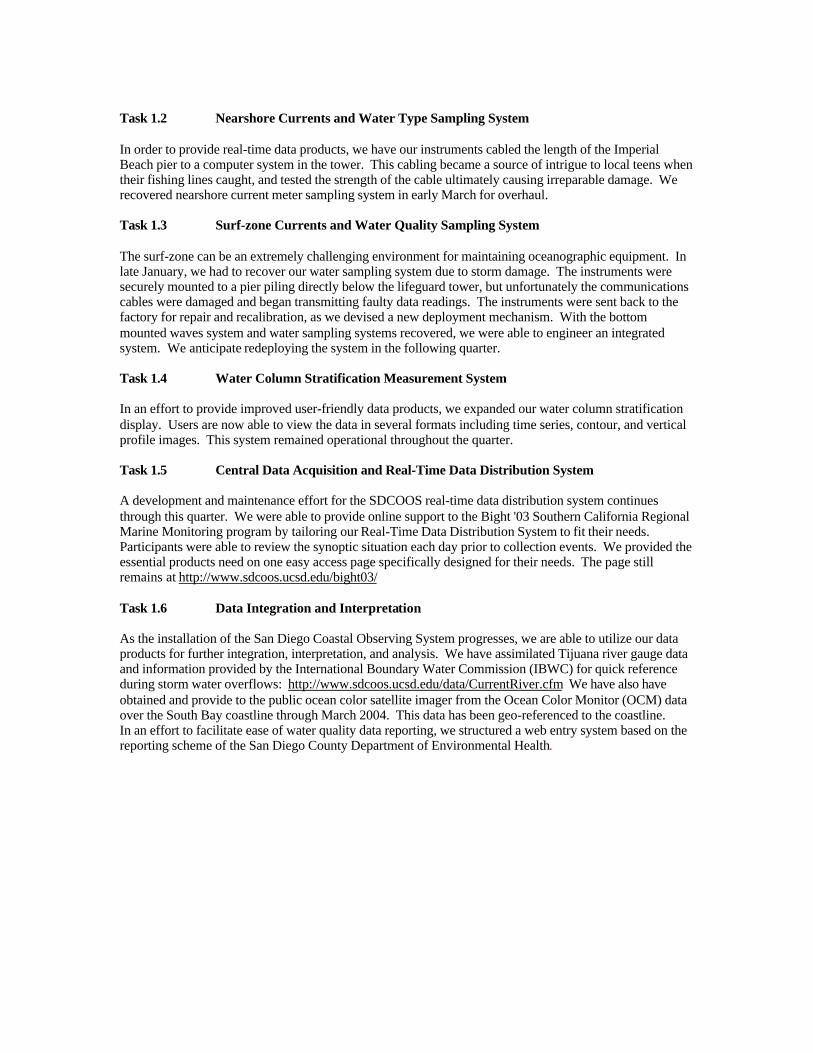
Figure 2. Continued summary ofthe depth averaged currents at theI.B. pier location measured to dateby the Acoustic Doppler CurrentProfiler. The time history and realtime flow reporting allows usersto incorporate flow direction withstorm events. Web links havebeen enabled for viewing surface,full water column, and averagedcurrents. Ongoing analysis isperformed to ensure HFcorrelation between multiple datasources. HF radar surfacecurrents can be compared with inwater point measurements. Theblue lines represent hourly data,and the red line is a sliding 24hour average. Gaps in the timeseries at the beginning of therecords are a result of bringing thesystem offline for QA/QC efforts.A comparison of the plots showsthat the dominant currentdirections in this region arealongshore.
Figure 3. This web page is representative of the user interface for the County of San Diego waterquality data entry. Fields and formats were included based on pertinent logged information. The datafeeds directly into an SDCOOS database and can be displayed easily on the web page for publicviewing. The system is fully functional, but still in beta testing.
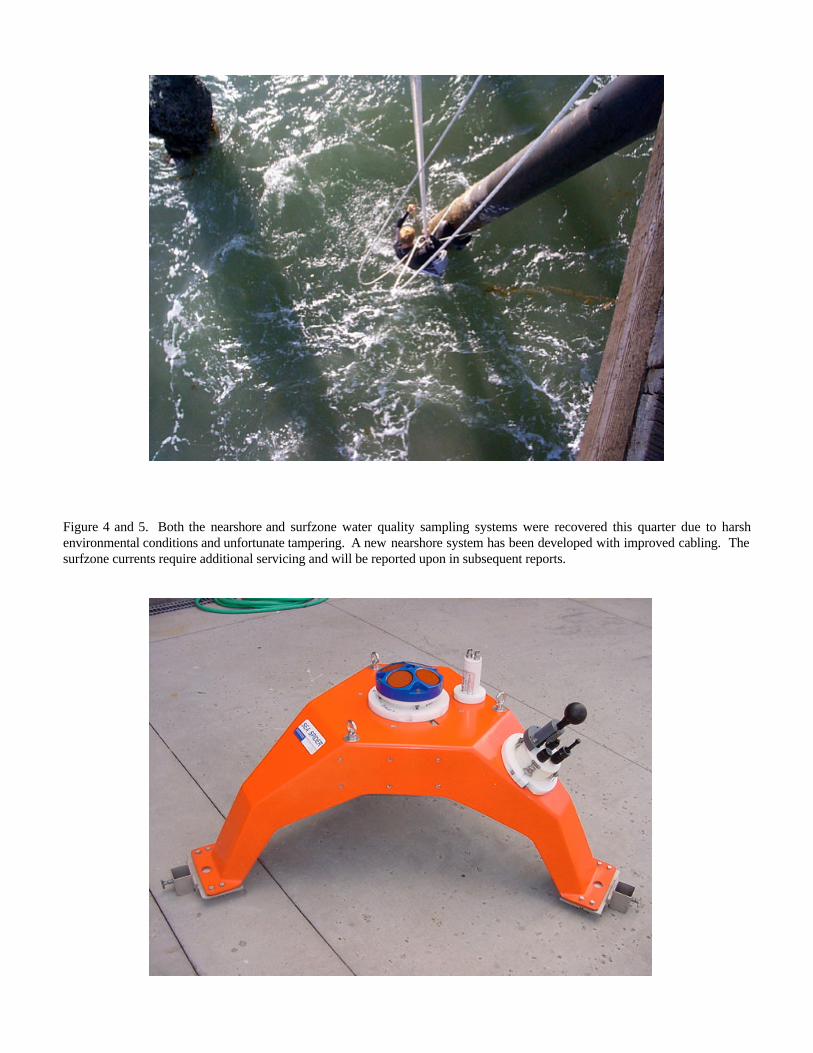
Figure 4 and 5. Both the nearshore and surfzone water quality sampling systems were recovered this quarter due to harshenvironmental conditions and unfortunate tampering. A new nearshore system has been developed with improved cabling. Thesurfzone currents require additional servicing and will be reported upon in subsequent reports.
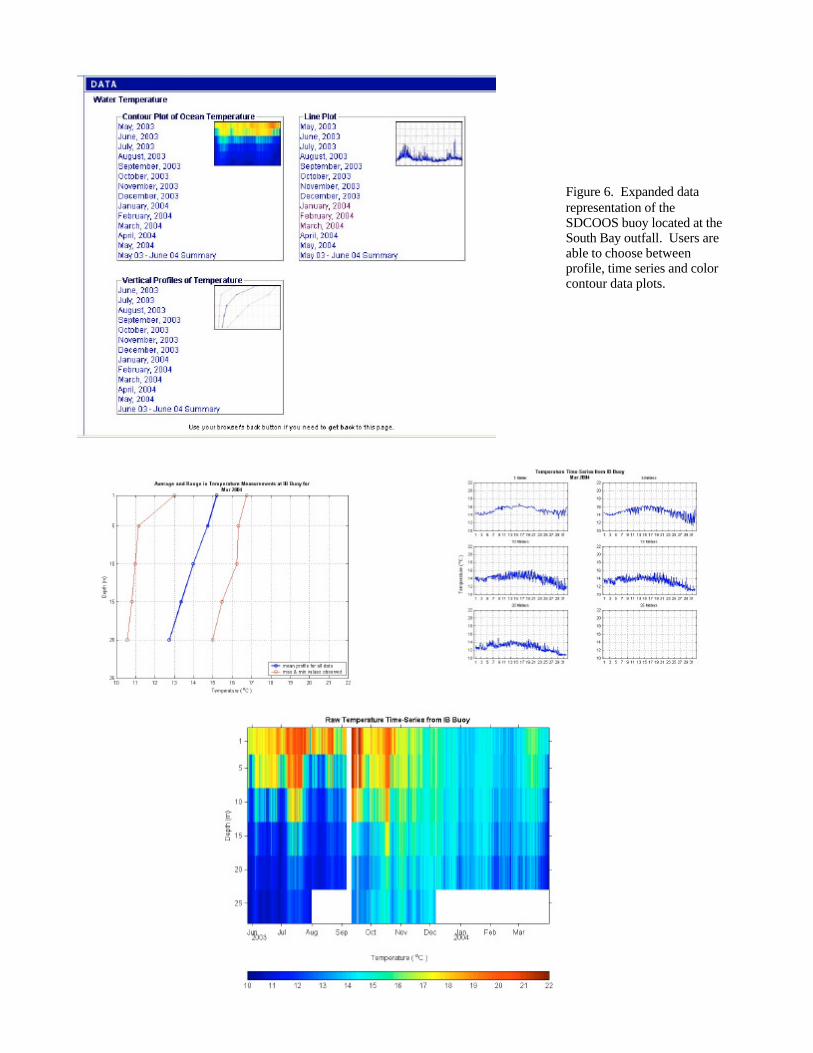
Figure 6. Expanded datarepresentation of theSDCOOS buoy located at theSouth Bay outfall. Users areable to choose betweenprofile, time series and colorcontour data plots.
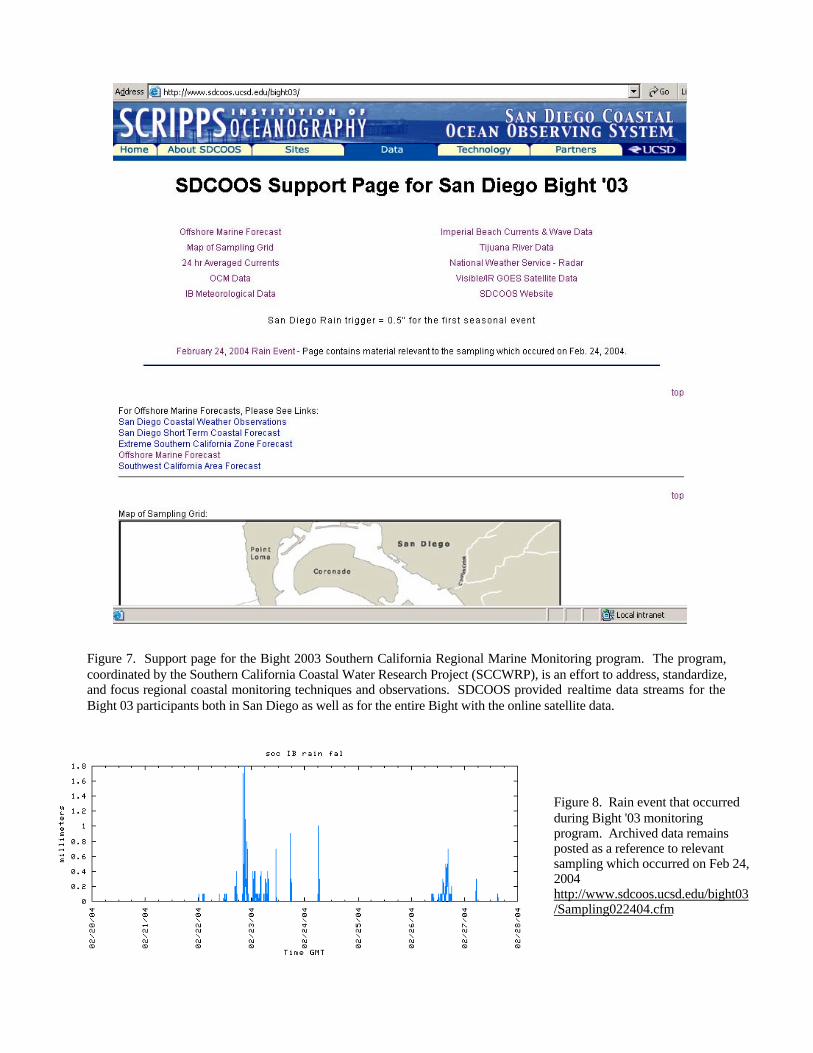
Figure 7. Support page for the Bight 2003 Southern California Regional Marine Monitoring program. The program,coordinated by the Southern California Coastal Water Research Project (SCCWRP), is an effort to address, standardize,and focus regional coastal monitoring techniques and observations. SDCOOS provided realtime data streams for theBight 03 participants both in San Diego as well as for the entire Bight with the online satellite data.
Figure 8. Rain event that occurredduring Bight '03 monitoringprogram. Archived data remainsposted as a reference to relevantsampling which occurred on Feb 24,2004http://www.sdcoos.ucsd.edu/bight03/Sampling022404.cfm

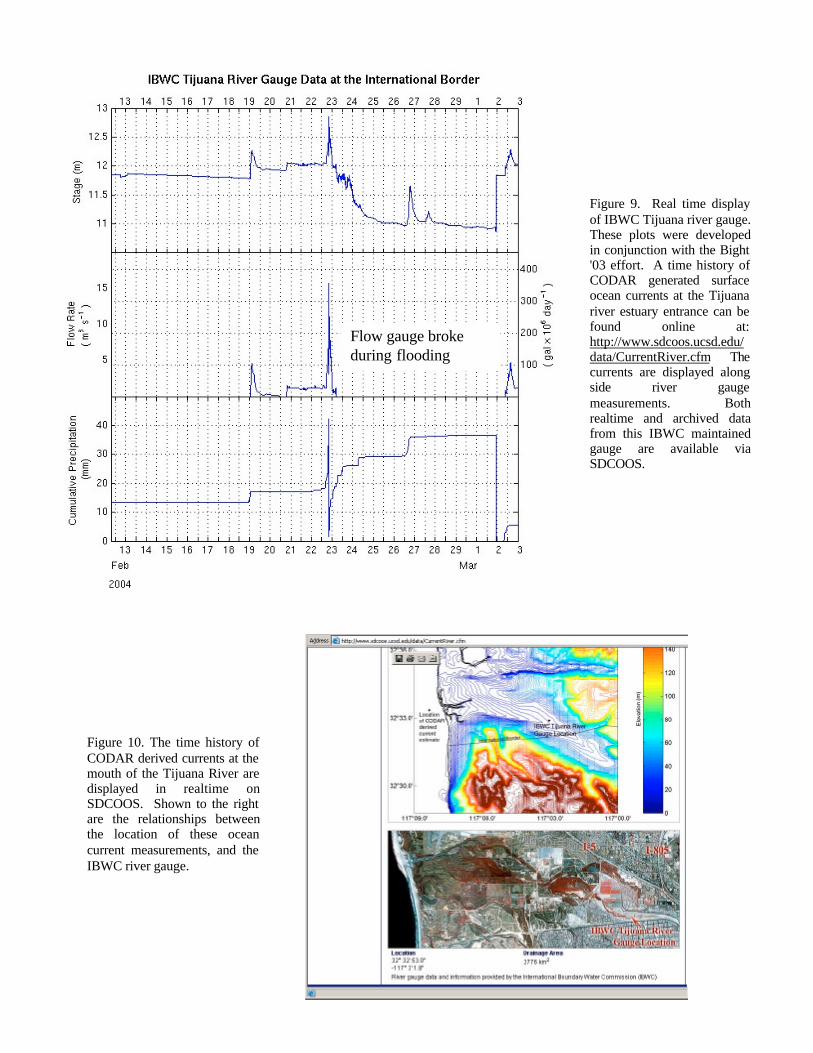
Flow gauge brokeduring flooding
Figure 9. Real time displayof IBWC Tijuana river gauge.These plots were developedin conjunction with the Bight'03 effort. A time history ofCODAR generated surfaceocean currents at the Tijuanariver estuary entrance can befound online at:http://www.sdcoos.ucsd.edu/data/CurrentRiver.cfm Thecurrents are displayed alongside river gaugemeasurements. Bothrealtime and archived datafrom this IBWC maintainedgauge are available viaSDCOOS.
Figure 10. The time history ofCODAR derived currents at themouth of the Tijuana River aredisplayed in realtime onSDCOOS. Shown to the rightare the relationships betweenthe location of these oceancurrent measurements, and theIBWC river gauge.
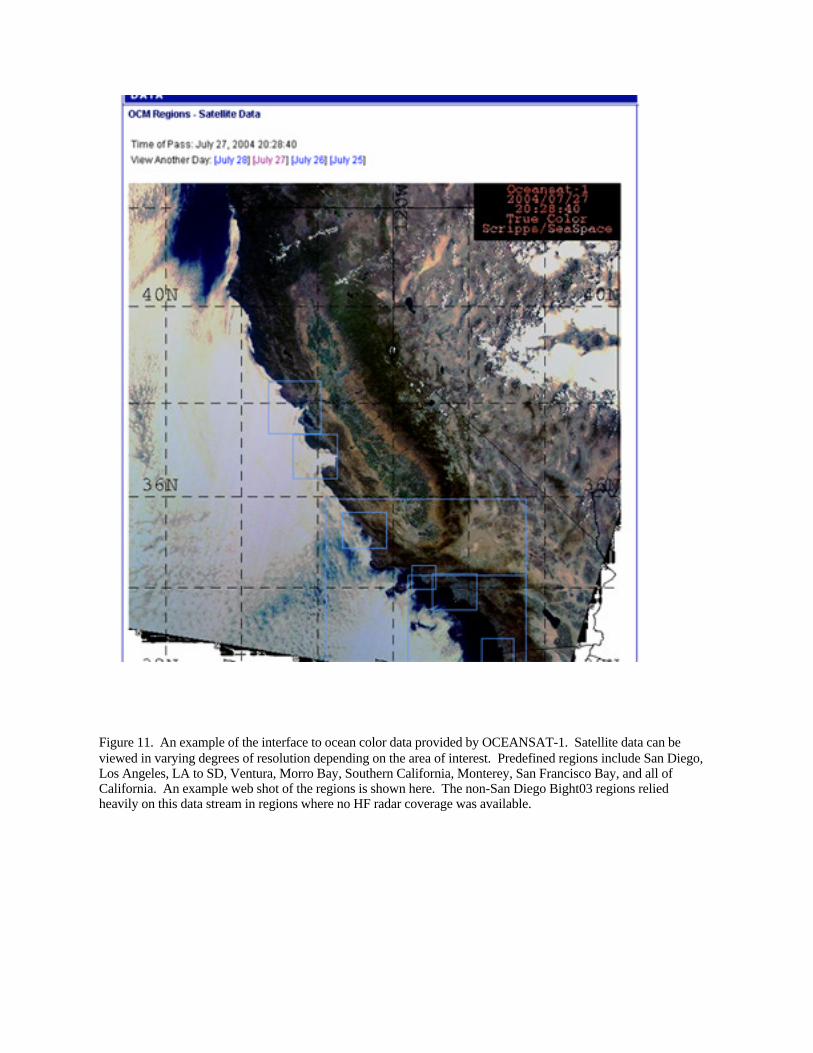
Figure 11. An example of the interface to ocean color data provided by OCEANSAT-1. Satellite data can beviewed in varying degrees of resolution depending on the area of interest. Predefined regions include San Diego,Los Angeles, LA to SD, Ventura, Morro Bay, Southern California, Monterey, San Francisco Bay, and all ofCalifornia. An example web shot of the regions is shown here. The non-San Diego Bight03 regions reliedheavily on this data stream in regions where no HF radar coverage was available.
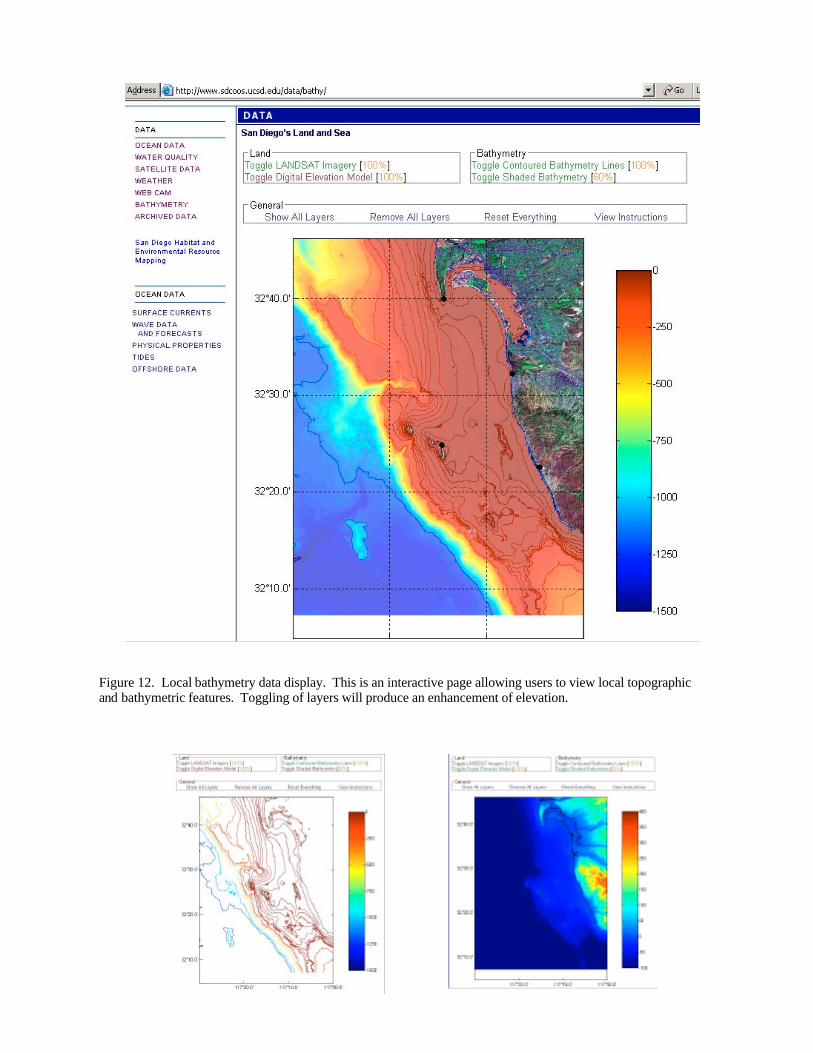
Figure 12. Local bathymetry data display. This is an interactive page allowing users to view local topographicand bathymetric features. Toggling of layers will produce an enhancement of elevation.
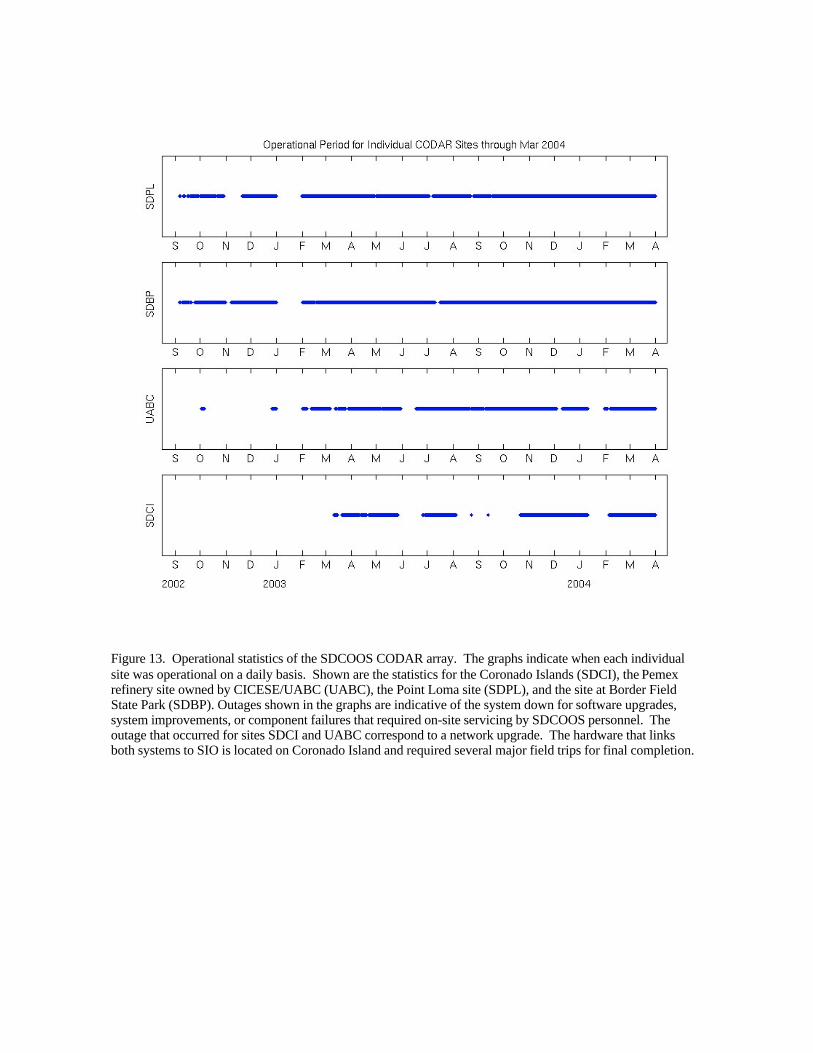
Figure 13. Operational statistics of the SDCOOS CODAR array. The graphs indicate when each individualsite was operational on a daily basis. Shown are the statistics for the Coronado Islands (SDCI), the Pemexrefinery site owned by CICESE/UABC (UABC), the Point Loma site (SDPL), and the site at Border FieldState Park (SDBP). Outages shown in the graphs are indicative of the system down for software upgrades,system improvements, or component failures that required on-site servicing by SDCOOS personnel. Theoutage that occurred for sites SDCI and UABC correspond to a network upgrade. The hardware that linksboth systems to SIO is located on Coronado Island and required several major field trips for final completion.