Embed Size (px)
Citation preview
SOUTH COAST BRITISH COLUMBIA TRANSPORTATION AUTHORITY 2016 STATUTORY ANNUAL REPORT
The South Coast British Columbia Transportation Authority (TransLink) is required to provide an annual report and audited financial statements to the Mayors’ Council on Regional Transportation by March 31st. This report fulfills the reporting obligation to provide: A. A summary of operations during the year with comparison to the strategic transportation plan and the
applicable service, capital and operational plans;
B. The audited financial statements for the year;
C. A summary of the nature of complaints received in the year and actions taken in response to those
complaints;
D. A summary of the results of the customer satisfaction survey process;
E . Amendments to the articles of the Authority;
F . A summary of the date, type and outcome of meetings of TransLink’s Board of Directors held during the year;
G. Fare Collection Bylaw; and
H. A summary of tickets issued and collection under Section 248.
This report should be read in conjunction with the 2016 Annual Report, in order to get a full understanding of the organization and its financial and operational performance. The 2016 Annual Report will be posted on TransLink’s website.
TABLE OF CONTENTS
EXECUTIVE SUMMARY ................................................................................................................................................... 4
A. OPERATIONS SUMMARY ..................................................................................................................................... 5
1 Transportation Services Provided ....................................................................................................................... 5
2 2016 Transportation Plan Status Report............................................................................................................. 7
3 2016 Financial Plan ............................................................................................................................................. 9
4 2016 Capital Program ....................................................................................................................................... 11
5 Transportation Demand Management ............................................................................................................. 21
6 Short-term Fares Assessed ............................................................................................................................... 25
7 Borrowings Undertaken in 2016 ....................................................................................................................... 26
7.1 Long-term Borrowing ........................................................................................................................................ 26
B. AUDITED FINANCIAL STATEMENTS ................................................................................................................... 29
C. COMPLAINTS SUMMARY .................................................................................................................................. 30
D. CUSTOMER SATISFACTION ................................................................................................................................ 38
E. CHANGES TO ARTICLES OF THE AUTHORITY ..................................................................................................... 42
F. BOARD SUMMARY ............................................................................................................................................ 43
G. FARE COLLECTION BYLAW ................................................................................................................................ 48
H. SECTION 248 TICKETS AND COLLECTIONS ........................................................................................................ 51
South Coast British Columbia Transportation Authority—2016 Statutory Annual Report March 2017
EXECUTIVE SUMMARY Under the South Coast British Columbia Transportation Authority Act, TransLink is required to prepare an annual report that includes a summary of operations for the year along with a comparison to the organization’s applicable strategic, service, capital and operational plans. This 2016 Statutory Annual Report meets that requirement, and includes other reporting obligations such as audited financial statements, complaints and customer satisfaction summaries. This report should be read in conjunction with the 2016 Annual Report to obtain a full understanding of the organization and the strategic platform that drives its financial and operational performance. The 2016 Annual Report will be posted on the TransLink website. TransLink’s current Strategic Plan, as defined by legislation, is Transportation and Financial Base Plan for 2014 to 2016 and Outlook for 2017 to 2023 (2014 Base Plan and Outlook). This 2016 Statutory Annual Report makes reference to year 3 of the 2014 Base Plan and Outlook.
Page 4 of 51
South Coast British Columbia Transportation Authority—2016 Statutory Annual Report March 2017
A. OPERATIONS SUMMARY
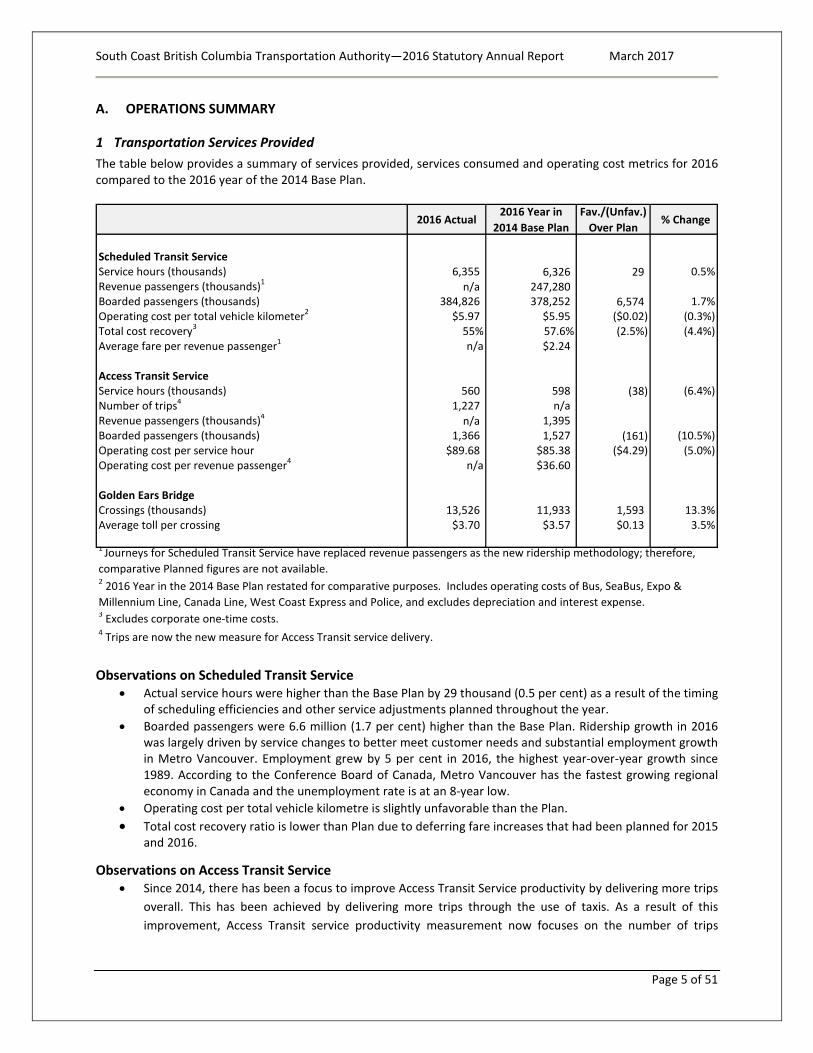
1 Transportation Services Provided The table below provides a summary of services provided, services consumed and operating cost metrics for 2016 compared to the 2016 year of the 2014 Base Plan.
Observations on Scheduled Transit Service
• Actual service hours were higher than the Base Plan by 29 thousand (0.5 per cent) as a result of the timing of scheduling efficiencies and other service adjustments planned throughout the year.
• Boarded passengers were 6.6 million (1.7 per cent) higher than the Base Plan. Ridership growth in 2016 was largely driven by service changes to better meet customer needs and substantial employment growth in Metro Vancouver. Employment grew by 5 per cent in 2016, the highest year-over-year growth since 1989. According to the Conference Board of Canada, Metro Vancouver has the fastest growing regional economy in Canada and the unemployment rate is at an 8-year low.
• Operating cost per total vehicle kilometre is slightly unfavorable than the Plan. • Total cost recovery ratio is lower than Plan due to deferring fare increases that had been planned for 2015
and 2016.
Observations on Access Transit Service • Since 2014, there has been a focus to improve Access Transit Service productivity by delivering more trips
overall. This has been achieved by delivering more trips through the use of taxis. As a result of this improvement, Access Transit service productivity measurement now focuses on the number of trips
2016 Actual2016 Year in
2014 Base PlanFav./(Unfav.)
Over Plan % Change
Scheduled Transit ServiceService hours (thousands) 6,355 6,326 29 0.5%Revenue passengers (thousands)1 n/a 247,280 Boarded passengers (thousands) 384,826 378,252 6,574 1.7%Operating cost per total vehicle kilometer2 $5.97 $5.95 ($0.02) (0.3%)Total cost recovery3 55% 57.6% (2.5%) (4.4%)Average fare per revenue passenger1 n/a $2.24
Access Transit Service Service hours (thousands) 560 598 (38) (6.4%)Number of trips4 1,227 n/aRevenue passengers (thousands)4 n/a 1,395 Boarded passengers (thousands) 1,366 1,527 (161) (10.5%)Operating cost per service hour $89.68 $85.38 ($4.29) (5.0%)Operating cost per revenue passenger4 n/a $36.60
Golden Ears BridgeCrossings (thousands) 13,526 11,933 1,593 13.3%Average toll per crossing $3.70 $3.57 $0.13 3.5%
1 Journeys for Scheduled Transit Service have replaced revenue passengers as the new ridership methodology; therefore, comparative Planned figures are not available.2 2016 Year in the 2014 Base Plan restated for comparative purposes. Includes operating costs of Bus, SeaBus, Expo & Millennium Line, Canada Line, West Coast Express and Police, and excludes depreciation and interest expense.
4 Trips are now the new measure for Access Transit service delivery.
3 Excludes corporate one-time costs.
Page 5 of 51
South Coast British Columbia Transportation Authority—2016 Statutory Annual Report March 2017
delivered. Trips are demand based and fluctuate with clientele demand. The number of Access Transit trips offered increased slightly (1.9 per cent) over 2015. In 2016, Access Transit delivered a total of 1.2 million trips, of which 10.8 per cent were through the use of taxis.
• Service hours and operating costs per service hour are unfavourable due to a shift and increase in trips being provided by taxis and fewer HandyDART service hours.
Observations on Golden Ears Bridge
• Golden Ears Bridge crossings were 1.6 million (13.3 per cent) higher than Plan and is attributed to increased Vehicle Kilometres Travelled (VKT) in the region.
• The average toll rate per crossing was favourable compared to Plan due to a higher number of unregistered/pay as you go vehicles not taking advantage of discounted rates.
Page 6 of 51
South Coast British Columbia Transportation Authority—2016 Statutory Annual Report March 2017
2 2016 Transportation Plan Status Report The following items from the 2014 Base Plan and Outlook were identified as occurring in 2016. An update of their status is provided below: What’s in the Plan The 2014 Base Plan included initiatives to improve operational efficiency, improve service, define an appropriate solution for the Pattullo Bridge operation and maintenance, and plan an efficient Major Road Network.
• A deck rehabilitation project on the 79-year-old Pattullo Bridge, to keep it functional and safe to operate until a replacement bridge is built, was completed one month earlier than planned in the summer of 2016. Work was focused on essential deck repairs to address concrete delamination on sections of the bridge. Repairs were designed to extend the life of the bridge deck with minimum maintenance to keep the bridge operational while a replacement bridge is designed and built. In the meantime, TransLink will continue to regularly inspect the bridge and make necessary repairs in the future to maintain safety and functionality.
• In 2016, progress was made on defining the base concept for the Pattullo Bridge Replacement. A Memorandum of Understanding was signed with the Cities of New Westminster and Surrey, and the new bridge connections to the municipal and provincial road networks were defined. A Business Case was submitted to P3 Canada, and discussions continue with the Federal and Provincial governments to reach agreement on project funding and financing.
Invest Strategically Strategic investment activities contemplated in the 2014 Base Plan and advanced in 2016 included station upgrades on the Expo Line, the launch of revenue service for the Millennium Line Evergreen Extension, and the purchase of more energy efficient and environmentally friendly revenue vehicles.
• In 2016, 71 new 40’ conventional diesel buses replaced buses that had reached the end of their service lives. These new buses have 95 per cent lower Criteria Air Contaminants and 5 per cent lower Green House Gas emissions. There were also 62 new community shuttles that replaced defective shuttles in 2016.
• TransLink initiated a new phase of the Custom Transit Service Delivery Review in response to recent customer concerns about service quality and delivery.
• The New Westminster Station Upgrade project was completed. This was the third of seven station upgrade projects to be completed. Construction continued on Joyce-Collingwood, Commercial Broadway, Metrotown and Surrey City Centre, which reached the procurement stage in 2016.
• TransLink worked closely with the Evergreen Project team to achieve the successful launch of revenue service in December. This included systems integration work, testing and commissioning, updating way finding, integrating stations with the communities and initiating a new bus service plan in the northeast sector to connect bus service to the Evergreen Extension. Work also continued on the upgrades at Commercial Broadway Station, to expand station capacity and improve passenger circulation.
Manage the System A focus of the 2016 year in the 2014 Base Plan was on finding efficiencies to generate cost savings while maintaining existing service levels and using available funds to invest strategically. TransLink’s operating companies continue to pursue cost saving efficiencies through operator and route scheduling, such as recovery time, right sizing the fleet and re-allocating lower productivity service hours to more productive routes.
Page 7 of 51
South Coast British Columbia Transportation Authority—2016 Statutory Annual Report March 2017
• Coast Mountain Bus Company delivered more service in 2016 with the same fleet and number of operators. Recovery time rates for conventional bus were the same and for community shuttle was slightly reduced as a result of efficiencies gained through run-time adjustments.
• Over 80 network changes were rolled out over the course of 2016, including revising over 20 bus routes to better connect to the Evergreen Extension in December. Other changes implemented in 2016 decreased travel time on busy routes, extended service to areas with high customer demand, took advantage of road and infrastructure changes, and made our system more efficient.
• The first phase of the Southwest Area Transport Plan was completed, following a public consultation period in spring 2016. Work on the second phase of the plan, which will identify priorities for improving transit and transportation in the sub-region, began in 2016 and will continue into 2017.
• Phase 2 of the new Transit Police community-based service delivery model (six hubs) was implemented in 2016. Six neighbourhood police officers are now in place. Development of action blueprints are underway to address safety and crime issues in relation to each of the six transit hubs. A collaborative, joint policing approach with jurisdictional police was launched with the rollout of the Evergreen Extension in December 2016. Joint training has also occurred for coordinated response to significant incidents.
Partner to Make It Happen TransLink works with municipalities and all levels of governments, businesses, residents and customers to ensure investment and transportation decisions support land use decisions, ensures efficient movement of goods, leverages real estate assets and considers stakeholders.
• In 2016, TransLink completed the sale of two surplus properties. Proceeds will be primarily used to secure real property to support future transportation projects.
• TransLink’s Adjacent and Integrated Development (AID) Program continues to engage adjacent property owners to integrate and construct in a safe manner, supporting Metro Vancouver’s Regional Growth Strategy. More than 70 development projects were actively managed and monitored under the AID Program.
Achieving Our Goals Transportation is a significant contributor to climate change through the emission of greenhouse gases. TransLink contributes to protecting the environment through lowering greenhouse gas emissions, supporting a compact urban form and minimizing encroachment on designated conservation, recreation, agricultural and rural lands.
• In 2016, TransLink reduced Criteria Air Contaminant (CAC) emissions by 36 tonnes (from 748 to 712) as a result of retiring older fleet and running more efficient, clean engines.
Page 8 of 51
South Coast British Columbia Transportation Authority—2016 Statutory Annual Report March 2017
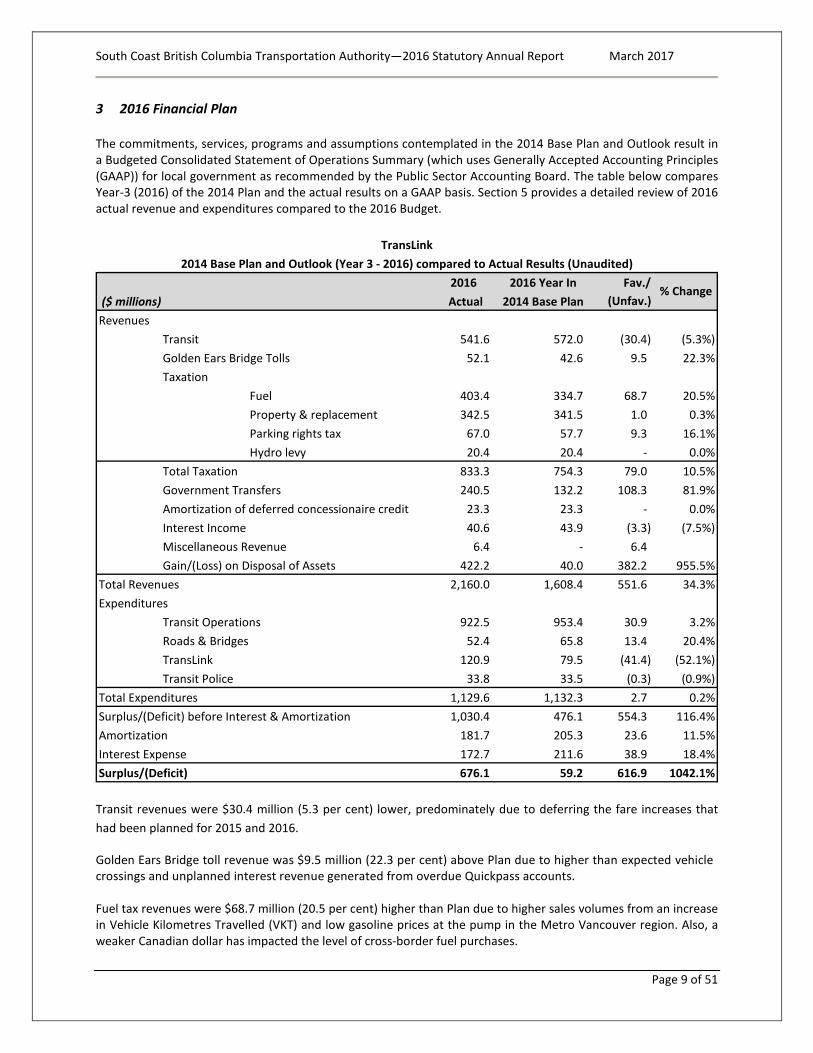
3 2016 Financial Plan The commitments, services, programs and assumptions contemplated in the 2014 Base Plan and Outlook result in a Budgeted Consolidated Statement of Operations Summary (which uses Generally Accepted Accounting Principles (GAAP)) for local government as recommended by the Public Sector Accounting Board. The table below compares Year-3 (2016) of the 2014 Plan and the actual results on a GAAP basis. Section 5 provides a detailed review of 2016 actual revenue and expenditures compared to the 2016 Budget.
Transit revenues were $30.4 million (5.3 per cent) lower, predominately due to deferring the fare increases that had been planned for 2015 and 2016.
Golden Ears Bridge toll revenue was $9.5 million (22.3 per cent) above Plan due to higher than expected vehicle crossings and unplanned interest revenue generated from overdue Quickpass accounts. Fuel tax revenues were $68.7 million (20.5 per cent) higher than Plan due to higher sales volumes from an increase in Vehicle Kilometres Travelled (VKT) and low gasoline prices at the pump in the Metro Vancouver region. Also, a weaker Canadian dollar has impacted the level of cross-border fuel purchases.
2016 2016 Year In Fav./ ($ millions) Actual 2014 Base Plan (Unfav.) Revenues
Transit 541.6 572.0 (30.4) (5.3%)Golden Ears Bridge Tolls 52.1 42.6 9.5 22.3%Taxation
Fuel 403.4 334.7 68.7 20.5%Property & replacement 342.5 341.5 1.0 0.3%Parking rights tax 67.0 57.7 9.3 16.1%Hydro levy 20.4 20.4 - 0.0%
Total Taxation 833.3 754.3 79.0 10.5%Government Transfers 240.5 132.2 108.3 81.9%Amortization of deferred concessionaire credit 23.3 23.3 - 0.0%Interest Income 40.6 43.9 (3.3) (7.5%)Miscellaneous Revenue 6.4 - 6.4 Gain/(Loss) on Disposal of Assets 422.2 40.0 382.2 955.5%
Total Revenues 2,160.0 1,608.4 551.6 34.3%Expenditures
Transit Operations 922.5 953.4 30.9 3.2%Roads & Bridges 52.4 65.8 13.4 20.4%TransLink 120.9 79.5 (41.4) (52.1%)Transit Police 33.8 33.5 (0.3) (0.9%)
Total Expenditures 1,129.6 1,132.3 2.7 0.2%Surplus/(Deficit) before Interest & Amortization 1,030.4 476.1 554.3 116.4%Amortization 181.7 205.3 23.6 11.5%Interest Expense 172.7 211.6 38.9 18.4%Surplus/(Deficit) 676.1 59.2 616.9 1042.1%
TransLink2014 Base Plan and Outlook (Year 3 - 2016) compared to Actual Results (Unaudited)
% Change
Page 9 of 51
South Coast British Columbia Transportation Authority—2016 Statutory Annual Report March 2017
Property and replacement tax revenues were $1.0 million (0.3 per cent) above Plan. Rates are set annually to achieve the planned property tax with an adjustment for changes to property values factored into the calculation. The increase is attributable to fewer adjustments when property tax assessments were finalized. Parking rights taxes were $9.3 million (16.1 per cent) favourable to Plan as more revenues were remitted by parking vendors, consistent with increased Vehicle Kilometres Travelled in the transit region. Government funding transfers were $108.3 million (81.9 per cent) favourable to Plan. This is primarily due to increase in revenue recognized under the Federal Gas Tax Program of $74.7 million and one-time funding of $23.2 million from the Province for Lincoln Station on the Evergreen Extension, which was not included in the Plan. The additional Federal Gas Tax revenue of $74.7 million is due to a required change in accounting treatment related to a new agreement with the Union of British Columbia Municipalities (UBCM) for Federal Gas Tax Funds signed in 2015. Effective April 1, 2014, Generally Accepted Accounting Principles for the Public Sector require that the funds received be recorded as revenues at the time the funds are spent. Previously, the contract required the assets to be held for at least ten years and the funds received were recognized over the ten year period. Interest income was $3.3 million (7.5 per cent) below Plan primarily due to lower interest rates and lower sinking fund balances partly offset by higher actual returns on the sinking funds. Miscellaneous revenues were $6.4 million, consisting mostly of recoveries from third parties. The Plan forecasts expenditures net of recoveries, therefore miscellaneous revenue was not included in the Plan. Gain on disposal of assets from the sale of surplus property was $382.2 million more than the Plan due to earlier and higher than anticipated gains on sales of surplus properties. Transit Operations costs were $30.9 million (3.2 per cent) favourable to Plan as a result of the early execution of the West Coast Express rail car lease buyout in 2015 rather than in 2016, lower diesel fuel costs, and the timing of the Evergreen Extension integration in December. These favourable variances are offset by additional state of good repair costs and higher revenue vehicle material costs, increased labour costs, higher fare media costs and higher vehicle insurance rates. Increased labour costs were mainly related to additional staff on Expo/Millennium Lines in response to the recommendations put forward in the Independent Review of the SkyTrain disruptions in 2014. Spending on roads and bridges was $13.4 million (20.4 per cent) lower than Plan mainly due to a recovery of a prior year expense, offset by Pattullo Bridge rehabilitation costs and timing of capital funding to municipalities. TransLink costs of $120.9 million were $41.4 million (52.1 per cent) unfavourable to Plan mainly due to one-time costs. One-time costs include rapid transit studies, Compass implementation and Evergreen Extension start-up costs. Corporate ongoing costs were higher mainly due to credit card interchange fees associated with direct fare product sales of Compass cards and tickets, higher feasibility studies mainly in response to recommendations from the 2014 Independent SkyTrain Review, and claims paid out by TransLink’s Transportation Property Casualty Company (TPCC). Amortization was $23.6 million (11.5 per cent) below Plan mainly due to timing of capital project completion in major construction projects and revenue vehicles, offset by higher depreciation of major capital spare parts from BCRTC. Interest expense was $38.9 million (18.4 per cent) below Plan due to both lower than anticipated borrowings (from later than planned capital spending) and lower interest rates.
Page 10 of 51
South Coast British Columbia Transportation Authority—2016 Statutory Annual Report March 2017
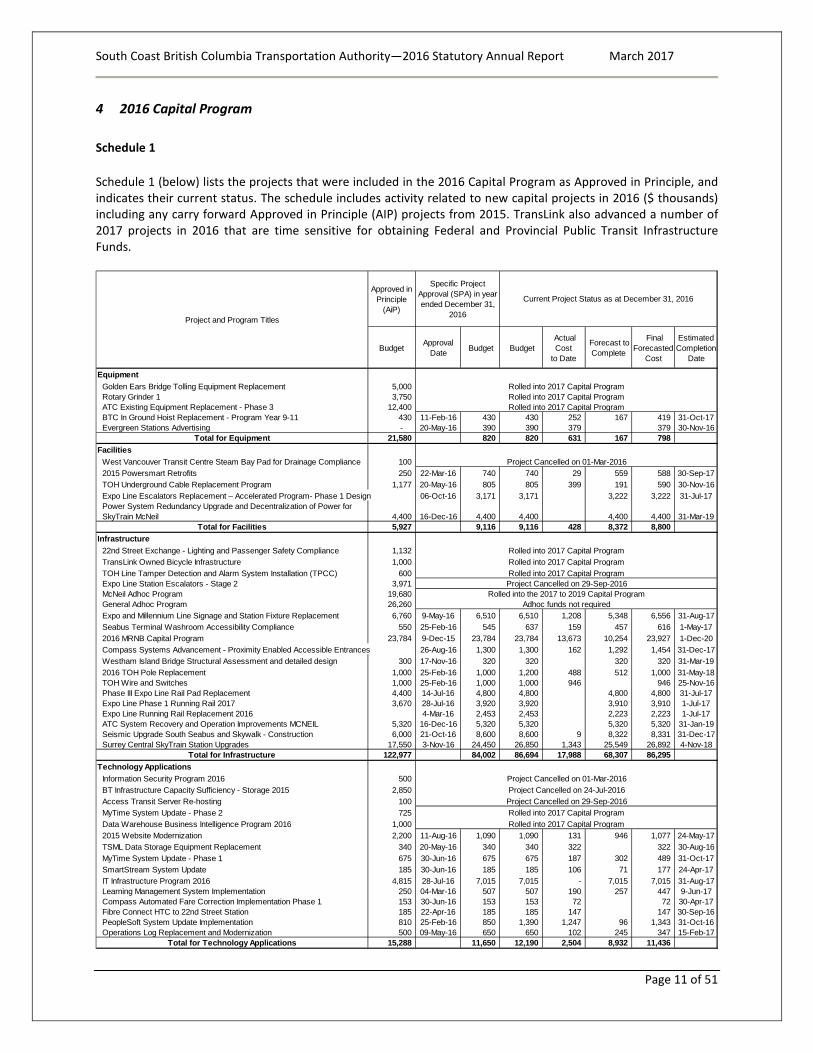
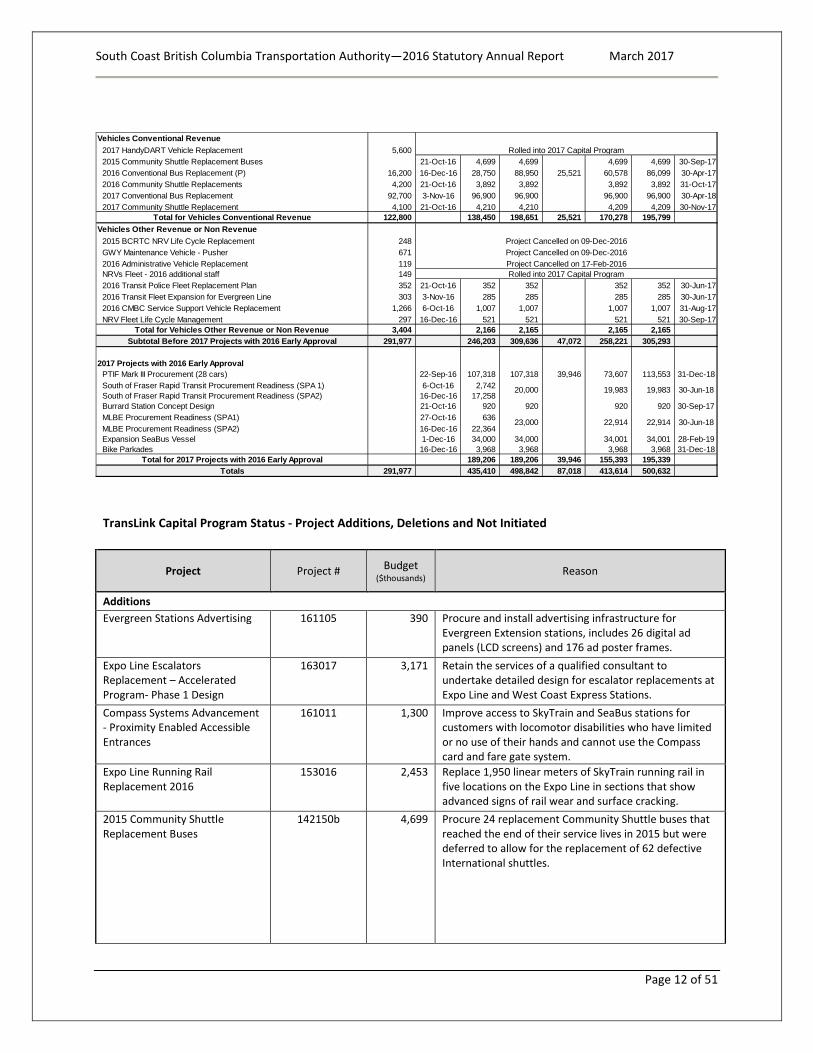
4 2016 Capital Program Schedule 1 Schedule 1 (below) lists the projects that were included in the 2016 Capital Program as Approved in Principle, and indicates their current status. The schedule includes activity related to new capital projects in 2016 ($ thousands) including any carry forward Approved in Principle (AIP) projects from 2015. TransLink also advanced a number of 2017 projects in 2016 that are time sensitive for obtaining Federal and Provincial Public Transit Infrastructure Funds.
Approved in Principle
(AiP)
BudgetApproval
Date Budget Budget Actual Cost
to Date
Forecast to Complete
Final Forecasted
Cost
Estimated Completion
Date
EquipmentGolden Ears Bridge Tolling Equipment Replacement 5,000 Rotary Grinder 1 3,750 ATC Existing Equipment Replacement - Phase 3 12,400 BTC In Ground Hoist Replacement - Program Year 9-11 430 11-Feb-16 430 430 252 167 419 31-Oct-17Evergreen Stations Advertising - 20-May-16 390 390 379 379 30-Nov-16
Total for Equipment 21,580 820 820 631 167 798 Facilities
West Vancouver Transit Centre Steam Bay Pad for Drainage Compliance 100 2015 Powersmart Retrofits 250 22-Mar-16 740 740 29 559 588 30-Sep-17TOH Underground Cable Replacement Program 1,177 20-May-16 805 805 399 191 590 30-Nov-16Expo Line Escalators Replacement – Accelerated Program- Phase 1 Design 06-Oct-16 3,171 3,171 3,222 3,222 31-Jul-17Power System Redundancy Upgrade and Decentralization of Power for SkyTrain McNeil 4,400 16-Dec-16 4,400 4,400 4,400 4,400 31-Mar-19
Total for Facilities 5,927 9,116 9,116 428 8,372 8,800 Infrastructure
22nd Street Exchange - Lighting and Passenger Safety Compliance 1,132 TransLink Owned Bicycle Infrastructure 1,000 TOH Line Tamper Detection and Alarm System Installation (TPCC) 600 Expo Line Station Escalators - Stage 2 3,971 McNeil Adhoc Program 19,680 General Adhoc Program 26,260 Expo and Millennium Line Signage and Station Fixture Replacement 6,760 9-May-16 6,510 6,510 1,208 5,348 6,556 31-Aug-17Seabus Terminal Washroom Accessibility Compliance 550 25-Feb-16 545 637 159 457 616 1-May-172016 MRNB Capital Program 23,784 9-Dec-15 23,784 23,784 13,673 10,254 23,927 1-Dec-20Compass Systems Advancement - Proximity Enabled Accessible Entrances 26-Aug-16 1,300 1,300 162 1,292 1,454 31-Dec-17Westham Island Bridge Structural Assessment and detailed design 300 17-Nov-16 320 320 320 320 31-Mar-192016 TOH Pole Replacement 1,000 25-Feb-16 1,000 1,200 488 512 1,000 31-May-18TOH Wire and Switches 1,000 25-Feb-16 1,000 1,000 946 946 25-Nov-16Phase III Expo Line Rail Pad Replacement 4,400 14-Jul-16 4,800 4,800 4,800 4,800 31-Jul-17Expo Line Phase 1 Running Rail 2017 3,670 28-Jul-16 3,920 3,920 3,910 3,910 1-Jul-17Expo Line Running Rail Replacement 2016 4-Mar-16 2,453 2,453 2,223 2,223 1-Jul-17ATC System Recovery and Operation Improvements MCNEIL 5,320 16-Dec-16 5,320 5,320 5,320 5,320 31-Jan-19Seismic Upgrade South Seabus and Skywalk - Construction 6,000 21-Oct-16 8,600 8,600 9 8,322 8,331 31-Dec-17Surrey Central SkyTrain Station Upgrades 17,550 3-Nov-16 24,450 26,850 1,343 25,549 26,892 4-Nov-18
Total for Infrastructure 122,977 84,002 86,694 17,988 68,307 86,295 Technology Applications
Information Security Program 2016 500 BT Infrastructure Capacity Sufficiency - Storage 2015 2,850 Access Transit Server Re-hosting 100 MyTime System Update - Phase 2 725 Data Warehouse Business Intelligence Program 2016 1,000 2015 Website Modernization 2,200 11-Aug-16 1,090 1,090 131 946 1,077 24-May-17TSML Data Storage Equipment Replacement 340 20-May-16 340 340 322 322 30-Aug-16MyTime System Update - Phase 1 675 30-Jun-16 675 675 187 302 489 31-Oct-17SmartStream System Update 185 30-Jun-16 185 185 106 71 177 24-Apr-17IT Infrastructure Program 2016 4,815 28-Jul-16 7,015 7,015 - 7,015 7,015 31-Aug-17Learning Management System Implementation 250 04-Mar-16 507 507 190 257 447 9-Jun-17Compass Automated Fare Correction Implementation Phase 1 153 30-Jun-16 153 153 72 72 30-Apr-17Fibre Connect HTC to 22nd Street Station 185 22-Apr-16 185 185 147 147 30-Sep-16PeopleSoft System Update Implementation 810 25-Feb-16 850 1,390 1,247 96 1,343 31-Oct-16Operations Log Replacement and Modernization 500 09-May-16 650 650 102 245 347 15-Feb-17
Total for Technology Applications 15,288 11,650 12,190 2,504 8,932 11,436
Rolled into 2017 Capital Program
Project Cancelled on 01-Mar-2016
Rolled into 2017 Capital ProgramRolled into 2017 Capital ProgramRolled into 2017 Capital ProgramProject Cancelled on 29-Sep-2016
Rolled into the 2017 to 2019 Capital ProgramAdhoc funds not required
Project Cancelled on 01-Mar-2016Project Cancelled on 24-Jul-2016Project Cancelled on 29-Sep-2016Rolled into 2017 Capital Program
Rolled into 2017 Capital Program
Project and Program Titles
Specific Project Approval (SPA) in year ended December 31,
2016
Current Project Status as at December 31, 2016
Rolled into 2017 Capital ProgramRolled into 2017 Capital Program
Page 11 of 51
South Coast British Columbia Transportation Authority—2016 Statutory Annual Report March 2017
TransLink Capital Program Status - Project Additions, Deletions and Not Initiated
Project Project # Budget
($thousands) Reason
Additions Evergreen Stations Advertising 161105 390 Procure and install advertising infrastructure for
Evergreen Extension stations, includes 26 digital ad panels (LCD screens) and 176 ad poster frames.
Expo Line Escalators Replacement – Accelerated Program- Phase 1 Design
163017 3,171 Retain the services of a qualified consultant to undertake detailed design for escalator replacements at Expo Line and West Coast Express Stations.
Compass Systems Advancement - Proximity Enabled Accessible Entrances
161011 1,300 Improve access to SkyTrain and SeaBus stations for customers with locomotor disabilities who have limited or no use of their hands and cannot use the Compass card and fare gate system.
Expo Line Running Rail Replacement 2016
153016 2,453 Replace 1,950 linear meters of SkyTrain running rail in five locations on the Expo Line in sections that show advanced signs of rail wear and surface cracking.
2015 Community Shuttle Replacement Buses
142150b 4,699 Procure 24 replacement Community Shuttle buses that reached the end of their service lives in 2015 but were deferred to allow for the replacement of 62 defective International shuttles.
Vehicles Conventional Revenue2017 HandyDART Vehicle Replacement 5,600 2015 Community Shuttle Replacement Buses 21-Oct-16 4,699 4,699 4,699 4,699 30-Sep-172016 Conventional Bus Replacement (P) 16,200 16-Dec-16 28,750 88,950 25,521 60,578 86,099 30-Apr-172016 Community Shuttle Replacements 4,200 21-Oct-16 3,892 3,892 3,892 3,892 31-Oct-172017 Conventional Bus Replacement 92,700 3-Nov-16 96,900 96,900 96,900 96,900 30-Apr-182017 Community Shuttle Replacement 4,100 21-Oct-16 4,210 4,210 4,209 4,209 30-Nov-17
Total for Vehicles Conventional Revenue 122,800 138,450 198,651 25,521 170,278 195,799 Vehicles Other Revenue or Non Revenue
2015 BCRTC NRV Life Cycle Replacement 248 GWY Maintenance Vehicle - Pusher 671 2016 Administrative Vehicle Replacement 119 NRVs Fleet - 2016 additional staff 149 2016 Transit Police Fleet Replacement Plan 352 21-Oct-16 352 352 352 352 30-Jun-172016 Transit Fleet Expansion for Evergreen Line 303 3-Nov-16 285 285 285 285 30-Jun-172016 CMBC Service Support Vehicle Replacement 1,266 6-Oct-16 1,007 1,007 1,007 1,007 31-Aug-17NRV Fleet Life Cycle Management 297 16-Dec-16 521 521 521 521 30-Sep-17
Total for Vehicles Other Revenue or Non Revenue 3,404 2,166 2,165 2,165 2,165 Subtotal Before 2017 Projects with 2016 Early Approval 291,977 246,203 309,636 47,072 258,221 305,293
2017 Projects with 2016 Early Approval PTIF Mark III Procurement (28 cars) 22-Sep-16 107,318 107,318 39,946 73,607 113,553 31-Dec-18South of Fraser Rapid Transit Procurement Readiness (SPA 1) 6-Oct-16 2,742 South of Fraser Rapid Transit Procurement Readiness (SPA2) 16-Dec-16 17,258 Burrard Station Concept Design 21-Oct-16 920 920 920 920 30-Sep-17MLBE Procurement Readiness (SPA1) 27-Oct-16 636 MLBE Procurement Readiness (SPA2) 16-Dec-16 22,364 Expansion SeaBus Vessel 1-Dec-16 34,000 34,000 34,001 34,001 28-Feb-19Bike Parkades 16-Dec-16 3,968 3,968 3,968 3,968 31-Dec-18
Total for 2017 Projects with 2016 Early Approval 189,206 189,206 39,946 155,393 195,339 Totals 291,977 435,410 498,842 87,018 413,614 500,632
Rolled into 2017 Capital Program
Project Cancelled on 09-Dec-2016Project Cancelled on 09-Dec-2016Project Cancelled on 17-Feb-2016Rolled into 2017 Capital Program
30-Jun-18
23,000 22,914 22,914 30-Jun-18
20,000 19,983 19,983
Page 12 of 51
South Coast British Columbia Transportation Authority—2016 Statutory Annual Report March 2017
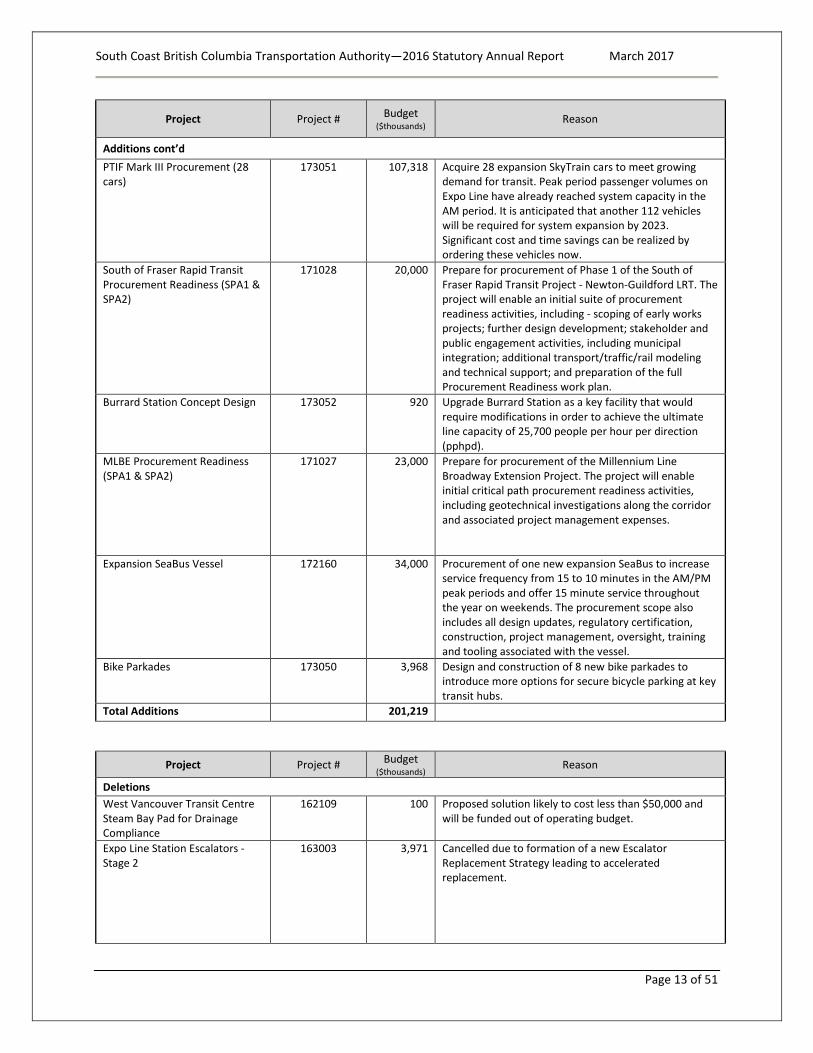
Project Project # Budget ($thousands) Reason
Additions cont’d PTIF Mark III Procurement (28 cars)
173051 107,318 Acquire 28 expansion SkyTrain cars to meet growing demand for transit. Peak period passenger volumes on Expo Line have already reached system capacity in the AM period. It is anticipated that another 112 vehicles will be required for system expansion by 2023. Significant cost and time savings can be realized by ordering these vehicles now.
South of Fraser Rapid Transit Procurement Readiness (SPA1 & SPA2)
171028 20,000 Prepare for procurement of Phase 1 of the South of Fraser Rapid Transit Project - Newton-Guildford LRT. The project will enable an initial suite of procurement readiness activities, including - scoping of early works projects; further design development; stakeholder and public engagement activities, including municipal integration; additional transport/traffic/rail modeling and technical support; and preparation of the full Procurement Readiness work plan.
Burrard Station Concept Design 173052 920 Upgrade Burrard Station as a key facility that would require modifications in order to achieve the ultimate line capacity of 25,700 people per hour per direction (pphpd).
MLBE Procurement Readiness (SPA1 & SPA2)
171027 23,000 Prepare for procurement of the Millennium Line Broadway Extension Project. The project will enable initial critical path procurement readiness activities, including geotechnical investigations along the corridor and associated project management expenses.
Expansion SeaBus Vessel 172160 34,000 Procurement of one new expansion SeaBus to increase service frequency from 15 to 10 minutes in the AM/PM peak periods and offer 15 minute service throughout the year on weekends. The procurement scope also includes all design updates, regulatory certification, construction, project management, oversight, training and tooling associated with the vessel.
Bike Parkades 173050 3,968 Design and construction of 8 new bike parkades to introduce more options for secure bicycle parking at key transit hubs.
Total Additions 201,219
Project Project # Budget ($thousands) Reason
Deletions West Vancouver Transit Centre Steam Bay Pad for Drainage Compliance
162109 100 Proposed solution likely to cost less than $50,000 and will be funded out of operating budget.
Expo Line Station Escalators - Stage 2
163003 3,971 Cancelled due to formation of a new Escalator Replacement Strategy leading to accelerated replacement.
Page 13 of 51
South Coast British Columbia Transportation Authority—2016 Statutory Annual Report March 2017
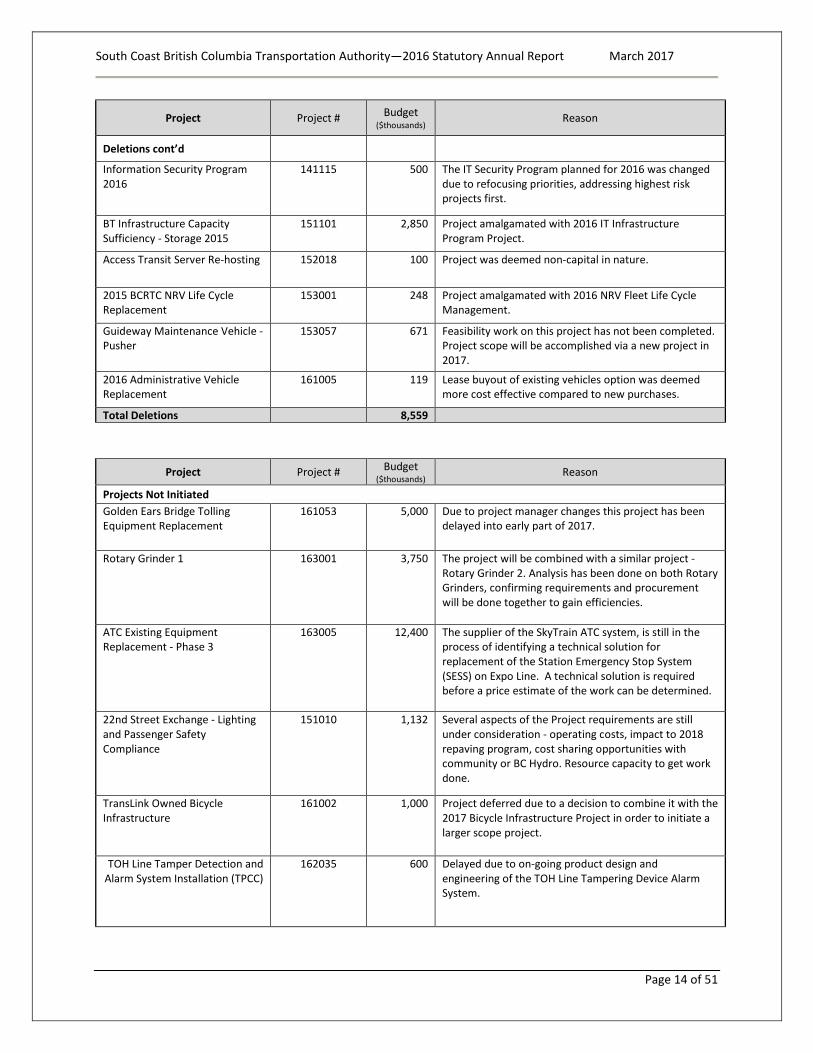
Project Project # Budget ($thousands) Reason
Deletions cont’d Information Security Program 2016
141115 500 The IT Security Program planned for 2016 was changed due to refocusing priorities, addressing highest risk projects first.
BT Infrastructure Capacity Sufficiency - Storage 2015
151101 2,850 Project amalgamated with 2016 IT Infrastructure Program Project.
Access Transit Server Re-hosting 152018 100 Project was deemed non-capital in nature.
2015 BCRTC NRV Life Cycle Replacement
153001 248 Project amalgamated with 2016 NRV Fleet Life Cycle Management.
Guideway Maintenance Vehicle - Pusher
153057 671 Feasibility work on this project has not been completed. Project scope will be accomplished via a new project in 2017.
2016 Administrative Vehicle Replacement
161005 119 Lease buyout of existing vehicles option was deemed more cost effective compared to new purchases.
Total Deletions 8,559
Project Project # Budget ($thousands) Reason
Projects Not Initiated Golden Ears Bridge Tolling Equipment Replacement
161053 5,000 Due to project manager changes this project has been delayed into early part of 2017.
Rotary Grinder 1 163001 3,750 The project will be combined with a similar project - Rotary Grinder 2. Analysis has been done on both Rotary Grinders, confirming requirements and procurement will be done together to gain efficiencies.
ATC Existing Equipment Replacement - Phase 3
163005 12,400 The supplier of the SkyTrain ATC system, is still in the process of identifying a technical solution for replacement of the Station Emergency Stop System (SESS) on Expo Line. A technical solution is required before a price estimate of the work can be determined.
22nd Street Exchange - Lighting and Passenger Safety Compliance
151010 1,132 Several aspects of the Project requirements are still under consideration - operating costs, impact to 2018 repaving program, cost sharing opportunities with community or BC Hydro. Resource capacity to get work done.
TransLink Owned Bicycle Infrastructure
161002 1,000 Project deferred due to a decision to combine it with the 2017 Bicycle Infrastructure Project in order to initiate a larger scope project.
TOH Line Tamper Detection and Alarm System Installation (TPCC)
162035 600 Delayed due to on-going product design and engineering of the TOH Line Tampering Device Alarm System.
Page 14 of 51
South Coast British Columbia Transportation Authority—2016 Statutory Annual Report March 2017
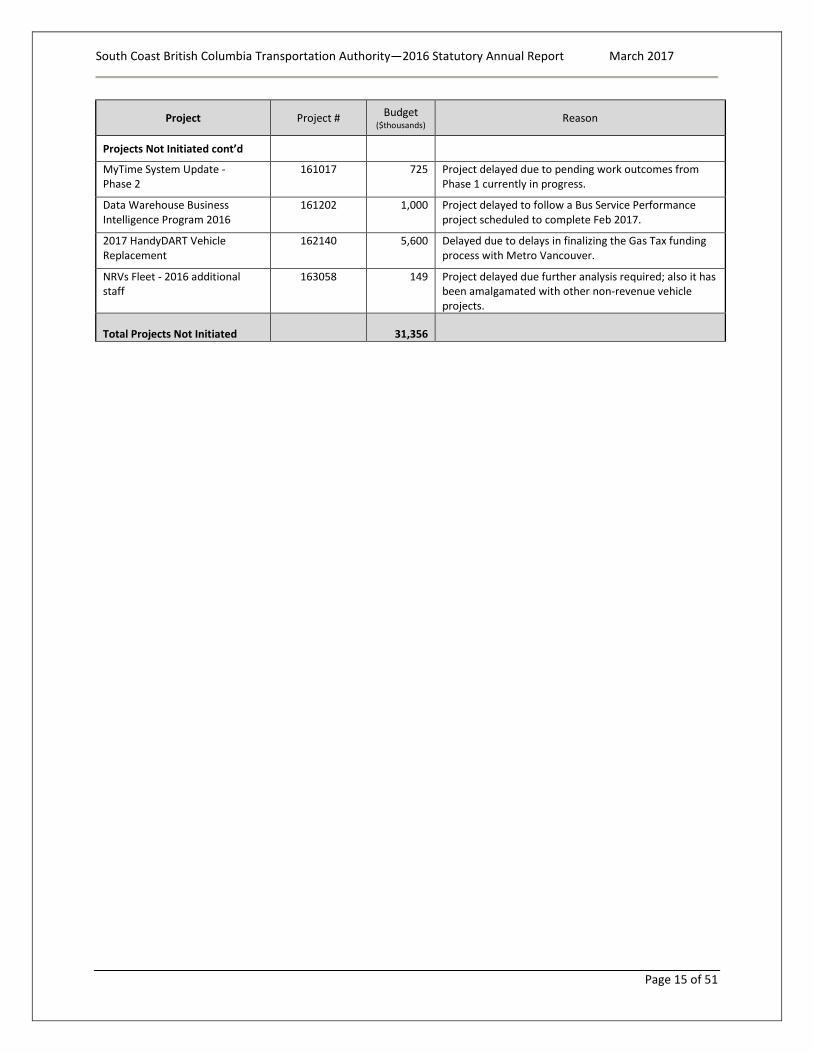
Project Project # Budget ($thousands) Reason
Projects Not Initiated cont’d MyTime System Update - Phase 2
161017 725 Project delayed due to pending work outcomes from Phase 1 currently in progress.
Data Warehouse Business Intelligence Program 2016
161202 1,000 Project delayed to follow a Bus Service Performance project scheduled to complete Feb 2017.
2017 HandyDART Vehicle Replacement
162140 5,600 Delayed due to delays in finalizing the Gas Tax funding process with Metro Vancouver.
NRVs Fleet - 2016 additional staff
163058 149 Project delayed due further analysis required; also it has been amalgamated with other non-revenue vehicle projects.
Total Projects Not Initiated
31,356
Page 15 of 51
South Coast British Columbia Transportation Authority—2016 Statutory Annual Report March 2017
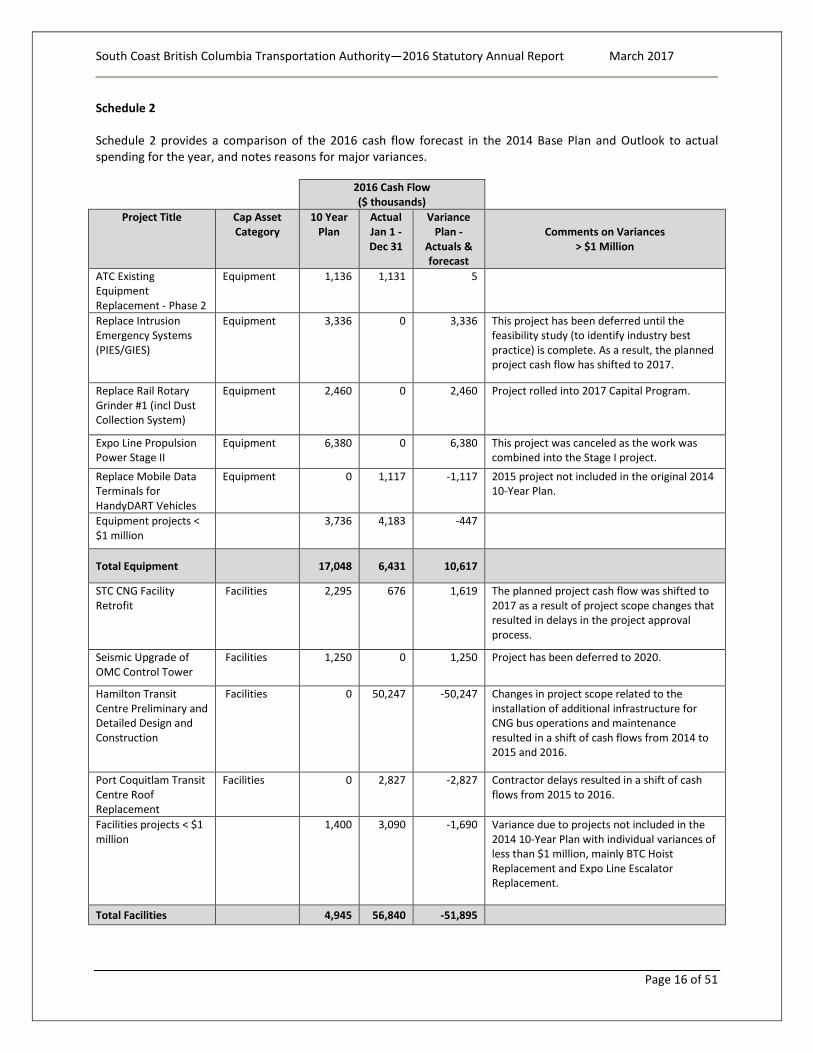
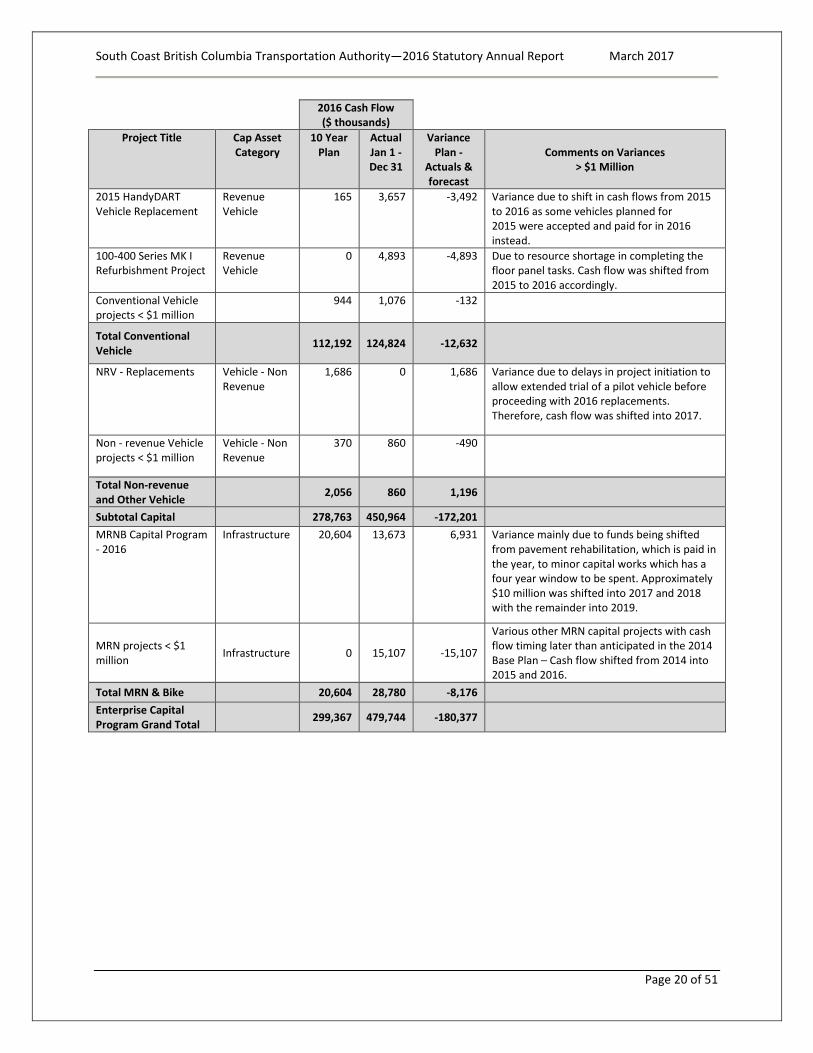
Schedule 2 Schedule 2 provides a comparison of the 2016 cash flow forecast in the 2014 Base Plan and Outlook to actual spending for the year, and notes reasons for major variances. 2016 Cash Flow
($ thousands)
Project Title Cap Asset Category
10 Year Plan
Actual Jan 1 - Dec 31
Variance Plan -
Actuals & forecast
Comments on Variances > $1 Million
ATC Existing Equipment Replacement - Phase 2
Equipment 1,136 1,131 5
Replace Intrusion Emergency Systems (PIES/GIES)
Equipment 3,336 0 3,336 This project has been deferred until the feasibility study (to identify industry best practice) is complete. As a result, the planned project cash flow has shifted to 2017.
Replace Rail Rotary Grinder #1 (incl Dust Collection System)
Equipment 2,460 0 2,460 Project rolled into 2017 Capital Program.
Expo Line Propulsion Power Stage II
Equipment 6,380 0 6,380 This project was canceled as the work was combined into the Stage I project.
Replace Mobile Data Terminals for HandyDART Vehicles
Equipment 0 1,117 -1,117 2015 project not included in the original 2014 10-Year Plan.
Equipment projects < $1 million
3,736 4,183 -447
Total Equipment 17,048 6,431 10,617
STC CNG Facility Retrofit
Facilities 2,295 676 1,619 The planned project cash flow was shifted to 2017 as a result of project scope changes that resulted in delays in the project approval process.
Seismic Upgrade of OMC Control Tower
Facilities 1,250 0 1,250 Project has been deferred to 2020.
Hamilton Transit Centre Preliminary and Detailed Design and Construction
Facilities 0 50,247 -50,247 Changes in project scope related to the installation of additional infrastructure for CNG bus operations and maintenance resulted in a shift of cash flows from 2014 to 2015 and 2016.
Port Coquitlam Transit Centre Roof Replacement
Facilities 0 2,827 -2,827 Contractor delays resulted in a shift of cash flows from 2015 to 2016.
Facilities projects < $1 million
1,400 3,090 -1,690 Variance due to projects not included in the 2014 10-Year Plan with individual variances of less than $1 million, mainly BTC Hoist Replacement and Expo Line Escalator Replacement.
Total Facilities 4,945 56,840 -51,895
Page 16 of 51
South Coast British Columbia Transportation Authority—2016 Statutory Annual Report March 2017
2016 Cash Flow
($ thousands)
Project Title Cap Asset Category
10 Year Plan
Actual Jan 1 - Dec 31
Variance Plan -
Actuals & forecast
Comments on Variances > $1 Million
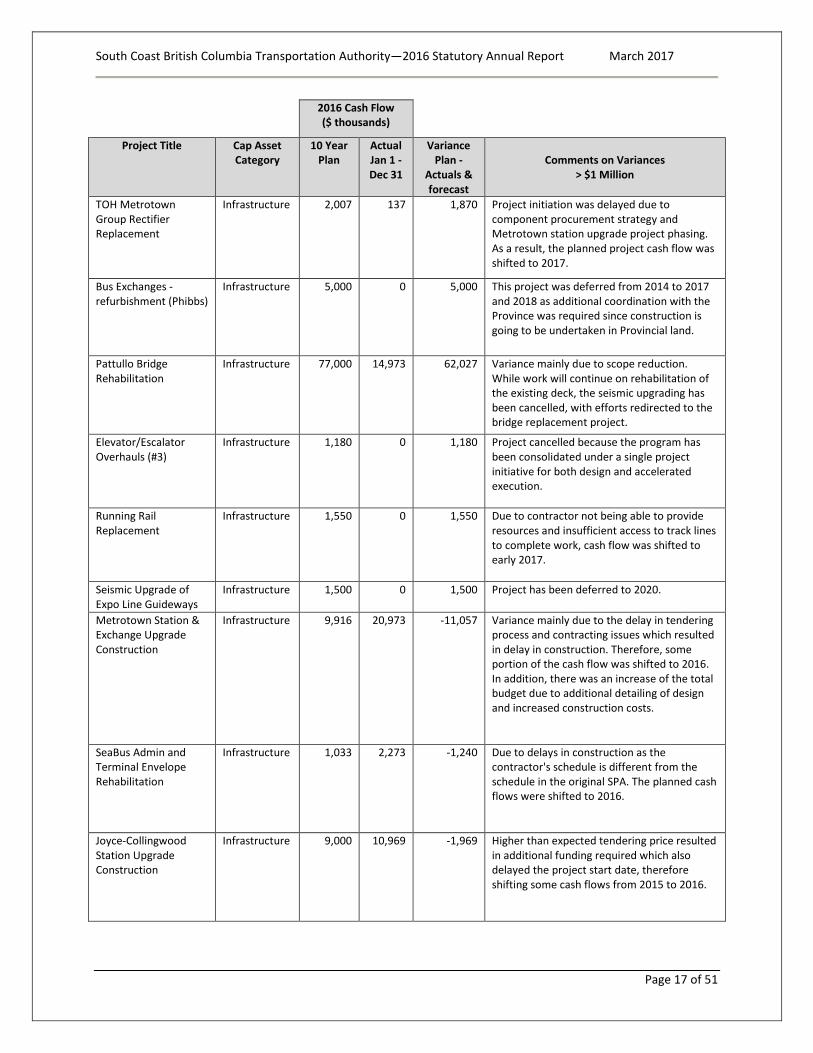
TOH Metrotown Group Rectifier Replacement
Infrastructure 2,007 137 1,870 Project initiation was delayed due to component procurement strategy and Metrotown station upgrade project phasing. As a result, the planned project cash flow was shifted to 2017.
Bus Exchanges - refurbishment (Phibbs)
Infrastructure 5,000 0 5,000 This project was deferred from 2014 to 2017 and 2018 as additional coordination with the Province was required since construction is going to be undertaken in Provincial land.
Pattullo Bridge Rehabilitation
Infrastructure 77,000 14,973 62,027 Variance mainly due to scope reduction. While work will continue on rehabilitation of the existing deck, the seismic upgrading has been cancelled, with efforts redirected to the bridge replacement project.
Elevator/Escalator Overhauls (#3)
Infrastructure 1,180 0 1,180 Project cancelled because the program has been consolidated under a single project initiative for both design and accelerated execution.
Running Rail Replacement
Infrastructure 1,550 0 1,550 Due to contractor not being able to provide resources and insufficient access to track lines to complete work, cash flow was shifted to early 2017.
Seismic Upgrade of Expo Line Guideways
Infrastructure 1,500 0 1,500 Project has been deferred to 2020.
Metrotown Station & Exchange Upgrade Construction
Infrastructure 9,916 20,973 -11,057 Variance mainly due to the delay in tendering process and contracting issues which resulted in delay in construction. Therefore, some portion of the cash flow was shifted to 2016. In addition, there was an increase of the total budget due to additional detailing of design and increased construction costs.
SeaBus Admin and Terminal Envelope Rehabilitation
Infrastructure 1,033 2,273 -1,240 Due to delays in construction as the contractor's schedule is different from the schedule in the original SPA. The planned cash flows were shifted to 2016.
Joyce-Collingwood Station Upgrade Construction
Infrastructure 9,000 10,969 -1,969 Higher than expected tendering price resulted in additional funding required which also delayed the project start date, therefore shifting some cash flows from 2015 to 2016.
Page 17 of 51
South Coast British Columbia Transportation Authority—2016 Statutory Annual Report March 2017
2016 Cash Flow
($ thousands)
Project Title Cap Asset Category
10 Year Plan
Actual Jan 1 - Dec 31
Variance Plan -
Actuals & forecast
Comments on Variances > $1 Million
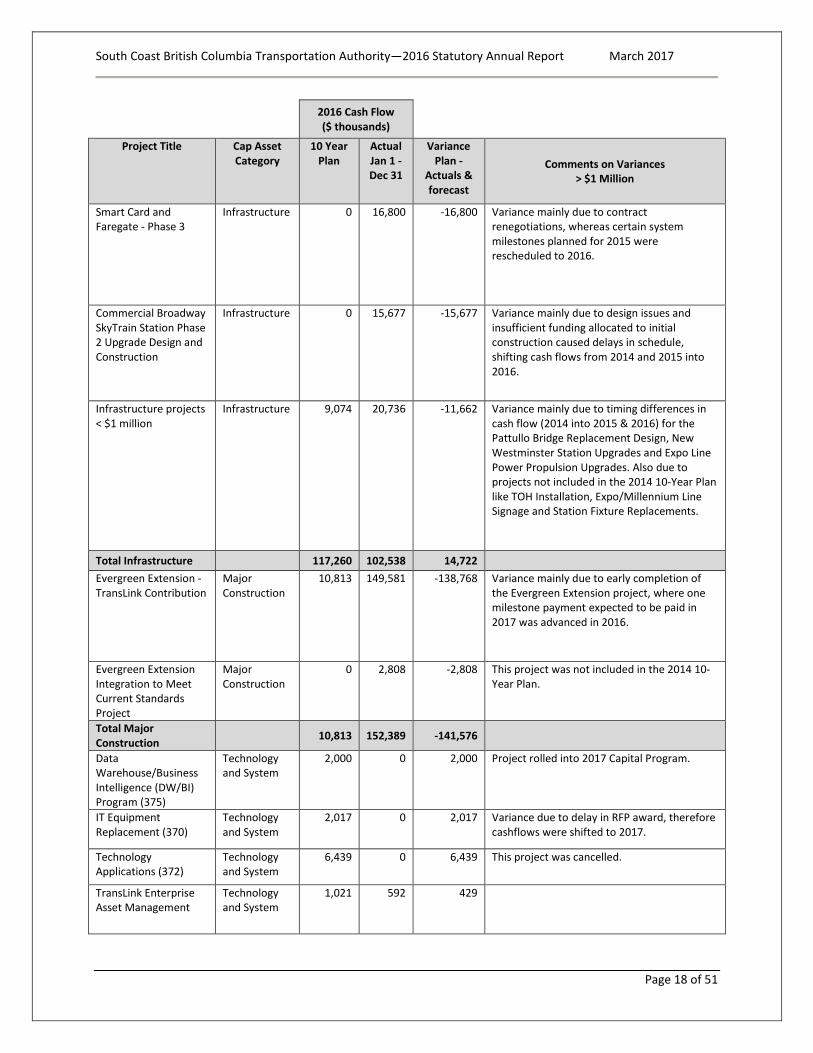
Smart Card and Faregate - Phase 3
Infrastructure 0 16,800 -16,800 Variance mainly due to contract renegotiations, whereas certain system milestones planned for 2015 were rescheduled to 2016.
Commercial Broadway SkyTrain Station Phase 2 Upgrade Design and Construction
Infrastructure 0 15,677 -15,677 Variance mainly due to design issues and insufficient funding allocated to initial construction caused delays in schedule, shifting cash flows from 2014 and 2015 into 2016.
Infrastructure projects < $1 million
Infrastructure 9,074 20,736 -11,662 Variance mainly due to timing differences in cash flow (2014 into 2015 & 2016) for the Pattullo Bridge Replacement Design, New Westminster Station Upgrades and Expo Line Power Propulsion Upgrades. Also due to projects not included in the 2014 10-Year Plan like TOH Installation, Expo/Millennium Line Signage and Station Fixture Replacements.
Total Infrastructure 117,260 102,538 14,722 Evergreen Extension - TransLink Contribution
Major Construction
10,813 149,581 -138,768 Variance mainly due to early completion of the Evergreen Extension project, where one milestone payment expected to be paid in 2017 was advanced in 2016.
Evergreen Extension Integration to Meet Current Standards Project
Major Construction
0 2,808 -2,808 This project was not included in the 2014 10-Year Plan.
Total Major Construction 10,813 152,389 -141,576
Data Warehouse/Business Intelligence (DW/BI) Program (375)
Technology and System
2,000 0 2,000 Project rolled into 2017 Capital Program.
IT Equipment Replacement (370)
Technology and System
2,017 0 2,017 Variance due to delay in RFP award, therefore cashflows were shifted to 2017.
Technology Applications (372)
Technology and System
6,439 0 6,439 This project was cancelled.
TransLink Enterprise Asset Management
Technology and System
1,021 592 429
Page 18 of 51
South Coast British Columbia Transportation Authority—2016 Statutory Annual Report March 2017
2016 Cash Flow
($ thousands)
Project Title Cap Asset Category
10 Year Plan
Actual Jan 1 - Dec 31
Variance Plan -
Actuals & forecast
Comments on Variances > $1 Million
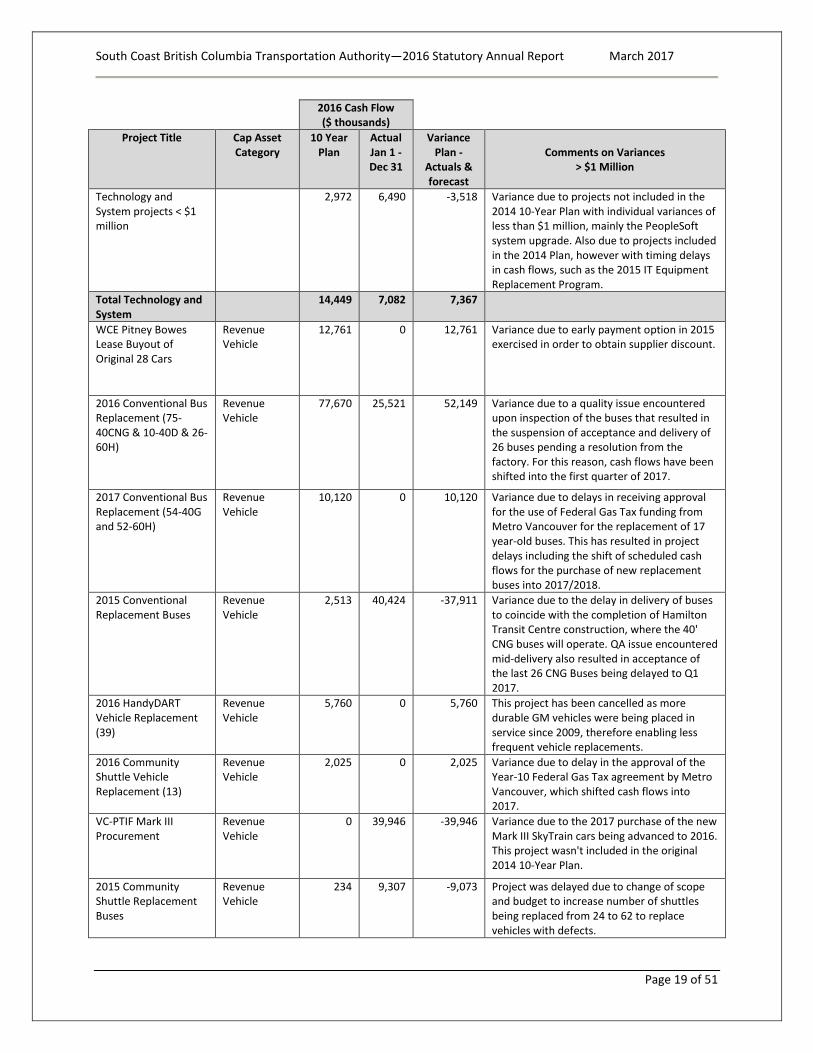
Technology and System projects < $1 million
2,972 6,490 -3,518 Variance due to projects not included in the 2014 10-Year Plan with individual variances of less than $1 million, mainly the PeopleSoft system upgrade. Also due to projects included in the 2014 Plan, however with timing delays in cash flows, such as the 2015 IT Equipment Replacement Program.
Total Technology and System
14,449 7,082 7,367
WCE Pitney Bowes Lease Buyout of Original 28 Cars
Revenue Vehicle
12,761 0 12,761 Variance due to early payment option in 2015 exercised in order to obtain supplier discount.
2016 Conventional Bus Replacement (75-40CNG & 10-40D & 26-60H)
Revenue Vehicle
77,670 25,521 52,149 Variance due to a quality issue encountered upon inspection of the buses that resulted in the suspension of acceptance and delivery of 26 buses pending a resolution from the factory. For this reason, cash flows have been shifted into the first quarter of 2017.
2017 Conventional Bus Replacement (54-40G and 52-60H)
Revenue Vehicle
10,120 0 10,120 Variance due to delays in receiving approval for the use of Federal Gas Tax funding from Metro Vancouver for the replacement of 17 year-old buses. This has resulted in project delays including the shift of scheduled cash flows for the purchase of new replacement buses into 2017/2018.
2015 Conventional Replacement Buses
Revenue Vehicle
2,513 40,424 -37,911 Variance due to the delay in delivery of buses to coincide with the completion of Hamilton Transit Centre construction, where the 40' CNG buses will operate. QA issue encountered mid-delivery also resulted in acceptance of the last 26 CNG Buses being delayed to Q1 2017.
2016 HandyDART Vehicle Replacement (39)
Revenue Vehicle
5,760 0 5,760 This project has been cancelled as more durable GM vehicles were being placed in service since 2009, therefore enabling less frequent vehicle replacements.
2016 Community Shuttle Vehicle Replacement (13)
Revenue Vehicle
2,025 0 2,025 Variance due to delay in the approval of the Year-10 Federal Gas Tax agreement by Metro Vancouver, which shifted cash flows into 2017.
VC-PTIF Mark III Procurement
Revenue Vehicle
0 39,946 -39,946 Variance due to the 2017 purchase of the new Mark III SkyTrain cars being advanced to 2016. This project wasn't included in the original 2014 10-Year Plan.
2015 Community Shuttle Replacement Buses
Revenue Vehicle
234 9,307 -9,073 Project was delayed due to change of scope and budget to increase number of shuttles being replaced from 24 to 62 to replace vehicles with defects.
Page 19 of 51
South Coast British Columbia Transportation Authority—2016 Statutory Annual Report March 2017
2016 Cash Flow
($ thousands)
Project Title Cap Asset Category
10 Year Plan
Actual Jan 1 - Dec 31
Variance Plan -
Actuals & forecast
Comments on Variances > $1 Million
2015 HandyDART Vehicle Replacement
Revenue Vehicle
165 3,657 -3,492 Variance due to shift in cash flows from 2015 to 2016 as some vehicles planned for 2015 were accepted and paid for in 2016 instead.
100-400 Series MK I Refurbishment Project
Revenue Vehicle
0 4,893 -4,893 Due to resource shortage in completing the floor panel tasks. Cash flow was shifted from 2015 to 2016 accordingly.
Conventional Vehicle projects < $1 million
944 1,076 -132
Total Conventional Vehicle 112,192 124,824 -12,632
NRV - Replacements Vehicle - Non Revenue
1,686 0 1,686 Variance due to delays in project initiation to allow extended trial of a pilot vehicle before proceeding with 2016 replacements. Therefore, cash flow was shifted into 2017.
Non - revenue Vehicle projects < $1 million
Vehicle - Non Revenue
370 860 -490
Total Non-revenue and Other Vehicle 2,056 860 1,196
Subtotal Capital 278,763 450,964 -172,201 MRNB Capital Program - 2016
Infrastructure 20,604 13,673 6,931 Variance mainly due to funds being shifted from pavement rehabilitation, which is paid in the year, to minor capital works which has a four year window to be spent. Approximately $10 million was shifted into 2017 and 2018 with the remainder into 2019.
MRN projects < $1 million Infrastructure 0 15,107 -15,107
Various other MRN capital projects with cash flow timing later than anticipated in the 2014 Base Plan – Cash flow shifted from 2014 into 2015 and 2016.
Total MRN & Bike 20,604 28,780 -8,176 Enterprise Capital Program Grand Total 299,367 479,744 -180,377
Page 20 of 51
South Coast British Columbia Transportation Authority—2016 Statutory Annual Report March 2017
5 Transportation Demand Management Transportation Demand Management (TDM) is coordinated in Metro Vancouver under TransLink’s TravelSmart initiative. TravelSmart represents partnerships between TransLink, municipalities, various government / non-governmental and industry partners all committed to helping more people choose transit, ridesharing, carpooling, car sharing, cycling and walking in place of single occupancy vehicle (SOV) trips. Changing behaviour is a component of the TDM measures necessary to balance growing mobility expectations against the capacity of our transportation system and the impacts of our travel choices. Transportation Demand Management is legislated as part of TransLink’s mandate in the South Coast British Columbia Transportation Authority Act (under section 4(1) (b)) and TravelSmart was Canada’s first integrated transportation demand management program. The TravelSmart program identity became established following a successful pilot in nine Metro Vancouver communities in 2005/06. The regional showcase project in 2005/06 demonstrated that information and incentives could create an eight per cent reduction in single occupancy vehicle trips and significant increases in transit use, walking and biking. TravelSmart developed and became a core element of essential demand management for the 2010 Winter Olympic Games, helping reduce background traffic by over 30 per cent. The adopted Regional Growth Strategy 1 (RGS 2013) describes policies to meet the demands of over one million new residents and 600,000 new jobs over the next 30 years. Central to the strategy are goals for denser land use and increased investment in transit and active transportation to create the conditions for reducing the high level of single occupancy vehicle trips in most areas. The Regional Transportation Strategy Framework (RTS 2013) responds to the RGS and describes how to "design our communities and transportation systems in such a way that they reduce the distances driven in the region by 33 per cent and make half our trips by walking, cycling and transit". Behaviour change measures are essential to the RTS as they provide the motivation, information and support necessary for individuals to change their travel habits. The following summarizes activity and outcomes from 2016 according to the ‘target area’ headings contained in the 2016 TravelSmart work and program plans. 2016 TravelSmart headline results
• 1,630,450 people now live in a TravelSmart municipality • Over 100,000 customers assisted during TransLink’s Compass launch campaigns • Over 100,000 customers assisted during SkyTrain’s Evergreen Extension customer outreach campaigns • Over 50,000 customers assisted during four Quarterly Bus Service changes • Over 50,000 customers assisted during Operation Pattern Changes outreach campaigns (as part of the
multi-phased opening of the Evergreen Extension) • 40,000+ employees engaged in TravelSmart workplace travel planning projects • Over 4,000 children taught how to cycle more safely • 1,600+ seniors provided travel training instruction, tools and sustainable transportation workshops • 4,400+ newcomers to the region provided with travel training instruction, tools and sustainable
transportation workshops • 5,000+ students engaged in TransLink’s TravelSmart school travel planning projects and sustainable
transportation workshops • 200+ community events, presentations & seminars executed by TransLink’s TravelSmart team
Activity and outcome report
Page 21 of 51
South Coast British Columbia Transportation Authority—2016 Statutory Annual Report March 2017
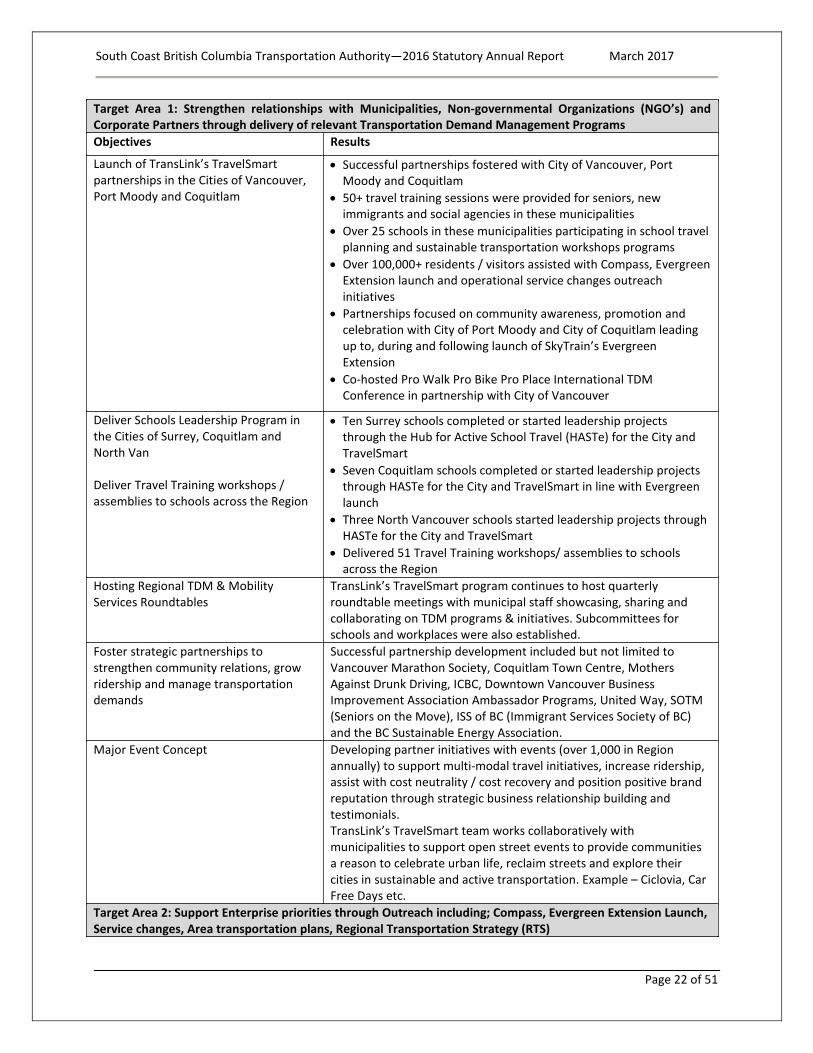
Target Area 1: Strengthen relationships with Municipalities, Non-governmental Organizations (NGO’s) and Corporate Partners through delivery of relevant Transportation Demand Management Programs Objectives Results
Launch of TransLink’s TravelSmart partnerships in the Cities of Vancouver, Port Moody and Coquitlam
• Successful partnerships fostered with City of Vancouver, Port Moody and Coquitlam
• 50+ travel training sessions were provided for seniors, new immigrants and social agencies in these municipalities
• Over 25 schools in these municipalities participating in school travel planning and sustainable transportation workshops programs
• Over 100,000+ residents / visitors assisted with Compass, Evergreen Extension launch and operational service changes outreach initiatives
• Partnerships focused on community awareness, promotion and celebration with City of Port Moody and City of Coquitlam leading up to, during and following launch of SkyTrain’s Evergreen Extension
• Co-hosted Pro Walk Pro Bike Pro Place International TDM Conference in partnership with City of Vancouver
Deliver Schools Leadership Program in the Cities of Surrey, Coquitlam and North Van Deliver Travel Training workshops / assemblies to schools across the Region
• Ten Surrey schools completed or started leadership projects through the Hub for Active School Travel (HASTe) for the City and TravelSmart
• Seven Coquitlam schools completed or started leadership projects through HASTe for the City and TravelSmart in line with Evergreen launch
• Three North Vancouver schools started leadership projects through HASTe for the City and TravelSmart
• Delivered 51 Travel Training workshops/ assemblies to schools across the Region
Hosting Regional TDM & Mobility Services Roundtables
TransLink’s TravelSmart program continues to host quarterly roundtable meetings with municipal staff showcasing, sharing and collaborating on TDM programs & initiatives. Subcommittees for schools and workplaces were also established.
Foster strategic partnerships to strengthen community relations, grow ridership and manage transportation demands
Successful partnership development included but not limited to Vancouver Marathon Society, Coquitlam Town Centre, Mothers Against Drunk Driving, ICBC, Downtown Vancouver Business Improvement Association Ambassador Programs, United Way, SOTM (Seniors on the Move), ISS of BC (Immigrant Services Society of BC) and the BC Sustainable Energy Association.
Major Event Concept Developing partner initiatives with events (over 1,000 in Region annually) to support multi-modal travel initiatives, increase ridership, assist with cost neutrality / cost recovery and position positive brand reputation through strategic business relationship building and testimonials. TransLink’s TravelSmart team works collaboratively with municipalities to support open street events to provide communities a reason to celebrate urban life, reclaim streets and explore their cities in sustainable and active transportation. Example – Ciclovia, Car Free Days etc.
Target Area 2: Support Enterprise priorities through Outreach including; Compass, Evergreen Extension Launch, Service changes, Area transportation plans, Regional Transportation Strategy (RTS)
Page 22 of 51
South Coast British Columbia Transportation Authority—2016 Statutory Annual Report March 2017
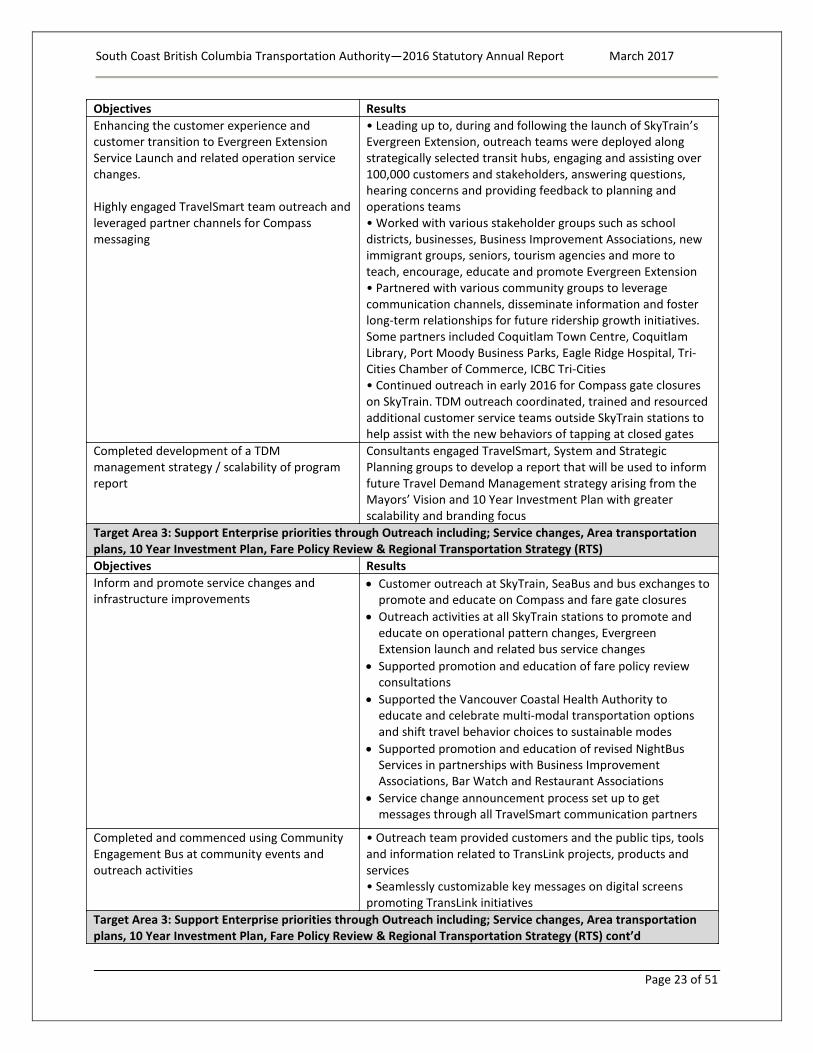
Objectives Results Enhancing the customer experience and customer transition to Evergreen Extension Service Launch and related operation service changes. Highly engaged TravelSmart team outreach and leveraged partner channels for Compass messaging
• Leading up to, during and following the launch of SkyTrain’s Evergreen Extension, outreach teams were deployed along strategically selected transit hubs, engaging and assisting over 100,000 customers and stakeholders, answering questions, hearing concerns and providing feedback to planning and operations teams • Worked with various stakeholder groups such as school districts, businesses, Business Improvement Associations, new immigrant groups, seniors, tourism agencies and more to teach, encourage, educate and promote Evergreen Extension • Partnered with various community groups to leverage communication channels, disseminate information and foster long-term relationships for future ridership growth initiatives. Some partners included Coquitlam Town Centre, Coquitlam Library, Port Moody Business Parks, Eagle Ridge Hospital, Tri-Cities Chamber of Commerce, ICBC Tri-Cities • Continued outreach in early 2016 for Compass gate closures on SkyTrain. TDM outreach coordinated, trained and resourced additional customer service teams outside SkyTrain stations to help assist with the new behaviors of tapping at closed gates
Completed development of a TDM management strategy / scalability of program report
Consultants engaged TravelSmart, System and Strategic Planning groups to develop a report that will be used to inform future Travel Demand Management strategy arising from the Mayors’ Vision and 10 Year Investment Plan with greater scalability and branding focus
Target Area 3: Support Enterprise priorities through Outreach including; Service changes, Area transportation plans, 10 Year Investment Plan, Fare Policy Review & Regional Transportation Strategy (RTS) Objectives Results Inform and promote service changes and infrastructure improvements
• Customer outreach at SkyTrain, SeaBus and bus exchanges to promote and educate on Compass and fare gate closures
• Outreach activities at all SkyTrain stations to promote and educate on operational pattern changes, Evergreen Extension launch and related bus service changes
• Supported promotion and education of fare policy review consultations
• Supported the Vancouver Coastal Health Authority to educate and celebrate multi-modal transportation options and shift travel behavior choices to sustainable modes
• Supported promotion and education of revised NightBus Services in partnerships with Business Improvement Associations, Bar Watch and Restaurant Associations
• Service change announcement process set up to get messages through all TravelSmart communication partners
Completed and commenced using Community Engagement Bus at community events and outreach activities
• Outreach team provided customers and the public tips, tools and information related to TransLink projects, products and services • Seamlessly customizable key messages on digital screens promoting TransLink initiatives
Target Area 3: Support Enterprise priorities through Outreach including; Service changes, Area transportation plans, 10 Year Investment Plan, Fare Policy Review & Regional Transportation Strategy (RTS) cont’d
Page 23 of 51
South Coast British Columbia Transportation Authority—2016 Statutory Annual Report March 2017
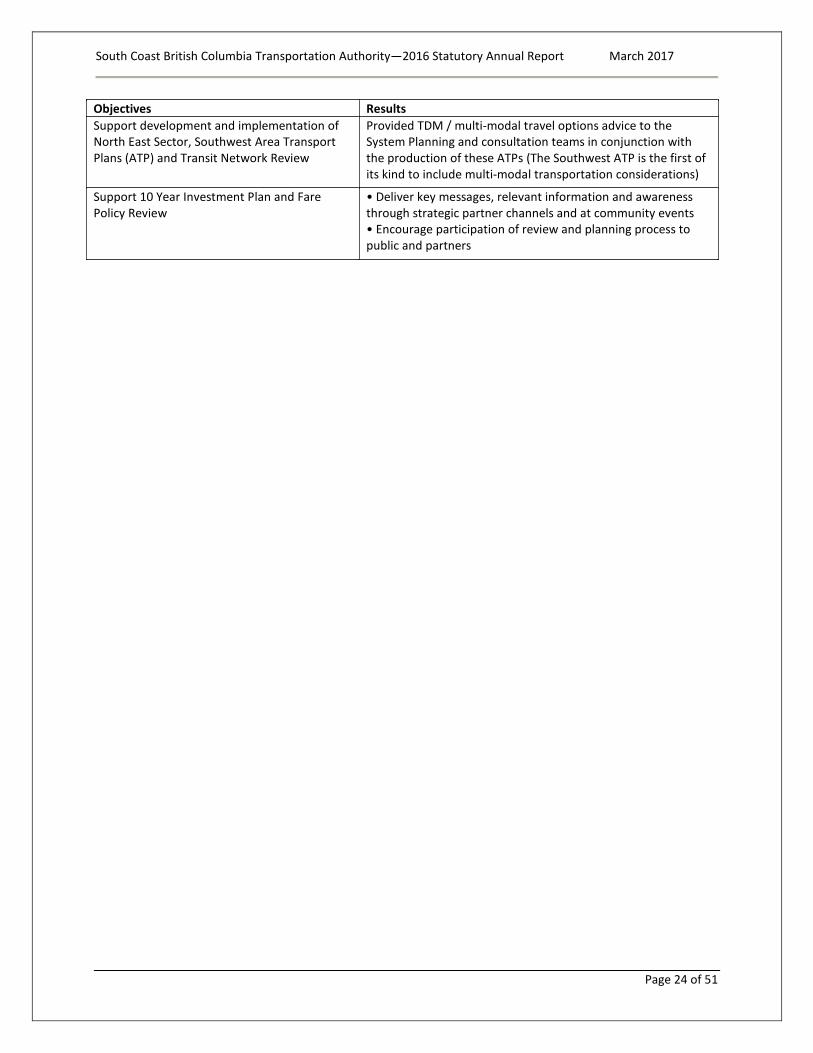
Objectives Results Support development and implementation of North East Sector, Southwest Area Transport Plans (ATP) and Transit Network Review
Provided TDM / multi-modal travel options advice to the System Planning and consultation teams in conjunction with the production of these ATPs (The Southwest ATP is the first of its kind to include multi-modal transportation considerations)
Support 10 Year Investment Plan and Fare Policy Review
• Deliver key messages, relevant information and awareness through strategic partner channels and at community events • Encourage participation of review and planning process to public and partners
Page 24 of 51
South Coast British Columbia Transportation Authority—2016 Statutory Annual Report March 2017
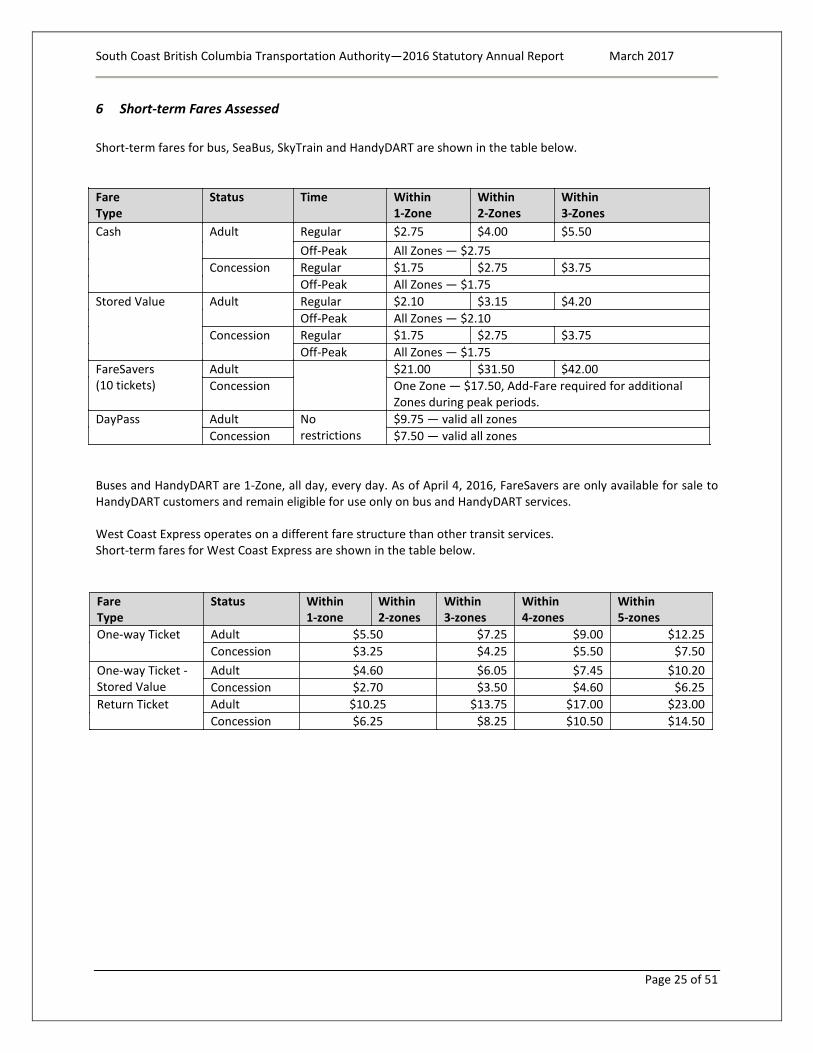
6 Short-term Fares Assessed
Short-term fares for bus, SeaBus, SkyTrain and HandyDART are shown in the table below. Fare Type
Status Time Within 1-Zone
Within 2-Zones
Within 3-Zones
Cash Adult Regular $2.75 $4.00 $5.50 Off-Peak All Zones — $2.75
Concession Regular $1.75 $2.75 $3.75 Off-Peak All Zones — $1.75
Stored Value Adult Regular $2.10 $3.15 $4.20 Off-Peak All Zones — $2.10
Concession Regular $1.75 $2.75 $3.75 Off-Peak All Zones — $1.75
FareSavers (10 tickets)
Adult $21.00 $31.50 $42.00 Concession One Zone — $17.50, Add-Fare required for additional
Zones during peak periods. DayPass Adult No
restrictions $9.75 — valid all zones
Concession $7.50 — valid all zones Buses and HandyDART are 1-Zone, all day, every day. As of April 4, 2016, FareSavers are only available for sale to HandyDART customers and remain eligible for use only on bus and HandyDART services. West Coast Express operates on a different fare structure than other transit services. Short-term fares for West Coast Express are shown in the table below. Fare Type
Status Within 1-zone
Within 2-zones
Within 3-zones
Within 4-zones
Within 5-zones
One-way Ticket Adult $5.50 $7.25 $9.00 $12.25 Concession $3.25 $4.25 $5.50 $7.50
One-way Ticket - Stored Value
Adult $4.60 $6.05 $7.45 $10.20 Concession $2.70 $3.50 $4.60 $6.25
Return Ticket Adult $10.25 $13.75 $17.00 $23.00 Concession $6.25 $8.25 $10.50 $14.50
Page 25 of 51
South Coast British Columbia Transportation Authority—2016 Statutory Annual Report March 2017
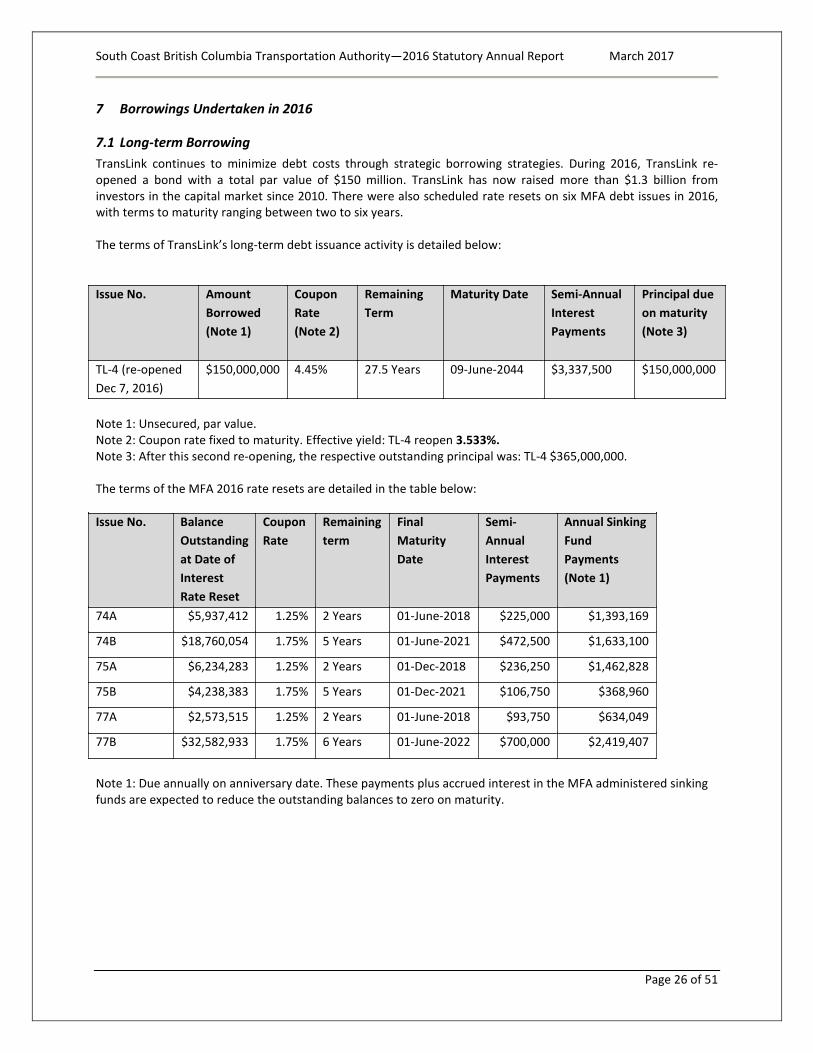
7 Borrowings Undertaken in 2016
7.1 Long-term Borrowing TransLink continues to minimize debt costs through strategic borrowing strategies. During 2016, TransLink re-opened a bond with a total par value of $150 million. TransLink has now raised more than $1.3 billion from investors in the capital market since 2010. There were also scheduled rate resets on six MFA debt issues in 2016, with terms to maturity ranging between two to six years. The terms of TransLink’s long-term debt issuance activity is detailed below: Issue No. Amount
Borrowed (Note 1)
Coupon Rate (Note 2)
Remaining Term
Maturity Date Semi-Annual Interest Payments
Principal due on maturity (Note 3)
TL-4 (re-opened Dec 7, 2016)
$150,000,000 4.45% 27.5 Years 09-June-2044 $3,337,500 $150,000,000
Note 1: Unsecured, par value. Note 2: Coupon rate fixed to maturity. Effective yield: TL-4 reopen 3.533%. Note 3: After this second re-opening, the respective outstanding principal was: TL-4 $365,000,000. The terms of the MFA 2016 rate resets are detailed in the table below:
Issue No.
Balance Outstanding at Date of Interest Rate Reset
Coupon Rate
Remaining term
Final Maturity Date
Semi-Annual Interest Payments
Annual Sinking Fund Payments (Note 1)
74A $5,937,412 1.25% 2 Years 01-June-2018 $225,000 $1,393,169
74B $18,760,054 1.75% 5 Years 01-June-2021 $472,500 $1,633,100
75A $6,234,283 1.25% 2 Years 01-Dec-2018 $236,250 $1,462,828
75B $4,238,383 1.75% 5 Years 01-Dec-2021 $106,750 $368,960
77A $2,573,515 1.25% 2 Years 01-June-2018 $93,750 $634,049
77B $32,582,933 1.75% 6 Years 01-June-2022 $700,000 $2,419,407
Note 1: Due annually on anniversary date. These payments plus accrued interest in the MFA administered sinking funds are expected to reduce the outstanding balances to zero on maturity.
Page 26 of 51
South Coast British Columbia Transportation Authority—2016 Statutory Annual Report March 2017
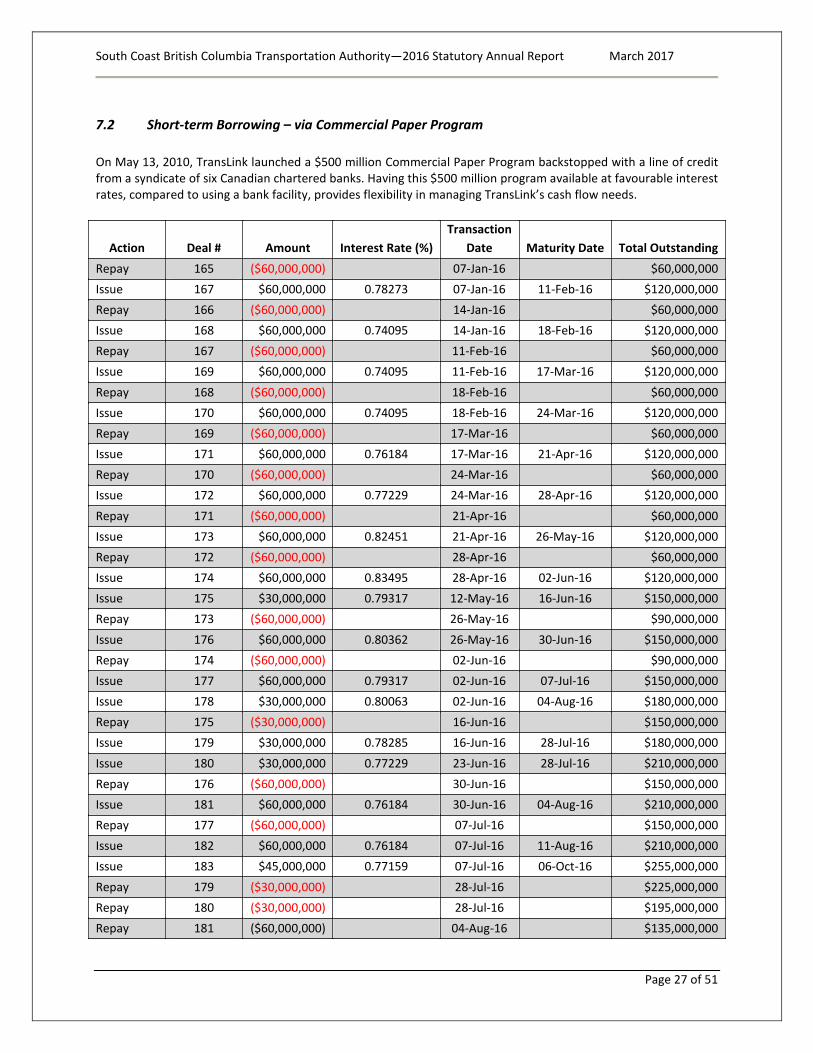
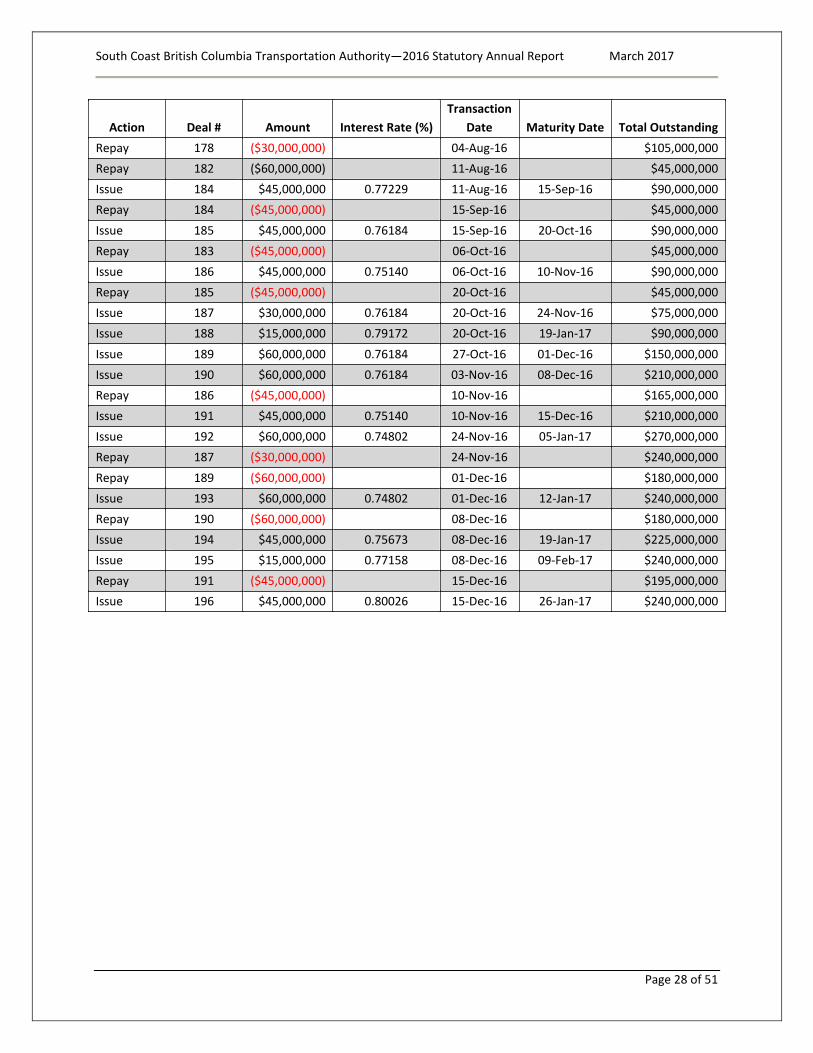
7.2 Short-term Borrowing – via Commercial Paper Program On May 13, 2010, TransLink launched a $500 million Commercial Paper Program backstopped with a line of credit from a syndicate of six Canadian chartered banks. Having this $500 million program available at favourable interest rates, compared to using a bank facility, provides flexibility in managing TransLink’s cash flow needs.
Action Deal # Amount Interest Rate (%) Transaction
Date Maturity Date Total Outstanding Repay 165 ($60,000,000)
07-Jan-16
$60,000,000
Issue 167 $60,000,000 0.78273 07-Jan-16 11-Feb-16 $120,000,000 Repay 166 ($60,000,000)
14-Jan-16
$60,000,000
Issue 168 $60,000,000 0.74095 14-Jan-16 18-Feb-16 $120,000,000 Repay 167 ($60,000,000)
11-Feb-16
$60,000,000
Issue 169 $60,000,000 0.74095 11-Feb-16 17-Mar-16 $120,000,000 Repay 168 ($60,000,000)
18-Feb-16
$60,000,000
Issue 170 $60,000,000 0.74095 18-Feb-16 24-Mar-16 $120,000,000 Repay 169 ($60,000,000)
17-Mar-16
$60,000,000
Issue 171 $60,000,000 0.76184 17-Mar-16 21-Apr-16 $120,000,000 Repay 170 ($60,000,000)
24-Mar-16
$60,000,000
Issue 172 $60,000,000 0.77229 24-Mar-16 28-Apr-16 $120,000,000 Repay 171 ($60,000,000)
21-Apr-16
$60,000,000
Issue 173 $60,000,000 0.82451 21-Apr-16 26-May-16 $120,000,000 Repay 172 ($60,000,000)
28-Apr-16
$60,000,000
Issue 174 $60,000,000 0.83495 28-Apr-16 02-Jun-16 $120,000,000 Issue 175 $30,000,000 0.79317 12-May-16 16-Jun-16 $150,000,000 Repay 173 ($60,000,000)
26-May-16
$90,000,000
Issue 176 $60,000,000 0.80362 26-May-16 30-Jun-16 $150,000,000 Repay 174 ($60,000,000)
02-Jun-16
$90,000,000
Issue 177 $60,000,000 0.79317 02-Jun-16 07-Jul-16 $150,000,000 Issue 178 $30,000,000 0.80063 02-Jun-16 04-Aug-16 $180,000,000 Repay 175 ($30,000,000)
16-Jun-16
$150,000,000
Issue 179 $30,000,000 0.78285 16-Jun-16 28-Jul-16 $180,000,000 Issue 180 $30,000,000 0.77229 23-Jun-16 28-Jul-16 $210,000,000 Repay 176 ($60,000,000)
30-Jun-16
$150,000,000
Issue 181 $60,000,000 0.76184 30-Jun-16 04-Aug-16 $210,000,000 Repay 177 ($60,000,000)
07-Jul-16
$150,000,000
Issue 182 $60,000,000 0.76184 07-Jul-16 11-Aug-16 $210,000,000 Issue 183 $45,000,000 0.77159 07-Jul-16 06-Oct-16 $255,000,000 Repay 179 ($30,000,000)
28-Jul-16
$225,000,000
Repay 180 ($30,000,000)
28-Jul-16
$195,000,000 Repay 181 ($60,000,000)
04-Aug-16
$135,000,000
Page 27 of 51
South Coast British Columbia Transportation Authority—2016 Statutory Annual Report March 2017
Action Deal # Amount Interest Rate (%) Transaction
Date Maturity Date Total Outstanding Repay 178 ($30,000,000)
04-Aug-16
$105,000,000
Repay 182 ($60,000,000)
11-Aug-16
$45,000,000 Issue 184 $45,000,000 0.77229 11-Aug-16 15-Sep-16 $90,000,000 Repay 184 ($45,000,000)
15-Sep-16
$45,000,000
Issue 185 $45,000,000 0.76184 15-Sep-16 20-Oct-16 $90,000,000 Repay 183 ($45,000,000)
06-Oct-16
$45,000,000
Issue 186 $45,000,000 0.75140 06-Oct-16 10-Nov-16 $90,000,000 Repay 185 ($45,000,000)
20-Oct-16
$45,000,000
Issue 187 $30,000,000 0.76184 20-Oct-16 24-Nov-16 $75,000,000 Issue 188 $15,000,000 0.79172 20-Oct-16 19-Jan-17 $90,000,000 Issue 189 $60,000,000 0.76184 27-Oct-16 01-Dec-16 $150,000,000 Issue 190 $60,000,000 0.76184 03-Nov-16 08-Dec-16 $210,000,000 Repay 186 ($45,000,000)
10-Nov-16
$165,000,000
Issue 191 $45,000,000 0.75140 10-Nov-16 15-Dec-16 $210,000,000 Issue 192 $60,000,000 0.74802 24-Nov-16 05-Jan-17 $270,000,000 Repay 187 ($30,000,000)
24-Nov-16
$240,000,000
Repay 189 ($60,000,000)
01-Dec-16
$180,000,000 Issue 193 $60,000,000 0.74802 01-Dec-16 12-Jan-17 $240,000,000 Repay 190 ($60,000,000)
08-Dec-16
$180,000,000
Issue 194 $45,000,000 0.75673 08-Dec-16 19-Jan-17 $225,000,000 Issue 195 $15,000,000 0.77158 08-Dec-16 09-Feb-17 $240,000,000 Repay 191 ($45,000,000) 15-Dec-16 $195,000,000 Issue 196 $45,000,000 0.80026 15-Dec-16 26-Jan-17 $240,000,000
Page 28 of 51
South Coast British Columbia Transportation Authority—2016 Statutory Annual Report March 2017
B. AUDITED FINANCIAL STATEMENTS
The 2016 Audited Financial Statements is attached as Appendix A.
Page 29 of 51
South Coast British Columbia Transportation Authority—2016 Statutory Annual Report March 2017
C. COMPLAINTS SUMMARY
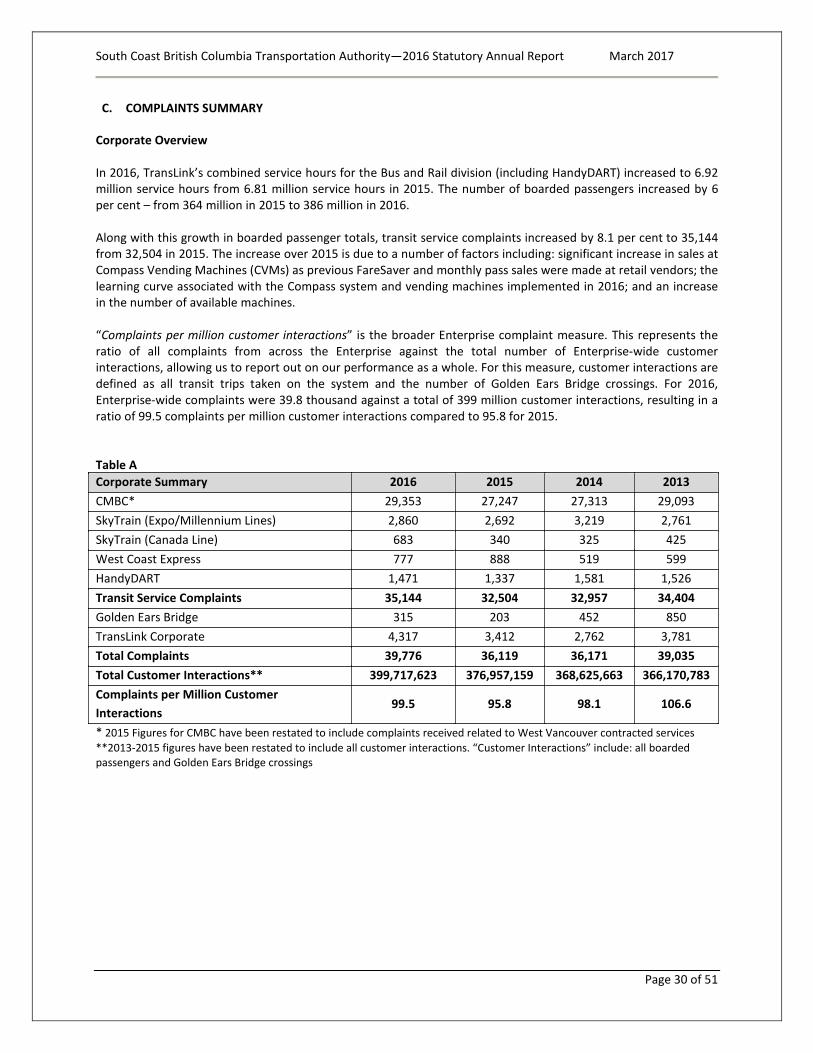
Corporate Overview In 2016, TransLink’s combined service hours for the Bus and Rail division (including HandyDART) increased to 6.92 million service hours from 6.81 million service hours in 2015. The number of boarded passengers increased by 6 per cent – from 364 million in 2015 to 386 million in 2016.
Along with this growth in boarded passenger totals, transit service complaints increased by 8.1 per cent to 35,144 from 32,504 in 2015. The increase over 2015 is due to a number of factors including: significant increase in sales at Compass Vending Machines (CVMs) as previous FareSaver and monthly pass sales were made at retail vendors; the learning curve associated with the Compass system and vending machines implemented in 2016; and an increase in the number of available machines. “Complaints per million customer interactions” is the broader Enterprise complaint measure. This represents the ratio of all complaints from across the Enterprise against the total number of Enterprise-wide customer interactions, allowing us to report out on our performance as a whole. For this measure, customer interactions are defined as all transit trips taken on the system and the number of Golden Ears Bridge crossings. For 2016, Enterprise-wide complaints were 39.8 thousand against a total of 399 million customer interactions, resulting in a ratio of 99.5 complaints per million customer interactions compared to 95.8 for 2015. Table A Corporate Summary 2016 2015 2014 2013 CMBC* 29,353 27,247 27,313 29,093 SkyTrain (Expo/Millennium Lines) 2,860 2,692 3,219 2,761 SkyTrain (Canada Line) 683 340 325 425 West Coast Express 777 888 519 599 HandyDART 1,471 1,337 1,581 1,526 Transit Service Complaints 35,144 32,504 32,957 34,404 Golden Ears Bridge 315 203 452 850 TransLink Corporate 4,317 3,412 2,762 3,781 Total Complaints 39,776 36,119 36,171 39,035 Total Customer Interactions** 399,717,623 376,957,159 368,625,663 366,170,783 Complaints per Million Customer Interactions
99.5 95.8 98.1 106.6
* 2015 Figures for CMBC have been restated to include complaints received related to West Vancouver contracted services **2013-2015 figures have been restated to include all customer interactions. “Customer Interactions” include: all boarded passengers and Golden Ears Bridge crossings
Page 30 of 51
South Coast British Columbia Transportation Authority—2016 Statutory Annual Report March 2017
Coast Mountain Bus Company Coast Mountain Bus Company (CMBC) continued its focus on customer experience in 2016 through a continuation and expansion of the 2015 initiatives, and participation on the newly-established enterprise “Customer First” Committee. In 2016 CMBC focused on the following:
• Annual transit operator performance reviews have continued for 100 per cent of all active employees. The reviews tie into their individual performance as well as their efforts toward achieving corporate goals and improving customer experience. The performance review discussions covered: reducing complaints, acknowledging commendations, personal attendance record, their own role in customer service and effect on delivery of service.
• CMBC also expanded its “one route per month” initiative where a specific route from each transit center is selected each month and focus is put on resolving service issues and complaints, and implementing improvement strategies for that route. CMBC expanded this initiative to the Transit Communications Center and the on-road support Transit Supervisor groups.
• Customer feedback continues to be incorporated into the service review processes, which were traditionally focused on transit operator quality of work. The introduction of customer feedback provides another point of view in the process.
• Priority return to training (PRTT) one-day refresher was offered to transit operators identified through the complaint investigation or one route per month initiative. This course covered refresher training on conflict resolution, customer interaction and professional driving skills.
• A one day Violence Incident Prevention training course was provided to approximately one third of the Operator workforce. This training is providing operators with coping skills in dealing with potentially hostile or angry customers and forms a good basis for positive customer interactions. This initiative commenced in 2015 and is spread over 3 years. After this it will be embedded into CMBC’s recurrent and initial training plan.
• Employee briefing sessions were continued to improve awareness of accessible transit, customers with strollers and overall customer complaints.
• Customer complaint and commendation metrics by depot were posted in the depots for employees. For CMBC, in 2016, slightly more than half (50.5 per cent) of the complaints involved staff (operators) and 49.5 per cent of complaints were related to service delivery. Although slightly higher in 2016, these complaint category percentages are consistent to previous years. All complaints are logged and assigned a priority code of P1 or P3. P1 complaints are urgent and in 2016, were all resolved within 48 hours. P3 complaints are less critical and must be resolved within 15 business days. Approximately 87 per cent of complaints were closed within 15 business days – a similar success rate as achieved last year. SkyTrain — Expo and Millennium Lines The increase in complaints is due to vending machines. Excluding these, complaints declined from 1,622 in 2015 to 1,518 in 2016 – a decline of 6.4 per cent in comparison to 2015. Customers’ concerns relating to elevated track noise level declined in 2016. SkyTrain is committed to minimizing any impact generated from its operation and in response to track noise concerns from nearby residents along the system; SkyTrain acquired a contractor in 2016 to complete corrective grinding maintenance across the system. This work improved the rail condition and reduced the track noise level. On October 22, 2016, SkyTrain introduced a new pattern change in preparation for the opening of the Millennium Line Evergreen Extension. One of the key changes included the expansion of the Expo Line with one route travelling from Waterfront to King George Station in Surrey and the other route travelling between Waterfront and
Page 31 of 51
South Coast British Columbia Transportation Authority—2016 Statutory Annual Report March 2017
Production Way-University in Burnaby. By extending the Expo Line to Production Way-University, customers can easily transfer between Expo and Millennium Line at Production Way-University using the same platform – eliminating the use of escalators, elevators or stairs. SkyTrain Attendants were deployed in key stations during this transition to provide added assistance to customers during their travel. As customers adapted to the new change, SkyTrain launched the opening of the Millennium Line Evergreen Extension on December 2, 2016. SkyTrain continues to utilize the Mystery Shopper program to enhance its services. One concept known, as the “Red Flag Alert” that currently exists in the program identifies incidence of issues that require immediate attention such as dirty train floors or platforms. Aside from SkyTrain Attendants that circulate throughout the stations and trains to monitor the conditions, the maintenance department has been added to the distribution list for “Red Flag Alerts” to provide real-time notifications for areas that require immediate attention. The success of the Mystery Shopper program since its inception in 2005 has enabled SkyTrain teams to focus on key areas to enhance customer experience. In 2016, SkyTrain responded to and closed 86.1 per cent of complaints within 10 days and 81.5 per cent in seven days. SkyTrain - Canada Line The overall number of Canada Line complaints received in 2016 was 683 compared to 340 in 2015. Excluding vending machine refunds, 2016 complaints of 170 showed a year-over-year increase with compared to 2015 complaints of 97. The majority of the complaints were due to customer relations associated with the implementation of the Compass Card system. It was noted that there was a 49 per cent increase from 2015 however the complaints had subsided by the third quarter of the year when the Compass Card fare gates had closed and customers were more familiar with its usage. The steady state of Compass Card operations was further supported by a dedicated monitor in the Canada Line Control Centre and the Canada Line Attendants and Supervisors. Other areas of concern in 2016 involved the escalator and elevator availability, train door operations and interior vehicle temperatures. The annual operations and maintenance plans for 2016 identified major track work maintenance which required the replacement of components. In order to reduce service impacts to the customers, the operator scheduled late night single tracking and the work continued during non-revenue hours. The rail contract group reviews each plan affecting train service before implementation. In addition, the operator is in contact with CMBC and Customer Information to ensure the plans are communicated in a timely manner to the customers. The Mystery Shopper program continues to effectively provide timely information about issues found on the system. Since the system allows the Shoppers to report the issues in real time, the operator is able to address/correct the condition before the customers are impacted. In addition, the Shoppers are also able to award commendations for various metrics such as customer service. This not only recognizes exemplary service but encourages customer engagement by the Canada Line Attendants. In 2016, 94 per cent of the complaints were closed within 15 business days. West Coast Express
West Coast Express (WCE) received 777 complaints in 2016 which was a reduction of nearly 13 per cent over the previous year. The largest number of complaints, 461, were directly related to CP operational issues. The WCE on-time-performance (OTP) was seriously impacted by a high volume of freight trains operating between Mission City and Vancouver during the months of October and November. December presented weather related challenges for
Page 32 of 51
South Coast British Columbia Transportation Authority—2016 Statutory Annual Report March 2017
the entire region which further impacted OTP for the year. Although WCE ran without too much difficulty, it was affected by trees falling in front of trains and difficult conditions in parking lots and stations, generating further complaints in December. For the first time, WCE monthly OTP fell to 95.3 per cent. The monthly average of complaints remained steady for the first three quarters of 2016. Then in late October and throughout November the OTP dropped with the onslaught of CP related delays. The issues related to high volume of freight service and the limited spacing and time to move through the region. During this period WCE went from an average of 32.5 complaints per month, to a total of 261 for November alone. WCE, BCRTC and TransLink worked with CP Rail to resolve the service delays. December saw a move toward normalized service, with only the unusual weather creating issues. With the implementation of Compass, the walk-in business at WCE increased dramatically due to conventional transit users coming in, and the ongoing need to upgrade WCE U-Pass BC users. The tourists are also coming in large numbers to get refunds for their Compass cards before they leave the country. We received no complaints about our walk-in location and were able to provide services for about 1,800 people per month. HandyDART
HandyDART complaint numbers increased by 10 per cent from 2015. The largest increase in complaints was regarding on-time performance, with complaints regarding lateness increasing from 69 to 149. The current Access Transit policy review is recommending that TransLink undertake an assessment of the impact of reducing wait times. Operator-related complaints increased by 27 per cent, accounting for 40 per cent of all complaints. Follow-up with the operator after each complaint is done as well as any required coaching provided by the HandyDART service provider, MVT Canadian Bus Inc. (MVT). Service availability related complaints remained low at 17. This can be attributed to the additional service that was implemented to reduce the number of trip denials to HandyDART customers in 2016. With denials still at a low level of 3,558, service availability complaints were only one per cent of all complaints. Taxi service related complaints increased slightly, from 580 to 616 (6 per cent), while the number of taxi trips increased by 33 per cent. As in 2015, all complaints were followed-up with both the employee as well as the customer, be it a complaint regarding a trip on a HandyDART vehicle or on a taxi. Training for taxi drivers continues to be provided by the Justice Institute and taxi companies, and MVT provides their train-the-trainer program to all taxi companies as well. HandyDART now addresses complaints in the same manner and timeframe as CMBC: P1 within 48 hours and P3 within 15 business days. In actual practice, most complaints are responded to and closed with the customer within two days. Golden Ears Bridge Toll operations on the Golden Ears Bridge are contracted through agreement with toll operator V-Flow Tolling Inc. (V-Flow). Although the agreement does not require customer satisfaction surveys to be conducted and reported, V-Flow voluntarily performs customer satisfaction surveys by telephone throughout each month. In 2016, 4,818 customers were surveyed, giving an overall ‘Completely Satisfied’ annual average rating of 95 per cent. The agreement sets monthly performance requirements regarding the number of complaints that are allowed, as follows:
Page 33 of 51
South Coast British Columbia Transportation Authority—2016 Statutory Annual Report March 2017
• Written complaints are not to exceed two per one thousand accounts regarding the toll system and operations of the toll system.
• Complaints regarding data entry errors by the Toll Operator are not to exceed five per one thousand accounts.
• Telephone complaints are not to exceed five complaints per one thousand calls received about the toll system and operations of the toll system.
• Less than two accounts closed due to customer service dissatisfaction out of every 400 accounts closed with respect to the toll system and operations of the toll system.
• Total complaints are not to exceed 15 per one thousand customer contacts regarding the toll system and operations of the toll system.
Complaints are compiled and summarized by V-Flow. Most complaints are received and responded to immediately if received by telephone. Written complaints or complaints requiring written response are responded to within five business days. Complaints about the tolling service on the Golden Ears Bridge in 2016 continued to be relatively low as crossings grew.
Page 34 of 51
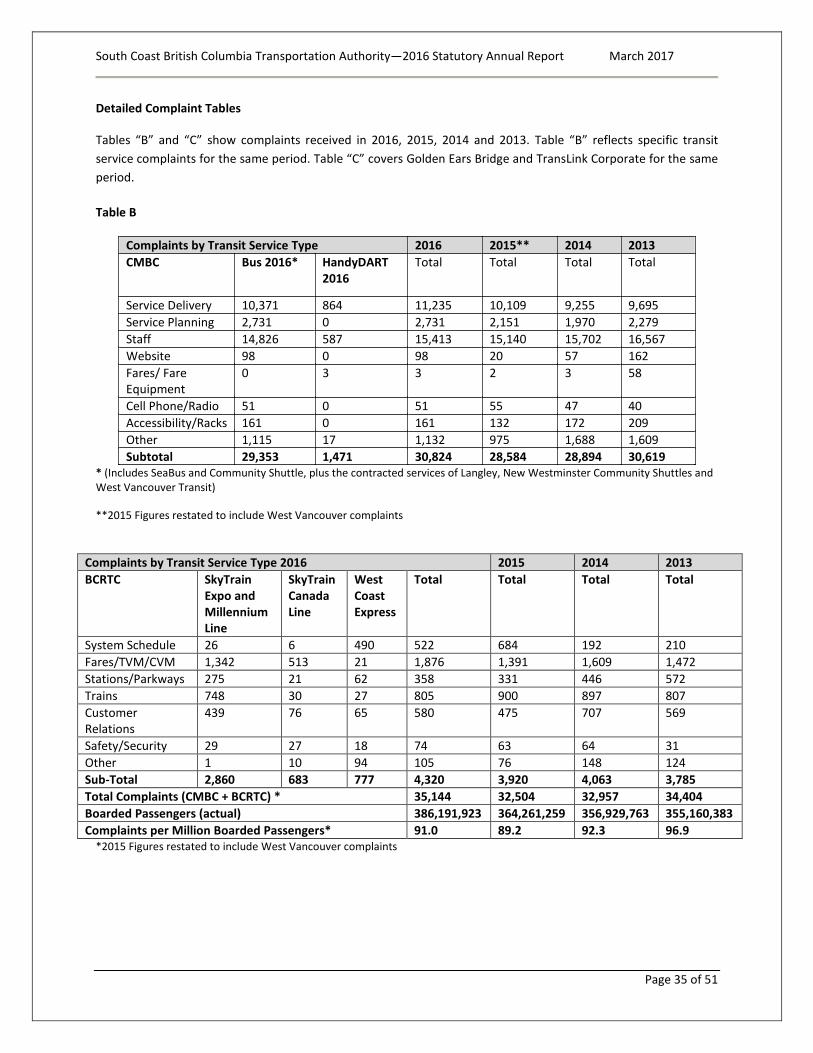
South Coast British Columbia Transportation Authority—2016 Statutory Annual Report March 2017
Detailed Complaint Tables
Tables “B” and “C” show complaints received in 2016, 2015, 2014 and 2013. Table “B” reflects specific transit service complaints for the same period. Table “C” covers Golden Ears Bridge and TransLink Corporate for the same period. Table B
Complaints by Transit Service Type 2016 2015** 2014 2013 CMBC Bus 2016* HandyDART
2016 Total Total Total Total
Service Delivery 10,371 864 11,235 10,109 9,255 9,695 Service Planning 2,731 0 2,731 2,151 1,970 2,279 Staff 14,826 587 15,413 15,140 15,702 16,567 Website 98 0 98 20 57 162 Fares/ Fare Equipment
0 3 3 2 3 58
Cell Phone/Radio 51 0 51 55 47 40 Accessibility/Racks 161 0 161 132 172 209 Other 1,115 17 1,132 975 1,688 1,609 Subtotal 29,353 1,471 30,824 28,584 28,894 30,619
* (Includes SeaBus and Community Shuttle, plus the contracted services of Langley, New Westminster Community Shuttles and West Vancouver Transit)
**2015 Figures restated to include West Vancouver complaints
Complaints by Transit Service Type 2016 2015 2014 2013 BCRTC SkyTrain
Expo and Millennium Line
SkyTrain Canada Line
West Coast Express
Total Total Total Total
System Schedule 26 6 490 522 684 192 210 Fares/TVM/CVM 1,342 513 21 1,876 1,391 1,609 1,472 Stations/Parkways 275 21 62 358 331 446 572 Trains 748 30 27 805 900 897 807 Customer Relations
439 76 65 580 475 707 569
Safety/Security 29 27 18 74 63 64 31 Other 1 10 94 105 76 148 124 Sub-Total 2,860 683 777 4,320 3,920 4,063 3,785 Total Complaints (CMBC + BCRTC) * 35,144 32,504 32,957 34,404 Boarded Passengers (actual) 386,191,923 364,261,259 356,929,763 355,160,383 Complaints per Million Boarded Passengers* 91.0 89.2 92.3 96.9
*2015 Figures restated to include West Vancouver complaints
Page 35 of 51
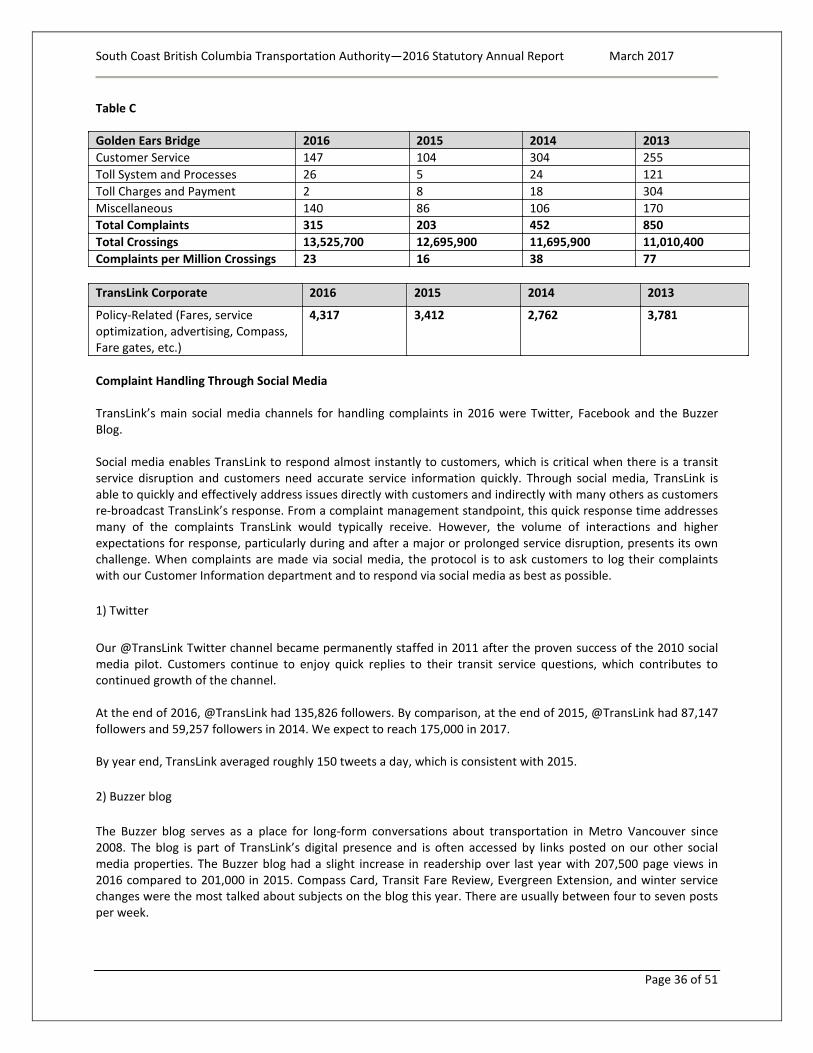
South Coast British Columbia Transportation Authority—2016 Statutory Annual Report March 2017
Table C
Golden Ears Bridge 2016 2015 2014 2013 Customer Service 147 104 304 255 Toll System and Processes 26 5 24 121 Toll Charges and Payment 2 8 18 304 Miscellaneous 140 86 106 170 Total Complaints 315 203 452 850 Total Crossings 13,525,700 12,695,900 11,695,900 11,010,400 Complaints per Million Crossings 23 16 38 77 TransLink Corporate 2016 2015 2014 2013
Policy-Related (Fares, service optimization, advertising, Compass, Fare gates, etc.)
4,317 3,412 2,762 3,781
Complaint Handling Through Social Media TransLink’s main social media channels for handling complaints in 2016 were Twitter, Facebook and the Buzzer Blog. Social media enables TransLink to respond almost instantly to customers, which is critical when there is a transit service disruption and customers need accurate service information quickly. Through social media, TransLink is able to quickly and effectively address issues directly with customers and indirectly with many others as customers re-broadcast TransLink’s response. From a complaint management standpoint, this quick response time addresses many of the complaints TransLink would typically receive. However, the volume of interactions and higher expectations for response, particularly during and after a major or prolonged service disruption, presents its own challenge. When complaints are made via social media, the protocol is to ask customers to log their complaints with our Customer Information department and to respond via social media as best as possible. 1) Twitter Our @TransLink Twitter channel became permanently staffed in 2011 after the proven success of the 2010 social media pilot. Customers continue to enjoy quick replies to their transit service questions, which contributes to continued growth of the channel. At the end of 2016, @TransLink had 135,826 followers. By comparison, at the end of 2015, @TransLink had 87,147 followers and 59,257 followers in 2014. We expect to reach 175,000 in 2017. By year end, TransLink averaged roughly 150 tweets a day, which is consistent with 2015. 2) Buzzer blog The Buzzer blog serves as a place for long-form conversations about transportation in Metro Vancouver since 2008. The blog is part of TransLink’s digital presence and is often accessed by links posted on our other social media properties. The Buzzer blog had a slight increase in readership over last year with 207,500 page views in 2016 compared to 201,000 in 2015. Compass Card, Transit Fare Review, Evergreen Extension, and winter service changes were the most talked about subjects on the blog this year. There are usually between four to seven posts per week.
Page 36 of 51
South Coast British Columbia Transportation Authority—2016 Statutory Annual Report March 2017
3) Facebook TransLink’s Facebook page continues to grow since its inception in 2010. The TransLink Facebook page is a place to communicate with our customers on transit-related information, share photos and videos, and provide information on major service changes. By the end of 2016, the TransLink Facebook page had 26,148 followers compared to 17,338 followers in 2015, 11,325 in 2014 and roughly 9,000 at the end of 2013. There are usually four to five new posts on the page per week.
Page 37 of 51
South Coast British Columbia Transportation Authority—2016 Statutory Annual Report March 2017
D. Customer Satisfaction
2016 Customer Service Performance Ratings Table D below summarizes the percentage of customers who gave good-to-excellent service ratings, which is defined as a rating of 8, 9, or 10 out of 10. All Transit System and mode-specific attribute measures, including overall service, are based on asking the customers directly. In other words, overall service is not calculated mathematically from any of the specific service attributes - such as frequency or reliability. The analysis is segmented into the following groups: • Transit System (includes people who have ridden the bus, SeaBus or SkyTrain at least once within the last 30
days); • Bus System (includes all CMBC bus service as well as West Vancouver Transit and contracted Community
Shuttle service); • SkyTrain (as of August 17, 2009 the SkyTrain segment includes the Canada Line); • SeaBus; • West Coast Express (normally, the survey is conducted twice a year, onboard the train service only and
excludes TrainBus); and • HandyDART (survey conducted once per year, by phone with registered HandyDART customers).
Data is from three sources: • TransLink’s Bus, SkyTrain, SeaBus Customer Service Performance Survey, which interviews adults who have
ridden transit at least once within the last 30 days in Metro Vancouver. Interviews are conducted daily and by phone.
• TransLink’s West Coast Express Customer Service Performance Survey, which is conducted twice per year (March and September) onboard the West Coast Express train. Surveys are partially administered by an interviewer, and may be completed by the individual.
• TransLink’s HandyDART Customer Service Performance Survey, which is conducted once per year in the fall by phone and primarily with past month users of the service.
Customer Service Performance Summary for 2016 — Transit System, Bus, SeaBus, SkyTrain, West Coast Express and HandyDART Transit System In 2016, more than half of transit riders (60 per cent) gave the system good-to-excellent scores of 8, 9 or 10 out of 10 for overall service. This is up from last year (57 per cent), with the first two quarters of 2016 a little higher than the second. The overall service rating at the system level remains lower than each of the overall service ratings by mode. The transit system service attributes that customers are most critical of include: the amount of transit information available on board buses as well as the number of bus shelters available throughout the region. Transit bus shelters are provided by the municipalities. Less than half of customers consistently rate these aspects of transit service as being good to excellent (8 or higher out of 10). However, more than half (53 per cent) of TransLink’s customers feel they are getting good-to-excellent value for the money they spend on transit. This has been trending upward over the past few years (48 per cent in 2015 and 47 per cent in 2014).
Page 38 of 51
South Coast British Columbia Transportation Authority—2016 Statutory Annual Report March 2017
Bus System Six and a half out of ten bus riders rate the overall bus service provided in Metro Vancouver as good to excellent; this is up three percentage points from 2015. The top three areas of bus service strength remain: having an operator who drives safely and professionally, feeling safe from crime on board the bus, and having a direct route. Four-in-five riders gave scores of 8 or higher to these attributes. Overcrowding (49 per cent), on-time reliability (57 per cent) and frequency of service (49 per cent) remain the three lowest-rated bus service attributes although all are up from last year (up from 48 per cent, 55 per cent and 47 per cent respectively). SkyTrain In 2016, 75 per cent of SkyTrain customers, which includes Canada Line, gave the overall service good-to-excellent scores. This is an increase of three percentage points over 2015. Overcrowding, although not the lowest-rated attribute, is an important area of SkyTrain service to monitor because of the relative impact that crowding has on customers’ perceptions of the overall SkyTrain service. The rating is marginally higher than last year. SeaBus SeaBus ratings are up over last year. Four-in-five SeaBus customers (84 per cent, versus 78 per cent in 2015) now rate the service as an eight or higher out of ten for overall service. Ratings are also higher for safety from crime. West Coast Express West Coast Express always receives high scores from its customers with greater than four-in-five (84 per cent) giving it good-to-excellent ratings for overall service. This, is up from last year (72 per cent), as are many of the attributes of WCE service; most notably on-time reliable service (71 per cent, up from 59 per cent in 2015). Over the course of the year there were several disruptive issues revolving around the shared use of the track with CP Rail and their maintenance schedule. HandyDART HandyDART Service is a highly-rated transit service, with eight-in-ten riders (79 per cent) giving it good-to-excellent ratings for overall service, which is identical to 2015 ratings. Most attributes continue to achieve very high ratings, especially those related to operators’ abilities. Ratings for value for money remain very high (85 per cent). The three lowest-scoring HandyDART attributes: service availability, on-time reliable service and ease of booking a trip, achieve very respectable ratings (all 72 per cent).
Page 39 of 51
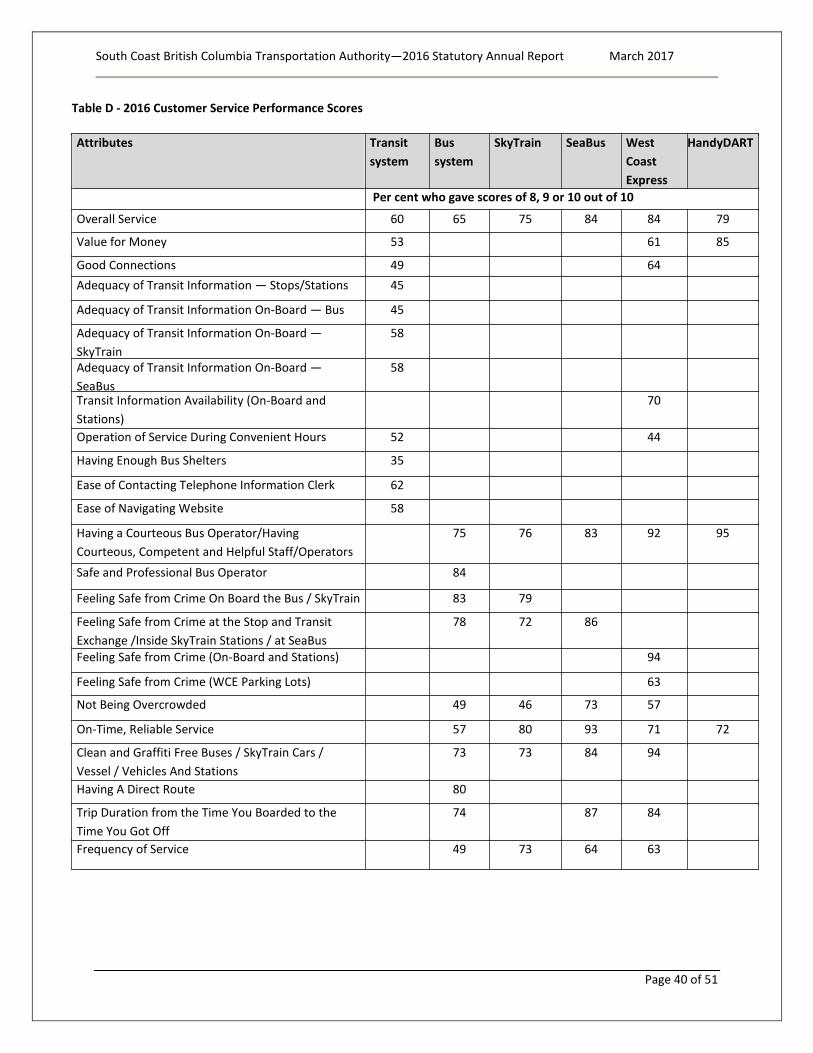
South Coast British Columbia Transportation Authority—2016 Statutory Annual Report March 2017
Table D - 2016 Customer Service Performance Scores
Attributes Transit system
Bus system
SkyTrain SeaBus West Coast Express
HandyDART
Per cent who gave scores of 8, 9 or 10 out of 10
Overall Service
60 65 75 84 84 79 Value for Money 53 61 85
Good Connections 49 64 Adequacy of Transit Information — Stops/Stations 45
Adequacy of Transit Information On-Board — Bus 45
Adequacy of Transit Information On-Board —SkyTrain
58
Adequacy of Transit Information On-Board — SeaBus
58
Transit Information Availability (On-Board and Stations)
70
Operation of Service During Convenient Hours 52 44
Having Enough Bus Shelters 35
Ease of Contacting Telephone Information Clerk 62
Ease of Navigating Website 58
Having a Courteous Bus Operator/Having Courteous, Competent and Helpful Staff/Operators
75 76 83 92 95
Safe and Professional Bus Operator 84
Feeling Safe from Crime On Board the Bus / SkyTrain 83 79
Feeling Safe from Crime at the Stop and Transit Exchange /Inside SkyTrain Stations / at SeaBus
78 72 86
Feeling Safe from Crime (On-Board and Stations) 94
Feeling Safe from Crime (WCE Parking Lots) 63
Not Being Overcrowded 49 46 73 57
On-Time, Reliable Service 57 80 93 71 72
Clean and Graffiti Free Buses / SkyTrain Cars / Vessel / Vehicles And Stations
73 73 84 94
Having A Direct Route 80
Trip Duration from the Time You Boarded to the Time You Got Off
74 87 84
Frequency of Service 49 73 64 63
Page 40 of 51
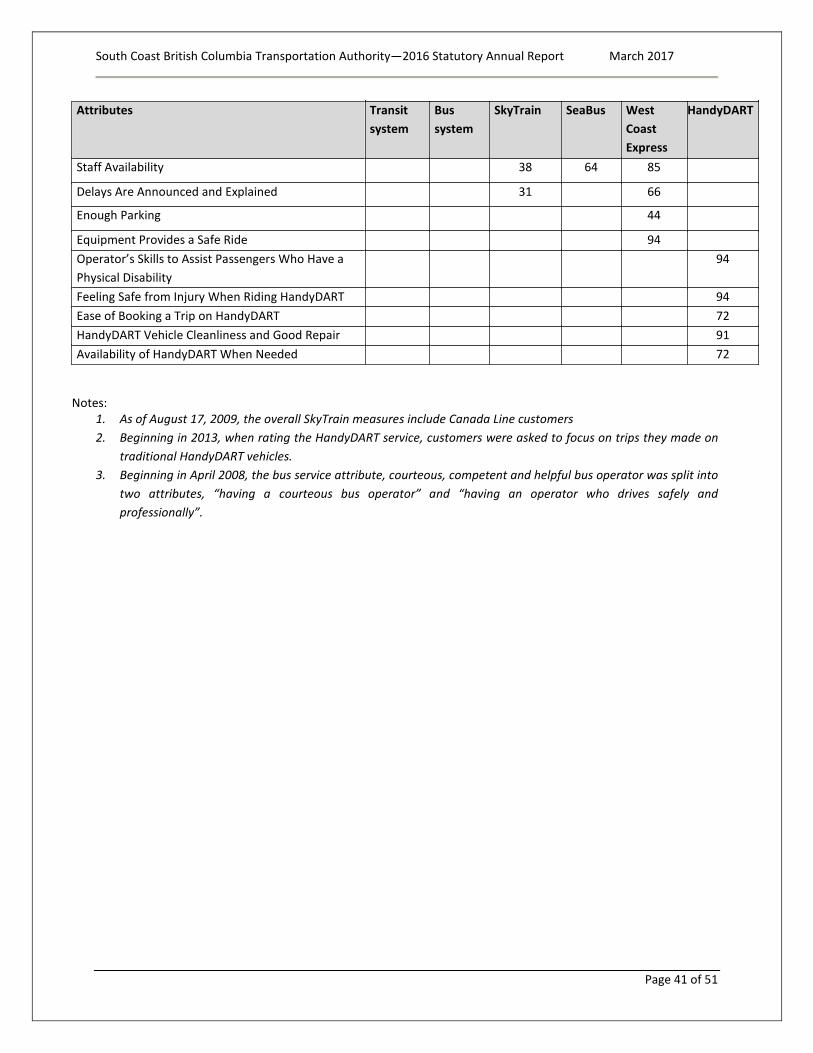
South Coast British Columbia Transportation Authority—2016 Statutory Annual Report March 2017
Notes:
1. As of August 17, 2009, the overall SkyTrain measures include Canada Line customers 2. Beginning in 2013, when rating the HandyDART service, customers were asked to focus on trips they made on
traditional HandyDART vehicles. 3. Beginning in April 2008, the bus service attribute, courteous, competent and helpful bus operator was split into
two attributes, “having a courteous bus operator” and “having an operator who drives safely and professionally”.
Attributes Transit system
Bus system
SkyTrain SeaBus West Coast Express
HandyDART
Staff Availability 38 64 85
Delays Are Announced and Explained 31 66
Enough Parking 44
Equipment Provides a Safe Ride 94 Operator’s Skills to Assist Passengers Who Have a Physical Disability
94
Feeling Safe from Injury When Riding HandyDART 94 Ease of Booking a Trip on HandyDART 72 HandyDART Vehicle Cleanliness and Good Repair 91 Availability of HandyDART When Needed 72
Page 41 of 51
South Coast British Columbia Transportation Authority—2016 Statutory Annual Report March 2017
E. Changes to Articles of the Authority
There were no amendments to the Articles of the Authority in 2016.
Page 42 of 51
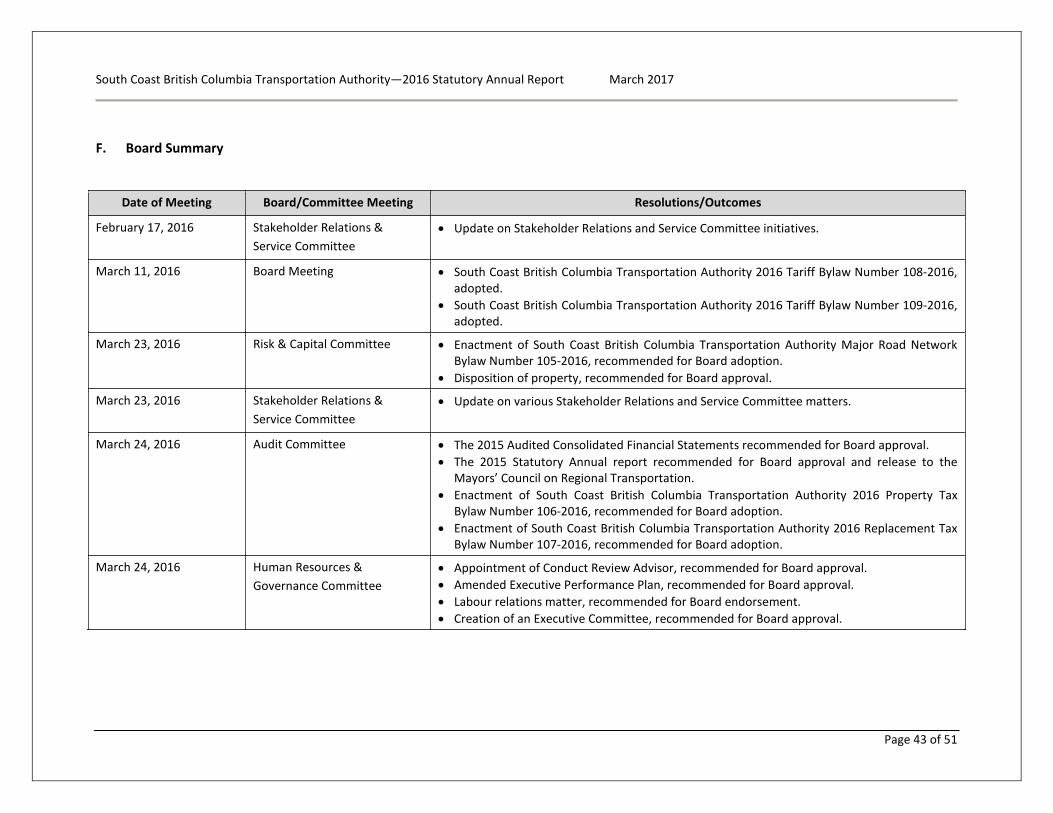
South Coast British Columbia Transportation Authority—2016 Statutory Annual Report March 2017
F. Board Summary
Date of Meeting Board/Committee Meeting Resolutions/Outcomes
February 17, 2016 Stakeholder Relations & Service Committee
• Update on Stakeholder Relations and Service Committee initiatives.
March 11, 2016 Board Meeting • South Coast British Columbia Transportation Authority 2016 Tariff Bylaw Number 108-2016, adopted.
• South Coast British Columbia Transportation Authority 2016 Tariff Bylaw Number 109-2016, adopted.
March 23, 2016 Risk & Capital Committee • Enactment of South Coast British Columbia Transportation Authority Major Road Network Bylaw Number 105-2016, recommended for Board adoption.
• Disposition of property, recommended for Board approval.
March 23, 2016 Stakeholder Relations & Service Committee
• Update on various Stakeholder Relations and Service Committee matters.
March 24, 2016 Audit Committee • The 2015 Audited Consolidated Financial Statements recommended for Board approval. • The 2015 Statutory Annual report recommended for Board approval and release to the
Mayors’ Council on Regional Transportation. • Enactment of South Coast British Columbia Transportation Authority 2016 Property Tax
Bylaw Number 106-2016, recommended for Board adoption. • Enactment of South Coast British Columbia Transportation Authority 2016 Replacement Tax
Bylaw Number 107-2016, recommended for Board adoption.
March 24, 2016 Human Resources & Governance Committee
• Appointment of Conduct Review Advisor, recommended for Board approval. • Amended Executive Performance Plan, recommended for Board approval. • Labour relations matter, recommended for Board endorsement. • Creation of an Executive Committee, recommended for Board approval.
Page 43 of 51
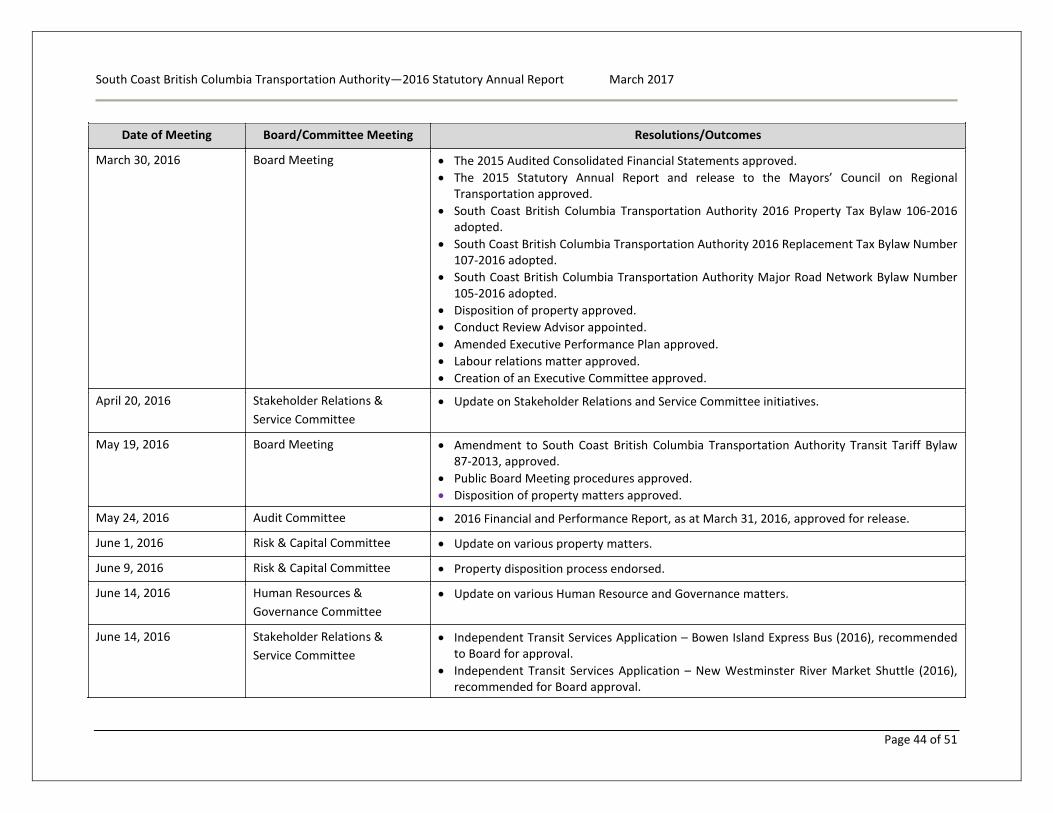
South Coast British Columbia Transportation Authority—2016 Statutory Annual Report March 2017
Date of Meeting Board/Committee Meeting Resolutions/Outcomes
March 30, 2016 Board Meeting • The 2015 Audited Consolidated Financial Statements approved. • The 2015 Statutory Annual Report and release to the Mayors’ Council on Regional
Transportation approved. • South Coast British Columbia Transportation Authority 2016 Property Tax Bylaw 106-2016
adopted. • South Coast British Columbia Transportation Authority 2016 Replacement Tax Bylaw Number
107-2016 adopted. • South Coast British Columbia Transportation Authority Major Road Network Bylaw Number
105-2016 adopted. • Disposition of property approved. • Conduct Review Advisor appointed. • Amended Executive Performance Plan approved. • Labour relations matter approved. • Creation of an Executive Committee approved.
April 20, 2016 Stakeholder Relations & Service Committee
• Update on Stakeholder Relations and Service Committee initiatives.
May 19, 2016 Board Meeting • Amendment to South Coast British Columbia Transportation Authority Transit Tariff Bylaw 87-2013, approved.
• Public Board Meeting procedures approved. • Disposition of property matters approved.
May 24, 2016 Audit Committee • 2016 Financial and Performance Report, as at March 31, 2016, approved for release.
June 1, 2016 Risk & Capital Committee • Update on various property matters.
June 9, 2016 Risk & Capital Committee • Property disposition process endorsed.
June 14, 2016 Human Resources & Governance Committee
• Update on various Human Resource and Governance matters.
June 14, 2016 Stakeholder Relations & Service Committee
• Independent Transit Services Application – Bowen Island Express Bus (2016), recommended to Board for approval.
• Independent Transit Services Application – New Westminster River Market Shuttle (2016), recommended for Board approval.
Page 44 of 51
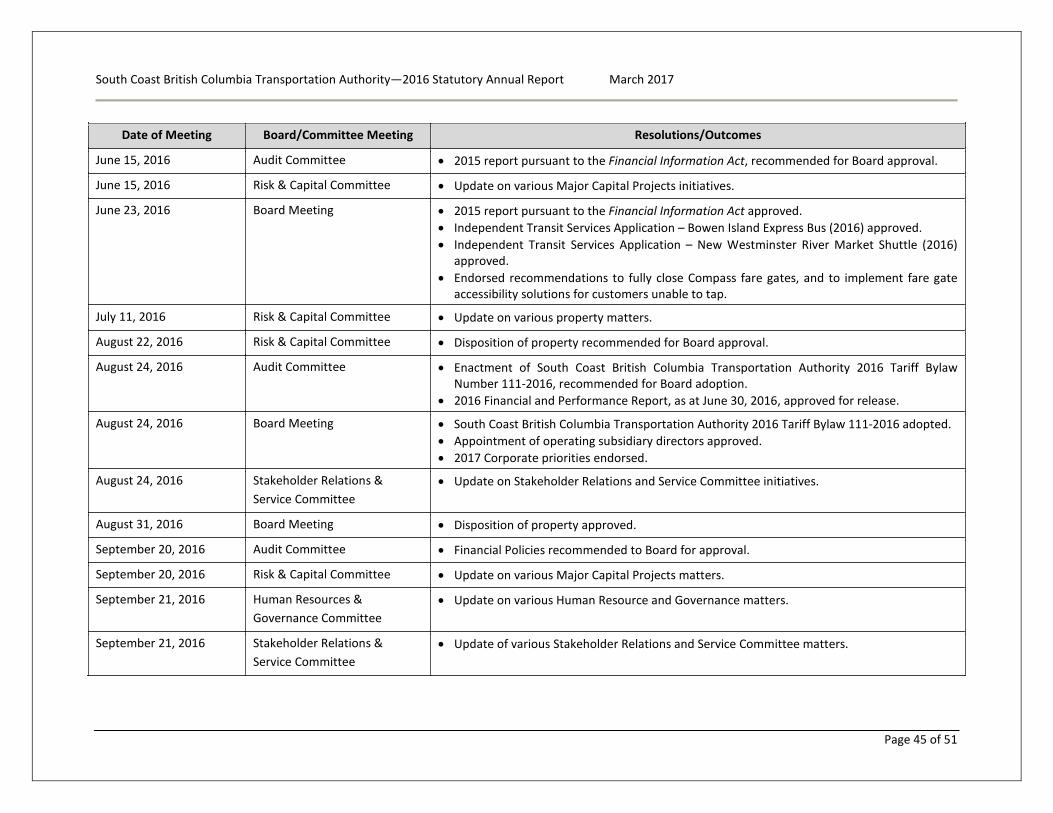
South Coast British Columbia Transportation Authority—2016 Statutory Annual Report March 2017
Date of Meeting Board/Committee Meeting Resolutions/Outcomes
June 15, 2016 Audit Committee • 2015 report pursuant to the Financial Information Act, recommended for Board approval.
June 15, 2016 Risk & Capital Committee • Update on various Major Capital Projects initiatives.
June 23, 2016 Board Meeting • 2015 report pursuant to the Financial Information Act approved. • Independent Transit Services Application – Bowen Island Express Bus (2016) approved. • Independent Transit Services Application – New Westminster River Market Shuttle (2016)
approved. • Endorsed recommendations to fully close Compass fare gates, and to implement fare gate
accessibility solutions for customers unable to tap.
July 11, 2016 Risk & Capital Committee • Update on various property matters.
August 22, 2016 Risk & Capital Committee • Disposition of property recommended for Board approval.
August 24, 2016 Audit Committee • Enactment of South Coast British Columbia Transportation Authority 2016 Tariff Bylaw Number 111-2016, recommended for Board adoption.
• 2016 Financial and Performance Report, as at June 30, 2016, approved for release.
August 24, 2016 Board Meeting • South Coast British Columbia Transportation Authority 2016 Tariff Bylaw 111-2016 adopted. • Appointment of operating subsidiary directors approved. • 2017 Corporate priorities endorsed.
August 24, 2016 Stakeholder Relations & Service Committee
• Update on Stakeholder Relations and Service Committee initiatives.
August 31, 2016 Board Meeting • Disposition of property approved.
September 20, 2016 Audit Committee • Financial Policies recommended to Board for approval.
September 20, 2016 Risk & Capital Committee • Update on various Major Capital Projects matters.
September 21, 2016 Human Resources & Governance Committee
• Update on various Human Resource and Governance matters.
September 21, 2016 Stakeholder Relations & Service Committee
• Update of various Stakeholder Relations and Service Committee matters.
Page 45 of 51
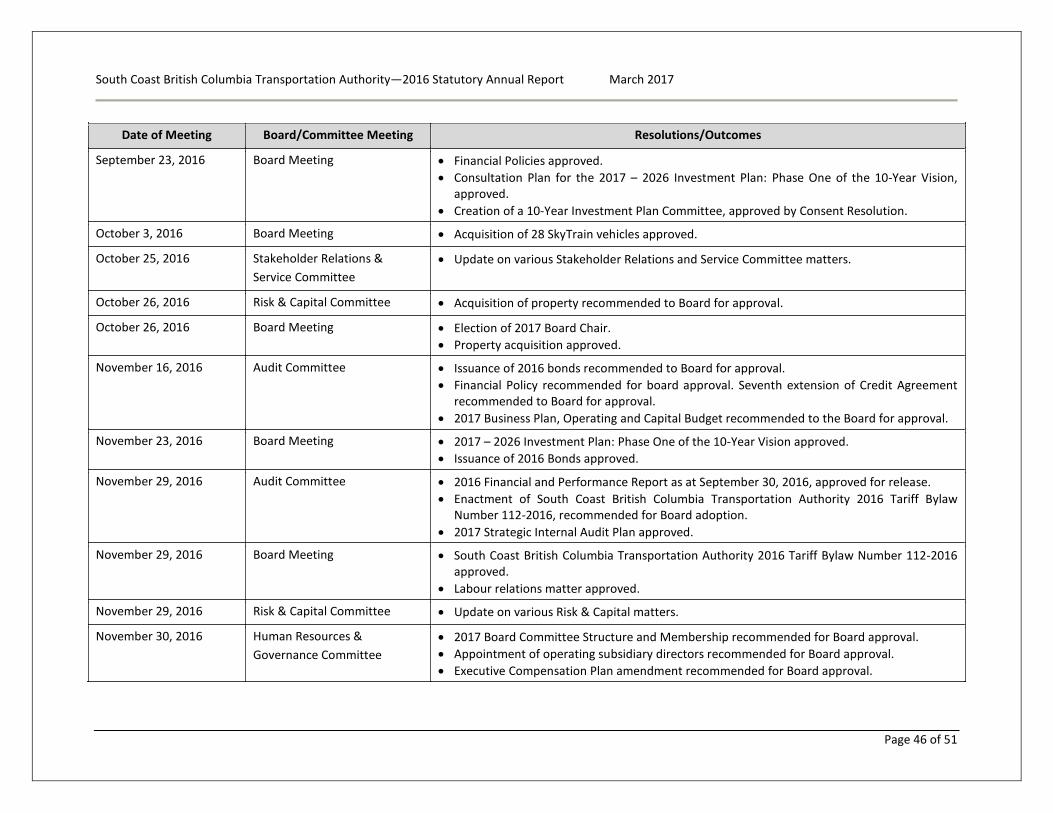
South Coast British Columbia Transportation Authority—2016 Statutory Annual Report March 2017
Date of Meeting Board/Committee Meeting Resolutions/Outcomes
September 23, 2016 Board Meeting • Financial Policies approved. • Consultation Plan for the 2017 – 2026 Investment Plan: Phase One of the 10-Year Vision,
approved. • Creation of a 10-Year Investment Plan Committee, approved by Consent Resolution.
October 3, 2016 Board Meeting • Acquisition of 28 SkyTrain vehicles approved.
October 25, 2016 Stakeholder Relations & Service Committee
• Update on various Stakeholder Relations and Service Committee matters.
October 26, 2016 Risk & Capital Committee • Acquisition of property recommended to Board for approval.
October 26, 2016 Board Meeting • Election of 2017 Board Chair. • Property acquisition approved.
November 16, 2016 Audit Committee • Issuance of 2016 bonds recommended to Board for approval. • Financial Policy recommended for board approval. Seventh extension of Credit Agreement
recommended to Board for approval. • 2017 Business Plan, Operating and Capital Budget recommended to the Board for approval.
November 23, 2016 Board Meeting • 2017 – 2026 Investment Plan: Phase One of the 10-Year Vision approved. • Issuance of 2016 Bonds approved.
November 29, 2016 Audit Committee • 2016 Financial and Performance Report as at September 30, 2016, approved for release. • Enactment of South Coast British Columbia Transportation Authority 2016 Tariff Bylaw
Number 112-2016, recommended for Board adoption. • 2017 Strategic Internal Audit Plan approved.
November 29, 2016 Board Meeting • South Coast British Columbia Transportation Authority 2016 Tariff Bylaw Number 112-2016 approved.
• Labour relations matter approved.
November 29, 2016 Risk & Capital Committee • Update on various Risk & Capital matters.
November 30, 2016 Human Resources & Governance Committee
• 2017 Board Committee Structure and Membership recommended for Board approval. • Appointment of operating subsidiary directors recommended for Board approval. • Executive Compensation Plan amendment recommended for Board approval.
Page 46 of 51
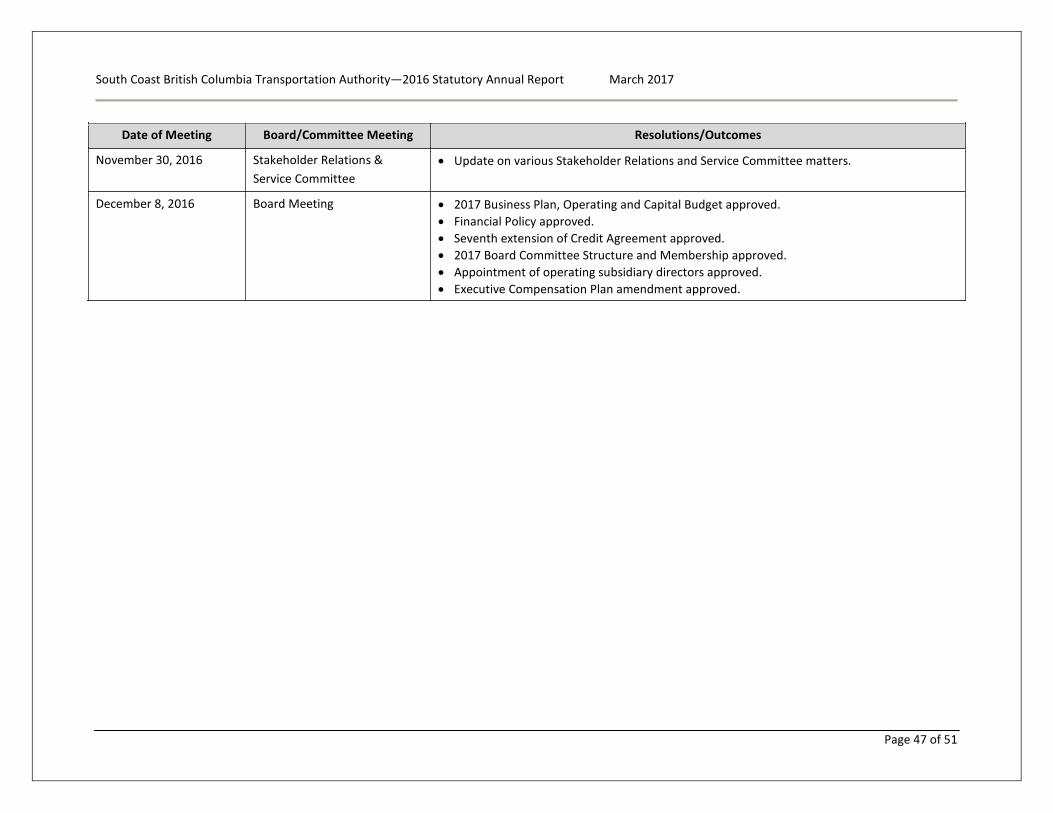
South Coast British Columbia Transportation Authority—2016 Statutory Annual Report March 2017
Date of Meeting Board/Committee Meeting Resolutions/Outcomes
November 30, 2016 Stakeholder Relations & Service Committee
• Update on various Stakeholder Relations and Service Committee matters.
December 8, 2016 Board Meeting • 2017 Business Plan, Operating and Capital Budget approved. • Financial Policy approved. • Seventh extension of Credit Agreement approved. • 2017 Board Committee Structure and Membership approved. • Appointment of operating subsidiary directors approved. • Executive Compensation Plan amendment approved.
Page 47 of 51
South Coast British Columbia Transportation Authority—2016 Statutory Annual Report March 2017
G. Fare Collection Bylaw
The current version of the Fare Collection Bylaw is shown below. Definitions
1. In this regulation:
"Act" means the South Coast British Columbia Transportation Authority Act; "pass" means a record that the authority or a related party has issued or recognized as authorization for the person to whom it was issued to enter a fare paid zone or board a transit vehicle that is not a fare paid zone, and includes, without limitation, a transfer, a fare receipt, a monthly pass, any other time-limited pass and a payment card; "payment card" means a record issued by the authority or a related party if the following apply:
(a) the person to whom the record is issued can, by paying money to the authority or a related party, create or increase a credit balance on the record; (b) the credit balance on the record can be applied by the person to whom the record was issued towards any fare;
"surcharge date”, in relation to a ticket, means the later of (a) the date that is 180 days after the date of service of the ticket, (b) if the person to whom the ticket was issued disputes his or her liability under the ticket in accordance with section 4, the date that is 31 days after the date on which a notice of decision in response to the dispute is provided to that person under section 4 (4), and (c) if the person to whom the ticket was issued appeals his or her liability under the ticket in accordance with section 7, the date that is 7 days after the date on which a notice of decision in response to the appeal is provided to that person under section 7 (5);
"ticket" means a ticket issued under section 248 of the Act. Description of infraction
2. Every word and phrase set out in Column 2 of Schedule 1 to this regulation is authorized to be used on a ticket to describe the infraction of contravening the provision of the Act referred to in Column 1 opposite that word or phrase.
Ticketed amounts
3. (1) For the contravention of a provision of the Act set out in Column 1 of Schedule 1 to this regulation,
(a) Column 2 of Schedule 1 sets out the description of the infraction for the purposes of section 2, and (b) Column 3 of Schedule 1 prescribes the fine for the infraction.
(2) On the surcharge date applicable to a ticket, a surcharge of $40 is added to and forms part of the ticketed amount if full payment of the ticketed amount is not made before the surcharge date. (3) On the date that is 366 days after the date of service of the ticket, an additional surcharge of $60 is added to and forms part of the ticketed amount if full payment of the ticketed amount is not made on or before that date.
Dispute process
4. (1) For the purposes of section 251 (1) of the Act, a person to whom a ticket has been issued may dispute his or her liability under the ticket
Page 48 of 51
South Coast British Columbia Transportation Authority—2016 Statutory Annual Report March 2017
(a) within 14 days after the date of service of the ticket, or (b) if the authority is satisfied that, due to extenuating circumstances, the person was not reasonably able within that 14 day period to dispute liability under the ticket, within any longer period that the authority may, in writing, specify.
(2) To dispute liability under a ticket, the person to whom the ticket was issued must, within the dispute period referred to in subsection (1) of this section, provide to the authority, in accordance with subsection (3), a notice of the dispute
(a) identifying on which of the grounds set out in section 251 (1) of the Act the person is basing the dispute, and (b) providing any information relevant to the dispute.
(3) A notice of dispute under subsection (2) of this section must be provided to the authority by (a) mailing it to the head office of the authority, or (b) providing it electronically in the manner set out on the authority's website.
(4) Within 30 days after receiving a notice of dispute under subsection (2), the authority must (a) decide whether to confirm or cancel the ticket, and (b) provide to the person who submitted the notice of dispute, in accordance with subsection (5), notice of that decision and the basis on which it was made.
(5) A notice of decision under subsection (4) must be provided to the person who submitted the notice of dispute by
(a) mailing the notice of decision to the postal address provided for that person in the notice of dispute, or (b) emailing the notice of decision to the email address provided for that person in the notice of dispute.
Appeal period
5. (1) For the purposes of section 253 of the Act, a person who has disputed liability under a ticket in accordance with section 4 of this regulation and Division 3 of Part 12 of the Act may appeal liability under the ticket to an arbitrator
(a) within 30 days after the authority provided notice under section 4 (4) of this regulation of the authority's decision, or (b) if the arbitrator is satisfied that, due to extenuating circumstances, the person was not reasonably able within that 30 day period to appeal liability under the ticket, within any longer period that the arbitrator may, in writing, specify.
(2) A request under subsection (1) (b) for an extension of time within which to appeal liability under a ticket must
(a) set out the reason why the person was unable to provide a notice of appeal within the 30 day period referred to in subsection (1) (a), and (b) be provided to the authority by
(i) mailing the request to the head office of the authority, or (ii) providing the request electronically in the manner set out on the authority's website.
(3) Promptly after receiving a request referred to in subsection (2), the authority must provide the request to the arbitrator. (4) Within 14 days after receiving a request under subsection (3), the arbitrator must provide notice to the appellant and the authority as to whether an extension of time within which to appeal liability under the ticket has been granted and if an extension is granted, indicate the date before which the notice of appeal must be provided to the authority.
Additional grounds for appeal
6. For the purpose of section 253 (c) of the Act, a person may appeal liability under a ticket on the ground that relevant information was not submitted in the dispute procedure.
Page 49 of 51
South Coast British Columbia Transportation Authority—2016 Statutory Annual Report March 2017
Appeal process
7. (1) To appeal liability under a ticket, the person to whom the ticket was issued must, within the appeal period referred to in section 5 (1), provide to the authority, in accordance with subsection (2) of this section, a notice of appeal
(a) identifying on which of the grounds set out in section 253 of the Act or section 6 of this regulation the person is basing the appeal, and (b) providing any information relevant to the appeal.
(2) A notice of appeal under subsection (1) must be provided to the authority by (a) mailing it to the head office of the authority, or (b) providing it electronically in the manner set out on the authority’s website.
(3) Promptly after receiving a notice of appeal under subsection (2), the authority must provide the notice of appeal to the arbitrator who has the earliest availability. (4) An arbitrator to whom a notice of appeal is provided under subsection (3) may request from the appellant or the authority any additional records or information that the arbitrator considers appropriate and may, in his or her sole discretion, authorize the appellant and the authority to provide the additional records or information to the arbitrator in one or more of the following manners:
(a) in person; (b) in writing; (c) electronically.
(5) After receiving a notice of appeal under subsection (3), the arbitrator must (a) confirm or cancel the ticket, and (b) provide, in accordance with subsection (6), to
(i) the person who submitted the notice of appeal, and (ii) the authority notice of that decision and the basis on which it was made.
(6) A notice of decision under subsection (5) must be provided to the person who submitted the notice of appeal by
(a) mailing the notice of decision to the postal address provided for that person in the notice of appeal, or (b) emailing the notice of decision to the email address provided for that person in the notice of appeal.
Cancellation of tickets
8. If a ticket is cancelled under section 4 or 7 and some or all of the ticketed amount of the ticket has been paid to the authority, the authority must refund the amount paid.
Payment of fare
9. For the purposes of section 244 (1) (a) of the Act, a person may satisfy the requirement to pay the fare required by the tariff in any of the following manners:
(a) if a pass has been issued to the person and that pass is valid for application to the fare,
(i) if a device that can record the use of the pass has been installed or made available by the authority or a related party for the fare paid zone or transit vehicle, by using the pass in such a way that
(A) its use is recorded by the device, and (B) if the pass is a payment card, the unpaid portion, if any, of the fare is debited from the pass, or
Page 50 of 51
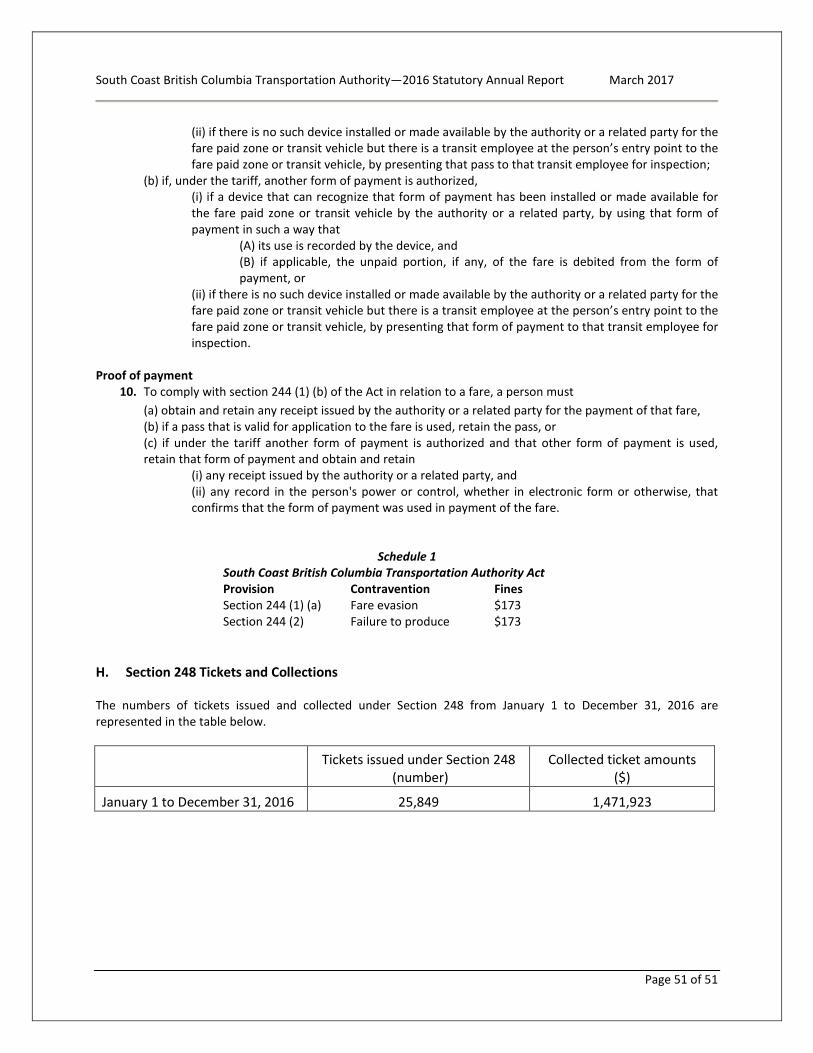
South Coast British Columbia Transportation Authority—2016 Statutory Annual Report March 2017
(ii) if there is no such device installed or made available by the authority or a related party for the fare paid zone or transit vehicle but there is a transit employee at the person’s entry point to the fare paid zone or transit vehicle, by presenting that pass to that transit employee for inspection;
(b) if, under the tariff, another form of payment is authorized, (i) if a device that can recognize that form of payment has been installed or made available for the fare paid zone or transit vehicle by the authority or a related party, by using that form of payment in such a way that
(A) its use is recorded by the device, and (B) if applicable, the unpaid portion, if any, of the fare is debited from the form of payment, or
(ii) if there is no such device installed or made available by the authority or a related party for the fare paid zone or transit vehicle but there is a transit employee at the person’s entry point to the fare paid zone or transit vehicle, by presenting that form of payment to that transit employee for inspection.
Proof of payment
10. To comply with section 244 (1) (b) of the Act in relation to a fare, a person must (a) obtain and retain any receipt issued by the authority or a related party for the payment of that fare, (b) if a pass that is valid for application to the fare is used, retain the pass, or (c) if under the tariff another form of payment is authorized and that other form of payment is used, retain that form of payment and obtain and retain
(i) any receipt issued by the authority or a related party, and (ii) any record in the person's power or control, whether in electronic form or otherwise, that confirms that the form of payment was used in payment of the fare.
Schedule 1 South Coast British Columbia Transportation Authority Act Provision Contravention Fines Section 244 (1) (a) Fare evasion $173 Section 244 (2) Failure to produce $173
H. Section 248 Tickets and Collections
The numbers of tickets issued and collected under Section 248 from January 1 to December 31, 2016 are represented in the table below.
Tickets issued under Section 248
(number) Collected ticket amounts
($)
January 1 to December 31, 2016 25,849 1,471,923
Page 51 of 51
Consolidated Financial Statements (Expressed in thousands of dollars)
SOUTH COAST BRITISH COLUMBIA TRANSPORTATION AUTHORITY
Year ended December 31, 2016
APPENDIX A
KPMG EnterpriseTM Metro Tower I 4710 Kingsway, Suite 2400 Burnaby BC V5H 4M2 Canada Telephone (604) 527-3600 Fax (604) 527-3636
INDEPENDENT AUDITORS' REPORT
To the Members of the Board of the South Coast British Columbia Transportation Authority
We have audited the accompanying consolidated financial statements of the South Coast British Columbia Transportation Authority, which comprise the consolidated statement of financial position as at December 31, 2016, the consolidated statements of operations, changes in net debt and cash flows for the year then ended, and notes, comprising a summary of significant accounting policies and other explanatory information.
Management's Responsibility for the Consolidated Financial Statements
Management is responsible for the preparation and fair presentation of these consolidated financial statements in accordance with Canadian public sector accounting standards, and for such internal control as management determines is necessary to enable the preparation of financial statements that are free from material misstatement, whether due to fraud or error.
Auditors' Responsibility
Our responsibility is to express an opinion on these consolidated financial statements based on our audit. We conducted our audit in accordance with Canadian generally accepted auditing standards. Those standards require that we comply with ethical requirements and plan and perform an audit to obtain reasonable assurance about whether the consolidated financial statements are free from material misstatement.
An audit involves performing procedures to obtain audit evidence about the amounts and disclosures in the consolidated financial statements. The procedures selected depend on our judgment, including the assessment of the risks of material misstatement of the consolidated financial statements, whether due to fraud or error. In making those risk assessments, we consider internal control relevant to the entity’s preparation and fair presentation of the consolidated financial statements in order to design audit procedures that are appropriate in the circumstances, but not for the purpose of expressing an opinion on the effectiveness of the entity’s internal control. An audit also includes evaluating the appropriateness of accounting policies used and the reasonableness of accounting estimates made by management, as well as evaluating the overall presentation of the consolidated financial statements.
KPMG LLP is a Canadian limited liability partnership and a member firm of the KPMG network of independent member firms affiliated with KPMG International Cooperative (“KPMG International”), a Swiss entity. KPMG Canada provides services to KPMG LLP.
South Coast British Columbia Transportation Authority Page 2
We believe that the audit evidence we have obtained in our audit is sufficient and appropriate to provide a basis for our audit opinion.
Opinion
In our opinion, the consolidated financial statements present fairly, in all material respects, the consolidated financial position of the South Coast British Columbia Transportation Authority as at December 31, 2016 and its consolidated results of operations, consolidated changes in net debt and its consolidated cash flows for the year then ended in accordance with Canadian public sector accounting standards.
Chartered Professional Accountants March 30, 2017 Burnaby, Canada
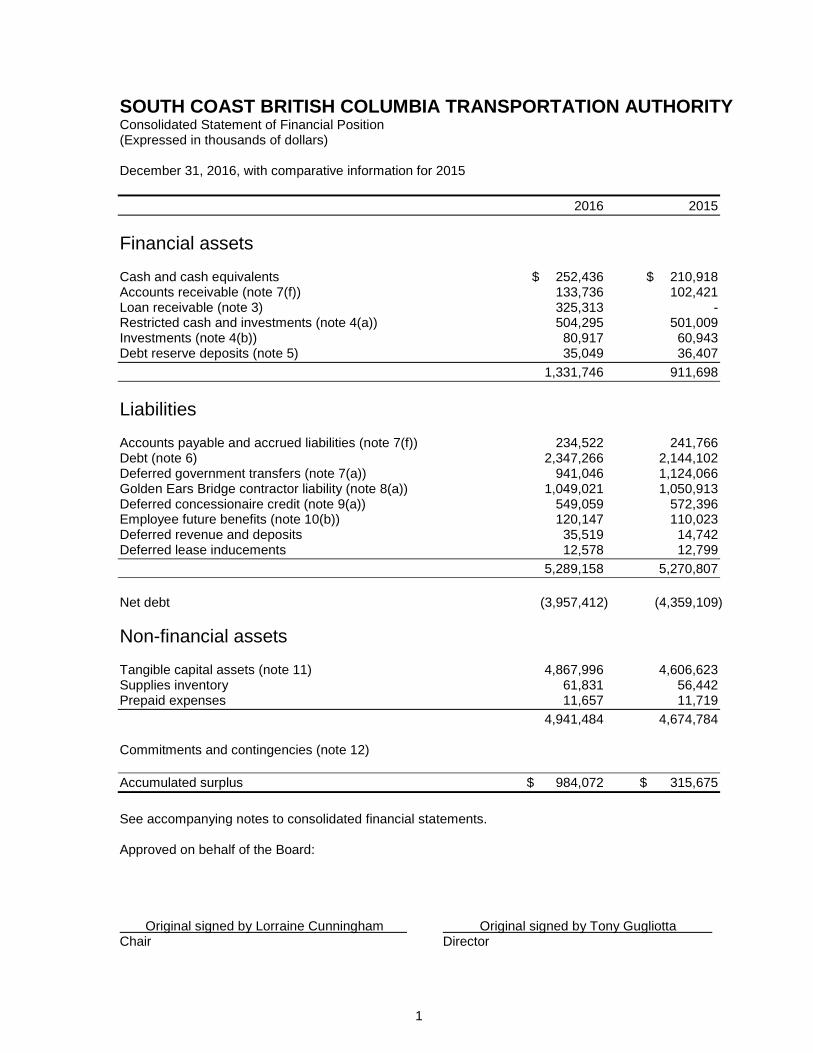
SOUTH COAST BRITISH COLUMBIA TRANSPORTATION AUTHORITY Consolidated Statement of Financial Position (Expressed in thousands of dollars) December 31, 2016, with comparative information for 2015 2016 2015 Financial assets Cash and cash equivalents $ 252,436 $ 210,918 Accounts receivable (note 7(f)) 133,736 102,421 Loan receivable (note 3) 325,313 - Restricted cash and investments (note 4(a)) 504,295 501,009 Investments (note 4(b)) 80,917 60,943 Debt reserve deposits (note 5) 35,049 36,407 1,331,746 911,698 Liabilities Accounts payable and accrued liabilities (note 7(f)) 234,522 241,766 Debt (note 6) 2,347,266 2,144,102 Deferred government transfers (note 7(a)) 941,046 1,124,066 Golden Ears Bridge contractor liability (note 8(a)) 1,049,021 1,050,913 Deferred concessionaire credit (note 9(a)) 549,059 572,396 Employee future benefits (note 10(b)) 120,147 110,023 Deferred revenue and deposits 35,519 14,742 Deferred lease inducements 12,578 12,799 5,289,158 5,270,807 Net debt (3,957,412) (4,359,109) Non-financial assets Tangible capital assets (note 11) 4,867,996 4,606,623 Supplies inventory 61,831 56,442 Prepaid expenses 11,657 11,719 4,941,484 4,674,784 Commitments and contingencies (note 12) Accumulated surplus $ 984,072 $ 315,675 See accompanying notes to consolidated financial statements. Approved on behalf of the Board: Original signed by Lorraine Cunningham Original signed by Tony Gugliotta Chair Director
1
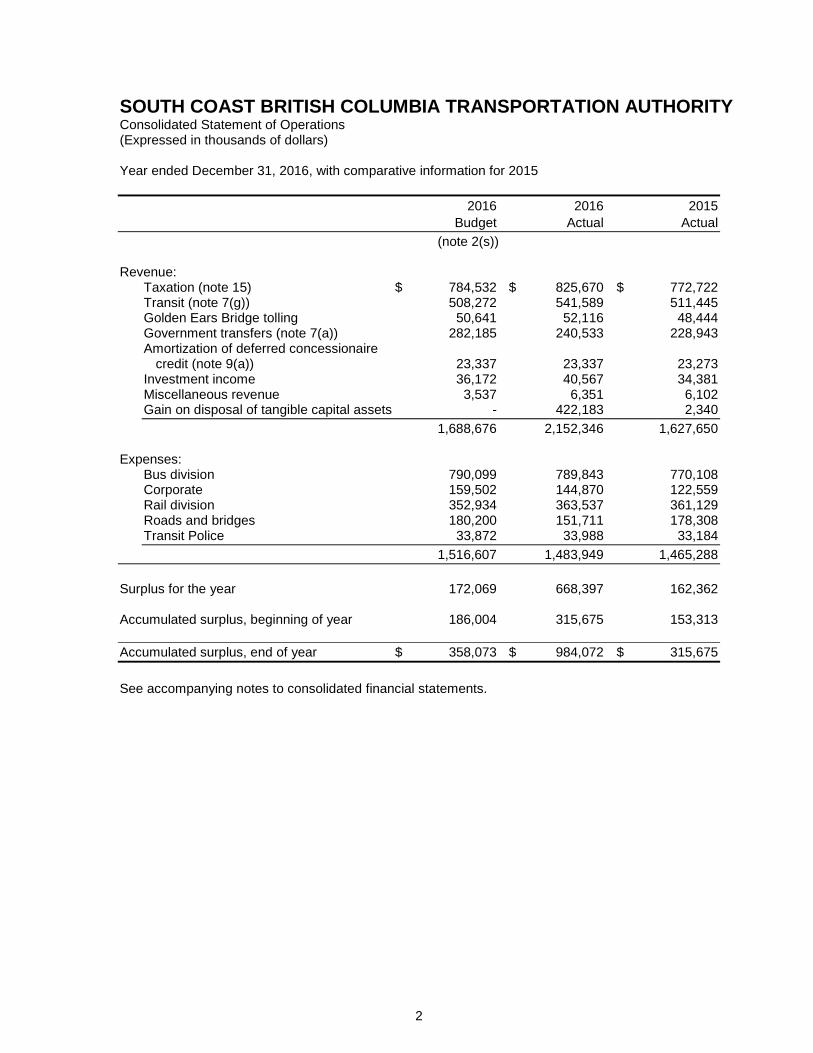
SOUTH COAST BRITISH COLUMBIA TRANSPORTATION AUTHORITY Consolidated Statement of Operations (Expressed in thousands of dollars) Year ended December 31, 2016, with comparative information for 2015 2016 2016 2015 Budget Actual Actual (note 2(s)) Revenue:
Taxation (note 15) $ 784,532 $ 825,670 $ 772,722 Transit (note 7(g)) 508,272 541,589 511,445 Golden Ears Bridge tolling 50,641 52,116 48,444 Government transfers (note 7(a)) 282,185 240,533 228,943 Amortization of deferred concessionaire credit (note 9(a)) 23,337 23,337 23,273 Investment income 36,172 40,567 34,381 Miscellaneous revenue 3,537 6,351 6,102 Gain on disposal of tangible capital assets - 422,183 2,340 1,688,676 2,152,346 1,627,650
Expenses:
Bus division 790,099 789,843 770,108 Corporate 159,502 144,870 122,559 Rail division 352,934 363,537 361,129 Roads and bridges 180,200 151,711 178,308 Transit Police 33,872 33,988 33,184 1,516,607 1,483,949 1,465,288
Surplus for the year 172,069 668,397 162,362 Accumulated surplus, beginning of year 186,004 315,675 153,313 Accumulated surplus, end of year $ 358,073 $ 984,072 $ 315,675 See accompanying notes to consolidated financial statements.
2
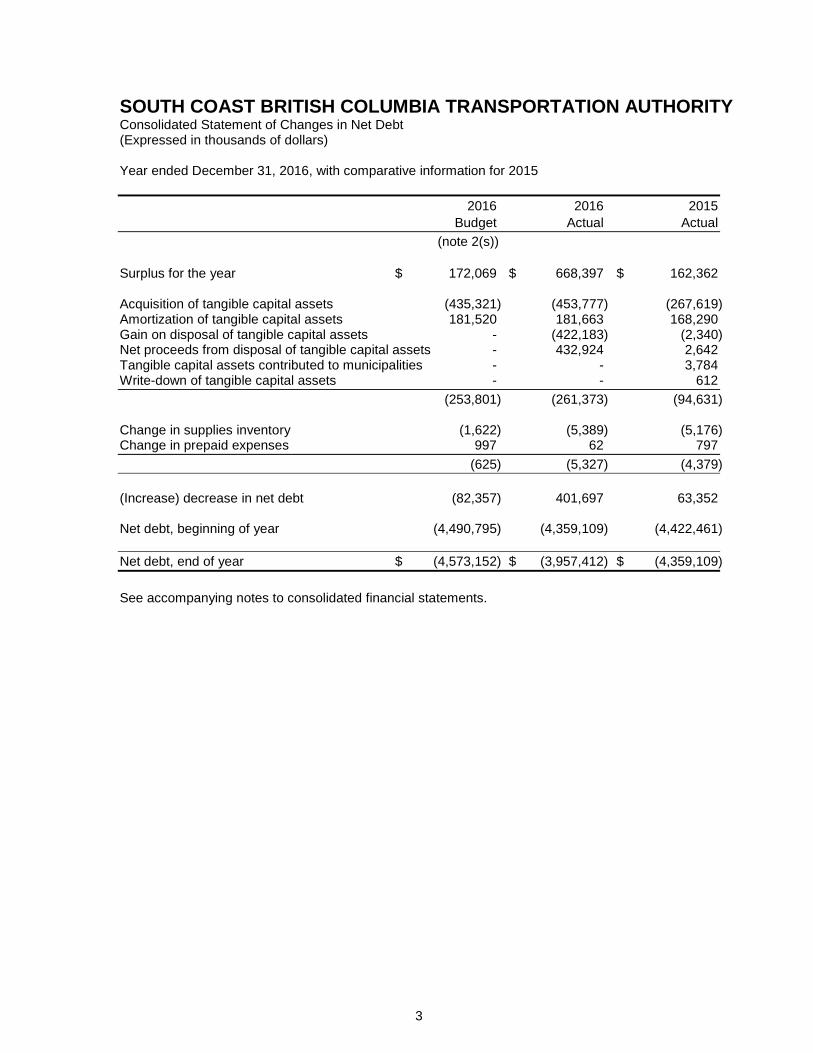
SOUTH COAST BRITISH COLUMBIA TRANSPORTATION AUTHORITY Consolidated Statement of Changes in Net Debt (Expressed in thousands of dollars) Year ended December 31, 2016, with comparative information for 2015 2016 2016 2015 Budget Actual Actual (note 2(s)) Surplus for the year $ 172,069 $ 668,397 $ 162,362 Acquisition of tangible capital assets (435,321) (453,777) (267,619) Amortization of tangible capital assets 181,520 181,663 168,290 Gain on disposal of tangible capital assets - (422,183) (2,340) Net proceeds from disposal of tangible capital assets - 432,924 2,642 Tangible capital assets contributed to municipalities - - 3,784 Write-down of tangible capital assets - - 612 (253,801) (261,373) (94,631) Change in supplies inventory (1,622) (5,389) (5,176) Change in prepaid expenses 997 62 797 (625) (5,327) (4,379) (Increase) decrease in net debt (82,357) 401,697 63,352 Net debt, beginning of year (4,490,795) (4,359,109) (4,422,461) Net debt, end of year $ (4,573,152) $ (3,957,412) $ (4,359,109) See accompanying notes to consolidated financial statements.
3
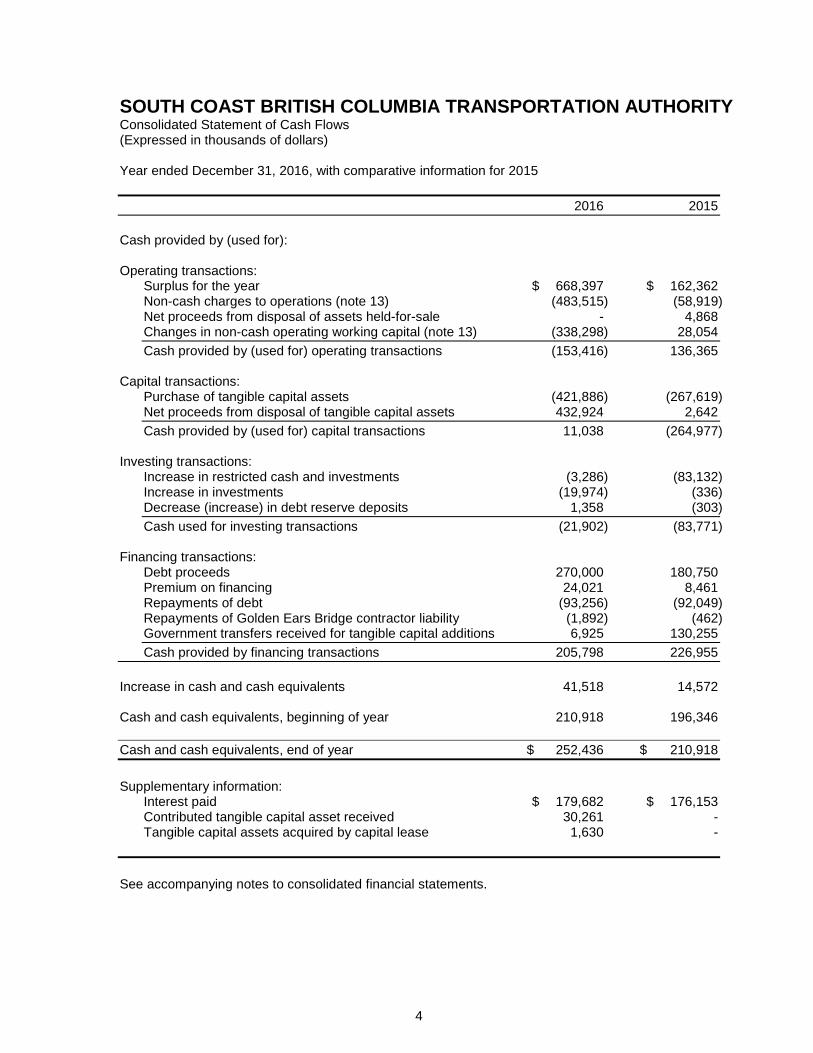
SOUTH COAST BRITISH COLUMBIA TRANSPORTATION AUTHORITY Consolidated Statement of Cash Flows (Expressed in thousands of dollars) Year ended December 31, 2016, with comparative information for 2015 2016 2015 Cash provided by (used for): Operating transactions:
Surplus for the year $ 668,397 $ 162,362 Non-cash charges to operations (note 13) (483,515) (58,919) Net proceeds from disposal of assets held-for-sale - 4,868 Changes in non-cash operating working capital (note 13) (338,298) 28,054 Cash provided by (used for) operating transactions (153,416) 136,365
Capital transactions:
Purchase of tangible capital assets (421,886) (267,619) Net proceeds from disposal of tangible capital assets 432,924 2,642 Cash provided by (used for) capital transactions 11,038 (264,977)
Investing transactions:
Increase in restricted cash and investments (3,286) (83,132) Increase in investments (19,974) (336) Decrease (increase) in debt reserve deposits 1,358 (303) Cash used for investing transactions (21,902) (83,771)
Financing transactions:
Debt proceeds 270,000 180,750 Premium on financing 24,021 8,461 Repayments of debt (93,256) (92,049) Repayments of Golden Ears Bridge contractor liability (1,892) (462) Government transfers received for tangible capital additions 6,925 130,255 Cash provided by financing transactions 205,798 226,955
Increase in cash and cash equivalents 41,518 14,572 Cash and cash equivalents, beginning of year 210,918 196,346 Cash and cash equivalents, end of year $ 252,436 $ 210,918 Supplementary information:
Interest paid $ 179,682 $ 176,153 Contributed tangible capital asset received 30,261 - Tangible capital assets acquired by capital lease 1,630 -
See accompanying notes to consolidated financial statements.
4
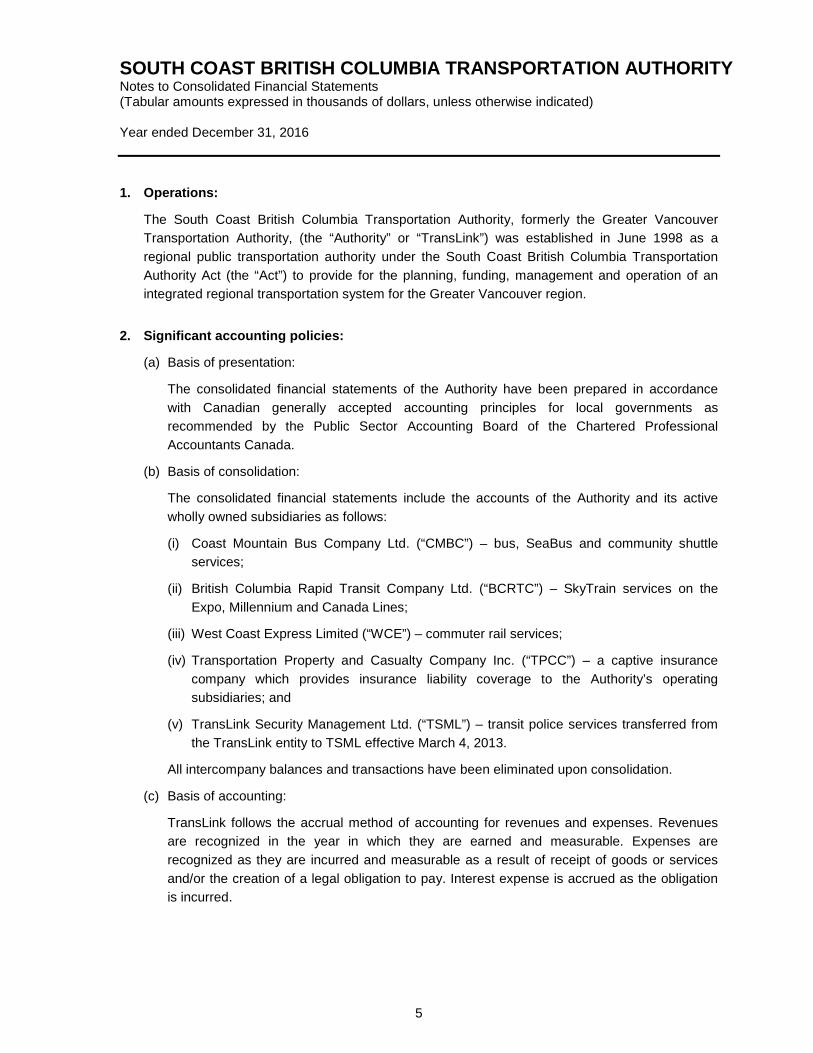
SOUTH COAST BRITISH COLUMBIA TRANSPORTATION AUTHORITY Notes to Consolidated Financial Statements (Tabular amounts expressed in thousands of dollars, unless otherwise indicated) Year ended December 31, 2016
1. Operations:
The South Coast British Columbia Transportation Authority, formerly the Greater Vancouver Transportation Authority, (the “Authority” or “TransLink”) was established in June 1998 as a regional public transportation authority under the South Coast British Columbia Transportation Authority Act (the “Act”) to provide for the planning, funding, management and operation of an integrated regional transportation system for the Greater Vancouver region.
2. Significant accounting policies:
(a) Basis of presentation:
The consolidated financial statements of the Authority have been prepared in accordance with Canadian generally accepted accounting principles for local governments as recommended by the Public Sector Accounting Board of the Chartered Professional Accountants Canada.
(b) Basis of consolidation:
The consolidated financial statements include the accounts of the Authority and its active wholly owned subsidiaries as follows:
(i) Coast Mountain Bus Company Ltd. (“CMBC”) – bus, SeaBus and community shuttle services;
(ii) British Columbia Rapid Transit Company Ltd. (“BCRTC”) – SkyTrain services on the Expo, Millennium and Canada Lines;
(iii) West Coast Express Limited (“WCE”) – commuter rail services;
(iv) Transportation Property and Casualty Company Inc. (“TPCC”) – a captive insurance company which provides insurance liability coverage to the Authority’s operating subsidiaries; and
(v) TransLink Security Management Ltd. (“TSML”) – transit police services transferred from the TransLink entity to TSML effective March 4, 2013.
All intercompany balances and transactions have been eliminated upon consolidation.
(c) Basis of accounting:
TransLink follows the accrual method of accounting for revenues and expenses. Revenues are recognized in the year in which they are earned and measurable. Expenses are recognized as they are incurred and measurable as a result of receipt of goods or services and/or the creation of a legal obligation to pay. Interest expense is accrued as the obligation is incurred.
5
SOUTH COAST BRITISH COLUMBIA TRANSPORTATION AUTHORITY Notes to Consolidated Financial Statements (Tabular amounts expressed in thousands of dollars, unless otherwise indicated) Year ended December 31, 2016
2. Significant accounting policies (continued):
(d) Cash and cash equivalents:
Cash and cash equivalents include highly liquid investments with a term to maturity of three months or less at the date of purchase.
(e) Financial instruments:
Financial instruments are classified into two categories: fair value or cost.
(i) Fair value:
Investments and derivatives that are quoted in an active market and loans receivable are reflected at fair value as at the reporting date. The Authority does not hold any investments or derivatives that are quoted in an active market. Unrealized gains and losses on financial assets are recognized in the Statement of Remeasurement Gains and Losses until such time that the financial asset is derecognized due to disposal or impairment. At the time of derecognition, the related realized gains and losses are recognized in the Statement of Operations and related balances are reversed from the Statement of Remeasurement Gains and Losses. As at December 31, 2016, the Authority does not have any unrealized gains or losses and a Statement of Remeasurement Gains and Losses has not been included in these financial statements.
(ii) Cost:
All other financial instruments are recorded at cost. Gains and losses on financial instruments recorded at cost are recognized in the Statement of Operations when the financial asset is recognized due to disposal or impairment. Sales and purchases of investments are recorded on the trade date. Transaction costs related to the acquisition of investments are included in the cost of the related investments.
Accounts receivable and accounts payable and accrued liabilities are measured at cost using the effective interest rate method. Any gains, losses or interest expense is recorded in the annual surplus depending on the nature of the financial liability that gave rise to the gain, loss or expense. Valuation allowances are made when collection is in doubt.
(f) Supplies inventory:
Supplies inventory is valued at the lower of average cost and net realizable value. Cost includes purchase price, import duties, other net taxes, and transport, handling and other costs directly attributable to acquisition. Net realizable value is the estimated current replacement cost.
6
SOUTH COAST BRITISH COLUMBIA TRANSPORTATION AUTHORITY Notes to Consolidated Financial Statements (Tabular amounts expressed in thousands of dollars, unless otherwise indicated) Year ended December 31, 2016
2. Significant accounting policies (continued):
(g) Tangible capital assets:
Tangible capital assets have been recorded as follows:
(i) Tangible capital assets are recorded at cost, including capitalized interest as described in note 2(h). Cost includes all amounts that are directly attributable to acquisition, construction, development or betterment of the asset, including the purchase price and other acquisition costs such as installation costs, design and engineering fees, legal fees, survey costs, site preparation costs, freight charges, transportation, insurance costs and duties.
(ii) As part of the establishment of the Authority, certain tangible capital assets contributed by the Province of British Columbia and BC Transit were recorded at the estimated fair value at the date of acquisition based on appraisals carried out.
(iii) Amortization is provided on the cost less estimated salvage value on a straight-line basis over a period not exceeding the estimated useful lives as follows:
Asset Years Land improvements 30 Buildings 30 Bridges, guideways, stations and tunnels 30 -100 Other supporting systems (tracks, rail, roads, electrical, drainage,
ventilation, tolling) 8 - 40 Vehicles and SeaBus 5 - 40 Equipment 5 - 40
(h) Capitalization of interest:
Interest costs directly attributable to construction projects and major capital acquisitions are capitalized from the commencement of the capital outlays until the assets are placed into service.
(i) Major Road Network (“MRN”) expenditures:
Part 2 of the Act provides that the Authority must establish a MRN, comprising an integrated system of highways throughout the transportation service region, and the Authority must contribute funds to the municipalities for the purpose of constructing and maintaining any part of the MRN within that municipality if certain conditions are met.
Funding related to constructing the MRN is expensed under the heading “capital infrastructure contributions” as the related assets are the property of the appropriate municipalities who assume all the rights and obligations.
Funding related to operating and maintaining the MRN are expensed under the heading “maintenance, materials and utilities”.
7
SOUTH COAST BRITISH COLUMBIA TRANSPORTATION AUTHORITY Notes to Consolidated Financial Statements (Tabular amounts expressed in thousands of dollars, unless otherwise indicated) Year ended December 31, 2016
2. Significant accounting policies (continued):
(i) Major Road network (“MRN”) expenditures (continued):
For the MRN and Bike (“MRNB”) programs, the amount of allocated funding contribution to each municipality for construction is determined by the proportion of a municipality’s regional population and employment growth, consistent with the Metro Vancouver Growth Strategy. For the Operations, Maintenance and Rehabilitation funding of the MRN, the amount of annual Operation and Maintenance (“O&M”) contribution and the annual Pavement Rehabilitation (“R”) contribution to each municipality are determined by the corresponding set funding rate per lane kilometer of the MRN.
(j) Pension plans and employee future benefits:
(i) Pension plan:
The Authority, its subsidiaries and employees make contributions to the Public Service Pension Plan (“PSPP”). These contributions to the PSPP are expensed as incurred.
(ii) Employee future benefits:
Post-retirement and post-employment benefits are available to the majority of the Authority’s employees. The cost of post-retirement benefits is actuarially determined, prorated on service and management’s best estimate of retirement ages and expected health care costs. The cost of post-employment benefits to disabled employees is actuarially determined based on future projected benefits of currently disabled employees. The obligations under these post-retirement and post-employment benefit plans are accrued as the employees render services necessary to earn the future benefits. The measurement date of the accrued benefit obligation coincides with the Authority’s fiscal year. The most recent actuarial valuation of the plans was December 31, 2016. The plans are unfunded and require no contributions from employees. Employer contributions are based upon expected annual benefit payments.
Actuarial gains (losses) on the accrued benefit obligation arise from differences between actual and expected experience and from changes in the actuarial assumptions used to determine the accrued benefit obligation. The net accumulated actuarial gains (losses) are amortized over the average remaining service period of active employees in the consolidated statement of operations. The amortization period of the active employees covered by the post-retirement plan is 12 years (2015 - 12 years) and post-employment plan is 6 years (2015 - 6 years).
(k) Deferred revenue:
The Authority defers the portion of the revenue collected from transit services relating to services not yet rendered. This revenue is recognized in the year in which related services are provided.
8
SOUTH COAST BRITISH COLUMBIA TRANSPORTATION AUTHORITY Notes to Consolidated Financial Statements (Tabular amounts expressed in thousands of dollars, unless otherwise indicated) Year ended December 31, 2016
2. Significant accounting policies (continued):
(l) Deferred concessionaire credit:
Deferred concessionaire credit represents the funding provided by the Canada Line Concessionaire towards the design and construction phases of the Canada Line in exchange for the right to operate the line over the 30 year operating term. This amount is amortized to income on a straight-line basis over the operating term of the concessionaire agreement which commenced in August 2009 and will expire in July 2040.
(m) Government transfers:
Restricted transfers from governments are deferred and recognized as revenue as the related stipulations in the agreement are met. Unrestricted transfers are recognized as revenue when received or receivable if the amount to be received can be reasonably estimated and collection is reasonably assured.
A significant portion of the Authority’s government funding for capital purposes is received from the federal government through the Gas Tax program and other similar programs. Under these agreements, the Authority is required to acquire specific transit assets with the funds. The Authority is also required under certain agreements to maintain the assets over a set holding period and repay funds if the associated assets are sold before the end of the holding period.
(n) Liability for contaminated sites:
Contaminated sites are a result of contamination being introduced into air, soil, water or sediment of a chemical, organic or radioactive material or live organism that exceeds an environmental standard. Liabilities are recorded net of any expected recoveries.
A liability for remediation of contaminated sites is recognized when all the following criteria are met:
(i) an environmental standard exists;
(ii) contamination exceeds the environmental standard;
(iii) the Authority is directly responsible or accepts responsibility;
(iv) it is expected that future economic benefits will be given up; and
(v) a reasonable estimate of the amount can be made.
The liability is recognized as management’s estimate of the cost of post-remediation including operation, maintenance and monitoring that are an integral part of the remediation strategy for a contaminated site.
(o) Income taxes:
The Authority is a tax exempt corporation, which is exempt from Canadian Federal and British Columbia Provincial income taxes as it is deemed to be a public body performing the function of government in Canada. The Authority’s subsidiaries file on the basis that they are exempt from Canadian Federal and British Columbia Provincial income taxes.
9
SOUTH COAST BRITISH COLUMBIA TRANSPORTATION AUTHORITY Notes to Consolidated Financial Statements (Tabular amounts expressed in thousands of dollars, unless otherwise indicated) Year ended December 31, 2016
2. Significant accounting policies (continued):
(p) Foreign currency translation:
Transactions of the Authority and its subsidiaries originating in foreign currencies are translated at the rates in effect at the time of the transaction. Monetary assets and liabilities denominated in foreign currencies are translated to Canadian dollars at exchange rates in effect at the statement of financial position dates. Foreign exchange gains and losses are included in income.
(q) Use of estimates:
The preparation of the consolidated financial statements requires management to make estimates and assumptions that affect the reported amounts of assets and liabilities and disclosure of contingent assets and liabilities at the date of the financial statements and the reported amounts of revenue and expenses during the reporting period. Significant areas requiring the use of estimates include determination of useful lives of tangible capital assets, percentage of completion of construction-in-progress, allowance for doubtful accounts receivable, obsolete inventory, determination of employee future benefits, liability for contaminated sites, self-insurance liability provisions and provisions for legal contingencies. Actual results could differ from those estimates.
(r) Segment disclosure:
A segment is defined as a distinguishable activity or group of activities of a government for which it is appropriate to separately report financial information to achieve the objectives of the standard. TransLink has provided definitions of segments used and presented financial information in the segmented format (note 16). The Business Technology, Human Resource, Payroll and Administrative Services costs are managed by the corporate segment and allocated among the operating segments, as appropriate. Interest has been allocated based on the allocated depreciation.
(s) Budget data:
The budget data presented in these consolidated financial statements were approved by the Board of Directors on December 9, 2015.
10
SOUTH COAST BRITISH COLUMBIA TRANSPORTATION AUTHORITY Notes to Consolidated Financial Statements (Tabular amounts expressed in thousands of dollars, unless otherwise indicated) Year ended December 31, 2016
3. Loan receivable:
In 2016, the Authority sold the Oakridge Transit Centre land for proceeds of $440,000,000. The Authority received $88,000,000 of the proceeds in 2016 with the remaining payment due in annual instalments as follows: Instalments
January 20, 2018 $ 22,000 January 20, 2019 66,000 January 20, 2020 66,000 January 20, 2021 66,000 January 20, 2022 66,000 January 20, 2023 66,000 Total $ 352,000 The instalments are secured by a mortgage on the land sold.
The loan receivable of $325,313,000 is the present value of the instalments due as at December 31, 2016 using a discount rate of 2.10%.
Interest accrues on each instalment if it is not paid one month prior to its due date. Interest accrues at 18.00% per annum, calculated and compounded half-yearly. Provided the purchaser is in compliance with the land sale agreement and related mortgage, the purchaser can prepay all or any part of the remaining instalments at any time without notice, bonus or penalty.
4. Restricted and unrestricted investments:
The Authority holds investments consisting of term deposits, money market instruments, and bonds held at various financial institutions.
All these investments are recorded at amortized cost. The bonds have an average initial term of 147 months (2015 – 104 months) and an average remaining term to maturity of 129 months (2015 - 89 months). All bonds held by the Authority, as at December 31, 2016 and 2015, were rated A or higher.
Details of effective interest rates and coupon rates of the government and corporate bonds are as follows: 2016 2015 Effective Coupon Effective Coupon rates rates rates rates Weighted average rate 2.59% 3.20% 2.22% 3.10% Interest rate range 1.09% - 4.51% 1.33 - 5.60% 0.95% - 4.51% 0.95% - 5.60%
11
SOUTH COAST BRITISH COLUMBIA TRANSPORTATION AUTHORITY Notes to Consolidated Financial Statements (Tabular amounts expressed in thousands of dollars, unless otherwise indicated) Year ended December 31, 2016
4. Restricted and unrestricted investments (continued):
(a) Restricted cash and investments: 2016 2015 Government transfers for capital project funding (i):
Cash and cash equivalents $ 52,354 $ 34,705 Investments:
Term deposits and money market instruments 72,013 150,386 Bonds (note 14(b)) 68,097 136,918
Total government transfers for capital project funding 192,464 322,009 Self-administered sinking funds:
Cash and cash equivalents 14 18 Bonds maturing beyond one year (note 14(b)) 162,380 117,743 Total self-administered sinking funds 162,394 117,761
Land reserve:
Cash and cash equivalents 128,016 38,609 TPCC (wholly-owned captive insurance subsidiary):
Bonds (note 14(b)) 21,421 22,630 Total restricted cash and investments $ 504,295 $ 501,009 (i) Government transfers for capital project funding consists of $190,464,000 (2015 -
$320,009,000) of unspent Gas Tax funds and $2,000,000 (2015 - $2,000,000) of other contributions.
(b) Unrestricted investments:
Unrestricted investments are comprised of term deposits and money market instruments in the amount of $80,917,000 (2015 - $60,943,000).
5. Debt reserve deposits and callable demand notes:
The Authority is required to pay the Municipal Finance Authority of British Columbia (“MFA”) debt reserve deposits into a debt reserve fund of 1.00% (2.00% prior to 2007) of the face value of each debenture borrowing from the MFA. These are interest bearing restricted funds administered by the MFA and are only refundable once the respective debt issue has been fully repaid.
If at any time the MFA does not receive sufficient funds to meet payments or sinking fund contributions due on the Authority’s debt obligations, the interest and principal payments or sinking fund contributions will be deducted from this debt reserve fund.
12
SOUTH COAST BRITISH COLUMBIA TRANSPORTATION AUTHORITY Notes to Consolidated Financial Statements (Tabular amounts expressed in thousands of dollars, unless otherwise indicated) Year ended December 31, 2016
5. Debt reserve deposits and callable demand notes (continued):
In addition to the debt reserve deposit, the Authority is required by the MFA to issue a non-interest bearing demand note for an amount equal to one-half the average annual installment of principal and interest relative to any debt borrowed less the debt reserve deposit. The demand notes payable to the MFA are callable only if, in the event of a default by the Authority or Metro Vancouver (the interposed significant lender over the Authority’s long-term debt), there are insufficient funds in the Authority’s debt reserve deposit held at the MFA to meet a required interest, principal payment or sinking fund contribution. As the Authority is in full compliance with its debt payments and no such call has been made by the MFA on these demand notes, their face value have not been recorded as a liability on the consolidated statement of financial position. At year-end, the maximum value of the demand notes totaled $42,299,000 (2015 - $45,786,000).
6. Debt: 2016 2015 Unsecured commercial paper, due next 12 months $ 239,603 $ 119,590 Unsecured sinking fund bonds held by the MFA, weighted average
coupon rate of 4.17% (effective rate 4.22%), maturing at various dates from 2017 to 2036, 10 to 30 year original term 1,417,315 1,495,075
Less: MFA administered debt sinking funds (694,896) (683,920) Unsecured serial debenture held by the MFA, coupon rate of 5.10%
interest payable semi-annually (effective rate 5.19%), maturing in 2025, principal repayment of approximately $2 million annually, 20 year original term 23,817 26,162
Unsecured bullet maturity bond series TL-1, interest rate 3.80%
(effective rate 3.88%), maturing 2020, original 10 year term 299,121 298,902 Unsecured bullet maturity bond series TL-2, interest rate 4.65%
(effective rate 4.70%), maturing 2041, original 30 year term 198,587 198,539 Unsecured bullet maturity bond series TL-3, interest rate 3.85%
(effective rate 3.82 %), maturing 2052, original 40 year term 251,502 251,502 Unsecured bullet maturity bond series TL-4, interest rate 4.45%
(effective rate 3.97%), (2015 - 4.27%) maturing 2044, original 30.5 year term 395,606 221,672
Unsecured bullet maturity bond series TL-5, interest rate 3.05%
(effective rate 3.06%), maturing 2025, original 10.5 year term 214,932 214,915 Capital lease, weighted average implicit rate of 4.00% (2015 - 2.73%),
maturing at various dates from 2017 to 2020 1,679 1,665 $ 2,347,266 $ 2,144,102
13
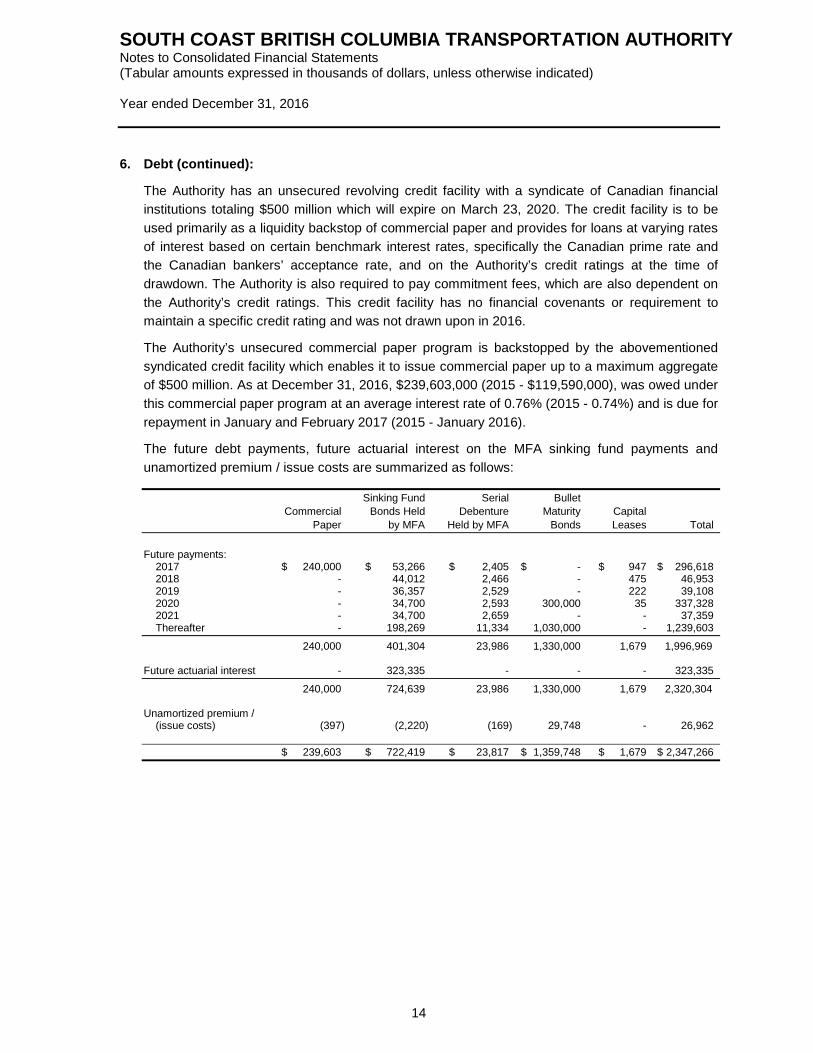
SOUTH COAST BRITISH COLUMBIA TRANSPORTATION AUTHORITY Notes to Consolidated Financial Statements (Tabular amounts expressed in thousands of dollars, unless otherwise indicated) Year ended December 31, 2016
6. Debt (continued):
The Authority has an unsecured revolving credit facility with a syndicate of Canadian financial institutions totaling $500 million which will expire on March 23, 2020. The credit facility is to be used primarily as a liquidity backstop of commercial paper and provides for loans at varying rates of interest based on certain benchmark interest rates, specifically the Canadian prime rate and the Canadian bankers’ acceptance rate, and on the Authority’s credit ratings at the time of drawdown. The Authority is also required to pay commitment fees, which are also dependent on the Authority’s credit ratings. This credit facility has no financial covenants or requirement to maintain a specific credit rating and was not drawn upon in 2016.
The Authority’s unsecured commercial paper program is backstopped by the abovementioned syndicated credit facility which enables it to issue commercial paper up to a maximum aggregate of $500 million. As at December 31, 2016, $239,603,000 (2015 - $119,590,000), was owed under this commercial paper program at an average interest rate of 0.76% (2015 - 0.74%) and is due for repayment in January and February 2017 (2015 - January 2016).
The future debt payments, future actuarial interest on the MFA sinking fund payments and unamortized premium / issue costs are summarized as follows: Sinking Fund Serial Bullet Commercial Bonds Held Debenture Maturity Capital Paper by MFA Held by MFA Bonds Leases Total Future payments:
2017 $ 240,000 $ 53,266 $ 2,405 $ - $ 947 $ 296,618 2018 - 44,012 2,466 - 475 46,953 2019 - 36,357 2,529 - 222 39,108 2020 - 34,700 2,593 300,000 35 337,328 2021 - 34,700 2,659 - - 37,359 Thereafter - 198,269 11,334 1,030,000 - 1,239,603
240,000 401,304 23,986 1,330,000 1,679 1,996,969 Future actuarial interest - 323,335 - - - 323,335
240,000 724,639 23,986 1,330,000 1,679 2,320,304 Unamortized premium /
(issue costs) (397) (2,220) (169) 29,748 - 26,962 $ 239,603 $ 722,419 $ 23,817 $ 1,359,748 $ 1,679 $ 2,347,266
14
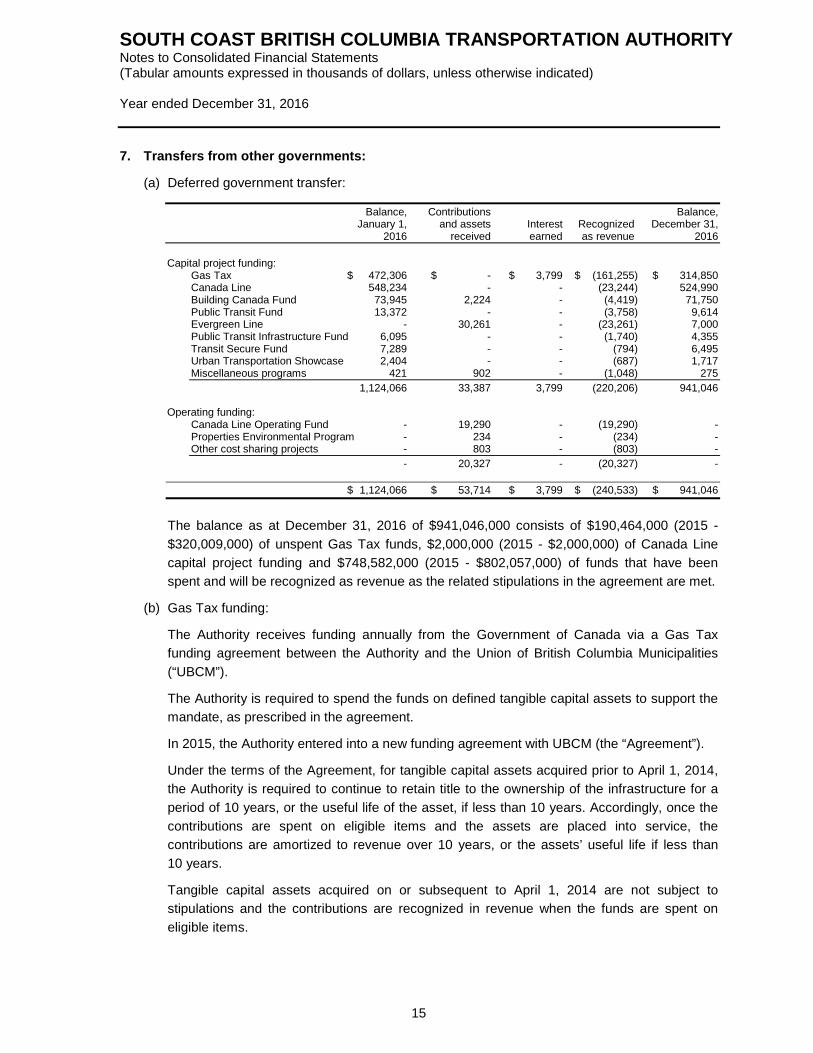
SOUTH COAST BRITISH COLUMBIA TRANSPORTATION AUTHORITY Notes to Consolidated Financial Statements (Tabular amounts expressed in thousands of dollars, unless otherwise indicated) Year ended December 31, 2016 7. Transfers from other governments:
(a) Deferred government transfer: Balance, Contributions Balance, January 1, and assets Interest Recognized December 31, 2016 received earned as revenue 2016 Capital project funding:
Gas Tax $ 472,306 $ - $ 3,799 $ (161,255) $ 314,850 Canada Line 548,234 - - (23,244) 524,990 Building Canada Fund 73,945 2,224 - (4,419) 71,750 Public Transit Fund 13,372 - - (3,758) 9,614 Evergreen Line - 30,261 - (23,261) 7,000 Public Transit Infrastructure Fund 6,095 - - (1,740) 4,355 Transit Secure Fund 7,289 - - (794) 6,495 Urban Transportation Showcase 2,404 - - (687) 1,717 Miscellaneous programs 421 902 - (1,048) 275 1,124,066 33,387 3,799 (220,206) 941,046
Operating funding:
Canada Line Operating Fund - 19,290 - (19,290) - Properties Environmental Program - 234 - (234) - Other cost sharing projects - 803 - (803) - - 20,327 - (20,327) -
$ 1,124,066 $ 53,714 $ 3,799 $ (240,533) $ 941,046
The balance as at December 31, 2016 of $941,046,000 consists of $190,464,000 (2015 - $320,009,000) of unspent Gas Tax funds, $2,000,000 (2015 - $2,000,000) of Canada Line capital project funding and $748,582,000 (2015 - $802,057,000) of funds that have been spent and will be recognized as revenue as the related stipulations in the agreement are met.
(b) Gas Tax funding:
The Authority receives funding annually from the Government of Canada via a Gas Tax funding agreement between the Authority and the Union of British Columbia Municipalities (“UBCM”).
The Authority is required to spend the funds on defined tangible capital assets to support the mandate, as prescribed in the agreement.
In 2015, the Authority entered into a new funding agreement with UBCM (the “Agreement”).
Under the terms of the Agreement, for tangible capital assets acquired prior to April 1, 2014, the Authority is required to continue to retain title to the ownership of the infrastructure for a period of 10 years, or the useful life of the asset, if less than 10 years. Accordingly, once the contributions are spent on eligible items and the assets are placed into service, the contributions are amortized to revenue over 10 years, or the assets’ useful life if less than 10 years.
Tangible capital assets acquired on or subsequent to April 1, 2014 are not subject to stipulations and the contributions are recognized in revenue when the funds are spent on eligible items.
15
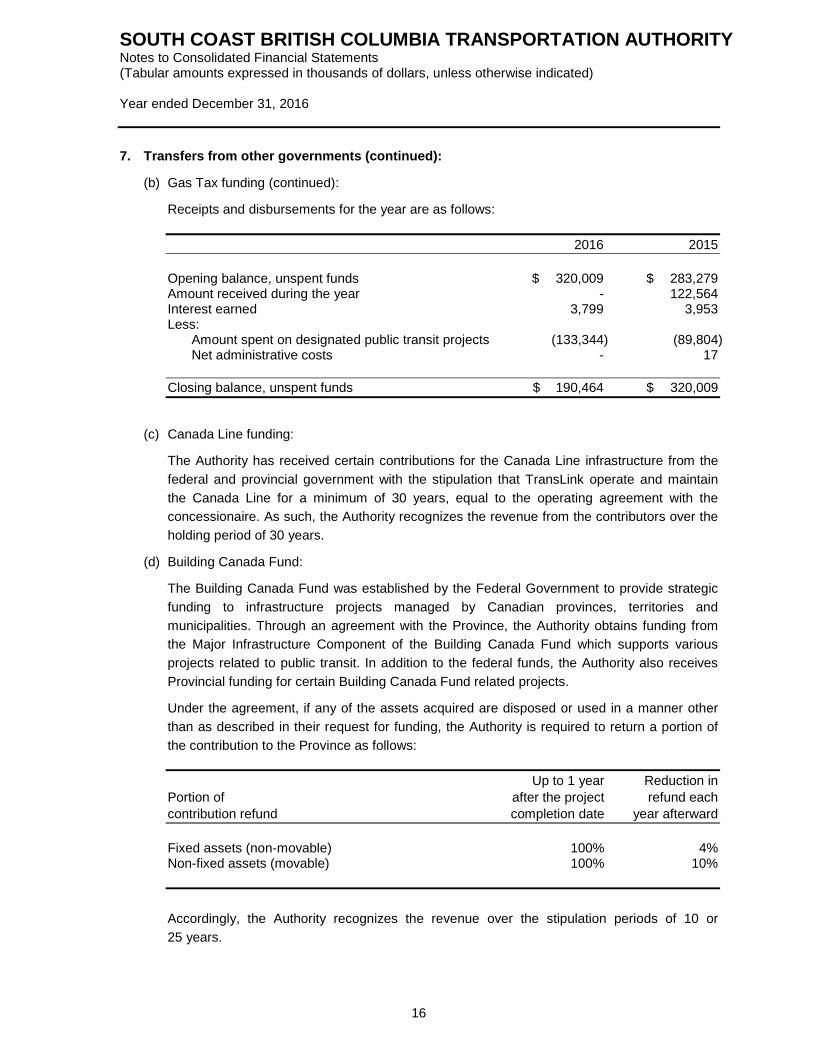
SOUTH COAST BRITISH COLUMBIA TRANSPORTATION AUTHORITY Notes to Consolidated Financial Statements (Tabular amounts expressed in thousands of dollars, unless otherwise indicated) Year ended December 31, 2016 7. Transfers from other governments (continued):
(b) Gas Tax funding (continued):
Receipts and disbursements for the year are as follows: 2016 2015 Opening balance, unspent funds $ 320,009 $ 283,279 Amount received during the year - 122,564 Interest earned 3,799 3,953 Less:
Amount spent on designated public transit projects (133,344) (89,804) Net administrative costs - 17
Closing balance, unspent funds $ 190,464 $ 320,009
(c) Canada Line funding:
The Authority has received certain contributions for the Canada Line infrastructure from the federal and provincial government with the stipulation that TransLink operate and maintain the Canada Line for a minimum of 30 years, equal to the operating agreement with the concessionaire. As such, the Authority recognizes the revenue from the contributors over the holding period of 30 years.
(d) Building Canada Fund:
The Building Canada Fund was established by the Federal Government to provide strategic funding to infrastructure projects managed by Canadian provinces, territories and municipalities. Through an agreement with the Province, the Authority obtains funding from the Major Infrastructure Component of the Building Canada Fund which supports various projects related to public transit. In addition to the federal funds, the Authority also receives Provincial funding for certain Building Canada Fund related projects.
Under the agreement, if any of the assets acquired are disposed or used in a manner other than as described in their request for funding, the Authority is required to return a portion of the contribution to the Province as follows: Up to 1 year Reduction in Portion of after the project refund each contribution refund completion date year afterward Fixed assets (non-movable) 100% 4% Non-fixed assets (movable) 100% 10% Accordingly, the Authority recognizes the revenue over the stipulation periods of 10 or 25 years.
16
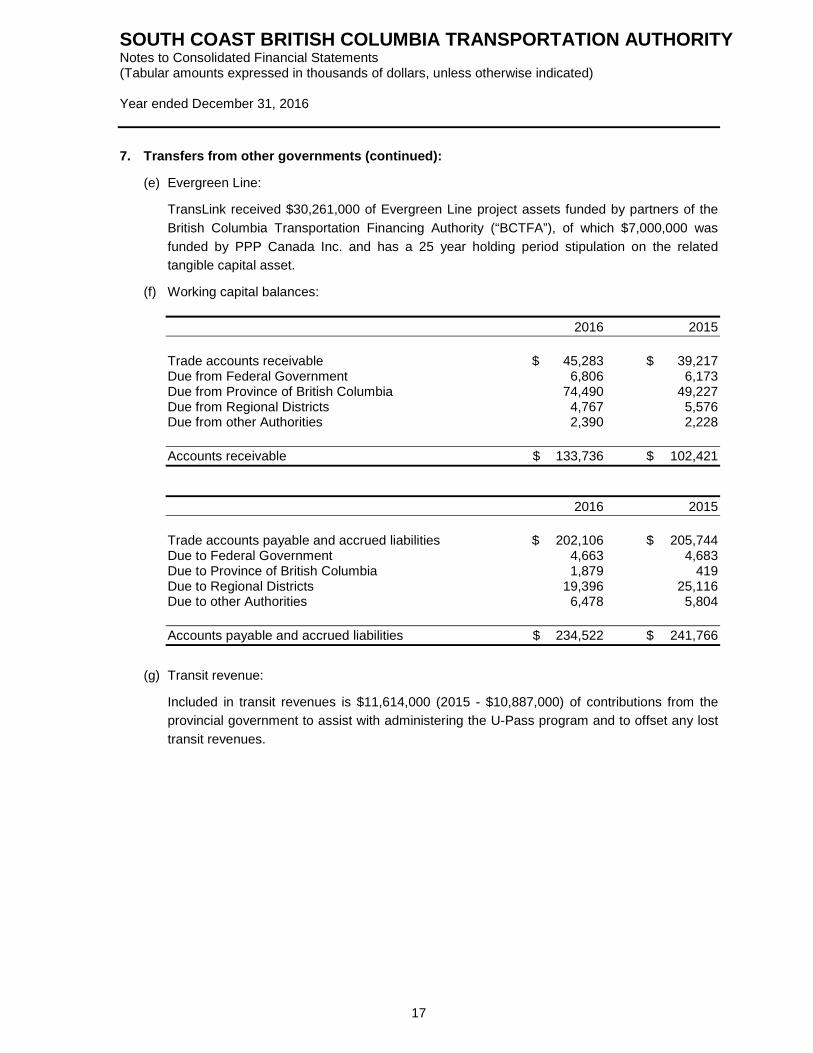
SOUTH COAST BRITISH COLUMBIA TRANSPORTATION AUTHORITY Notes to Consolidated Financial Statements (Tabular amounts expressed in thousands of dollars, unless otherwise indicated) Year ended December 31, 2016 7. Transfers from other governments (continued):
(e) Evergreen Line:
TransLink received $30,261,000 of Evergreen Line project assets funded by partners of the British Columbia Transportation Financing Authority (“BCTFA”), of which $7,000,000 was funded by PPP Canada Inc. and has a 25 year holding period stipulation on the related tangible capital asset.
(f) Working capital balances: 2016 2015 Trade accounts receivable $ 45,283 $ 39,217 Due from Federal Government 6,806 6,173 Due from Province of British Columbia 74,490 49,227 Due from Regional Districts 4,767 5,576 Due from other Authorities 2,390 2,228 Accounts receivable $ 133,736 $ 102,421
2016 2015 Trade accounts payable and accrued liabilities $ 202,106 $ 205,744 Due to Federal Government 4,663 4,683 Due to Province of British Columbia 1,879 419 Due to Regional Districts 19,396 25,116 Due to other Authorities 6,478 5,804 Accounts payable and accrued liabilities $ 234,522 $ 241,766
(g) Transit revenue:
Included in transit revenues is $11,614,000 (2015 - $10,887,000) of contributions from the provincial government to assist with administering the U-Pass program and to offset any lost transit revenues.
17
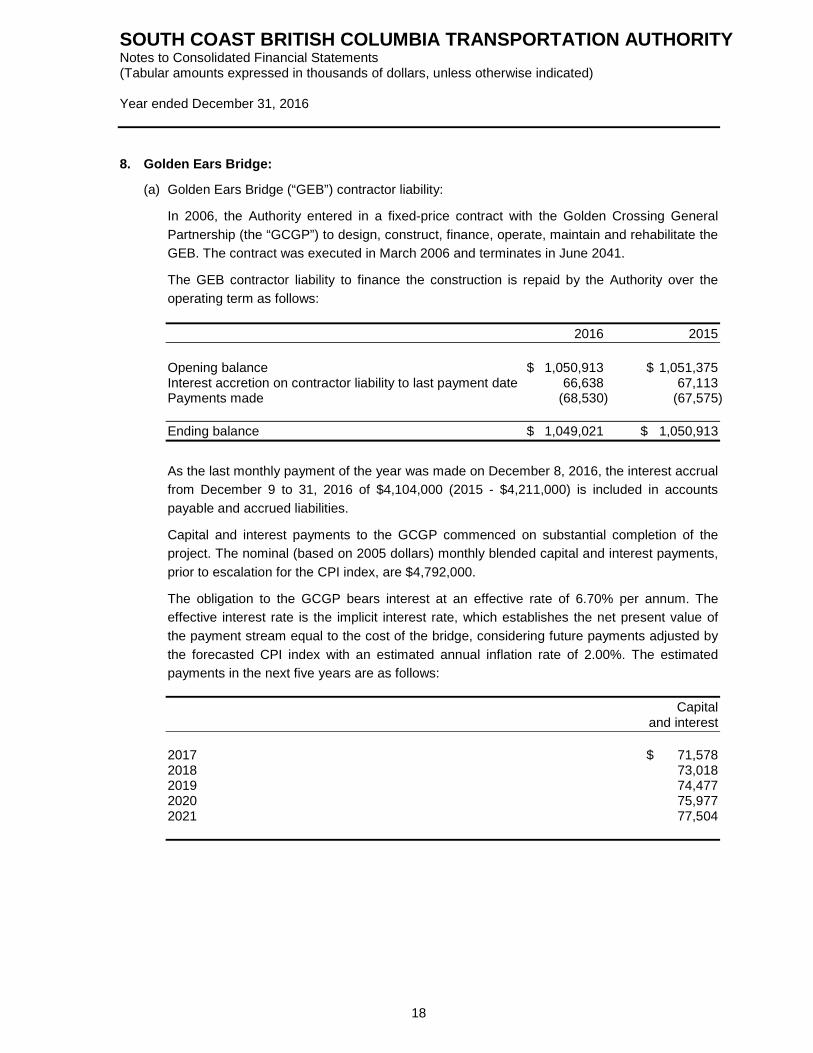
SOUTH COAST BRITISH COLUMBIA TRANSPORTATION AUTHORITY Notes to Consolidated Financial Statements (Tabular amounts expressed in thousands of dollars, unless otherwise indicated) Year ended December 31, 2016
8. Golden Ears Bridge:
(a) Golden Ears Bridge (“GEB”) contractor liability:
In 2006, the Authority entered in a fixed-price contract with the Golden Crossing General Partnership (the “GCGP”) to design, construct, finance, operate, maintain and rehabilitate the GEB. The contract was executed in March 2006 and terminates in June 2041.
The GEB contractor liability to finance the construction is repaid by the Authority over the operating term as follows: 2016 2015 Opening balance $ 1,050,913 $ 1,051,375 Interest accretion on contractor liability to last payment date 66,638 67,113 Payments made (68,530) (67,575) Ending balance $ 1,049,021 $ 1,050,913 As the last monthly payment of the year was made on December 8, 2016, the interest accrual from December 9 to 31, 2016 of $4,104,000 (2015 - $4,211,000) is included in accounts payable and accrued liabilities.
Capital and interest payments to the GCGP commenced on substantial completion of the project. The nominal (based on 2005 dollars) monthly blended capital and interest payments, prior to escalation for the CPI index, are $4,792,000.
The obligation to the GCGP bears interest at an effective rate of 6.70% per annum. The effective interest rate is the implicit interest rate, which establishes the net present value of the payment stream equal to the cost of the bridge, considering future payments adjusted by the forecasted CPI index with an estimated annual inflation rate of 2.00%. The estimated payments in the next five years are as follows: Capital and interest 2017 $ 71,578 2018 73,018 2019 74,477 2020 75,977 2021 77,504
18
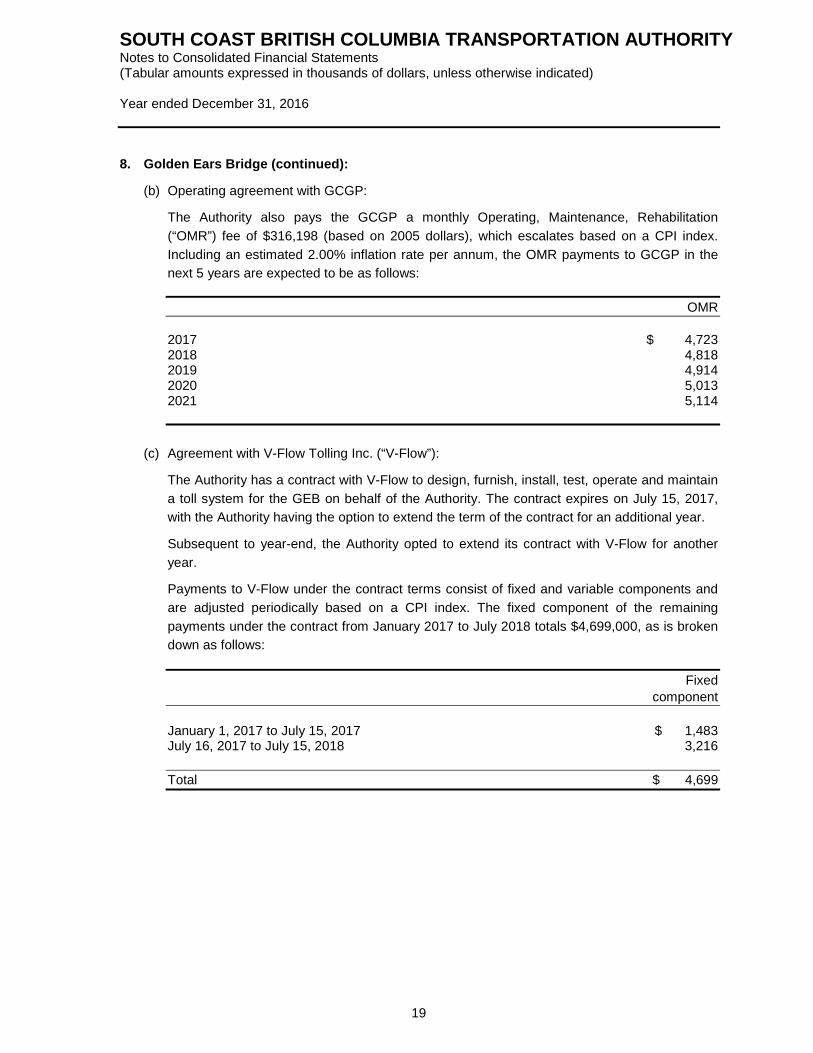
SOUTH COAST BRITISH COLUMBIA TRANSPORTATION AUTHORITY Notes to Consolidated Financial Statements (Tabular amounts expressed in thousands of dollars, unless otherwise indicated) Year ended December 31, 2016
8. Golden Ears Bridge (continued):
(b) Operating agreement with GCGP:
The Authority also pays the GCGP a monthly Operating, Maintenance, Rehabilitation (“OMR”) fee of $316,198 (based on 2005 dollars), which escalates based on a CPI index. Including an estimated 2.00% inflation rate per annum, the OMR payments to GCGP in the next 5 years are expected to be as follows: OMR 2017 $ 4,723 2018 4,818 2019 4,914 2020 5,013 2021 5,114
(c) Agreement with V-Flow Tolling Inc. (“V-Flow”):
The Authority has a contract with V-Flow to design, furnish, install, test, operate and maintain a toll system for the GEB on behalf of the Authority. The contract expires on July 15, 2017, with the Authority having the option to extend the term of the contract for an additional year.
Subsequent to year-end, the Authority opted to extend its contract with V-Flow for another year.
Payments to V-Flow under the contract terms consist of fixed and variable components and are adjusted periodically based on a CPI index. The fixed component of the remaining payments under the contract from January 2017 to July 2018 totals $4,699,000, as is broken down as follows: Fixed component January 1, 2017 to July 15, 2017 $ 1,483 July 16, 2017 to July 15, 2018 3,216 Total $ 4,699
19
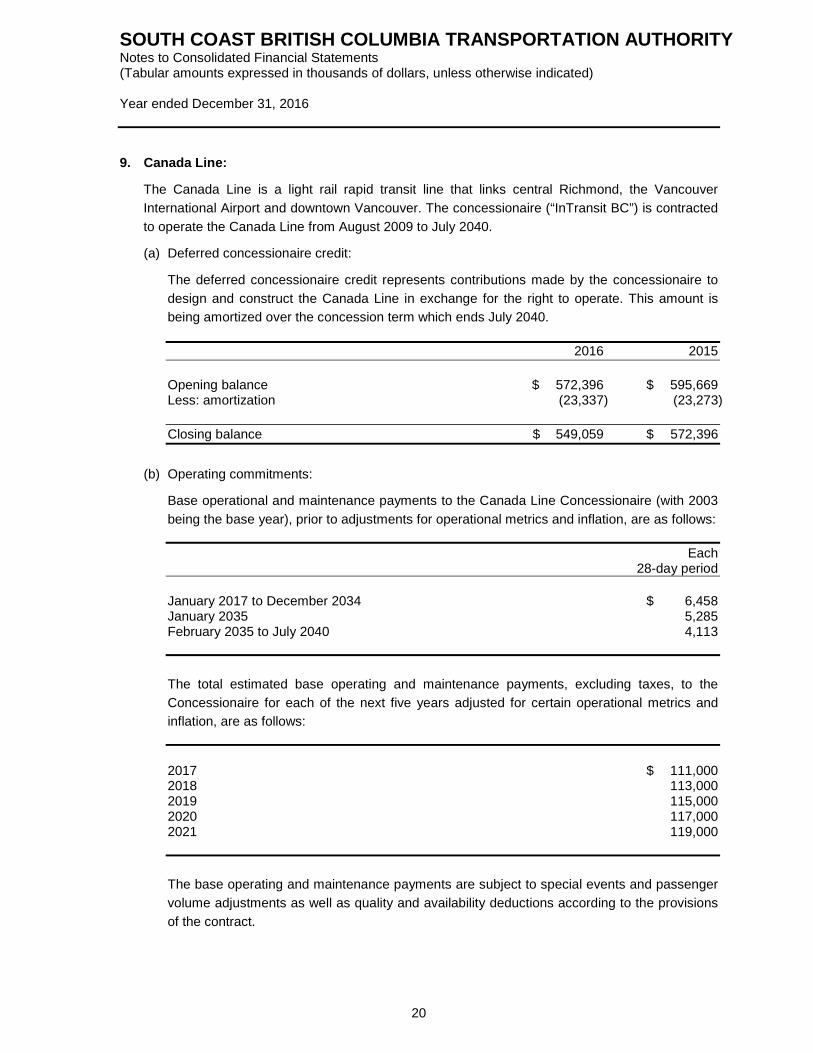
SOUTH COAST BRITISH COLUMBIA TRANSPORTATION AUTHORITY Notes to Consolidated Financial Statements (Tabular amounts expressed in thousands of dollars, unless otherwise indicated) Year ended December 31, 2016
9. Canada Line:
The Canada Line is a light rail rapid transit line that links central Richmond, the Vancouver International Airport and downtown Vancouver. The concessionaire (“InTransit BC”) is contracted to operate the Canada Line from August 2009 to July 2040.
(a) Deferred concessionaire credit:
The deferred concessionaire credit represents contributions made by the concessionaire to design and construct the Canada Line in exchange for the right to operate. This amount is being amortized over the concession term which ends July 2040. 2016 2015 Opening balance $ 572,396 $ 595,669 Less: amortization (23,337) (23,273) Closing balance $ 549,059 $ 572,396
(b) Operating commitments:
Base operational and maintenance payments to the Canada Line Concessionaire (with 2003 being the base year), prior to adjustments for operational metrics and inflation, are as follows: Each 28-day period January 2017 to December 2034 $ 6,458 January 2035 5,285 February 2035 to July 2040 4,113 The total estimated base operating and maintenance payments, excluding taxes, to the Concessionaire for each of the next five years adjusted for certain operational metrics and inflation, are as follows: 2017 $ 111,000 2018 113,000 2019 115,000 2020 117,000 2021 119,000 The base operating and maintenance payments are subject to special events and passenger volume adjustments as well as quality and availability deductions according to the provisions of the contract.
20
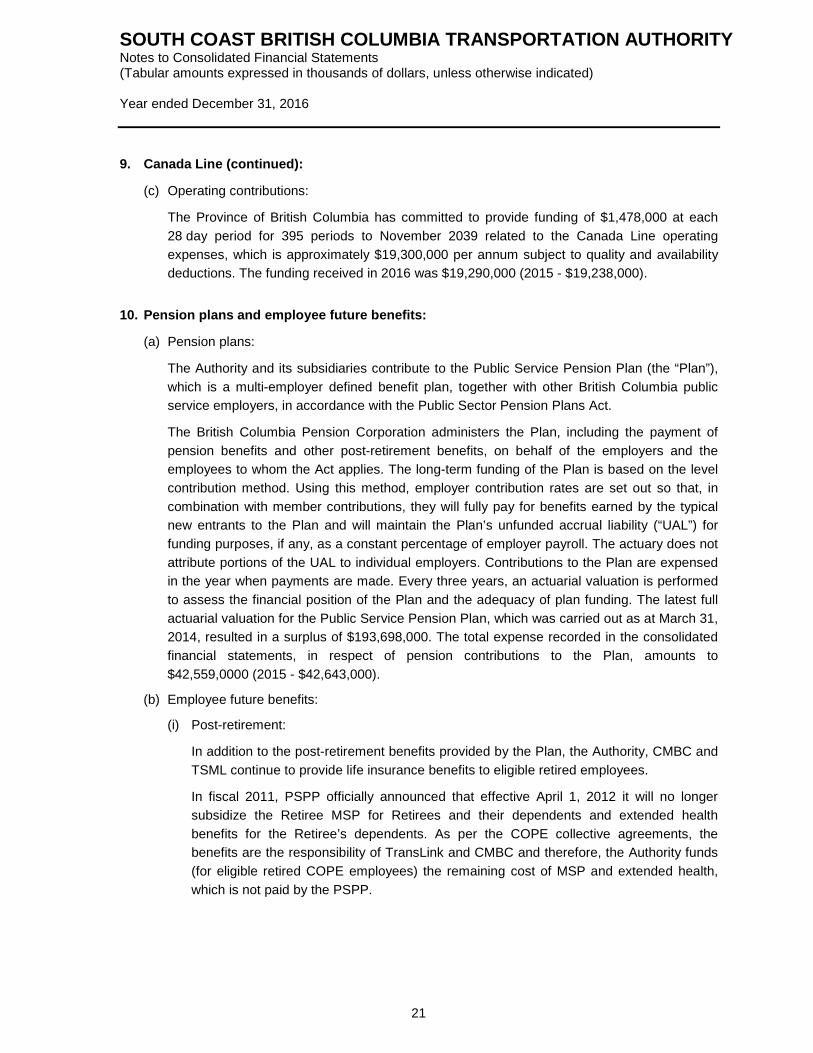
SOUTH COAST BRITISH COLUMBIA TRANSPORTATION AUTHORITY Notes to Consolidated Financial Statements (Tabular amounts expressed in thousands of dollars, unless otherwise indicated) Year ended December 31, 2016
9. Canada Line (continued):
(c) Operating contributions:
The Province of British Columbia has committed to provide funding of $1,478,000 at each 28 day period for 395 periods to November 2039 related to the Canada Line operating expenses, which is approximately $19,300,000 per annum subject to quality and availability deductions. The funding received in 2016 was $19,290,000 (2015 - $19,238,000).
10. Pension plans and employee future benefits:
(a) Pension plans:
The Authority and its subsidiaries contribute to the Public Service Pension Plan (the “Plan”), which is a multi-employer defined benefit plan, together with other British Columbia public service employers, in accordance with the Public Sector Pension Plans Act.
The British Columbia Pension Corporation administers the Plan, including the payment of pension benefits and other post-retirement benefits, on behalf of the employers and the employees to whom the Act applies. The long-term funding of the Plan is based on the level contribution method. Using this method, employer contribution rates are set out so that, in combination with member contributions, they will fully pay for benefits earned by the typical new entrants to the Plan and will maintain the Plan’s unfunded accrual liability (“UAL”) for funding purposes, if any, as a constant percentage of employer payroll. The actuary does not attribute portions of the UAL to individual employers. Contributions to the Plan are expensed in the year when payments are made. Every three years, an actuarial valuation is performed to assess the financial position of the Plan and the adequacy of plan funding. The latest full actuarial valuation for the Public Service Pension Plan, which was carried out as at March 31, 2014, resulted in a surplus of $193,698,000. The total expense recorded in the consolidated financial statements, in respect of pension contributions to the Plan, amounts to $42,559,0000 (2015 - $42,643,000).
(b) Employee future benefits:
(i) Post-retirement:
In addition to the post-retirement benefits provided by the Plan, the Authority, CMBC and TSML continue to provide life insurance benefits to eligible retired employees.
In fiscal 2011, PSPP officially announced that effective April 1, 2012 it will no longer subsidize the Retiree MSP for Retirees and their dependents and extended health benefits for the Retiree’s dependents. As per the COPE collective agreements, the benefits are the responsibility of TransLink and CMBC and therefore, the Authority funds (for eligible retired COPE employees) the remaining cost of MSP and extended health, which is not paid by the PSPP.
21
SOUTH COAST BRITISH COLUMBIA TRANSPORTATION AUTHORITY Notes to Consolidated Financial Statements (Tabular amounts expressed in thousands of dollars, unless otherwise indicated) Year ended December 31, 2016
10. Pension plans and employee future benefits (continued):
(b) Employee future benefits (continued):
(ii) Post-retirement (continued):
In the collective agreement between TSML and the Transit Police Professional Association (“TPPA”) union ratified on November 27, 2014, the parties eliminated the MSP and extended health retiree benefits for new employees. Employees with one complete year of service or more as of November 27, 2014 were eligible for retirement benefits as follows:
• employees with at least 10 consecutive years of service at TSML and eligible to retire on pension with TSML as of December 31, 2018 who elected by May 26, 2015 to retire on or before December 31, 2018.
• all other eligible employees were paid a lump-sum of $750 per year of service calculated as of November 27, 2014.
BCRTC also sponsors a post-retirement plan which provides MSP coverage, extended health and dental benefits to eligible retired employees.
The total expense recorded in the consolidated financial statements, in respect of obligations under these plans, amounts to $11,140,000 (2015 - $10,534,000).
(iii) Post-employment:
The Authority, CMBC and TSML provide MSP, extended health, dental and life insurance benefits to employees on approved long-term disability leave (post-employment benefits).
BCRTC provides MSP, extended health, dental, life insurance and pension benefits to employees on approved long-term disability leave.
Effective December 24, 2012, WCE employees on approved long-term disability leave receive MSP, extended health, dental and life insurance benefits.
The total expense recorded in the consolidated financial statements for the year, in respect of obligations under these plans, amounts to $2,893,000 (2015 - $3,730,000).
22
SOUTH COAST BRITISH COLUMBIA TRANSPORTATION AUTHORITY Notes to Consolidated Financial Statements (Tabular amounts expressed in thousands of dollars, unless otherwise indicated) Year ended December 31, 2016
10. Pension plans and employee future benefits (continued):
(b) Employee future benefits (continued):
(iv) Summary of the Authority’s post-retirement and post-employment plans is as follows: Post-retirement Post-employment Total Total benefits benefits 2016 2015 Accrued benefit obligation $ 102,583 $ 19,178 $ 121,761 $ 115,908 Unamortized net
actuarial (loss) gain (13,427) 11,813 (1,614) (5,885) Accrued benefit liability $ 89,156 $ 30,991 $ 120,147 $ 110,023
The accrued benefit liabilities are not funded.
(v) The expense for the year is comprised of the following components: Post- Post- retirement employment Total Total benefits benefits 2016 2015 Current period benefit cost $ 5,660 $ 5,027 $ 10,687 $ 10,741 Interest cost 3,570 671 4,241 3,911 Amortization of actuarial
(gains) and losses 1,910 (2,805) (895) (388) Net expense 11,140 2,893 14,033 14,264 Actuarially determined payments (1,225) (2,684) (3,909) (4,116) Change in accrued
benefit liability $ 9,915 $ 209 $ 10,124 $ 10,148
(vi) The significant assumptions used are as follows: 2016 2015 Discount rates 2.80% - 3.60% 2.90% - 3.60% Expected health care cost trend rates 4.40% - 7.20% 4.40% - 6.90%
23
SOUTH COAST BRITISH COLUMBIA TRANSPORTATION AUTHORITY Notes to Consolidated Financial Statements (Tabular amounts expressed in thousands of dollars, unless otherwise indicated) Year ended December 31, 2016
11. Tangible capital assets: Balance, Additions, Balance, January 1, net of December 31, Cost 2016 transfers Disposals 2016
Land $ 316,556 $ 48,237 $ (9,475) $ 355,318 Land improvements 41,648 - (1,251) 40,397 Buildings 234,367 76,735 (5,576) 305,526 Bridges, guideways, stations and tunnels 2,178,268 193,143 - 2,371,411 Other supporting systems 848,921 192,138 - 1,041,059 Vehicles and SeaBus 1,469,296 181,995 (12,421) 1,638,870 Equipment 643,655 35,118 (5,794) 672,979 Tangible capital projects in progress 428,105 (273,589) - 154,516
$ 6,160,816 $ 453,777 $ (34,517) $ 6,580,076 Balance, Balance, Accumulated January 1, December 31, amortization 2016 Additions Disposals 2016
Land $ - $ - $ - $ - Land improvements (19,460) (1,298) 1,167 (19,591) Buildings (103,084) (8,370) 4,703 (106,751) Bridges, guideways, stations and tunnels (143,150) (22,605) - (165,755) Other supporting systems (185,461) (32,577) - (218,038) Vehicles and SeaBus (762,257) (76,389) 12,421 (826,225) Equipment (340,781) (40,424) 5,485 (375,720)
$ (1,554,193) $ (181,663) $ 23,776 $ (1,712,080) Balance, Balance, January 1, December 31, Net book value 2016 2016
Land $ 316,556 $ 355,318 Land improvements 22,188 20,806 Buildings 131,283 198,775 Bridges, guideways, stations and tunnels 2,035,118 2,205,656 Other supporting systems 663,460 823,021 Vehicles and SeaBus 707,039 812,645 Equipment 302,874 297,259 Tangible capital projects in progress 428,105 154,516
$ 4,606,623 $ 4,867,996
Included in tangible capital assets is capital leased equipment with a net book value of $2,700,000 (2015 - $3,300,000).
Interest capitalized during the year ended December 31, 2016 amounted to $7,900,000 (2015 - $10,800,000).
24
SOUTH COAST BRITISH COLUMBIA TRANSPORTATION AUTHORITY Notes to Consolidated Financial Statements (Tabular amounts expressed in thousands of dollars, unless otherwise indicated) Year ended December 31, 2016
11. Tangible capital assets (continued):
As at December 31, 2016, the net book value of Expo and Millennium Line guideways or system improvements totaled $327,000,000 (2015 - $320,000,000) of which $224,000,000 (2015 -$236,000,000) relates to improvements on the assets that are leased/licensed from the Province. The guideways are leased/licensed from the Province for nominal proceeds and the Authority is responsible for operations and maintenance. The Expo and Millennium line leases expire in 2018 and 2017 respectively. Both leases have available renewal options and the agreements provide the Authority with reimbursement of the unamortized cost of capital improvements to the assets that are leased/licensed from the Province should the leases not be renewed. As the Authority expects to either renew the leases or be reimbursed for any unamortized costs, the improvements are included in the equipment category and are being amortized over their expected useful lives and not the term of the lease.
BCTFA leases to TransLink all of its interests (owned and otherwise) with respect to the West Coast Express properties and infrastructure. As at December 31, 2016, the net book value of West Coast Express improvements totaled $4,000,000 (2015 - $4,300,000).
The Evergreen Line (an extension of the Millennium Line) links neighborhoods in Burnaby, Port Moody and Coquitlam and is operated by TransLink as part of the regional transportation network. The Evergreen Line is funded by the Government of Canada, BCTFA, TransLink and other partners. On October 31, 2016, the Evergreen Line was substantially completed and accordingly, a portion of the Evergreen Line infrastructure (“TransLink Evergreen Line Infrastructure”) was transferred from BCTFA to TransLink including stations, guideway and the related systems east of Inlet Centre station (excluding Inlet Centre station) and the vehicle storage facility.
As BCTFA holds the underlying property rights on which the TransLink Evergreen Line Infrastructure is located, BCTFA and TransLink have agreed to enter into an agreement whereby TransLink may exercise and obtain the benefit of BCTFA’s interests to such property rights for a 100 year term on certain terms and conditions, including that if the agreement expires or terminates then BCTFA will reimburse TransLink for the unamortized portion of the initial cost of the TransLink Evergreen Line Infrastructure.
25
SOUTH COAST BRITISH COLUMBIA TRANSPORTATION AUTHORITY Notes to Consolidated Financial Statements (Tabular amounts expressed in thousands of dollars, unless otherwise indicated) Year ended December 31, 2016 12. Commitments and contingencies:
(a) Operating leases:
The Authority is committed to annual lease payments in respect of office premises, in the following amounts: 2017 $ 16,409 2018 16,576 2019 14,266 2020 12,158 2021 11,831 $ 71,240 Included in the payment schedule above are certain commitments that extend beyond 2021. Significant commitments beyond 2021 are as follows:
(i) The Authority has a premise lease with the Brewery District Investments Ltd. for the head office of TransLink and TSML which ends in 2033. The monthly commitment for basic rent and operating costs subsequent to year 2021 ranges from $739,000 to $792,000.
(b) WCE - lease and operating commitments:
In connection with operating the Commuter Rail System, the operating commitment for WCE include train operations, office lease, rolling stock maintenance, ticket vending and parking management and miscellaneous services.
The following summarizes the WCE operating commitments: 2017 $ 14,965 2018 15,129 2019 12,529 2020 11,451 2021 6,013 $ 60,087 Subsequent to 2021, monthly operating commitments for WCE are $500,000 to $507,000 for 2022 to 2025.
26
SOUTH COAST BRITISH COLUMBIA TRANSPORTATION AUTHORITY Notes to Consolidated Financial Statements (Tabular amounts expressed in thousands of dollars, unless otherwise indicated) Year ended December 31, 2016 12. Commitments and contingencies (continued):
(b) Operating commitment with Cubic Transportation System Inc.:
The Authority has a contract with Cubic Transportation Systems Inc. (“Cubic”) to operate its transit fare system. The contract expires in January 2026 with the Authority having the option to extend the term of the contract for an additional 5 years.
Base payments to Cubic under the contract terms for operations and maintenance are adjusted periodically based on a CPI index.
The base payments prior to adjustments for operational metrics based on 2011 dollars are as follows: Fixed component 2017 $ 11,037 2018 11,161 2019 11,386 2020 11,716 2021 13,456 $ 58,756 Subsequent to 2021, the fixed monthly base payments range from $969,000 to $1,038,000 for 2022 to 2025.
(c) Diesel fuel purchase:
The Authority has entered into multiple fixed price future agreements for diesel purchase volumes up to September 2017. The approximate total payment relating to the fixed price future agreements for the contracted purchase volumes is $11,900,000 (2015 - $9,750,000).
(d) Natural gas supply contract:
The Authority has entered into a fixed price natural gas purchase agreement up to April 2017. The approximate total payment relating to the fixed price agreement for the contracted purchase volumes is $264,000 (2015 - nil).
(e) Major Road Network (“MRN”) Capital Funding:
The Authority has signed several funding agreements with municipalities on major MRN projects. At December 31, 2016, the net amount of MRN capital infrastructure contributions committed and not paid is $3,090,000 (2015 - $6,300,000). This amount will be paid to the municipalities upon completion of their projects.
27
SOUTH COAST BRITISH COLUMBIA TRANSPORTATION AUTHORITY Notes to Consolidated Financial Statements (Tabular amounts expressed in thousands of dollars, unless otherwise indicated) Year ended December 31, 2016 12. Commitments and contingencies (continued):
(f) Lawsuits and claims:
As at December 31, 2016, a number of lawsuits and claims, arising in the ordinary course of business, have been initiated against the Authority. Management is of the opinion that sufficient provisions net of any recoveries have been made in the financial statements for any lawsuits and claims made against the Authority, except as noted below.
A number of lawsuits commenced against TransLink and/or its subsidiary, CLCO, in relation to the Canada Line project remain outstanding. The Authority does not believe that reasonable estimates of any potential losses can be estimated at this time and therefore, no provisions have been made in the consolidated financial statements for the following:
• A class action lawsuit filed by Cambie area merchants, where no specific amount has been claimed at this time. The trial of the first phase of this class action concluded April 2, 2015. Reasons for Judgment were delivered November 6, 2015. The main claims of the merchants for damages for the tort of nuisance were dismissed. The Court’s decision allows for a certain claim of lesser value, injurious affection to property interests, to be advanced. The number of claims that may be advanced in the future is approximately 100; the amount of these claims cannot be estimated at this time.
• A lawsuit filed by a number of Cambie area merchants, where no specific amount has been claimed at this time.
• Two additional lawsuits each filed by individual Cambie area merchants, where no specific amount has been claimed at this time.
Once a reasonable estimate of the potential liability, if any, is determined, a provision will be recognized.
(g) Other capital and inventory commitments:
At December 31, 2016, $119,988,000 (2015 - $305,700,000) has been contractually committed for other capital projects and inventory.
(h) Letters of credit:
As at December 31, 2016, the Authority has issued letters of credit to the City of Richmond totaling $1,023,000 (2015 - $1,644,000) which expire in 2017.
28
SOUTH COAST BRITISH COLUMBIA TRANSPORTATION AUTHORITY Notes to Consolidated Financial Statements (Tabular amounts expressed in thousands of dollars, unless otherwise indicated) Year ended December 31, 2016
13. Statement of cash flows: 2016 2015 Non-cash charges to operations:
Amortization of tangible capital assets $ 181,663 $ 168,290 Amortization of bond discount 576 1,380 Amortization of debt issue cost 193 204 Amortization of deferred concessionaire credit (23,337) (23,273) Amortization of deferred government transfers (196,945) (207,354) Amortization of deferred lease inducements (221) (222) Government transfers revenue - asset received (23,261) - Tangible capital assets contributed to municipalities - 3,784 Write-down of tangible capital assets - 612 Gain on disposal of tangible capital assets (422,183) (2,340)
$ (483,515) $ (58,919) Changes in non-cash operating working capital:
(Increase) decrease in accounts receivable $ (31,315) $ 223 Increase in loan receivable (325,313) - Increase in supplies inventory (5,389) (5,176) Decrease in prepaid expenses 62 797 (Decrease) increase in accounts payable and accrued liabilities (7,244) 9,288 Increase in deferred revenue and deposits 20,777 12,774 Employee future benefit payable 10,124 10,148
$ (338,298) $ 28,054
14. Financial instruments:
(a) Credit, interest and foreign exchange risk:
Unless otherwise noted, it is management’s opinion that the Authority is not exposed to any significant credit or interest rate risk as a result of these financial instruments. Interest rate risk related to the Authority’s debt will be subject to the market interest rates at the date of refinancing, but this risk is mitigated by spreading maturities of borrowings over multiple years and also regularly making contributions to sinking funds in order to repay all long-term bullet debt over a pre-determined amortization period. The Authority’s operations are all based in Canada and exposure to foreign exchange fluctuations is not significant.
(b) Fair values:
The fair values of certain debt and assets are represented in the table below. Management considers term deposits and money market instruments carrying amounts to approximate fair values. For all other classes of financial instruments presented in these consolidated financial statements, management considers the carrying amounts approximate the fair values.
29
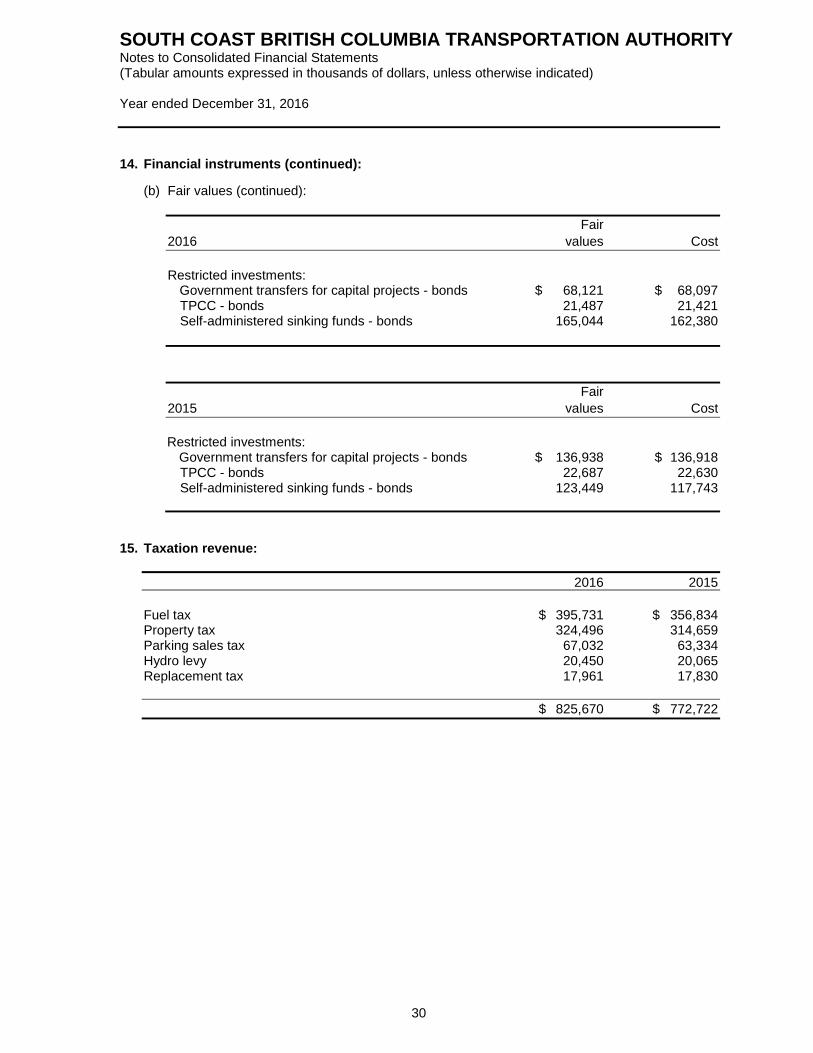
SOUTH COAST BRITISH COLUMBIA TRANSPORTATION AUTHORITY Notes to Consolidated Financial Statements (Tabular amounts expressed in thousands of dollars, unless otherwise indicated) Year ended December 31, 2016
14. Financial instruments (continued):
(b) Fair values (continued): Fair 2016 values Cost Restricted investments:
Government transfers for capital projects - bonds $ 68,121 $ 68,097 TPCC - bonds 21,487 21,421 Self-administered sinking funds - bonds 165,044 162,380
Fair 2015 values Cost Restricted investments:
Government transfers for capital projects - bonds $ 136,938 $ 136,918 TPCC - bonds 22,687 22,630 Self-administered sinking funds - bonds 123,449 117,743
15. Taxation revenue: 2016 2015 Fuel tax $ 395,731 $ 356,834 Property tax 324,496 314,659 Parking sales tax 67,032 63,334 Hydro levy 20,450 20,065 Replacement tax 17,961 17,830 $ 825,670 $ 772,722
30
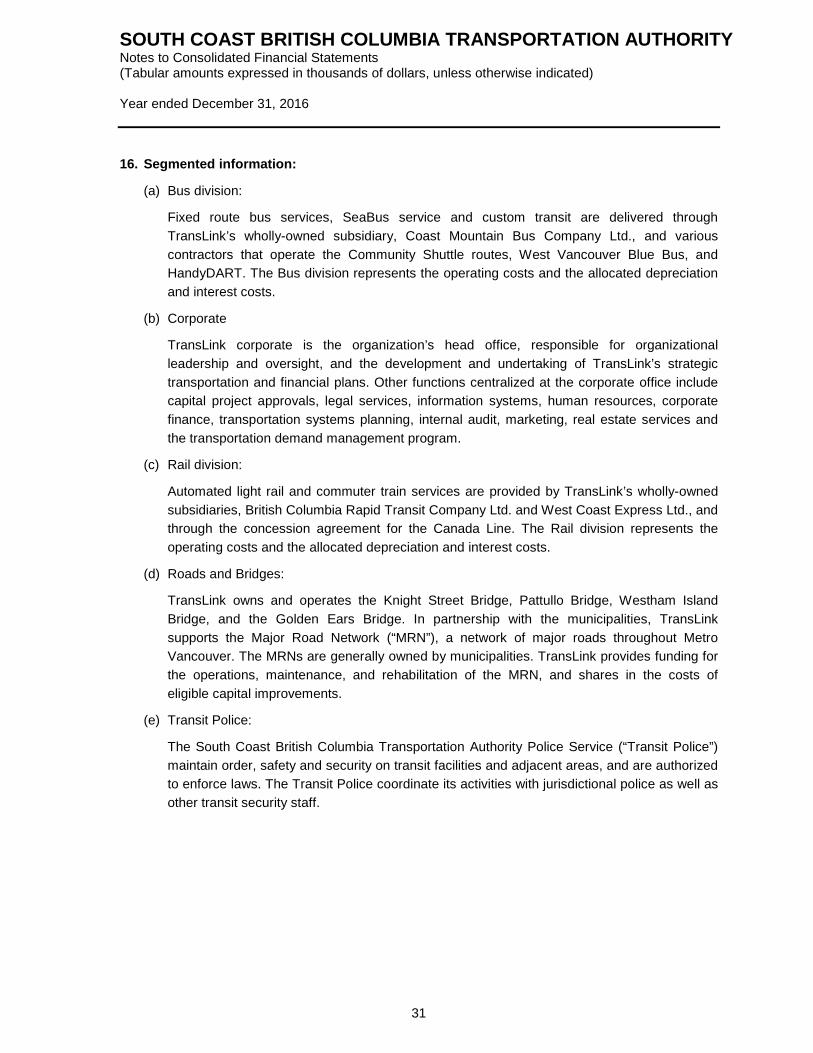
SOUTH COAST BRITISH COLUMBIA TRANSPORTATION AUTHORITY Notes to Consolidated Financial Statements (Tabular amounts expressed in thousands of dollars, unless otherwise indicated) Year ended December 31, 2016
16. Segmented information:
(a) Bus division:
Fixed route bus services, SeaBus service and custom transit are delivered through TransLink’s wholly-owned subsidiary, Coast Mountain Bus Company Ltd., and various contractors that operate the Community Shuttle routes, West Vancouver Blue Bus, and HandyDART. The Bus division represents the operating costs and the allocated depreciation and interest costs.
(b) Corporate
TransLink corporate is the organization’s head office, responsible for organizational leadership and oversight, and the development and undertaking of TransLink’s strategic transportation and financial plans. Other functions centralized at the corporate office include capital project approvals, legal services, information systems, human resources, corporate finance, transportation systems planning, internal audit, marketing, real estate services and the transportation demand management program.
(c) Rail division:
Automated light rail and commuter train services are provided by TransLink’s wholly-owned subsidiaries, British Columbia Rapid Transit Company Ltd. and West Coast Express Ltd., and through the concession agreement for the Canada Line. The Rail division represents the operating costs and the allocated depreciation and interest costs.
(d) Roads and Bridges:
TransLink owns and operates the Knight Street Bridge, Pattullo Bridge, Westham Island Bridge, and the Golden Ears Bridge. In partnership with the municipalities, TransLink supports the Major Road Network (“MRN”), a network of major roads throughout Metro Vancouver. The MRNs are generally owned by municipalities. TransLink provides funding for the operations, maintenance, and rehabilitation of the MRN, and shares in the costs of eligible capital improvements.
(e) Transit Police:
The South Coast British Columbia Transportation Authority Police Service (“Transit Police”) maintain order, safety and security on transit facilities and adjacent areas, and are authorized to enforce laws. The Transit Police coordinate its activities with jurisdictional police as well as other transit security staff.
31
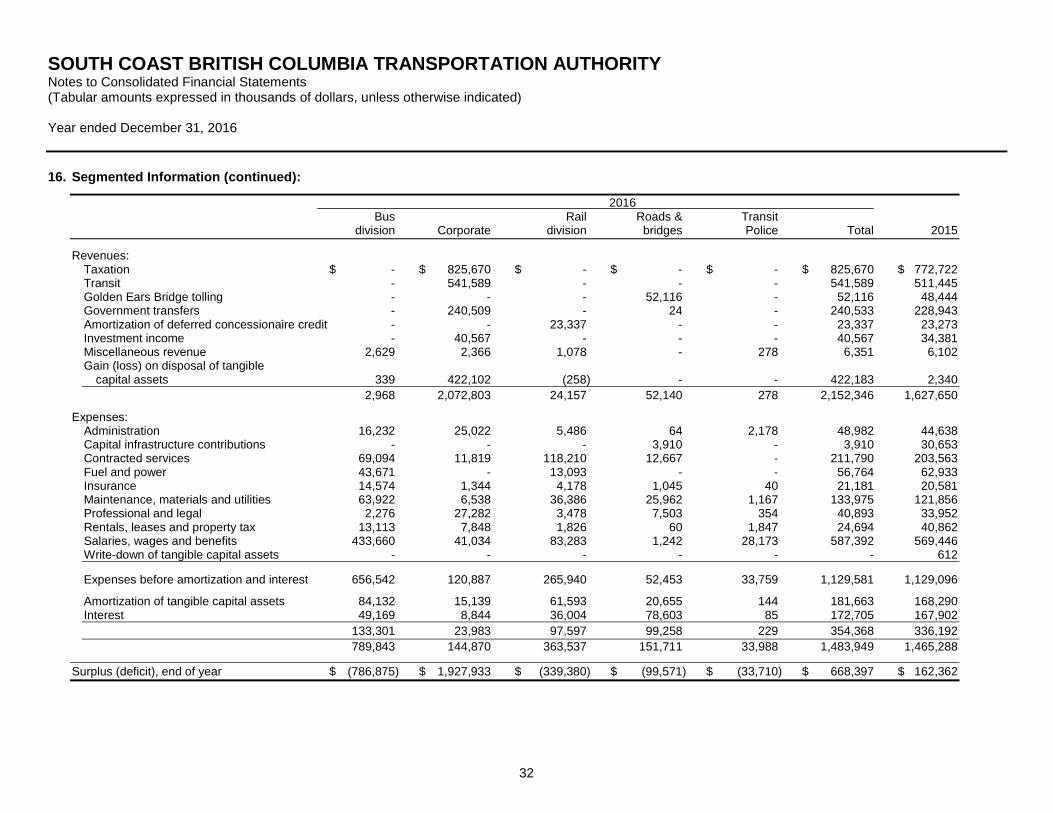
SOUTH COAST BRITISH COLUMBIA TRANSPORTATION AUTHORITY Notes to Consolidated Financial Statements (Tabular amounts expressed in thousands of dollars, unless otherwise indicated) Year ended December 31, 2016 16. Segmented Information (continued):
2016 Bus Rail Roads & Transit division Corporate division bridges Police Total 2015 Revenues:
Taxation $ - $ 825,670 $ - $ - $ - $ 825,670 $ 772,722 Transit - 541,589 - - - 541,589 511,445 Golden Ears Bridge tolling - - - 52,116 - 52,116 48,444 Government transfers - 240,509 - 24 - 240,533 228,943 Amortization of deferred concessionaire credit - - 23,337 - - 23,337 23,273 Investment income - 40,567 - - - 40,567 34,381 Miscellaneous revenue 2,629 2,366 1,078 - 278 6,351 6,102 Gain (loss) on disposal of tangible
capital assets 339 422,102 (258) - - 422,183 2,340 2,968 2,072,803 24,157 52,140 278 2,152,346 1,627,650
Expenses: Administration 16,232 25,022 5,486 64 2,178 48,982 44,638 Capital infrastructure contributions - - - 3,910 - 3,910 30,653 Contracted services 69,094 11,819 118,210 12,667 - 211,790 203,563 Fuel and power 43,671 - 13,093 - - 56,764 62,933 Insurance 14,574 1,344 4,178 1,045 40 21,181 20,581 Maintenance, materials and utilities 63,922 6,538 36,386 25,962 1,167 133,975 121,856 Professional and legal 2,276 27,282 3,478 7,503 354 40,893 33,952 Rentals, leases and property tax 13,113 7,848 1,826 60 1,847 24,694 40,862 Salaries, wages and benefits 433,660 41,034 83,283 1,242 28,173 587,392 569,446 Write-down of tangible capital assets - - - - - - 612 Expenses before amortization and interest 656,542 120,887 265,940 52,453 33,759 1,129,581 1,129,096
Amortization of tangible capital assets 84,132 15,139 61,593 20,655 144 181,663 168,290 Interest 49,169 8,844 36,004 78,603 85 172,705 167,902 133,301 23,983 97,597 99,258 229 354,368 336,192 789,843 144,870 363,537 151,711 33,988 1,483,949 1,465,288
Surplus (deficit), end of year $ (786,875) $ 1,927,933 $ (339,380) $ (99,571) $ (33,710) $ 668,397 $ 162,362
32
SOUTH COAST BRITISH COLUMBIA TRANSPORTATION AUTHORITY Notes to Consolidated Financial Statements (Tabular amounts expressed in thousands of dollars, unless otherwise indicated) Year ended December 31, 2016
17. Comparative information:
Certain comparative information has been reclassified to conform to the current year’s financial statement presentation.
33