Embed Size (px)
Citation preview
South Gloucestershire Council Strategic Flood Risk Assessment - Level 2
FINAL REPORT
December 2011
South Gloucestershire Council
Council Offices
Badminton Road
YATE
Gloucestershire
BS37 5AF
2011s4997 SGC FINAL SFRA Level 2 v7.0.doc i
JBA Office
Aberdeen House South Road HAYWARDS HEATH West Sussex RH16 4NG
JBA Project Manager
Alastair Dale BSc PGDip MIAHR
Revision History
Revision Ref / Date Issued
Amendments Issued to
V1.0 - First Draft (July '11)
N/A Pam Walton (South Gloucestershire Council) Nigel Smith (EA)
V1.1 - Updated Draft
Updated with initial comments from client and EA
Pam Walton (South Gloucestershire Council) Nigel Smith (EA) at meeting dated the 30 August 2011 ( Hard Copy)
V 2.0 Updated
Updated following meeting on the 30 August 2011, Comments from EA 05/08/2011 and 26/08/2011 Comments from SGC 26/08/2011, 02/09/2011 and 07/09/2011
Not Issued
V3.0 - FINAL DRAFT
Updated following emails dated 7 September (EA) 14 September 2011 (SGC) 23 September (EA) 28 September (SGC) 03 October (SGC)
Pam Walton (South Gloucestershire Council) Nigel Smith (EA) Nigel Hale (South Gloucestershire Council
V4.0 FINAL
Updated following emails from SGC on the: 27 October, 28 October, 31 October, 4 November, 8 November and the 9 November. And from the EA on the 25 October, 4 November
Pam Walton (South Gloucestershire Council) Nigel Smith (EA) Nigel Hale (South Gloucestershire Council
v5.0 FINAL Update following emails dated: 2/12/2011 (SGC)
Pam Walton (South Gloucestershire Council) Nigel Smith (EA) Nigel Hale (South Gloucestershire Council
V6.0 FINAL Update following dated 6/12/2011 (SGC)
Pam Walton (South Gloucestershire Council) Nigel Smith (EA) Nigel Hale (South Gloucestershire Council
V7.0 Final Update following email dated 6 /12/2011 (SGC)
Pam Walton (South Gloucestershire Council) Nigel Smith (EA) Nigel Hale (South Gloucestershire Council

2011s4997 SGC FINAL SFRA Level 2 v7.0.doc ii
2011s4997 SGC FINAL SFRA Level 2 v7.0.doc iii
Contract
This Level 2 Strategic Flood Risk Assessment (SFRA) is commissioned by South Gloucestershire Council. This document has been prepared by JBA Consulting in response to the Level 2 SFRA commission awarded by South Gloucestershire Council, in March 2011.
Prepared by .................................................. Jack Southon BSc MSc FRGS
Analyst
....................................................................... Margaret Moran LLM BSc Dip
Analyst
Reviewed by ................................................. Alastair Dale BSc PGDip MIAHR
Technical Director
Purpose
This document has been prepared as a report for South Gloucestershire Council. JBA Consulting accepts no responsibility or liability for any use that is made of this document other than by South Gloucestershire Council for the purposes for which it was originally commissioned and prepared.

2011s4997 SGC FINAL SFRA Level 2 v7.0.doc iv
Copyright
© Jeremy Benn Associates Limited 2011
Carbon Footprint
367g
A printed copy of the main text in this document will result in a carbon footprint of 289g if 100% post-consumer recycled paper is used and 367g if primary-source paper is used. These figures assume the report is printed in black and white on A4 paper and in duplex.
JBA is aiming towards becoming a carbon neutral company and the carbon emissions from our activities are offset.

2011s4997 SGC FINAL SFRA Level 2 v7.0.doc v
This page is intentionally blank.
2011s4997 SGC FINAL SFRA Level 2 v7.0.doc vi
Contents
Abbreviations and Glossary of Terms ............................................................................ x
1. Introduction ........................................................................................................... 1
1.1 About this Report .................................................................................................... 1 1.2 SFRA Objectives .................................................................................................... 2 1.3 How to Find What You Need in the SFRA ............................................................. 3 1.4 Scope of Assessment ............................................................................................. 4 1.5 Approach ................................................................................................................ 7 1.6 Consultation ............................................................................................................ 8
2. Understanding Flood Risk in South Gloucestershire ...................................... 9
2.1 Historic Flooding ..................................................................................................... 9 2.2 Topography, Geology, Soils and Hydrology .......................................................... 9 2.3 Bristol Avon Catchment .......................................................................................... 10 2.4 Severn Tidal Catchment ......................................................................................... 17 2.5 How Flood Risk is Assessed .................................................................................. 19 2.6 Understanding Flooding in South Gloucestershire ................................................ 23 2.7 Possible Responses to Flooding ............................................................................ 25 2.8 Policy Considerations ............................................................................................. 26
3. Mapping and Risk Based Approach ................................................................... 31
3.1 Summary of Mapping for All Sources of Flood Risk .............................................. 31 3.2 Other Relevant Flood Risk Information .................................................................. 32 3.3 Sequential Approach .............................................................................................. 33 3.4 Sequential Test ....................................................................................................... 33 3.5 Exception Test ........................................................................................................ 36
4. Overview of Future Development ....................................................................... 37
4.1 Extent and type of development ............................................................................. 37 4.2 Review of Future Development .............................................................................. 38 4.3 Summary of Existing Surface Water Regime ......................................................... 40
5. Strategic Assessment of Future Development ................................................. 43
5.1 Introduction ............................................................................................................. 43 5.2 Development over the next 5 Years ....................................................................... 43 5.3 Longer Term Development up to 2026 .................................................................. 46 5.4 Approach to Analysis of Catchment Response to Development ........................... 47
6. Catchment Response to Development .............................................................. 51
6.1 Introduction ............................................................................................................. 51 6.2 Key Locations ......................................................................................................... 51 6.3 Summary of Existing Situation ............................................................................... 51 6.4 Establishing a Baseline .......................................................................................... 52 6.5 Guidance on SuDS Techniques ............................................................................. 55
7. Strategic Options.................................................................................................. 57
7.1 Possible Strategic Options ..................................................................................... 57 7.2 Review and Assessment of Options ...................................................................... 57 7.3 Indicative Costs and Scale ..................................................................................... 68 7.4 Conclusions ............................................................................................................ 68
2011s4997 SGC FINAL SFRA Level 2 v7.0.doc vii
8. Summary Assessment of Core Strategy Development Sites .......................... 69
8.1 Introduction ............................................................................................................. 69 8.2 Summary Tables and Maps ................................................................................... 69
9. FRA Requirements ............................................................................................... 71
9.1 Over-Arching Principles .......................................................................................... 71 9.2 Requirements for Flood Risk Assessments ........................................................... 71
10. Outcomes .............................................................................................................. 73
10.1 Summary of Work Undertaken ............................................................................... 73 10.2 Outcomes ............................................................................................................... 73
Appendices ........................................................................................................................ I
A. Strategic Site Summary Tables and Maps ......................................................... I
A-1.0 Cribbs/Patchway New Neighbourhood and Post 2020 Contingency Site to the West of A4108 (Cribbs Causeway) .......................................................... II
A-2.0 North Yate New Neighbourhood - Main and South of Yate Outdoor Sports Complex (YOSC) ...................................................................................... IV
A-3.1 West of M32 Area (Harry Stoke) .......................................................................... V
A-3.2 West of the M32 (Land East of Coldharbour Lane)........................................... VII
A-3.3 West of the M32 (The University of the West of England) ............................... VIII
A-4.0 Housing Opportunity Thornbury ........................................................................ IX
B. Maps....................................................................................................................... XI
C. Catchment Response Hydrographs ................................................................... XV
D. Challenge Flood Maps and Flood Zones ........................................................... XVII
E. Indicative Cost and Scale of Strategic Storage Options .................................. XIX
List of Figures
Figure 1-1: Study Extent ................................................................................................. 2
Figure 1-2: Key documents and strategic planning links - Flood Risk ..................... 5
Figure 1-3 Flood Risk Management Hierarchy ............................................................ 7
Figure 2-1 South Gloucestershire Council Sub Catchments .................................... 10
Figure 2-2 Ladden Brook ................................................................................................ 13
Figure 2-3 Upper River Frome ....................................................................................... 14
Figure 2-4 Lower Frome .................................................................................................. 15
Figure 2-5 River Trym...................................................................................................... 16
Figure 2-6 Pickedmoor Brook ........................................................................................ 18
Figure 2-7: Use of SFRA information ............................................................................ 20
Figure 2-8: Definition of Flood Zones ........................................................................... 20
Figure 2-9: Definition of Flood Zone 3b (Table D1 of PPS25) ..................................... 21
Figure 2-10 Bristol Avon CFMP ..................................................................................... 27
Figure 2-11 Severn Tidal CFMP...................................................................................... 28
Figure 4-1: Development Areas in South Gloucestershire Council ........................... 37
2011s4997 SGC FINAL SFRA Level 2 v7.0.doc viii
Figure 4-2 Cribbs Causeway/Patchway New Neighbourhood .................................... 38
Figure 4-3 North Yate New Neighbourhood - Main and South of Yate Outdoor Sports Complex (YOSC) .................................................................................... 38
Figure 4-4 West of M32 Area ......................................................................................... 39
Figure 4-5 The University of the West of England (UWE) ........................................... 40
Figure 4-6 Thornbury Housing Opportunity ................................................................. 40
Figure 6-1: Schematic of Watercourses within South Gloucestershire Council ...... 52
Figure 6-2 Example of Indicative Hydrograph .............................................................. 53
Figure 7-1- Strategic Option 1 - Ladden Brook Reservoir 1 ....................................... 58
Figure 7-2- Schematic of Strategic Option 2 - Ladden Brook Reservoir 2a .............. 59
Figure 7-3- Schematic of Strategic Option 3 - Tubbs Bottom .................................... 61
Figure 7-4- Schematic of Strategic Option 4 - Bradley Brook .................................... 62
Figure 7-5- Schematic of Strategic Option 5 - Ladden Brook Reservoir 2b.............. 63
Figure 7-6- Schematic of Strategic Option 6 - Bradley Brook Reservoir 3a ............. 64
Figure 7-7- Schematic of Strategic Option 7 - Ham Brook .......................................... 65
Figure 7-8- Schematic of Strategic Option 8 - Ladden Brook Reservoir 2b and Tubbs Bottom ..................................................................................................... 66
Figure 7-9- Schematic of Strategic Option 9 Bradley Brook Reservoir 3b ............... 67
List of Tables
Table 1-1: SFRA Report layout....................................................................................... 3
Table 1-2 Roles and Responsibilities ........................................................................... 6
Table 2-1 Previous Fluvial Studies ................................................................................ 23
Table 3-1 Hydraulic Models ............................................................................................ 31
Table 5-1 Predicted rate of development completion.................................................. 43
Table 5-2 Critical Storm Duration affecting downstream development .................... 44
Table 5-3 Predicted rainfall depth for each site for Critical Storm Duration ............. 44
Table 5-4 Estimated runoff pre- and post-development runoff rates and volumes (up to 2016) by site used in strategic catchment analysis. ............ 45
Table 5-5 Predicted storage requirements for each development up until 2016 used in strategic catchment analysis .............................................................. 46
Table 5-6 Estimated runoff pre- and post-development runoff rates and volumes (up to 2026) by site used in strategic catchment analysis. ............ 46
Table 5-7 Predicted storage requirements for each development up until 2026 used in strategic catchment analysis. ............................................................. 47
Table 6-1 Key Locations ................................................................................................. 51
Table 6-2 Summary of Scenario 2 - Climate Change Compared with Baseline ........ 53
Table 6-3 Summary of Scenario 3 - Un-attenuated Development Compared with Baseline ....................................................................................................... 54
Table 6-4 Summary of Scenario 4 - Attenuated Development Compared with Baseline ............................................................................................................... 54
2011s4997 SGC FINAL SFRA Level 2 v7.0.doc ix
Table 6-5: SuDS Hydraulic Design Criteria ................................................................... 56
Table 7-1 Summary of Scenario 5 results against baseline (Scenario 1) .................. 58
Table 7-2 Summary of Scenario 6 results against baseline (Scenario 1) .................. 59
Table 7-3 Summary of Scenario 7 results against baseline (Scenario 1) .................. 61
Table 7-4 Summary of Scenario 8 results against baseline (Scenario 1) .................. 62
Table 7-5 Summary of Scenario 9 results against baseline (Scenario 1) .................. 63
Table 7-6 Summary of Scenario 10 results against baseline (Scenario 1) ................ 64
Table 7-7 Summary of Scenario 11 results against baseline (Scenario 1) ................ 65
Table 7-8 Summary of Scenario 12 results against baseline (Scenario 4) ................ 66
Table 7-9 Summary of Scenario 13 results against baseline (Scenario 4) ................ 68
2011s4997 SGC FINAL SFRA Level 2 v7.0.doc x
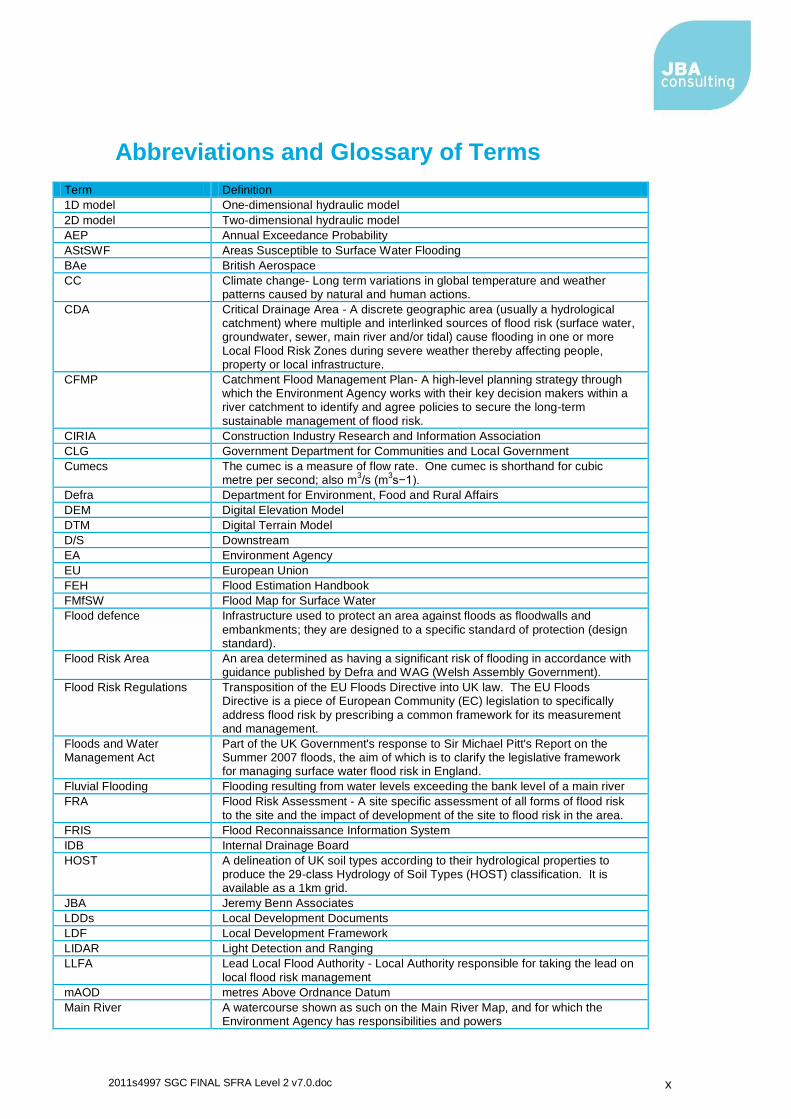
Abbreviations and Glossary of Terms
Term Definition
1D model One-dimensional hydraulic model
2D model Two-dimensional hydraulic model
AEP Annual Exceedance Probability
AStSWF Areas Susceptible to Surface Water Flooding
BAe British Aerospace
CC Climate change- Long term variations in global temperature and weather patterns caused by natural and human actions.
CDA Critical Drainage Area - A discrete geographic area (usually a hydrological catchment) where multiple and interlinked sources of flood risk (surface water, groundwater, sewer, main river and/or tidal) cause flooding in one or more
Local Flood Risk Zones during severe weather thereby affecting people, property or local infrastructure.
CFMP Catchment Flood Management Plan- A high-level planning strategy through which the Environment Agency works with their key decision makers within a river catchment to identify and agree policies to secure the long-term
sustainable management of flood risk.
CIRIA Construction Industry Research and Information Association
CLG Government Department for Communities and Local Government
Cumecs The cumec is a measure of flow rate. One cumec is shorthand for cubic metre per second; also m
3/s (m
3s−1).
Defra Department for Environment, Food and Rural Affairs
DEM Digital Elevation Model
DTM Digital Terrain Model
D/S Downstream
EA Environment Agency
EU European Union
FEH Flood Estimation Handbook
FMfSW Flood Map for Surface Water
Flood defence Infrastructure used to protect an area against floods as floodwalls and
embankments; they are designed to a specific standard of protection (design standard).
Flood Risk Area An area determined as having a significant risk of flooding in accordance with guidance published by Defra and WAG (Welsh Assembly Government).
Flood Risk Regulations Transposition of the EU Floods Directive into UK law. The EU Floods Directive is a piece of European Community (EC) legislation to specifically
address flood risk by prescribing a common framework for its measurement and management.
Floods and Water Management Act
Part of the UK Government's response to Sir Michael Pitt's Report on the Summer 2007 floods, the aim of which is to clarify the legislative framework for managing surface water flood risk in England.
Fluvial Flooding Flooding resulting from water levels exceeding the bank level of a main river
FRA Flood Risk Assessment - A site specific assessment of all forms of flood risk
to the site and the impact of development of the site to flood risk in the area.
FRIS Flood Reconnaissance Information System
IDB Internal Drainage Board
HOST A delineation of UK soil types according to their hydrological properties to produce the 29-class Hydrology of Soil Types (HOST) classification. It is available as a 1km grid.
JBA Jeremy Benn Associates
LDDs Local Development Documents
LDF Local Development Framework
LIDAR Light Detection and Ranging
LLFA Lead Local Flood Authority - Local Authority responsible for taking the lead on
local flood risk management
mAOD metres Above Ordnance Datum
Main River A watercourse shown as such on the Main River Map, and for which the Environment Agency has responsibilities and powers
2011s4997 SGC FINAL SFRA Level 2 v7.0.doc xi
MMO Marine Management Organisation
NFCDD National Flood and Coastal Defence Database
NPPF National Planning Policy Framework
NRD National Receptor Dataset – a collection of risk receptors produced by the
Environment Agency
NSWI Northern Storm Water Interceptor
Ordinary Watercourse All watercourses that are not designated Main River. Local Authorities or, where they exist, IDBs have similar permissive powers as the Environment Agency in relation to flood defence work. However, the riparian owner has the responsibility of maintenance.
PFRA Preliminary Flood Risk Assessment
Pitt Review Comprehensive independent review of the 2007 summer floods by Sir Michael
Pitt, which provided recommendations to improve flood risk management in England.
PPS25 Planning and Policy Statement 25: Development and Flood Risk
ReFH Revitalised Flood Hydrograph
Resilience Measures Measures designed to reduce the impact of water that enters property and businesses; could include measures such as raising electrical appliances.
Resistance Measures Measures designed to keep flood water out of properties and businesses; could include flood guards for example.
Risk In flood risk management, risk is defined as a product of the probability or likelihood of a flood occurring, and the consequence of the flood.
Return Period Is an estimate of the interval of time between events of a certain intensity or size, in this instance it refers to flood events. It is a statistical measurement denoting the average recurrence interval over an extended period of time.
Sewer flooding Flooding caused by a blockage or overflowing in a sewer or urban drainage system.
SHLAA Strategic Housing Land Availability Assessment - The Strategic Housing Land Availability Assessment (SHLAA) is a technical piece of evidence to support the Core Strategy and Sites & Policies Development Plan Documents (DPDs). Its purpose is to demonstrate that there is a supply of housing land in the District which is suitable and deliverable.
SFRA Strategic Flood Risk Assessment
Stakeholder A person or organisation affected by the problem or solution, or interested in the problem or solution. They can be individuals or organisations, includes the public and communities.
SPRHOST Standard Percentage Runoff (%) associated with each HOST soil class
SuDS Sustainable Drainage Systems - Methods of management practices and control structures that are designed to drain surface water in a more
sustainable manner than some conventional techniques
Surface water flooding Flooding as a result of surface water runoff as a result of high intensity rainfall when water is ponding or flowing over the ground surface before it enters the underground drainage network or watercourse, or cannot enter it because the network is full to capacity, thus causing what is known as pluvial flooding.
SWMP Surface Water Management Plan - The SWMP plan should outline the
preferred surface water management strategy and identify the actions, timescales and responsibilities of each partner. It is the principal output from the SWMP study.
U/S Upstream
UWE University of West England
YOSC Yate Outdoor Sports Complex
2011s4997 SGC FINAL SFRA Level 2 v7.0.doc
1
1. Introduction
1.1 About this Report
South Gloucestershire Council's Level 2 Strategic Flood Risk Assessment (SFRA) Report, compliments the supporting document "South Gloucestershire SFRA Level 1 Report, February 2009
1." A Level 2 SFRA has been prepared to build on the work that was included
in the Level 1 SFRA.
In particular, South Gloucestershire Council has identified the Level 2 SFRA should:
Correspond to the “increased scope “SFRA referred to in paragraph E6 of Planning Policy Statement 25 (PPS25).
Facilitate application of the Sequential and Exception Tests.
Consider the detailed nature of flood hazards taking account of the presence of flood risk management measures, including flood defences.
Allow a sequential approach to site allocation to be undertaken within a flood zone.
Allow development of the policies and practices required to ensure that development within Flood Zones 2 and 3 satisfies the requirements of the Exception Test.
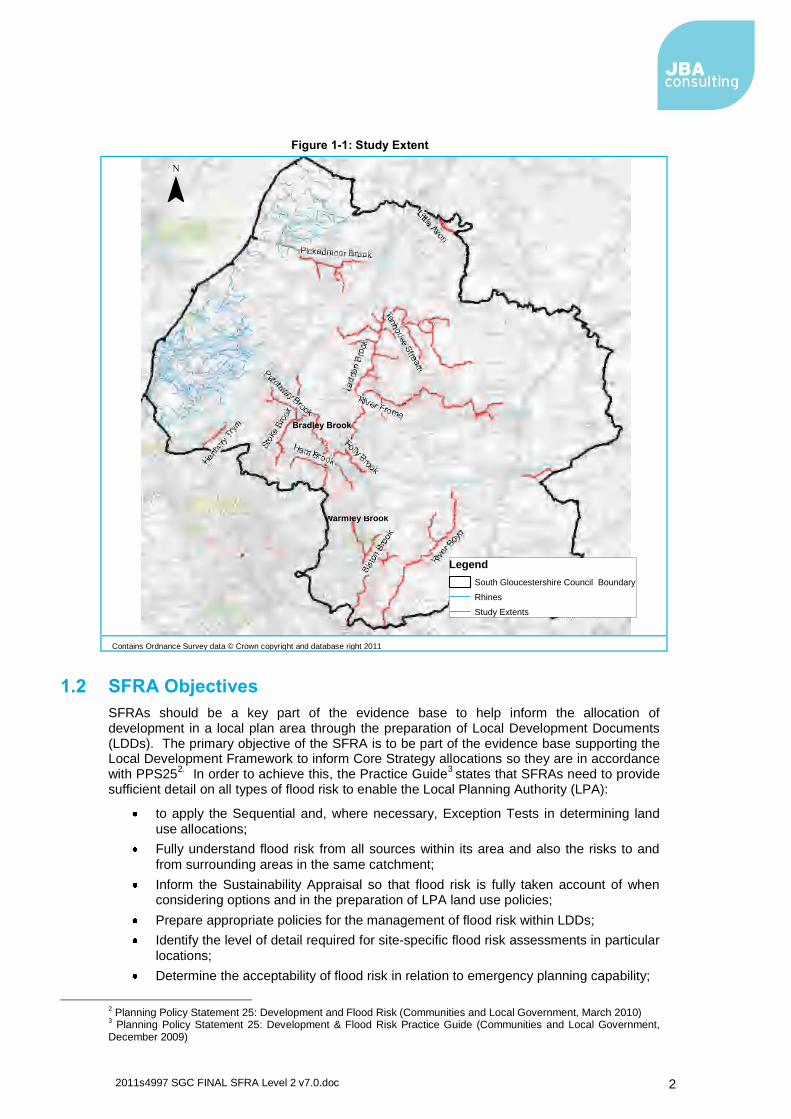
This document has been prepared under the requirements of Planning and Policy Statement 25 and accompanying Planning Policy Statement 25: Development and Flood Risk - Practice Guide. The Government‟s draft National Planning Policy Framework (NPPF) was published in the final stages of this document‟s preparation, however the Level 2 SFRA is considered to be generally compliant with the draft NPPF. The extent of the study area, together with the principal watercourses, is shown in Figure 1-1.
1 http://www.southglos.gov.uk/NR/rdonlyres/72D86103-23D7-45C3-8033-4345C3BE1FD7/0/PTE090113.pdf
2011s4997 SGC FINAL SFRA Level 2 v7.0.doc
2
Figure 1-1: Study Extent
Contains Ordnance Survey data © Crown copyright and database right 2011
1.2 SFRA Objectives
SFRAs should be a key part of the evidence base to help inform the allocation of development in a local plan area through the preparation of Local Development Documents (LDDs). The primary objective of the SFRA is to be part of the evidence base supporting the Local Development Framework to inform Core Strategy allocations so they are in accordance with PPS25
2. In order to achieve this, the Practice Guide
3 states that SFRAs need to provide
sufficient detail on all types of flood risk to enable the Local Planning Authority (LPA):
to apply the Sequential and, where necessary, Exception Tests in determining land use allocations;
Fully understand flood risk from all sources within its area and also the risks to and
from surrounding areas in the same catchment;
Inform the Sustainability Appraisal so that flood risk is fully taken account of when considering options and in the preparation of LPA land use policies;
Prepare appropriate policies for the management of flood risk within LDDs;
Identify the level of detail required for site-specific flood risk assessments in particular
locations;
Determine the acceptability of flood risk in relation to emergency planning capability;
2 Planning Policy Statement 25: Development and Flood Risk (Communities and Local Government, March 2010)
3 Planning Policy Statement 25: Development & Flood Risk Practice Guide (Communities and Local Government,
December 2009)
Legend
South Gloucestershire Council Boundary
Rhines
Study Extents
¯
Warmley Brook
Bradley Brook
2011s4997 SGC FINAL SFRA Level 2 v7.0.doc
3
To meet these objectives it will also be a requirement that those preparing information for assessment and testing of flood risk understand the assessment process and the specific characteristics of the flooding that affects the area. The SFRA should also:
Identify strategic measures (if required) to address the effects of proposed
development; and
Influence and provide evidence that assists when making decisions on windfall
planning applications.
Thus the report provides the reader with an understanding of flood risk and how this can be managed in the future.
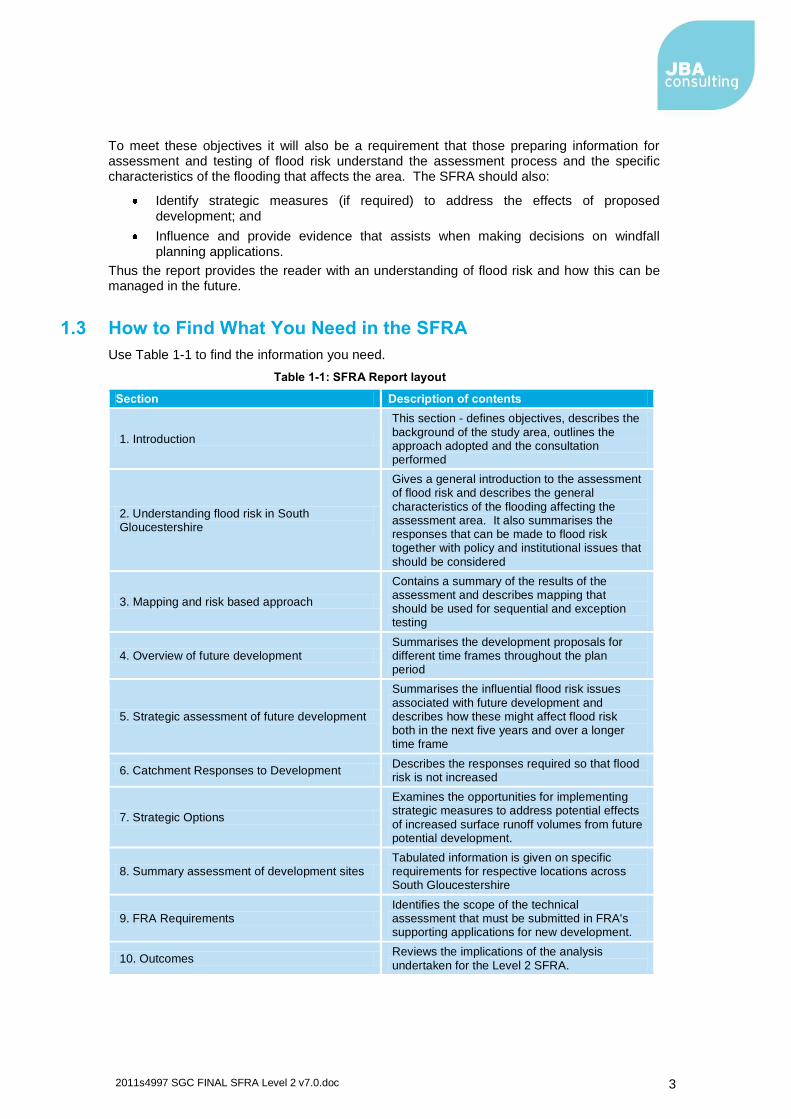
1.3 How to Find What You Need in the SFRA
Use Table 1-1 to find the information you need.
Table 1-1: SFRA Report layout
Section Description of contents
1. Introduction
This section - defines objectives, describes the
background of the study area, outlines the approach adopted and the consultation performed
2. Understanding flood risk in South Gloucestershire
Gives a general introduction to the assessment of flood risk and describes the general
characteristics of the flooding affecting the assessment area. It also summarises the responses that can be made to flood risk together with policy and institutional issues that
should be considered
3. Mapping and risk based approach
Contains a summary of the results of the assessment and describes mapping that should be used for sequential and exception testing
4. Overview of future development Summarises the development proposals for different time frames throughout the plan period
5. Strategic assessment of future development
Summarises the influential flood risk issues
associated with future development and describes how these might affect flood risk both in the next five years and over a longer time frame
6. Catchment Responses to Development Describes the responses required so that flood risk is not increased
7. Strategic Options
Examines the opportunities for implementing strategic measures to address potential effects
of increased surface runoff volumes from future potential development.
8. Summary assessment of development sites Tabulated information is given on specific requirements for respective locations across South Gloucestershire
9. FRA Requirements Identifies the scope of the technical assessment that must be submitted in FRA's supporting applications for new development.
10. Outcomes Reviews the implications of the analysis
undertaken for the Level 2 SFRA.
2011s4997 SGC FINAL SFRA Level 2 v7.0.doc
4
1.4 Scope of Assessment
1.4.1 Hierarchy
The over arching aim of planning policy on development and flood risk is to ensure that flood risk is taken into account at all stages of the planning process. Following announcements by Communities and Local Government (CLG) (on the 6th July 2010 the Secretary of State announced that all regional strategies were revoked)
4 Regional Spatial Strategies are no
longer attributed substantial weight in the local planning process. It can be concluded that the role of Regional Flood Risk Appraisals is also reduced, since the context for their preparation is removed. However the relevant information used in the preparation of the Regional Flood Risk Appraisals should still be considered. The new landscape for the assessment of flood risk is now illustrated in Figure 1-2 (Figure 2.2 in the Practice Guide now being modified in response to the changes in the planning process)
4 This was challenged at Judicial review in November 2010 - but outcome is not affected
2011s4997 SGC FINAL SFRA Level 2 v7.0.doc
5
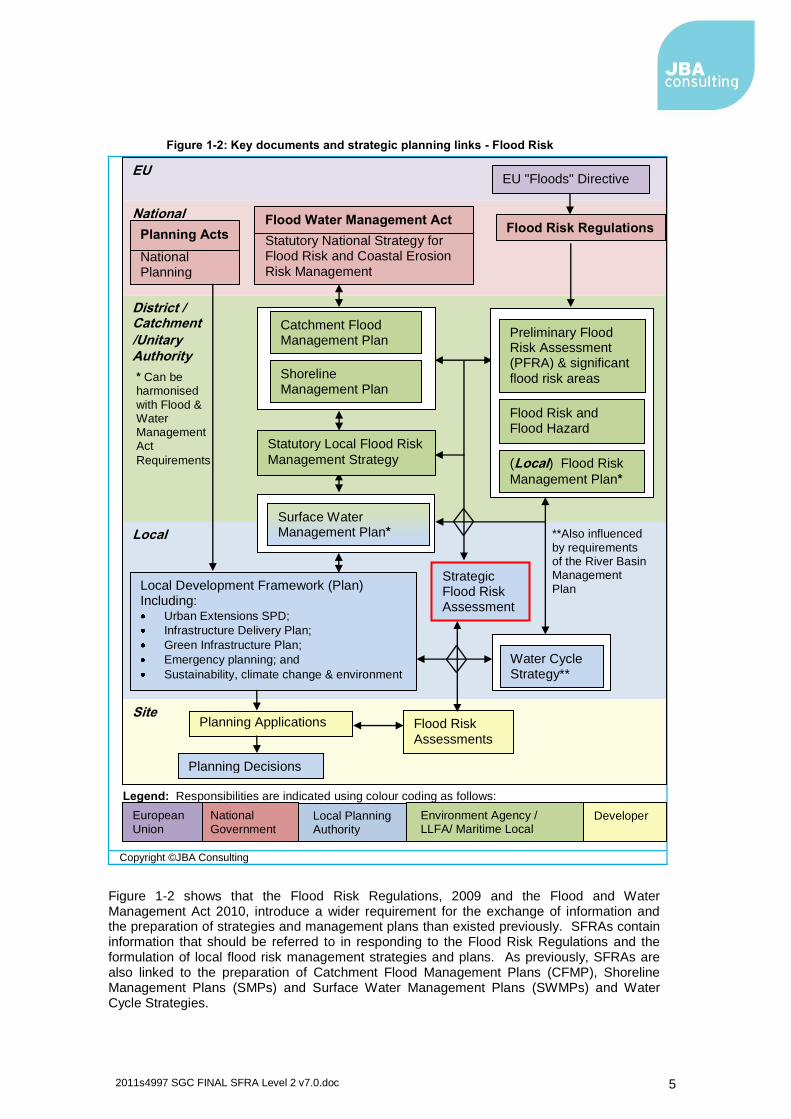
Figure 1-2: Key documents and strategic planning links - Flood Risk
Copyright ©JBA Consulting
Figure 1-2 shows that the Flood Risk Regulations, 2009 and the Flood and Water Management Act 2010, introduce a wider requirement for the exchange of information and the preparation of strategies and management plans than existed previously. SFRAs contain information that should be referred to in responding to the Flood Risk Regulations and the formulation of local flood risk management strategies and plans. As previously, SFRAs are also linked to the preparation of Catchment Flood Management Plans (CFMP), Shoreline Management Plans (SMPs) and Surface Water Management Plans (SWMPs) and Water Cycle Strategies.
National
Site
Local
District / Catchment
EU
National Planning Policy
Local Development Framework (Plan) Including: Urban Extensions SPD;
Infrastructure Delivery Plan;
Green Infrastructure Plan;
Emergency planning; and
Sustainability, climate change & environment
Strategic Flood Risk Assessment
Flood Risk Assessments
Planning Applications
Planning Decisions
Legend: Responsibilities are indicated using colour coding as follows:
EU "Floods" Directive
Surface Water Management Plan*
* Can be harmonised
with Flood & Water Management Act
Requirements
Flood Risk Regulations Statutory National Strategy for Flood Risk and Coastal Erosion
Risk Management
Statutory Local Flood Risk
Management Strategy
Catchment Flood Management Plan
Shoreline Management Plan
Preliminary Flood Risk Assessment (PFRA) & significant
flood risk areas
Flood Risk and Flood Hazard Mapping
(Local) Flood Risk
Management Plan*
Flood Water Management Act Planning Acts
Water Cycle Strategy**
**Also influenced
by requirements of the River Basin Management
Plan
National
Government Local Planning Authority
Environment Agency / LLFA/ Maritime Local
Authorities, e.g. MMO
Developer European
Union
/Unitary Authority
2011s4997 SGC FINAL SFRA Level 2 v7.0.doc
6
It should be recognised that there is also a requirement for decisions to be based on sustainability appraisals and the information in the SFRA should be used to inform this process at local level.
1.4.2 Responsibilities
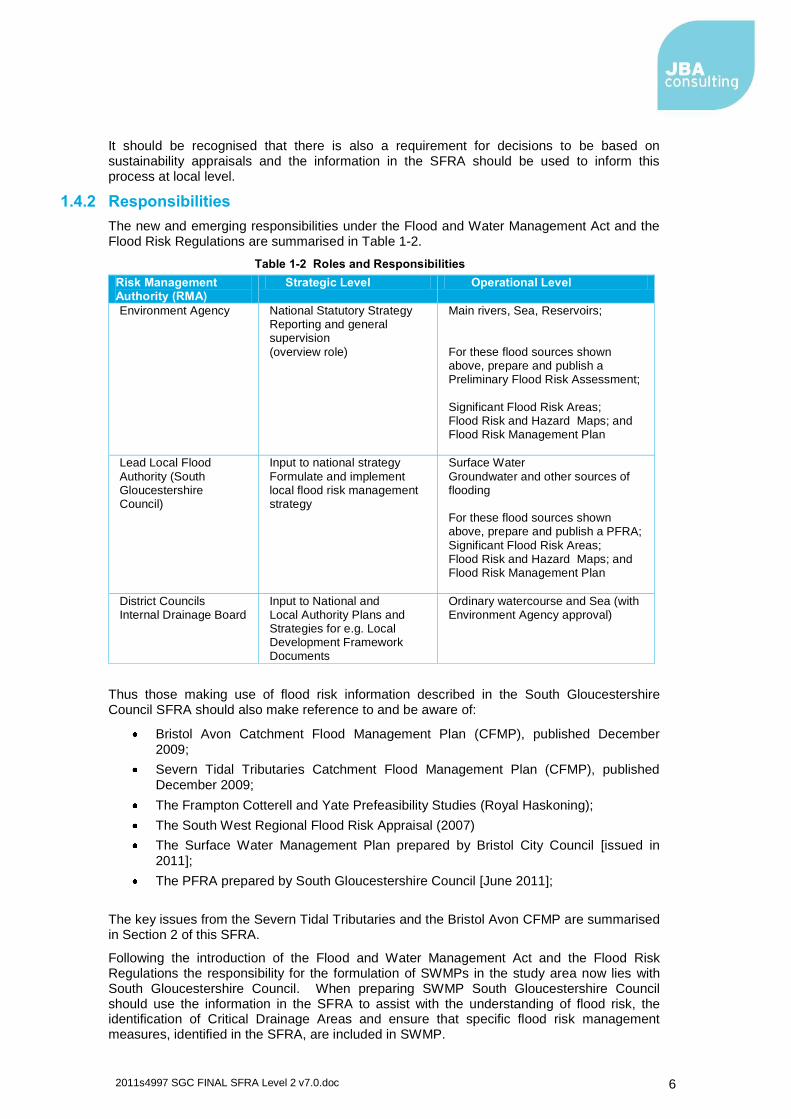
The new and emerging responsibilities under the Flood and Water Management Act and the Flood Risk Regulations are summarised in Table 1-2.
Table 1-2 Roles and Responsibilities
Risk Management Authority (RMA)
Strategic Level Operational Level
Environment Agency
National Statutory Strategy Reporting and general supervision
(overview role)
Main rivers, Sea, Reservoirs;
For these flood sources shown above, prepare and publish a Preliminary Flood Risk Assessment;
Significant Flood Risk Areas; Flood Risk and Hazard Maps; and Flood Risk Management Plan
Lead Local Flood
Authority (South Gloucestershire Council)
Input to national strategy
Formulate and implement local flood risk management strategy
Surface Water
Groundwater and other sources of flooding For these flood sources shown above, prepare and publish a PFRA;
Significant Flood Risk Areas; Flood Risk and Hazard Maps; and Flood Risk Management Plan
District Councils Internal Drainage Board
Input to National and Local Authority Plans and Strategies for e.g. Local Development Framework Documents
Ordinary watercourse and Sea (with Environment Agency approval)
Thus those making use of flood risk information described in the South Gloucestershire Council SFRA should also make reference to and be aware of:
Bristol Avon Catchment Flood Management Plan (CFMP), published December 2009;
Severn Tidal Tributaries Catchment Flood Management Plan (CFMP), published
December 2009;
The Frampton Cotterell and Yate Prefeasibility Studies (Royal Haskoning);
The South West Regional Flood Risk Appraisal (2007)
The Surface Water Management Plan prepared by Bristol City Council [issued in
2011];
The PFRA prepared by South Gloucestershire Council [June 2011];
The key issues from the Severn Tidal Tributaries and the Bristol Avon CFMP are summarised in Section 2 of this SFRA.
Following the introduction of the Flood and Water Management Act and the Flood Risk Regulations the responsibility for the formulation of SWMPs in the study area now lies with South Gloucestershire Council. When preparing SWMP South Gloucestershire Council should use the information in the SFRA to assist with the understanding of flood risk, the identification of Critical Drainage Areas and ensure that specific flood risk management measures, identified in the SFRA, are included in SWMP.
2011s4997 SGC FINAL SFRA Level 2 v7.0.doc
7
1.5 Approach
1.5.1 General Assessment of Flood Risk
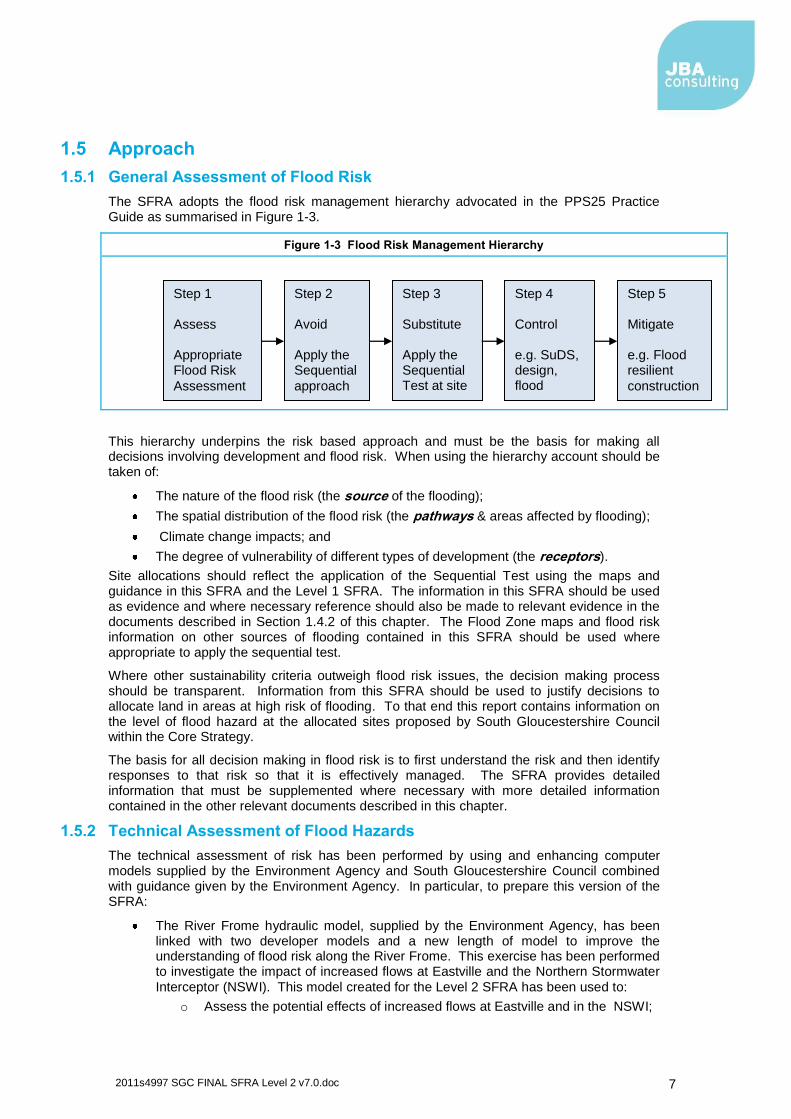
The SFRA adopts the flood risk management hierarchy advocated in the PPS25 Practice Guide as summarised in Figure 1-3.
Figure 1-3 Flood Risk Management Hierarchy
This hierarchy underpins the risk based approach and must be the basis for making all decisions involving development and flood risk. When using the hierarchy account should be taken of:
The nature of the flood risk (the source of the flooding);
The spatial distribution of the flood risk (the pathways & areas affected by flooding);
Climate change impacts; and
The degree of vulnerability of different types of development (the receptors).
Site allocations should reflect the application of the Sequential Test using the maps and guidance in this SFRA and the Level 1 SFRA. The information in this SFRA should be used as evidence and where necessary reference should also be made to relevant evidence in the documents described in Section 1.4.2 of this chapter. The Flood Zone maps and flood risk information on other sources of flooding contained in this SFRA should be used where appropriate to apply the sequential test.
Where other sustainability criteria outweigh flood risk issues, the decision making process should be transparent. Information from this SFRA should be used to justify decisions to allocate land in areas at high risk of flooding. To that end this report contains information on the level of flood hazard at the allocated sites proposed by South Gloucestershire Council within the Core Strategy.
The basis for all decision making in flood risk is to first understand the risk and then identify responses to that risk so that it is effectively managed. The SFRA provides detailed information that must be supplemented where necessary with more detailed information contained in the other relevant documents described in this chapter.
1.5.2 Technical Assessment of Flood Hazards
The technical assessment of risk has been performed by using and enhancing computer models supplied by the Environment Agency and South Gloucestershire Council combined with guidance given by the Environment Agency. In particular, to prepare this version of the SFRA:
The River Frome hydraulic model, supplied by the Environment Agency, has been linked with two developer models and a new length of model to improve the understanding of flood risk along the River Frome. This exercise has been performed to investigate the impact of increased flows at Eastville and the Northern Stormwater
Interceptor (NSWI). This model created for the Level 2 SFRA has been used to:
o Assess the potential effects of increased flows at Eastville and in the NSWI;
Step 1 Assess Appropriate Flood Risk
Assessment
Step 2 Avoid Apply the Sequential
approach
Step 3 Substitute Apply the Sequential Test at site level
Step 4 Control e.g. SuDS, design, flood defences
Step 5 Mitigate e.g. Flood resilient
construction
2011s4997 SGC FINAL SFRA Level 2 v7.0.doc
8
o Improve the understanding of the influence of the storage capacity of
Emerson Green, Tubbs Bottom and Cribbs Reservoir;
o Improve the understanding of the flood mechanisms at Eastville and the
NSWI;
o Examine the feasibility and effectiveness of strategic measures to address flood risk.
Modelled outlines using JFlow+ have been developed for the Pickedmoor Brook to determine Flood Zone 3a, Flood Zone 3b and Flood Zone 2;
The catchment wide analysis has been undertaken considering both pre and post
development and climate change; and
Flood Maps for Surface Water (FMfSW) and the Bristol City SWMP have been referenced, to ascertain the level of risk from surface water.
1.5.3 Scope of Assessment
This version of the SFRA contains flood risk information that satisfies the requirements of a Level 2 SFRA. The Practice Guide advises that:
"The Level 2 SFRA corresponds to the ‘increased scope’ SFRA referred to in paragraph E6 of PPS25. The principal purpose of a Level 2 SFRA is to facilitate application of the Sequential and Exception Tests. More detailed information is required where there is deemed to be development pressure in areas that are at medium or high flood risk and there are no other suitable alternative areas for development after applying the Sequential Test. This more detailed study should consider the detailed nature of the flood hazard, taking account of the presence of flood risk management measures such as flood defences. This will allow a sequential approach to site allocation to be adopted within a Flood Zone (paragraphs 17 and D4 of PPS25). It will also allow the policies and practices required to ensure that development in such areas satisfies the requirements of the Exception Test, to be identified for insertion into the LDD."
1.6 Consultation
The following parties (external to South Gloucestershire Council) have been consulted during the preparation of this version of the SFRA:
The Environment Agency;
Lower Severn Internal Drainage Board (IDB)
Wessex Water (contacted - no response received)
2011s4997 SGC FINAL SFRA Level 2 v7.0.doc
9
2. Understanding Flood Risk in South Gloucestershire
2.1 Historic Flooding
The existing database of flooding events from all sources of flood risk has been previously compiled within the Level 1 SFRA using a combination of data from the:
Flood Reconnaissance Information System (FRIS)
South Gloucestershire Council
Avon Fire and Rescue Service
Network Rail,
The historic flooding is most relevant to understanding flood risk and river flooding is the most serious issue. Notable river floods within the catchment have included the events of 1882, 1960 and 1968.
2.2 Topography, Geology, Soils and Hydrology
The boundary encompasses an area of 563 square kilometres. For the purposes of this SFRA, the District area can be delineated into two catchments:
Bristol Avon Catchment
Severn Tidal Catchment
2011s4997 SGC FINAL SFRA Level 2 v7.0.doc
10
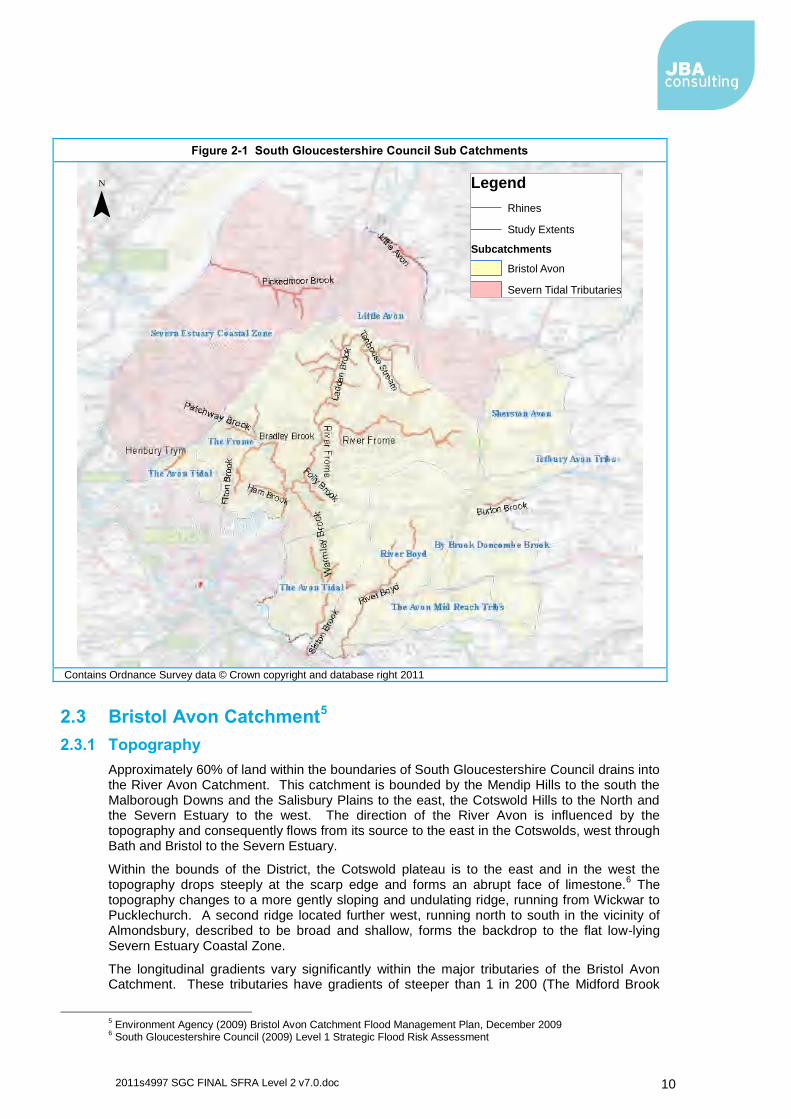
Figure 2-1 South Gloucestershire Council Sub Catchments
Contains Ordnance Survey data © Crown copyright and database right 2011
2.3 Bristol Avon Catchment5
2.3.1 Topography
Approximately 60% of land within the boundaries of South Gloucestershire Council drains into the River Avon Catchment. This catchment is bounded by the Mendip Hills to the south the Malborough Downs and the Salisbury Plains to the east, the Cotswold Hills to the North and the Severn Estuary to the west. The direction of the River Avon is influenced by the topography and consequently flows from its source to the east in the Cotswolds, west through Bath and Bristol to the Severn Estuary.
Within the bounds of the District, the Cotswold plateau is to the east and in the west the topography drops steeply at the scarp edge and forms an abrupt face of limestone.
6 The
topography changes to a more gently sloping and undulating ridge, running from Wickwar to Pucklechurch. A second ridge located further west, running north to south in the vicinity of Almondsbury, described to be broad and shallow, forms the backdrop to the flat low-lying Severn Estuary Coastal Zone.
The longitudinal gradients vary significantly within the major tributaries of the Bristol Avon Catchment. These tributaries have gradients of steeper than 1 in 200 (The Midford Brook
5 Environment Agency (2009) Bristol Avon Catchment Flood Management Plan, December 2009
6 South Gloucestershire Council (2009) Level 1 Strategic Flood Risk Assessment
Legend
Rhines
Study Extents
Subcatchments
Bristol Avon
Severn Tidal Tributaries
¯
2011s4997 SGC FINAL SFRA Level 2 v7.0.doc
11
and By Brook) to less than 1 in 1200 (River Avon).7 The River Frome is one of the steeper
watercourses and has a gradient of between 1 in 200 and 300, over a substantial length.
2.3.2 Geology
The geology can have an effect on the run off (and the flooding) within a catchment as a result of the permeability of the strata. The geology of the Avon catchment is variable. According to the Bristol Avon CFMP the exposed strata increases in age from east to west. Devonion and Silurian strata are the predominant strata with South Gloucestershire Council's area.
The CFMP5 describes a mixture of Triassic mudstones, upper Westphalian and Lower Lias
formations within South Gloucestershire Council's area. Triassic mudstones and Lower Lias (clay) have a low permeability, which can result in greater rates of runoff.
2.3.3 Soils
The CFMP categorises the soils into:
Seasonally wet, deep clay, (slowly permeable)
Shallow calcareous clay (well drained)
Deep clay (slowly permeable)
Calcareous silty soils (well drained)
Deep sandy and coarse loamy soil (well drained)
Calcareous loamy soils (moderately permeable)
Shallow silty over clayey soils (well drained)
Reddish fine and course loamy soils (well drained)
Within South Gloucestershire Council's boundary, the soils have been classified as seasonally wet deep clay and slowly permeable
8
2.3.4 Bristol Avon Subcatchments
Within South Gloucestershire, as shown in Figure 2-1, there are seven sub catchments which drain into the River Avon Catchment. These are:
Sherston Avon
River Boyd Catchment
Tetbury Avon
By Brook
River Frome
Avon Bristol Tidal
The Avon Mid Reach Tributaries
Of these catchments, the River Frome, River Boyd catchment, the By Brook and the Avon Bristol Tidal catchment contains main rivers and tributaries within the South Gloucestershire Council Boundary. The others watercourses have the majority of their catchments within the boundaries of other authorities.
The River Boyd Catchment
The catchment of the River Boyd is contained completely within the study area. The area covers 52 km
2. The river flows in a south westerly direction through Wick and Bitton. The
catchment is predominantly rural and extends beyond the M4 towards Yate/Chipping Sodbury. For the purposes of the Level 2 SFRA, the focus of the study area in the Avon sub catchment is the River Frome and the River Trym, which are discussed in further detail below.
7 Environment Agency (2009) Bristol Avon Catchment Flood Management Plan, December 2009
8 Environment Agency (2009) Bristol Avon Catchment Flood Management Plan, December 2009, p21
2011s4997 SGC FINAL SFRA Level 2 v7.0.doc
12
The River Frome Catchment
The River Frome is a tributary of the River Avon, it flows through the Cotswold Hills, through South Gloucestershire and then southwest to the centre of Bristol. The river rises in Dodington (near Tormarton) and flows past Chipping Sodbury, Yate, Frampton Cotterell, Hambrook and Frenchay. Downstream of Frenchay Mill, the Frome enters the boundaries of Bristol City Council and flows through Stapleton and Eastville Park.
At Eastville, flows in the River Frome are split into culvert to discharge into the Floating Harbour in central Bristol or via the Northern Stormwater Interceptor (NSWI) tunnel into the River Avon at Blackrocks. Normally flows in the River Frome discharge into the culvert section to the Floating Harbour but in times of flood, excess waters in the River Frome are passed over a side weir into a relief culvert at Eastville, known as the Northern Stormwater Interceptor sewer (NSWI).
Much of the length of the main culvert of the River Frome lies beneath highways or open space; however, there are significant lengths, notably between Fairfax Street and Nelson Street, and Nelson Street and Bridewell Lane that are beneath buildings. The Frome culvert is in two sections. Section 1 from Eastville sluices at junction 2 of the M32 flowing through to Junction 3. There is then an open section of channel followed by a second culvert section from Wade Street to the Floating Harbour.
The River Frome is approximately 32 km in length, it crosses the boundary between South Gloucestershire Council and Bristol City Council and there are a number of tributaries that discharge into its upper reaches. The overall catchment size is approximately 180 km² and the River Frome can be split into three distinct sections:
a. The Ladden Brook (South Gloucestershire Council)
b. Upper Frome ( South Gloucestershire Council)
c. Lower Frome ( Bristol City Council)
2011s4997 SGC FINAL SFRA Level 2 v7.0.doc
13
(a) Ladden Brook
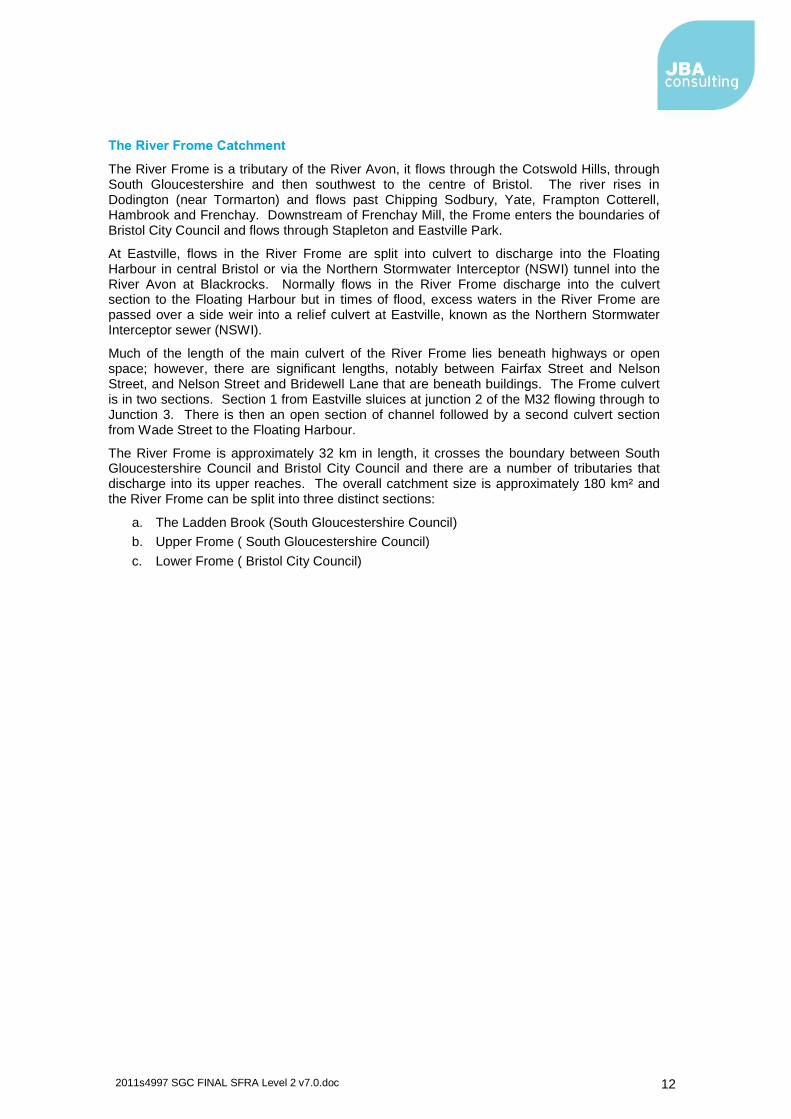
Figure 2-2 Ladden Brook
This map is reproduced from Ordnance Survey material with the permission of Ordnance Survey under the PSMA Member Licence on behalf of the Controller of Her Majesty's Stationery Office Crown copyright. Unauthorised reproduction infringes Crown copyright and may lead to prosecution or civil proceedings. South Gloucestershire Council, March 2011.
Figure 2-2 shows the extent of Ladden Brook. It begins at Sodbury Common and flows in an arc formation, firstly flowing to the north then continuing in a north westerly direction, before continuing south to join with the River Frome at Cog Mill. The Ladden Brook's catchment is mainly rural. There are no Environment Agency maintained defences identified within the area. An agricultural (land drainage) pumping station at Ladden Bows was operational until the 1980s and used to lift surface water over a geological feature on the Ladden Brook, . This has now been abandoned.
¯
LEGEND
Study Extents
LIDAR
metres (m) AOD
High : 75 mAOD
Low :10 mAOD
2011s4997 SGC FINAL SFRA Level 2 v7.0.doc
14
(b) The Upper River Frome
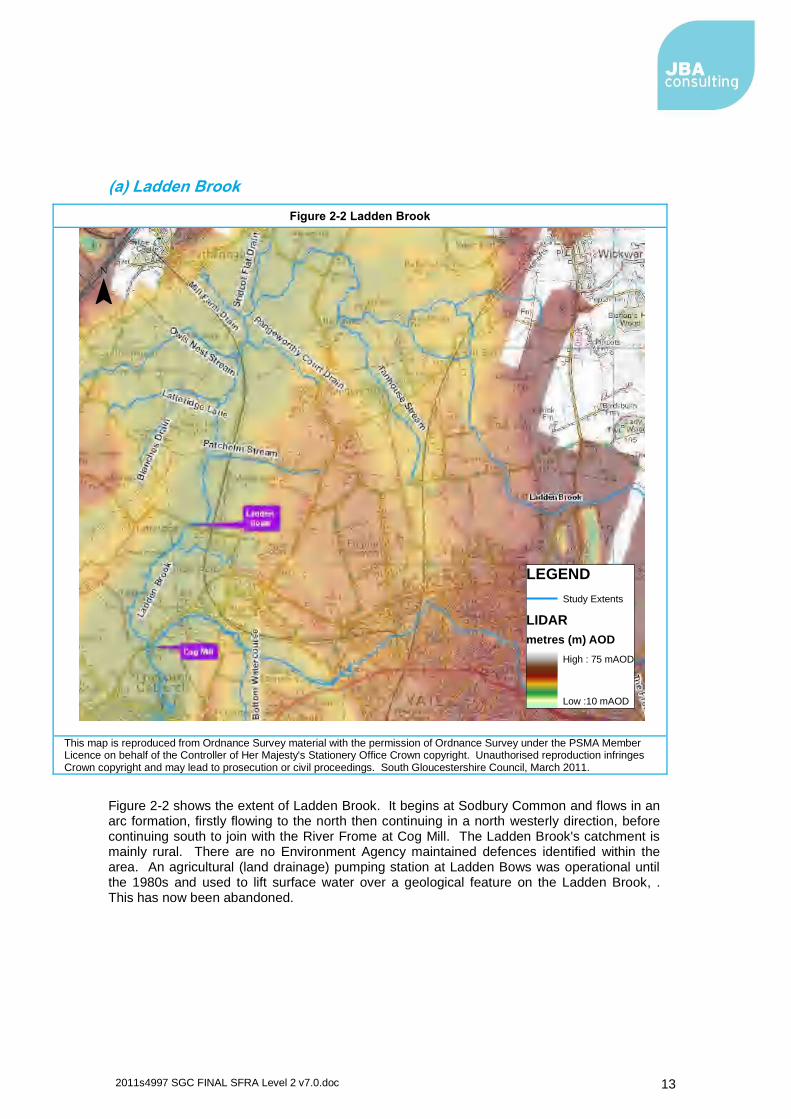
Figure 2-3 Upper River Frome
This map is reproduced from Ordnance Survey material with the permission of Ordnance Survey under the PSMA Member Licence on behalf of the Controller of Her Majesty's Stationery Office Crown copyright. Unauthorised reproduction infringes Crown copyright and may lead to prosecution or civil proceedings. South Gloucestershire Council, March 2011.
The source of the Upper River Frome is at Dodington (near Tormarton) where it flows down through Chipping Sodbury, Yate, Frampton Cotterell, Hambrook, and Frenchay Bridge, see Figure 2-3. The main tributaries of the Upper River Frome include; the Ladden, Folly and Bradley Brook. Bradley Brook provides the dominant input into the Upper River Frome and peak flow values at Frenchay in the upper Frome. The Upper Frome is extensively urbanised.
¯
LEGEND
Study Extents
LIDAR
metres (m) AOD
High : 75 mAOD
Low :10 mAOD
2011s4997 SGC FINAL SFRA Level 2 v7.0.doc
15
(c) The Lower River Frome
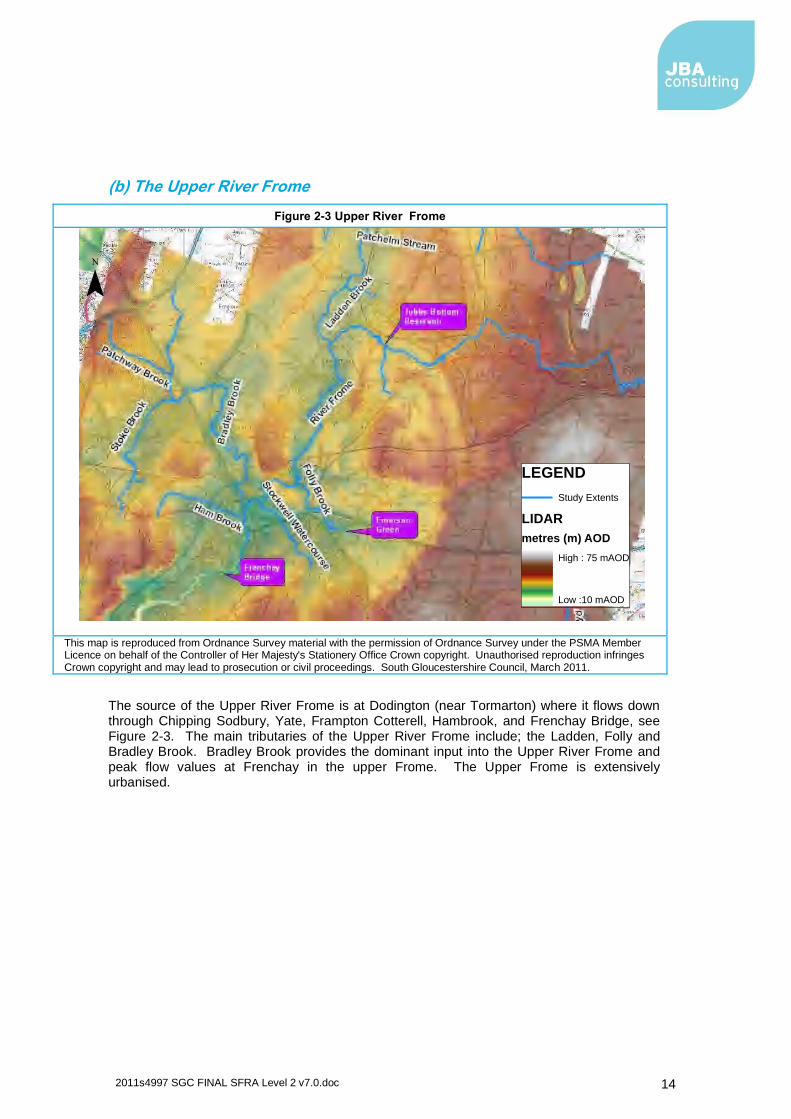
Figure 2-4 Lower Frome
This map is reproduced from Ordnance Survey material with the permission of Ordnance Survey under the PSMA Member Licence on behalf of the Controller of Her Majesty's Stationery Office Crown copyright. Unauthorised reproduction infringes Crown copyright and may lead to prosecution or civil proceedings. South Gloucestershire Council, March 2011.
The upstream limit of the Lower River Frome is at Frenchay Bridge, just at the boundary of South Gloucestershire Council, see Figure 2-4.
Flows are conveyed through the Frome culverts, outside of the bounds of South Gloucestershire, and discharge into the River Avon, via the Mylnes culvert. The Mylnes Culvert begins at Stonegates chamber located at the northern end of St Augustine‟s Parade and outfalls to the River Avon.
Only during periods of excess flows will the Frome discharge into the Floating Harbour via Castle Ditch, Fosseway, Castle Green Tunnel and Stone Gates Weir. There is a potential for the Frome culverts to be tide locked, if the Floating Harbour gets overtopped from the tidal levels into the Cumberland basin.
The NSWI only operates during high flows in the Frome (after the Environment Agency receives a trigger at the Frenchay gauge). The NSWI is a Wessex Water Plc. asset, which they own and maintain. There is an agreed operational procedure with Wessex Water allowing the Environment Agency to divert fluvial high flows into the NSWI. At present, the standard of protection in the city centre is a 1 % AEP but this is heavily dependent on the operation of NSWI and The Frome. There are still uncertainties regarding the standard of protection of these culverts, if a joint fluvial and tidal event were to occur. Bristol City Council
¯
LEGEND
South Gloucestershire Council Boundary
Watercourses
LIDAR
metres AOD
High :75 m AOD
Low : 10 m AOD
2011s4997 SGC FINAL SFRA Level 2 v7.0.doc
16
is undertaking a study to quantify these risks further, at the time of writing this Level 2 SFRA this study had not been finalised. The lower catchment of Frome is heavily urbanised.
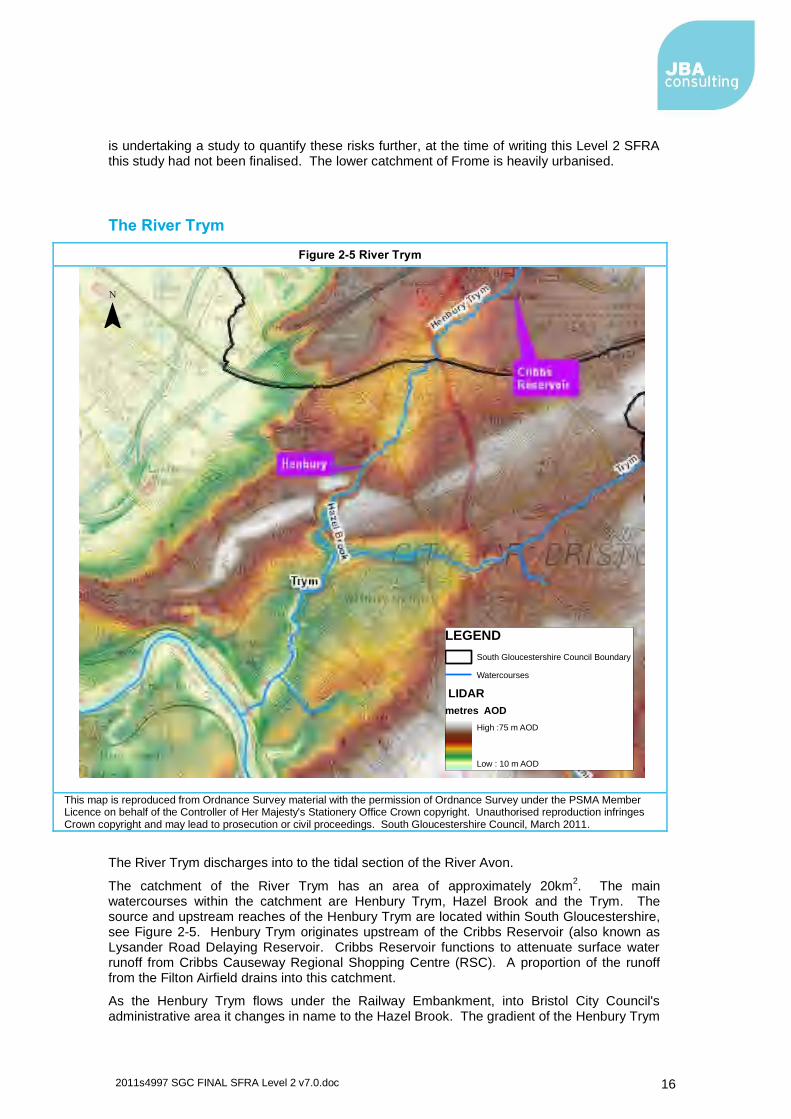
The River Trym
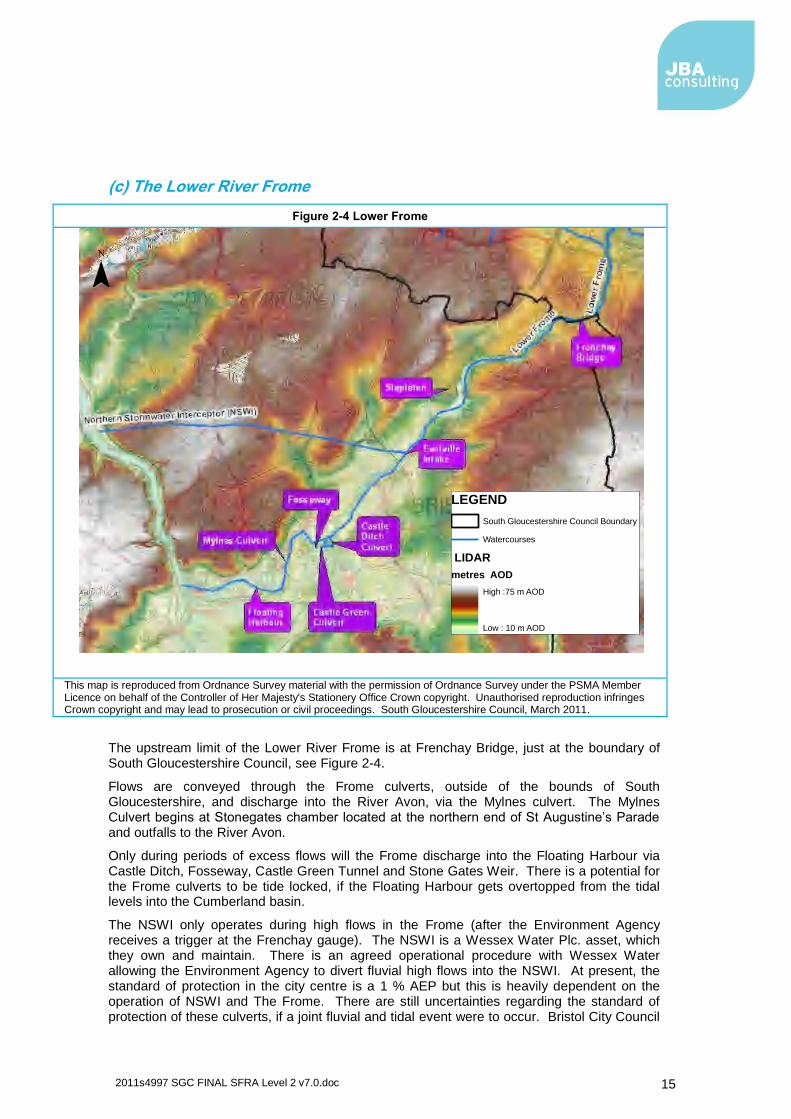
Figure 2-5 River Trym
This map is reproduced from Ordnance Survey material with the permission of Ordnance Survey under the PSMA Member Licence on behalf of the Controller of Her Majesty's Stationery Office Crown copyright. Unauthorised reproduction infringes Crown copyright and may lead to prosecution or civil proceedings. South Gloucestershire Council, March 2011.
The River Trym discharges into to the tidal section of the River Avon.
The catchment of the River Trym has an area of approximately 20km2. The main
watercourses within the catchment are Henbury Trym, Hazel Brook and the Trym. The source and upstream reaches of the Henbury Trym are located within South Gloucestershire, see Figure 2-5. Henbury Trym originates upstream of the Cribbs Reservoir (also known as Lysander Road Delaying Reservoir. Cribbs Reservoir functions to attenuate surface water runoff from Cribbs Causeway Regional Shopping Centre (RSC). A proportion of the runoff from the Filton Airfield drains into this catchment.
As the Henbury Trym flows under the Railway Embankment, into Bristol City Council's administrative area it changes in name to the Hazel Brook. The gradient of the Henbury Trym
¯
LEGEND
South Gloucestershire Council Boundary
Watercourses
LIDAR
metres AOD
High :75 m AOD
Low : 10 m AOD
2011s4997 SGC FINAL SFRA Level 2 v7.0.doc
17
is steep, with ground levels ranging from 52 mAOD at its source to 11mAOD at its convergence with Hazel Brook approximately 3km downstream.
The Hazel Brook continues south - west towards Henbury, passing through the Blaise Castle Estate, where it flows along a steep sided valley until it meets with the River Trym. The Trym flows in a south westerly direction and discharges into the River Avon at Sea Mills.
2.4 Severn Tidal Catchment9
Approximately 40% of South Gloucestershire drains into the River Severn, and thus into a tidal environment. The low lying land in this catchment is generally flat. Many of these low lying areas have been influenced by man over many centuries, including straightening of channels, dredging or bank stabilisation. This area is characterised by the Rhines, streams and ditches that discharge into the Severn Estuary.
Geology in the Severn Tidal Catchment can be divided into clays and mudstones located across the wide Severn Valley and limestone and sandstones can be found in the higher ground located at the Forest of Dean and the Cotswolds.
The soil classification within the catchment can again be split into two broad categories
1. With well drained, fine- and silty-soils located in the Cotswolds, which is susceptible to erosion.
2. Clayey soils are the predominant feature across the flatter Severn Valley. These clays are prone to water logging.
The Severn Tidal Tributaries CFMP covers an area of over 1,000 km2 and is made up of six
sub catchments, each draining into the River Severn downstream of Gloucester. These sub catchments are:
Avonmouth,
Little Avon and River Cam,
River Frome (Stroud),
Gloucester streams (including the Dimore Brook, Sud Brook, River Twyver, Daniels Brook and Wotton Brook,
Westbury Brook and Walmore Common,
Forest of Dean (including the River Lyd and Cinderford Streams).
Of the Severn Tidal sub catchments, only two are within the boundaries of South Gloucestershire Council; Avonmouth and Little Avon. Only a small proportion of the main river of Little Avon is contained within the north of the study area. For the purposes of this study, only the Pickedmoor Brook in the Avonmouth catchment is considered.
9 Environment Agency - Severn Tidal Tributaries CFMP (December 2009)
2011s4997 SGC FINAL SFRA Level 2 v7.0.doc
18
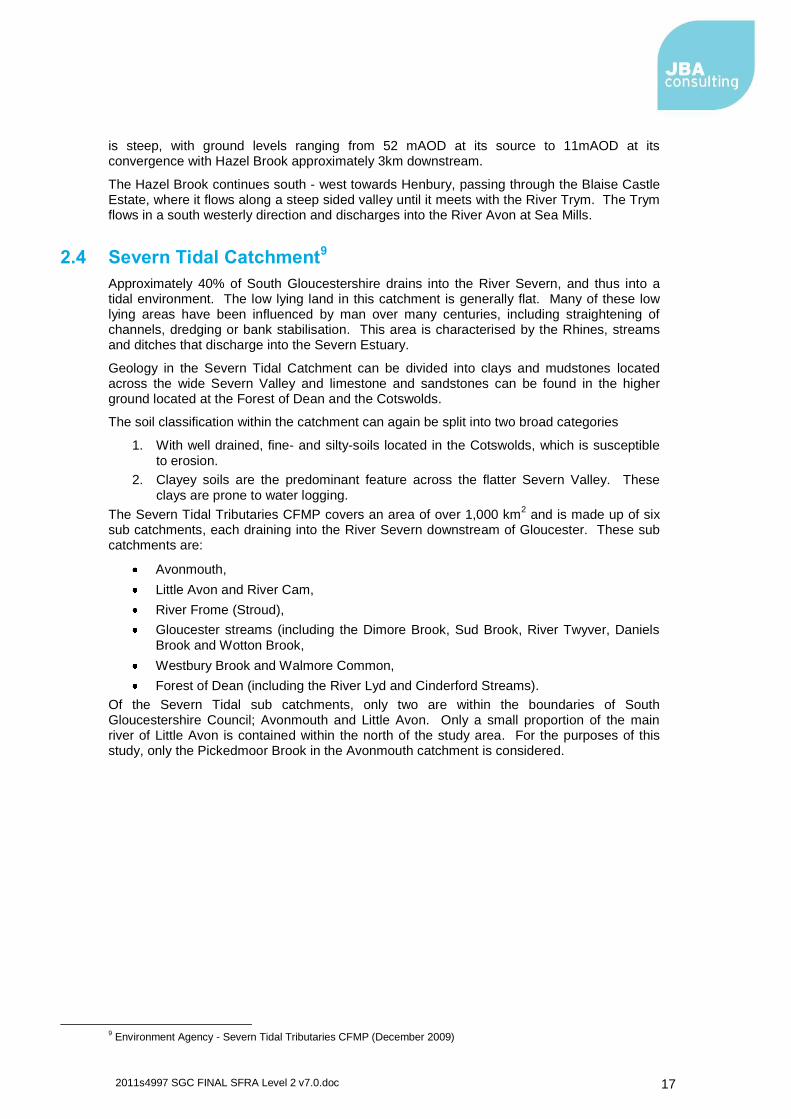
Pickedmoor Brook
Figure 2-6 Pickedmoor Brook
This map is reproduced from Ordnance Survey material with the permission of Ordnance Survey under the PSMA Member Licence on behalf of the Controller of Her Majesty's Stationery Office Crown copyright. Unauthorised reproduction infringes Crown copyright and may lead to prosecution or civil proceedings. South Gloucestershire Council, March 2011.
The Pickedmoor Brook catchment area is 13 km2
(calculated at Oldbury). The Pickedmoor Brook is a non-main watercourse/ ordinary watercourse falling under the jurisdiction of the Local Authority and the Lower Severn Internal Drainage Board. The Local Authority and the Lower Severn Internal Drainage Board have similar permissive powers as the Environment Agency in relation to flood defence work. However, the responsibility of maintenance for ordinary watercourses lies with the riparian owner. Pickedmoor Brook is located in the Severn Estuary Lowlands, see Figure 2-6. Its source is at Milbury Heath. It flows west through Thornbury. The brook continues in a westerly direction to join the rhine system at the east of Oldbury, where flows then discharge into the Severn Estuary.
The main risk addressed in the Level 2 SFRA is the potential impact increased flows from proposed development will have on land downstream of Thornbury, particularly with respect to the impact on the network of rhines.
The network of rhines is a complex system of drains or ditches serving to convey flows away from agricultural land in the Lower Severn Internal Drainage Board. This area is at risk from tidal flooding from the Severn Estuary and is prone to tide locking. The tidal area extends from Oldbury to the Severn Estuary, see Figure 2-6.
¯
Legend
South Gloucestershire Boundary
Rhines
Watercourses
LIDAR
metres AOD
High :75 m AOD
Low : 10 m AOD
2011s4997 SGC FINAL SFRA Level 2 v7.0.doc
19
2.5 How Flood Risk is Assessed
2.5.1 Definitions
A Flood is now formally defined in the Flood and Water Management Act as
"including cases where land not normally covered by water becomes covered by water and can be the result of water emanating from a number of sources".
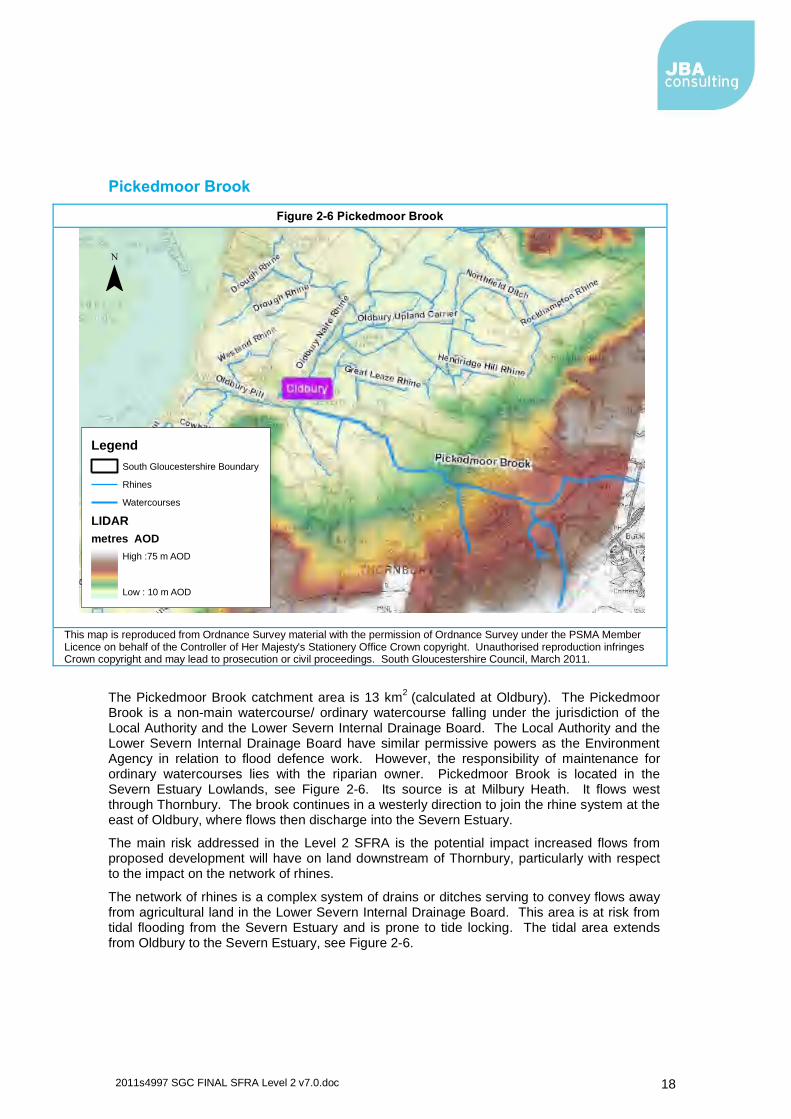
PPS 25 states that flood risk is the combination of the statistical probability of a flood occurring and the scale of its potential consequences, whether inland or on the coast and includes consideration of development located outside of the river and tidal flood risk areas. Thus it is possible to define flood risk as:
Flood Risk = (Probability of a flood) x (scale of the consequences)
On that basis it is useful to express the definition as follows:
Using this definition it can be seen that:
Increasing the probability or chance of a flood increases the flood risk. Thus in situations where the probability of a flood being experienced increases gradually over time (say as a consequence of increased flood frequency due to climate change effects) then the magnitude of the risk will increase. It follows that in locations
affected by climate change effects the flood risk will increase if no action is taken;
The scale of the consequences can increase the flood risk. The scale of the consequences can be increased by:
o Flood Hazard Magnitude - if the direct hazard posed by the depth of flooding, the velocity of the flow, the speed of onset or the rate of rise in flood water or the duration of inundation is increased then the consequences of flooding are increased [and so is the flood risk];
o Receptor presence - The consequences of a flood will be increased if there are more receptors affected. Thus the consequences can be increased if the extent and frequency of flooding affects more people, property or infrastructure. Additionally the consequences will be increased [and so is the flood risk] if there is new development that increases the probability of flooding (for instance by causing an increase in the volume of runoff from new paved areas) or increases the density of infrastructure in areas known to
flood; and
o Receptor vulnerability - The consequences will be increased if the vulnerability of the people, property or infrastructure is increased. For example old or very young people are more vulnerable if there is a flood and hence if they were present in greater numbers the consequences of a flood
would be increased [and so is the flood risk].
The risk must be assessed for flooding from all main sources and these are flooding from:
The sea;
Main rivers;
Reservoirs;
Surface runoff from the land and surface water from drainage systems (caused by heavy rainfall);
Ordinary watercourses;
Consequences = X
X X Flood Hazard
Magnitude Receptor presence
Receptor
Vulnerability
Probability Flood
Risk
2011s4997 SGC FINAL SFRA Level 2 v7.0.doc
20
Groundwater; and
Artificial sources.
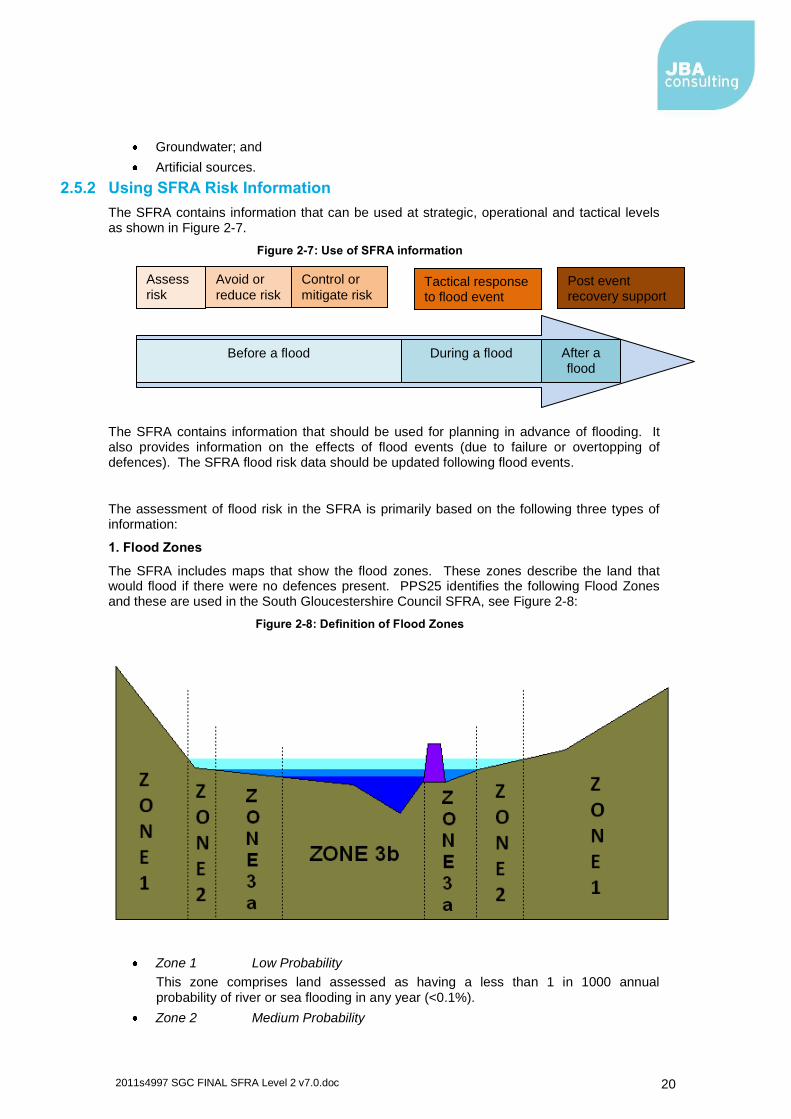
2.5.2 Using SFRA Risk Information
The SFRA contains information that can be used at strategic, operational and tactical levels as shown in Figure 2-7.
Figure 2-7: Use of SFRA information
The SFRA contains information that should be used for planning in advance of flooding. It also provides information on the effects of flood events (due to failure or overtopping of defences). The SFRA flood risk data should be updated following flood events.
The assessment of flood risk in the SFRA is primarily based on the following three types of information:
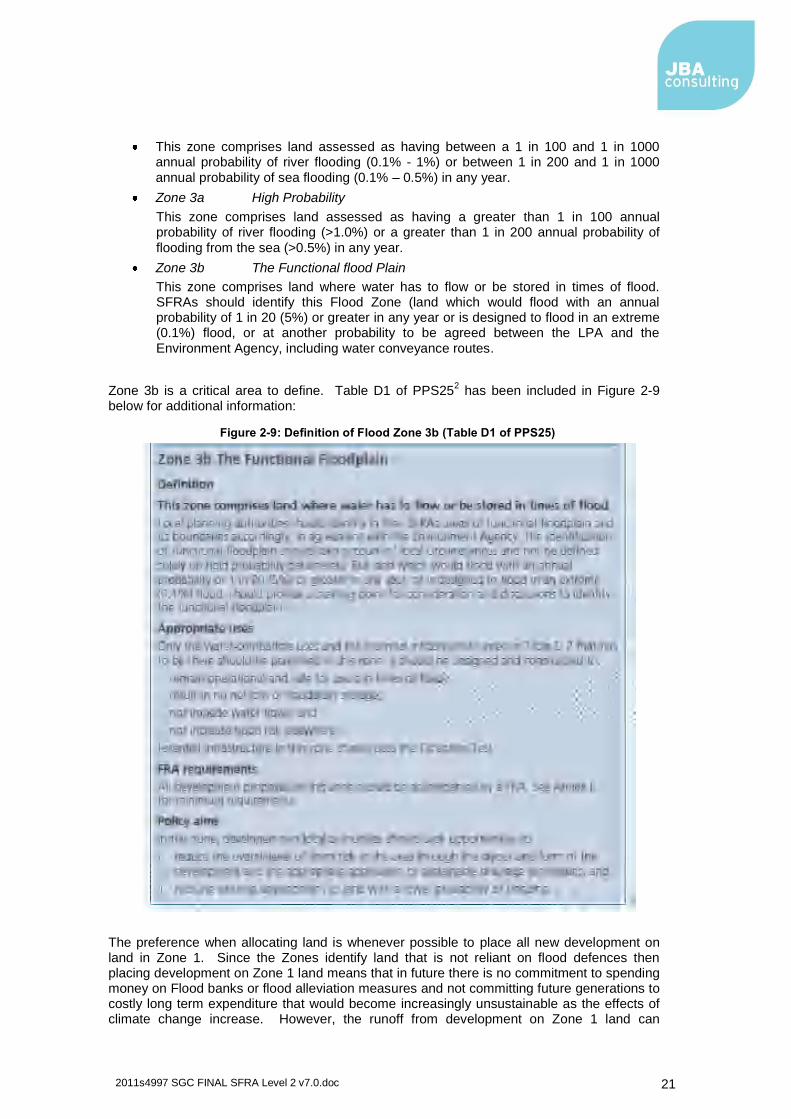
1. Flood Zones
The SFRA includes maps that show the flood zones. These zones describe the land that would flood if there were no defences present. PPS25 identifies the following Flood Zones and these are used in the South Gloucestershire Council SFRA, see Figure 2-8:
Figure 2-8: Definition of Flood Zones
Zone 1 Low Probability
This zone comprises land assessed as having a less than 1 in 1000 annual probability of river or sea flooding in any year (<0.1%).
Zone 2 Medium Probability
Avoid or
reduce risk
Assess risk
Control or
mitigate risk Tactical response to flood event
Post event recovery support
Before a flood During a flood After a
flood
2011s4997 SGC FINAL SFRA Level 2 v7.0.doc
21
This zone comprises land assessed as having between a 1 in 100 and 1 in 1000 annual probability of river flooding (0.1% - 1%) or between 1 in 200 and 1 in 1000
annual probability of sea flooding (0.1% – 0.5%) in any year.
Zone 3a High Probability
This zone comprises land assessed as having a greater than 1 in 100 annual probability of river flooding (>1.0%) or a greater than 1 in 200 annual probability of
flooding from the sea (>0.5%) in any year.
Zone 3b The Functional flood Plain
This zone comprises land where water has to flow or be stored in times of flood. SFRAs should identify this Flood Zone (land which would flood with an annual probability of 1 in 20 (5%) or greater in any year or is designed to flood in an extreme (0.1%) flood, or at another probability to be agreed between the LPA and the Environment Agency, including water conveyance routes.
Zone 3b is a critical area to define. Table D1 of PPS252 has been included in Figure 2-9
below for additional information:
Figure 2-9: Definition of Flood Zone 3b (Table D1 of PPS25)
The preference when allocating land is whenever possible to place all new development on land in Zone 1. Since the Zones identify land that is not reliant on flood defences then placing development on Zone 1 land means that in future there is no commitment to spending money on Flood banks or flood alleviation measures and not committing future generations to costly long term expenditure that would become increasingly unsustainable as the effects of climate change increase. However, the runoff from development on Zone 1 land can
2011s4997 SGC FINAL SFRA Level 2 v7.0.doc
22
potentially cause an increase in the probability of flooding to existing downstream development. Information in the SFRA should be used to address this issue.
2. Actual Flood Risk
If it has not been possible for all future development to be situated in Zone 1 then a more detailed assessment is needed to understand the implications of locating proposed development in zones 2 or 3. This is accomplished by considering information on the “actual risk” of flooding. The assessment of actual risk takes account of the presence of flood defences and provides a picture of the safety of existing and proposed development. It should be understood that the standard of protection afforded by flood defences is not constant and it is presumed that the required minimum standards for new development are:
Residential development should be protected against and flooding with an annual
probability of river flooding of 1% in any year; and
Residential development should be protected against flooding with an annual
probability of tidal (sea) flooding of 0.5% in any year.
The assessment of the actual risk should take the following issues into account:
The level of protection afforded by existing defences might be less than the appropriate standards and hence may need to be improved if further growth is
contemplated;
The flood risk management policy for the defences will provide information on the level of future commitment to maintain existing standards of protection. If there is a conflict between the proposed level of commitment and the future needs to support growth then it will be a priority for the Flood Risk Management Strategy to be reviewed;
The standard of safety must be maintained for the intended lifetime of the development (assumed to be 100 years for residential development). Over time the effects of climate change will erode the present day standard of protection afforded by defences and so commitment is needed to invest in the maintenance and upgrade
of defences if the present day levels of protection are to be maintained; and
The assessment of actual risk can include consideration of the magnitude of the hazard posed by flooding. By understanding the depth, velocity, speed of onset and rate of rise of floodwater it is possible to assess the level of hazard posed by flood events from the respective sources. This assessment will be needed in circumstances where consideration is given to the mitigation of the consequences of flooding or where it is proposed to place lower vulnerability development in areas that are at risk from inundation.
Those using the South Gloucestershire Level 2 SFRA should refer to the Environment Agency's National Flood and Coastal Defence Dataset (NFCDD) for details on the standard of protection of defences.
3. Residual Risk
The residual risk refers to the risks that remain in circumstances where measures have been taken to alleviate flooding. It is important that these risks are quantified to confirm that the consequences can be safely managed. The residual risk can be:
The effects of a flood with a magnitude greater than that for which the defences or management measures have been designed to alleviate. This can result in over topping of flood banks, failure of flood gates to cope with the level of flow or failure of
pumping systems to cope with the incoming discharges; or
2011s4997 SGC FINAL SFRA Level 2 v7.0.doc
23
Failure of the defences or flood risk management measures to perform their intended duty. This could be breach failure of flood embankments, failure of flood gates to
operate in the intended manner or failure of pumping stations.
The assessment of residual risk demands that attention be given to the vulnerability of the receptors and the response to managing the resultant flood emergency. In this instance attention should be paid to the characteristics of flood emergencies and the roles and responsibilities during such events.
2.6 Understanding Flooding in South Gloucestershire
2.6.1 Introduction
The following techniques have been used to assess the probability and magnitude of flooding:
An inventory of historic flooding has been used in the Level 1 SFRA and the PFRA.
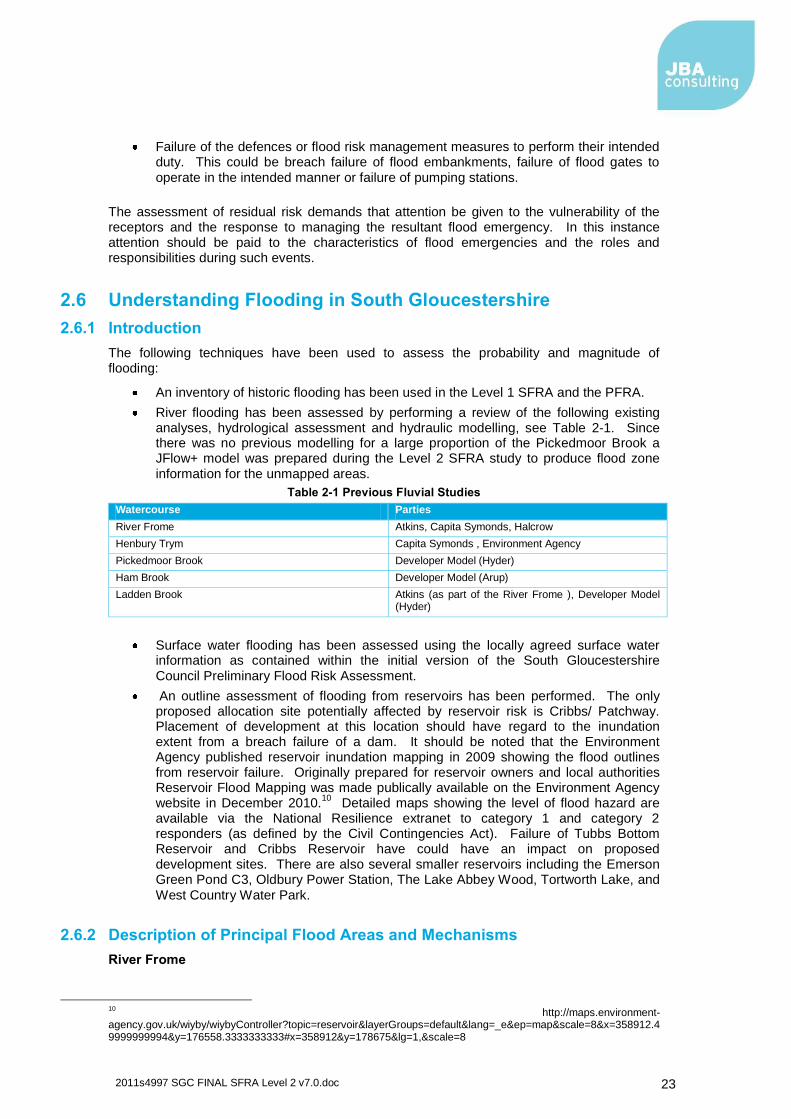
River flooding has been assessed by performing a review of the following existing analyses, hydrological assessment and hydraulic modelling, see Table 2-1. Since there was no previous modelling for a large proportion of the Pickedmoor Brook a JFlow+ model was prepared during the Level 2 SFRA study to produce flood zone
information for the unmapped areas.
Table 2-1 Previous Fluvial Studies
Watercourse Parties
River Frome Atkins, Capita Symonds, Halcrow
Henbury Trym Capita Symonds , Environment Agency
Pickedmoor Brook Developer Model (Hyder)
Ham Brook Developer Model (Arup)
Ladden Brook Atkins (as part of the River Frome ), Developer Model (Hyder)
Surface water flooding has been assessed using the locally agreed surface water information as contained within the initial version of the South Gloucestershire
Council Preliminary Flood Risk Assessment.
An outline assessment of flooding from reservoirs has been performed. The only proposed allocation site potentially affected by reservoir risk is Cribbs/ Patchway. Placement of development at this location should have regard to the inundation extent from a breach failure of a dam. It should be noted that the Environment Agency published reservoir inundation mapping in 2009 showing the flood outlines from reservoir failure. Originally prepared for reservoir owners and local authorities Reservoir Flood Mapping was made publically available on the Environment Agency website in December 2010.
10 Detailed maps showing the level of flood hazard are
available via the National Resilience extranet to category 1 and category 2 responders (as defined by the Civil Contingencies Act). Failure of Tubbs Bottom Reservoir and Cribbs Reservoir have could have an impact on proposed development sites. There are also several smaller reservoirs including the Emerson Green Pond C3, Oldbury Power Station, The Lake Abbey Wood, Tortworth Lake, and
West Country Water Park.
2.6.2 Description of Principal Flood Areas and Mechanisms
River Frome
10
http://maps.environment-agency.gov.uk/wiyby/wiybyController?topic=reservoir&layerGroups=default&lang=_e&ep=map&scale=8&x=358912.49999999994&y=176558.3333333333#x=358912&y=178675&lg=1,&scale=8
2011s4997 SGC FINAL SFRA Level 2 v7.0.doc
24
The River Frome reacts rapidly to rainfall, as was seen in the floods of 1968. Key locations, within South Gloucestershire Boundary that are known to be at risk of flooding along the River Frome are:
St John's Way, Chipping Sodbury
Celestine Road, Yate
Nibley Lane, Iron Acton
Rectory Road, Frampton Cotterell
The Dingle Winterbourne (confluence of Folly Brook)
Further locations have been identified as being at risk of flooding from the following watercourses:
Bradley Brook
o Juniper Way, Bradley Stoke South
Filton Brook
o New Road, Filton
Stoke Brook
o Bush Avenue, Little Stoke
Folly Brook
o Emersons Green North
Historically, the general management regime within the River Frome catchment was to attenuate discharges from watercourses to the east of the catchment, whilst allowing flows from the western side to drain freely and quickly. The aim was to enable faster catchments to discharge to the River Frome before the attenuated flood peak from the eastern side of the catchment passes. In this sense, contributions from the upper Frome as a result of Tubbs Bottom Washland, and Folly Brook, as a result of Emerson Green Pond C3 and others, were and continue to be attenuated, whilst the Ladden Brook and Bradley Brook catchments were encouraged to drain freely.
Tubbs Bottom detention reservoir is an essential flood control structure in the Frome catchment. The Tubbs Bottom detention reservoir (built 1981) is designed and operated to retain inflows in excess of 12 cumecs
11. Previous studies indicated that Tubbs Bottom
controls flows at Frenchay and Eastville by attenuating in the upper Catchment of the Frome. This allows the flows from the Bradley Brook to pass through Frenchay/Eastville in advance of peak flows from the upper catchment. The 1% Annual Exceedance Probability (AEP) flood (80 cumecs) can be conveyed through the River Frome and NSWI culvert system but there is no additional capacity under the current conditions, without Tubbs Bottom would reduce this standard of service.
As discussed in Section 2.3.4, in normal flow conditions, the Frome enters into culverts, downstream of the boundary of South Gloucestershire, through Mylnes Culvert and into the Floating Harbour. In times of extreme flows the Frome enters the Floating Harbour via a series of culverts, Castle Green, Castle Drain and Fosseway. As stated above, the NSWI only operates during high flows in the Frome (after the Environment Agency receives a trigger at the Frenchay gauge). The current Standard of Protection (SoP) in Bristol City centre is stated to be 1% AEP, but this is reliant on the efficient operation of the NSWI and Eastville Intake.
The aim of the Level 2 SFRA is to assess the potential impact of the proposed developments within the catchment of the River Frome, especially at the critical point of the Eastville and to investigate whether there are strategic options available that may be able to reduce risk at these points. This is discussed further in Section 6.
River Trym
11
Atkins (2004), Bristol Frome Flood Management Strategy Phase 2, Preliminary Strategic Review
2011s4997 SGC FINAL SFRA Level 2 v7.0.doc
25
In the upper reaches of the Trym (Henbury Trym), Cribbs Reservoir is the main feature. It was initially designed to attenuate excess surface water flows from the Cribbs Causeway Regional Shopping Centre development. Recent works have been completed to the operation structures; however these works do not reduce the level of flood risk downstream.
12
Areas vulnerable to fluvial inundation from the 1% AEP event on the Trym are located on Westfield road, Westbury, Passage Road, upstream of the A4018, Tomarton Crescent and on Henbury Road and at Southmead. With the exception of Passage Road, these areas are outside South Gloucestershire Council boundaries.
Strategic options have not been considered for the River Trym within this study.
Pickedmoor Brook
Two models have been prepared to classify the present level of flood risk within this area. One is a developer model used to support a proposed development at Park Farm, Thornbury. The other was produced specifically as part of this study to establish Flood Zones for the remaining length of watercourse. This analysis shows there is predicted to be an accumulation of flood water upstream of Morton Way on the Pickedmoor Brook at the north-east of Thornbury.
The aim of this study is to consider the impact proposed development may have on the rhine watercourse and rhine system downstream of Thornbury.
2.7 Possible Responses to Flooding
2.7.1 Assess
The first response to flooding must be to understand the nature and frequency of the risk. The assessment of risk is not just performed as a "one off" during the process, but rather the assessment of risk should be performed during all subsequent stages of responding to flooding.
2.7.2 Avoid
The sequential approach requires that the first response is to avoid the hazard. If it is possible to place all new growth in areas at a low probability of flooding then the flood risk management considerations will relate solely to ensuring that proposed development does not increase the probability of flooding to others. This can be achieved by implementing SuDS systems and other measures to control and manage run-off. In some circumstances it might be possible to include measures within proposed growth areas that reduce the probability of flooding to others and assist existing communities to adapt to the effects of climate change. In such circumstances the growth proposals should include features that can deliver the necessary levels of mitigation so that the standards of protection and probability of flooding are not reduced by the effects of climate change. In South Gloucestershire, consideration should be given not only to the peak flows generated by new development but also to the volumes generated during longer duration storm events, specifically the impact such volumes could have on the following;
The River Frome corridor,
Eastville Intake,
The Pickedmoor Brook and the rhine network downstream of Thornbury
the urban extents downstream of Cribbs Causeway Regional Shopping Centre , Patchway, Filton, Little Stoke and Bradley Stoke South.
2.7.3 Substitute, Control and Mitigate
These responses all involve management of the flood risk and thus require an understanding of the consequences (the magnitude of the flood hazard and the vulnerability of the receptor).
12
Environment Agency (2011) River Trym Standard of Protection Study
2011s4997 SGC FINAL SFRA Level 2 v7.0.doc
26
There are opportunities to reduce the flood risk by lowering the vulnerability of the proposed development. For instance changing existing residential land to commercial uses will reduce the risk provided that the residential land can then be located on land in a lower risk flood zone.
Flood risk management responses in circumstances where there is a need to consider growth or regeneration in areas that are affected by a medium or high probability will include:
Strategic measures to maintain or improve the standard of flood protection so that the growth can be implemented safely for the lifetime of the development (must include provisions to invest in infrastructure that can adapt to the increased chance and severity of flooding presented by climate change);
Design measures so that the proposed development includes features that enables the infrastructure to adapt to the increased probability and severity of flooding whilst ensuring that new communities are safe and that the risk to others is not increased (preferably reduced);
Flood resilient measures that reduce the consequences of flooding to infrastructure so that the magnitude of the consequences is reduced. Such measures would need to be considered alongside improved flood warning, evacuation and welfare procedures so that occupants affected by flooding could be safe for the duration of a flood event and rapidly return to properties after an event had been experienced.
It would be necessary to address the necessary commitment and provisions for the long term management and maintenance of all measures to control and mitigate flooding, where they have to be deployed.
2.8 Policy Considerations
At the time of preparing this Level 2 SFRA principal documents that influence this SFRA are the Bristol Avon CFMP and the Severn Tidal Tributaries CFMP.
The key objective of a CFMP is to develop complementary policies for long-term management of flood risk within the catchment that take into account the likely impacts of changes in climate, the effects of land use and land management, deliver multiple benefits and contribute towards sustainable development (CFMP: volume I – policy guidance, 2004).
As part of the CFMP process each CFMP area was divided up into broad areas (known as „policy units‟), which represent areas of similar characteristics, similar flood mechanisms and similar flood risks. Each policy unit was then assessed to decide which policy will provide the most appropriate level and direction of flood risk management both now and in the future.
One of six standard flood risk management policies has been applied to each policy unit:
Policy 1 – No active intervention (including flood warning and maintenance). Continue to monitor and advice.
Policy 2 – Reduce existing flood risk management actions (accepting that flood risk
will increase over time).
Policy 3 – Continue with existing or alternative actions to manage flood risk at the current level.
Policy 4 – Take further action to sustain the current level of flood risk into the future (responding to the potential increases in risk from urban development, land use
change and climate change).
Policy 5 – Take further action to reduce flood risk.
Policy 6 – Take action to increase the frequency of flooding to deliver benefits locally or elsewhere (which may constitute an overall flood risk reduction, e.g. for habitat inundation).
The proposed CFMP policies affecting South Gloucestershire are summarised below and their policy units are illustrated in Figure 2-10 and Figure 2-11.
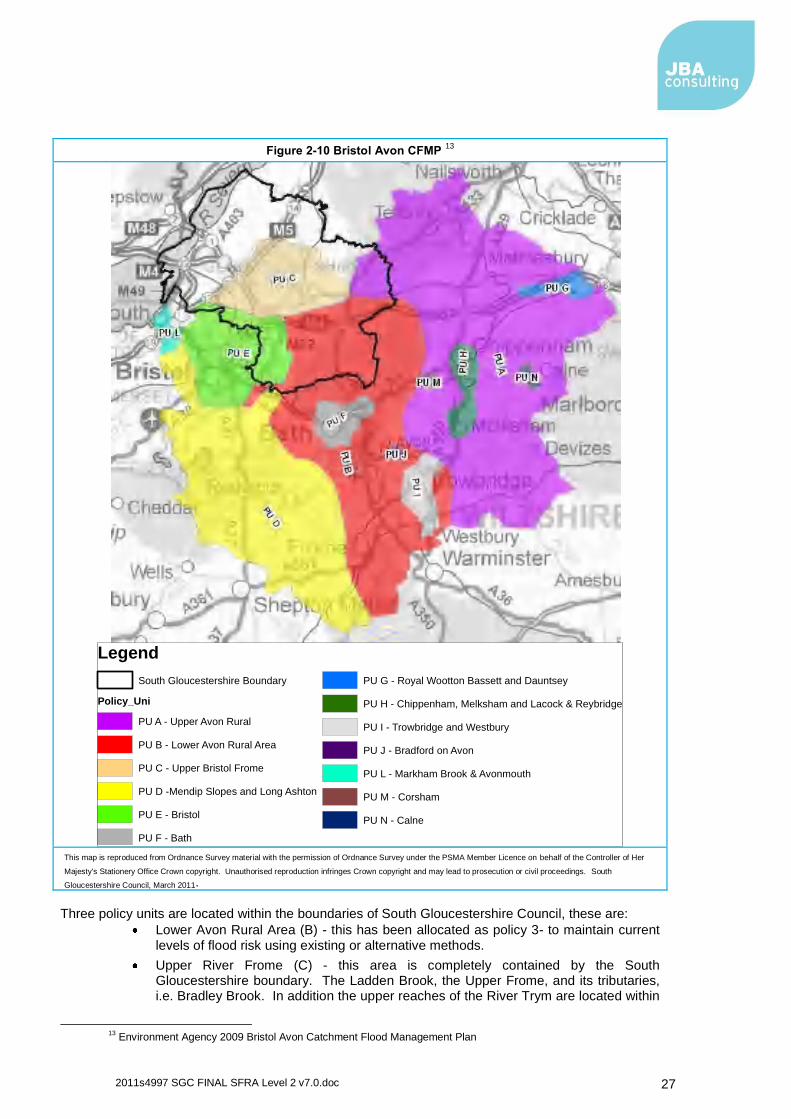
2011s4997 SGC FINAL SFRA Level 2 v7.0.doc
27
Figure 2-10 Bristol Avon CFMP 13
Legend
South Gloucestershire Boundary
Policy_Uni
PU A - Upper Avon Rural
PU B - Lower Avon Rural Area
PU C - Upper Bristol Frome
PU D -Mendip Slopes and Long Ashton
PU E - Bristol
PU F - Bath
PU G - Royal Wootton Bassett and Dauntsey
PU H - Chippenham, Melksham and Lacock & Reybridge
PU I - Trowbridge and Westbury
PU J - Bradford on Avon
PU L - Markham Brook & Avonmouth
PU M - Corsham
PU N - Calne
This map is reproduced from Ordnance Survey material with the permission of Ordnance Survey under the PSMA Member Licence on behalf of the Controller of Her
Majesty's Stationery Office Crown copyright. Unauthorised reproduction infringes Crown copyright and may lead to prosecution or civil proceedings. South
Gloucestershire Council, March 2011.
Three policy units are located within the boundaries of South Gloucestershire Council, these are:
Lower Avon Rural Area (B) - this has been allocated as policy 3- to maintain current levels of flood risk using existing or alternative methods.
Upper River Frome (C) - this area is completely contained by the South Gloucestershire boundary. The Ladden Brook, the Upper Frome, and its tributaries, i.e. Bradley Brook. In addition the upper reaches of the River Trym are located within
13
Environment Agency 2009 Bristol Avon Catchment Flood Management Plan
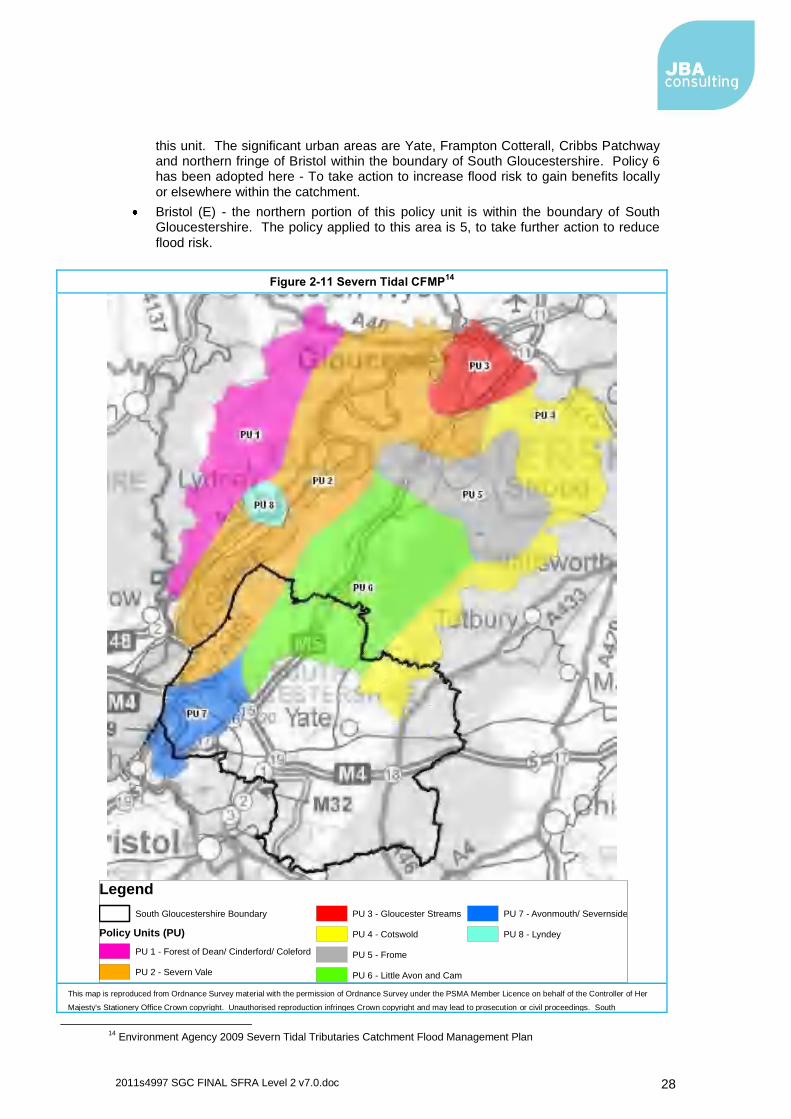
2011s4997 SGC FINAL SFRA Level 2 v7.0.doc
28
this unit. The significant urban areas are Yate, Frampton Cotterall, Cribbs Patchway and northern fringe of Bristol within the boundary of South Gloucestershire. Policy 6 has been adopted here - To take action to increase flood risk to gain benefits locally or elsewhere within the catchment.
Bristol (E) - the northern portion of this policy unit is within the boundary of South Gloucestershire. The policy applied to this area is 5, to take further action to reduce
flood risk.
Figure 2-11 Severn Tidal CFMP14
Legend
South Gloucestershire Boundary
Policy Units (PU)
PU 1 - Forest of Dean/ Cinderford/ Coleford
PU 2 - Severn Vale
PU 3 - Gloucester Streams
PU 4 - Cotswold
PU 5 - Frome
PU 6 - Little Avon and Cam
PU 7 - Avonmouth/ Severnside
PU 8 - Lyndey
This map is reproduced from Ordnance Survey material with the permission of Ordnance Survey under the PSMA Member Licence on behalf of the Controller of Her
Majesty's Stationery Office Crown copyright. Unauthorised reproduction infringes Crown copyright and may lead to prosecution or civil proceedings. South
14
Environment Agency 2009 Severn Tidal Tributaries Catchment Flood Management Plan
2011s4997 SGC FINAL SFRA Level 2 v7.0.doc
29
Gloucestershire Council, March 2011.
Figure 2-11 shows the policy units for the Severn Tidal Tributaries CFMP. The units that relate to South Gloucestershire Council are:
Avonmouth/ Severnside (7) -Policy 4 has been adopted - to take further action to sustain the current level of flood risk into the future (responding to the potential
increases in risk from urban development, land use change and climate change
Severn Vale (2) - contains the Lower Severn Internal Drainage Board network of rhines. Policy 3 applies - to maintain current levels of flood risk using existing or
alternative methods.
Little Avon and Cam (6) - The urban areas of Thornbury, Berkeley, Charfield, Wotton-under-Edge and Dursley are located in this policy unit area. In this Policy unit, policy 3 is used - to continue with existing or alternative actions to manage flood risk at the
current level.
Cotswold (4) - Policy 6 applies - to take action with others to store water or manage run-off in locations that provide overall flood risk reduction or environmental benefits,
locally or elsewhere in the catchment.
The policies in the CFMP have been prepared using evidence that assess the current conditions and estimates the effects of future changers due to climate change.

2011s4997 SGC FINAL SFRA Level 2 v7.0.doc
30
This page is intentionally left blank.
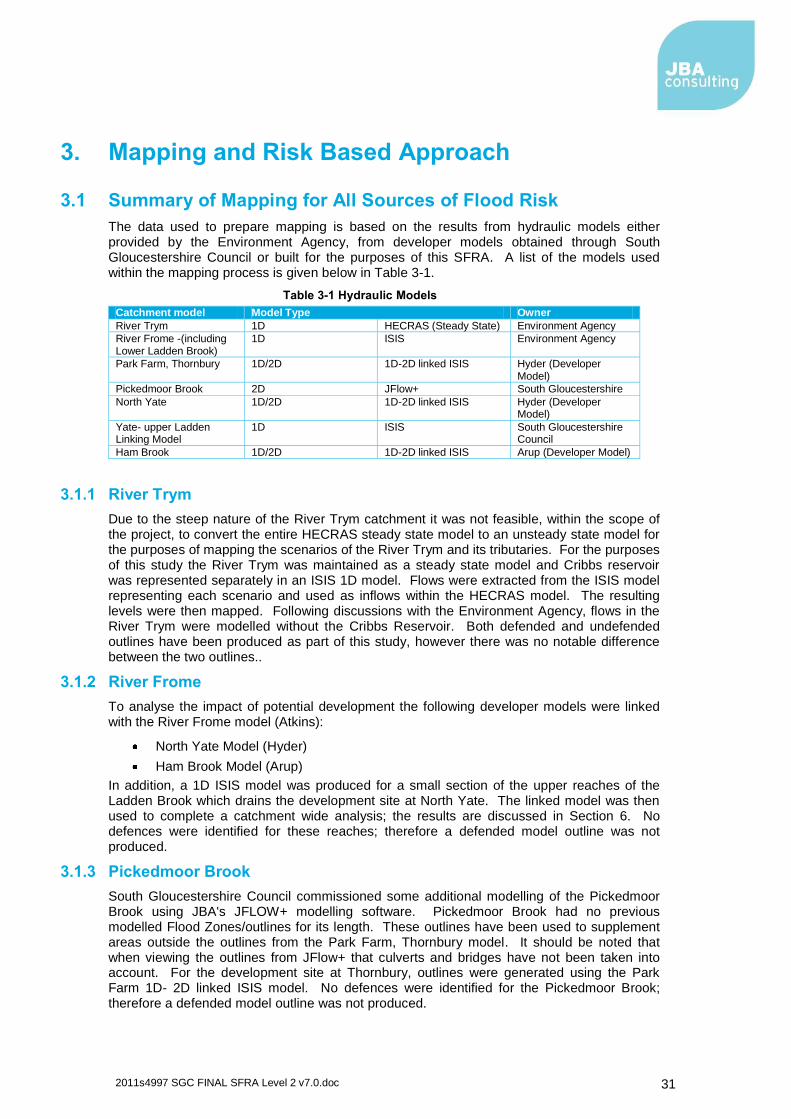
2011s4997 SGC FINAL SFRA Level 2 v7.0.doc
31
3. Mapping and Risk Based Approach
3.1 Summary of Mapping for All Sources of Flood Risk
The data used to prepare mapping is based on the results from hydraulic models either provided by the Environment Agency, from developer models obtained through South Gloucestershire Council or built for the purposes of this SFRA. A list of the models used within the mapping process is given below in Table 3-1.
Table 3-1 Hydraulic Models
Catchment model Model Type Owner
River Trym 1D HECRAS (Steady State) Environment Agency
River Frome -(including Lower Ladden Brook)
1D ISIS Environment Agency
Park Farm, Thornbury 1D/2D 1D-2D linked ISIS Hyder (Developer Model)
Pickedmoor Brook 2D JFlow+ South Gloucestershire
North Yate 1D/2D 1D-2D linked ISIS Hyder (Developer Model)
Yate- upper Ladden Linking Model
1D ISIS South Gloucestershire Council
Ham Brook 1D/2D 1D-2D linked ISIS Arup (Developer Model)
3.1.1 River Trym
Due to the steep nature of the River Trym catchment it was not feasible, within the scope of the project, to convert the entire HECRAS steady state model to an unsteady state model for the purposes of mapping the scenarios of the River Trym and its tributaries. For the purposes of this study the River Trym was maintained as a steady state model and Cribbs reservoir was represented separately in an ISIS 1D model. Flows were extracted from the ISIS model representing each scenario and used as inflows within the HECRAS model. The resulting levels were then mapped. Following discussions with the Environment Agency, flows in the River Trym were modelled without the Cribbs Reservoir. Both defended and undefended outlines have been produced as part of this study, however there was no notable difference between the two outlines..
3.1.2 River Frome
To analyse the impact of potential development the following developer models were linked with the River Frome model (Atkins):
North Yate Model (Hyder)
Ham Brook Model (Arup)
In addition, a 1D ISIS model was produced for a small section of the upper reaches of the Ladden Brook which drains the development site at North Yate. The linked model was then used to complete a catchment wide analysis; the results are discussed in Section 6. No defences were identified for these reaches; therefore a defended model outline was not produced.
3.1.3 Pickedmoor Brook
South Gloucestershire Council commissioned some additional modelling of the Pickedmoor Brook using JBA's JFLOW+ modelling software. Pickedmoor Brook had no previous modelled Flood Zones/outlines for its length. These outlines have been used to supplement areas outside the outlines from the Park Farm, Thornbury model. It should be noted that when viewing the outlines from JFlow+ that culverts and bridges have not been taken into account. For the development site at Thornbury, outlines were generated using the Park Farm 1D- 2D linked ISIS model. No defences were identified for the Pickedmoor Brook; therefore a defended model outline was not produced.
2011s4997 SGC FINAL SFRA Level 2 v7.0.doc
32
3.1.4 Surface Water
Mapping of surface water flood risk has been taken from the locally agreed surface water information prepared by South Gloucestershire Council and described in the PFRA. The information is based on a national scale map identifying those areas where surface water flooding poses a risk. The mapping is based on two rainfall events, one with a 1 in 30 and the other with a 1 in 200 chance of occurring in any year. Bristol City's SWMP has also been taken into account when assessing the risk of surface water at the boundary between the two unitary authorities.
3.1.5 Hazard Maps
Hazard mapping has also been produced for the potential development areas. The hazard rating is calculated directly within the TUFLOW modelling package and utilises the classifications of hazard presented in DEFRA R&D Technical Note FD2320: Flood Risk Assessment Guidance for New Development, together with the relevant supplementary advice.
3.1.6 Suite of Maps
All of the mapping can be found in the Appendix A and is presented in the following structure:
Flood Zones: Outlines for Pickedmoor Brook, Ham Brook, River Trym:
o Zone 3b (functional floodplain) - 5% AEP (4% AEP for the Trym).
o Zone 3a - 1% AEP, undefended case
o Zone 2 - 0.1% AEP, undefended case
Defended Outlines: River Trym
o 4% AEP
o 1% AEP
Depth, Velocity and Hazard Grids for Pickedmoor Brook, Ham Brook, and River Trym:
o Zone 3b (functional floodplain) - 5% AEP (4% AEP for the Trym).
o Zone 3a - 1% AEP, undefended case
o Zone 2 - 0.1% AEP, undefended case
o Climate change - 1% AEP with 20% increase in flows,
3.2 Other Relevant Flood Risk Information
The mapping prepared for this version of the SFRA provides information on:
The extent of flooding;
the depth of flooding;
the velocity of flood water; and
The hazard from floodwater
It should be noted that users of this SFRA should also refer to other relevant information on flood risk, as this is published and becomes available, where this is appropriate. Other information that should be referred to includes:
The South Gloucestershire's Preliminary Flood Risk Assessment (PFRA) and determined Significant Flood Risk Areas (if any);
Hazard and Risk Mapping prepared for the Flood Risk Regulations (available in Dec
2013);
Flood Risk Management Plan in accordance with the Flood Risk Regulations available in Dec 2015:
2011s4997 SGC FINAL SFRA Level 2 v7.0.doc
33
Bristol City Surface Water Management Plan (June 2011)
National Flood and Coastal Defences Dataset (NFCDD) (available now); and
National Receptor Dataset (NRD) (available now).
South Gloucestershire Level 1 SFRA.
Information produced by the Environment Agency on how to challenge Flood Maps and Flood Zones included within the SFRA is included in Appendix D.
3.3 Sequential Approach
It is often the case that it is not possible for all new development to be allocated on land that is not at risk from flooding. In these circumstances the Flood Zone maps (that show the extent of inundation assuming that there are no defences) are too simplistic. A greater understanding of the scale and nature of the flood risks are required. To help achieve this, more detailed modelling of a range of extreme storm events and failure of flood management operational features has been undertaken (discussed in Section 2).
The ability to manage flood risk for new development must consider a wide range of issues, which includes how any evacuation of the occupants would be handled, how the new development fits in with the existing flood management provision and, should there be an event, how quickly the wider area would recover and return to normal. Some areas, either through natural or artificial topography, are easier to integrate flood management measures into the new development, without causing a significant alteration in its design and its place setting. These measures can have the potential to cause an alteration to the flood risk to adjacent property or in flood cells on the opposite bank.
3.4 Sequential Test
The Sequential Test must be performed when considering the placement of future development and for planning application proposals. Again details of the test are described in PPS 25 and the accompanying Practice Guide. The Practice Guide gives detailed instructions on how to perform the test. These instructions on how to perform the Test should be used with the following information from the SFRA:
Identify the area to be assessed (including alternatives) on the Flood Zone Maps that
are provided with this assessment;
Establish the risk of flooding from other sources again using the Maps in this SFRA; and
Follow the instructions given in Chapter 4 of the Practice Guide.
The Practice Guide gives specific guidance on the application of the Sequential Test in relation to allocation of land, individual planning applications, windfall sites, and renewable energy projects, redevelopment of an existing single property and change of use.
The Sequential Test is used to direct all new development (through the site allocation process) to locations at least risk of flooding, giving highest priority to Flood Zone 1. South Gloucestershire Council has sequentially tested the development sites in the Core Strategy. This information is set out in South Gloucestershire Council Core Strategy Flood Risk - Sequential Test, Information Note, March 2011 and South Gloucestershire Core Strategy Topic Paper on Flooding Issues, June 2011. The Level 2 SFRA provides further flood risk evidence which the Council can use to assess whether it is necessary to revisit/update the Sequential Test. The Environment Agency (2009)
15 recommends that the following approach
is used by local planning authorities to apply the Sequential Test to planning applications located in Flood Zones 2 or 3. There are three stages to the test, as follows:
Stage 1 – Strategic application & development vulnerability
15
Environment Agency (2009) Demonstrating the flood risk (PPS25) Sequential Test for Planning Applications, PPS25 FRSA (national) version 2.0 Advise issued on 27 January 2009
2011s4997 SGC FINAL SFRA Level 2 v7.0.doc
34
Stage 2 – Defining the evidence base
Stage 3 – Applying the Sequential Test
Stage 1 – Strategic Application & Development Vulnerability
(1.A) Has the Sequential Test already been carried out for this development at the development plan level? If yes, reference should be provided to the site allocation and Development Plan Document (DPD) in question.
(1.B) Is the flood risk vulnerability classification of the proposal appropriate to the Flood Zone in which the site is located according to Tables D1 and D3 of PPS25? The vulnerability of the development should be clearly stated.
Finish here if the answer is „Yes‟ to both questions 1.A. and 1.B.
Only complete Stages 2 and 3 if the answer to either questions 1.A and 1.B is „No‟.
Stage 2 – Defining the Evidence Base
(2.A) State the geographical area over which the test is to be applied.
(2.B) If greater or less than the boundary of South Gloucestershire justify why the geographical area for applying the test has been chosen.
(2.C) Identify the source of reasonable available sites, either:
Background / evidence base documents (state which), or if not available
Other sites known to South Gloucestershire Council that meet the functional requirements of the application
Identify the source of „reasonably available‟ alternative sites – these sites will usually be drawn from the evidence base / background documents that have been produced to inform the emerging LDF. For example, an important source of information for housing sites and development land will be provided by the SHLAA and the Employment Land Review (ELR).
Until the SHLAA is complete, or in the absence of background documents, „reasonably available‟ sites would include any sites that are known to South Gloucestershire Council and that meet the functional requirements of the application in question, and where necessary, meet the LDF Policy criterion for windfall development (see below)
Identify the geographical area of search over which the test is to be applied – this will usually be over the whole of the South Gloucestershire but may be reduced where justified by the functional arrangements of the development (e.g. catchment area for a school or doctors surgery) or relevant objectives in the Local Development Framework. Equally, in some circumstances it may be appropriate to expand the search area beyond the council boundary for uses that have a national market.
The Sequential Test can be considered adequately demonstrated if both of the following criteria are met:
The Sequential Test has already been carried out for the site (for the same development type) at the strategic level (development plan) in line with paragraphs D5 and D6 of PPS25 (or procedures agreed within the National Planning Policy Framework); and
The development vulnerability is appropriate to the Flood Zone (see table
D1 of PPS25)
2011s4997 SGC FINAL SFRA Level 2 v7.0.doc
35
Windfall Sites
(2.D) State the method used for comparing the flood risk between sites, whether it is this SFRA or an alternative (e.g. Environment Agency flood map, site specific flood risk assessment) as new information becomes available.
Stage 3 – Applying the Sequential Test
(3.A) State the name and location of the reasonably available site options being compared to the application site
(3.B) Indicate whether flood risk on the reasonable available options is higher or lower than the application site. State the Flood Zone or SFRA classification for each site.
(3.C) State whether the reasonably available options being considered are allocated in the Development Plan. Confirm the status of the plan.
(3.D) State the approximate capacity of each reasonably available site being considered. This should be based on:
the density policy within a Local Development Document (LDD)
the current Strategic Housing Land Availability Assessment (SHLAA)
past performance
(3.E) Detail any constraints to the delivery of identified reasonably available options; for example, availability within a given time period or lack of appropriate infrastructure i.e. flood defences which protect the site through its design lifetime. This part of the test should include recommendations on how these constraints should be overcome and when.
Sequential Test Conclusion
Are there any reasonably available sites in areas with a lower probability of flooding, which would be appropriate to the type of development or land use proposed?
Compare the reasonably available sites identified under stage 2 with the application site. Sites should be compared in relation to flood risk; development plan status; capacity; and constraints to delivery including availability, policy restrictions, physical problems or limitations, potential impacts of the development, and future environmental conditions that would be experienced by the inhabitants of the development.
Windfall sites are those which have not been specifically identified as available in the Development Planning Process. They comprise previously-developed sites that have unexpectedly become available. Government policy in PPS3 para. 59 advise that LPAs should not normally rely on windfall sites to meet housing needs.
The Environment Agency recommend that the acceptability of windfall applications in flood risk areas should be considered at the strategic level through a policy setting out broad locations and quantities of windfall development that would be acceptable or not in Sequential Test terms. Evidence on this position should be provided as support to the soundness of the Core Strategy. Guidance on determining the housing potential of windfall (where justified) for broad locations can be found in paras 50-52 of Strategic Housing Land Availability Assessments, Practice Guide to PPS3.
In the absence of flood risk windfall policy, it may be possible (where data is sufficiently robust) for the LPA to apply the Sequential Test taking into account historic windfall rates and their distribution across the district relative to Flood Zones. Where historic and future trends evidence indicate that housing need in the district through windfall can be met largely/entirely by development outside high flood risk areas, this may provide grounds for factoring this into the consideration of „reasonably available‟ alternative sites at the planning application stage.
2011s4997 SGC FINAL SFRA Level 2 v7.0.doc
36
Next Step
3.5 Exception Test
The Exception Test is performed to ensure that more vulnerable property types, such as residential development are not located in areas at high risk of flooding where development would not be safe. Again PPS 25 and the accompanying Practice Guide gives detailed information on how the Test should be performed. The Test involves satisfying the following three components:
a. It must be demonstrated that the development provides wider sustainability benefits to the community that outweigh flood risk, informed by a SFRA where one has been
prepared;
b. The development should be on developable previously developed land or, if it is not on previously developed land, that there are no reasonable alternative sites on
developable previously developed land; and
c. A FRA must demonstrate that the development will be safe, without increasing the flood risk elsewhere, and, where possible, will reduce flood risk overall.
The advice and guidance given in PPS 25 should be used in conjunction with the mapping issued in this version of the SFRA. The Practice Guide gives specific guidance on:
The identification of wider sustainability benefits;
How to determine what is safe; and
Access and egress requirements.
When considering development in areas that are protected by flood defences consideration should also be given to the residual risk that is either a result of the failure or overtopping of defences. This SFRA provides information on the level of hazard (Hazard mapping) that would affect people, property and infrastructure if the existing flood defences failed (due to breaching) or if an event exceeded their original design standard. The methods used to generate the hazard mapping are as described in the PPS 25 Practice Guide. This information can also be used by those preparing for flood emergencies or requiring tactical information during a flood event.
Exception Test – Where necessary, the Exception Test should now be applied in the circumstances set out by table D.1 and D.3 of PPS25.
Applying the sequential approach at the site level – In addition to the formal Sequential Test, PPS25 sets out the requirements for developers to apply the sequential approach (see para. 14 and D8) to locating development within the site.
The following questions should be considered:
Can risk be avoided through substituting less vulnerable uses or by
amending the site lay-out?
Has the applicant demonstrated that less vulnerable uses for the site have been considered and reasonably discounted?
Can layout be varied to reduce the number of people or flood risk
vulnerability or building units located in higher risk parts of the site?
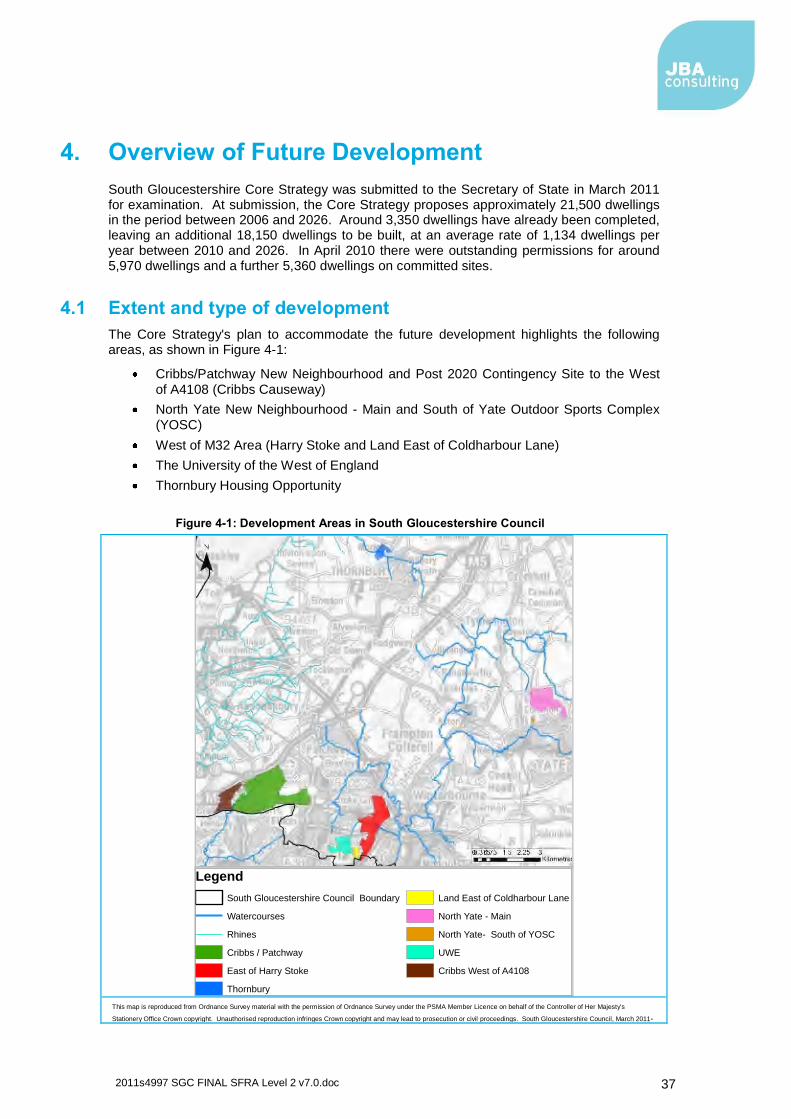
2011s4997 SGC FINAL SFRA Level 2 v7.0.doc
37
4. Overview of Future Development
South Gloucestershire Core Strategy was submitted to the Secretary of State in March 2011 for examination. At submission, the Core Strategy proposes approximately 21,500 dwellings in the period between 2006 and 2026. Around 3,350 dwellings have already been completed, leaving an additional 18,150 dwellings to be built, at an average rate of 1,134 dwellings per year between 2010 and 2026. In April 2010 there were outstanding permissions for around 5,970 dwellings and a further 5,360 dwellings on committed sites.
4.1 Extent and type of development
The Core Strategy's plan to accommodate the future development highlights the following areas, as shown in Figure 4-1:
Cribbs/Patchway New Neighbourhood and Post 2020 Contingency Site to the West
of A4108 (Cribbs Causeway)
North Yate New Neighbourhood - Main and South of Yate Outdoor Sports Complex (YOSC)
West of M32 Area (Harry Stoke and Land East of Coldharbour Lane)
The University of the West of England
Thornbury Housing Opportunity
Figure 4-1: Development Areas in South Gloucestershire Council
Legend
South Gloucestershire Council Boundary
Watercourses
Rhines
Cribbs / Patchway
East of Harry Stoke
Thornbury
Land East of Coldharbour Lane
North Yate - Main
North Yate- South of YOSC
UWE
Cribbs West of A4108
This map is reproduced from Ordnance Survey material with the permission of Ordnance Survey under the PSMA Member Licence on behalf of the Controller of Her Majesty's
Stationery Office Crown copyright. Unauthorised reproduction infringes Crown copyright and may lead to prosecution or civil proceedings. South Gloucestershire Council, March 2011.
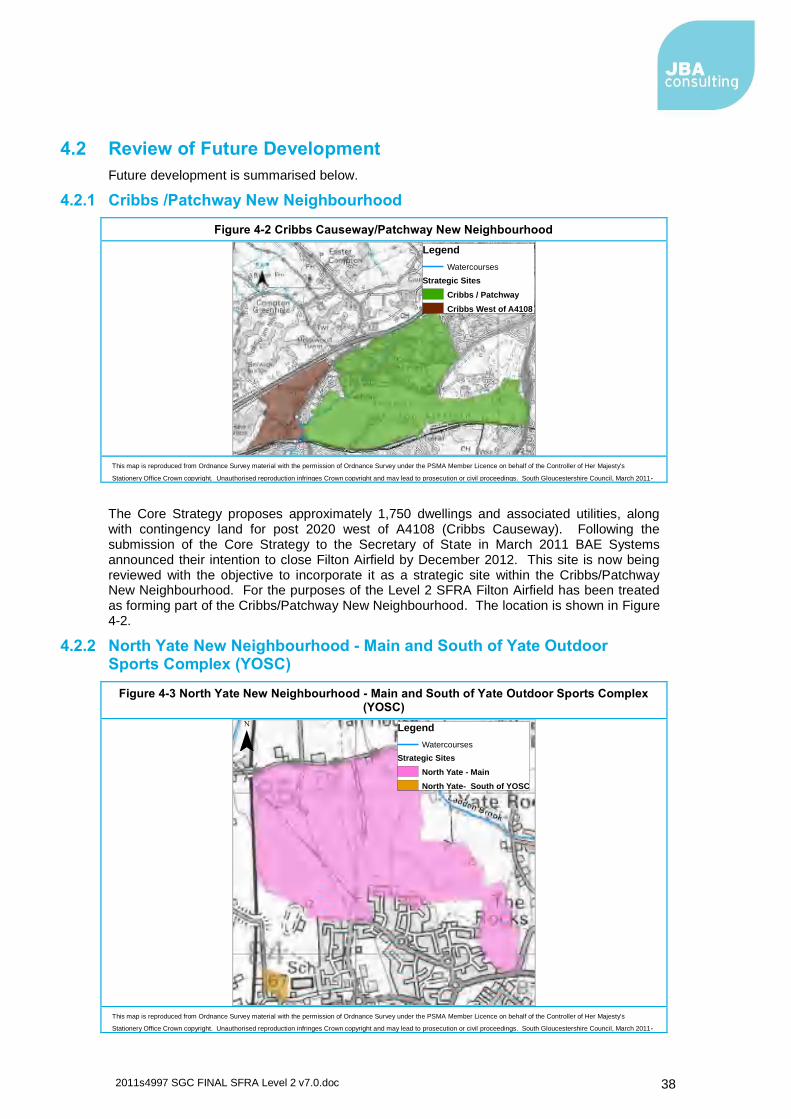
2011s4997 SGC FINAL SFRA Level 2 v7.0.doc
38
4.2 Review of Future Development
Future development is summarised below.
4.2.1 Cribbs /Patchway New Neighbourhood
Figure 4-2 Cribbs Causeway/Patchway New Neighbourhood
This map is reproduced from Ordnance Survey material with the permission of Ordnance Survey under the PSMA Member Licence on behalf of the Controller of Her Majesty's
Stationery Office Crown copyright. Unauthorised reproduction infringes Crown copyright and may lead to prosecution or civil proceedings. South Gloucestershire Council, March 2011.
The Core Strategy proposes approximately 1,750 dwellings and associated utilities, along with contingency land for post 2020 west of A4108 (Cribbs Causeway). Following the submission of the Core Strategy to the Secretary of State in March 2011 BAE Systems announced their intention to close Filton Airfield by December 2012. This site is now being reviewed with the objective to incorporate it as a strategic site within the Cribbs/Patchway New Neighbourhood. For the purposes of the Level 2 SFRA Filton Airfield has been treated as forming part of the Cribbs/Patchway New Neighbourhood. The location is shown in Figure 4-2.
4.2.2 North Yate New Neighbourhood - Main and South of Yate Outdoor Sports Complex (YOSC)
Figure 4-3 North Yate New Neighbourhood - Main and South of Yate Outdoor Sports Complex (YOSC)
This map is reproduced from Ordnance Survey material with the permission of Ordnance Survey under the PSMA Member Licence on behalf of the Controller of Her Majesty's
Stationery Office Crown copyright. Unauthorised reproduction infringes Crown copyright and may lead to prosecution or civil proceedings. South Gloucestershire Council, March 2011.
¯
Legend
Watercourses
Strategic Sites
Cribbs / Patchway
Cribbs West of A4108
Legend
Watercourses
Strategic Sites
North Yate - Main
North Yate- South of YOSC
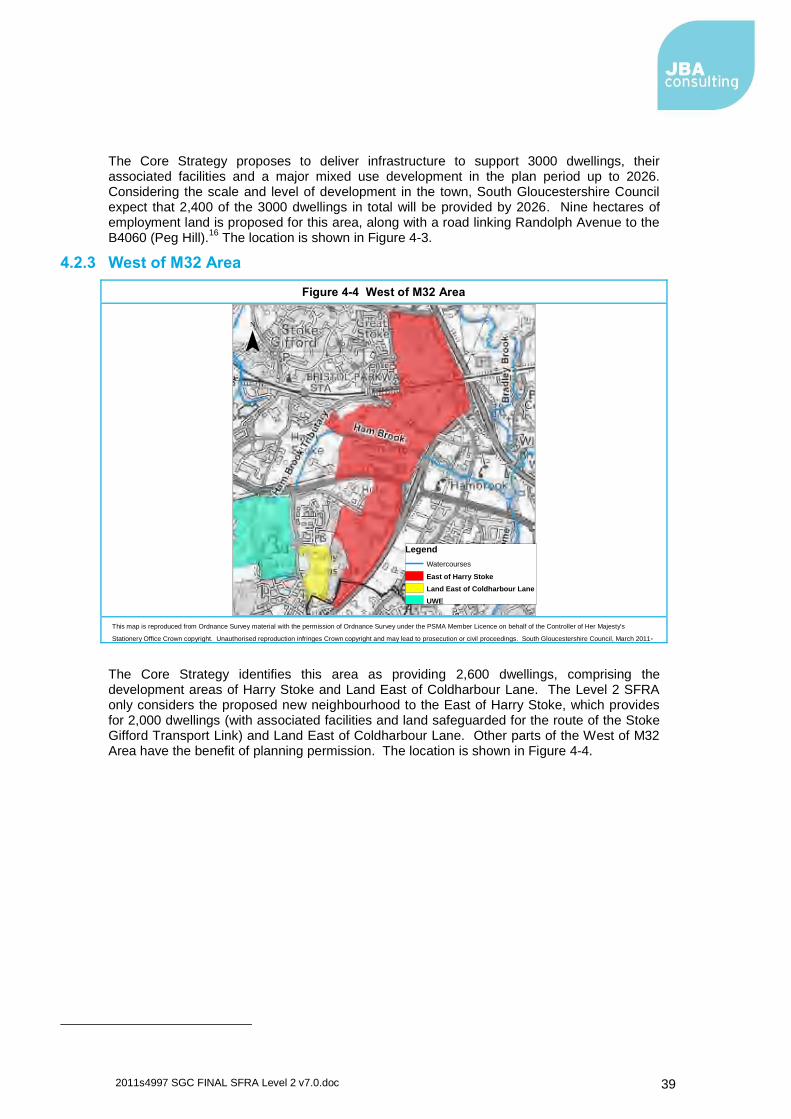
2011s4997 SGC FINAL SFRA Level 2 v7.0.doc
39
The Core Strategy proposes to deliver infrastructure to support 3000 dwellings, their associated facilities and a major mixed use development in the plan period up to 2026. Considering the scale and level of development in the town, South Gloucestershire Council expect that 2,400 of the 3000 dwellings in total will be provided by 2026. Nine hectares of employment land is proposed for this area, along with a road linking Randolph Avenue to the B4060 (Peg Hill).
16 The location is shown in Figure 4-3.
4.2.3 West of M32 Area
Figure 4-4 West of M32 Area
This map is reproduced from Ordnance Survey material with the permission of Ordnance Survey under the PSMA Member Licence on behalf of the Controller of Her Majesty's
Stationery Office Crown copyright. Unauthorised reproduction infringes Crown copyright and may lead to prosecution or civil proceedings. South Gloucestershire Council, March 2011.
The Core Strategy identifies this area as providing 2,600 dwellings, comprising the development areas of Harry Stoke and Land East of Coldharbour Lane. The Level 2 SFRA only considers the proposed new neighbourhood to the East of Harry Stoke, which provides for 2,000 dwellings (with associated facilities and land safeguarded for the route of the Stoke Gifford Transport Link) and Land East of Coldharbour Lane. Other parts of the West of M32 Area have the benefit of planning permission. The location is shown in Figure 4-4.
Legend
Watercourses
East of Harry Stoke
Land East of Coldharbour Lane
UWE
¯
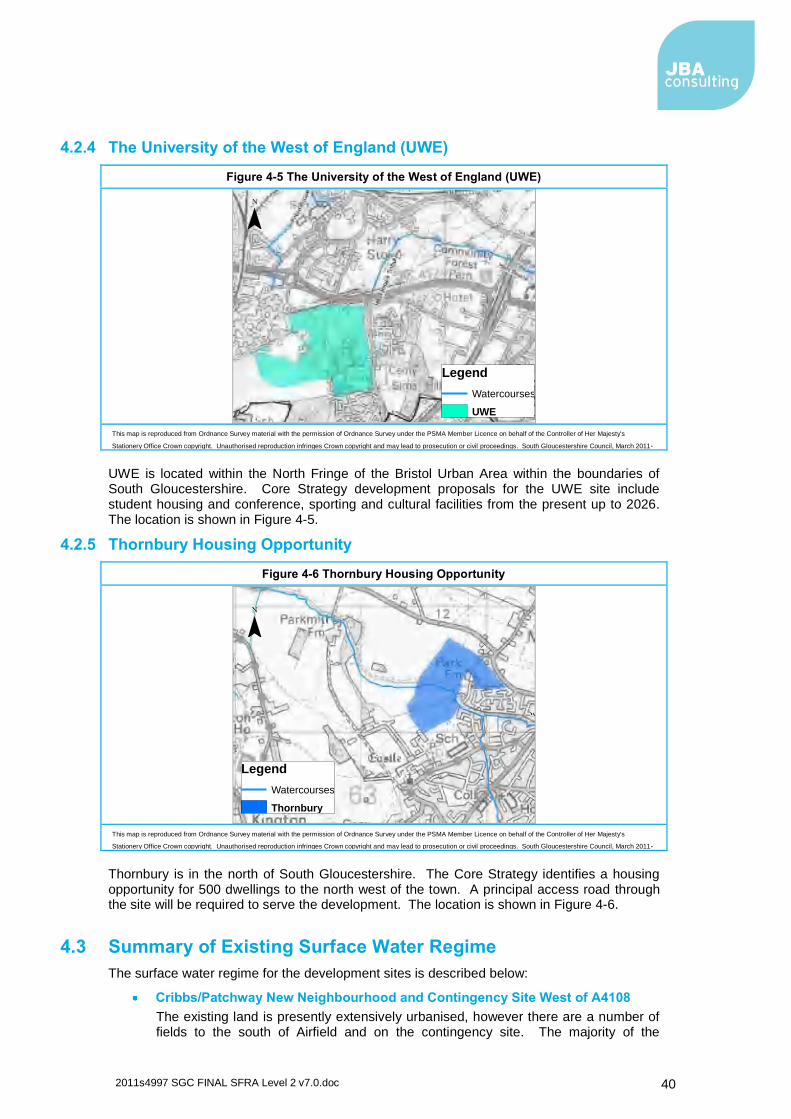
2011s4997 SGC FINAL SFRA Level 2 v7.0.doc
40
4.2.4 The University of the West of England (UWE)
Figure 4-5 The University of the West of England (UWE)
This map is reproduced from Ordnance Survey material with the permission of Ordnance Survey under the PSMA Member Licence on behalf of the Controller of Her Majesty's
Stationery Office Crown copyright. Unauthorised reproduction infringes Crown copyright and may lead to prosecution or civil proceedings. South Gloucestershire Council, March 2011.
UWE is located within the North Fringe of the Bristol Urban Area within the boundaries of South Gloucestershire. Core Strategy development proposals for the UWE site include student housing and conference, sporting and cultural facilities from the present up to 2026. The location is shown in Figure 4-5.
4.2.5 Thornbury Housing Opportunity
Figure 4-6 Thornbury Housing Opportunity
This map is reproduced from Ordnance Survey material with the permission of Ordnance Survey under the PSMA Member Licence on behalf of the Controller of Her Majesty's
Stationery Office Crown copyright. Unauthorised reproduction infringes Crown copyright and may lead to prosecution or civil proceedings. South Gloucestershire Council, March 2011.
Thornbury is in the north of South Gloucestershire. The Core Strategy identifies a housing opportunity for 500 dwellings to the north west of the town. A principal access road through the site will be required to serve the development. The location is shown in Figure 4-6.
4.3 Summary of Existing Surface Water Regime
The surface water regime for the development sites is described below:
Cribbs/Patchway New Neighbourhood and Contingency Site West of A4108
The existing land is presently extensively urbanised, however there are a number of fields to the south of Airfield and on the contingency site. The majority of the
¯
Legend
Watercourses
UWE
Legend
Watercourses
Thornbury
¯
2011s4997 SGC FINAL SFRA Level 2 v7.0.doc
41
development site (73%), including the land west of the A4108 drains into the River Trym Catchment. A small portion of the site to the east, namely Filton Airfield drains to the tributaries of Bradley Brook and into the Frome. The land is presently extensively urbanised and impermeable.
North Yate Neighbourhood
This site drains to the north towards Ladden Brook, although it is located just north of
the Frome.
East of Harry Stoke and Land East of Coldharbour Lane (part of the West of M32 Area)
The land East of Harry Stoke site drains directly into the Ham Brook, which flows through the site. The site is predominantly Greenfield, but as the Bristol Avon CFMP suggests the ground in this area has low permeability and therefore is prone to inundation by surface runoff. The land east of Coldharbour Lane drains north into one of the tributaries feeding the Ham Brook; it is presently undeveloped.
University of West England
Some of this land also drains into the Frome via the Filton Brook and via a tributary of
Ham Brook, see Figure 4-5. The site is predominantly developed.
Housing Opportunity at Thornbury
The land is drained by Pickedmoor Brook, to the north and a small drain to the south. The drain to the south flows west and combines with the Pickedmoor Brook at
Parkmill Culvert, downstream of the site.
The main flood risk issue resulting from the proposed developments will be an increase in impermeable areas within the catchment. If the volume of runoff from the change in impervious area is not mitigated, there will be an increase in the flood risk, either in the vicinity of development or the increase will impact upon a receptor downstream of the proposed development.

2011s4997 SGC FINAL SFRA Level 2 v7.0.doc
42
This page is intentionally left blank.
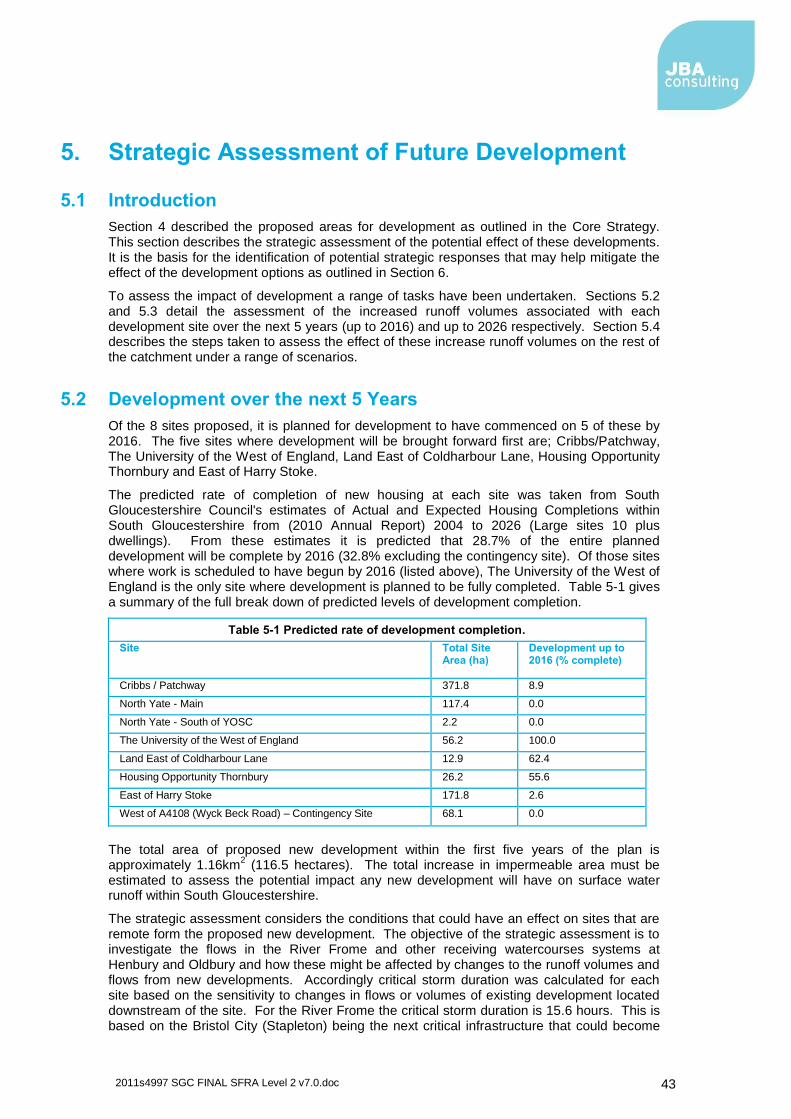
2011s4997 SGC FINAL SFRA Level 2 v7.0.doc
43
5. Strategic Assessment of Future Development
5.1 Introduction
Section 4 described the proposed areas for development as outlined in the Core Strategy. This section describes the strategic assessment of the potential effect of these developments. It is the basis for the identification of potential strategic responses that may help mitigate the effect of the development options as outlined in Section 6.
To assess the impact of development a range of tasks have been undertaken. Sections 5.2 and 5.3 detail the assessment of the increased runoff volumes associated with each development site over the next 5 years (up to 2016) and up to 2026 respectively. Section 5.4 describes the steps taken to assess the effect of these increase runoff volumes on the rest of the catchment under a range of scenarios.
5.2 Development over the next 5 Years
Of the 8 sites proposed, it is planned for development to have commenced on 5 of these by 2016. The five sites where development will be brought forward first are; Cribbs/Patchway, The University of the West of England, Land East of Coldharbour Lane, Housing Opportunity Thornbury and East of Harry Stoke.
The predicted rate of completion of new housing at each site was taken from South Gloucestershire Council's estimates of Actual and Expected Housing Completions within South Gloucestershire from (2010 Annual Report) 2004 to 2026 (Large sites 10 plus dwellings). From these estimates it is predicted that 28.7% of the entire planned development will be complete by 2016 (32.8% excluding the contingency site). Of those sites where work is scheduled to have begun by 2016 (listed above), The University of the West of England is the only site where development is planned to be fully completed. Table 5-1 gives a summary of the full break down of predicted levels of development completion.
Table 5-1 Predicted rate of development completion.
Site Total Site Area (ha)
Development up to 2016 (% complete)
Cribbs / Patchway 371.8 8.9
North Yate - Main 117.4 0.0
North Yate - South of YOSC 2.2 0.0
The University of the West of England 56.2 100.0
Land East of Coldharbour Lane 12.9 62.4
Housing Opportunity Thornbury 26.2 55.6
East of Harry Stoke 171.8 2.6
West of A4108 (Wyck Beck Road) – Contingency Site 68.1 0.0
The total area of proposed new development within the first five years of the plan is approximately 1.16km
2 (116.5 hectares). The total increase in impermeable area must be
estimated to assess the potential impact any new development will have on surface water runoff within South Gloucestershire.
The strategic assessment considers the conditions that could have an effect on sites that are remote form the proposed new development. The objective of the strategic assessment is to investigate the flows in the River Frome and other receiving watercourses systems at Henbury and Oldbury and how these might be affected by changes to the runoff volumes and flows from new developments. Accordingly critical storm duration was calculated for each site based on the sensitivity to changes in flows or volumes of existing development located downstream of the site. For the River Frome the critical storm duration is 15.6 hours. This is based on the Bristol City (Stapleton) being the next critical infrastructure that could become
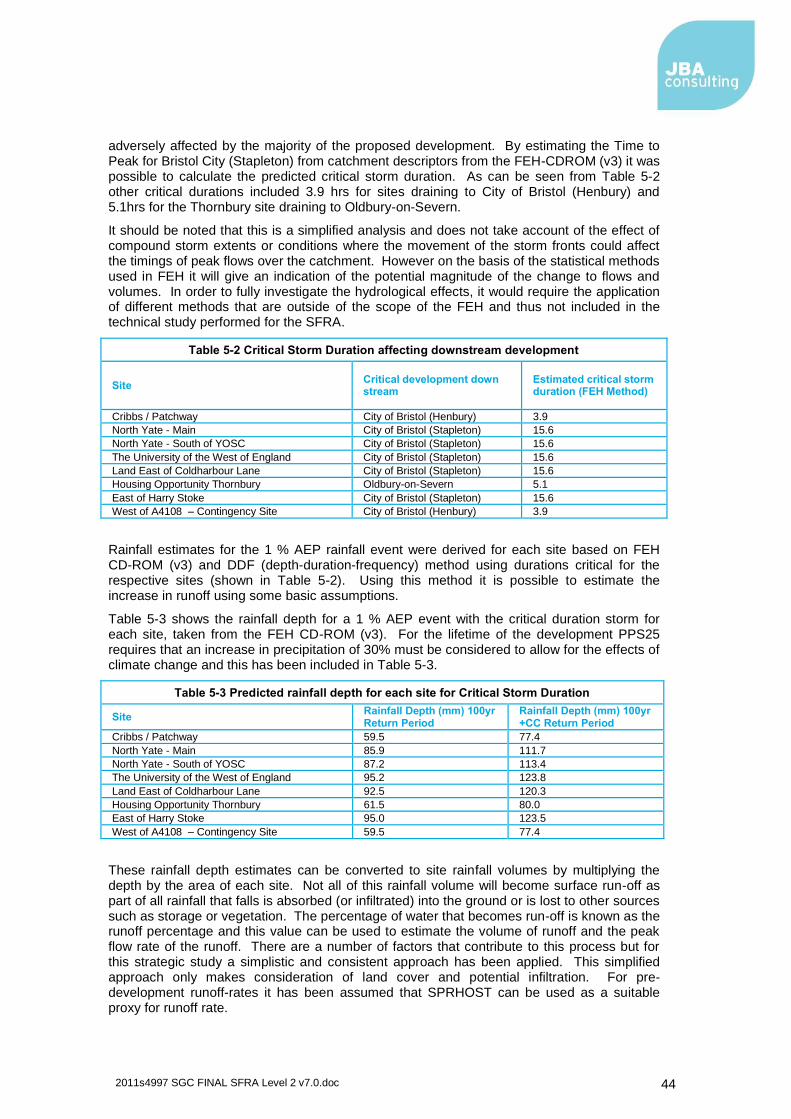
2011s4997 SGC FINAL SFRA Level 2 v7.0.doc
44
adversely affected by the majority of the proposed development. By estimating the Time to Peak for Bristol City (Stapleton) from catchment descriptors from the FEH-CDROM (v3) it was possible to calculate the predicted critical storm duration. As can be seen from Table 5-2 other critical durations included 3.9 hrs for sites draining to City of Bristol (Henbury) and 5.1hrs for the Thornbury site draining to Oldbury-on-Severn.
It should be noted that this is a simplified analysis and does not take account of the effect of compound storm extents or conditions where the movement of the storm fronts could affect the timings of peak flows over the catchment. However on the basis of the statistical methods used in FEH it will give an indication of the potential magnitude of the change to flows and volumes. In order to fully investigate the hydrological effects, it would require the application of different methods that are outside of the scope of the FEH and thus not included in the technical study performed for the SFRA.
Table 5-2 Critical Storm Duration affecting downstream development
Site Critical development down stream
Estimated critical storm duration (FEH Method)
Cribbs / Patchway City of Bristol (Henbury) 3.9
North Yate - Main City of Bristol (Stapleton) 15.6
North Yate - South of YOSC City of Bristol (Stapleton) 15.6
The University of the West of England City of Bristol (Stapleton) 15.6
Land East of Coldharbour Lane City of Bristol (Stapleton) 15.6
Housing Opportunity Thornbury Oldbury-on-Severn 5.1
East of Harry Stoke City of Bristol (Stapleton) 15.6
West of A4108 – Contingency Site City of Bristol (Henbury) 3.9
Rainfall estimates for the 1 % AEP rainfall event were derived for each site based on FEH CD-ROM (v3) and DDF (depth-duration-frequency) method using durations critical for the respective sites (shown in Table 5-2). Using this method it is possible to estimate the increase in runoff using some basic assumptions.
Table 5-3 shows the rainfall depth for a 1 % AEP event with the critical duration storm for each site, taken from the FEH CD-ROM (v3). For the lifetime of the development PPS25 requires that an increase in precipitation of 30% must be considered to allow for the effects of climate change and this has been included in Table 5-3.
Table 5-3 Predicted rainfall depth for each site for Critical Storm Duration
Site Rainfall Depth (mm) 100yr Return Period
Rainfall Depth (mm) 100yr +CC Return Period
Cribbs / Patchway 59.5 77.4
North Yate - Main 85.9 111.7
North Yate - South of YOSC 87.2 113.4
The University of the West of England 95.2 123.8
Land East of Coldharbour Lane 92.5 120.3
Housing Opportunity Thornbury 61.5 80.0
East of Harry Stoke 95.0 123.5
West of A4108 – Contingency Site 59.5 77.4
These rainfall depth estimates can be converted to site rainfall volumes by multiplying the depth by the area of each site. Not all of this rainfall volume will become surface run-off as part of all rainfall that falls is absorbed (or infiltrated) into the ground or is lost to other sources such as storage or vegetation. The percentage of water that becomes run-off is known as the runoff percentage and this value can be used to estimate the volume of runoff and the peak flow rate of the runoff. There are a number of factors that contribute to this process but for this strategic study a simplistic and consistent approach has been applied. This simplified approach only makes consideration of land cover and potential infiltration. For pre-development runoff-rates it has been assumed that SPRHOST can be used as a suitable proxy for runoff rate.
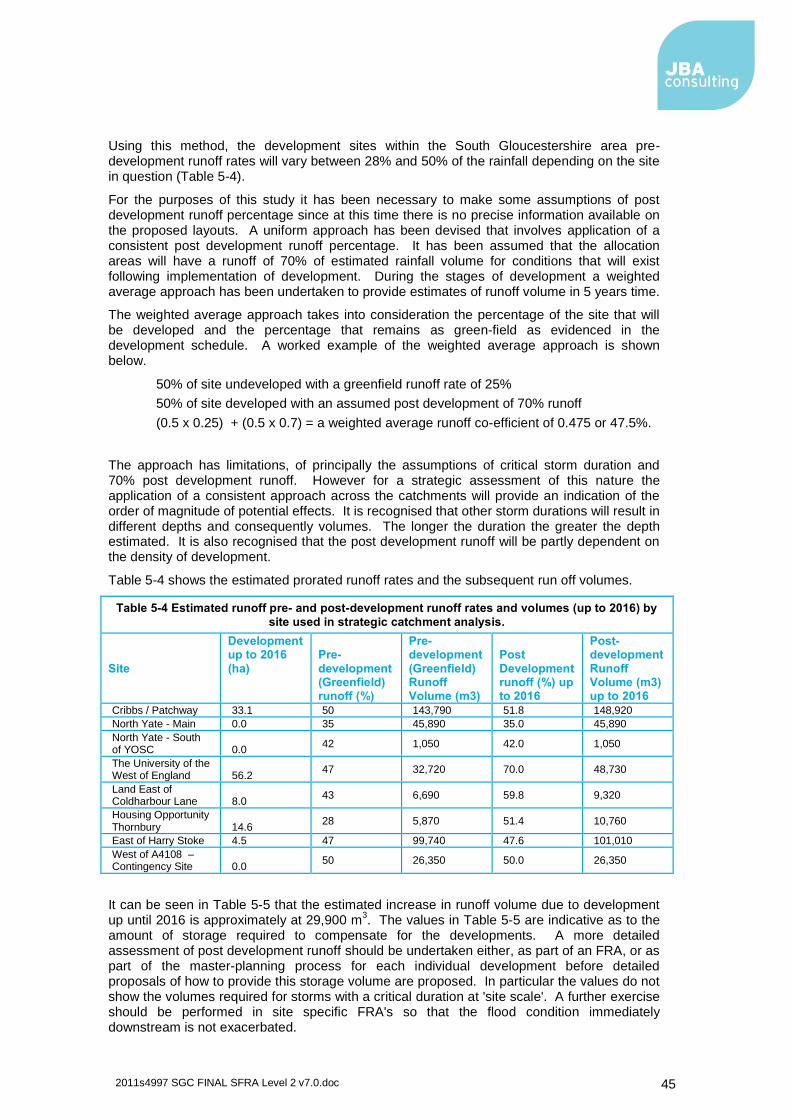
2011s4997 SGC FINAL SFRA Level 2 v7.0.doc
45
Using this method, the development sites within the South Gloucestershire area pre-development runoff rates will vary between 28% and 50% of the rainfall depending on the site in question (Table 5-4).
For the purposes of this study it has been necessary to make some assumptions of post development runoff percentage since at this time there is no precise information available on the proposed layouts. A uniform approach has been devised that involves application of a consistent post development runoff percentage. It has been assumed that the allocation areas will have a runoff of 70% of estimated rainfall volume for conditions that will exist following implementation of development. During the stages of development a weighted average approach has been undertaken to provide estimates of runoff volume in 5 years time.
The weighted average approach takes into consideration the percentage of the site that will be developed and the percentage that remains as green-field as evidenced in the development schedule. A worked example of the weighted average approach is shown below.
50% of site undeveloped with a greenfield runoff rate of 25%
50% of site developed with an assumed post development of 70% runoff
(0.5 x 0.25) + (0.5 x 0.7) = a weighted average runoff co-efficient of 0.475 or 47.5%.
The approach has limitations, of principally the assumptions of critical storm duration and 70% post development runoff. However for a strategic assessment of this nature the application of a consistent approach across the catchments will provide an indication of the order of magnitude of potential effects. It is recognised that other storm durations will result in different depths and consequently volumes. The longer the duration the greater the depth estimated. It is also recognised that the post development runoff will be partly dependent on the density of development.
Table 5-4 shows the estimated prorated runoff rates and the subsequent run off volumes.
Table 5-4 Estimated runoff pre- and post-development runoff rates and volumes (up to 2016) by
site used in strategic catchment analysis.
Site
Development up to 2016
(ha)
Pre-
development (Greenfield) runoff (%)
Pre-development
(Greenfield) Runoff Volume (m3)
Post
Development runoff (%) up to 2016
Post-development
Runoff Volume (m3) up to 2016
Cribbs / Patchway 33.1 50 143,790 51.8 148,920
North Yate - Main 0.0 35 45,890 35.0 45,890
North Yate - South of YOSC 0.0
42 1,050 42.0 1,050
The University of the West of England 56.2
47 32,720 70.0 48,730
Land East of Coldharbour Lane 8.0
43 6,690 59.8 9,320
Housing Opportunity Thornbury 14.6
28 5,870 51.4 10,760
East of Harry Stoke 4.5 47 99,740 47.6 101,010
West of A4108 – Contingency Site 0.0
50 26,350 50.0 26,350
It can be seen in Table 5-5 that the estimated increase in runoff volume due to development up until 2016 is approximately at 29,900 m
3. The values in Table 5-5 are indicative as to the
amount of storage required to compensate for the developments. A more detailed assessment of post development runoff should be undertaken either, as part of an FRA, or as part of the master-planning process for each individual development before detailed proposals of how to provide this storage volume are proposed. In particular the values do not show the volumes required for storms with a critical duration at 'site scale'. A further exercise should be performed in site specific FRA's so that the flood condition immediately downstream is not exacerbated.
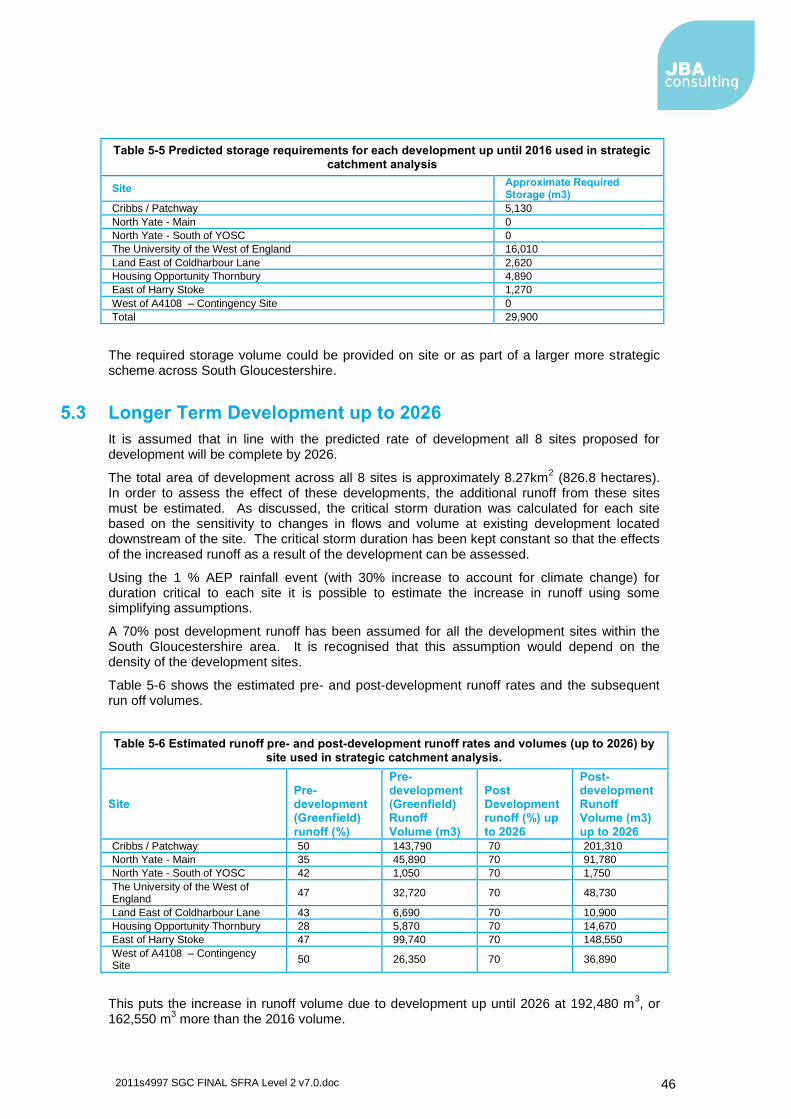
2011s4997 SGC FINAL SFRA Level 2 v7.0.doc
46
Table 5-5 Predicted storage requirements for each development up until 2016 used in strategic
catchment analysis
Site Approximate Required Storage (m3)
Cribbs / Patchway 5,130
North Yate - Main 0
North Yate - South of YOSC 0
The University of the West of England 16,010
Land East of Coldharbour Lane 2,620
Housing Opportunity Thornbury 4,890
East of Harry Stoke 1,270
West of A4108 – Contingency Site 0
Total 29,900
The required storage volume could be provided on site or as part of a larger more strategic scheme across South Gloucestershire.
5.3 Longer Term Development up to 2026
It is assumed that in line with the predicted rate of development all 8 sites proposed for development will be complete by 2026.
The total area of development across all 8 sites is approximately 8.27km2 (826.8 hectares).
In order to assess the effect of these developments, the additional runoff from these sites must be estimated. As discussed, the critical storm duration was calculated for each site based on the sensitivity to changes in flows and volume at existing development located downstream of the site. The critical storm duration has been kept constant so that the effects of the increased runoff as a result of the development can be assessed.
Using the 1 % AEP rainfall event (with 30% increase to account for climate change) for duration critical to each site it is possible to estimate the increase in runoff using some simplifying assumptions.
A 70% post development runoff has been assumed for all the development sites within the South Gloucestershire area. It is recognised that this assumption would depend on the density of the development sites.
Table 5-6 shows the estimated pre- and post-development runoff rates and the subsequent run off volumes.
Table 5-6 Estimated runoff pre- and post-development runoff rates and volumes (up to 2026) by
site used in strategic catchment analysis.
Site Pre-development (Greenfield)
runoff (%)
Pre-development (Greenfield) Runoff
Volume (m3)
Post Development runoff (%) up
to 2026
Post-development Runoff Volume (m3)
up to 2026
Cribbs / Patchway 50 143,790 70 201,310
North Yate - Main 35 45,890 70 91,780
North Yate - South of YOSC 42 1,050 70 1,750
The University of the West of England
47 32,720 70 48,730
Land East of Coldharbour Lane 43 6,690 70 10,900
Housing Opportunity Thornbury 28 5,870 70 14,670
East of Harry Stoke 47 99,740 70 148,550
West of A4108 – Contingency Site
50 26,350 70 36,890
This puts the increase in runoff volume due to development up until 2026 at 192,480 m3, or
162,550 m3 more than the 2016 volume.
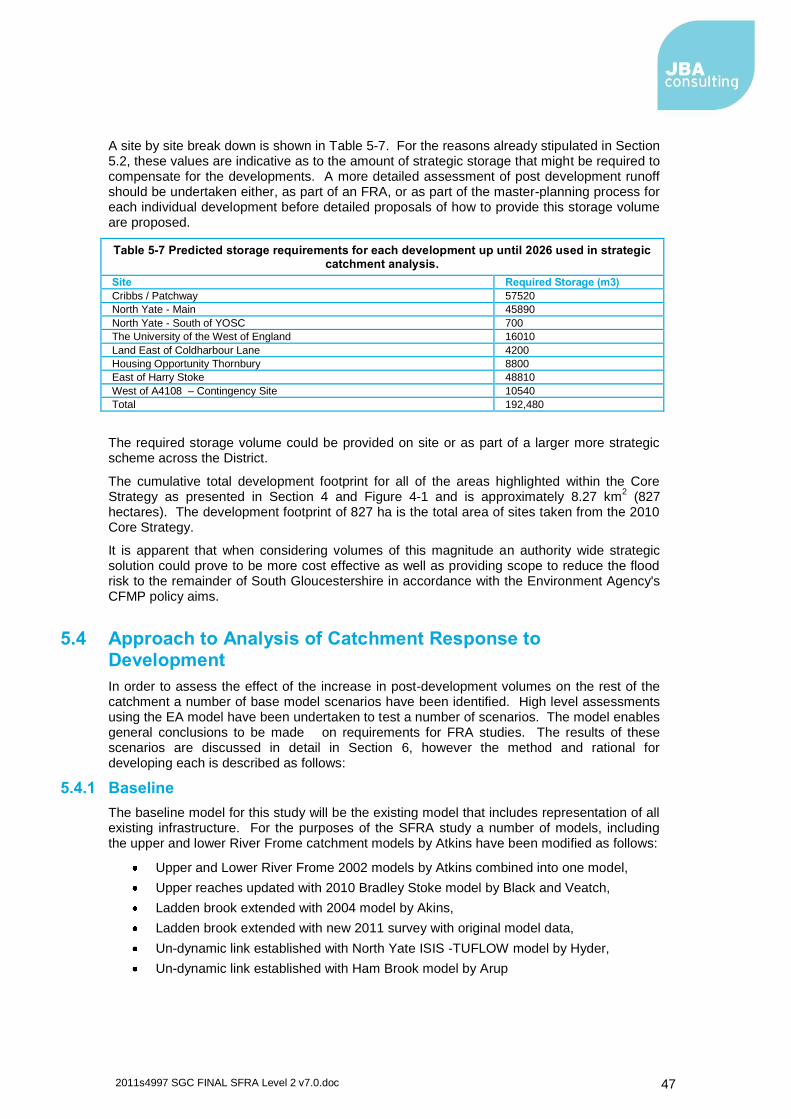
2011s4997 SGC FINAL SFRA Level 2 v7.0.doc
47
A site by site break down is shown in Table 5-7. For the reasons already stipulated in Section 5.2, these values are indicative as to the amount of strategic storage that might be required to compensate for the developments. A more detailed assessment of post development runoff should be undertaken either, as part of an FRA, or as part of the master-planning process for each individual development before detailed proposals of how to provide this storage volume are proposed.
Table 5-7 Predicted storage requirements for each development up until 2026 used in strategic catchment analysis.
Site Required Storage (m3)
Cribbs / Patchway 57520
North Yate - Main 45890
North Yate - South of YOSC 700
The University of the West of England 16010
Land East of Coldharbour Lane 4200
Housing Opportunity Thornbury 8800
East of Harry Stoke 48810
West of A4108 – Contingency Site 10540
Total 192,480
The required storage volume could be provided on site or as part of a larger more strategic scheme across the District.
The cumulative total development footprint for all of the areas highlighted within the Core Strategy as presented in Section 4 and Figure 4-1 and is approximately 8.27 km
2 (827
hectares). The development footprint of 827 ha is the total area of sites taken from the 2010 Core Strategy.
It is apparent that when considering volumes of this magnitude an authority wide strategic solution could prove to be more cost effective as well as providing scope to reduce the flood risk to the remainder of South Gloucestershire in accordance with the Environment Agency's CFMP policy aims.
5.4 Approach to Analysis of Catchment Response to Development
In order to assess the effect of the increase in post-development volumes on the rest of the catchment a number of base model scenarios have been identified. High level assessments using the EA model have been undertaken to test a number of scenarios. The model enables general conclusions to be made on requirements for FRA studies. The results of these scenarios are discussed in detail in Section 6, however the method and rational for developing each is described as follows:
5.4.1 Baseline
The baseline model for this study will be the existing model that includes representation of all existing infrastructure. For the purposes of the SFRA study a number of models, including the upper and lower River Frome catchment models by Atkins have been modified as follows:
Upper and Lower River Frome 2002 models by Atkins combined into one model,
Upper reaches updated with 2010 Bradley Stoke model by Black and Veatch,
Ladden brook extended with 2004 model by Akins,
Ladden brook extended with new 2011 survey with original model data,
Un-dynamic link established with North Yate ISIS -TUFLOW model by Hyder,
Un-dynamic link established with Ham Brook model by Arup
2011s4997 SGC FINAL SFRA Level 2 v7.0.doc
48
5.4.2 Baseline with Climate Change
There is a need to amend the existing baseline model to show the effects of climate change. This enables examination of the effects of climate change on the existing catchment independently of change caused by the proposed development.
5.4.3 Development without Onsite Attenuation
There is a need to create a modelled scenario to show the potential effect of development should no onsite attenuation measures be implemented to limit the runoff from the post development sites to greenfield rates.
To this end it has been necessary to apply the full increase in post-development runoff volume to the model at the same rate as the existing inflows. This has been achieved by replicating existing Revitalised Flood Hydrograph (ReFH) model units in the modelling software and preserving storm duration, time step but scaling the peak of the hydrograph to achieve the estimated increase in post-development volume. The ReFH model is a lumped conceptual rainfall-runoff model used to generate flow hydrographs from catchment descriptors obtained from the FEH CD-ROM. The ReFH model is based on robust hydrological modelling techniques and is considered to be an improvement over the existing Flood Studies Report and Flood Estimation Handbook model. Using ReFH enables a more direct and transparent description of flood-generating mechanisms and introduces the concept of seasonal variation in soil moisture content, design rainfall and baseflow. ReFH was used in this study because it was the basis for the existing flow estimations for much of the model. Many software packages contain a semi-automated ReFH model flow estimation unit which enables users to rapidly adjust the ReFH model parameters and generate flow estimations.
5.4.4 Development with Onsite Attenuation
A further scenario to investigate the effects of proposed development is to assume that on-site attenuation measures will be implemented for each of the respective development locations to limit post-development rates to green-field runoff rates in line with the requirements of PPS25.
Using the baseline model it is proposed to model the effect of onsite attenuation measures (e.g. SuDS) for all development sites. This model can be used to represent the effect of attenuation measures that limit the peak flow from the site to the existing greenfield peak, prolonging the flood hydrograph as the increased runoff volume is temporarily stored and released over an extended period.
A desktop analysis has been designed to estimate the approximate lag time that would be associated with attenuation facilities to store increased post-development runoff from the respective sites whilst maintain the existing peak level. To achieve this, the existing hydrology for the sites was amended to create a new inflow hydrographs to represent runoff from the proposed development sites. These new inflow hydrographs retain the existing peak levels, but incorporates the estimated increased runoff volumes from the proposed developments.
As the green-field runoff from the development sites has already been included in the original model hydrology it was more difficult to apply an appropriate representation of the effect of increased flow volumes that have been attenuated to the green-field runoff rates. To achieve this a similar approach to that outlined in section 5.4.3 was undertaken where by existing ReFH units were replicated preserving storm duration, time step and scaling the peak flow to achieve the pre-development runoff volume. This was then taken to be the pre-development green-field runoff rate. The storm duration and time-step where then adjusted preserving the peak-flow rate to achieve the post- development runoff volume.
The pre-development runoff hydrograph was subtracted from the post development runoff hydrograph to produce a flow-time boundary that would simulate water being held in some temporary storage and release after the original peak for a given storm duration.

2011s4997 SGC FINAL SFRA Level 2 v7.0.doc
49
5.4.5 Outcomes
The scenarios selected illustrate the scope of strategic analysis that will need to be performed during the course of preparing FRAs in support of specific planning applications.

2011s4997 SGC FINAL SFRA Level 2 v7.0.doc
50
This page is intentionally left blank.
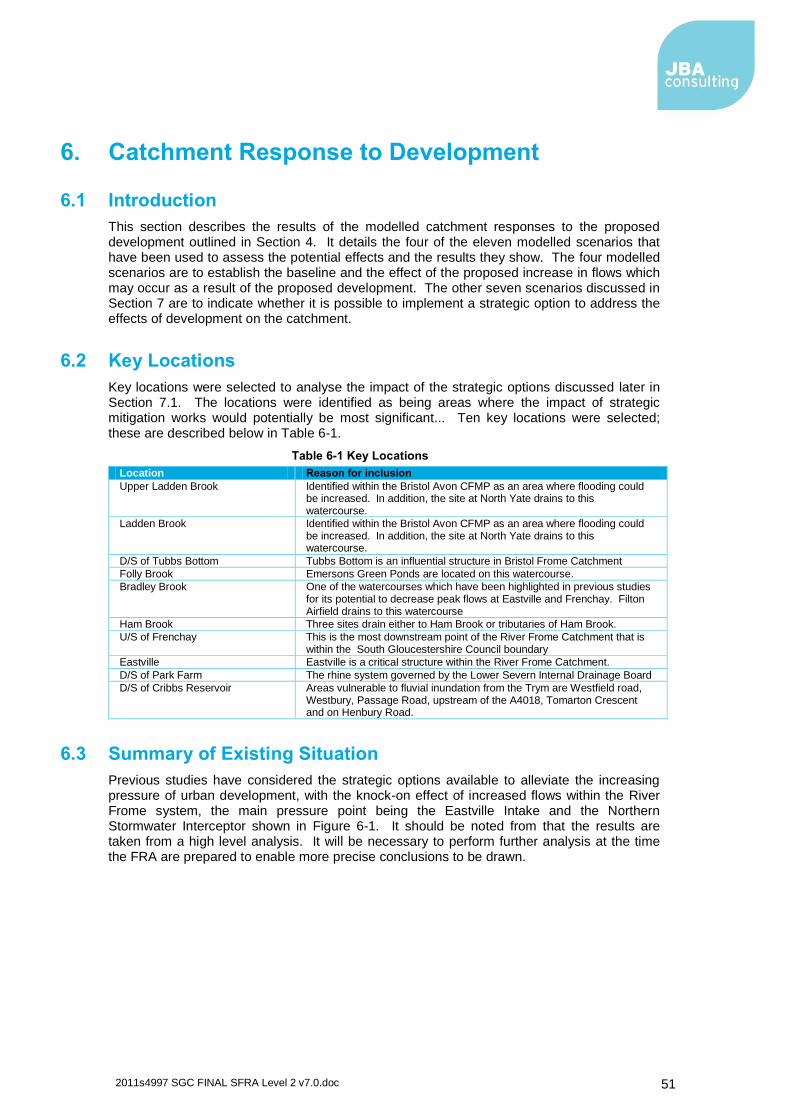
2011s4997 SGC FINAL SFRA Level 2 v7.0.doc
51
6. Catchment Response to Development
6.1 Introduction
This section describes the results of the modelled catchment responses to the proposed development outlined in Section 4. It details the four of the eleven modelled scenarios that have been used to assess the potential effects and the results they show. The four modelled scenarios are to establish the baseline and the effect of the proposed increase in flows which may occur as a result of the proposed development. The other seven scenarios discussed in Section 7 are to indicate whether it is possible to implement a strategic option to address the effects of development on the catchment.
6.2 Key Locations
Key locations were selected to analyse the impact of the strategic options discussed later in Section 7.1. The locations were identified as being areas where the impact of strategic mitigation works would potentially be most significant... Ten key locations were selected; these are described below in Table 6-1.
Table 6-1 Key Locations
Location Reason for inclusion
Upper Ladden Brook Identified within the Bristol Avon CFMP as an area where flooding could be increased. In addition, the site at North Yate drains to this watercourse.
Ladden Brook Identified within the Bristol Avon CFMP as an area where flooding could be increased. In addition, the site at North Yate drains to this watercourse.
D/S of Tubbs Bottom Tubbs Bottom is an influential structure in Bristol Frome Catchment
Folly Brook Emersons Green Ponds are located on this watercourse.
Bradley Brook One of the watercourses which have been highlighted in previous studies for its potential to decrease peak flows at Eastville and Frenchay. Filton Airfield drains to this watercourse
Ham Brook Three sites drain either to Ham Brook or tributaries of Ham Brook.
U/S of Frenchay This is the most downstream point of the River Frome Catchment that is within the South Gloucestershire Council boundary
Eastville Eastville is a critical structure within the River Frome Catchment.
D/S of Park Farm The rhine system governed by the Lower Severn Internal Drainage Board
D/S of Cribbs Reservoir Areas vulnerable to fluvial inundation from the Trym are Westfield road, Westbury, Passage Road, upstream of the A4018, Tomarton Crescent and on Henbury Road.
6.3 Summary of Existing Situation
Previous studies have considered the strategic options available to alleviate the increasing pressure of urban development, with the knock-on effect of increased flows within the River Frome system, the main pressure point being the Eastville Intake and the Northern Stormwater Interceptor shown in Figure 6-1. It should be noted from that the results are taken from a high level analysis. It will be necessary to perform further analysis at the time the FRA are prepared to enable more precise conclusions to be drawn.
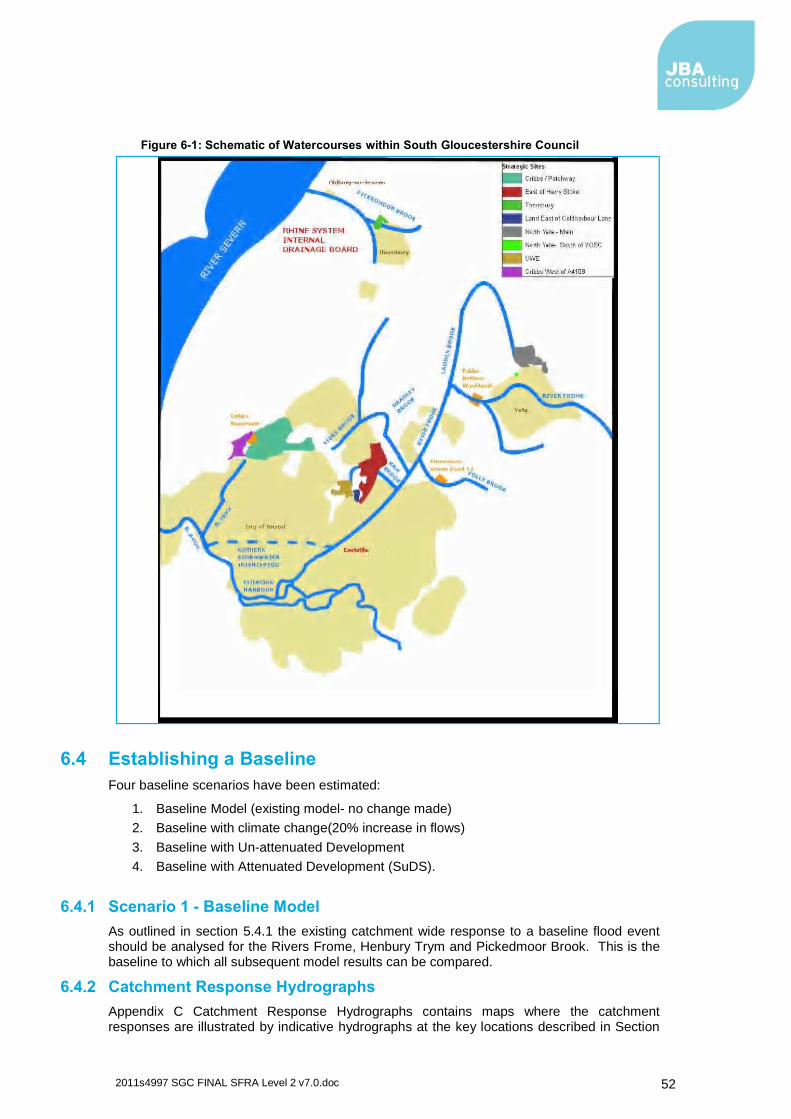
2011s4997 SGC FINAL SFRA Level 2 v7.0.doc
52
Figure 6-1: Schematic of Watercourses within South Gloucestershire Council
6.4 Establishing a Baseline
Four baseline scenarios have been estimated:
1. Baseline Model (existing model- no change made)
2. Baseline with climate change(20% increase in flows)
3. Baseline with Un-attenuated Development
4. Baseline with Attenuated Development (SuDS).
6.4.1 Scenario 1 - Baseline Model
As outlined in section 5.4.1 the existing catchment wide response to a baseline flood event should be analysed for the Rivers Frome, Henbury Trym and Pickedmoor Brook. This is the baseline to which all subsequent model results can be compared.
6.4.2 Catchment Response Hydrographs
Appendix C Catchment Response Hydrographs contains maps where the catchment responses are illustrated by indicative hydrographs at the key locations described in Section
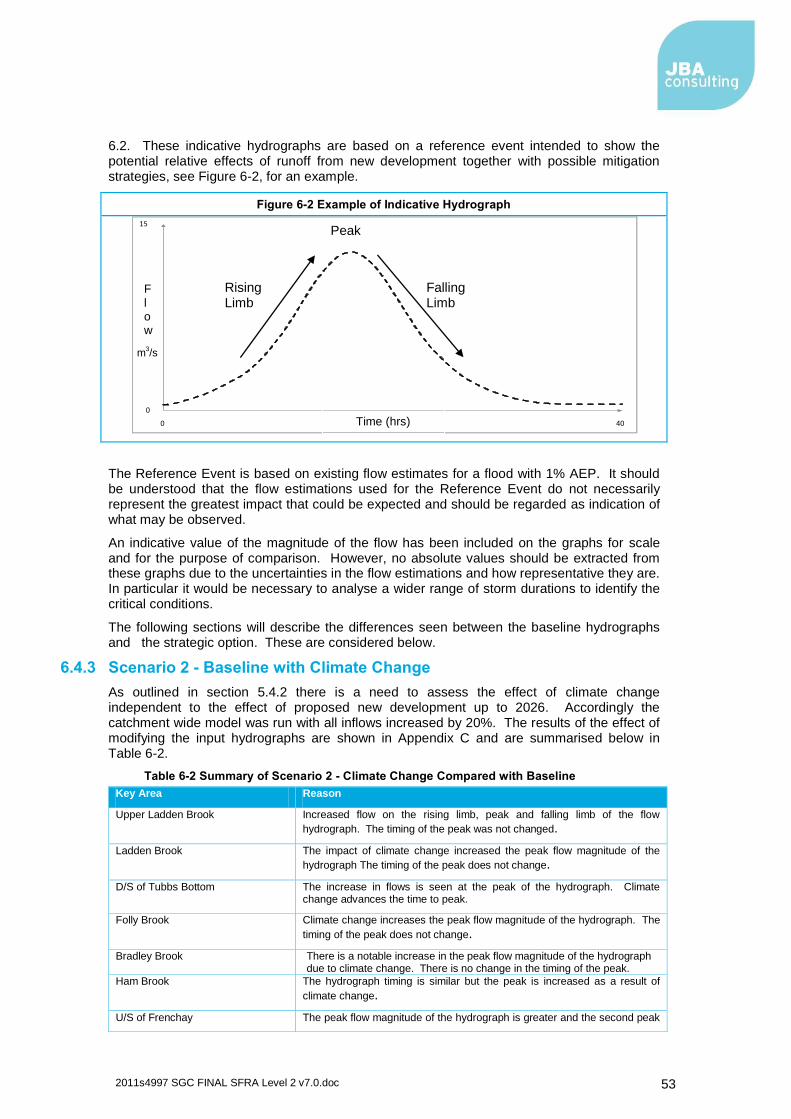
2011s4997 SGC FINAL SFRA Level 2 v7.0.doc
53
6.2. These indicative hydrographs are based on a reference event intended to show the potential relative effects of runoff from new development together with possible mitigation strategies, see Figure 6-2, for an example.
Figure 6-2 Example of Indicative Hydrograph
The Reference Event is based on existing flow estimates for a flood with 1% AEP. It should be understood that the flow estimations used for the Reference Event do not necessarily represent the greatest impact that could be expected and should be regarded as indication of what may be observed.
An indicative value of the magnitude of the flow has been included on the graphs for scale and for the purpose of comparison. However, no absolute values should be extracted from these graphs due to the uncertainties in the flow estimations and how representative they are. In particular it would be necessary to analyse a wider range of storm durations to identify the critical conditions.
The following sections will describe the differences seen between the baseline hydrographs and the strategic option. These are considered below.
6.4.3 Scenario 2 - Baseline with Climate Change
As outlined in section 5.4.2 there is a need to assess the effect of climate change independent to the effect of proposed new development up to 2026. Accordingly the catchment wide model was run with all inflows increased by 20%. The results of the effect of modifying the input hydrographs are shown in Appendix C and are summarised below in Table 6-2.
Table 6-2 Summary of Scenario 2 - Climate Change Compared with Baseline
Key Area Reason
Upper Ladden Brook Increased flow on the rising limb, peak and falling limb of the flow
hydrograph. The timing of the peak was not changed.
Ladden Brook The impact of climate change increased the peak flow magnitude of the
hydrograph The timing of the peak does not change.
D/S of Tubbs Bottom The increase in flows is seen at the peak of the hydrograph. Climate change advances the time to peak.
Folly Brook Climate change increases the peak flow magnitude of the hydrograph. The
timing of the peak does not change.
Bradley Brook There is a notable increase in the peak flow magnitude of the hydrograph due to climate change. There is no change in the timing of the peak.
Ham Brook The hydrograph timing is similar but the peak is increased as a result of
climate change.
U/S of Frenchay The peak flow magnitude of the hydrograph is greater and the second peak
0
15
0 40 Time (hrs)
Rising Limb
Falling Limb
Peak
F
low
m3/s
2011s4997 SGC FINAL SFRA Level 2 v7.0.doc
54
is more pronounced as a result of the increased flows
Eastville The peak flow magnitude is increased and the overall shape of the hydrograph illustrates increased flow magnitude at Eastville.
D/S of Park Farm The flow is increased.
D/S of Cribbs Reservoir The flow is increased.
6.4.4 Scenario 3 - Baseline with Un-attenuated Development
As outlined in Section 5.4.3 the potential effect of development up to 2026 on the catchment should be assessed to investigate the effect of not implementing onsite attenuation measures. This scenario is essentially examining the effects of 'free discharge' conditions from the proposed development should no onsite attenuation measures be implemented.
The results of this at key locations can be seen in Appendix C and are summarised below in Table 6-3.
Table 6-3 Summary of Scenario 3 - Un-attenuated Development Compared with Baseline
Location Description of effect Upper Ladden Brook The rising limb of the hydrograph is affected, as a result of greater runoff
within the catchment from the proposed development. The flow values are
higher than the baseline but have a flatter shape before the peak of the
hydrograph. At the peak the difference between the baseline and Scenario 3 is minimal
Ladden Brook There is a minimal increase in peak flow magnitude.
D/S of Tubbs Bottom There is no apparent difference between the two hydrographs.
Folly Brook The hydrographs are similar.
Bradley Brook There is minor increase on the rising limb due to additional flow from Cribbs Reservoir.
Ham Brook There is a notable difference between the peak flow magnitudes, the falling limb and the base flow.
U/S of Frenchay Generally the hydrographs are similar, with the exception of an increase in flows on the rising limb of the hydrograph
Eastville By the time flows reach Eastville, there is no notable difference in the hydrographs.
D/S of Park Farm There is an increase in the peak flow
D/S of Cribbs Reservoir There is a notable increase in flow.
It should be recognised that the results are for the Reference Event only as further analysis will need to be performed within site specific FRAs.
6.4.5 Scenario 4 - Baseline with Attenuated Development (SuDS)
As outlined in Section 5.4.4 there is a need to assess the potential effect of development on the catchment assuming onsite attenuation measures (e.g. SuDS) have been implemented at all sites. As outlined below in Section 6.5
The results of this at key locations can be seen in Appendix C and are summarised below in Table 6-4.
Table 6-4 Summary of Scenario 4 - Attenuated Development Compared with Baseline
Location Description of effect Upper Ladden Brook The results indicate that attenuation reduces flows on the rising limb but
advances the timing of the peak and has greater flow magnitude than the baseline
Ladden Brook In the Ladden Brook the magnitude of the peak flow is increased however the timing of the peak remains the same
D/S of Tubbs Bottom There is no measurable change in the hydrograph
2011s4997 SGC FINAL SFRA Level 2 v7.0.doc
55
Location Description of effect Folly Brook The hydrographs are similar
Bradley Brook There is minor increase on the rising limb due to additional flow from Cribbs.
Ham Brook At Ham Brook the rising limb of both hydrographs are similar. As a result of the attenuation the magnitude of the peak flow is decreased but the timings of the peak flow is slowed when compared with baseline and flow magnitude in the falling limb are greater.
U/S of Frenchay There is a minor increase in the peak flow and falling limb due to SuDS
Eastville No notable change is detected
D/S of Park Farm The attenuated flow is lower than the Baseline flow
D/S of Cribbs Reservoir The difference is not notable
It should be recognised that the results are for the Reference Event only as further analysis will need to be performed within site specific FRAs.
6.5 Guidance on SuDS Techniques
Reference should be made to the locally agreed surface water maps and the Surface Water Management Plan prepared by Bristol City SWMP (to be issued in 2011). All FRAs carried out in South Gloucestershire should take account of surface water flooding. This should include all sites within Environment Agency Flood Zone 3a and 2, sites greater than 1ha in Flood Zone 1 and sites greater than 0.5ha in Critical Drainage Areas (CDAs).
Managing surface water flooding should consider the same management hierarchy of assess, avoid, substitute and control as outlined in PPS25 with the aim of reducing risk by controlling water at the source (through SuDS) and considering flood mechanisms during exceedance events (i.e. development of flow paths).
As well as adhering to the guidance provided, FRAs should consider the following issues with regards to managing surface water as outlined in PPS25.
"How surface water is currently managed on site, how it is currently functioning and
how it is to be undertaken in the new development
All sewers that will subsequently be adopted by the sewerage undertaker must be
designed and built in accordance with the requirements of Sewers of Adoption
Sewers should be designed to ensure that no flooding occurs above ground level for events with a return period of 30 years (3.3% AEP)
For events with a return period in excess of 30 years (3.3% AEP), surface flooding of
open space such as landscaped areas or car parks is acceptable for short periods
No flooding of property should occur as a result of a one in 100 year (1% AEP) storm
event
Developed rate of runoff into a watercourse, or another receiving body, should be no
greater than the existing rate of runoff for the same event
Developers are, however, strongly encouraged to reduce runoff rates from previously-developed sites as much as is reasonably practicable.
Volumes of runoff should also be reduced wherever possible using infiltration and
attenuation techniques.17
"
Drainage schemes should consider the critical duration of the receiving watercourse.
Please refer to Table 5-2 to inform drainage work.
Using information provided in the SuDS Manual18
on design criteria, Table 6-5 has been produced in order to identify available SuDS techniques when designing for a range of
17
Communities and Local Government (2009) Planning Policy Statement 25: Development and Flood Risk - Practice Guide 18
CIRIA (2007) The SUDS Manual Table 3.5
2011s4997 SGC FINAL SFRA Level 2 v7.0.doc
56
hydraulic conditions and objectives. These criteria are purely based on flood risk and others such as water quality, amenity and ecology should also be considered at a site level.
Table 6-5: SuDS Hydraulic Design Criteria
Criteria Design Event Design Objective Available Techniques
Protect against flooding from
watercourse
1 in 100/200 year event
Control risks to people and property
Preservation of riverside buffers and
natural floodplain
Protect against flooding from drainage
system
Site 1 in 10/30 year event
No flooding on site, except where planned and approved
Adequate site drainage and flapped outfalls
Site 1 in 100/200 year event
Control risks to people and property
Subsurface storage, increase flood levels and retention ponds
Protect against
flooding from overland flows
Site 1 in
100/200 year event, short duration events
Planned flood routing and
temporary storage accommodation on site
Open channels such
as swales or use of road network
Protect receiving drainage
system/watercourse from rate of discharge
Catchment 1 in 1 year event
Attenuation storage to control 1 year site discharge rate to ≤ 1 in 1 year greenfield peak rate
The majority of SUD techniques will help achieve this aim
Catchment 1 in 100/200 year event
100/200 year site discharge rate to ≤ 1 in 100/200 year greenfield peak rate
Retention and detention
All events Where possible, interception
storage to prevent runoff from first 5mm of rainfall
Source control
Protect receiving drainage
system/watercourse from volume of discharge
Catchment 1 % AEP event
Where possible, long term storage/infiltration to control
1 % AEP discharge volume to ≤ 1 % AEP greenfield volumes.
Infiltration and source control
Using information produced within this SFRA and the guidance produced in Table 6-5. Each site risk identified should be then linked to criteria in Section 8 to identify appropriate SUDS techniques suitable for managing that risk.
2011s4997 SGC FINAL SFRA Level 2 v7.0.doc
57
7. Strategic Options
As discussed in Section 2.6.2, there are a number of areas within the boundaries of South Gloucestershire that are known to be at risk from flooding. It should be noted that the Bristol Avon CFMP (BACFMP) highlights the need to reduce the risk of flooding at the Eastville intake and the Northern Stormwater Interceptor. In addition, the BACFMP also highlights that measures within the upper Frome and its associated tributaries, should be taken to increase flooding for the wider benefit of the catchment.
The previous section described the first four scenarios which indicated the catchment response with regard to increased flows as a result of proposed development and climate change. Scenarios (1 -4) did not consider any strategic options. This section considers possible strategic options (scenarios 5 to 13), identified to address the impact of increased development within the catchment. These scenarios were compared against the pre-development baseline (Scenario 1).
7.1 Possible Strategic Options
This version of the SFRA considers the strategic responses to address key flood risk issues in South Gloucestershire. Strategic options are not being considered for Thornbury or the River Trym as part of this SFRA. The focus of this strategic assessment has been to indicate the potential effect of new development within South Gloucestershire Council plan area on the River Frome.
The measures have been assessed using the technical analyses performed during the preparation of the SFRA modelling and mapping. In particular this technical assessment has included:
Consideration of the risk to existing property using results from the hydraulic
modelling with both 1D ISIS, linked 1D-2D ISIS ,
Consideration of the effect of the increased volumes of runoff generated by proposed future development draining to the River Frome.
7.2 Review and Assessment of Options
On the basis of the assessment of the influential surface runoff considerations the key flood issues are:
To reduce flood risk in the centre of Bristol, particularly Eastville and the Northern Stormwater Interceptor
Identifying measures that do not cause increased volumes of flood water to contribute
to Frenchay and Eastville during events with extensive durations
To date the following options have been identified:
Storage on the Ladden Brook
Storage on the upper River Frome at Tubbs Bottom reservoir
Increased Conveyance on the Bradley Brook
Storage on the Bradley Brook
Storage on the Ladden Brook and the upper River Frome at Tubbs Bottom reservoir
The results obtained from analysis of the options using the model are summaries as follows:
7.2.1 Scenario 5 - Strategic Option 1 - Storage on the Ladden Brook - Reservoir 1
This option examines the effect of a potential in-line storage reservoir on the upper Ladden Brook near Oldclose Farm (OS 369420, 188180), see Figure 7-1.
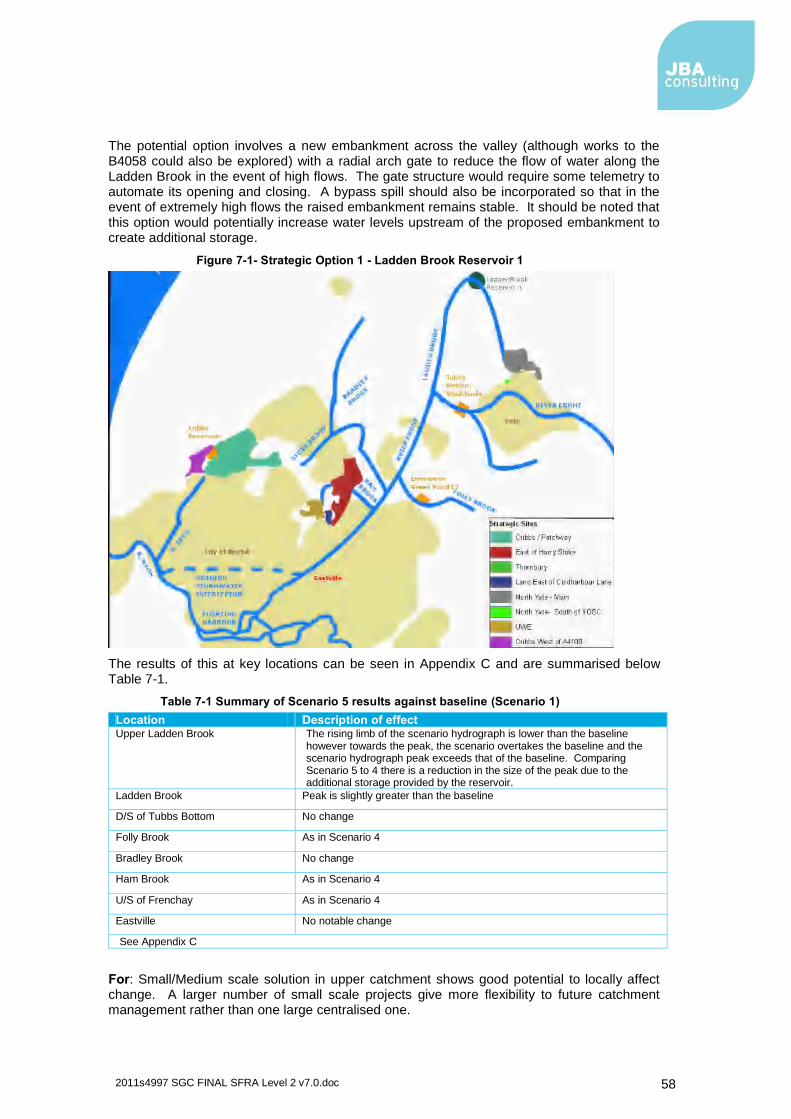
2011s4997 SGC FINAL SFRA Level 2 v7.0.doc
58
The potential option involves a new embankment across the valley (although works to the B4058 could also be explored) with a radial arch gate to reduce the flow of water along the Ladden Brook in the event of high flows. The gate structure would require some telemetry to automate its opening and closing. A bypass spill should also be incorporated so that in the event of extremely high flows the raised embankment remains stable. It should be noted that this option would potentially increase water levels upstream of the proposed embankment to create additional storage.
Figure 7-1- Strategic Option 1 - Ladden Brook Reservoir 1
The results of this at key locations can be seen in Appendix C and are summarised below Table 7-1.
Table 7-1 Summary of Scenario 5 results against baseline (Scenario 1)
Location Description of effect Upper Ladden Brook The rising limb of the scenario hydrograph is lower than the baseline
however towards the peak, the scenario overtakes the baseline and the scenario hydrograph peak exceeds that of the baseline. Comparing Scenario 5 to 4 there is a reduction in the size of the peak due to the additional storage provided by the reservoir.
Ladden Brook Peak is slightly greater than the baseline
D/S of Tubbs Bottom No change
Folly Brook As in Scenario 4
Bradley Brook No change
Ham Brook As in Scenario 4
U/S of Frenchay As in Scenario 4
Eastville No notable change
See Appendix C
For: Small/Medium scale solution in upper catchment shows good potential to locally affect change. A larger number of small scale projects give more flexibility to future catchment management rather than one large centralised one.
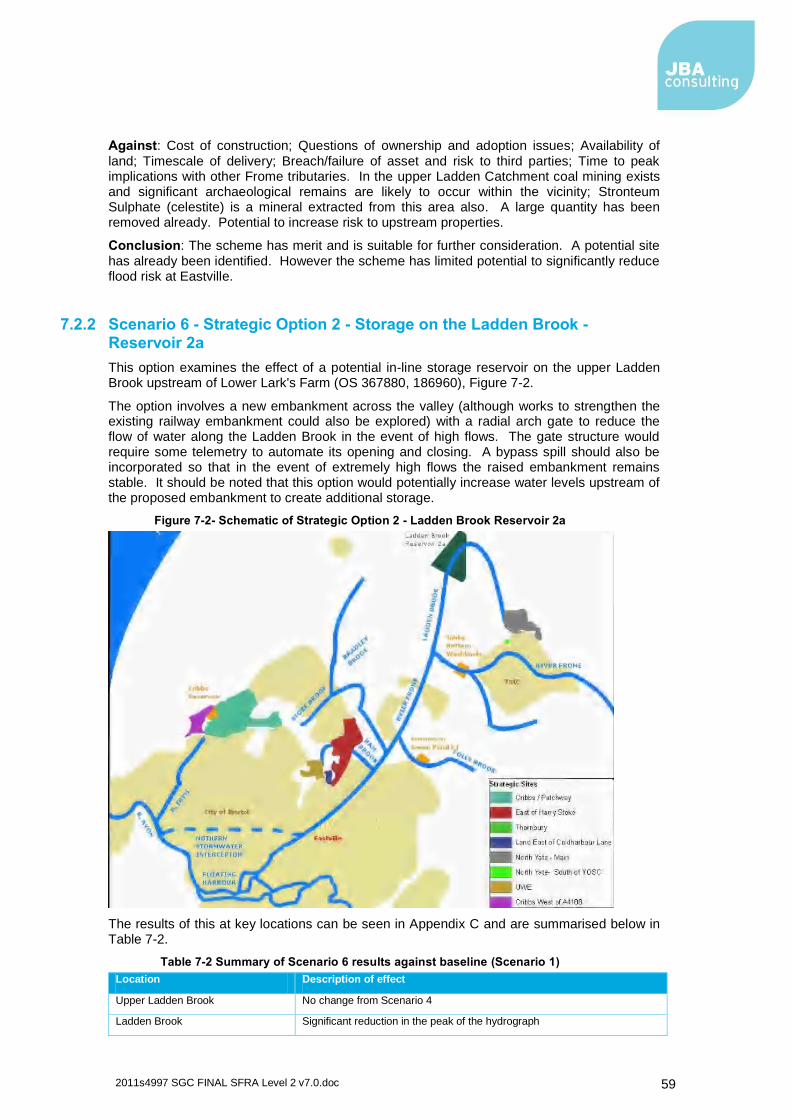
2011s4997 SGC FINAL SFRA Level 2 v7.0.doc
59
Against: Cost of construction; Questions of ownership and adoption issues; Availability of land; Timescale of delivery; Breach/failure of asset and risk to third parties; Time to peak implications with other Frome tributaries. In the upper Ladden Catchment coal mining exists and significant archaeological remains are likely to occur within the vicinity; Stronteum Sulphate (celestite) is a mineral extracted from this area also. A large quantity has been removed already. Potential to increase risk to upstream properties.
Conclusion: The scheme has merit and is suitable for further consideration. A potential site has already been identified. However the scheme has limited potential to significantly reduce flood risk at Eastville.
7.2.2 Scenario 6 - Strategic Option 2 - Storage on the Ladden Brook - Reservoir 2a
This option examines the effect of a potential in-line storage reservoir on the upper Ladden Brook upstream of Lower Lark's Farm (OS 367880, 186960), Figure 7-2.
The option involves a new embankment across the valley (although works to strengthen the existing railway embankment could also be explored) with a radial arch gate to reduce the flow of water along the Ladden Brook in the event of high flows. The gate structure would require some telemetry to automate its opening and closing. A bypass spill should also be incorporated so that in the event of extremely high flows the raised embankment remains stable. It should be noted that this option would potentially increase water levels upstream of the proposed embankment to create additional storage.
Figure 7-2- Schematic of Strategic Option 2 - Ladden Brook Reservoir 2a
The results of this at key locations can be seen in Appendix C and are summarised below in Table 7-2.
Table 7-2 Summary of Scenario 6 results against baseline (Scenario 1)
Location Description of effect
Upper Ladden Brook No change from Scenario 4
Ladden Brook Significant reduction in the peak of the hydrograph
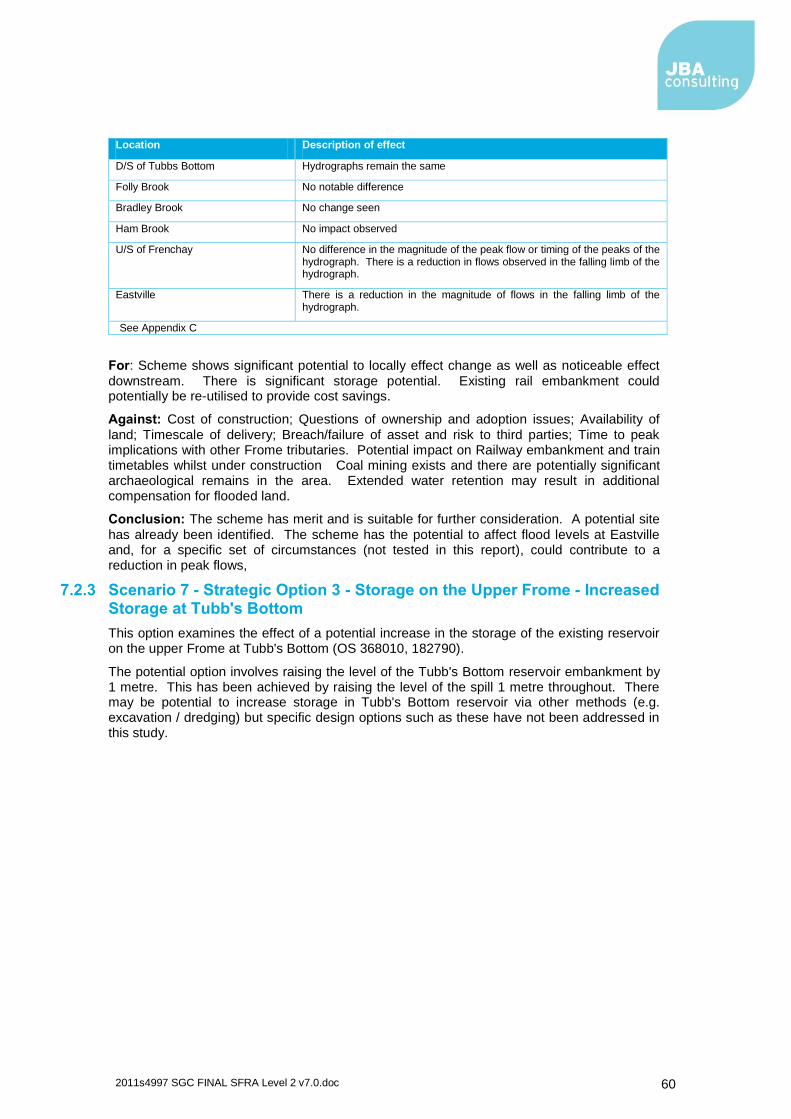
2011s4997 SGC FINAL SFRA Level 2 v7.0.doc
60
Location Description of effect
D/S of Tubbs Bottom Hydrographs remain the same
Folly Brook No notable difference
Bradley Brook No change seen
Ham Brook No impact observed
U/S of Frenchay No difference in the magnitude of the peak flow or timing of the peaks of the hydrograph. There is a reduction in flows observed in the falling limb of the hydrograph.
Eastville There is a reduction in the magnitude of flows in the falling limb of the hydrograph.
See Appendix C
For: Scheme shows significant potential to locally effect change as well as noticeable effect
downstream. There is significant storage potential. Existing rail embankment could potentially be re-utilised to provide cost savings.
Against: Cost of construction; Questions of ownership and adoption issues; Availability of land; Timescale of delivery; Breach/failure of asset and risk to third parties; Time to peak implications with other Frome tributaries. Potential impact on Railway embankment and train timetables whilst under construction Coal mining exists and there are potentially significant archaeological remains in the area. Extended water retention may result in additional compensation for flooded land.
Conclusion: The scheme has merit and is suitable for further consideration. A potential site
has already been identified. The scheme has the potential to affect flood levels at Eastville and, for a specific set of circumstances (not tested in this report), could contribute to a reduction in peak flows,
7.2.3 Scenario 7 - Strategic Option 3 - Storage on the Upper Frome - Increased Storage at Tubb's Bottom
This option examines the effect of a potential increase in the storage of the existing reservoir on the upper Frome at Tubb's Bottom (OS 368010, 182790).
The potential option involves raising the level of the Tubb's Bottom reservoir embankment by 1 metre. This has been achieved by raising the level of the spill 1 metre throughout. There may be potential to increase storage in Tubb's Bottom reservoir via other methods (e.g. excavation / dredging) but specific design options such as these have not been addressed in this study.
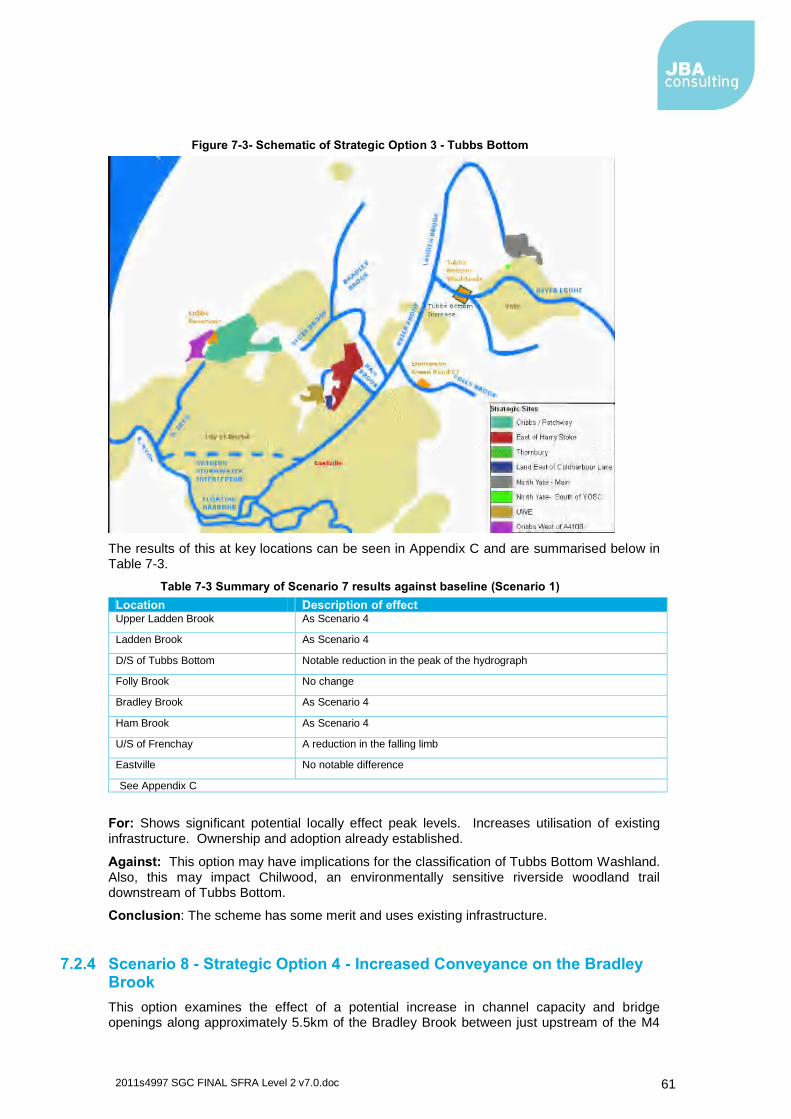
2011s4997 SGC FINAL SFRA Level 2 v7.0.doc
61
Figure 7-3- Schematic of Strategic Option 3 - Tubbs Bottom
The results of this at key locations can be seen in Appendix C and are summarised below in Table 7-3.
Table 7-3 Summary of Scenario 7 results against baseline (Scenario 1)
Location Description of effect Upper Ladden Brook As Scenario 4
Ladden Brook As Scenario 4
D/S of Tubbs Bottom Notable reduction in the peak of the hydrograph
Folly Brook No change
Bradley Brook As Scenario 4
Ham Brook As Scenario 4
U/S of Frenchay A reduction in the falling limb
Eastville No notable difference
See Appendix C
For: Shows significant potential locally effect peak levels. Increases utilisation of existing infrastructure. Ownership and adoption already established.
Against: This option may have implications for the classification of Tubbs Bottom Washland. Also, this may impact Chilwood, an environmentally sensitive riverside woodland trail downstream of Tubbs Bottom.
Conclusion: The scheme has some merit and uses existing infrastructure.
7.2.4 Scenario 8 - Strategic Option 4 - Increased Conveyance on the Bradley Brook
This option examines the effect of a potential increase in channel capacity and bridge openings along approximately 5.5km of the Bradley Brook between just upstream of the M4
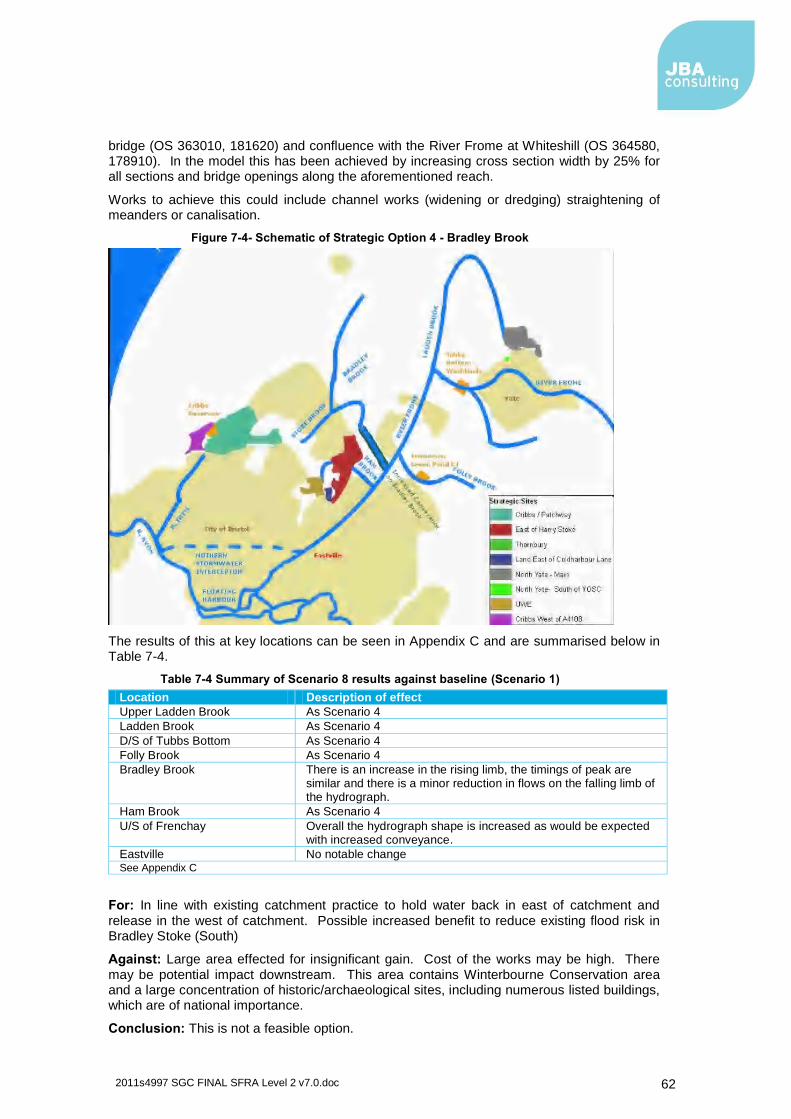
2011s4997 SGC FINAL SFRA Level 2 v7.0.doc
62
bridge (OS 363010, 181620) and confluence with the River Frome at Whiteshill (OS 364580, 178910). In the model this has been achieved by increasing cross section width by 25% for all sections and bridge openings along the aforementioned reach.
Works to achieve this could include channel works (widening or dredging) straightening of meanders or canalisation.
Figure 7-4- Schematic of Strategic Option 4 - Bradley Brook
The results of this at key locations can be seen in Appendix C and are summarised below in Table 7-4.
Table 7-4 Summary of Scenario 8 results against baseline (Scenario 1)
Location Description of effect
Upper Ladden Brook As Scenario 4
Ladden Brook As Scenario 4
D/S of Tubbs Bottom As Scenario 4
Folly Brook As Scenario 4
Bradley Brook There is an increase in the rising limb, the timings of peak are similar and there is a minor reduction in flows on the falling limb of the hydrograph.
Ham Brook As Scenario 4
U/S of Frenchay Overall the hydrograph shape is increased as would be expected with increased conveyance.
Eastville No notable change See Appendix C
For: In line with existing catchment practice to hold water back in east of catchment and release in the west of catchment. Possible increased benefit to reduce existing flood risk in Bradley Stoke (South)
Against: Large area effected for insignificant gain. Cost of the works may be high. There
may be potential impact downstream. This area contains Winterbourne Conservation area and a large concentration of historic/archaeological sites, including numerous listed buildings, which are of national importance.
Conclusion: This is not a feasible option.
2011s4997 SGC FINAL SFRA Level 2 v7.0.doc
63
7.2.5 Scenario 9 - Strategic Option 5 - Storage on the Ladden Brook - Reservoir 2b
This option examines the effect of different operating rules on the potential in-line storage reservoir on the upper Ladden Brook upstream of Lower Lark's Farm (OS 367879, 186959). It is a variation of option 2 previously outlined in Section 7.2.2.
As per Section 7.2.2, this potential option involves a new embankment across the valley upstream of Lower Lark's Farm. This scenario tests the operational rules of the gate structure in the embankment to see the effect of releasing less water during an event and delaying re-opening the gates post event. It should be noted that this option would potentially increase water levels upstream of the proposed embankment to create additional storage.
Figure 7-5- Schematic of Strategic Option 5 - Ladden Brook Reservoir 2b
The results of this at key locations can be seen in Appendix C and are summarised below in Table 7-5.
Table 7-5 Summary of Scenario 9 results against baseline (Scenario 1)
Location Description of effect
Upper Ladden Brook As Scenario 4
Ladden Brook As Scenario 6 (reservoir 2a), there is a reduction in the peak. The difference between Scenario 9 and 6 is the timing of the peaks. In Scenario 9, the peak is later than Scenario 6.
D/S of Tubbs Bottom No impact
Folly Brook No notable difference
Bradley Brook As Scenario 4
Ham Brook As Scenario 4
U/S of Frenchay With this Scenario the reduction in the falling limb of the hydrograph is more pronounced.
Eastville Again, as with Scenario 6, the falling limb is lowered. See Appendix C
For: Scheme shows significant potential to locally effect change as well as noticeable effect downstream. This is potential for significant storage.
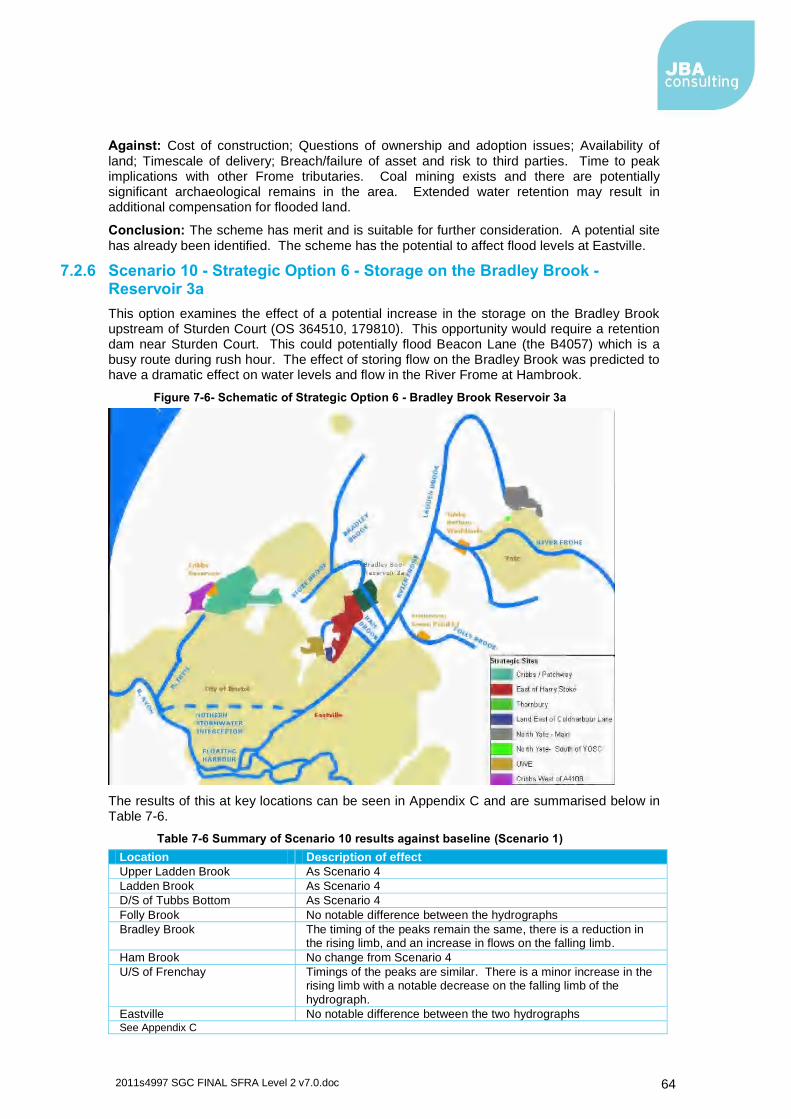
2011s4997 SGC FINAL SFRA Level 2 v7.0.doc
64
Against: Cost of construction; Questions of ownership and adoption issues; Availability of land; Timescale of delivery; Breach/failure of asset and risk to third parties. Time to peak implications with other Frome tributaries. Coal mining exists and there are potentially significant archaeological remains in the area. Extended water retention may result in additional compensation for flooded land.
Conclusion: The scheme has merit and is suitable for further consideration. A potential site
has already been identified. The scheme has the potential to affect flood levels at Eastville.
7.2.6 Scenario 10 - Strategic Option 6 - Storage on the Bradley Brook - Reservoir 3a
This option examines the effect of a potential increase in the storage on the Bradley Brook upstream of Sturden Court (OS 364510, 179810). This opportunity would require a retention dam near Sturden Court. This could potentially flood Beacon Lane (the B4057) which is a busy route during rush hour. The effect of storing flow on the Bradley Brook was predicted to have a dramatic effect on water levels and flow in the River Frome at Hambrook.
Figure 7-6- Schematic of Strategic Option 6 - Bradley Brook Reservoir 3a
The results of this at key locations can be seen in Appendix C and are summarised below in Table 7-6.
Table 7-6 Summary of Scenario 10 results against baseline (Scenario 1)
Location Description of effect
Upper Ladden Brook As Scenario 4
Ladden Brook As Scenario 4
D/S of Tubbs Bottom As Scenario 4
Folly Brook No notable difference between the hydrographs
Bradley Brook The timing of the peaks remain the same, there is a reduction in the rising limb, and an increase in flows on the falling limb.
Ham Brook No change from Scenario 4
U/S of Frenchay Timings of the peaks are similar. There is a minor increase in the rising limb with a notable decrease on the falling limb of the
hydrograph.
Eastville No notable difference between the two hydrographs See Appendix C
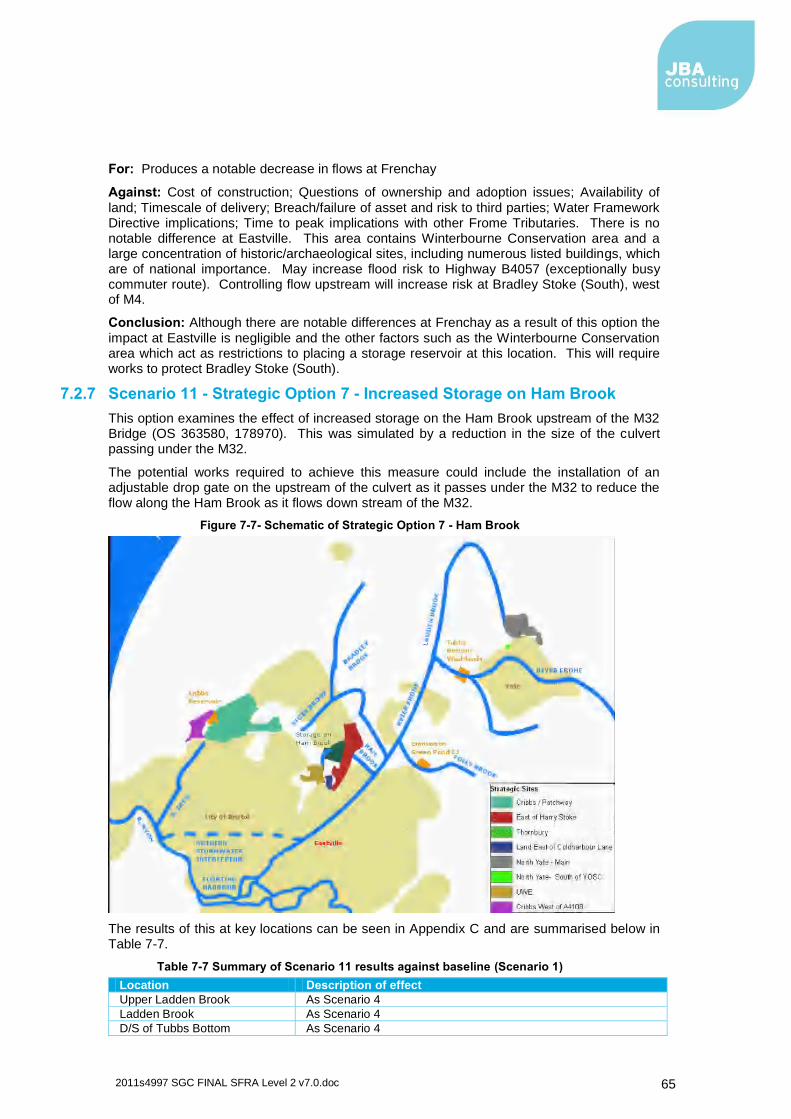
2011s4997 SGC FINAL SFRA Level 2 v7.0.doc
65
For: Produces a notable decrease in flows at Frenchay
Against: Cost of construction; Questions of ownership and adoption issues; Availability of
land; Timescale of delivery; Breach/failure of asset and risk to third parties; Water Framework Directive implications; Time to peak implications with other Frome Tributaries. There is no notable difference at Eastville. This area contains Winterbourne Conservation area and a large concentration of historic/archaeological sites, including numerous listed buildings, which are of national importance. May increase flood risk to Highway B4057 (exceptionally busy commuter route). Controlling flow upstream will increase risk at Bradley Stoke (South), west of M4.
Conclusion: Although there are notable differences at Frenchay as a result of this option the impact at Eastville is negligible and the other factors such as the Winterbourne Conservation area which act as restrictions to placing a storage reservoir at this location. This will require works to protect Bradley Stoke (South).
7.2.7 Scenario 11 - Strategic Option 7 - Increased Storage on Ham Brook
This option examines the effect of increased storage on the Ham Brook upstream of the M32 Bridge (OS 363580, 178970). This was simulated by a reduction in the size of the culvert passing under the M32.
The potential works required to achieve this measure could include the installation of an adjustable drop gate on the upstream of the culvert as it passes under the M32 to reduce the flow along the Ham Brook as it flows down stream of the M32.
Figure 7-7- Schematic of Strategic Option 7 - Ham Brook
The results of this at key locations can be seen in Appendix C and are summarised below in Table 7-7.
Table 7-7 Summary of Scenario 11 results against baseline (Scenario 1)
Location Description of effect
Upper Ladden Brook As Scenario 4
Ladden Brook As Scenario 4
D/S of Tubbs Bottom As Scenario 4
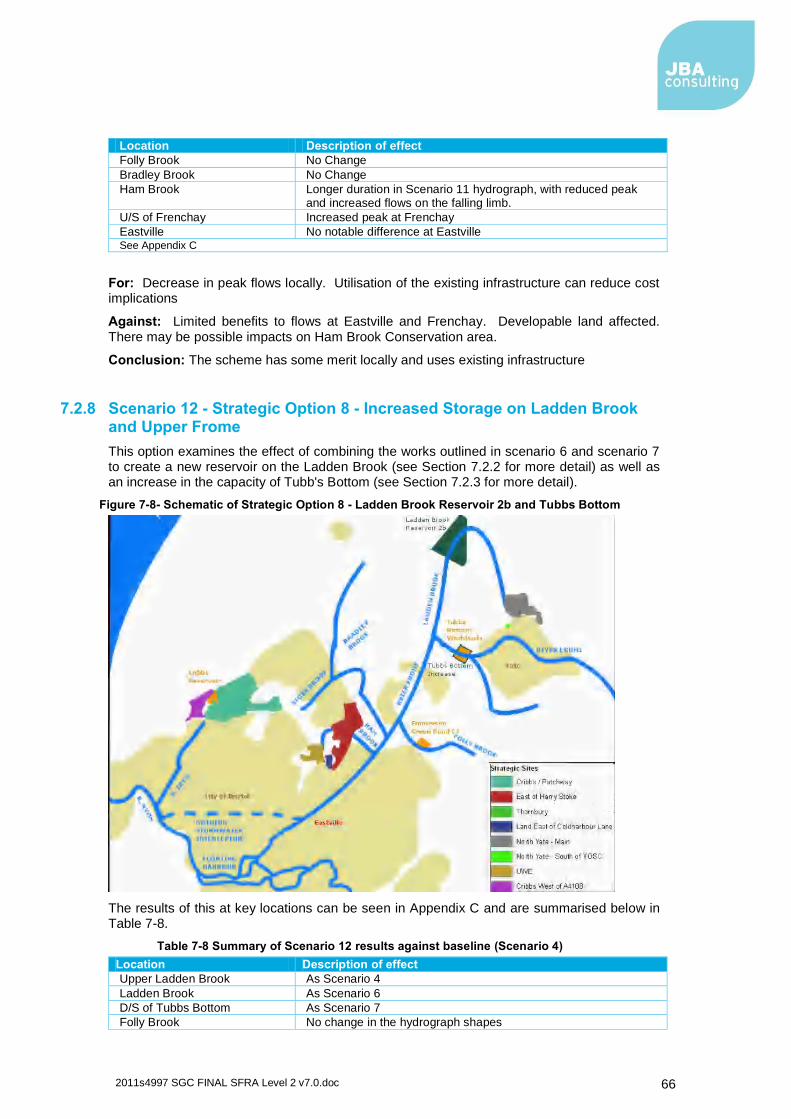
2011s4997 SGC FINAL SFRA Level 2 v7.0.doc
66
Location Description of effect
Folly Brook No Change
Bradley Brook No Change
Ham Brook Longer duration in Scenario 11 hydrograph, with reduced peak and increased flows on the falling limb.
U/S of Frenchay Increased peak at Frenchay
Eastville No notable difference at Eastville See Appendix C
For: Decrease in peak flows locally. Utilisation of the existing infrastructure can reduce cost implications
Against: Limited benefits to flows at Eastville and Frenchay. Developable land affected. There may be possible impacts on Ham Brook Conservation area.
Conclusion: The scheme has some merit locally and uses existing infrastructure
7.2.8 Scenario 12 - Strategic Option 8 - Increased Storage on Ladden Brook and Upper Frome
This option examines the effect of combining the works outlined in scenario 6 and scenario 7 to create a new reservoir on the Ladden Brook (see Section 7.2.2 for more detail) as well as an increase in the capacity of Tubb's Bottom (see Section 7.2.3 for more detail).
Figure 7-8- Schematic of Strategic Option 8 - Ladden Brook Reservoir 2b and Tubbs Bottom
The results of this at key locations can be seen in Appendix C and are summarised below in Table 7-8.
Table 7-8 Summary of Scenario 12 results against baseline (Scenario 4)
Location Description of effect
Upper Ladden Brook As Scenario 4
Ladden Brook As Scenario 6
D/S of Tubbs Bottom As Scenario 7
Folly Brook No change in the hydrograph shapes
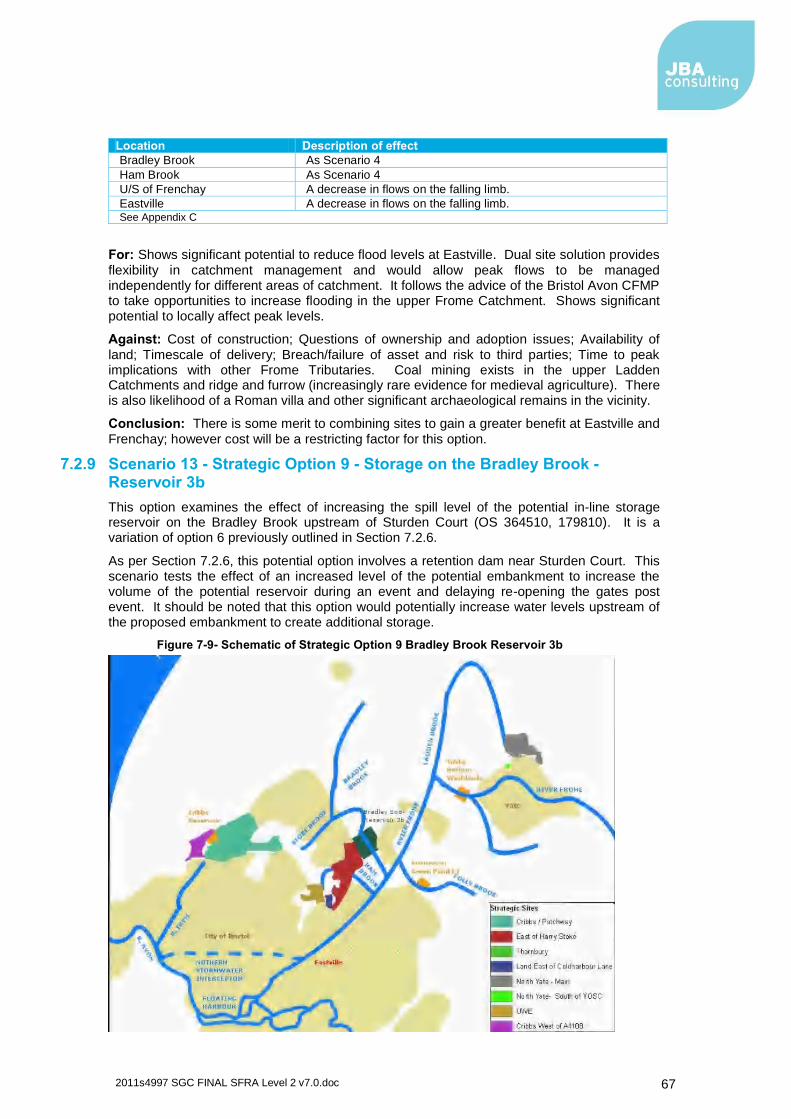
2011s4997 SGC FINAL SFRA Level 2 v7.0.doc
67
Location Description of effect
Bradley Brook As Scenario 4
Ham Brook As Scenario 4
U/S of Frenchay A decrease in flows on the falling limb.
Eastville A decrease in flows on the falling limb. See Appendix C
For: Shows significant potential to reduce flood levels at Eastville. Dual site solution provides
flexibility in catchment management and would allow peak flows to be managed independently for different areas of catchment. It follows the advice of the Bristol Avon CFMP to take opportunities to increase flooding in the upper Frome Catchment. Shows significant potential to locally affect peak levels.
Against: Cost of construction; Questions of ownership and adoption issues; Availability of
land; Timescale of delivery; Breach/failure of asset and risk to third parties; Time to peak implications with other Frome Tributaries. Coal mining exists in the upper Ladden Catchments and ridge and furrow (increasingly rare evidence for medieval agriculture). There is also likelihood of a Roman villa and other significant archaeological remains in the vicinity.
Conclusion: There is some merit to combining sites to gain a greater benefit at Eastville and
Frenchay; however cost will be a restricting factor for this option.
7.2.9 Scenario 13 - Strategic Option 9 - Storage on the Bradley Brook - Reservoir 3b
This option examines the effect of increasing the spill level of the potential in-line storage reservoir on the Bradley Brook upstream of Sturden Court (OS 364510, 179810). It is a variation of option 6 previously outlined in Section 7.2.6.
As per Section 7.2.6, this potential option involves a retention dam near Sturden Court. This scenario tests the effect of an increased level of the potential embankment to increase the volume of the potential reservoir during an event and delaying re-opening the gates post event. It should be noted that this option would potentially increase water levels upstream of the proposed embankment to create additional storage.
Figure 7-9- Schematic of Strategic Option 9 Bradley Brook Reservoir 3b
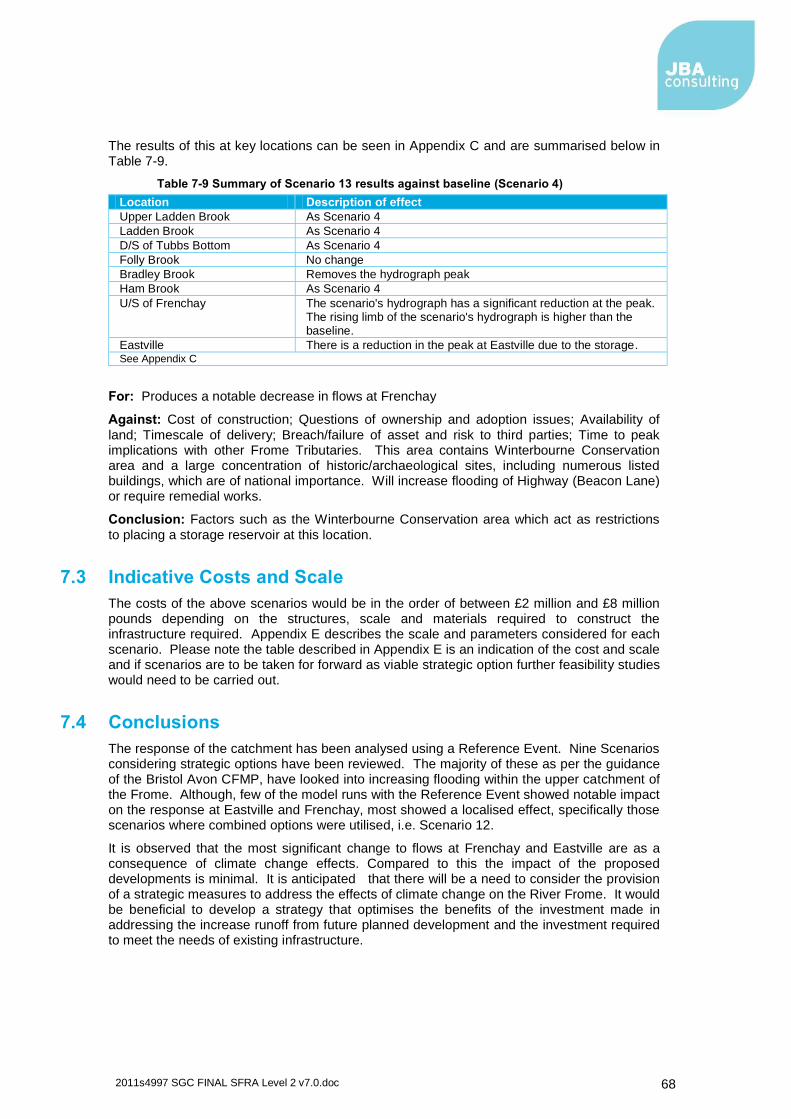
2011s4997 SGC FINAL SFRA Level 2 v7.0.doc
68
The results of this at key locations can be seen in Appendix C and are summarised below in Table 7-9.
Table 7-9 Summary of Scenario 13 results against baseline (Scenario 4)
Location Description of effect
Upper Ladden Brook As Scenario 4
Ladden Brook As Scenario 4
D/S of Tubbs Bottom As Scenario 4
Folly Brook No change
Bradley Brook Removes the hydrograph peak
Ham Brook As Scenario 4
U/S of Frenchay The scenario's hydrograph has a significant reduction at the peak. The rising limb of the scenario's hydrograph is higher than the baseline.
Eastville There is a reduction in the peak at Eastville due to the storage. See Appendix C
For: Produces a notable decrease in flows at Frenchay
Against: Cost of construction; Questions of ownership and adoption issues; Availability of
land; Timescale of delivery; Breach/failure of asset and risk to third parties; Time to peak implications with other Frome Tributaries. This area contains Winterbourne Conservation area and a large concentration of historic/archaeological sites, including numerous listed buildings, which are of national importance. Will increase flooding of Highway (Beacon Lane) or require remedial works.
Conclusion: Factors such as the Winterbourne Conservation area which act as restrictions
to placing a storage reservoir at this location.
7.3 Indicative Costs and Scale
The costs of the above scenarios would be in the order of between £2 million and £8 million pounds depending on the structures, scale and materials required to construct the infrastructure required. Appendix E describes the scale and parameters considered for each scenario. Please note the table described in Appendix E is an indication of the cost and scale and if scenarios are to be taken for forward as viable strategic option further feasibility studies would need to be carried out.
7.4 Conclusions
The response of the catchment has been analysed using a Reference Event. Nine Scenarios considering strategic options have been reviewed. The majority of these as per the guidance of the Bristol Avon CFMP, have looked into increasing flooding within the upper catchment of the Frome. Although, few of the model runs with the Reference Event showed notable impact on the response at Eastville and Frenchay, most showed a localised effect, specifically those scenarios where combined options were utilised, i.e. Scenario 12.
It is observed that the most significant change to flows at Frenchay and Eastville are as a consequence of climate change effects. Compared to this the impact of the proposed developments is minimal. It is anticipated that there will be a need to consider the provision of a strategic measures to address the effects of climate change on the River Frome. It would be beneficial to develop a strategy that optimises the benefits of the investment made in addressing the increase runoff from future planned development and the investment required to meet the needs of existing infrastructure.
2011s4997 SGC FINAL SFRA Level 2 v7.0.doc
69
8. Summary Assessment of Core Strategy Development Sites
8.1 Introduction
A high-level assessment of the following development sites has been undertaken:
1. Cribbs/Patchway New Neighbourhood and Post 2020 Contingency Site to the West
of A4108 (Cribbs Causeway)
2. North Yate New Neighbourhood - Main and South of Yate Outdoor Sports Complex
(YOSC)
3. West of M32 Area
o 3.1 Harry Stoke
o 3.2 Land East of Coldharbour Lane
o 3.3 The University of the West of England
4. Thornbury Housing Opportunity
The Core Strategy development site summary tables consider the following:
Type of development proposed;
Which Flood Zone the site located within;
Depth of flooding possible at the site;
Are access routes affected;
Implications of Climate Change;
Assessment of Hazard.
The associated maps are:
Flood Zone mapping; mapping of water depths for the 100 year and 100 year plus
climate change events (where available);
Historic flood events
and mapping of hazard rating (where available).
8.2 Summary Tables and Maps
The site summary tables and Maps can be found in Appendix A.

2011s4997 SGC FINAL SFRA Level 2 v7.0.doc
70
This page is intentionally left blank.
2011s4997 SGC FINAL SFRA Level 2 v7.0.doc
71
9. FRA Requirements
9.1 Over-Arching Principles
In line with the thrust of current and emerging government planning policy guidance and evidence from the South Gloucestershire Level 2 SFRA development proposals requiring FRAs should:
not increase flood risk elsewhere, taking into account the impacts of climate change;
not increase surface water volumes or peak flow rates, as this would result in an increased flood risk to the receiving catchments;
where practicable use the opportunities offered by new development to reduce flood
risk within the site and elsewhere; and
ensure that where new development is, exceptionally, necessary in areas of flood risk it is made safe from flooding for the lifetime of the development, taking into account
the impacts of climate change.
9.2 Requirements for Flood Risk Assessments
Flood Risk Assessments (FRA) should be carried out in accordance with Government guidance, address the South Gloucestershire SFRA Level 2 FRA Over-Arching Principles and the following matters:
Surface water attenuation solely based on matching greenfield runoff rates is not acceptable. It will be expected that long term storage is applied to protect receiving watercourse from increased surface water volumes. As part of the assessment the FRA drainage assessment must consider a restricted discharge rate (e.g. QBAR), which is fixed for all storms up to the 1% AEP with climate change. Modelling of the drainage scheme must demonstrate that the above can be achieved. Runoff from previously developed sites should be compared with existing discharge rates, however developers will be required to reduce surface water runoff rates (30%) and volumes as much as is reasonably practicable. Surface water volumes should be reduced where possible through the use of infiltration and attenuation.
The critical duration of the receiving watercourse will need to be determined to
ensure that sufficient storage is being provided.
It is critical that the onsite drainage models demonstrate that there is no increased flood risk downstream. On-site attenuation schemes within the catchment of the Bristol Frome and Henbury Trym must be tested against the Environment Agency‟s Bristol Frome and Henbury Trym models to ensure that there is no net hydrological increase downstream. The scope of the downstream assessment will need to be agreed with the Environment Agency. This element of the assessment may result in
additional storage being required onsite.
Exemplar SUDS schemes, which follow best practices outlined CIRIA C697, must be brought forward within the FRA. In particular it will be expected that a range of SUDS has been applied to ensure that water quality is not diminished and water quantity is not increased as a result of the development.
The authority or company who will be adopting the SUDS drainage scheme must be
clearly articulated.
Further detailed site specific FRA guidance is provided for each Core Strategy strategic development site in Appendix A.

2011s4997 SGC FINAL SFRA Level 2 v7.0.doc
72
This page is intentionally left blank.
2011s4997 SGC FINAL SFRA Level 2 v7.0.doc
73
10. Outcomes
10.1 Summary of Work Undertaken
The Level 2 SFRA has identified the risk that flooding poses to property and life at each of the potential development sites identified in the Core Strategy.
Taking into consideration all sources of flooding the Level 2 SFRA has assessed how the sites affect flood risk and identifies the issues that should be taken into consideration when they are developed.
Using a simplified approach, based on a reference flood event, an assessment has been made of the potential opportunities, within the River Frome catchment, to implement strategic options to identify/determine if a strategic flood risk reduction could be achieved at Frenchay and Eastville".
The assessment identified that under climate change conditions (without Core Strategy proposed development) the flows at Frenchay and Eastville are predicted to increase significantly.
10.2 Outcomes
10.2.1 Individual Core Strategy Development Sites
Flood risk has been identified on all the sites highlighted within the Core Strategy from both surface water runoff and fluvial sources. However, by considering the risk during the lifetime of the proposed development, by influencing the design and layout of the development sites and the land uses proposed, it is feasible to mitigate flood risk on these sites.
The key requirements for future development are summarised below:
All sites within Zones 2 and 3 will require a detailed Flood Risk Assessment in accordance PPS25, making reference to Section 8 and associated maps of this report. It will be necessary for all potential developers to carry out a topographic survey to establish more accurately ground levels within the site. Consultation with the Environment Agency is strongly recommended at an early stage in the FRA process.
The layout of buildings and access routes should adopt a sequential approach, steering buildings (and hence people) towards areas of lowest risk within the boundaries of the site. This will also ensure that the risk of flooding is not worsened
by, for example, blocked flood flow routes.
The FRA requirements defined in Section 9 of the Level 2 SFRA must be applied to all future development brought forward. Further detailed guidance on the Core
Strategy development sites is provided in Appendix A
10.2.2 Impact on Catchments and Off-Site Strategic Storage Options
The greatest impact upon all the catchments is the impact of climate change.
Climate change causes a marked increase in flows on the River Frome catchment specifically at Frenchay and Eastville.
The impacts of the development on the River Frome catchment were assessed in the following ways:
Unattenuated (without SuDS)
Attenuated (with SuDS)
Strategic Option 1: Storage on the Ladden Brook - Reservoir 1
Strategic Option 2: Storage on the Ladden Brook - Reservoir 2a
2011s4997 SGC FINAL SFRA Level 2 v7.0.doc
74
Strategic Option 3: Storage on the upper Frome - Increase Storage in Tubb's Bottom
Strategic Option 4: Increased Conveyance on the Bradley Brook
Strategic Option 5: Storage on the Ladden Brook - Reservoir 2b
Strategic Option 6: Storage on the Bradley Brook - Reservoir 3a
Strategic Option 7: Increased Storage on Ham Brook
Strategic Option 8: Increased Storage on Ladden Brook and upper Frome
Strategic Option 9: Storage on the Bradley Brook - Reservoir 3b
Although the individual strategic storage options tested made a difference locally and some had a minor impact at Frenchay (within the limits of the method adopted); for the majority of the options there was no notable difference at Eastville.
The strategic option to provide storage on Bradley Brook was the exception. This option provided the only appreciable reduction of peak flows at Eastville.
Combining options together indicated that reduced flows at Eastville and Frenchay could be achieved.
However there are significant problems with implementing an off-site strategic storage approach:
It is anticipated that there would be significant delay in implementation and that this would, as a consequence, have implications for the delivery of development identified in the Core Strategy. Delay is likely to arise as the result of the time required to identify a suitable site, a willing land owner(s), land acquisition and ensure legal matters such as future ownership and adoption of off-site solutions are satisfactorily
completed.
There are other material considerations, such as the impact on the historic and natural environment and possible impacts on transport infrastructure and risks to third parties from possible breach/failure of options, which also need to be robustly assessed and which may rule out certain strategic options. The initial evidence provided in this report indicates that these constraints are significant in the majority of the options considered.
The initial indicative costs identified in this report (at Appendix E) for the strategic options confirm that funding is a significant issue. Any funds sought through the planning process, from Core Strategy development, would need to comply with Circular 05/2005 and the CIL Regulations. Therefore any funding contributions would need to be necessary to make the development acceptable in planning terms, would need to be directly related to the development and be fairly and reasonably related in scale and kind to the development. Evidence from the SFRA Level 2 suggests the impact on the River Frome catchment from development proposed in the Core Strategy is limited, when compared with the impact of climate change and the impact
from existing development in the area.
For the above reasons the off-site strategic option approach to the River Frome catchment will not be taken forward and on-site attenuation will be required to mitigate flood risk associated with the development sites in the Core Strategy. However, the FRAs for individual sites should include assessments of the impact of the surface water management proposals on the flows at Frenchay and Eastville. The SFRA Level 2 analysis has identified a localised increase in peak flows on some of the River Frome sub catchments in attenuated development scenarios. Proposed development area FRAs must ensure that sufficient attenuation is provided to ensure these localised risks are mitigated.
The SFRA Level 2 analysis has shown that there is negligible impact on peak flows on the catchments of Pickedmoor Brook and Trym from on-site attenuated development at Thornbury and Cribbs/Patchway. Individual FRAs prepared to support these proposed developments must ensure that peak flows are mitigated.

2011s4997 SGC FINAL SFRA Level 2 v7.0.doc
75
All FRAs should comply with the requirements set out in Chapter 9 of this document.
It is important to recognise that the SFRA has been developed using the best available information at the time of writing. This relates both to the current risk of flooding from rivers, and the potential impacts of future climate change. The Environment Agency regularly reviews their flood risk mapping, and it is important that they are approached to determine whether updated (more accurate) information is available prior to commencing a detailed Flood Risk Assessment.
2011s4997 SGC FINAL SFRA Level 2 v7.0.doc I
Appendices
A. Strategic Site Summary Tables and Maps
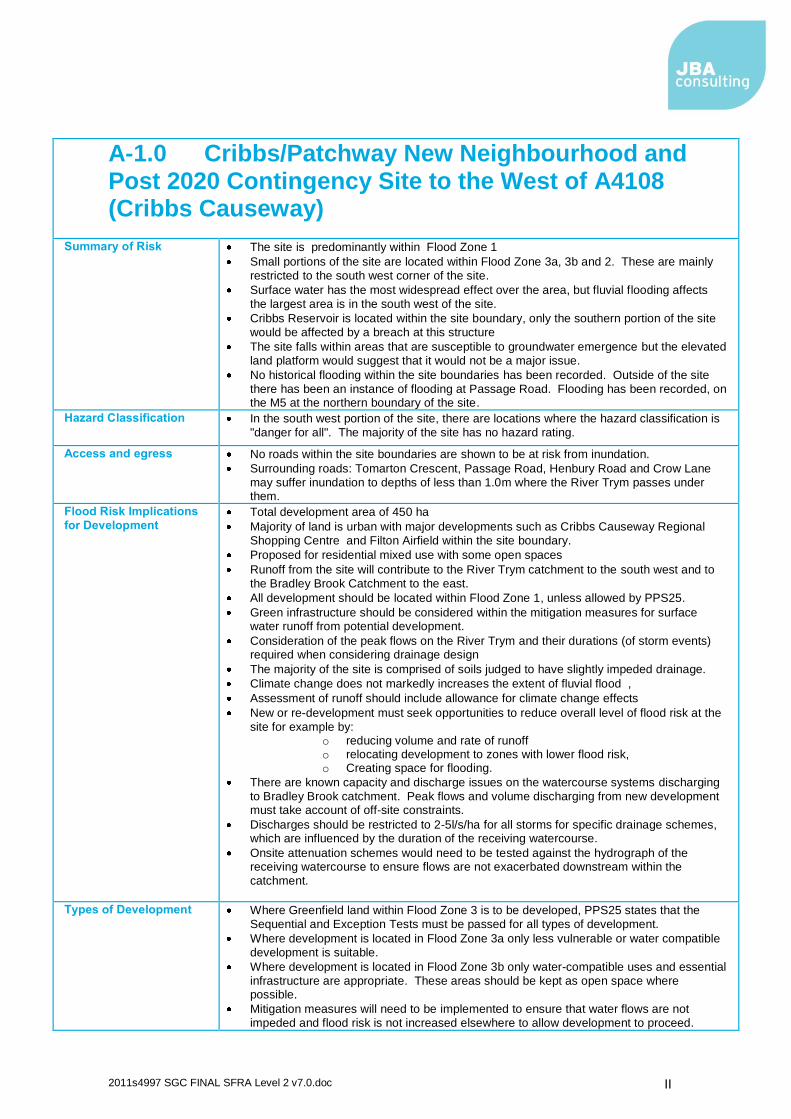
2011s4997 SGC FINAL SFRA Level 2 v7.0.doc II
A-1.0 Cribbs/Patchway New Neighbourhood and Post 2020 Contingency Site to the West of A4108 (Cribbs Causeway)
Summary of Risk The site is predominantly within Flood Zone 1
Small portions of the site are located within Flood Zone 3a, 3b and 2. These are mainly
restricted to the south west corner of the site.
Surface water has the most widespread effect over the area, but fluvial flooding affects
the largest area is in the south west of the site.
Cribbs Reservoir is located within the site boundary, only the southern portion of the site
would be affected by a breach at this structure
The site falls within areas that are susceptible to groundwater emergence but the elevated
land platform would suggest that it would not be a major issue.
No historical flooding within the site boundaries has been recorded. Outside of the site
there has been an instance of flooding at Passage Road. Flooding has been recorded, on the M5 at the northern boundary of the site.
Hazard Classification In the south west portion of the site, there are locations where the hazard classification is
"danger for all". The majority of the site has no hazard rating.
Access and egress No roads within the site boundaries are shown to be at risk from inundation.
Surrounding roads: Tomarton Crescent, Passage Road, Henbury Road and Crow Lane
may suffer inundation to depths of less than 1.0m where the River Trym passes under them.
Flood Risk Implications
for Development Total development area of 450 ha
Majority of land is urban with major developments such as Cribbs Causeway Regional
Shopping Centre and Filton Airfield within the site boundary.
Proposed for residential mixed use with some open spaces
Runoff from the site will contribute to the River Trym catchment to the south west and to
the Bradley Brook Catchment to the east.
All development should be located within Flood Zone 1, unless allowed by PPS25.
Green infrastructure should be considered within the mitigation measures for surface water runoff from potential development.
Consideration of the peak flows on the River Trym and their durations (of storm events) required when considering drainage design
The majority of the site is comprised of soils judged to have slightly impeded drainage.
Climate change does not markedly increases the extent of fluvial flood ,
Assessment of runoff should include allowance for climate change effects
New or re-development must seek opportunities to reduce overall level of flood risk at the
site for example by: o reducing volume and rate of runoff o relocating development to zones with lower flood risk, o Creating space for flooding.
There are known capacity and discharge issues on the watercourse systems discharging
to Bradley Brook catchment. Peak flows and volume discharging from new development must take account of off-site constraints.
Discharges should be restricted to 2-5l/s/ha for all storms for specific drainage schemes, which are influenced by the duration of the receiving watercourse.
Onsite attenuation schemes would need to be tested against the hydrograph of the receiving watercourse to ensure flows are not exacerbated downstream within the
catchment.
Types of Development Where Greenfield land within Flood Zone 3 is to be developed, PPS25 states that the
Sequential and Exception Tests must be passed for all types of development.
Where development is located in Flood Zone 3a only less vulnerable or water compatible
development is suitable.
Where development is located in Flood Zone 3b only water-compatible uses and essential
infrastructure are appropriate. These areas should be kept as open space where possible.
Mitigation measures will need to be implemented to ensure that water flows are not
impeded and flood risk is not increased elsewhere to allow development to proceed.
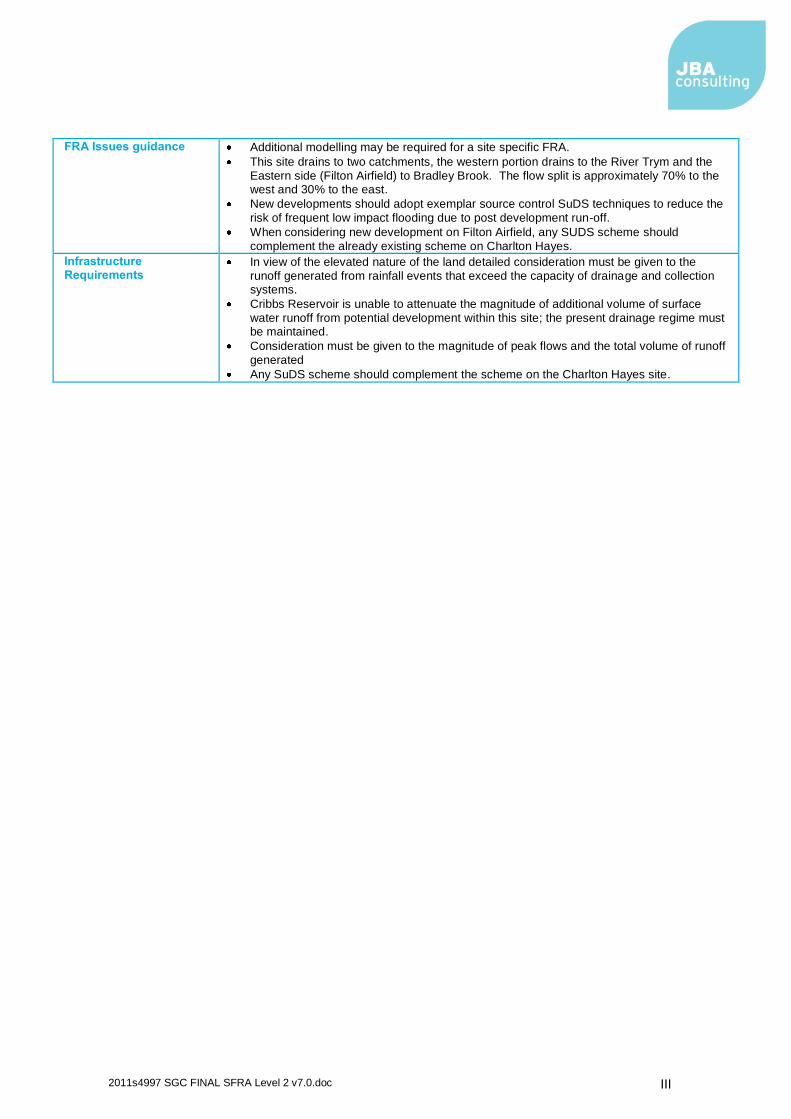
2011s4997 SGC FINAL SFRA Level 2 v7.0.doc III
FRA Issues guidance Additional modelling may be required for a site specific FRA.
This site drains to two catchments, the western portion drains to the River Trym and the
Eastern side (Filton Airfield) to Bradley Brook. The flow split is approximately 70% to the west and 30% to the east.
New developments should adopt exemplar source control SuDS techniques to reduce the
risk of frequent low impact flooding due to post development run-off.
When considering new development on Filton Airfield, any SUDS scheme should
complement the already existing scheme on Charlton Hayes.
Infrastructure Requirements
In view of the elevated nature of the land detailed consideration must be given to the
runoff generated from rainfall events that exceed the capacity of drainage and collection systems.
Cribbs Reservoir is unable to attenuate the magnitude of additional volume of surface
water runoff from potential development within this site; the present drainage regime must be maintained.
Consideration must be given to the magnitude of peak flows and the total volume of runoff
generated
Any SuDS scheme should complement the scheme on the Charlton Hayes site.
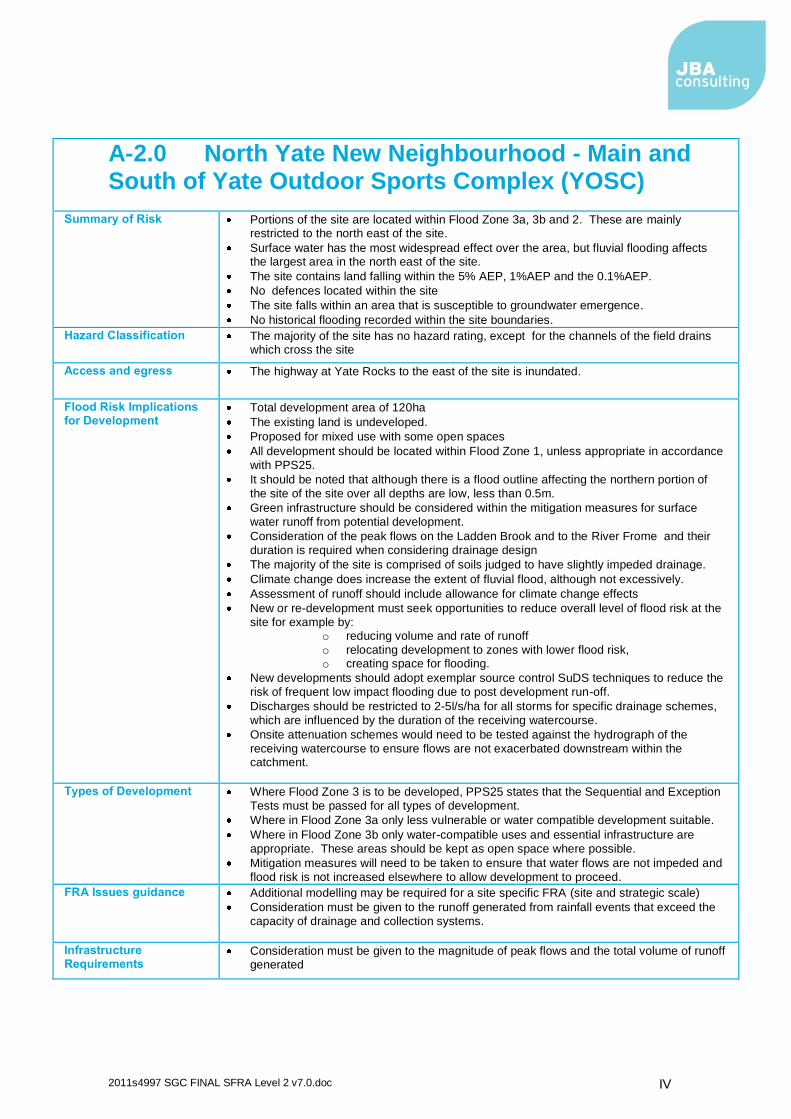
2011s4997 SGC FINAL SFRA Level 2 v7.0.doc IV
A-2.0 North Yate New Neighbourhood - Main and South of Yate Outdoor Sports Complex (YOSC)
Summary of Risk Portions of the site are located within Flood Zone 3a, 3b and 2. These are mainly restricted to the north east of the site.
Surface water has the most widespread effect over the area, but fluvial flooding affects the largest area in the north east of the site.
The site contains land falling within the 5% AEP, 1%AEP and the 0.1%AEP.
No defences located within the site
The site falls within an area that is susceptible to groundwater emergence.
No historical flooding recorded within the site boundaries.
Hazard Classification The majority of the site has no hazard rating, except for the channels of the field drains which cross the site
Access and egress The highway at Yate Rocks to the east of the site is inundated.
Flood Risk Implications for Development
Total development area of 120ha
The existing land is undeveloped.
Proposed for mixed use with some open spaces
All development should be located within Flood Zone 1, unless appropriate in accordance
with PPS25.
It should be noted that although there is a flood outline affecting the northern portion of
the site of the site over all depths are low, less than 0.5m.
Green infrastructure should be considered within the mitigation measures for surface
water runoff from potential development.
Consideration of the peak flows on the Ladden Brook and to the River Frome and their
duration is required when considering drainage design
The majority of the site is comprised of soils judged to have slightly impeded drainage.
Climate change does increase the extent of fluvial flood, although not excessively.
Assessment of runoff should include allowance for climate change effects
New or re-development must seek opportunities to reduce overall level of flood risk at the
site for example by: o reducing volume and rate of runoff
o relocating development to zones with lower flood risk, o creating space for flooding.
New developments should adopt exemplar source control SuDS techniques to reduce the
risk of frequent low impact flooding due to post development run-off.
Discharges should be restricted to 2-5l/s/ha for all storms for specific drainage schemes,
which are influenced by the duration of the receiving watercourse.
Onsite attenuation schemes would need to be tested against the hydrograph of the
receiving watercourse to ensure flows are not exacerbated downstream within the catchment.
Types of Development Where Flood Zone 3 is to be developed, PPS25 states that the Sequential and Exception
Tests must be passed for all types of development.
Where in Flood Zone 3a only less vulnerable or water compatible development suitable.
Where in Flood Zone 3b only water-compatible uses and essential infrastructure are
appropriate. These areas should be kept as open space where possible.
Mitigation measures will need to be taken to ensure that water flows are not impeded and
flood risk is not increased elsewhere to allow development to proceed.
FRA Issues guidance Additional modelling may be required for a site specific FRA (site and strategic scale)
Consideration must be given to the runoff generated from rainfall events that exceed the
capacity of drainage and collection systems.
Infrastructure Requirements
Consideration must be given to the magnitude of peak flows and the total volume of runoff generated
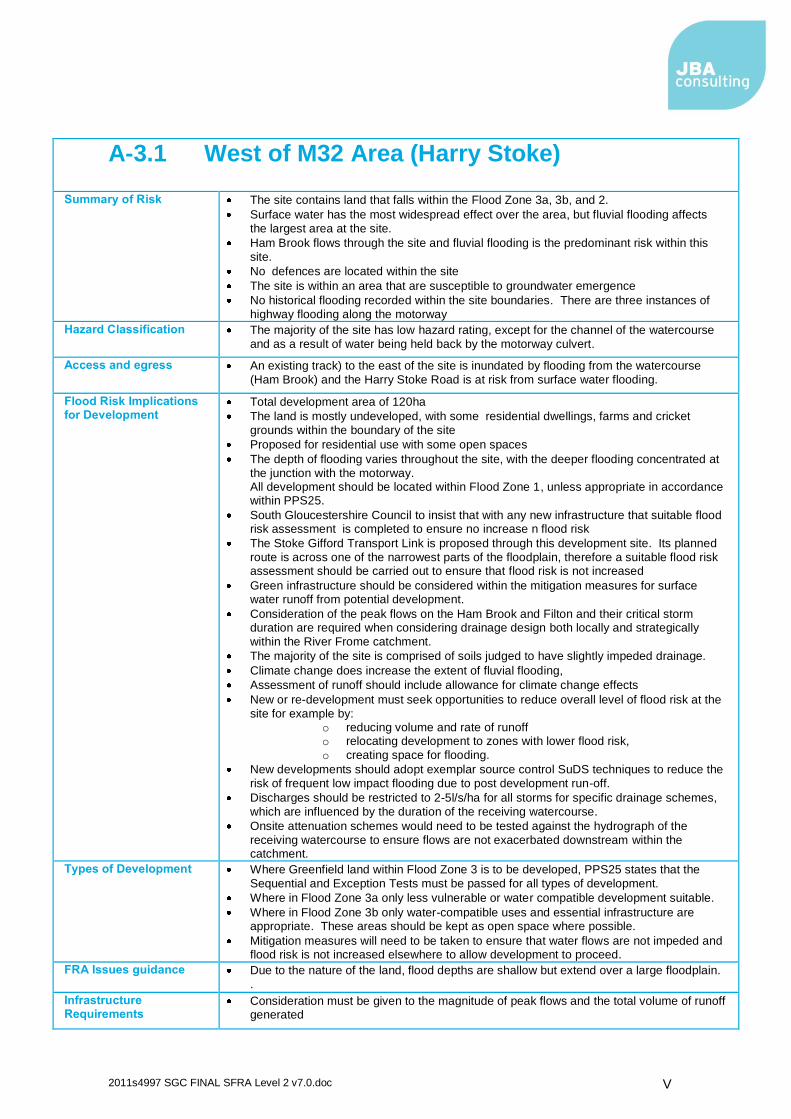
2011s4997 SGC FINAL SFRA Level 2 v7.0.doc V
A-3.1 West of M32 Area (Harry Stoke)
Summary of Risk The site contains land that falls within the Flood Zone 3a, 3b, and 2.
Surface water has the most widespread effect over the area, but fluvial flooding affects
the largest area at the site.
Ham Brook flows through the site and fluvial flooding is the predominant risk within this
site.
No defences are located within the site
The site is within an area that are susceptible to groundwater emergence
No historical flooding recorded within the site boundaries. There are three instances of
highway flooding along the motorway
Hazard Classification The majority of the site has low hazard rating, except for the channel of the watercourse
and as a result of water being held back by the motorway culvert.
Access and egress An existing track) to the east of the site is inundated by flooding from the watercourse
(Ham Brook) and the Harry Stoke Road is at risk from surface water flooding.
Flood Risk Implications for Development
Total development area of 120ha
The land is mostly undeveloped, with some residential dwellings, farms and cricket
grounds within the boundary of the site
Proposed for residential use with some open spaces
The depth of flooding varies throughout the site, with the deeper flooding concentrated at
the junction with the motorway. All development should be located within Flood Zone 1, unless appropriate in accordance within PPS25.
South Gloucestershire Council to insist that with any new infrastructure that suitable flood risk assessment is completed to ensure no increase n flood risk
The Stoke Gifford Transport Link is proposed through this development site. Its planned
route is across one of the narrowest parts of the floodplain, therefore a suitable flood risk assessment should be carried out to ensure that flood risk is not increased
Green infrastructure should be considered within the mitigation measures for surface water runoff from potential development.
Consideration of the peak flows on the Ham Brook and Filton and their critical storm duration are required when considering drainage design both locally and strategically
within the River Frome catchment.
The majority of the site is comprised of soils judged to have slightly impeded drainage.
Climate change does increase the extent of fluvial flooding,
Assessment of runoff should include allowance for climate change effects
New or re-development must seek opportunities to reduce overall level of flood risk at the
site for example by: o reducing volume and rate of runoff o relocating development to zones with lower flood risk,
o creating space for flooding.
New developments should adopt exemplar source control SuDS techniques to reduce the
risk of frequent low impact flooding due to post development run-off.
Discharges should be restricted to 2-5l/s/ha for all storms for specific drainage schemes,
which are influenced by the duration of the receiving watercourse.
Onsite attenuation schemes would need to be tested against the hydrograph of the
receiving watercourse to ensure flows are not exacerbated downstream within the catchment.
Types of Development Where Greenfield land within Flood Zone 3 is to be developed, PPS25 states that the
Sequential and Exception Tests must be passed for all types of development.
Where in Flood Zone 3a only less vulnerable or water compatible development suitable.
Where in Flood Zone 3b only water-compatible uses and essential infrastructure are appropriate. These areas should be kept as open space where possible.
Mitigation measures will need to be taken to ensure that water flows are not impeded and flood risk is not increased elsewhere to allow development to proceed.
FRA Issues guidance Due to the nature of the land, flood depths are shallow but extend over a large floodplain.
.
Infrastructure Requirements
Consideration must be given to the magnitude of peak flows and the total volume of runoff generated

2011s4997 SGC FINAL SFRA Level 2 v7.0.doc VI
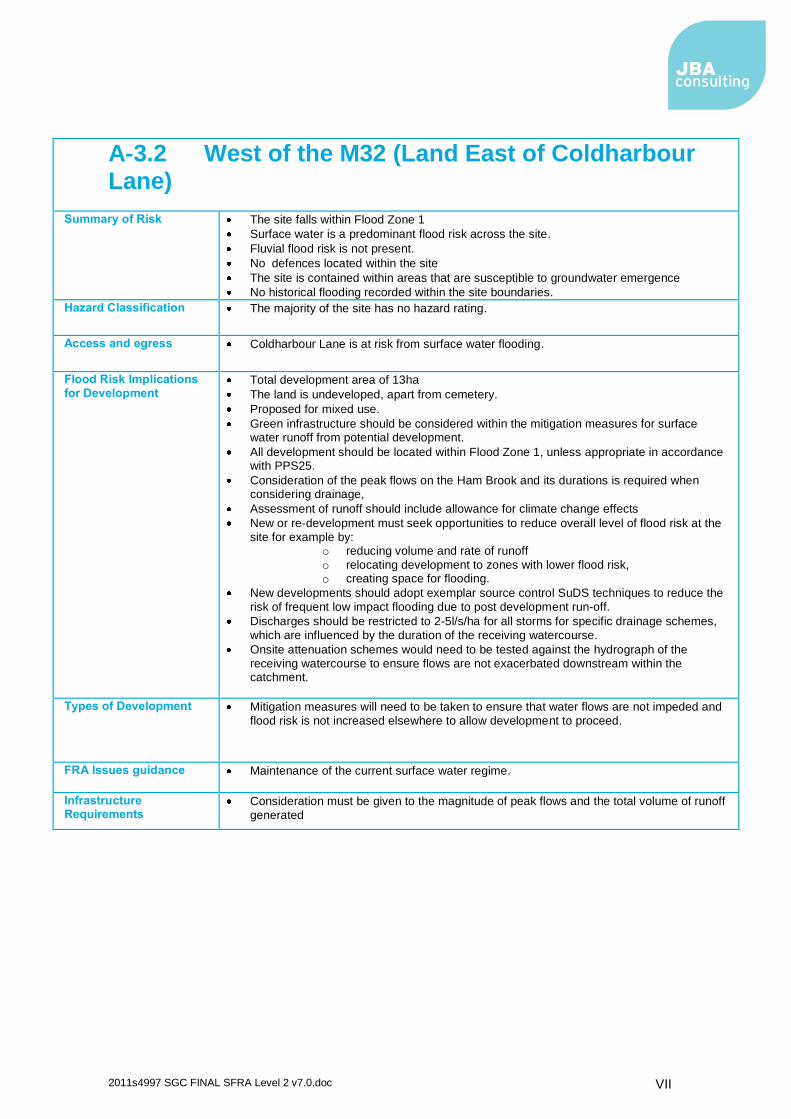
2011s4997 SGC FINAL SFRA Level 2 v7.0.doc VII
A-3.2 West of the M32 (Land East of Coldharbour Lane)
Summary of Risk The site falls within Flood Zone 1
Surface water is a predominant flood risk across the site.
Fluvial flood risk is not present.
No defences located within the site
The site is contained within areas that are susceptible to groundwater emergence
No historical flooding recorded within the site boundaries.
Hazard Classification The majority of the site has no hazard rating.
Access and egress Coldharbour Lane is at risk from surface water flooding.
Flood Risk Implications
for Development Total development area of 13ha
The land is undeveloped, apart from cemetery.
Proposed for mixed use.
Green infrastructure should be considered within the mitigation measures for surface water runoff from potential development.
All development should be located within Flood Zone 1, unless appropriate in accordance with PPS25.
Consideration of the peak flows on the Ham Brook and its durations is required when considering drainage,
Assessment of runoff should include allowance for climate change effects
New or re-development must seek opportunities to reduce overall level of flood risk at the
site for example by: o reducing volume and rate of runoff
o relocating development to zones with lower flood risk, o creating space for flooding.
New developments should adopt exemplar source control SuDS techniques to reduce the
risk of frequent low impact flooding due to post development run-off.
Discharges should be restricted to 2-5l/s/ha for all storms for specific drainage schemes,
which are influenced by the duration of the receiving watercourse.
Onsite attenuation schemes would need to be tested against the hydrograph of the
receiving watercourse to ensure flows are not exacerbated downstream within the catchment.
Types of Development Mitigation measures will need to be taken to ensure that water flows are not impeded and
flood risk is not increased elsewhere to allow development to proceed.
FRA Issues guidance Maintenance of the current surface water regime.
Infrastructure Requirements
Consideration must be given to the magnitude of peak flows and the total volume of runoff
generated
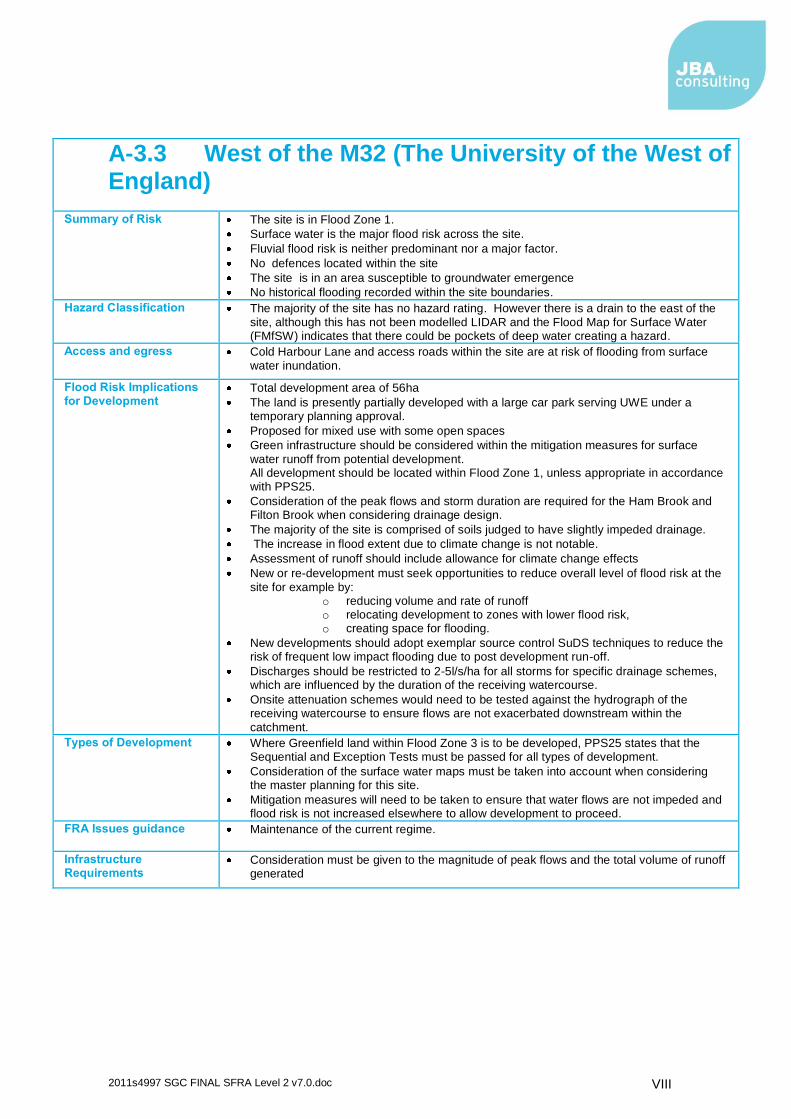
2011s4997 SGC FINAL SFRA Level 2 v7.0.doc VIII
A-3.3 West of the M32 (The University of the West of England)
Summary of Risk The site is in Flood Zone 1.
Surface water is the major flood risk across the site.
Fluvial flood risk is neither predominant nor a major factor.
No defences located within the site
The site is in an area susceptible to groundwater emergence
No historical flooding recorded within the site boundaries.
Hazard Classification The majority of the site has no hazard rating. However there is a drain to the east of the
site, although this has not been modelled LIDAR and the Flood Map for Surface Water (FMfSW) indicates that there could be pockets of deep water creating a hazard.
Access and egress Cold Harbour Lane and access roads within the site are at risk of flooding from surface
water inundation.
Flood Risk Implications for Development
Total development area of 56ha
The land is presently partially developed with a large car park serving UWE under a temporary planning approval.
Proposed for mixed use with some open spaces
Green infrastructure should be considered within the mitigation measures for surface
water runoff from potential development. All development should be located within Flood Zone 1, unless appropriate in accordance with PPS25.
Consideration of the peak flows and storm duration are required for the Ham Brook and Filton Brook when considering drainage design.
The majority of the site is comprised of soils judged to have slightly impeded drainage.
The increase in flood extent due to climate change is not notable.
Assessment of runoff should include allowance for climate change effects
New or re-development must seek opportunities to reduce overall level of flood risk at the
site for example by: o reducing volume and rate of runoff o relocating development to zones with lower flood risk, o creating space for flooding.
New developments should adopt exemplar source control SuDS techniques to reduce the risk of frequent low impact flooding due to post development run-off.
Discharges should be restricted to 2-5l/s/ha for all storms for specific drainage schemes, which are influenced by the duration of the receiving watercourse.
Onsite attenuation schemes would need to be tested against the hydrograph of the receiving watercourse to ensure flows are not exacerbated downstream within the
catchment.
Types of Development Where Greenfield land within Flood Zone 3 is to be developed, PPS25 states that the Sequential and Exception Tests must be passed for all types of development.
Consideration of the surface water maps must be taken into account when considering the master planning for this site.
Mitigation measures will need to be taken to ensure that water flows are not impeded and flood risk is not increased elsewhere to allow development to proceed.
FRA Issues guidance Maintenance of the current regime.
Infrastructure Requirements
Consideration must be given to the magnitude of peak flows and the total volume of runoff generated
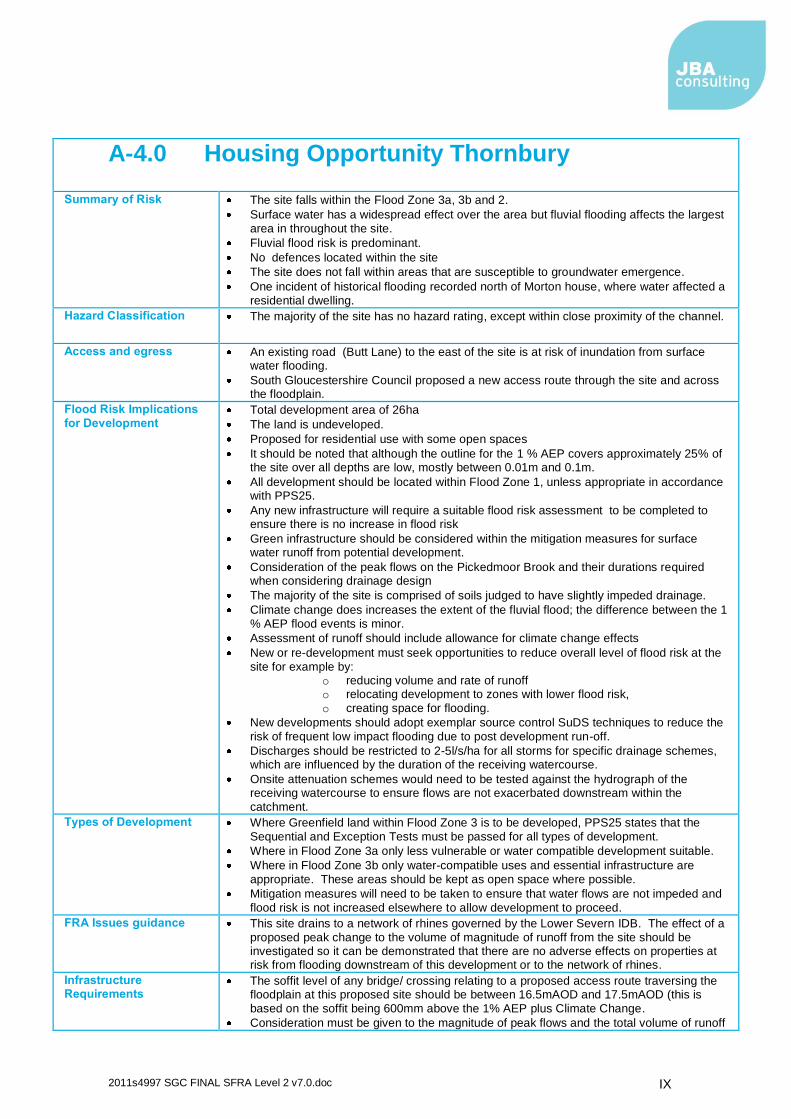
2011s4997 SGC FINAL SFRA Level 2 v7.0.doc IX
A-4.0 Housing Opportunity Thornbury
Summary of Risk The site falls within the Flood Zone 3a, 3b and 2.
Surface water has a widespread effect over the area but fluvial flooding affects the largest
area in throughout the site.
Fluvial flood risk is predominant.
No defences located within the site
The site does not fall within areas that are susceptible to groundwater emergence.
One incident of historical flooding recorded north of Morton house, where water affected a
residential dwelling.
Hazard Classification The majority of the site has no hazard rating, except within close proximity of the channel.
Access and egress An existing road (Butt Lane) to the east of the site is at risk of inundation from surface water flooding.
South Gloucestershire Council proposed a new access route through the site and across the floodplain.
Flood Risk Implications
for Development Total development area of 26ha
The land is undeveloped.
Proposed for residential use with some open spaces
It should be noted that although the outline for the 1 % AEP covers approximately 25% of the site over all depths are low, mostly between 0.01m and 0.1m.
All development should be located within Flood Zone 1, unless appropriate in accordance with PPS25.
Any new infrastructure will require a suitable flood risk assessment to be completed to ensure there is no increase in flood risk
Green infrastructure should be considered within the mitigation measures for surface water runoff from potential development.
Consideration of the peak flows on the Pickedmoor Brook and their durations required when considering drainage design
The majority of the site is comprised of soils judged to have slightly impeded drainage.
Climate change does increases the extent of the fluvial flood; the difference between the 1
% AEP flood events is minor.
Assessment of runoff should include allowance for climate change effects
New or re-development must seek opportunities to reduce overall level of flood risk at the
site for example by: o reducing volume and rate of runoff o relocating development to zones with lower flood risk,
o creating space for flooding.
New developments should adopt exemplar source control SuDS techniques to reduce the
risk of frequent low impact flooding due to post development run-off.
Discharges should be restricted to 2-5l/s/ha for all storms for specific drainage schemes, which are influenced by the duration of the receiving watercourse.
Onsite attenuation schemes would need to be tested against the hydrograph of the receiving watercourse to ensure flows are not exacerbated downstream within the
catchment.
Types of Development Where Greenfield land within Flood Zone 3 is to be developed, PPS25 states that the
Sequential and Exception Tests must be passed for all types of development.
Where in Flood Zone 3a only less vulnerable or water compatible development suitable.
Where in Flood Zone 3b only water-compatible uses and essential infrastructure are
appropriate. These areas should be kept as open space where possible.
Mitigation measures will need to be taken to ensure that water flows are not impeded and
flood risk is not increased elsewhere to allow development to proceed.
FRA Issues guidance This site drains to a network of rhines governed by the Lower Severn IDB. The effect of a
proposed peak change to the volume of magnitude of runoff from the site should be investigated so it can be demonstrated that there are no adverse effects on properties at risk from flooding downstream of this development or to the network of rhines.
Infrastructure Requirements
The soffit level of any bridge/ crossing relating to a proposed access route traversing the floodplain at this proposed site should be between 16.5mAOD and 17.5mAOD (this is
based on the soffit being 600mm above the 1% AEP plus Climate Change.
Consideration must be given to the magnitude of peak flows and the total volume of runoff

2011s4997 SGC FINAL SFRA Level 2 v7.0.doc X
generated
This page is intentionally left blank.

2011s4997 SGC FINAL SFRA Level 2 v7.0.doc XI
B. Maps

2011s4997 SGC FINAL SFRA Level 2 v7.0.doc XII
B.1 River Trym

2011s4997 SGC FINAL SFRA Level 2 v7.0.doc XIII
B.2 Ham Brook

2011s4997 SGC FINAL SFRA Level 2 v7.0.doc XIV
B.3 Pickedmoor Brook
2011s4997 SGC FINAL SFRA Level 2 v7.0.doc XV
C. Catchment Response Hydrographs

2011s4997 SGC FINAL SFRA Level 2 v7.0.doc XVI
2011s4997 SGC FINAL SFRA Level 2 v7.0.doc XVII
D. Challenge Flood Maps and Flood Zones
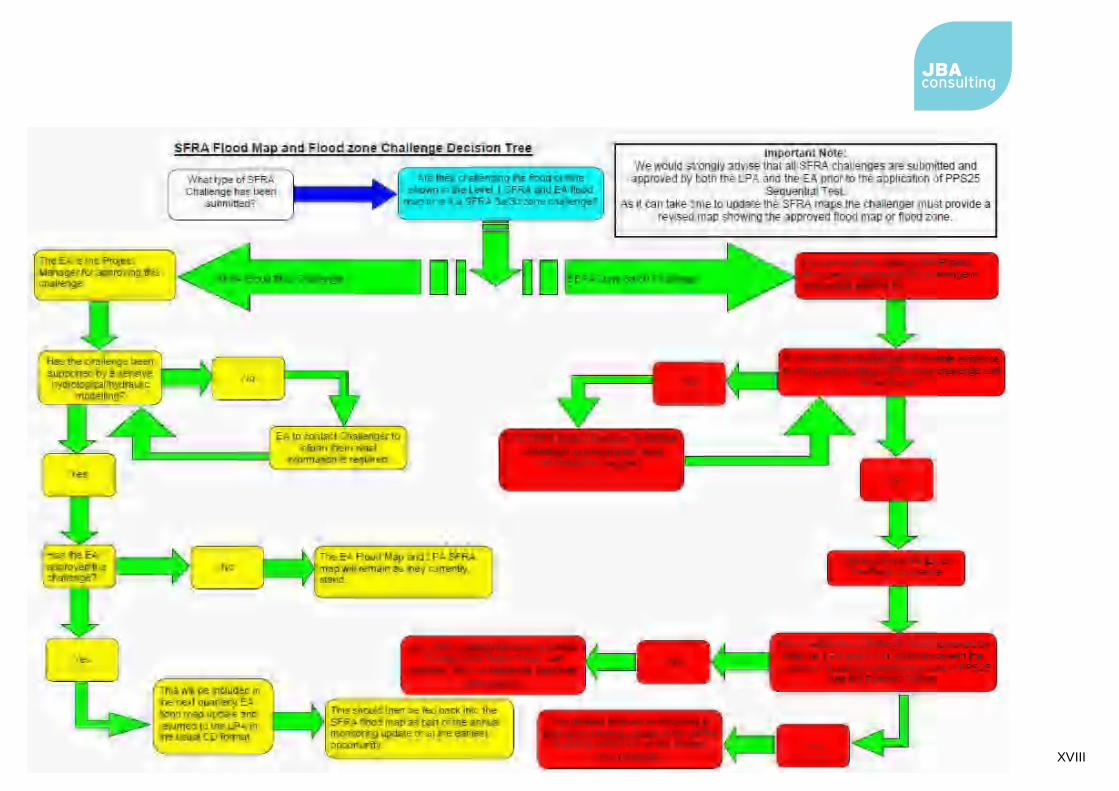
2011s4997 SGC FINAL SFRA Level 2 v7.0.doc XVIII
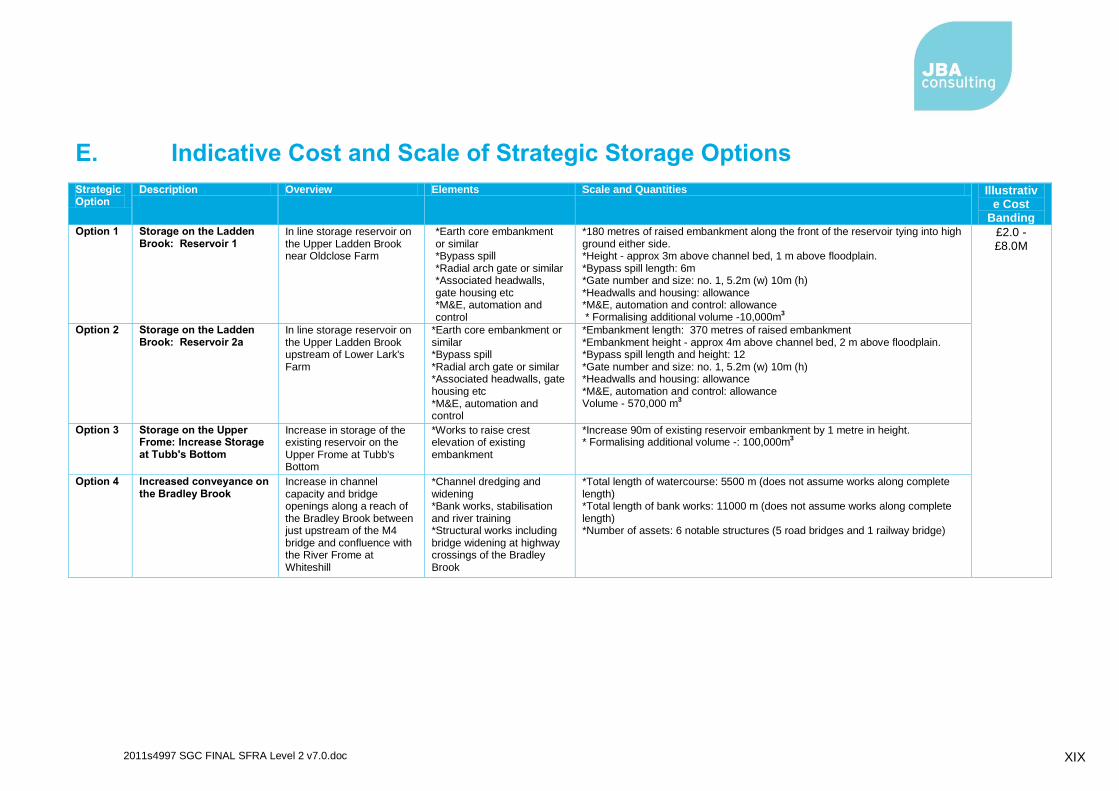
2011s4997 SGC FINAL SFRA Level 2 v7.0.doc XIX
E. Indicative Cost and Scale of Strategic Storage Options
Strategic Option
Description Overview Elements Scale and Quantities Illustrative Cost
Banding Option 1 Storage on the Ladden
Brook: Reservoir 1 In line storage reservoir on the Upper Ladden Brook near Oldclose Farm
*Earth core embankment or similar *Bypass spill *Radial arch gate or similar *Associated headwalls, gate housing etc *M&E, automation and control
*180 metres of raised embankment along the front of the reservoir tying into high ground either side. *Height - approx 3m above channel bed, 1 m above floodplain. *Bypass spill length: 6m *Gate number and size: no. 1, 5.2m (w) 10m (h) *Headwalls and housing: allowance *M&E, automation and control: allowance * Formalising additional volume -10,000m
3
£2.0 - £8.0M
Option 2 Storage on the Ladden Brook: Reservoir 2a
In line storage reservoir on the Upper Ladden Brook upstream of Lower Lark's Farm
*Earth core embankment or similar *Bypass spill *Radial arch gate or similar *Associated headwalls, gate housing etc *M&E, automation and control
*Embankment length: 370 metres of raised embankment *Embankment height - approx 4m above channel bed, 2 m above floodplain. *Bypass spill length and height: 12 *Gate number and size: no. 1, 5.2m (w) 10m (h) *Headwalls and housing: allowance *M&E, automation and control: allowance Volume - 570,000 m
3
Option 3 Storage on the Upper Frome: Increase Storage at Tubb's Bottom
Increase in storage of the existing reservoir on the Upper Frome at Tubb's Bottom
*Works to raise crest elevation of existing embankment
*Increase 90m of existing reservoir embankment by 1 metre in height. * Formalising additional volume -: 100,000m
3
Option 4 Increased conveyance on the Bradley Brook
Increase in channel capacity and bridge openings along a reach of the Bradley Brook between just upstream of the M4 bridge and confluence with the River Frome at Whiteshill
*Channel dredging and widening *Bank works, stabilisation and river training *Structural works including bridge widening at highway crossings of the Bradley Brook
*Total length of watercourse: 5500 m (does not assume works along complete length) *Total length of bank works: 11000 m (does not assume works along complete length) *Number of assets: 6 notable structures (5 road bridges and 1 railway bridge)
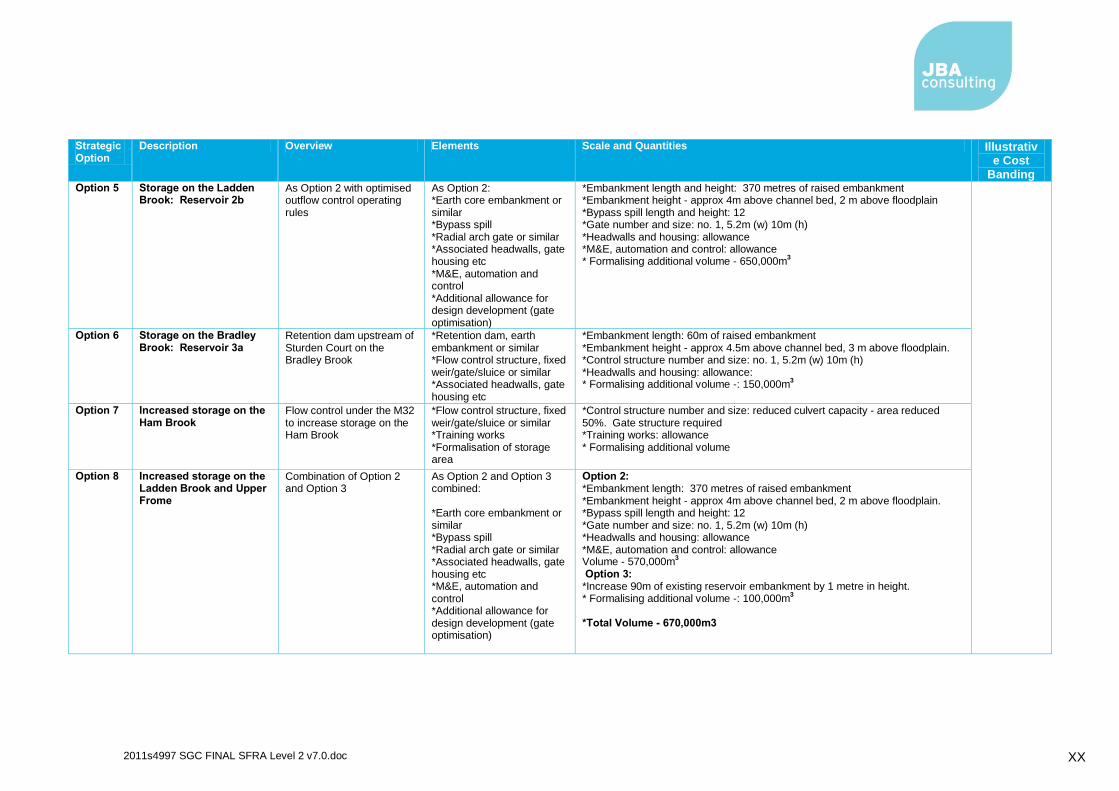
2011s4997 SGC FINAL SFRA Level 2 v7.0.doc XX
Strategic Option
Description Overview Elements Scale and Quantities Illustrative Cost
Banding Option 5 Storage on the Ladden
Brook: Reservoir 2b As Option 2 with optimised outflow control operating rules
As Option 2: *Earth core embankment or similar *Bypass spill *Radial arch gate or similar *Associated headwalls, gate housing etc *M&E, automation and control *Additional allowance for design development (gate optimisation)
*Embankment length and height: 370 metres of raised embankment *Embankment height - approx 4m above channel bed, 2 m above floodplain *Bypass spill length and height: 12 *Gate number and size: no. 1, 5.2m (w) 10m (h) *Headwalls and housing: allowance *M&E, automation and control: allowance * Formalising additional volume - 650,000m
3
Option 6 Storage on the Bradley Brook: Reservoir 3a
Retention dam upstream of Sturden Court on the Bradley Brook
*Retention dam, earth embankment or similar *Flow control structure, fixed weir/gate/sluice or similar *Associated headwalls, gate housing etc
*Embankment length: 60m of raised embankment *Embankment height - approx 4.5m above channel bed, 3 m above floodplain. *Control structure number and size: no. 1, 5.2m (w) 10m (h) *Headwalls and housing: allowance: * Formalising additional volume -: 150,000m
3
Option 7 Increased storage on the Ham Brook
Flow control under the M32 to increase storage on the Ham Brook
*Flow control structure, fixed weir/gate/sluice or similar *Training works *Formalisation of storage area
*Control structure number and size: reduced culvert capacity - area reduced 50%. Gate structure required *Training works: allowance * Formalising additional volume
Option 8 Increased storage on the Ladden Brook and Upper Frome
Combination of Option 2 and Option 3
As Option 2 and Option 3 combined: *Earth core embankment or similar *Bypass spill *Radial arch gate or similar *Associated headwalls, gate housing etc *M&E, automation and control *Additional allowance for design development (gate optimisation)
Option 2: *Embankment length: 370 metres of raised embankment *Embankment height - approx 4m above channel bed, 2 m above floodplain. *Bypass spill length and height: 12 *Gate number and size: no. 1, 5.2m (w) 10m (h) *Headwalls and housing: allowance *M&E, automation and control: allowance Volume - 570,000m
3
Option 3: *Increase 90m of existing reservoir embankment by 1 metre in height. * Formalising additional volume -: 100,000m
3
*Total Volume - 670,000m3
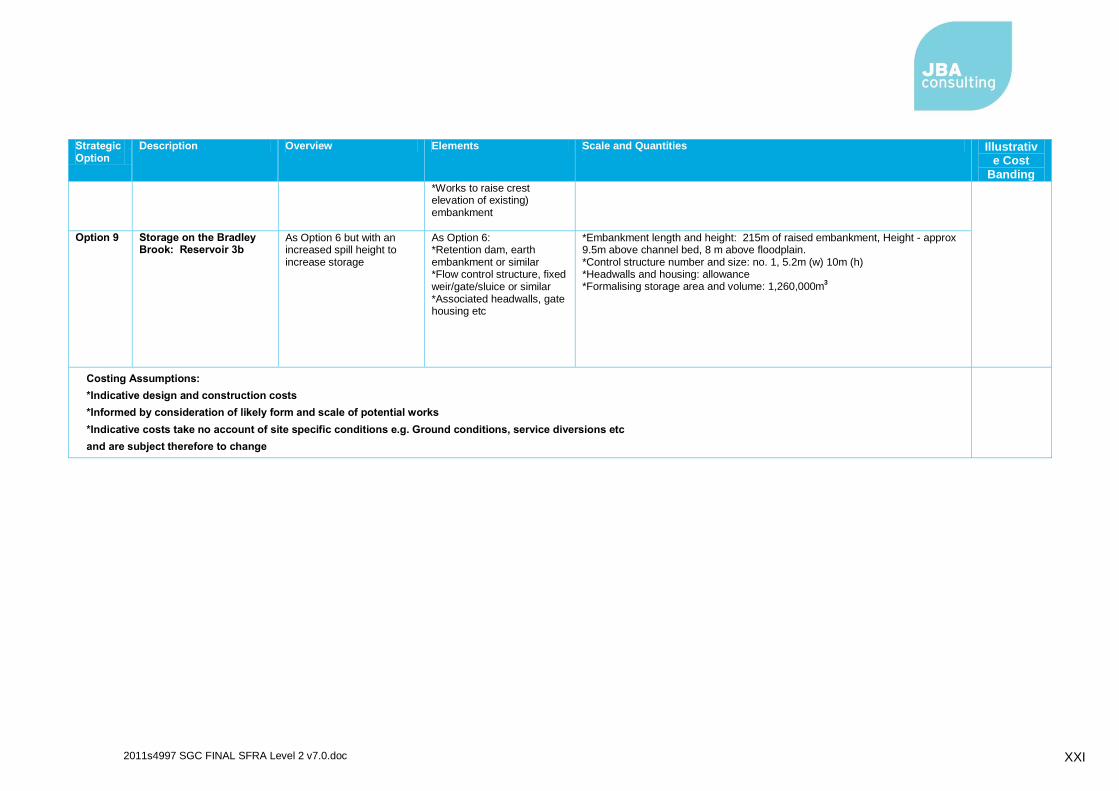
2011s4997 SGC FINAL SFRA Level 2 v7.0.doc XXI
Strategic Option
Description Overview Elements Scale and Quantities Illustrative Cost
Banding *Works to raise crest elevation of existing) embankment
Option 9 Storage on the Bradley Brook: Reservoir 3b
As Option 6 but with an increased spill height to increase storage
As Option 6: *Retention dam, earth embankment or similar *Flow control structure, fixed weir/gate/sluice or similar *Associated headwalls, gate housing etc
*Embankment length and height: 215m of raised embankment, Height - approx 9.5m above channel bed, 8 m above floodplain. *Control structure number and size: no. 1, 5.2m (w) 10m (h) *Headwalls and housing: allowance *Formalising storage area and volume: 1,260,000m
3
Costing Assumptions:
*Indicative design and construction costs
*Informed by consideration of likely form and scale of potential works
*Indicative costs take no account of site specific conditions e.g. Ground conditions, service diversions etc
and are subject therefore to change

2011s4997 SGC FINAL SFRA Level 2 v7.0.doc XXII

Offices at
Atherstone
Doncaster
Edinburgh
Haywards Heath
Limerick
Newcastle upon Tyne
Newport
Saltaire
Skipton
Tadcaster
Wallingford
Warrington
Registered Office South Barn
Broughton Hall
SKIPTON
North Yorkshire
BD23 3AE
t:+44(0)1756 799919 e:[email protected]
Jeremy Benn Associates Ltd Registered in England 3246693
Visit our website
www.jbaconsulting.co.uk