Embed Size (px)
Citation preview
Spaceflight Transcriptomes: Unique Responsesto a Novel Environment
Anna-Lisa Paul,1 Agata K. Zupanska,2 Dejerianne T. Ostrow,2 Yanping Zhang,2 Yijun Sun,2
Jian-Liang Li,2 Savita Shanker,2 William G. Farmerie,2 Claire E. Amalfitano,2 and Robert J. Ferl3
Abstract
The spaceflight environment presents unique challenges to terrestrial biology, including but not limited to thedirect effects of gravity. As we near the end of the Space Shuttle era, there remain fundamental questions aboutthe response and adaptation of plants to orbital spaceflight conditions. We address a key baseline question ofwhether gene expression changes are induced by the orbital environment, and then we ask whether undiffer-entiated cells, cells presumably lacking the typical gravity response mechanisms, perceive spaceflight. Arabi-dopsis seedlings and undifferentiated cultured Arabidopsis cells were launched in April, 2010, as part of theBRIC-16 flight experiment on STS-131. Biologically replicated DNA microarray and averaged RNA digitaltranscript profiling revealed several hundred genes in seedlings and cell cultures that were significantly affectedby launch and spaceflight. The response was moderate in seedlings; only a few genes were induced by morethan 7-fold, and the overall intrinsic expression level for most differentially expressed genes was low. In contrast,cell cultures displayed a more dramatic response, with dozens of genes showing this level of differentialexpression, a list comprised primarily of heat shock–related and stress-related genes. This baseline transcriptomeprofiling of seedlings and cultured cells confirms the fundamental hypothesis that survival of the spaceflightenvironment requires adaptive changes that are both governed and displayed by alterations in gene expression.The comparison of intact plants with cultures of undifferentiated cells confirms a second hypothesis: undiffer-entiated cells can detect spaceflight in the absence of specialized tissue or organized developmental structuresknown to detect gravity. Key Words: Tissue culture—Microgravity—Low Earth orbit—Space Shuttle—Micro-array. Astrobiology 12, 40–56.
1. Introduction
One of the accepted and fundamental premises ofspaceflight biology, and one which carries over into as-
trobiology, is that an understanding of adaptive processesand environmental limits of terrestrial biology in spaceflight iskey to successful space exploration strategies (Des Maraiset al., 2008). During spaceflight and exposure to other extra-terrestrial environments, organisms experience growth anddevelopment conditions that are distinctly unlike the terres-trial environment that has directed the evolution of gene ex-pression patterns that typically guide growth and ensuresurvival. Biology in space must therefore interpret novelstimuli, integrate new solutions, and express potentially un-usual suites of genes in an attempt to cope with spaceflightenvironments. Some of these responses might be directly in-
terpretable as appropriate responses that clearly inform sci-ence of the stresses induced by spaceflight. Other responsesmight be confused or inappropriate due to the novel signals orbiological processes stimulated by those spaceflight condi-tions. Defining both kinds of responses is critical to under-standing response and adaptation of any biology to all kindsof extraterrestrial environments—from vehicles in orbit tolunar habitats.
The fundamental scientific questions are: Do seedlingsexhibit gene expression changes that characterize the adap-tation to spaceflight, and do undifferentiated cells perceiveand similarly adapt to spaceflight? Past approaches to simi-lar questions have been hampered by spaceflight manifestopportunities and have been particularly limited with regardto biological replication. Current approaches seek to addressthe replication issue, and the present experiment is dedicated
1Horticultural Sciences and Genetics Institute, University of Florida, Gainesville, Florida.2University of Florida, Gainesville, Florida.3Interdisciplinary Center for Biotechnology and Research, Horticultural Sciences and Plant Molecular and Cellular Biology, University of
Florida, Gainesville, Florida.
ASTROBIOLOGYVolume 12, Number 1, 2012ª Mary Ann Liebert, Inc.DOI: 10.1089/ast.2011.0696
40
to robust, parallel replicated samples to answer these ques-tions to a refined state of statistical significance while em-ploying current gene expression profiling technologies.
Historical data indicate that plants mount stress responsesin the spaceflight environment (Ferl et al., 2002). Some of theresponses appear directly and are appropriately correlated tocertain environmental parameters in the vehicles and sup-port hardware, or are directly attributable to gravity effects,including the absence of convective mixing in microgravity(e.g., Porterfield et al., 1997; Levinskikh et al., 2000; Liao et al.,2004; Johnsson et al., 2009). However, it is also clear thataspects of spaceflight affect the ability of plants to processbiological signals from one tissue type, or organ, to another(e.g., Paul et al., 2001; Roux et al., 2003). Such processingerrors can subvert the engagement of adaptive metabolisms,and the perception of certain signals may be inappropriatelyprocessed into a stress response when true stress conditionsdo not exist. It is not known how novel environmental sig-nals are perceived and interpreted by plants or what genesplay a role in signaling events during spaceflight.
In the present experiment, the use of both whole seedlingsand undifferentiated Arabidopsis tissue culture enables anevaluation of the fundamental mechanisms associated withplant responses to spaceflight. Specific plant organs andtissues are often associated with the detection and trans-duction of signals from the environment, including gravity.For instance, the columellar cells of roots play a central rolein gravity perception, and movement of air through stomataplays a critical role in a plant’s perception of drought andengagement of ABA pathways. But what if organs such asthese were absent? Would gravity still exert an effect onplant cells, and would the effect be the same? What are someof the underlying mechanisms of environmental sensing? Towhat extent can individual cells, absent typically organizedtissues or organs, perceive the spaceflight environment?
Plants have evolved to deal with environmental challengethrough changes in metabolism guided by the activation andrepression of response genes. There are numerous reviews ofthe many environmental response genes and pathways thathave been examined in Arabidopsis (e.g., Chen et al., 2002;Kreps et al., 2002; Rossel et al., 2002; Seki et al., 2002; Kimuraet al., 2003; Martzivanou and Hampp, 2003; Kimbrough et al.,2004; Kittang et al., 2004; Branco-Price et al., 2005; Liu et al.,2005; Benedict et al., 2006; Lim et al., 2006; Jiang et al., 2007),and several large databases have been populated with generesponses to a variety of environmental challenges (e.g.,Kilian et al., 2007; Kant et al., 2008). Spaceflight is unique inthat it is a novel environment for plants; thus any response isone that can provide insight into how eukaryotes cope withabiotic signals that lie completely outside their evolutionaryexperience.
Plants offer valuable potential for exploring the eukaryoticresponse to spaceflight and other extraterrestrial environ-ments. This potential arises from the confluence of the life-support and astrobiology agendas and has kept plantbiology firmly within the spaceflight experiment community.Numerous plant experiments have flown in the SpaceShuttle and International Space Station payload programs inthe last 20 years, and the following citations are only asampling of this research: Saunders (1968), Bucker (1974),Krikorian et al. (1981, 1992), Kordyum et al. (1983), Guikemaet al. (1994), Kuang et al. (1996, 2000), Levine and Krikorian
(1996), Brown et al. (1997), Musgrave et al. (1997), Porterfieldet al. (1997), Adamchuk et al. (1999), Kiss and Edelmann(1999), Nedukha et al. (1999), Sato et al. (1999), Gao et al.(2000), Levinskikh et al. (2000), Levine et al. (2001), Kern andSack (2001), Paul et al. (2001, 2005), Hoson et al. (2003),Klymchuk et al. (2003), Stutte et al. (2006), Salmi and Roux(2008), Johnsson et al. (2009), Kiss et al. (2009), Ou et al. (2009),Solheim et al. (2009), Visscher et al. (2009). Conclusions fromplant biology experiments have highlighted biological re-sponses to spaceflight environments and have also illumi-nated engineering and operational advancements necessaryfor conducting sound biological experiments in space(reviewed in Halstead and Dutcher, 1987; Dutcher et al.,1994; Ferl et al., 2002; Clement and Slenzka, 2006; Brinck-mann, 2007; Gilroy and Masson, 2007).
Plants grown in low Earth orbital environments oftendisplay an altered physiology compared to plants in ground-based controls. At the cellular level, spaceflight has beenassociated with disruptions of microtubular self-organization(Papaseit et al., 2000), changes in amyloplast distribution(Legue et al., 1997; Kiss and Edelmann, 1999; Driss-Ecoleet al., 2000), and energy metabolism (Hampp et al., 1997). Atthe organismal level, plants have responded to spaceflightwith variations in basic physiology such as electron transportrates in photosynthetic processes (Tripathy et al., 1996) andstress metabolism responses related to hypoxia (Porterfieldet al., 1997), and disruptions of calcium localization andcalcium-mediated signaling (Merkys and Darginaviciene,1997; Klymchuk et al., 2001; Nedukha et al., 2001; Paul et al.,2001; Roux et al., 2003; Salmi and Roux, 2008). However,there are also examples where remarkably little disruption ofbasic processes occurs (Stutte et al., 2006), and it is possiblethat the better we get at designing microgravity habitats, thefewer stress responses we will see in our biology.
Almost all experiments that have evaluated the effects ofspaceflight on plants have been conducted with intactwhole plants, and the focus has often been related togravisensing and the roles of specific cells and organs thatact as sensors and contribute to gravity signal transduction.Spaceflight experiments in which tissue explants of rootsand tissue culture–derived plantlets have been used haveflown as well (Merkys et al., 1989; Levine and Krikorian,1992, 1996) but with no available molecular analyses. Anotable exception is the fern single-cell model system ofCeratopteris richardii spores, which does respond to space-flight at the molecular level and appears to be especiallysensitive to changes in the gravity vector and calcium sig-naling (Salmi and Roux, 2008).
A powerful approach to evaluating spaceflight adaptationis to assess the patterns of gene expression as they change inresponse to the spaceflight environment. This experimentalapproach has been limited to a small number of experimentswith few replicates. Gene expression studies that have beenconducted to date are neither highly replicated nor techni-cally robust enough to assay gene expression alterationsapproaching the 2-fold level of change with statistical sig-nificance (Paul et al., 2005; Stutte et al., 2006; Salmi and Roux,2008). The results presented here are from highly replicatedbiological samples of developmentally distinct forms ofArabidopsis: etiolated seedlings and undifferentiated cellcultures. Exploration of their respective transcriptomes inresponse to the spaceflight environment provides new
ARABIDOPSIS SPACEFLIGHT TRANSCRIPTOMES 41
insight in the perception and adaptation of terrestrial or-ganisms to an extraterrestrial environment.
2. Materials and Methods
2.1. BRIC spaceflight hardware
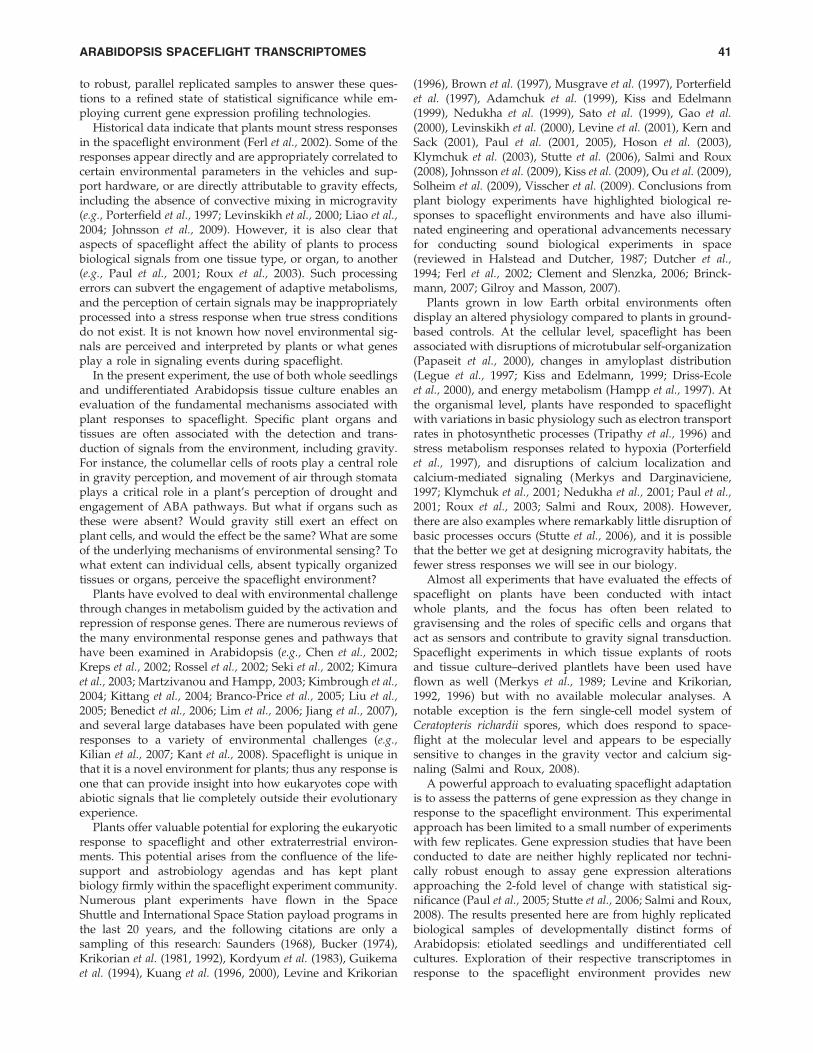
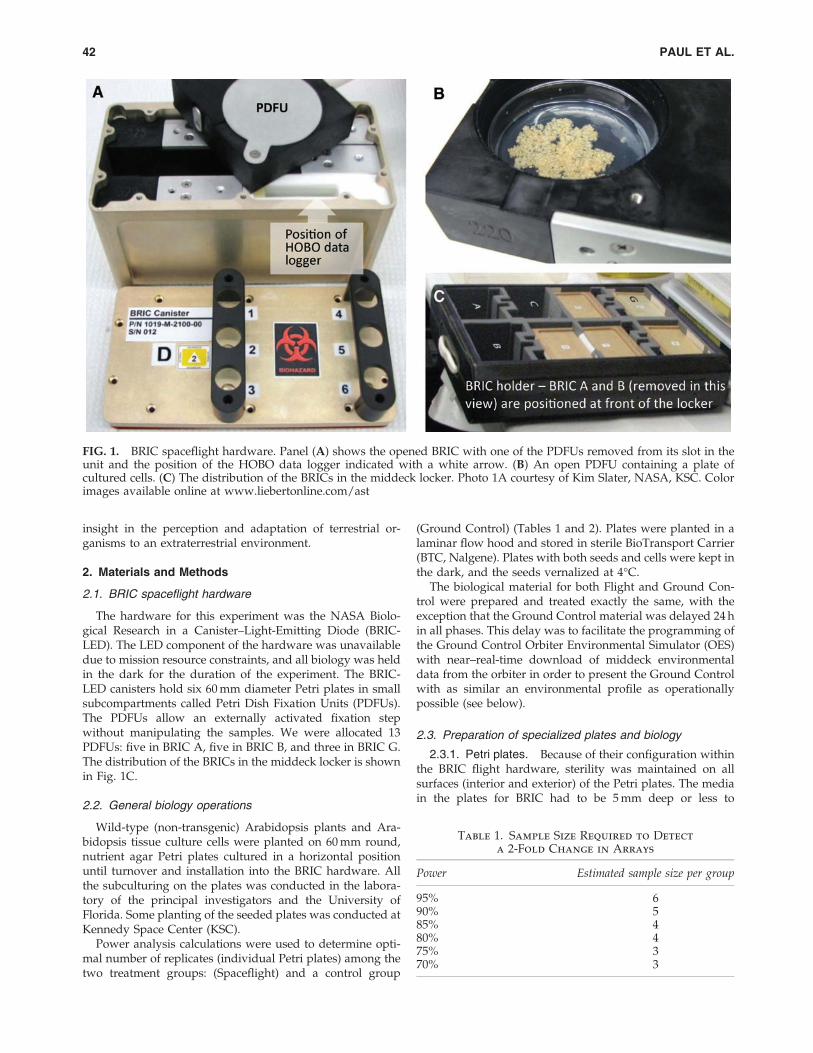
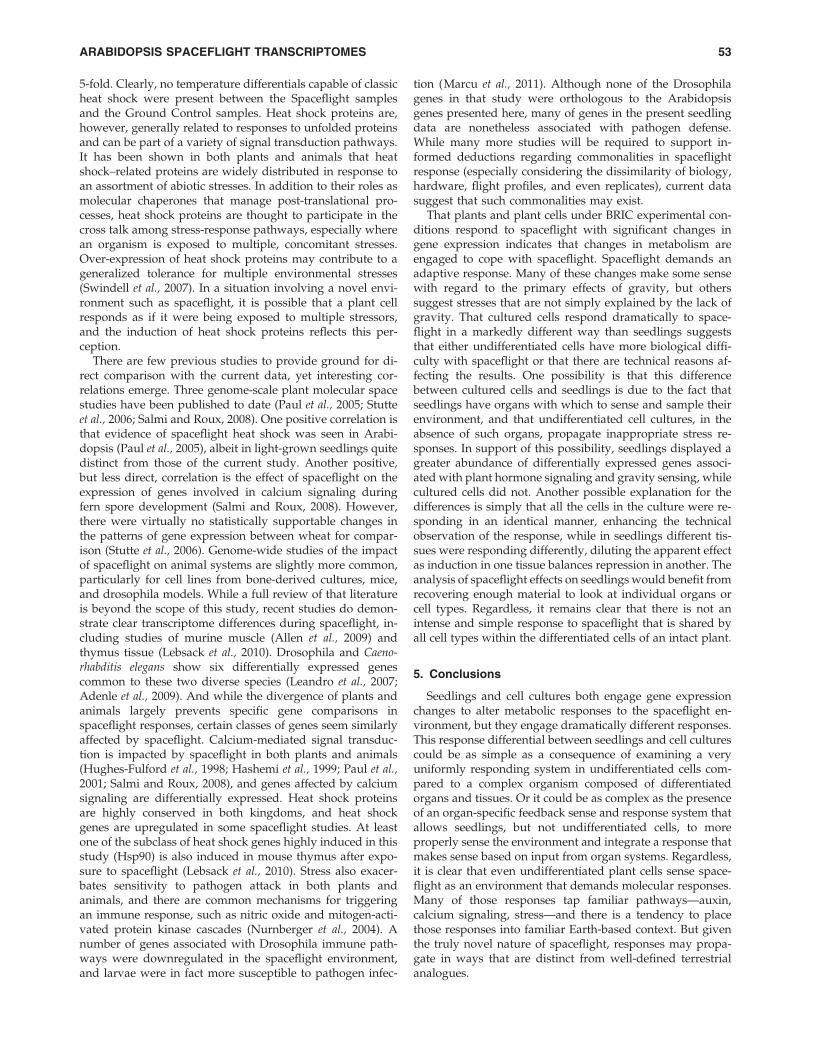
The hardware for this experiment was the NASA Biolo-gical Research in a Canister–Light-Emitting Diode (BRIC-LED). The LED component of the hardware was unavailabledue to mission resource constraints, and all biology was heldin the dark for the duration of the experiment. The BRIC-LED canisters hold six 60 mm diameter Petri plates in smallsubcompartments called Petri Dish Fixation Units (PDFUs).The PDFUs allow an externally activated fixation stepwithout manipulating the samples. We were allocated 13PDFUs: five in BRIC A, five in BRIC B, and three in BRIC G.The distribution of the BRICs in the middeck locker is shownin Fig. 1C.
2.2. General biology operations
Wild-type (non-transgenic) Arabidopsis plants and Ara-bidopsis tissue culture cells were planted on 60 mm round,nutrient agar Petri plates cultured in a horizontal positionuntil turnover and installation into the BRIC hardware. Allthe subculturing on the plates was conducted in the labora-tory of the principal investigators and the University ofFlorida. Some planting of the seeded plates was conducted atKennedy Space Center (KSC).
Power analysis calculations were used to determine opti-mal number of replicates (individual Petri plates) among thetwo treatment groups: (Spaceflight) and a control group
(Ground Control) (Tables 1 and 2). Plates were planted in alaminar flow hood and stored in sterile BioTransport Carrier(BTC, Nalgene). Plates with both seeds and cells were kept inthe dark, and the seeds vernalized at 4�C.
The biological material for both Flight and Ground Con-trol were prepared and treated exactly the same, with theexception that the Ground Control material was delayed 24 hin all phases. This delay was to facilitate the programming ofthe Ground Control Orbiter Environmental Simulator (OES)with near–real-time download of middeck environmentaldata from the orbiter in order to present the Ground Controlwith as similar an environmental profile as operationallypossible (see below).
2.3. Preparation of specialized plates and biology
2.3.1. Petri plates. Because of their configuration withinthe BRIC flight hardware, sterility was maintained on allsurfaces (interior and exterior) of the Petri plates. The mediain the plates for BRIC had to be 5 mm deep or less to
FIG. 1. BRIC spaceflight hardware. Panel (A) shows the opened BRIC with one of the PDFUs removed from its slot in theunit and the position of the HOBO data logger indicated with a white arrow. (B) An open PDFU containing a plate ofcultured cells. (C) The distribution of the BRICs in the middeck locker. Photo 1A courtesy of Kim Slater, NASA, KSC. Colorimages available online at www.liebertonline.com/ast
Table 1. Sample Size Required to Detect
a 2-Fold Change in Arrays
Power Estimated sample size per group
95% 690% 585% 480% 475% 370% 3
42 PAUL ET AL.
accommodate the biology and the PDFU cover hardware.For a 60 mm dish, this calculates out to 6.7 mL. After pour-ing, the plates were allowed to solidify and were thentransferred to a sterile BTC (to maintain sterility of externalsurface) until planting.
2.3.2. Preparation of seeded plates. Arabidopsis seedwas surface sterilized (after Paul et al., 2001) in a laminarflow hood. Seeds were planted on the surface of the Petriplates at a density of about 75 seeds per plate. The cover wasreplaced, but not taped, and the Petri plates were transferredto a sterile BTC. The BTC was wrapped in black cloth andstored for four days at 4�C until turnover, thereby ensuringthat the seeds remained dormant prior to launch. Further,plates were inspected before loading into the PDFU to verifyall seeds remained dormant.
2.3.3. Preparation of cell culture plates. MurashigeSkoog (MS) culture media was dispensed onto 60 mm Petriplates as described above. The liquid media from a sterile cellsuspension was decanted, and the cells were washed oncewith fresh liquid media and then decanted again. A sterilescoop was used to place about 1 g of cells on the surface on theplate and disperse it evenly across the surface. The cover wasreplaced, but not taped; the Petri plates were transferred to asterile BTC. The BTC was wrapped in black cloth and stored atroom temperature for 6 days until turnover. This Arabidopsiscallus line (which is far more slow-growing than a liquidsuspension culture) is typically subcultured once a month;thus preparation along this time line provided in-flight re-search material in the middle of the typical growth cycle.
2.4. RNA extractions
Total RNA was extracted with Qiashredder and RNeasykits from Qiagen according to the manufacturer’s instruc-tions. Residual DNA was removed by performing an on-column digestion with use of an RNase Free DNase (Qiagen).Integrity of the RNA was evaluated with the Agilent 2100BioAnalyzer (Ferl et al., 2011).
2.5. Quantitative RT-PCR
For quantitative reverse transcription–polymerase chainreaction (RT-qPCR), 150 ng of RNA were reverse transcribedinto cDNA by using High Capacity RNA to cDNA MasterMix (Applied Biosystems). One-eighth or one-sixth of totalcDNA for seedlings or tissue, respectively, was used as atemplate for a single RT-qPCR run. RT-qPCR was carried outwith TaqMan technology (Applied Biosystems) on the ABI7500 Fast instrument (Applied Biosystems) (Bustin, 2000).
The TaqMan Fast Advanced Master Mix reagent was usedfor the duplex RT-qPCR reaction with 6FAM and VIC-dyelabeled, TAMRA-quenched probes. In all reactions, theUBQ11 (At4g05050) served as an internal control. Each du-plex PCR mixture contained 900 nM target gene–specificforward and reverse primers each, 150 nM UBQ11 forwardand reverse primers each, 250 nM 6FAM labeled target gene–specific probe and 250 nM VIC-labeled UBQ11 probe. Primersand probes were designed with Primer Express softwareand supplied by Applied Biosystems. The complete list ofRT-qPCR probes and primer sets is shown in Table 3.
The thermal cycling program consisted of 20 s at 95�C,followed by 40 cycles of 3 s at 95�C, and 30 s at 59�C. Reac-tions were quantified by selecting the amplification cyclewhen the PCR product was first detected (threshold cycle,Ct). Three randomly selected primer and probe sets werechosen for validation experiments to test the efficiency of thetarget and reference amplifications. The Ct values for sixbiological replicas of each experimental group (seedlingsFlight, seedlings Ground Control, tissue Spaceflight, tissueGround Control) were analyzed with 7500 Software v2.0.5along with Microsoft Excel and the comparative CT(DDCT)method. The DCt was calculated as the difference betweenthe threshold cycle value of a target gene and that of UBQ11(endogenous control) in the same sample, while DDCt as thedifference between the DCt value of a Spaceflight sample andthat of the Ground Control (calibrator). The fold differenceof the target gene expression in Spaceflight samples rela-tive to Ground Control samples (calibrator) was calculated as2( -DDCt) and then log2-transformed.
2.6. Microarray preparation and analyses
Extracted total RNA (60 ng) was amplified with the Ova-tion Pico WTA System (NuGEN Technologies Inc.) in ac-cordance with manufacturer’s protocol. Fragmentation and
Table 2. The Effect of Sample Size on the Power
to Detect a 2-Fold Change
Sample size per group Estimated power
3 0.7734 0.8875 0.9476 0.9777 0.9908 0.996
Table 3. Quantitative PCR Primer and Probe Sets
Gene qPCR Primer/Probe sets
MLP423 F 5¢ AACCATCACCGTTATCCCTAAGG 3¢At1g24020 R 5¢ GGAAGCCTCGTACTGAGAGTTCA 3¢
P 5¢ 6FAMCCTCGGTGTTGCTCCGGCTAMRA 3¢
MAPKKK13 F 5¢ GCCAAAGCTCCATGGTCAAG 3¢At1g07150 R 5¢ GCCCTCGGTGTGTGGATTC 3¢
P 5¢ 6FAMTAGCCGATTTTGGGTCGGCGTTCTAMRA 3¢
AGP12 F 5¢ TCTCCGCCGTAGGAAACGT 3¢At3g13520 R 5¢ AGCATCGGAAGTAGGACTTGGA 3¢
P 5¢ 6FAMCTGCGCAGACAGAGGCTCCGGTAMRA 3¢
HSP17.6A F 5¢ CAAAGGCAATGGCTGCTACA 3¢At5g12030 R 5¢ TGTCCACGGCGAAAACGTA 3¢
P 5¢ 6FAMCTGACGTTATCGAGCACCCGGATAMRA 3¢
UBQ11 F 5¢ AACTTGAGGACGGCAGAACTTT 3¢At4g05050 R 5¢ GTGATGGTCTTTCCGGTCAAA 3¢
P 5¢ 6VICCAGAAGGAGTCTACGCTTCATTTGGTCTTGCTAMRA 3¢
The gene symbol and Atg number are shown in the left-handcolumn, and the sequences for the forward (F), reverse (R) andprimer (P) are shown in the right-hand column.
ARABIDOPSIS SPACEFLIGHT TRANSCRIPTOMES 43
biotinylation occurred with the Encore Biotin Module(NuGEN Technologies, Inc.) per the manufacturer’s protocol.Amplified and labeled cDNA (5 lg/sample) was fragmentedand hybridized with rotation onto Affymetrix GeneChipArabidopsis ATH1 Genome Arrays for 16 h at 45�C. Arrayswere washed on a Fluidics Station 450 (Affymetrix) with theHybridization Wash and Stain Kit (Affymetrix) and theWashing Procedure FS450_0004. Fluorescent signals weremeasured with an Affymetrix GeneChip Scanner 3000 7G.
2.7. SAGE preparation and analyses
SAGE SOLiD barcoded libraries were constructed at LifeTechnologies facilities located in Carlsbad, California, withassistance of University of Florida, ICBR Gene ExpressionCore personnel. All SAGE SOLiD barcoded libraries areprepared by using SOLiD SAGE with Barcode Module(catalog#: 4452811) according to manufacturer’s protocols.Briefly, 1 lg of total RNA was bound to Dynabeads to cap-ture the polyA-containing RNA. Double-stranded cDNAwas synthesized on the Dynabeads by using SuperScript IIIReverse Transcriptase and E. coli DNA polymerase. Thebound double-stranded cDNA was cleaved with Nla III togenerate DNA fragments that had an average length of ap-proximately 250 bp fragments. SOLiD SAGE barcodeAdaptor A was ligated to the Dynabead-bound cDNAfragments, and the Adaptor A–linked cDNA was digestedwith EcoP15I, which binds to Adaptor A adjoining to theNlaIII CATG cleavage recognition site and cleaves thecDNA*27 bp downstream from the adaptor. As a result, atag with a 2 bp overhang containing the Adaptor A sequenceand 27 bp of unique sequence from a single transcript wasreleased. After the ethanol precipitation, SOLiD SAGEAdaptor B was ligated to the 5¢ end of each tag; then eachlibrary was amplified with a different barcoded SOLiD 3¢primer from the SOLiD RNA Barcoding Kit (Cat#: 4427046)and a SOLiD 5¢ primer, primer, producing a clean 130 bpproduct. Finally, equal molar amounts of the barcoded li-braries were pooled together and purified for SOLiD se-quencing. Amplified libraries were ligated to beads by usingthe reagents and protocol following Applied BiosystemsSOLiD 4 Templated Beads Preparation Guide (Cat #:4448378). High-throughput sequencing of the 35 bp wascarried out on SOLiD Version 4 sequencer. Sequencing wasconducted on one slide of a SOLiD 4 Analyzer (Life Tech-nologies at Carlsbad, CA), and tags were mapped to theArabidopsis reference.
3. Results
3.1. Experiment design
To determine the experimental setup, power analysis wasperformed based on a completely randomized treatment-control experimental design. In the design summarized inTables 1 and 2, two groups of biological samples were con-sidered: a treatment group (Spaceflight) and a control group(Ground Control). Type I error (two-tailed) was held at 0.05.The standard deviation for the analysis summarized in bothTables 1 and 2 was estimated by using our previous Arabi-dopsis expression dataset with similar design (Paul et al.,2005). Given the programmatic and physical constraints ofthe BRIC payload distributions, balance between experiment
design and payload opportunity was key to deciding thedistribution of sample type and size. With a sample size offour for each group of samples, the design was expected tohave a power near 89% to detect 2-fold difference betweenthe control (Ground Control) and treatment (Spaceflight)groups (Table 1). With a sample size of six, the power rises toalmost 98% (0.977, Table 2). Based on our previous space-flight data and Arabidopsis seedling array data from KC-135parabolic flights (Paul et al., 2011), we sought to maximizethe opportunity to confidently detect gene expression dif-ferences at the 2-fold sensitivity such that the array analysesshould reveal significant changes in gene expression causedby spaceflight. Therefore, the experiment was designed tohave 6-fold replication of biological samples in the Space-flight and Ground Control hardware to facilitate confidencein changes in gene expression at the 2-fold level. Thus, theavailability of 13 PDFUs within the payload allowed for twosample types: seedlings and cultured cells.
3.2. Experiment hardware
The hardware for this experiment was the NASA BRIC-LED (Kern et al., 1999; NASA.gov, 2011). The BRIC-LED wasflown as a nonpowered middeck payload by program de-sign, so the LED component of the hardware was notavailable to the researchers; all biology was held in the darkfor the duration of the experiment. The BRIC-LED canistershold six 60 mm diameter Petri plates in small subcompart-ments called PDFUs. The PDFUs allow an externally acti-vated fixation step without manipulating the samples. Figure1A shows an open BRIC container with a view of the slots forfive PDFUs, with one PDFU extracted for comparison. Thesix replicate plates of seedlings and seven replicate plates ofcultured cells (13 plates total) were distributed among threeBRIC canisters: BRIC A (all seedlings), BRIC B (all culturedcells), and BRIC G (two PDFUs of seedlings, three of culturedcells). One of the PDFU slots in each BRIC was used to hold aHOBO data logger to record temperature. Figure 1B showsan open PDFU containing a plate of cultured Arabidopsiscells. The BRICs were contained within a foam-lined tray(Fig. 1C) for launch and stowage in a Shuttle middeck lockerfor the flight.
An additional set of Petri plates within BRIC hardware,identical to that launched for Spaceflight, was prepared forthe Ground Control. The Ground Control was housed in theOES chamber in the Spaceflight Life Sciences Laboratory(SLSL) at KSC. The Ground Control was initiated with aprecise 24 h delay to enable the OES environment to beprogramed with the environmental profile taken from te-lemetry of the Space Shuttle. Thus, 24 h later, the OES as-sumed an identical environmental profile as the Shuttle cabinthat contained the BRIC hardware and biology on orbit, andthe Ground Control BRIC hardware and samples experi-enced the same external environmental profile as the hard-ware and samples on the Space Shuttle. Environmentalparameters that were controlled on the OES and madeidentical to flight were cabin temperature, humidity, andCO2 concentration. Environmental telemetry from within theinterior of the BRIC units could not be collected and trans-mitted in real time; however, the inclusion of HOBO dataloggers enabled the collection of those data for postflightreference (details below).
44 PAUL ET AL.
3.3. Flight profile and environmental conditions
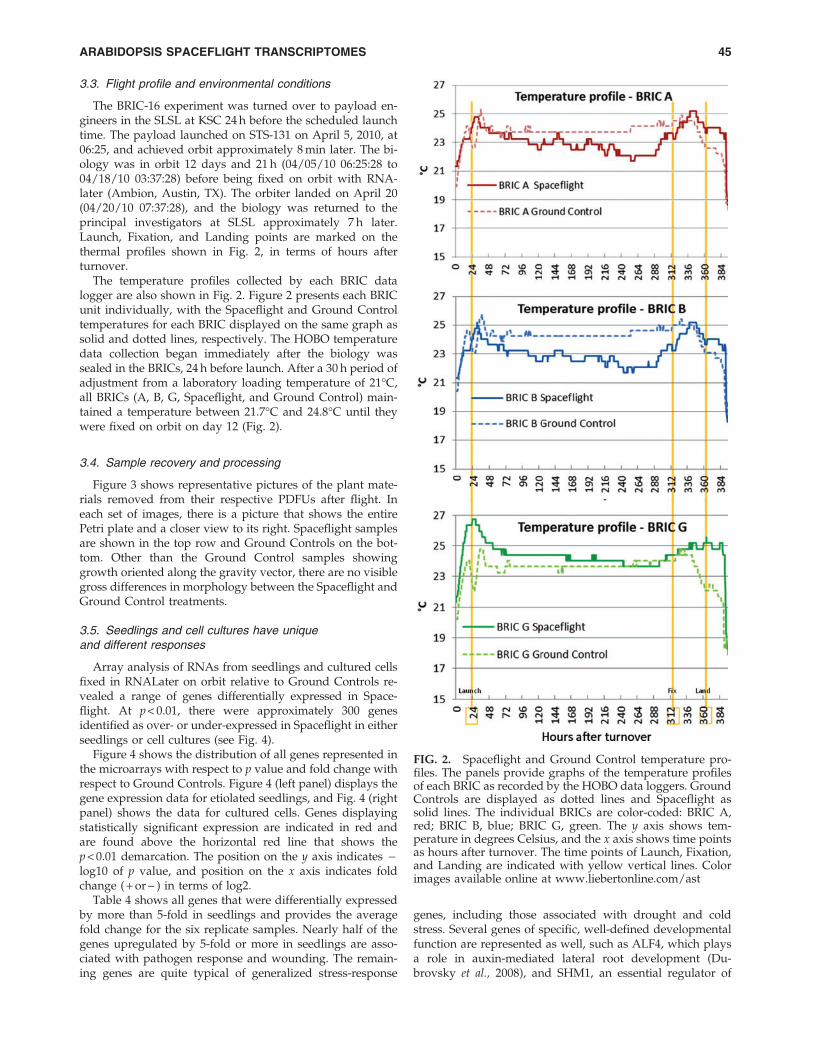
The BRIC-16 experiment was turned over to payload en-gineers in the SLSL at KSC 24 h before the scheduled launchtime. The payload launched on STS-131 on April 5, 2010, at06:25, and achieved orbit approximately 8 min later. The bi-ology was in orbit 12 days and 21 h (04/05/10 06:25:28 to04/18/10 03:37:28) before being fixed on orbit with RNA-later (Ambion, Austin, TX). The orbiter landed on April 20(04/20/10 07:37:28), and the biology was returned to theprincipal investigators at SLSL approximately 7 h later.Launch, Fixation, and Landing points are marked on thethermal profiles shown in Fig. 2, in terms of hours afterturnover.
The temperature profiles collected by each BRIC datalogger are also shown in Fig. 2. Figure 2 presents each BRICunit individually, with the Spaceflight and Ground Controltemperatures for each BRIC displayed on the same graph assolid and dotted lines, respectively. The HOBO temperaturedata collection began immediately after the biology wassealed in the BRICs, 24 h before launch. After a 30 h period ofadjustment from a laboratory loading temperature of 21�C,all BRICs (A, B, G, Spaceflight, and Ground Control) main-tained a temperature between 21.7�C and 24.8�C until theywere fixed on orbit on day 12 (Fig. 2).
3.4. Sample recovery and processing
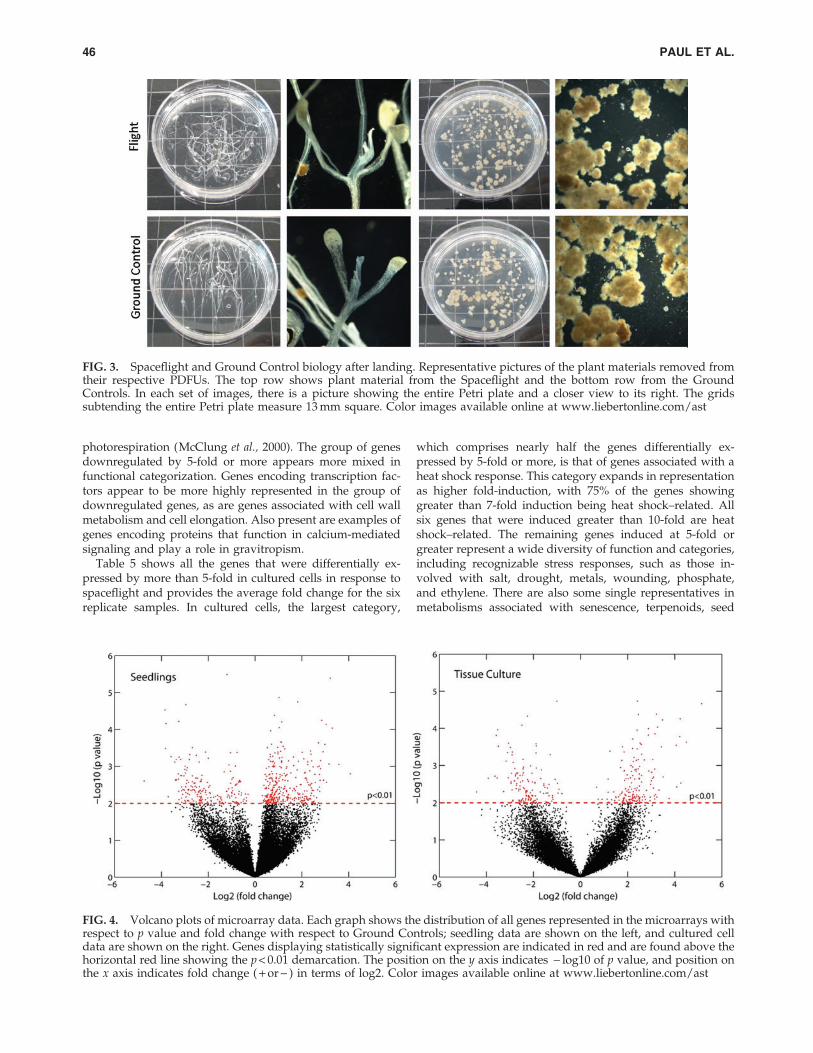
Figure 3 shows representative pictures of the plant mate-rials removed from their respective PDFUs after flight. Ineach set of images, there is a picture that shows the entirePetri plate and a closer view to its right. Spaceflight samplesare shown in the top row and Ground Controls on the bot-tom. Other than the Ground Control samples showinggrowth oriented along the gravity vector, there are no visiblegross differences in morphology between the Spaceflight andGround Control treatments.
3.5. Seedlings and cell cultures have uniqueand different responses
Array analysis of RNAs from seedlings and cultured cellsfixed in RNALater on orbit relative to Ground Controls re-vealed a range of genes differentially expressed in Space-flight. At p < 0.01, there were approximately 300 genesidentified as over- or under-expressed in Spaceflight in eitherseedlings or cell cultures (see Fig. 4).
Figure 4 shows the distribution of all genes represented inthe microarrays with respect to p value and fold change withrespect to Ground Controls. Figure 4 (left panel) displays thegene expression data for etiolated seedlings, and Fig. 4 (rightpanel) shows the data for cultured cells. Genes displayingstatistically significant expression are indicated in red andare found above the horizontal red line that shows thep < 0.01 demarcation. The position on the y axis indicates -log10 of p value, and position on the x axis indicates foldchange ( + or - ) in terms of log2.
Table 4 shows all genes that were differentially expressedby more than 5-fold in seedlings and provides the averagefold change for the six replicate samples. Nearly half of thegenes upregulated by 5-fold or more in seedlings are asso-ciated with pathogen response and wounding. The remain-ing genes are quite typical of generalized stress-response
genes, including those associated with drought and coldstress. Several genes of specific, well-defined developmentalfunction are represented as well, such as ALF4, which playsa role in auxin-mediated lateral root development (Du-brovsky et al., 2008), and SHM1, an essential regulator of
FIG. 2. Spaceflight and Ground Control temperature pro-files. The panels provide graphs of the temperature profilesof each BRIC as recorded by the HOBO data loggers. GroundControls are displayed as dotted lines and Spaceflight assolid lines. The individual BRICs are color-coded: BRIC A,red; BRIC B, blue; BRIC G, green. The y axis shows tem-perature in degrees Celsius, and the x axis shows time pointsas hours after turnover. The time points of Launch, Fixation,and Landing are indicated with yellow vertical lines. Colorimages available online at www.liebertonline.com/ast
ARABIDOPSIS SPACEFLIGHT TRANSCRIPTOMES 45
photorespiration (McClung et al., 2000). The group of genesdownregulated by 5-fold or more appears more mixed infunctional categorization. Genes encoding transcription fac-tors appear to be more highly represented in the group ofdownregulated genes, as are genes associated with cell wallmetabolism and cell elongation. Also present are examples ofgenes encoding proteins that function in calcium-mediatedsignaling and play a role in gravitropism.
Table 5 shows all the genes that were differentially ex-pressed by more than 5-fold in cultured cells in response tospaceflight and provides the average fold change for the sixreplicate samples. In cultured cells, the largest category,
which comprises nearly half the genes differentially ex-pressed by 5-fold or more, is that of genes associated with aheat shock response. This category expands in representationas higher fold-induction, with 75% of the genes showinggreater than 7-fold induction being heat shock–related. Allsix genes that were induced greater than 10-fold are heatshock–related. The remaining genes induced at 5-fold orgreater represent a wide diversity of function and categories,including recognizable stress responses, such as those in-volved with salt, drought, metals, wounding, phosphate,and ethylene. There are also some single representatives inmetabolisms associated with senescence, terpenoids, seed
FIG. 3. Spaceflight and Ground Control biology after landing. Representative pictures of the plant materials removed fromtheir respective PDFUs. The top row shows plant material from the Spaceflight and the bottom row from the GroundControls. In each set of images, there is a picture showing the entire Petri plate and a closer view to its right. The gridssubtending the entire Petri plate measure 13 mm square. Color images available online at www.liebertonline.com/ast
FIG. 4. Volcano plots of microarray data. Each graph shows the distribution of all genes represented in the microarrays withrespect to p value and fold change with respect to Ground Controls; seedling data are shown on the left, and cultured celldata are shown on the right. Genes displaying statistically significant expression are indicated in red and are found above thehorizontal red line showing the p < 0.01 demarcation. The position on the y axis indicates - log10 of p value, and position onthe x axis indicates fold change ( + or - ) in terms of log2. Color images available online at www.liebertonline.com/ast
46 PAUL ET AL.
development, cell walls, photosynthesis, and auxin. The listof the most highly downregulated genes shows more di-versity than the upregulated genes and includes severalrepresentatives each of kinases, transcription factors, andgenes encoding wounding and cell wall–associated proteins.
Examining the Gene Ontology categories for all Space-flight upregulated genes with p values < 0.01 betweenseedlings and cell cultures provides a broader look at thedifferences between the seedling and cell culture data sets.Although distributions of differentially expressed genes aresimilar for most categories, there are four categories thatdisplay striking differences between the two sample types.
Whereas in seedlings there are more than twice as manygenes upregulated in the category of cell organization andbiogenesis than in cell cultures, cultured cells display abouttwo and a half times as many stress and abiotic stimulusresponse genes as seedlings. Cell cultures also show induc-tion of almost three times as many genes in the category oftranscription as seen in seedlings. In a comparison of allgenes with p values of less than 0.01, and displaying a 2-folddifferential expression or greater, only one gene (MT3—At3g15353) is common to both the seedling and cell culturedata sets, and it is upregulated in seedlings while beingdownregulated in cell cultures (Table 6).
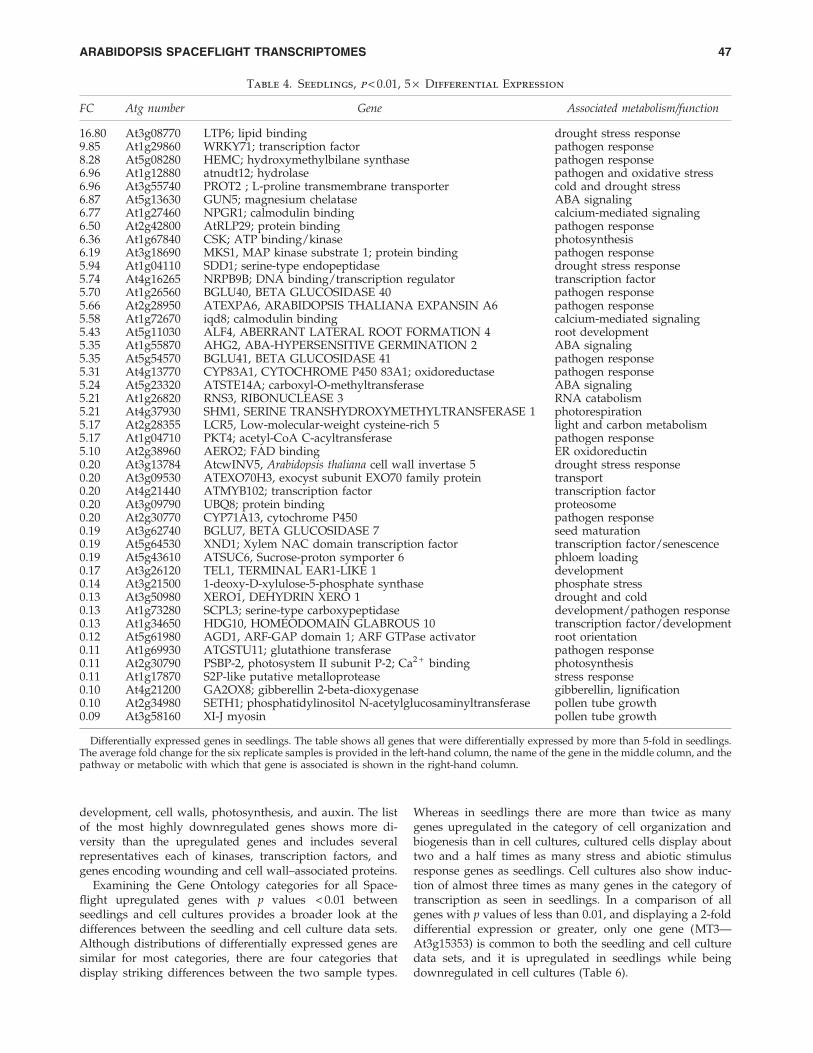
Table 4. Seedlings, p < 0.01, 5 · Differential Expression
FC Atg number Gene Associated metabolism/function
16.80 At3g08770 LTP6; lipid binding drought stress response9.85 At1g29860 WRKY71; transcription factor pathogen response8.28 At5g08280 HEMC; hydroxymethylbilane synthase pathogen response6.96 At1g12880 atnudt12; hydrolase pathogen and oxidative stress6.96 At3g55740 PROT2 ; L-proline transmembrane transporter cold and drought stress6.87 At5g13630 GUN5; magnesium chelatase ABA signaling6.77 At1g27460 NPGR1; calmodulin binding calcium-mediated signaling6.50 At2g42800 AtRLP29; protein binding pathogen response6.36 At1g67840 CSK; ATP binding/kinase photosynthesis6.19 At3g18690 MKS1, MAP kinase substrate 1; protein binding pathogen response5.94 At1g04110 SDD1; serine-type endopeptidase drought stress response5.74 At4g16265 NRPB9B; DNA binding/transcription regulator transcription factor5.70 At1g26560 BGLU40, BETA GLUCOSIDASE 40 pathogen response5.66 At2g28950 ATEXPA6, ARABIDOPSIS THALIANA EXPANSIN A6 pathogen response5.58 At1g72670 iqd8; calmodulin binding calcium-mediated signaling5.43 At5g11030 ALF4, ABERRANT LATERAL ROOT FORMATION 4 root development5.35 At1g55870 AHG2, ABA-HYPERSENSITIVE GERMINATION 2 ABA signaling5.35 At5g54570 BGLU41, BETA GLUCOSIDASE 41 pathogen response5.31 At4g13770 CYP83A1, CYTOCHROME P450 83A1; oxidoreductase pathogen response5.24 At5g23320 ATSTE14A; carboxyl-O-methyltransferase ABA signaling5.21 At1g26820 RNS3, RIBONUCLEASE 3 RNA catabolism5.21 At4g37930 SHM1, SERINE TRANSHYDROXYMETHYLTRANSFERASE 1 photorespiration5.17 At2g28355 LCR5, Low-molecular-weight cysteine-rich 5 light and carbon metabolism5.17 At1g04710 PKT4; acetyl-CoA C-acyltransferase pathogen response5.10 At2g38960 AERO2; FAD binding ER oxidoreductin0.20 At3g13784 AtcwINV5, Arabidopsis thaliana cell wall invertase 5 drought stress response0.20 At3g09530 ATEXO70H3, exocyst subunit EXO70 family protein transport0.20 At4g21440 ATMYB102; transcription factor transcription factor0.20 At3g09790 UBQ8; protein binding proteosome0.20 At2g30770 CYP71A13, cytochrome P450 pathogen response0.19 At3g62740 BGLU7, BETA GLUCOSIDASE 7 seed maturation0.19 At5g64530 XND1; Xylem NAC domain transcription factor transcription factor/senescence0.19 At5g43610 ATSUC6, Sucrose-proton symporter 6 phloem loading0.17 At3g26120 TEL1, TERMINAL EAR1-LIKE 1 development0.14 At3g21500 1-deoxy-D-xylulose-5-phosphate synthase phosphate stress0.13 At3g50980 XERO1, DEHYDRIN XERO 1 drought and cold0.13 At1g73280 SCPL3; serine-type carboxypeptidase development/pathogen response0.13 At1g34650 HDG10, HOMEODOMAIN GLABROUS 10 transcription factor/development0.12 At5g61980 AGD1, ARF-GAP domain 1; ARF GTPase activator root orientation0.11 At1g69930 ATGSTU11; glutathione transferase pathogen response0.11 At2g30790 PSBP-2, photosystem II subunit P-2; Ca2 + binding photosynthesis0.11 At1g17870 S2P-like putative metalloprotease stress response0.10 At4g21200 GA2OX8; gibberellin 2-beta-dioxygenase gibberellin, lignification0.10 At2g34980 SETH1; phosphatidylinositol N-acetylglucosaminyltransferase pollen tube growth0.09 At3g58160 XI-J myosin pollen tube growth
Differentially expressed genes in seedlings. The table shows all genes that were differentially expressed by more than 5-fold in seedlings.The average fold change for the six replicate samples is provided in the left-hand column, the name of the gene in the middle column, and thepathway or metabolic with which that gene is associated is shown in the right-hand column.
ARABIDOPSIS SPACEFLIGHT TRANSCRIPTOMES 47
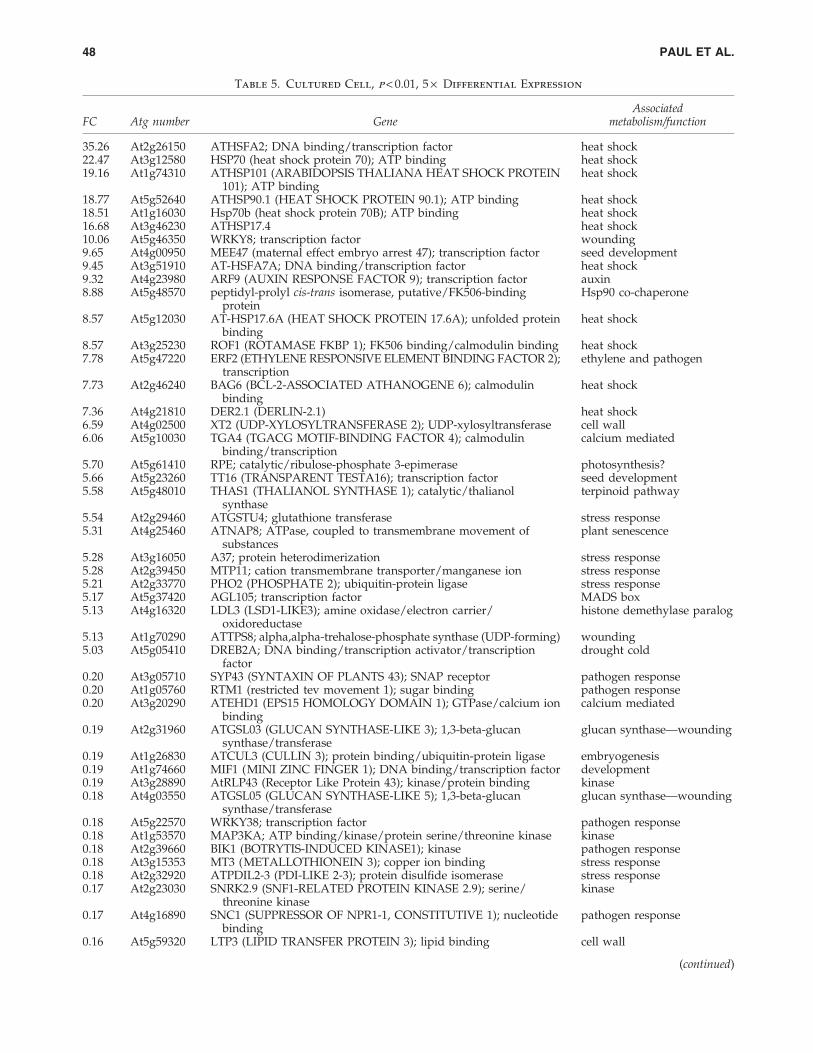
Table 5. Cultured Cell, p < 0.01, 5 · Differential Expression
FC Atg number GeneAssociated
metabolism/function
35.26 At2g26150 ATHSFA2; DNA binding/transcription factor heat shock22.47 At3g12580 HSP70 (heat shock protein 70); ATP binding heat shock19.16 At1g74310 ATHSP101 (ARABIDOPSIS THALIANA HEAT SHOCK PROTEIN
101); ATP bindingheat shock
18.77 At5g52640 ATHSP90.1 (HEAT SHOCK PROTEIN 90.1); ATP binding heat shock18.51 At1g16030 Hsp70b (heat shock protein 70B); ATP binding heat shock16.68 At3g46230 ATHSP17.4 heat shock10.06 At5g46350 WRKY8; transcription factor wounding9.65 At4g00950 MEE47 (maternal effect embryo arrest 47); transcription factor seed development9.45 At3g51910 AT-HSFA7A; DNA binding/transcription factor heat shock9.32 At4g23980 ARF9 (AUXIN RESPONSE FACTOR 9); transcription factor auxin8.88 At5g48570 peptidyl-prolyl cis-trans isomerase, putative/FK506-binding
proteinHsp90 co-chaperone
8.57 At5g12030 AT-HSP17.6A (HEAT SHOCK PROTEIN 17.6A); unfolded proteinbinding
heat shock
8.57 At3g25230 ROF1 (ROTAMASE FKBP 1); FK506 binding/calmodulin binding heat shock7.78 At5g47220 ERF2 (ETHYLENE RESPONSIVE ELEMENT BINDING FACTOR 2);
transcriptionethylene and pathogen
7.73 At2g46240 BAG6 (BCL-2-ASSOCIATED ATHANOGENE 6); calmodulinbinding
heat shock
7.36 At4g21810 DER2.1 (DERLIN-2.1) heat shock6.59 At4g02500 XT2 (UDP-XYLOSYLTRANSFERASE 2); UDP-xylosyltransferase cell wall6.06 At5g10030 TGA4 (TGACG MOTIF-BINDING FACTOR 4); calmodulin
binding/transcriptioncalcium mediated
5.70 At5g61410 RPE; catalytic/ribulose-phosphate 3-epimerase photosynthesis?5.66 At5g23260 TT16 (TRANSPARENT TESTA16); transcription factor seed development5.58 At5g48010 THAS1 (THALIANOL SYNTHASE 1); catalytic/thalianol
synthaseterpinoid pathway
5.54 At2g29460 ATGSTU4; glutathione transferase stress response5.31 At4g25460 ATNAP8; ATPase, coupled to transmembrane movement of
substancesplant senescence
5.28 At3g16050 A37; protein heterodimerization stress response5.28 At2g39450 MTP11; cation transmembrane transporter/manganese ion stress response5.21 At2g33770 PHO2 (PHOSPHATE 2); ubiquitin-protein ligase stress response5.17 At5g37420 AGL105; transcription factor MADS box5.13 At4g16320 LDL3 (LSD1-LIKE3); amine oxidase/electron carrier/
oxidoreductasehistone demethylase paralog
5.13 At1g70290 ATTPS8; alpha,alpha-trehalose-phosphate synthase (UDP-forming) wounding5.03 At5g05410 DREB2A; DNA binding/transcription activator/transcription
factordrought cold
0.20 At3g05710 SYP43 (SYNTAXIN OF PLANTS 43); SNAP receptor pathogen response0.20 At1g05760 RTM1 (restricted tev movement 1); sugar binding pathogen response0.20 At3g20290 ATEHD1 (EPS15 HOMOLOGY DOMAIN 1); GTPase/calcium ion
bindingcalcium mediated
0.19 At2g31960 ATGSL03 (GLUCAN SYNTHASE-LIKE 3); 1,3-beta-glucansynthase/transferase
glucan synthase—wounding
0.19 At1g26830 ATCUL3 (CULLIN 3); protein binding/ubiquitin-protein ligase embryogenesis0.19 At1g74660 MIF1 (MINI ZINC FINGER 1); DNA binding/transcription factor development0.19 At3g28890 AtRLP43 (Receptor Like Protein 43); kinase/protein binding kinase0.18 At4g03550 ATGSL05 (GLUCAN SYNTHASE-LIKE 5); 1,3-beta-glucan
synthase/transferaseglucan synthase—wounding
0.18 At5g22570 WRKY38; transcription factor pathogen response0.18 At1g53570 MAP3KA; ATP binding/kinase/protein serine/threonine kinase kinase0.18 At2g39660 BIK1 (BOTRYTIS-INDUCED KINASE1); kinase pathogen response0.18 At3g15353 MT3 (METALLOTHIONEIN 3); copper ion binding stress response0.18 At2g32920 ATPDIL2-3 (PDI-LIKE 2-3); protein disulfide isomerase stress response0.17 At2g23030 SNRK2.9 (SNF1-RELATED PROTEIN KINASE 2.9); serine/
threonine kinasekinase
0.17 At4g16890 SNC1 (SUPPRESSOR OF NPR1-1, CONSTITUTIVE 1); nucleotidebinding
pathogen response
0.16 At5g59320 LTP3 (LIPID TRANSFER PROTEIN 3); lipid binding cell wall
(continued)
48 PAUL ET AL.
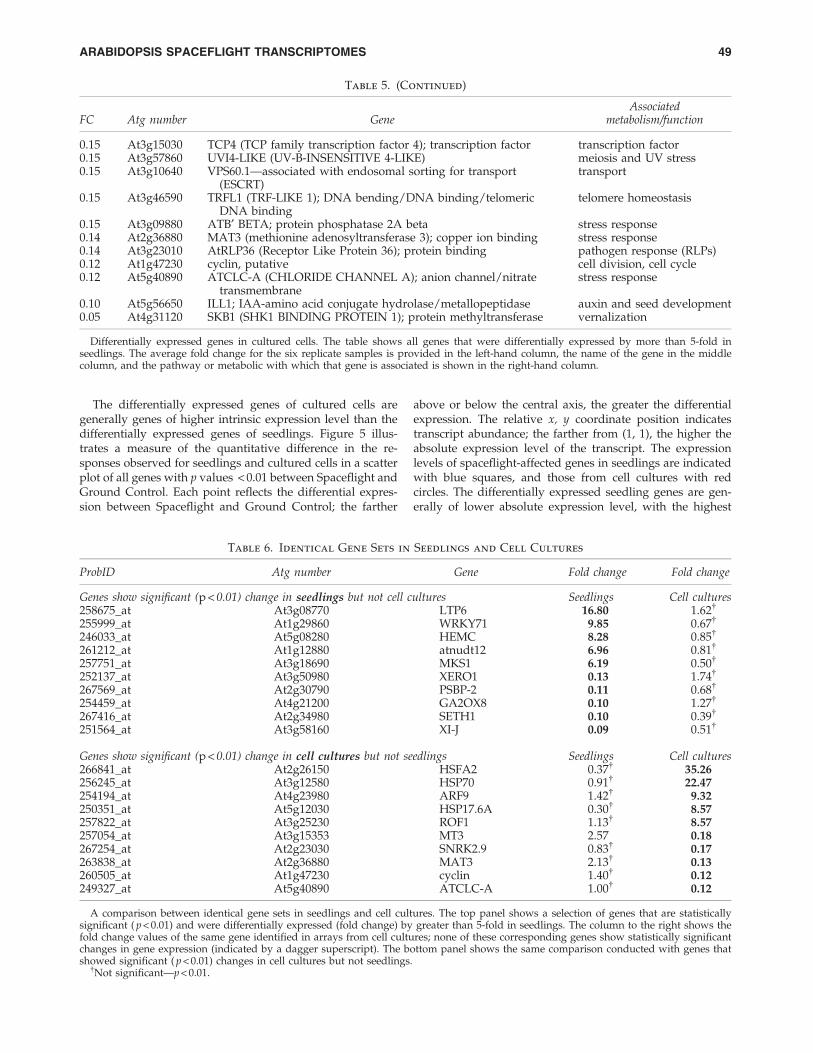
The differentially expressed genes of cultured cells aregenerally genes of higher intrinsic expression level than thedifferentially expressed genes of seedlings. Figure 5 illus-trates a measure of the quantitative difference in the re-sponses observed for seedlings and cultured cells in a scatterplot of all genes with p values < 0.01 between Spaceflight andGround Control. Each point reflects the differential expres-sion between Spaceflight and Ground Control; the farther
above or below the central axis, the greater the differentialexpression. The relative x, y coordinate position indicatestranscript abundance; the farther from (1, 1), the higher theabsolute expression level of the transcript. The expressionlevels of spaceflight-affected genes in seedlings are indicatedwith blue squares, and those from cell cultures with redcircles. The differentially expressed seedling genes are gen-erally of lower absolute expression level, with the highest
Table 6. Identical Gene Sets in Seedlings and Cell Cultures
ProbID Atg number Gene Fold change Fold change
Genes show significant (p < 0.01) change in seedlings but not cell cultures Seedlings Cell cultures258675_at At3g08770 LTP6 16.80 1.62{
255999_at At1g29860 WRKY71 9.85 0.67{
246033_at At5g08280 HEMC 8.28 0.85{
261212_at At1g12880 atnudt12 6.96 0.81{
257751_at At3g18690 MKS1 6.19 0.50{
252137_at At3g50980 XERO1 0.13 1.74{
267569_at At2g30790 PSBP-2 0.11 0.68{
254459_at At4g21200 GA2OX8 0.10 1.27{
267416_at At2g34980 SETH1 0.10 0.39{
251564_at At3g58160 XI-J 0.09 0.51{
Genes show significant (p < 0.01) change in cell cultures but not seedlings Seedlings Cell cultures266841_at At2g26150 HSFA2 0.37{ 35.26256245_at At3g12580 HSP70 0.91{ 22.47254194_at At4g23980 ARF9 1.42{ 9.32250351_at At5g12030 HSP17.6A 0.30{ 8.57257822_at At3g25230 ROF1 1.13{ 8.57257054_at At3g15353 MT3 2.57 0.18267254_at At2g23030 SNRK2.9 0.83{ 0.17263838_at At2g36880 MAT3 2.13{ 0.13260505_at At1g47230 cyclin 1.40{ 0.12249327_at At5g40890 ATCLC-A 1.00{ 0.12
A comparison between identical gene sets in seedlings and cell cultures. The top panel shows a selection of genes that are statisticallysignificant ( p < 0.01) and were differentially expressed (fold change) by greater than 5-fold in seedlings. The column to the right shows thefold change values of the same gene identified in arrays from cell cultures; none of these corresponding genes show statistically significantchanges in gene expression (indicated by a dagger superscript). The bottom panel shows the same comparison conducted with genes thatshowed significant ( p < 0.01) changes in cell cultures but not seedlings.
{Not significant—p < 0.01.
Table 5. (Continued)
FC Atg number GeneAssociated
metabolism/function
0.15 At3g15030 TCP4 (TCP family transcription factor 4); transcription factor transcription factor0.15 At3g57860 UVI4-LIKE (UV-B-INSENSITIVE 4-LIKE) meiosis and UV stress0.15 At3g10640 VPS60.1—associated with endosomal sorting for transport
(ESCRT)transport
0.15 At3g46590 TRFL1 (TRF-LIKE 1); DNA bending/DNA binding/telomericDNA binding
telomere homeostasis
0.15 At3g09880 ATB¢ BETA; protein phosphatase 2A beta stress response0.14 At2g36880 MAT3 (methionine adenosyltransferase 3); copper ion binding stress response0.14 At3g23010 AtRLP36 (Receptor Like Protein 36); protein binding pathogen response (RLPs)0.12 At1g47230 cyclin, putative cell division, cell cycle0.12 At5g40890 ATCLC-A (CHLORIDE CHANNEL A); anion channel/nitrate
transmembranestress response
0.10 At5g56650 ILL1; IAA-amino acid conjugate hydrolase/metallopeptidase auxin and seed development0.05 At4g31120 SKB1 (SHK1 BINDING PROTEIN 1); protein methyltransferase vernalization
Differentially expressed genes in cultured cells. The table shows all genes that were differentially expressed by more than 5-fold inseedlings. The average fold change for the six replicate samples is provided in the left-hand column, the name of the gene in the middlecolumn, and the pathway or metabolic with which that gene is associated is shown in the right-hand column.
ARABIDOPSIS SPACEFLIGHT TRANSCRIPTOMES 49
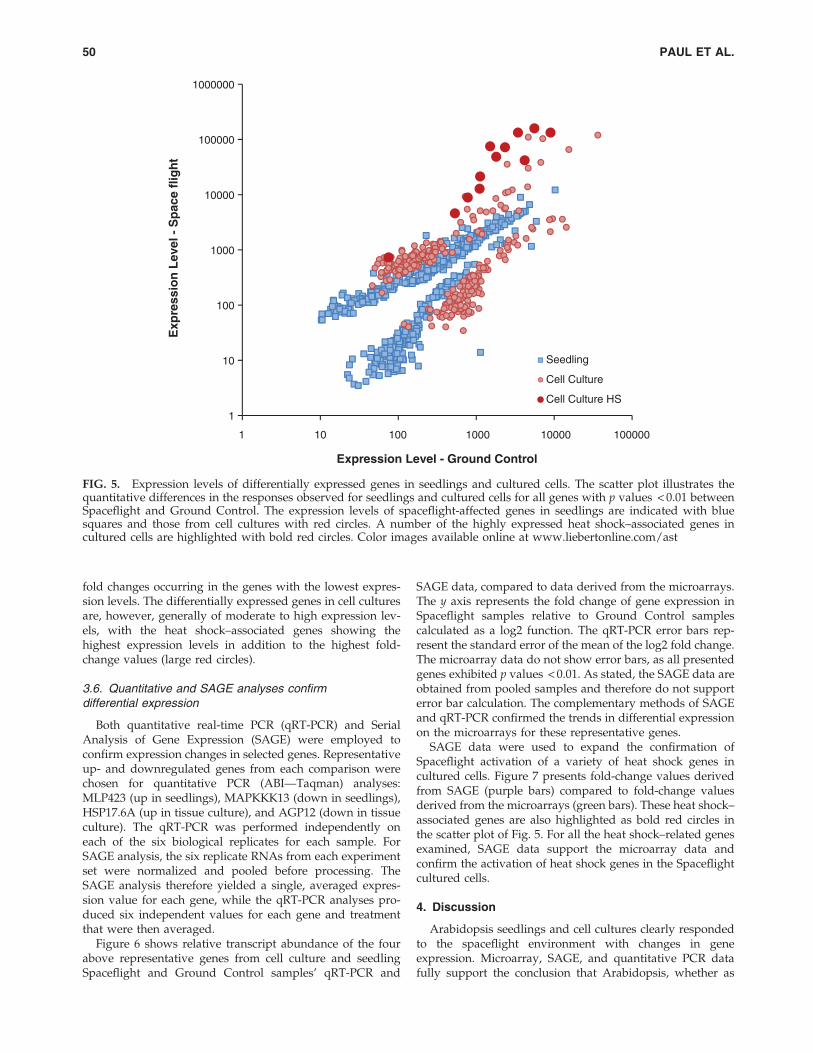
fold changes occurring in the genes with the lowest expres-sion levels. The differentially expressed genes in cell culturesare, however, generally of moderate to high expression lev-els, with the heat shock–associated genes showing thehighest expression levels in addition to the highest fold-change values (large red circles).
3.6. Quantitative and SAGE analyses confirmdifferential expression
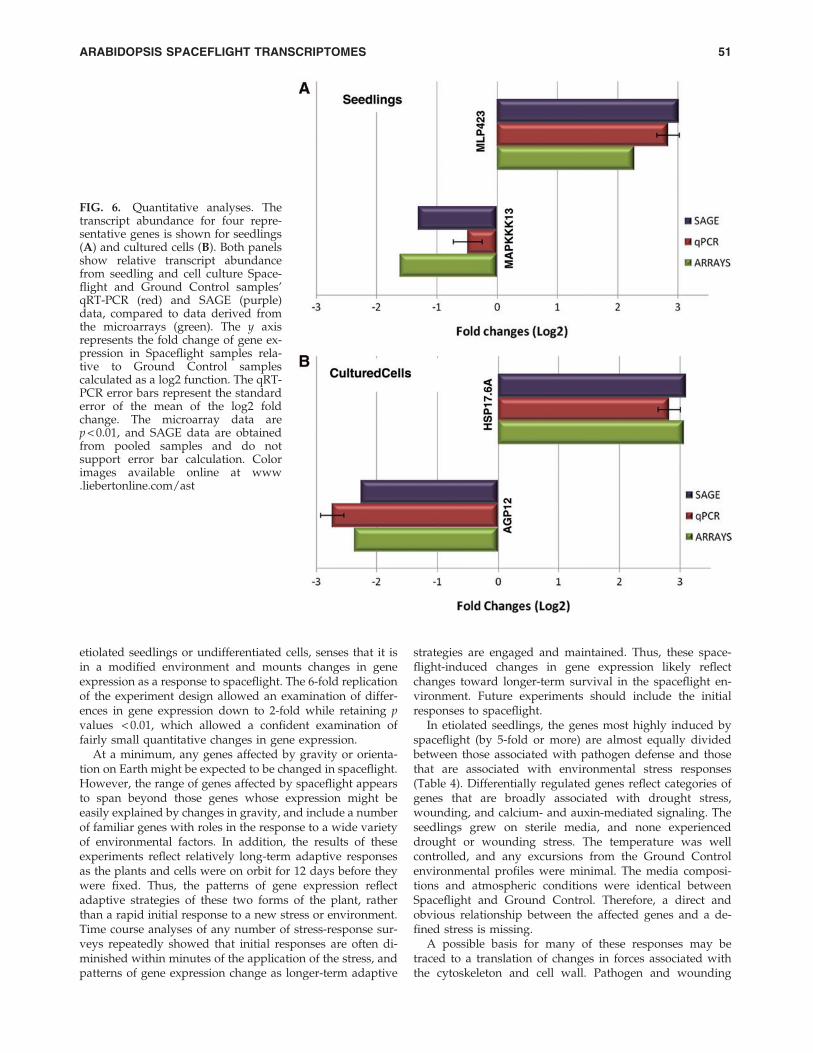
Both quantitative real-time PCR (qRT-PCR) and SerialAnalysis of Gene Expression (SAGE) were employed toconfirm expression changes in selected genes. Representativeup- and downregulated genes from each comparison werechosen for quantitative PCR (ABI—Taqman) analyses:MLP423 (up in seedlings), MAPKKK13 (down in seedlings),HSP17.6A (up in tissue culture), and AGP12 (down in tissueculture). The qRT-PCR was performed independently oneach of the six biological replicates for each sample. ForSAGE analysis, the six replicate RNAs from each experimentset were normalized and pooled before processing. TheSAGE analysis therefore yielded a single, averaged expres-sion value for each gene, while the qRT-PCR analyses pro-duced six independent values for each gene and treatmentthat were then averaged.
Figure 6 shows relative transcript abundance of the fourabove representative genes from cell culture and seedlingSpaceflight and Ground Control samples’ qRT-PCR and
SAGE data, compared to data derived from the microarrays.The y axis represents the fold change of gene expression inSpaceflight samples relative to Ground Control samplescalculated as a log2 function. The qRT-PCR error bars rep-resent the standard error of the mean of the log2 fold change.The microarray data do not show error bars, as all presentedgenes exhibited p values < 0.01. As stated, the SAGE data areobtained from pooled samples and therefore do not supporterror bar calculation. The complementary methods of SAGEand qRT-PCR confirmed the trends in differential expressionon the microarrays for these representative genes.
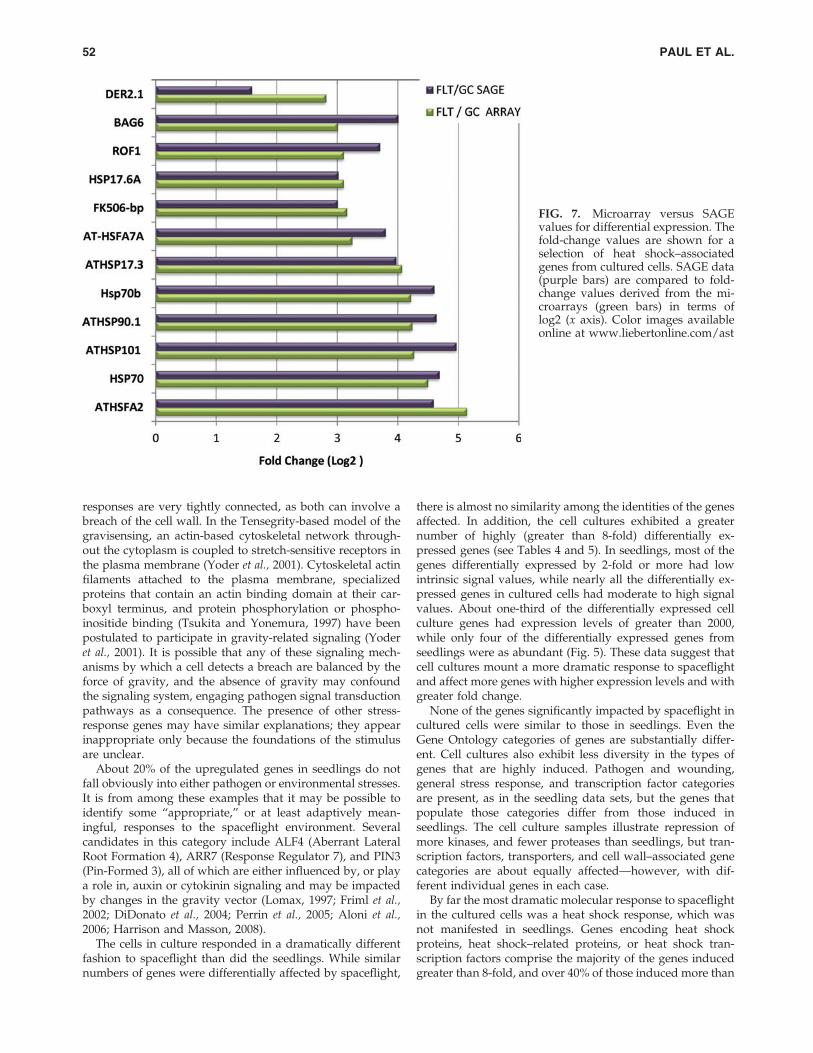
SAGE data were used to expand the confirmation ofSpaceflight activation of a variety of heat shock genes incultured cells. Figure 7 presents fold-change values derivedfrom SAGE (purple bars) compared to fold-change valuesderived from the microarrays (green bars). These heat shock–associated genes are also highlighted as bold red circles inthe scatter plot of Fig. 5. For all the heat shock–related genesexamined, SAGE data support the microarray data andconfirm the activation of heat shock genes in the Spaceflightcultured cells.
4. Discussion
Arabidopsis seedlings and cell cultures clearly respondedto the spaceflight environment with changes in geneexpression. Microarray, SAGE, and quantitative PCR datafully support the conclusion that Arabidopsis, whether as
1
10
100
1000
10000
100000
1000000
1 10 100 1000 10000 100000
Exp
ress
ion
Lev
el -
Sp
ace
flig
ht
Expression Level - Ground Control
Seedling
Cell Culture
Cell Culture HS
FIG. 5. Expression levels of differentially expressed genes in seedlings and cultured cells. The scatter plot illustrates thequantitative differences in the responses observed for seedlings and cultured cells for all genes with p values < 0.01 betweenSpaceflight and Ground Control. The expression levels of spaceflight-affected genes in seedlings are indicated with bluesquares and those from cell cultures with red circles. A number of the highly expressed heat shock–associated genes incultured cells are highlighted with bold red circles. Color images available online at www.liebertonline.com/ast
50 PAUL ET AL.
etiolated seedlings or undifferentiated cells, senses that it isin a modified environment and mounts changes in geneexpression as a response to spaceflight. The 6-fold replicationof the experiment design allowed an examination of differ-ences in gene expression down to 2-fold while retaining pvalues < 0.01, which allowed a confident examination offairly small quantitative changes in gene expression.
At a minimum, any genes affected by gravity or orienta-tion on Earth might be expected to be changed in spaceflight.However, the range of genes affected by spaceflight appearsto span beyond those genes whose expression might beeasily explained by changes in gravity, and include a numberof familiar genes with roles in the response to a wide varietyof environmental factors. In addition, the results of theseexperiments reflect relatively long-term adaptive responsesas the plants and cells were on orbit for 12 days before theywere fixed. Thus, the patterns of gene expression reflectadaptive strategies of these two forms of the plant, ratherthan a rapid initial response to a new stress or environment.Time course analyses of any number of stress-response sur-veys repeatedly showed that initial responses are often di-minished within minutes of the application of the stress, andpatterns of gene expression change as longer-term adaptive
strategies are engaged and maintained. Thus, these space-flight-induced changes in gene expression likely reflectchanges toward longer-term survival in the spaceflight en-vironment. Future experiments should include the initialresponses to spaceflight.
In etiolated seedlings, the genes most highly induced byspaceflight (by 5-fold or more) are almost equally dividedbetween those associated with pathogen defense and thosethat are associated with environmental stress responses(Table 4). Differentially regulated genes reflect categories ofgenes that are broadly associated with drought stress,wounding, and calcium- and auxin-mediated signaling. Theseedlings grew on sterile media, and none experienceddrought or wounding stress. The temperature was wellcontrolled, and any excursions from the Ground Controlenvironmental profiles were minimal. The media composi-tions and atmospheric conditions were identical betweenSpaceflight and Ground Control. Therefore, a direct andobvious relationship between the affected genes and a de-fined stress is missing.
A possible basis for many of these responses may betraced to a translation of changes in forces associated withthe cytoskeleton and cell wall. Pathogen and wounding
FIG. 6. Quantitative analyses. Thetranscript abundance for four repre-sentative genes is shown for seedlings(A) and cultured cells (B). Both panelsshow relative transcript abundancefrom seedling and cell culture Space-flight and Ground Control samples’qRT-PCR (red) and SAGE (purple)data, compared to data derived fromthe microarrays (green). The y axisrepresents the fold change of gene ex-pression in Spaceflight samples rela-tive to Ground Control samplescalculated as a log2 function. The qRT-PCR error bars represent the standarderror of the mean of the log2 foldchange. The microarray data arep < 0.01, and SAGE data are obtainedfrom pooled samples and do notsupport error bar calculation. Colorimages available online at www.liebertonline.com/ast
ARABIDOPSIS SPACEFLIGHT TRANSCRIPTOMES 51
responses are very tightly connected, as both can involve abreach of the cell wall. In the Tensegrity-based model of thegravisensing, an actin-based cytoskeletal network through-out the cytoplasm is coupled to stretch-sensitive receptors inthe plasma membrane (Yoder et al., 2001). Cytoskeletal actinfilaments attached to the plasma membrane, specializedproteins that contain an actin binding domain at their car-boxyl terminus, and protein phosphorylation or phospho-inositide binding (Tsukita and Yonemura, 1997) have beenpostulated to participate in gravity-related signaling (Yoderet al., 2001). It is possible that any of these signaling mech-anisms by which a cell detects a breach are balanced by theforce of gravity, and the absence of gravity may confoundthe signaling system, engaging pathogen signal transductionpathways as a consequence. The presence of other stress-response genes may have similar explanations; they appearinappropriate only because the foundations of the stimulusare unclear.
About 20% of the upregulated genes in seedlings do notfall obviously into either pathogen or environmental stresses.It is from among these examples that it may be possible toidentify some ‘‘appropriate,’’ or at least adaptively mean-ingful, responses to the spaceflight environment. Severalcandidates in this category include ALF4 (Aberrant LateralRoot Formation 4), ARR7 (Response Regulator 7), and PIN3(Pin-Formed 3), all of which are either influenced by, or playa role in, auxin or cytokinin signaling and may be impactedby changes in the gravity vector (Lomax, 1997; Friml et al.,2002; DiDonato et al., 2004; Perrin et al., 2005; Aloni et al.,2006; Harrison and Masson, 2008).
The cells in culture responded in a dramatically differentfashion to spaceflight than did the seedlings. While similarnumbers of genes were differentially affected by spaceflight,
there is almost no similarity among the identities of the genesaffected. In addition, the cell cultures exhibited a greaternumber of highly (greater than 8-fold) differentially ex-pressed genes (see Tables 4 and 5). In seedlings, most of thegenes differentially expressed by 2-fold or more had lowintrinsic signal values, while nearly all the differentially ex-pressed genes in cultured cells had moderate to high signalvalues. About one-third of the differentially expressed cellculture genes had expression levels of greater than 2000,while only four of the differentially expressed genes fromseedlings were as abundant (Fig. 5). These data suggest thatcell cultures mount a more dramatic response to spaceflightand affect more genes with higher expression levels and withgreater fold change.
None of the genes significantly impacted by spaceflight incultured cells were similar to those in seedlings. Even theGene Ontology categories of genes are substantially differ-ent. Cell cultures also exhibit less diversity in the types ofgenes that are highly induced. Pathogen and wounding,general stress response, and transcription factor categoriesare present, as in the seedling data sets, but the genes thatpopulate those categories differ from those induced inseedlings. The cell culture samples illustrate repression ofmore kinases, and fewer proteases than seedlings, but tran-scription factors, transporters, and cell wall–associated genecategories are about equally affected—however, with dif-ferent individual genes in each case.
By far the most dramatic molecular response to spaceflightin the cultured cells was a heat shock response, which wasnot manifested in seedlings. Genes encoding heat shockproteins, heat shock–related proteins, or heat shock tran-scription factors comprise the majority of the genes inducedgreater than 8-fold, and over 40% of those induced more than
FIG. 7. Microarray versus SAGEvalues for differential expression. Thefold-change values are shown for aselection of heat shock–associatedgenes from cultured cells. SAGE data(purple bars) are compared to fold-change values derived from the mi-croarrays (green bars) in terms oflog2 (x axis). Color images availableonline at www.liebertonline.com/ast
52 PAUL ET AL.
5-fold. Clearly, no temperature differentials capable of classicheat shock were present between the Spaceflight samplesand the Ground Control samples. Heat shock proteins are,however, generally related to responses to unfolded proteinsand can be part of a variety of signal transduction pathways.It has been shown in both plants and animals that heatshock–related proteins are widely distributed in response toan assortment of abiotic stresses. In addition to their roles asmolecular chaperones that manage post-translational pro-cesses, heat shock proteins are thought to participate in thecross talk among stress-response pathways, especially wherean organism is exposed to multiple, concomitant stresses.Over-expression of heat shock proteins may contribute to ageneralized tolerance for multiple environmental stresses(Swindell et al., 2007). In a situation involving a novel envi-ronment such as spaceflight, it is possible that a plant cellresponds as if it were being exposed to multiple stressors,and the induction of heat shock proteins reflects this per-ception.
There are few previous studies to provide ground for di-rect comparison with the current data, yet interesting cor-relations emerge. Three genome-scale plant molecular spacestudies have been published to date (Paul et al., 2005; Stutteet al., 2006; Salmi and Roux, 2008). One positive correlation isthat evidence of spaceflight heat shock was seen in Arabi-dopsis (Paul et al., 2005), albeit in light-grown seedlings quitedistinct from those of the current study. Another positive,but less direct, correlation is the effect of spaceflight on theexpression of genes involved in calcium signaling duringfern spore development (Salmi and Roux, 2008). However,there were virtually no statistically supportable changes inthe patterns of gene expression between wheat for compar-ison (Stutte et al., 2006). Genome-wide studies of the impactof spaceflight on animal systems are slightly more common,particularly for cell lines from bone-derived cultures, mice,and drosophila models. While a full review of that literatureis beyond the scope of this study, recent studies do demon-strate clear transcriptome differences during spaceflight, in-cluding studies of murine muscle (Allen et al., 2009) andthymus tissue (Lebsack et al., 2010). Drosophila and Caeno-rhabditis elegans show six differentially expressed genescommon to these two diverse species (Leandro et al., 2007;Adenle et al., 2009). And while the divergence of plants andanimals largely prevents specific gene comparisons inspaceflight responses, certain classes of genes seem similarlyaffected by spaceflight. Calcium-mediated signal transduc-tion is impacted by spaceflight in both plants and animals(Hughes-Fulford et al., 1998; Hashemi et al., 1999; Paul et al.,2001; Salmi and Roux, 2008), and genes affected by calciumsignaling are differentially expressed. Heat shock proteinsare highly conserved in both kingdoms, and heat shockgenes are upregulated in some spaceflight studies. At leastone of the subclass of heat shock genes highly induced in thisstudy (Hsp90) is also induced in mouse thymus after expo-sure to spaceflight (Lebsack et al., 2010). Stress also exacer-bates sensitivity to pathogen attack in both plants andanimals, and there are common mechanisms for triggeringan immune response, such as nitric oxide and mitogen-acti-vated protein kinase cascades (Nurnberger et al., 2004). Anumber of genes associated with Drosophila immune path-ways were downregulated in the spaceflight environment,and larvae were in fact more susceptible to pathogen infec-
tion (Marcu et al., 2011). Although none of the Drosophilagenes in that study were orthologous to the Arabidopsisgenes presented here, many of genes in the present seedlingdata are nonetheless associated with pathogen defense.While many more studies will be required to support in-formed deductions regarding commonalities in spaceflightresponse (especially considering the dissimilarity of biology,hardware, flight profiles, and even replicates), current datasuggest that such commonalities may exist.
That plants and plant cells under BRIC experimental con-ditions respond to spaceflight with significant changes ingene expression indicates that changes in metabolism areengaged to cope with spaceflight. Spaceflight demands anadaptive response. Many of these changes make some sensewith regard to the primary effects of gravity, but otherssuggest stresses that are not simply explained by the lack ofgravity. That cultured cells respond dramatically to space-flight in a markedly different way than seedlings suggeststhat either undifferentiated cells have more biological diffi-culty with spaceflight or that there are technical reasons af-fecting the results. One possibility is that this differencebetween cultured cells and seedlings is due to the fact thatseedlings have organs with which to sense and sample theirenvironment, and that undifferentiated cell cultures, in theabsence of such organs, propagate inappropriate stress re-sponses. In support of this possibility, seedlings displayed agreater abundance of differentially expressed genes associ-ated with plant hormone signaling and gravity sensing, whilecultured cells did not. Another possible explanation for thedifferences is simply that all the cells in the culture were re-sponding in an identical manner, enhancing the technicalobservation of the response, while in seedlings different tis-sues were responding differently, diluting the apparent effectas induction in one tissue balances repression in another. Theanalysis of spaceflight effects on seedlings would benefit fromrecovering enough material to look at individual organs orcell types. Regardless, it remains clear that there is not anintense and simple response to spaceflight that is shared byall cell types within the differentiated cells of an intact plant.
5. Conclusions
Seedlings and cell cultures both engage gene expressionchanges to alter metabolic responses to the spaceflight en-vironment, but they engage dramatically different responses.This response differential between seedlings and cell culturescould be as simple as a consequence of examining a veryuniformly responding system in undifferentiated cells com-pared to a complex organism composed of differentiatedorgans and tissues. Or it could be as complex as the presenceof an organ-specific feedback sense and response system thatallows seedlings, but not undifferentiated cells, to moreproperly sense the environment and integrate a response thatmakes sense based on input from organ systems. Regardless,it is clear that even undifferentiated plant cells sense space-flight as an environment that demands molecular responses.Many of those responses tap familiar pathways—auxin,calcium signaling, stress—and there is a tendency to placethose responses into familiar Earth-based context. But giventhe truly novel nature of spaceflight, responses may propa-gate in ways that are distinct from well-defined terrestrialanalogues.
ARABIDOPSIS SPACEFLIGHT TRANSCRIPTOMES 53
Acknowledgments
The authors would like to thank all our colleagues andassociates at Kennedy Space Center who helped with theBRIC flight experiment, especially Howard Levine, AprilSpinale, Dave Reed, Susan Manning-Roach, George Guerra,Kim Slater, Chris Comstock, and Dave Cox. Also, PatrickGilles and Xiequn (Tony) Xu for their help with the SAGEanalysis. This work was supported by NASA grantsNNX10AF45G and NNX09AL96G to A.L.P. and R.J.F.
Author Disclosure Statement
No competing financial interests exist.
Abbreviations
BRIC, Biological Research In a Canister; BTC, BioTrans-port Carrier; KSC, Kennedy Space Center; LED, light-emit-ting diode; OES, Orbiter Environmental Simulator; PDFUs,Petri Dish Fixation Units; qRT-PCR, quantitative real-timePCR; RT-qPCR, quantitative reverse transcription–polymerasechain reaction; SAGE, Serial Analysis of Gene Expression;SLSL, Spaceflight Life Sciences Laboratory.
References
Adamchuk, N.I., Mikhaylenko, N.F., Zolotareva, E.K., Hilaire,E., and Guikema, J.A. (1999) Spaceflight effects on structuraland some biochemical parameters of Brassica rapa photosyn-thetic apparatus. J Gravit Physiol 6:95–96.
Adenle, A.A., Johnsen, B., and Szewczyk, N.J. (2009) Review ofthe results from the International C. elegans first experiment(ICE-FIRST). Adv Space Res 44:210–216.
Allen, D.L., Bandstra, E.R., Harrison, B.C., Thorng, S., Stodieck,L.S., Kostenuik, P.J., Morony, S., Lacey, D.L., Hammond, T.G.,Leinwand L.L., Argraves, W.S., Bateman, T.A., and Barth, J.L.(2009) Effects of spaceflight on murine skeletal muscle geneexpression. J Appl Physiol 106:582–595.
Aloni, R., Aloni, E., Langhans, M., and Ullrich, C.I. (2006) Role ofcytokinin and auxin in shaping root architecture: regulatingvascular differentiation, lateral root initiation, root apicaldominance and root gravitropism. Ann Bot 97:883–893.
Benedict, C., Geisler, M., Trygg, J., Huner, N., and Hurry, V.(2006) Consensus by democracy. Using meta-analyses of mi-croarray and genomic data to model the cold acclimation sig-naling pathway in Arabidopsis. Plant Physiol 141:1219–1232.
Branco-Price, C., Kawaguchi, R., Ferreira, R.B., and Bailey-Serres, J. (2005) Genome-wide analysis of transcript abun-dance and translation in Arabidopsis seedlings subjected tooxygen deprivation. Ann Bot 96:647–660.
Brinckmann, E. (2007) Biology in Space and Life on Earth, Wiley-VCH Verlag GambH & Co. KGaA, Weinheim.
Brown, C.S., Tibbitts, T.W., Croxdale, J.G., and Wheeler, R.M.(1997) Potato tuber formation in the spaceflight environment.Life Support Biosph Sci 4:71–76.
Bucker, H. (1974) The Biostack experiments I and II aboardApollo 16 and 17. Life Sci Space Res 12:43–50.
Bustin, S.A. (2000) Absolute quantification of mRNA using real-time reverse transcription polymerase chain reaction assays. JMol Endocrinol 25:169–193.
Chen, W., Provart, N.J., Glazebrook, J., Katagiri, F., Chang, H.S.,Eulgem, T., Mauch, F., Luan, S., Zou, G., Whitham, S.A.,Budworth, P.R., Tao, Y., Xie, Z., Chen, X., Lam, S., Kreps, J.A.,Harper, J.F., Si-Ammour, A., Mauch-Mani, B., Heinlein, M.,
Kobayashi, K., Hohn, T., Dangl, J.L., Wang, X., and Zhu, T.(2002) Expression profile matrix of Arabidopsis transcriptionfactor genes suggests their putative functions in response toenvironmental stresses. Plant Cell 14:559–574.
Clement, G. and Slenzka, K., editors. (2006) Fundamentals of SpaceBiology—Research on Cells, Animals and Plants in Space, Micro-cosm Press and Springer, El Segundo, CA, and New York.
Des Marais, D.J., Nuth, J.A., III, Allamandola, L.J., Boss, A.P.,Farmer, J.D., Hoehler, T.M., Jakosky, B.M., Meadows, V.S.,Pohorille, A., Runnegar, B., and Spormann, A.M. (2008) TheNASA Astrobiology Roadmap. Astrobiology 8:715–730.
DiDonato, R.J., Arbuckle, E., Buker, S., Sheets, J., Tobar, J., To-tong, R., Grisafi, P., Fink, G.R., and Celenza, J.L. (2004) Ara-bidopsis ALF4 encodes a nuclear-localized protein requiredfor lateral root formation. Plant J 37:340–353.
Driss-Ecole, D., Jeune, B., Prouteau, M., Julianus, P., and Perbal,G. (2000) Lentil root statoliths reach a stable state in micro-gravity. Planta 211:396–405.
Dubrovsky, J.G., Sauer, M., Napsucialy-Mendivil, S., Ivanchenko,M.G., Friml, J., Shishkova, S., Celenza, J., and Benkova, E. (2008)Auxin acts as a local morphogenetic trigger to specify lateral rootfounder cells. Proc Natl Acad Sci USA 105:8790–8794.
Dutcher, F.R., Hess, E.L., and Halstead, T.W. (1994) Progress inplant research in space. Adv Space Res 14:159–171.
Ferl, R., Wheeler, R., Levine, H.G., and Paul, A.L. (2002) Plantsin space. Curr Opin Plant Biol 5:258–263.
Ferl, R.J., Zupanska, A., Spinale, A., Reed, D., Manning-Roach,S., Guerra, G., Cox, D., and Paul, A.-L. (2011) The performanceof KSC Fixation Tubes with RNALater for orbital experiments:a case study in ISS operations for molecular biology. Adv SpaceRes 48:199–206.
Friml, J., Wisniewska, J., Benkova, E., Mendgen, K., and Palme,K. (2002) Lateral relocation of auxin efflux regulator PIN3mediates tropism in Arabidopsis. Nature 415:806–809.
Gao, W.-Y., Fu, R.-Z., Fan, L., Zhao, S.-P., and Paek, K.-Y. (2000)The effects of spaceflight on soluble protein, isoperoxidase,and genomic DNA in ural licorice (Glycyrrhiza uralensis Fisch.).Journal of Plant Biology 43:94–98.
Gilroy, S. and Masson, P., editors. (2007) Plant Tropisms, Black-well Publishing, Ames, IA.
Guikema, J.A., DeBell, L., Paulsen, A., Spooner, B.S., and Wong,P.P. (1994) Clover development during spaceflight: a modelsystem. Adv Space Res 14:173–176.
Halstead, T.W. and Dutcher, F.R. (1987) Plants in space. AnnuRev Plant Physiol 38:317–345.
Hampp, R., Hoffmann, E., Schonherr, K., Johann, P., and DeFilippis, L. (1997) Fusion and metabolism of plant cells as af-fected by microgravity. Planta 203:S42–S53.
Harrison, B.R. and Masson, P.H. (2008) ARL2, ARG1 and PIN3define a gravity signal transduction pathway in root stato-cytes. Plant J 53:380–392.
Hashemi, B.B., Penkala, J.E., Vens, C., Huls, H., Cubbage, M.,and Sams, C.F. (1999) T cell activation responses are differ-entially regulated during clinorotation and in spaceflight.FASEB J 13:2071–2082.
Hoson, T., Soga, K., Wakabayashi, K., Kamisaka, S., and Tani-moto, E. (2003) Growth and cell wall changes in rice rootsduring spaceflight. Plant Soil 255:19–26.
Hughes-Fulford, M., Tjandrawinata, R., Fitzgerald, J., Gasuad,K., and Gilbertson, V. (1998) Effects of microgravity on oste-oblast growth. Gravit Space Biol Bull 11:51–60.
Jiang, Y., Yang, B., Harris, N.S., and Deyholos, M.K. (2007)Comparative proteomic analysis of NaCl stress-responsiveproteins in Arabidopsis roots. J Exp Bot 58:3591–3607.
54 PAUL ET AL.
Johnsson, A., Solheim, B.G., and Iversen, T.H. (2009) Gravityamplifies and microgravity decreases circumnutations inArabidopsis thaliana stems: results from a space experiment.New Phytol 182:621–629.
Kant, P., Gordon, M., Kant, S., Zolla, G., Davydov, O., Heimer,Y.M., Chalifa-Caspi, V., Shaked, R., and Barak, S. (2008)Functional-genomics-based identification of genes that regu-late Arabidopsis responses to multiple abiotic stresses. PlantCell Environ 31:697–714.
Kern, V.D. and Sack, F.D. (2001) Effects of spaceflight (STS-87)on tropisms and plastid positioning in protonemata of themoss Ceratodon purpureus. Adv Space Res 27:941–949.
Kern, V.D., Sack, F.D., White, N.J., Anderson, K., Wells, W., andMartin, C. (1999) Spaceflight hardware allowing unilateralirradiation and chemical fixation in Petri dishes. Adv Space Res24:775–778.
Kilian, J., Whitehead, D., Horak, J., Wanke, D., Weinl, S., Batistic,O., D’Angelo, C., Bornberg-Bauer, E., Kudla, J., and Harter, K.(2007) The AtGenExpress global stress expression data set:protocols, evaluation and model data analysis of UV-B light,drought and cold stress responses. Plant J 50:347–363.
Kimbrough, J.M., Salinas-Mondragon, R., Boss, W.F., Brown,C.S., and Sederoff, H.W. (2004) The fast and transient tran-scriptional network of gravity and mechanical stimulation inthe Arabidopsis root apex. Plant Physiol 136:2790–2805.
Kimura, M., Yamamoto, Y.Y., Seki, M., Sakurai, T., Sato, M.,Abe, T., Yoshida, S., Manabe, K., Shinozaki, K., and Matsui,M. (2003) Identification of Arabidopsis genes regulated byhigh light-stress using cDNA microarray. Photochem Photobiol77:226–233.
Kiss, J.Z. and Edelmann, R.E. (1999) Spaceflight experimentswith Arabidopsis starch-deficient mutants support a statolith-based model for graviperception. Adv Space Res 24:755–762.
Kiss, J.Z., Kumar, P., Millar, K.D.L., Edelmann, R.E., and Correll,M.J. (2009) Operations of a spaceflight experiment to investi-gate plant tropisms. Adv Space Res 44:879–886.
Kittang, A.I., van Loon, J.J., Vorst, O., Hall, R.D., Fossum, K.,and Iversen, T.H. (2004) Ground based studies of gene ex-pression in Arabidopsis exposed to gravity stresses. J GravitPhysiol 11:P223–P224.
Klymchuk, D.O., Brown, C.S., Chapman, D.K., Vorobyova, T.V.,and Martyn, G.M. (2001) Cytochemical localization of calcium insoybean root cap cells in microgravity. Adv Space Res 27:967–972.
Klymchuk, D.O., Kordyum, E.L., Vorobyova, T.V., Chapman,D.K., and Brown, C.S. (2003) Changes in vacuolation in theroot apex cells of soybean seedlings in microgravity. Adv SpaceRes 31:2283–2288.
Kordyum, V.A., Man’ko, V.G., Popova, A.F., Mashinsky, A.L.,Shcherbak, O.H., and Nguen, H.T. (1983) Changes in symbi-otic and associative interrelations in a higher plant-bacterialsystem during space flight. Adv Space Res 3:265–268.
Kreps, J.A., Wu, Y., Chang, H.S., Zhu, T., Wang, X., and Harper,J.F. (2002) Transcriptome changes for Arabidopsis in responseto salt, osmotic, and cold stress. Plant Physiol 130:2129–2141.
Krikorian, A.D., Dutcher, F.R., Quinn, C.E., and Steward, F.C.(1981) Growth and development of cultured carrot cells andembryos under spaceflight conditions. Adv Space Res 1:117–127.
Krikorian, A.D., Levine, H.G., Kann, R.P., and O’Connor S.A.(1992) Effects of spaceflight on growth and cell division inhigher plants. Adv Space Biol Med 2:181–209.
Kuang, A., Musgrave, M.E., and Matthews, S.W. (1996) Mod-ification of reproductive development in Arabidopsis thalianaunder spaceflight conditions. Planta 198:588–594.
Kuang, A., Xiao, Y., McClure, G., and Musgrave, M.E. (2000)Influence of microgravity on ultrastructure and storage re-serves in seeds of Brassica rapa L. Ann Bot 85:851–859.
Leandro, L.J., Szewczyk, N.J., Benguria, A., Herranz, R., Lavan,D., Medina, F.J., Gasset, G., Loon, J.V., Conley, C.A., andMarco, R. (2007) Comparative analysis of Drosophila melano-gaster and Caenorhabditis elegans gene expression experimentsin the European Soyuz flights to the International Space Sta-tion. Adv Space Res 40:506–512.
Lebsack, T.W., Fa, V., Woods, C.C., Gruener, R., Manziello,A.M., Pecaut, M.J., Gridley, D.S., Stodieck, L.S., Ferguson,V.L., and Deluca, D. (2010) Microarray analysis of spaceflownmurine thymus tissue reveals changes in gene expressionregulating stress and glucocorticoid receptors. J Cell Biochem110:372–381.
Legue, V., Blancaflor, E., Wymer, C., Perbal, G., Fantin, D., andGilroy, S. (1997) Cytoplasmic free Ca2 + in Arabidopsis rootschanges in response to touch but not gravity. Plant Physiol114:789–800.
Levine, H.G. and Krikorian, A.D. (1992) Shoot growth in asep-tically cultivated daylily and haplopappus plantlets after a 5-day spaceflight. Physiol Plant 86:349–359.
Levine, H.G. and Krikorian, A.D. (1996) Enhanced root pro-duction in Haplopappus gracilis grown under spaceflight con-ditions. J Gravit Physiol 3:17–27.
Levine, L.H., Levine, H.G., Stryjewski, E.C., Prima, V., and Pias-tuch, W.C. (2001) Effect of spaceflight on isoflavonoid accumu-lation in etiolated soybean seedlings. J Gravit Physiol 8:21–27.
Levinskikh, M.A., Sychev, V.N., Derendyaeva, T.A., Signalova,O.B., Salisbury, F.B., Campbell, W.F., Bingham, G.E., Bu-benheim, D.L., and Jahns, G. (2000) Analysis of the spaceflighteffects on growth and development of Super Dwarf wheatgrown on the Space Station Mir. J Plant Physiol 156:522–529.
Liao, J., Liu, G., Monje, O., Stutte, G.W., and Porterfield, D.M.(2004) Induction of hypoxic root metabolism results fromphysical limitations in O2 bioavailability in microgravity. AdvSpace Res 34:1579–1584.
Lim, C.J., Yang, K.A., Hong, J.K., Choi, J.S., Yun, D.J., Hong, J.C.,Chung, W.S., Lee, S.Y., Cho, M.J., and Lim, C.O. (2006) Geneexpression profiles during heat acclimation in Arabidopsisthaliana suspension-culture cells. J Plant Res 119:373–383.
Liu, F., Vantoai, T., Moy, L.P., Bock, G., Linford, L.D., andQuackenbush, J. (2005) Global transcription profiling revealscomprehensive insights into hypoxic response in Arabidopsis.Plant Physiol 137:1115–1129.
Lomax, T.L. (1997) Molecular genetic analysis of plant gravi-tropism. Gravit Space Biol Bull 10:75–82.
Marcu, O., Lera, M.P., Sanchez, M.E., Levic, E., Higgins, L.A.,Shmygelska, A., Fahlen, T.F., Nichol, H., and Bhattacharya, S.(2011) Innate immune responses of Drosophila melanogaster arealtered by spaceflight. PLoS ONE 6:e15361.
Martzivanou, M. and Hampp, R. (2003) Hyper-gravity effects onthe Arabidopsis transcriptome. Physiol Plant 118:221–231.
McClung, C.R., Hsu, M., Painter, J.E., Gagne, J.M., Karlsberg,S.D., and Salome, P.A. (2000) Integrated temporal regulationof the photorespiratory pathway. Circadian regulation of twoArabidopsis genes encoding serine hydroxymethyltransferase.Plant Physiol 123:381–392.
Merkys, A. and Darginaviciene, J. (1997) Plant gravitropic re-sponse. Adv Space Biol Med 6:213–230.
Merkys, A.J., Laurinavicius, R.S., Kenstaviciene, P.F., and Neci-tailo, G.S. (1989) Formation and growth of callus tissue ofArabidopsis under changed gravity. Adv Space Res 9:37–40.
ARABIDOPSIS SPACEFLIGHT TRANSCRIPTOMES 55
Musgrave, M.E., Kuang, A., and Porterfield, D.M. (1997) Plantreproduction in spaceflight environments. Gravit Space BiolBull 10:83–90.
NASA.gov. (2011) Biological Research in Canisters (BRIC). InInternational Space Station Research and Technology Fact Sheet,NASA. Available online at http://www.nasa.gov/mission_pages/station/research/experiments/BRIC.html.
Nedukha, O., Leach, J., Kordyum, E., Ryba-White, M., Hilaire,E., Guikema, J., and Piastuch, W. (1999) Root meristem ul-trastructure of soybean seedlings infected with a pathogenicfungus in microgravity. J Gravit Physiol 6:P125–P126.
Nedukha, O.M., Kordyum, E.L., Brown, C., and Chapman, D.(2001) The interaction of microgravity and ethylene on theultrastructure cell and Ca2 + localization in soybean hook hy-pocotyl. J Gravit Physiol 8:P49–P50.
Nurnberger, T., Brunner, F., Kemmerling, B., and Piater, L.(2004) Innate immunity in plants and animals: striking simi-larities and obvious differences. Immunol Rev 198:249–266.
Ou, X., Long, L., Zhang ,Y., Xue, Y., Liu, J., Lin, X., and Liu, B.(2009) Spaceflight induces both transient and heritable alter-ations in DNA methylation and gene expression in rice (Oryzasativa L.). Mutat Res 662:44–53.
Papaseit, C., Pochon, N., and Tabony, J. (2000) Microtubule self-organization is gravity-dependent. Proc Natl Acad Sci USA97:8364–8368.
Paul, A.-L., Daugherty, C.J., Bihn, E.A., Chapman, D.K., Nor-wood, K.L., and Ferl, R.J. (2001) Transgene expression pat-terns indicate that spaceflight affects stress signal perceptionand transduction in arabidopsis. Plant Physiol 126:613–621.
Paul, A.-L., Popp, M.P., Gurley, W.B., Guy, C., Norwood, K.L.,and Ferl, R.J. (2005) Arabidopsis gene expression patterns arealtered during spaceflight. Adv Space Res 36:1175–1181.
Paul, A.-L., Manak, M.S., Mayfield, J.D., Reyes, M.F., Gurley, W.B.,and Ferl, R.J. (2011) Parabolic flight induces changes in gene ex-pression patterns in Arabidopsis thaliana. Astrobiology 11:743–758.
Perrin, R.M., Young, L.S., Murthy, U.M.N., Harrison, B.R.,Wang, Y., Will, J.L., and Masson, P.H. (2005) Gravity signaltransduction in primary roots. Ann Bot 96:737–743.
Porterfield, D.M., Matthews, S.W., Daugherty, C.J., and Mus-grave, M.E. (1997) Spaceflight exposure effects on transcrip-tion, activity, and localization of alcohol dehydrogenase in theroots of Arabidopsis thaliana. Plant Physiol 113:685–693.
Rossel, J.B., Wilson, I.W., and Pogson, B.J. (2002) Global changesin gene expression in response to high light in Arabidopsis.Plant Physiol 130:1109–1120.
Roux, S.J., Chatterjee, A., Hillier, S., and Cannon, T. (2003) Earlydevelopment of fern gametophytes in microgravity. Adv SpaceRes 31:215–220.
Salmi, M.L. and Roux, S.J. (2008) Gene expression changes in-duced by space flight in single-cells of the fern Ceratopterisrichardii. Planta 229:151–159.
Sato, F., Takeda, S., Matsushima, H., and Yamada, Y. (1999) Cellgrowth and organ differentiation in cultured tobacco cellsunder spaceflight condition. Biol Sci Space 13:18–24.
Saunders, J.F. (1968) Biochemical dimensions of space biology.Space Life Sci 1:10–22.
Seki, M., Narusaka, M., Ishida, J., Nanjo, T., Fujita, M., Oono, Y.,Kamiya, A., Nakajima, M., Enju, A., Sakurai, T., Satou, M.,Akiyama, K., Taji, T., Yamaguchi-Shinozaki, K., Carninci, P.,Kawai, J., Hayashizaki, Y., and Shinozaki, K. (2002) Mon-itoring the expression profiles of 7000 Arabidopsis genes un-der drought, cold and high-salinity stresses using a full-lengthcDNA microarray. Plant J 31:279–292.
Solheim, B.G., Johnsson, A., and Iversen, T.H. (2009) Ultradianrhythms in Arabidopsis thaliana leaves in microgravity. NewPhytol 183:1043–1052.
Stutte, G.W., Monje, O., Hatfield, R.D., Paul, A.L., Ferl, R.J., andSimone, C.G. (2006) Microgravity effects on leaf morphology,cell structure, carbon metabolism and mRNA expression ofdwarf wheat. Planta 224:1038–1049.
Swindell, W.R., Huebner, M., and Weber, A.P. (2007) Tran-scriptional profiling of Arabidopsis heat shock proteins andtranscription factors reveals extensive overlap between heatand non-heat stress response pathways. BMC Genomics 8,doi:10.1186/1471-2164-8-125.
Tripathy, B.C., Brown, C.S., Levine, H.G., and Krikorian, A.D.(1996) Growth and photosynthetic responses of wheat plantsgrown in space. Plant Physiol 110:801–806.
Tsukita, S. and Yonemura, S. (1997) ERM proteins: head-to-tailregulation of actin-plasma membrane interaction. Trends Bio-chem Sci 22:53–58.
Visscher, A.M., Paul, A.L., Kirst, M., Alling, A.K., Silverstone, S.,Nechitailo, G., Nelson, M., Dempster, W.F., Van Thillo, M.,Allen, J.P., and Ferl, R.J. (2009) Effects of a spaceflight envi-ronment on heritable changes in wheat gene expression.Astrobiology 9:359–367.
Yoder, T.L., Zheng, H.Q., Todd, P., and Staehelin, L.A. (2001)Amyloplast sedimentation dynamics in maize columella cellssupport a new model for the gravity-sensing apparatus ofroots. Plant Physiol 125:1045–1060.
Address correspondence to:Robert J. Ferl
Interdisciplinary Center for Biotechnology ResearchHorticultural Sciences and Plant Molecular and Cellular Biology
University of FloridaGainesville, FL 32611-0580
E-mail: [email protected]
Submitted 20 June 2011Accepted 8 October 2011
56 PAUL ET AL.