Embed Size (px)
Citation preview
Spatial Modelling of Floodplain Inundation Combining Satellite Imagery and Elevation Models
Penton, D.J.1 and Overton, I.C.2
1 CSIRO Land and Water, Black Mountain, ACT, Australia 2 CSIRO Land and Water, Urrbrae, SA, Australia
Email: [email protected]
Keywords: Spatial science, floodplains, wetlands, environmental flows, river management, River Murray
EXTENDED ABSTRACT
The environmental benefits of water flowing into wetlands and over floodplains depend on the extent, depth, duration and frequency of the inundation. Along the River Murray in South-Eastern Australia, the health of forests and the breeding patterns of birds depend directly on the patterns of wetting caused by flooding events. This wetting is a major contributor to the recharge of ground waters. Therefore, river managers need to predict the dynamics of wetting when they plan environmental flows so they can optimise the environmental benefits to the riparian ecosystem. This paper describes the development of a River Murray floodplain inundation model for river managers to predict the impacts of flow regimes.
This paper contributes a method for modelling the extent and depth of flooding in a complex river system. First, we investigate how existing methods for modelling flood inundations apply to the River Murray. Noting the significant drawbacks of existing models, we describe a new technique for predicting the daily depth of water on floodplains from high resolution digital elevation data and satellite imagery. Finally, we describe the incorporation of this data into floodplain modelling software, namely the River Murray Floodplain Inundation Model (RiM-FIM).
There are many existing methods for modelling the flow of water in floodplains. Hydrologists are familiar with equations governing river flow and with software products such as one dimensional (MIKE11 and HEC-RAS) and two dimensional (MIKE21) hydrodynamic models. However, with very complex river systems such as the River Murray, parameterising these models is expensive. Hydrodynamic models require river cross-sections, accurate high resolution digital elevation models (DEMs) and extensive calibration.
Existing hydrodynamic approaches for river modelling are expensive to apply to the River Murray. Therefore, we have developed a technique for predicting the depth of water on floodplains from high-resolution digital elevation data and satellite imagery. The technique involves combining flood masks from Landsat imagery with a very high resolution DEM. The result is a set of very high resolution flood maps for river flows observed at gauging stations. The flood maps in Figure 1 show improvements adding elevation data provides to satellite imagery.
RiM-FIM incorporates this data with historical gauging station flows to produce a temporal model of floodplain inundation. The model enables users to visualise and analyse the inundation of floodplains along the River Murray.
Figure 1. Part (a) is a flood extent map produced using satellite imagery and part (b) is a flood extent map produced with combined satellite and DEM data.
1464
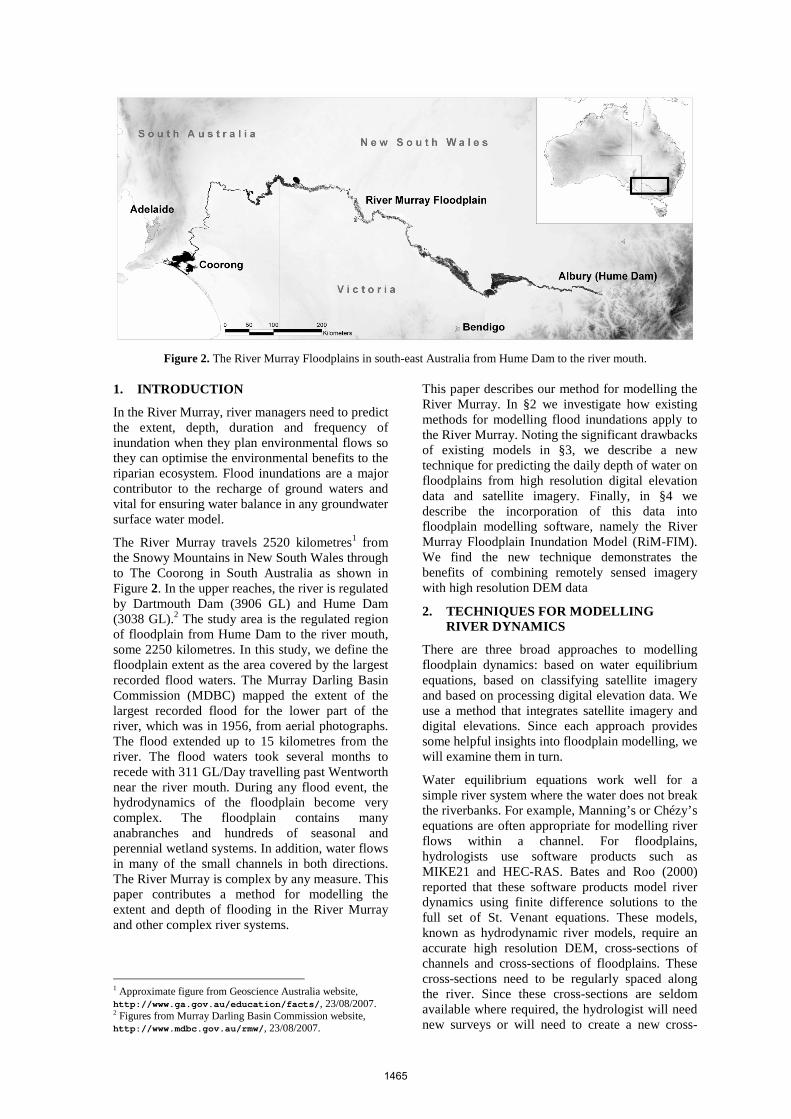
Figure 2. The River Murray Floodplains in south-east Australia from Hume Dam to the river mouth.
1. INTRODUCTION
In the River Murray, river managers need to predict the extent, depth, duration and frequency of inundation when they plan environmental flows so they can optimise the environmental benefits to the riparian ecosystem. Flood inundations are a major contributor to the recharge of ground waters and vital for ensuring water balance in any groundwater surface water model.
The River Murray travels 2520 kilometres1 from the Snowy Mountains in New South Wales through to The Coorong in South Australia as shown in Figure 2. In the upper reaches, the river is regulated by Dartmouth Dam (3906 GL) and Hume Dam (3038 GL).2 The study area is the regulated region of floodplain from Hume Dam to the river mouth, some 2250 kilometres. In this study, we define the floodplain extent as the area covered by the largest recorded flood waters. The Murray Darling Basin Commission (MDBC) mapped the extent of the largest recorded flood for the lower part of the river, which was in 1956, from aerial photographs. The flood extended up to 15 kilometres from the river. The flood waters took several months to recede with 311 GL/Day travelling past Wentworth near the river mouth. During any flood event, the hydrodynamics of the floodplain become very complex. The floodplain contains many anabranches and hundreds of seasonal and perennial wetland systems. In addition, water flows in many of the small channels in both directions. The River Murray is complex by any measure. This paper contributes a method for modelling the extent and depth of flooding in the River Murray and other complex river systems.
1 Approximate figure from Geoscience Australia website, http://www.ga.gov.au/education/facts/, 23/08/2007. 2 Figures from Murray Darling Basin Commission website, http://www.mdbc.gov.au/rmw/, 23/08/2007.
This paper describes our method for modelling the River Murray. In §2 we investigate how existing methods for modelling flood inundations apply to the River Murray. Noting the significant drawbacks of existing models in §3, we describe a new technique for predicting the daily depth of water on floodplains from high resolution digital elevation data and satellite imagery. Finally, in §4 we describe the incorporation of this data into floodplain modelling software, namely the River Murray Floodplain Inundation Model (RiM-FIM). We find the new technique demonstrates the benefits of combining remotely sensed imagery with high resolution DEM data
2. TECHNIQUES FOR MODELLING RIVER DYNAMICS
There are three broad approaches to modelling floodplain dynamics: based on water equilibrium equations, based on classifying satellite imagery and based on processing digital elevation data. We use a method that integrates satellite imagery and digital elevations. Since each approach provides some helpful insights into floodplain modelling, we will examine them in turn.
Water equilibrium equations work well for a simple river system where the water does not break the riverbanks. For example, Manning’s or Chézy’s equations are often appropriate for modelling river flows within a channel. For floodplains, hydrologists use software products such as MIKE21 and HEC-RAS. Bates and Roo (2000) reported that these software products model river dynamics using finite difference solutions to the full set of St. Venant equations. These models, known as hydrodynamic river models, require an accurate high resolution DEM, cross-sections of channels and cross-sections of floodplains. These cross-sections need to be regularly spaced along the river. Since these cross-sections are seldom available where required, the hydrologist will need new surveys or will need to create a new cross-
1465
section by interpolating between available cross-sections. Once the hydrologist has specified the parameters for the hydrodynamic model, the hydrologist must calibrate the model using observed flows and extents. Calibrating the model in itself is a very difficult exercise. One purpose for creating these hydrodynamic models is to determine the impact of modifying control structures such as levee banks (for example, Water Technology 2005). When linked to river gauge information, hydrodynamic models provide the information that river managers need; the model provides the extent, duration, depth and frequency of wetting. Most hydrodynamic models model river reaches of less than 200 kilometres in length. The computational cost and the financial cost make hydrodynamic models of longer rivers, such as the River Murray, difficult or impracticable. In addition, a one-dimensional model linked to a horizontal grid may not be sufficient to capture the hydraulics of the floodplain (Stewart et al. 1999; Bates and Roo 2000). Fortunately, satellite imagery and digital elevation data can provide the information river managers need without solving water equilibrium equations.
The second approach to modelling floodplain dynamics involves classifying satellite imagery. Satellite imagery for identifying flooded areas generally involves Multi-Spectral (e.g. Landsat or SPOT) or Synthetic Aperture Radar (SAR) imagery. The first step is to classify the image as inundated or non-inundated. In the case of Multi-Spectral imagery a density slice of a mid-infrared (MIR) band, separates inundated from non-inundated areas (Bennet 1987; Johnston and Barson 1993; Frazier and Page 2000; and Overton 2005). However, successful results depend on cloudless conditions and open canopy cover (Wang et al. 2002). Cloud conditions do not affect SAR imagery, which can also discriminate between inundated and non-inundated areas (Townsend and Walsh 1998; Sanyal and Lu 2004; and Martinez and Toan 2007). However, Smith (1997) warns that SAR imagery is less straightforward to interpret than Multi-Spectral imagery and that SAR imagery gives confusing results if there are wind-induced waves on the water or emergent vegetation (see also Sanyal and Lu 2004). Depending on the conditions, either Multi-Spectral or SAR imagery can describe the inundation extent of a flood. However, river managers also need to predict the depth of floods, which is not possible with satellite imagery alone. Depth information requires integrating flood extents with elevation data.
The third approach involves processing elevation data. The availability and quality of elevation data varies between study sites. An increasing number of river systems have accurate high resolution DEMs. Most rivers also contain gauging stations that record the water level (flood stage). Townsend
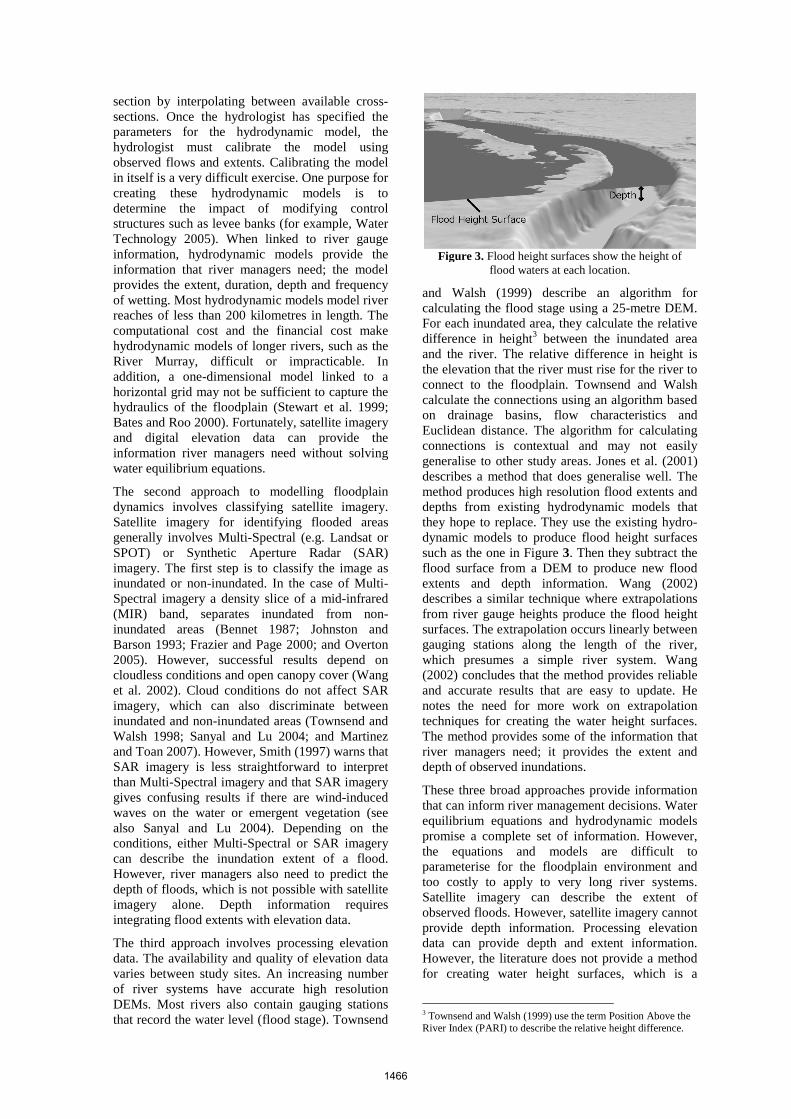
and Walsh (1999) describe an algorithm for calculating the flood stage using a 25-metre DEM. For each inundated area, they calculate the relative difference in height3 between the inundated area and the river. The relative difference in height is the elevation that the river must rise for the river to connect to the floodplain. Townsend and Walsh calculate the connections using an algorithm based on drainage basins, flow characteristics and Euclidean distance. The algorithm for calculating connections is contextual and may not easily generalise to other study areas. Jones et al. (2001) describes a method that does generalise well. The method produces high resolution flood extents and depths from existing hydrodynamic models that they hope to replace. They use the existing hydro-dynamic models to produce flood height surfaces such as the one in Figure 3. Then they subtract the flood surface from a DEM to produce new flood extents and depth information. Wang (2002) describes a similar technique where extrapolations from river gauge heights produce the flood height surfaces. The extrapolation occurs linearly between gauging stations along the length of the river, which presumes a simple river system. Wang (2002) concludes that the method provides reliable and accurate results that are easy to update. He notes the need for more work on extrapolation techniques for creating the water height surfaces. The method provides some of the information that river managers need; it provides the extent and depth of observed inundations.
These three broad approaches provide information that can inform river management decisions. Water equilibrium equations and hydrodynamic models promise a complete set of information. However, the equations and models are difficult to parameterise for the floodplain environment and too costly to apply to very long river systems. Satellite imagery can describe the extent of observed floods. However, satellite imagery cannot provide depth information. Processing elevation data can provide depth and extent information. However, the literature does not provide a method for creating water height surfaces, which is a
3 Townsend and Walsh (1999) use the term Position Above the River Index (PARI) to describe the relative height difference.
Figure 3. Flood height surfaces show the height of flood waters at each location.
1466
necessary part of creating depths from elevation data. The next section proposes a method for addressing some of these problems and providing the full suite of data that river managers need.
3. MAPPING FLOOD INUNDATIONS
River managers need to predict the extent, depth, duration and frequency of wetting. Existing hydrodynamic approaches for river modelling are expensive to apply to the River Murray. In this section, we describe a technique for predicting the depth of water on floodplains by combining Landsat imagery with a very high resolution (one metre resolution) DEM captured using Light Detection and Ranging (LIDAR). First, we discuss the ability of Landsat imagery to provide flood extent information and the data we have used. Then we describe the principles that relate flood extent to the height of flood waters. Finally, we explain a technique for deriving water heights for unseen floods. The resulting flood extents and depths have a five metre resolution.
Month Mean Flow (GL/day)
Mean Cloud Free Days (days)
August 20.1 12 September 25.2 16 October 26.3 20 November 21.5 23
Table 1. The River Murray mean cloud-free days is the mean solar days for the Murray floodplain from the
BIOCLIM product (Jeffrey et al. 2001).
Classifying the inundated and non-inundated areas of the floodplain from Landsat imagery works well for the River Murray. The River Murray floods in a gradual way with days or months warning of a flood in the lower reaches. Floods last for months rather than hours or days. The problems outlined earlier, cloud-cover and canopy-cover, have a less pronounced affect on the River Murray. As Table 1 shows, during the main flood months a high percentage of days are cloud free. A combination of snowmelt and distant rains drive the floodwaters instead of local rainfall. The other classification problem, canopy-cover, presents only a small problem for the River Murray. Forests along the River Murray floodplain contain in the over storey River Red Gum (Eucalyptus camaldulensis), Black Box (Euc-alyptus largiflorens) and Grey Box (Eucalyptus microcarpa). These forest species and the Eucalyptus species more generally, have a sparse leaf cover. Additionally, the forest canopy along the River Murray is quite open and there is little actual dense forest (>70% Projected Foliage Cover) (Byrne et al. 2007). Since the nature of flooding is gradual, satellite images are available without cloud-cover for most floods and canopy-cover does not have a big impact. Classified Landsat images provide an accurate representation of the River Murray floodplain.
The classified Landsat images that we use are those of Overton (2005). Overton splits the river into 22 zones because each zone has major differences in hydrology due to tributaries, off-takes and weirs. For each zone, there are flood masks (flood extents) for a range of different sized floods. For example, the zone that covers Barmah State Forest contains flood masks for four floods: 16 GL/Day, 33 GL/Day, 62 GL/Day and 113 GL/Day, as measured upstream at Tocumwal gauging station. The flood masks provide information about observed flood extent only.
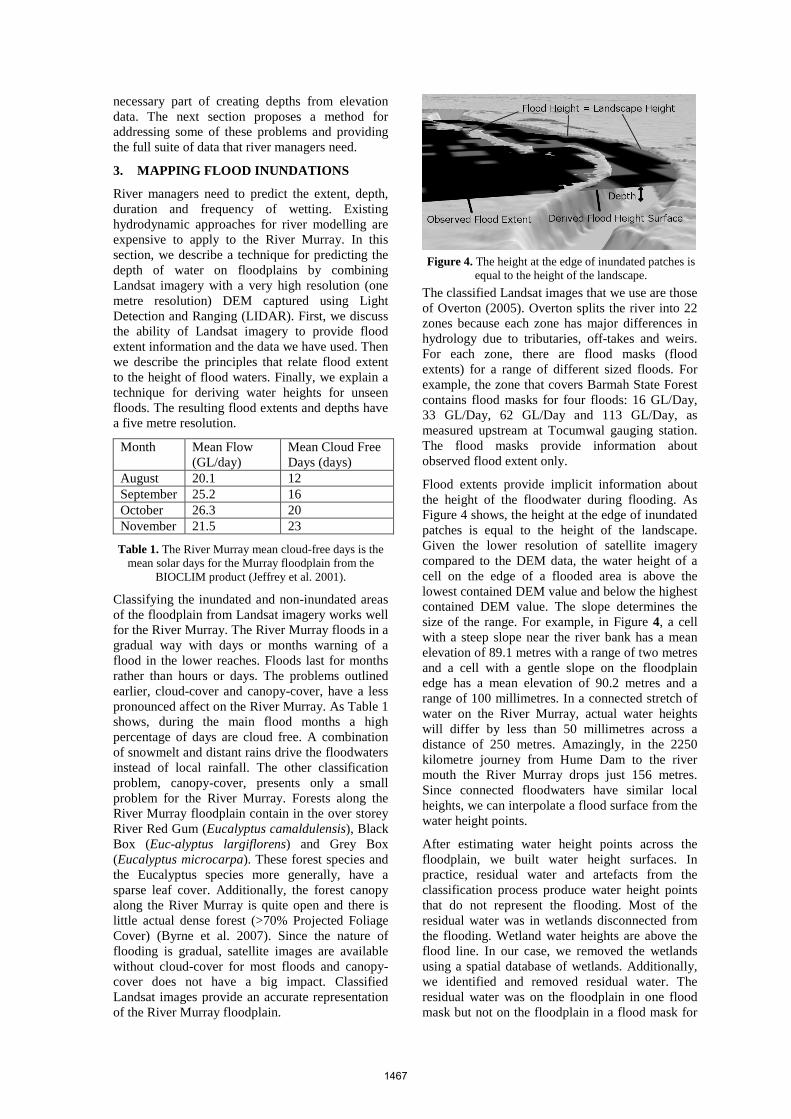
Flood extents provide implicit information about the height of the floodwater during flooding. As Figure 4 shows, the height at the edge of inundated patches is equal to the height of the landscape. Given the lower resolution of satellite imagery compared to the DEM data, the water height of a cell on the edge of a flooded area is above the lowest contained DEM value and below the highest contained DEM value. The slope determines the size of the range. For example, in Figure 4, a cell with a steep slope near the river bank has a mean elevation of 89.1 metres with a range of two metres and a cell with a gentle slope on the floodplain edge has a mean elevation of 90.2 metres and a range of 100 millimetres. In a connected stretch of water on the River Murray, actual water heights will differ by less than 50 millimetres across a distance of 250 metres. Amazingly, in the 2250 kilometre journey from Hume Dam to the river mouth the River Murray drops just 156 metres. Since connected floodwaters have similar local heights, we can interpolate a flood surface from the water height points.
After estimating water height points across the floodplain, we built water height surfaces. In practice, residual water and artefacts from the classification process produce water height points that do not represent the flooding. Most of the residual water was in wetlands disconnected from the flooding. Wetland water heights are above the flood line. In our case, we removed the wetlands using a spatial database of wetlands. Additionally, we identified and removed residual water. The residual water was on the floodplain in one flood mask but not on the floodplain in a flood mask for
Figure 4. The height at the edge of inundated patches is equal to the height of the landscape.
1467
a larger flood. Other small artefacts in the flood masks were from trees, which produced small islands with predicted water heights below the real water line. We removed these based on their area using simple GIS routines. Finally, we removed water heights with steep slopes such as river banks, levees and roads. We used kriging to interpolate a water surface for each flood mask from the final set of water points. Creating water height surfaces for observed flows provides a river manager with river water depth for those flows; however, remotely sensing cannot observe every flow scenario that a river manager might need.
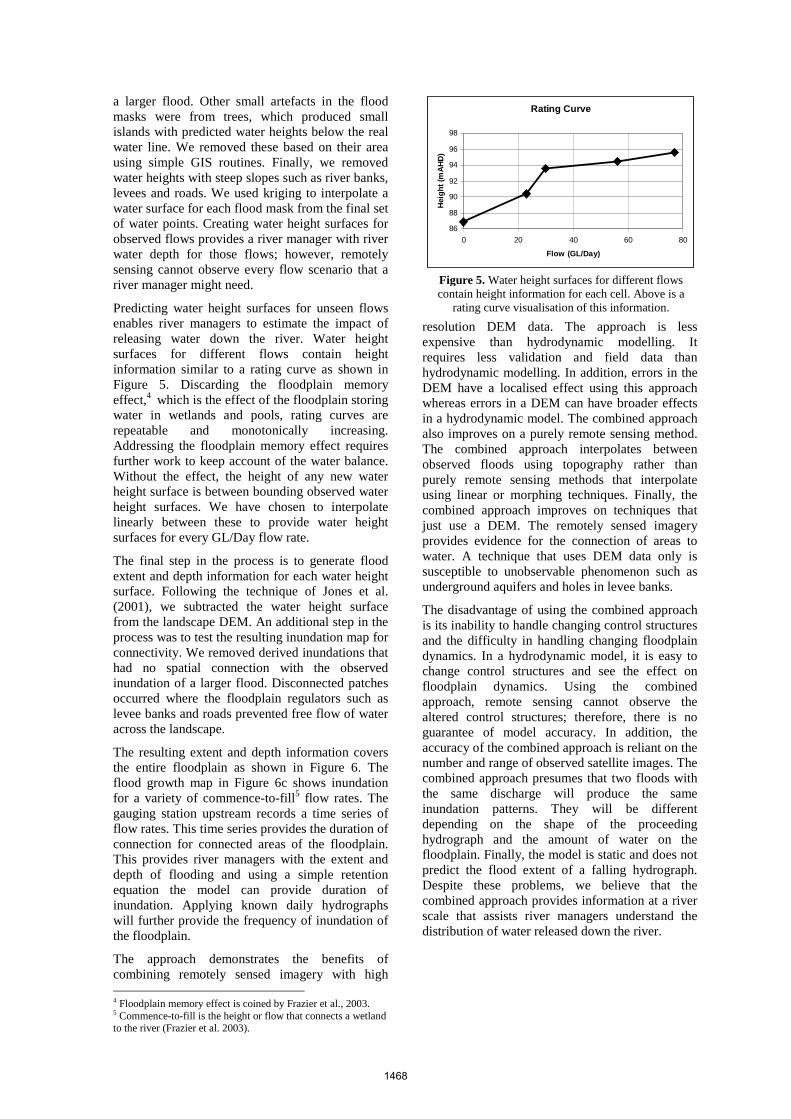
Predicting water height surfaces for unseen flows enables river managers to estimate the impact of releasing water down the river. Water height surfaces for different flows contain height information similar to a rating curve as shown in Figure 5. Discarding the floodplain memory effect,4 which is the effect of the floodplain storing water in wetlands and pools, rating curves are repeatable and monotonically increasing. Addressing the floodplain memory effect requires further work to keep account of the water balance. Without the effect, the height of any new water height surface is between bounding observed water height surfaces. We have chosen to interpolate linearly between these to provide water height surfaces for every GL/Day flow rate.
The final step in the process is to generate flood extent and depth information for each water height surface. Following the technique of Jones et al. (2001), we subtracted the water height surface from the landscape DEM. An additional step in the process was to test the resulting inundation map for connectivity. We removed derived inundations that had no spatial connection with the observed inundation of a larger flood. Disconnected patches occurred where the floodplain regulators such as levee banks and roads prevented free flow of water across the landscape.
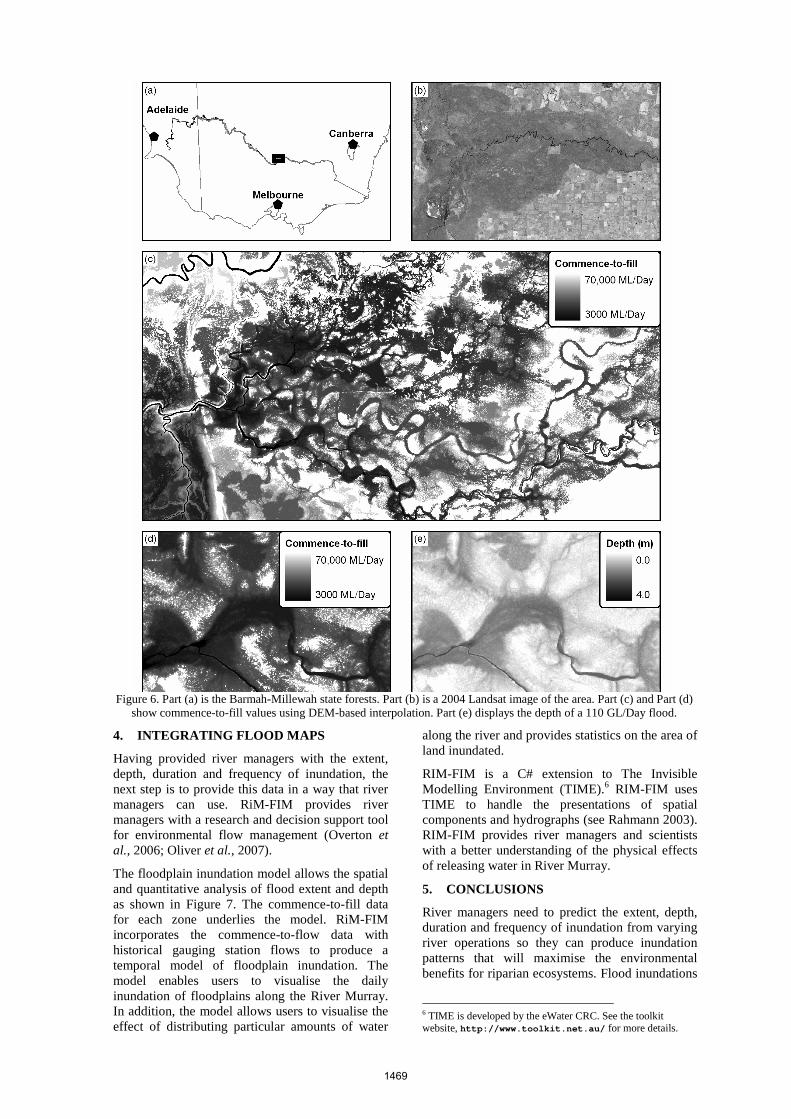
The resulting extent and depth information covers the entire floodplain as shown in Figure 6. The flood growth map in Figure 6c shows inundation for a variety of commence-to-fill5 flow rates. The gauging station upstream records a time series of flow rates. This time series provides the duration of connection for connected areas of the floodplain. This provides river managers with the extent and depth of flooding and using a simple retention equation the model can provide duration of inundation. Applying known daily hydrographs will further provide the frequency of inundation of the floodplain.
The approach demonstrates the benefits of combining remotely sensed imagery with high 4 Floodplain memory effect is coined by Frazier et al., 2003. 5 Commence-to-fill is the height or flow that connects a wetland to the river (Frazier et al. 2003).
resolution DEM data. The approach is less expensive than hydrodynamic modelling. It requires less validation and field data than hydrodynamic modelling. In addition, errors in the DEM have a localised effect using this approach whereas errors in a DEM can have broader effects in a hydrodynamic model. The combined approach also improves on a purely remote sensing method. The combined approach interpolates between observed floods using topography rather than purely remote sensing methods that interpolate using linear or morphing techniques. Finally, the combined approach improves on techniques that just use a DEM. The remotely sensed imagery provides evidence for the connection of areas to water. A technique that uses DEM data only is susceptible to unobservable phenomenon such as underground aquifers and holes in levee banks.
The disadvantage of using the combined approach is its inability to handle changing control structures and the difficulty in handling changing floodplain dynamics. In a hydrodynamic model, it is easy to change control structures and see the effect on floodplain dynamics. Using the combined approach, remote sensing cannot observe the altered control structures; therefore, there is no guarantee of model accuracy. In addition, the accuracy of the combined approach is reliant on the number and range of observed satellite images. The combined approach presumes that two floods with the same discharge will produce the same inundation patterns. They will be different depending on the shape of the proceeding hydrograph and the amount of water on the floodplain. Finally, the model is static and does not predict the flood extent of a falling hydrograph. Despite these problems, we believe that the combined approach provides information at a river scale that assists river managers understand the distribution of water released down the river.
Rating Curve
86
88
90
92
94
96
98
0 20 40 60 80
Flow (GL/Day)
Hei
gh
t (m
AH
D)
Figure 5. Water height surfaces for different flows contain height information for each cell. Above is a
rating curve visualisation of this information.
1468
4. INTEGRATING FLOOD MAPS
Having provided river managers with the extent, depth, duration and frequency of inundation, the next step is to provide this data in a way that river managers can use. RiM-FIM provides river managers with a research and decision support tool for environmental flow management (Overton et al., 2006; Oliver et al., 2007).
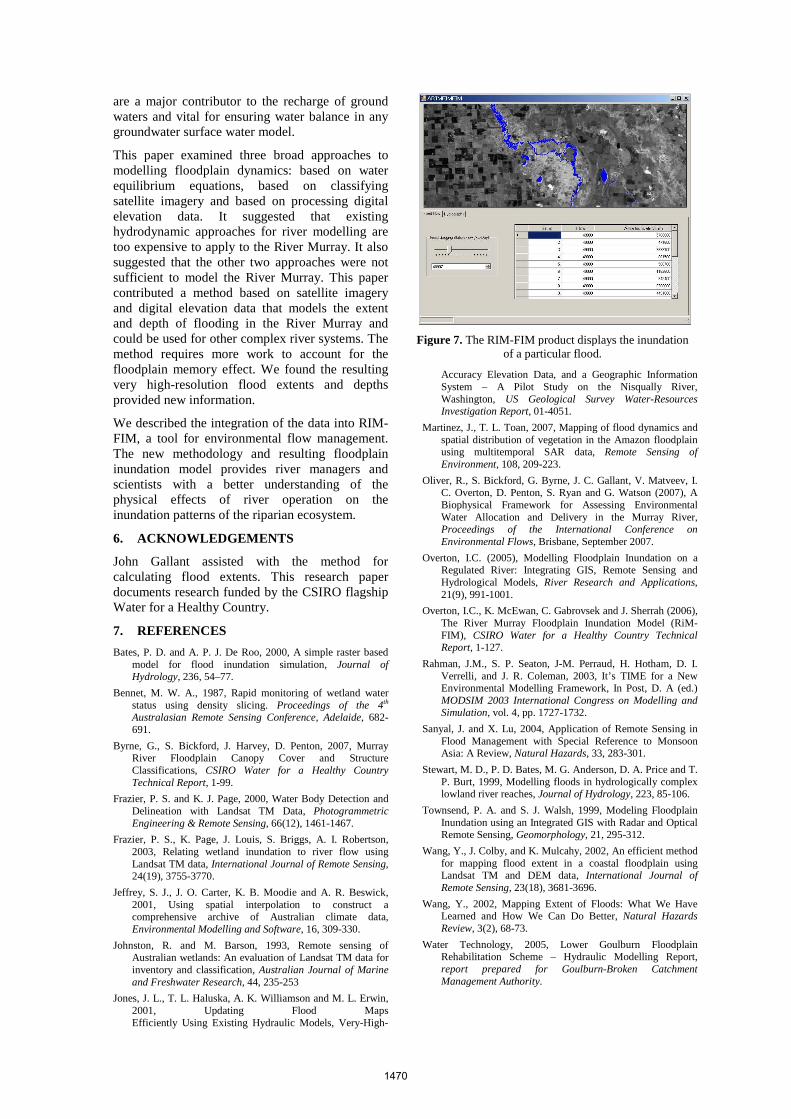
The floodplain inundation model allows the spatial and quantitative analysis of flood extent and depth as shown in Figure 7. The commence-to-fill data for each zone underlies the model. RiM-FIM incorporates the commence-to-flow data with historical gauging station flows to produce a temporal model of floodplain inundation. The model enables users to visualise the daily inundation of floodplains along the River Murray. In addition, the model allows users to visualise the effect of distributing particular amounts of water
along the river and provides statistics on the area of land inundated.
RIM-FIM is a C# extension to The Invisible Modelling Environment (TIME).6 RIM-FIM uses TIME to handle the presentations of spatial components and hydrographs (see Rahmann 2003). RIM-FIM provides river managers and scientists with a better understanding of the physical effects of releasing water in River Murray.
5. CONCLUSIONS
River managers need to predict the extent, depth, duration and frequency of inundation from varying river operations so they can produce inundation patterns that will maximise the environmental benefits for riparian ecosystems. Flood inundations
6 TIME is developed by the eWater CRC. See the toolkit website, http://www.toolkit.net.au/ for more details.
Figure 6. Part (a) is the Barmah-Millewah state forests. Part (b) is a 2004 Landsat image of the area. Part (c) and Part (d) show commence-to-fill values using DEM-based interpolation. Part (e) displays the depth of a 110 GL/Day flood.
1469
are a major contributor to the recharge of ground waters and vital for ensuring water balance in any groundwater surface water model.
This paper examined three broad approaches to modelling floodplain dynamics: based on water equilibrium equations, based on classifying satellite imagery and based on processing digital elevation data. It suggested that existing hydrodynamic approaches for river modelling are too expensive to apply to the River Murray. It also suggested that the other two approaches were not sufficient to model the River Murray. This paper contributed a method based on satellite imagery and digital elevation data that models the extent and depth of flooding in the River Murray and could be used for other complex river systems. The method requires more work to account for the floodplain memory effect. We found the resulting very high-resolution flood extents and depths provided new information.
We described the integration of the data into RIM-FIM, a tool for environmental flow management. The new methodology and resulting floodplain inundation model provides river managers and scientists with a better understanding of the physical effects of river operation on the inundation patterns of the riparian ecosystem.
6. ACKNOWLEDGEMENTS
John Gallant assisted with the method for calculating flood extents. This research paper documents research funded by the CSIRO flagship Water for a Healthy Country.
7. REFERENCES
Bates, P. D. and A. P. J. De Roo, 2000, A simple raster based model for flood inundation simulation, Journal of Hydrology, 236, 54–77.
Bennet, M. W. A., 1987, Rapid monitoring of wetland water status using density slicing. Proceedings of the 4th Australasian Remote Sensing Conference, Adelaide, 682-691.
Byrne, G., S. Bickford, J. Harvey, D. Penton, 2007, Murray River Floodplain Canopy Cover and Structure Classifications, CSIRO Water for a Healthy Country Technical Report, 1-99.
Frazier, P. S. and K. J. Page, 2000, Water Body Detection and Delineation with Landsat TM Data, Photogrammetric Engineering & Remote Sensing, 66(12), 1461-1467.
Frazier, P. S., K. Page, J. Louis, S. Briggs, A. I. Robertson, 2003, Relating wetland inundation to river flow using Landsat TM data, International Journal of Remote Sensing, 24(19), 3755-3770.
Jeffrey, S. J., J. O. Carter, K. B. Moodie and A. R. Beswick, 2001, Using spatial interpolation to construct a comprehensive archive of Australian climate data, Environmental Modelling and Software, 16, 309-330.
Johnston, R. and M. Barson, 1993, Remote sensing of Australian wetlands: An evaluation of Landsat TM data for inventory and classification, Australian Journal of Marine and Freshwater Research, 44, 235-253
Jones, J. L., T. L. Haluska, A. K. Williamson and M. L. Erwin, 2001, Updating Flood Maps Efficiently Using Existing Hydraulic Models, Very-High-
Accuracy Elevation Data, and a Geographic Information System – A Pilot Study on the Nisqually River, Washington, US Geological Survey Water-Resources Investigation Report, 01-4051.
Martinez, J., T. L. Toan, 2007, Mapping of flood dynamics and spatial distribution of vegetation in the Amazon floodplain using multitemporal SAR data, Remote Sensing of Environment, 108, 209-223.
Oliver, R., S. Bickford, G. Byrne, J. C. Gallant, V. Matveev, I. C. Overton, D. Penton, S. Ryan and G. Watson (2007), A Biophysical Framework for Assessing Environmental Water Allocation and Delivery in the Murray River, Proceedings of the International Conference on Environmental Flows, Brisbane, September 2007.
Overton, I.C. (2005), Modelling Floodplain Inundation on a Regulated River: Integrating GIS, Remote Sensing and Hydrological Models, River Research and Applications, 21(9), 991-1001.
Overton, I.C., K. McEwan, C. Gabrovsek and J. Sherrah (2006), The River Murray Floodplain Inundation Model (RiM-FIM), CSIRO Water for a Healthy Country Technical Report, 1-127.
Rahman, J.M., S. P. Seaton, J-M. Perraud, H. Hotham, D. I. Verrelli, and J. R. Coleman, 2003, It’s TIME for a New Environmental Modelling Framework, In Post, D. A (ed.) MODSIM 2003 International Congress on Modelling and Simulation, vol. 4, pp. 1727-1732.
Sanyal, J. and X. Lu, 2004, Application of Remote Sensing in Flood Management with Special Reference to Monsoon Asia: A Review, Natural Hazards, 33, 283-301.
Stewart, M. D., P. D. Bates, M. G. Anderson, D. A. Price and T. P. Burt, 1999, Modelling floods in hydrologically complex lowland river reaches, Journal of Hydrology, 223, 85-106.
Townsend, P. A. and S. J. Walsh, 1999, Modeling Floodplain Inundation using an Integrated GIS with Radar and Optical Remote Sensing, Geomorphology, 21, 295-312.
Wang, Y., J. Colby, and K. Mulcahy, 2002, An efficient method for mapping flood extent in a coastal floodplain using Landsat TM and DEM data, International Journal of Remote Sensing, 23(18), 3681-3696.
Wang, Y., 2002, Mapping Extent of Floods: What We Have Learned and How We Can Do Better, Natural Hazards Review, 3(2), 68-73.
Water Technology, 2005, Lower Goulburn Floodplain Rehabilitation Scheme – Hydraulic Modelling Report, report prepared for Goulburn-Broken Catchment Management Authority.
Figure 7. The RIM-FIM product displays the inundation of a particular flood.
1470