Embed Size (px)
Citation preview
Spatial Variability of Hydraulic Properties in the Emporia Series1
K. A. ALBRECHT, S. D. LOGSDON, J. C. PARKER, AND J. C. BAKER2
ABSTRACTVariability of soil hydraulic properties of one soil series is eval-
uated, observation scale effects are analyzed, and sampling require-ments for series characterization are determined. One site was se-lected in each of four counties. Every site had four subsites about30-m apart. Undisturbed cores were taken in triplicate about 0.3-mapart at each subsite and disturbed samples taken in single replicatewithin sampling pits at each subsite. Three depths were examined—the A, E, and Bt horizons. Coefficients of variation (CV) for moistureretention data were low ranging from 1.0 to 15.4%, while CVs ofsaturated hydraulic conductivities (A,) ranged from 112 to 297%.Nested analyses of variance revealed that variance generally in-creased with increasing sample separation distance. The majority ofthe variance occurred at the site level. Numbers of samples neededto estimate means to selected confidence levels for series character-ization were determined for each parameter by depth. Assumingcosts to be equal between sites, subsites, and replicates, it was foundthat 10 to 26 sites with one subsite per site and one replicate persubsite should be sampled to adequately describe moisture retentionto within 0.05 m3 m~3 and 7 to 15 sites would be necessary for K,evaluation to within one order magnitude. Results emphasize the
1 Contribution of the Dep. of Agronomy, Virginia PolytechnicInst. and State Univ., Blacksburg, VA 24061. Received 5 July 1984.Approved 7 June 1985.
2 Research Assistant, Research Assistant, Associate Professor, andAssociate Professor, Virginia Polytechnic Inst. and State Univ.,Blacksburg, VA 24061, respectively.
need to sample many sites for hydraulic properties which have mostof their variance at this level.
Additional Index Words: saturated hydraulic conductivity, mois-ture retention, observation scale, sampling.
Albrecht, K.A., S.D. Logsdon, J.C. Parker, and J.C. Baker. 1985.Spatial variability of hydraulic properties in the emporia series. SoilSci. Soc. Am. J. 49:1498-1502.
MORPHOLOGICAL AND GENETIC characteristicswithin soil series are expected to occur within
specified ranges. However, homogeneity of physicaland chemical features within series is not guaranteed(Beckett and Webster, 1971). Degrees of spatial vari-ability are dependent on the particular soil propertiesbeing examined. Categories compiled by Warrick andNielsen (1980) from five studies differentiate low var-iation soil properties: bulk density and saturated watercontent with coefficients of variation (CV) of 7 to 11%;medium variation soil properties: texture and mois-ture release characteristics with CVs of 12 to 62%; andhigh variation soil properties: saturated (Ks) and un-saturated hydraulic conductivities with CVs of 86 to420%. The need for data on spatial variability of dif-
ALBRECHT ET AL.: SPATIAL VARIABILITY OF HYDRAULIC PROPERTIES IN THE EMPORIA SERIES 1499
ferent soil properties for different soils has been em-phasized (Mader, 1963; Bouma, 1973; Cassel andBauer, 1975).
Bache et al. (1981) attempted to assess "seriesmeans" reliability for moisture release characteristics,but really measured mapping unit variability sincesamples were taken randomly within mapped bound-aries and not verified as fitting within series criteria.Baker and Bouma (1976) and Baker (1978) evaluatedvariability of hydraulic conductivity within and be-tween many series and suggested combining series withsimilar conductivity behavior into functional in-terpretive groups. This was possible because magni-tudes of within-series variabilities were as great orgreater than among-series variabilities. These studiesstress the importance of quantifying hydraulic-prop-erty spatial variability for each series and designingadequate sampling schemes to obtain representativevalues for areas.
Magnitudes of variabilities are found to differ withsample separation distance. Keisling et al. (1977) ob-served that variance in hydraulic conductivity of asingle soil series was less when sampling was restrictedto a "small" land area of 5.6-km radius as opposed toa "large" land area of 7.3-km radius. This suggests thathydraulic soil properties do not vary randomly inspace, but exhibit structured variance. One approachto evaluate this spatial structure is to consider a nesteddesign where the levels correspond to "short", "me-dium," and "long" range separation, and analysis ofvariance is used to determine what proportion of var-iance is contributed by each level (Webster, 1977).
The objectives of this study are to (i) evaluate thevariability of soil hydraulic properties in one soil se-ries, (ii) investigate observation scale effects, and (iii)determine sampling needs for series characterization.
SOILS AND METHODSThe study was carried out on the Emporia soil series (fine
loamy, siliceous, thermic Typic Hapludults). These soils areformed in moderately fine-textured stratified fluvial and ma-rine sediments on the Upper Coastal Plain of Virginia. Theyare deep and well-drained with moderately slow to slow pro-file permeability. Slopes usually range from 2 to 6%. A modalprofile is described in Table 1.
Four sites were selected in four different Virginia coun-ties—Middlesex, Prince George, Greensville, and Isle ofWight by the field soil survey parties in those areas whoconfirmed the presence of the selected series. Sites were 60-to 140-km apart. Sampling at each site was conducted atfour subsites spaced approximately 30-m apart. Each subsitewas verified as fitting within the Emporia series range. Ateach subsite triplicate 54-mm diam by 40-mm long undis-turbed cores were taken using a hydraulic sampler at pointsseparated horizontally by about 0.3 m in A, E, and Bt ho-rizons. Thin sampler wall thickness (3.8 mm) minimizeddisturbance. Disturbed samples were taken in single repli-cate in pits at each subsite at the same depths.
Saturated hydraulic conductivities (Ks) were measured bythe falling head method (Klute, 1965). Moisture desorptioncharacteristics were measured for head equivalent matrictensions (h) of 0 to 10.2 m on the undisturbed soil cores.Volumetric water contents at h = 51 and 153 m were de-termined on disturbed samples.
Analysis of variance (ANOVA) and coefficients of varia-tion were computed for Ks and volumentric water contents
Table 1. Profile description of a typical Emporia pedon.
0 to 15 cm; pale brown (10YR 6/3) loamy fine sand; weak fine granularstructure; very friable; many fine medium and coarse roots; stronglyacid; clear smooth boundary. (0-25 cm thick).
E horizon15 to 38 cm; pale brown (10YR 6/3) fine sandy loam; weak fine granular
structure; very friable; common fine and medium roots; strongly acid;gradual smooth boundary. (0-25 cm thick).
Btl horizon38 to 81 cm; yellowish brown (10YR 5/6) sandy clay loam; few medium
distinct yellowish red (5YR 5/8) mottles; weak medium subangularblocky structure; friable, slightly sticky, slightly plastic; few fine andmedium roots; few thin clay films on faces of peds; many sand grainsbridged and coated with clay; strongly acid; diffuse smooth boundary.
Bt2 horizon81 to 112 cm; yellowish brown (10YR 5/6) clay loam, many medium
prominent red (10YR 4/8) mottles; weak very thick platy structure part-ing to moderate medium subangular blocky; friable, sticky, slightlyplastic; few fine and medium roots; many medium clay films on faces ofpeds; very strongly acid; diffuse smooth boundary.
Bt3 horizon112 to 145 cm; yellowish brown (10YR 5/6) sandy clay loam; many medium
distinct light gray (10YR 7/1) and red (2.5YR 5/8) mottles; weak verythick platy structure parting to weak medium subangular blocky;friable, firm in place, slightly sticky, slightly plastic; common mediumclay films on faces of peds; very strongly acid; diffuse smooth boundary.(Combined thickness of the B2t horizon is 70-150 cm).
C horizon145 to 178 cm; mottled yellow (2.5Y 7/6), light gray (10YR 7/1), and reddish
brown (2.SYR 5/4) sandy clay loam; massive; friable, firm in place,slightly sticky, slightly plastic; few clay flows; very strongly acid.
at each tension for each depth. For the ANOVA, replicateswere nested within subsites and subsites were nested withinsites. Estimates of variance components corresponding toapproximate distance ranges of (i) 0 to 0.3 m, (ii) 0.3 to 30m, and (iii) 30 m to about 100 km were calculated in theconventional way (Snedecor and Cochran, 1967). We willrefer to these variance components as those between repli-cates nested in subsites, between subsites nested in sites, andbetween sites, respectively. Variance components are ex-pressed as percentages of the total variance. Log-trans-formed hydraulic conductivity data were used in the anal-ysis of variance since ANOVA requires a normal populationdistribution and since Ks is expected to be lognormal(Mclntyre and Tanner, 1959; Nielsen et al., 1973; Baker andBouma, 1976; Cameron, 1978).
Numbers of samples needed to estimate series means tospecified accuracy at the 0.05 significance level were deter-mined for each hydraulic parameter by depth. Nested costanalysis procedures (Snedecor and Cochran, 1967) were usedto determine the optimum number of sites, subsites per site,and replicates per subsite for sampling. An iterative tech-nique was employed. Costs for obtaining and testing sam-ples at the site, subsite, and replicate level were assumedequal. Mean volumetric moisture contents at each tensionwere estimated to within 0.05 m3 m~3. Saturated hydraulicconductivity means were estimated to within one order ofmagnitude.
RESULTS AND DISCUSSIONMoisture Retention
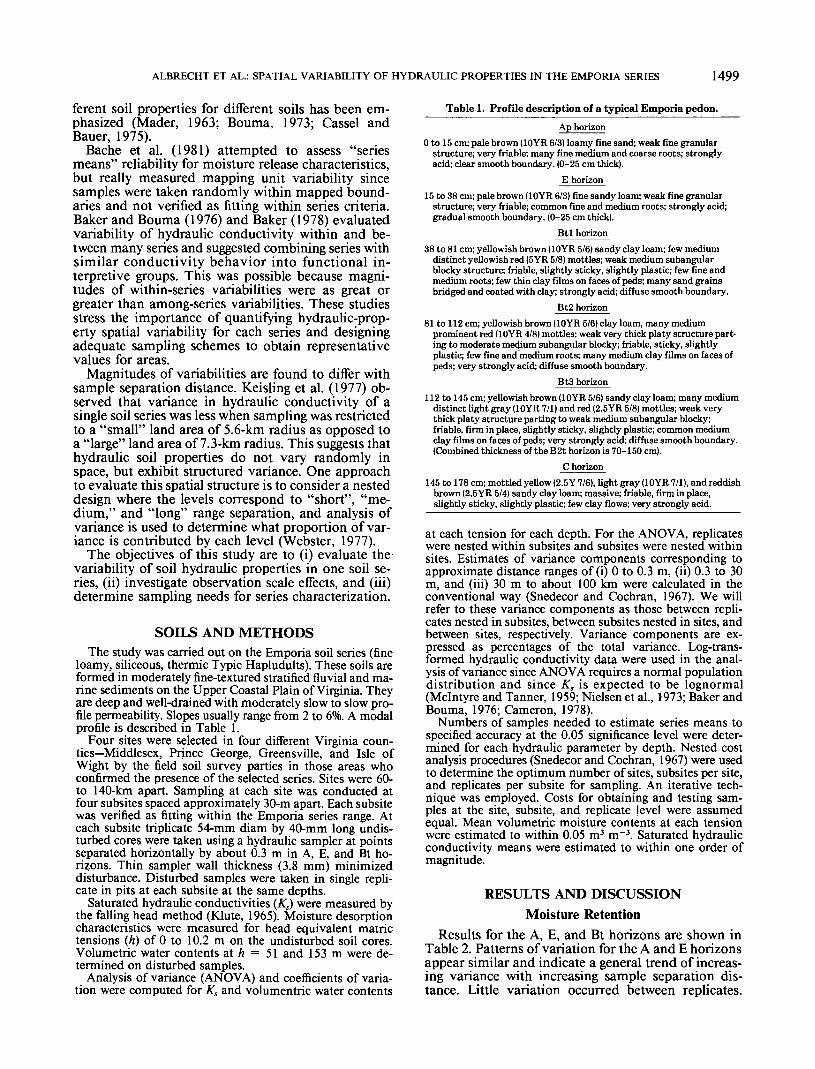
Results for the A, E, and Bt horizons are shown inTable 2. Patterns of variation for the A and E horizonsappear similar and indicate a general trend of increas-ing variance with increasing sample separation dis-tance. Little variation occurred between replicates.
1500 SOIL SCI. SOC. AM. J., VOL. 49, 1985
10
10
10°
10'1
A horizon
"0 0.1 0.2 0.3 0.4 0.59 (m3/m3)
Fig. 1. Moisture retention characteristics of A horizons. Site curvesrepresent averages of subsite values.
Averages of < 20 and 40% of the total variance wereattributable to A and E horizon subsites, respectively.Sites account for the majority of the variance rangingfrom about 50 to 83% of the total variance, except fortensions of 0.0 and 0.51 m. This implies that most ofthe samples need to be taken at the site level ratherthan at the subsite or replicate level to obtain a re-presentive series mean. Differences among site meansand differences among means of subsites nested in sitesare significant at the 0.001% level (except at 0.0- and0.51-m tensions) for both depths. Coefficients of var-iation are relatively low, 3.1 to 15.4% and 1.0 to 6.5%for the A and E horizon moisture retention charac-teristics, respectively.
Moisture retention data for the Bt horizon (Table2) shows that moisture contents at several tensionssupport the trend of increasing variance with increas-ing sample separation distance (h = 0.0, 0.51, and1.02 m). Disturbed sample data (h = 51.0 and 153.0m) show little difference between the variance com-ponents at the site and subsite levels with about halfof the variance contributable to each level. Moisturecontents at tensions between 3 and 10m show a ma-jority of their variance occurring at the subsite levelwith values ranging from 53 to 84% as compared tosite variances of 6 to 39%. Inconsistency of these re-sults makes it difficult to ascertain whether there maybe a different pattern of variation in the Bt horizonthan in the A and E horizons. Differences among sitemeans are significant at the 0.05 level for several ten-sions and differences among means of subsites nested
10'
10'
10°
10
horizon
0 0.1 0.2 0.3 0.4 0.5
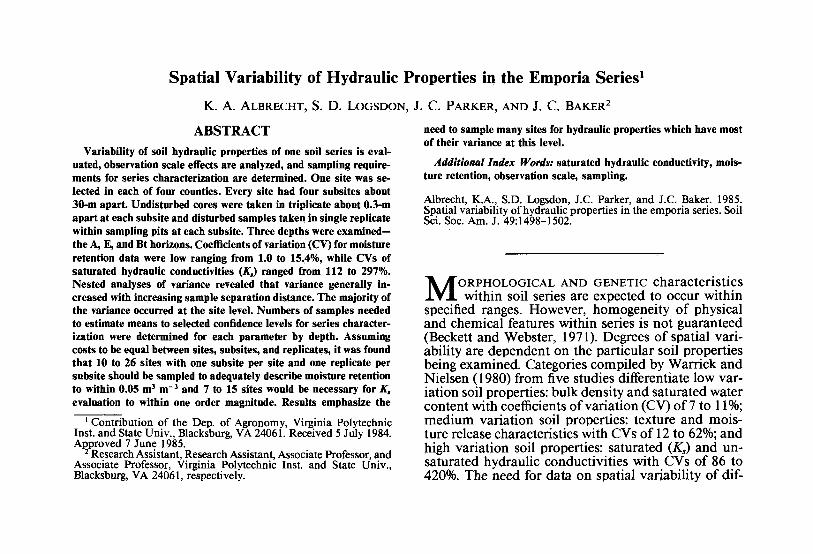
9 (m3/m3)Fig. 2. Moisture retention characteristics of E horizons. Site curves
represent averages of subsite values.
in sites are significant at the 0.001 level for all ten-sions. Coefficients of variation for Bt moisture reten-tion data are low with values ranging from 1.1 to 4.2%.
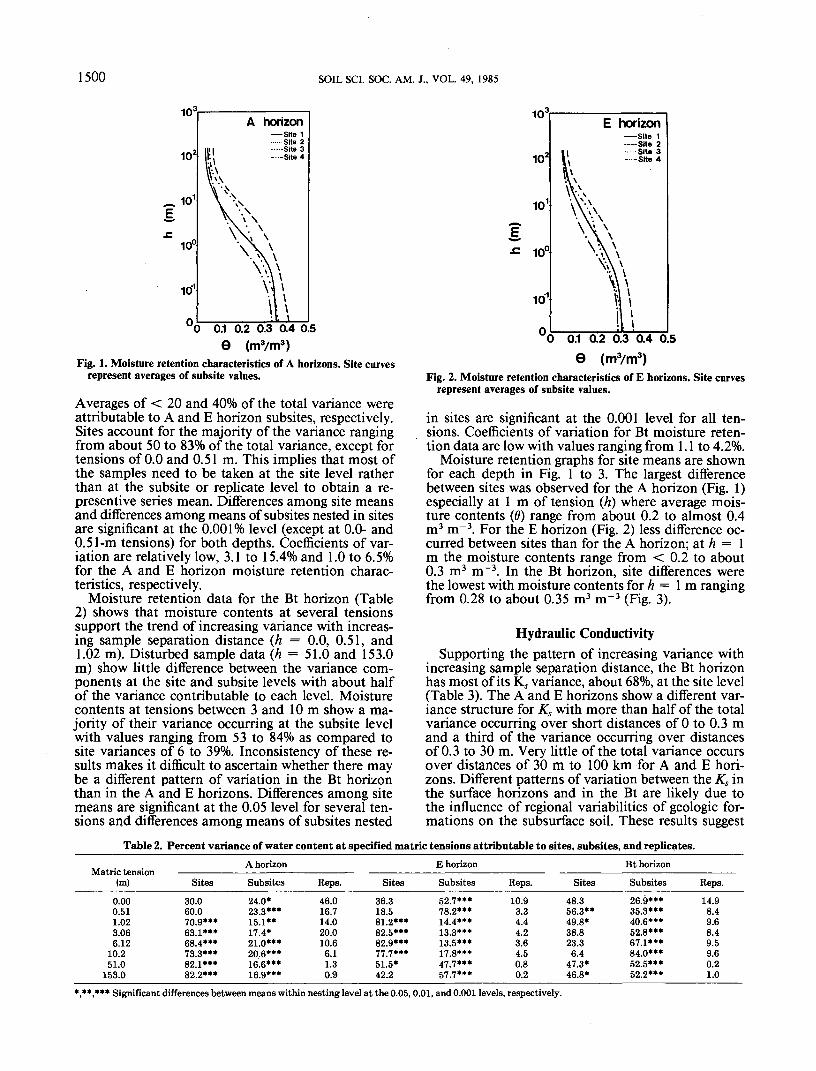
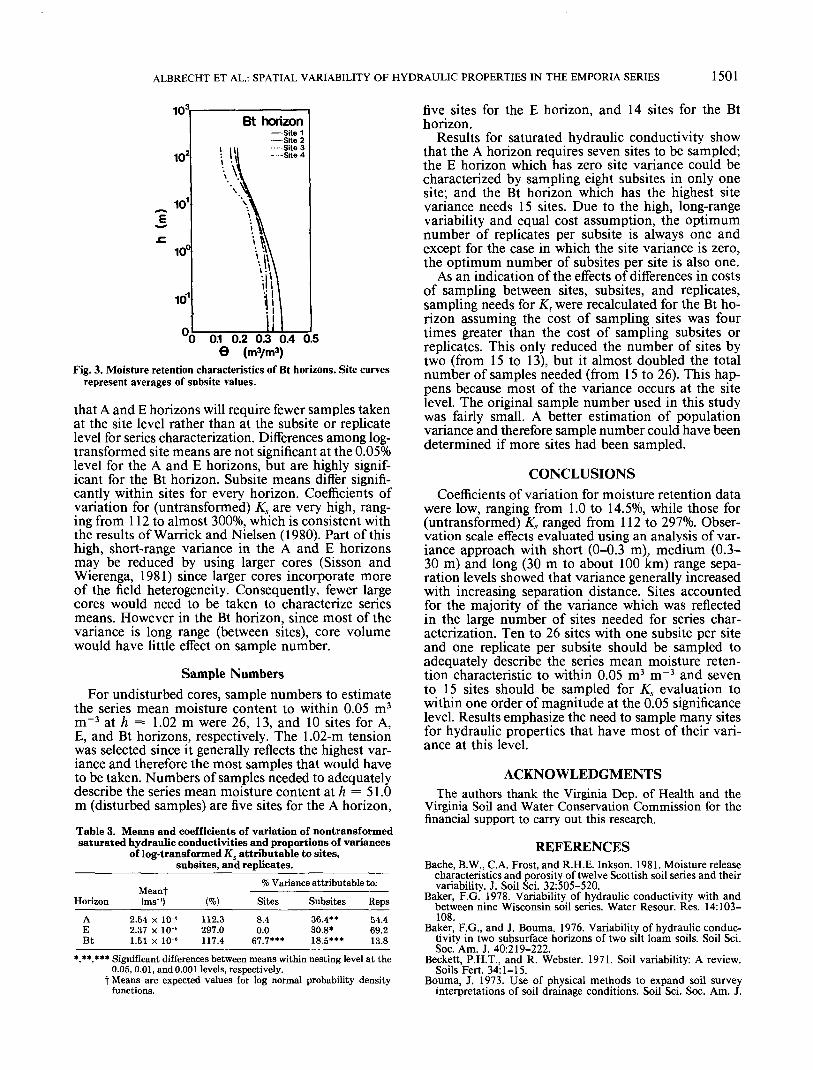
Moisture retention graphs for site means are shownfor each depth in Fig. 1 to 3. The largest differencebetween sites was observed for the A horizon (Fig. 1)especially at 1 m of tension (h) where average mois-ture contents (6) range from about 0.2 to almost 0.4m3 m"3. For the E horizon (Fig. 2) less difference oc-curred between sites than for the A horizon; at h = 1m the moisture contents range from < 0.2 to about0.3 m3 m~3. In the Bt horizon, site differences werethe lowest with moisture contents for h = 1m rangingfrom 0.28 to about 0.35 m3 m~3 (Fig. 3).
Hydraulic ConductivitySupporting the pattern of increasing variance with
increasing sample separation distance, the Bt horizonhas most of its Ks variance, about 68%, at the site level(Table 3). The A and E horizons show a different var-iance structure for Ks with more than half of the totalvariance occurring over short distances of 0 to 0.3 mand a third of the variance occurring over distancesof 0.3 to 30 m. Very little of the total variance occursover distances of 30 m to 100 km for A and E hori-zons. Different patterns of variation between the Ks inthe surface horizons and in the Bt are likely due tothe influence of regional variabilities of geologic for-mations on the subsurface soil. These results suggest
Table 2. Percent variance of water content at specified matric tensions attributable to sites, subsites, and replicates.
Matric tension(m)
0.000.511.023.066.12
10.251.0
153.0
Sites
30.060.070.9***63.1***68.4***73.3***82.1***82.2***
A horizon
Subsites
24.0*23.3***15.1**17.4*21.0***20.6***16.6***16.9***
Reps.
46.016.714.020.010.66.11.30.9
Sites
36.318.581.2***82.5***82.9***77.7***51.5*42.2
E horizon
Subsites
52.7***78.2***14.4***13.3***13.5***17.8***47.7***57.7***
Reps.
10.93.34.44.23.64.50.80.2
Sites
48.356.3**49.8*38.823.36.4
47.3*46.8*
Bt horizon
Subsites Reps.
26.9*35.3*40.6*52.8*67.1*84.0*52.5*52.2*
14.98.49.68.49.59.60.21.0
*,**,*** Significant differences between means within nesting level at the 0.05,0.01, and 0.001 levels, respectively.
ALBRECHT ET AL.: SPATIAL VARIABILITY OF HYDRAULIC PROPERTIES IN THE EMPORIA SERIES 1501
10'
10'
10
10°
id1
Bt horizon
0.50 0.1 0.2 0.3 0.49 (m3/m3)
Fig. 3. Moisture retention characteristics of Bt horizons. Site curvesrepresent averages of subsite values.
that A and E horizons will require fewer samples takenat the site level rather than at the subsite or replicatelevel for series characterization. Differences among log-transformed site means are not significant at the 0.05%level for the A and E horizons, but are highly signif-icant for the Bt horizon. Subsite means differ signifi-cantly within sites for every horizon. Coefficients ofvariation for (untransformed) Ks are very high, rang-ing from 112 to almost 300%, which is consistent withthe results of Warrick and Nielsen (1980). Part of thishigh, short-range variance in the A and E horizonsmay be reduced by using larger cores (Sisson andWierenga, 1981) since larger cores incorporate moreof the field heterogeneity. Consequently, fewer largecores would need to be taken to characterize seriesmeans. However in the Bt horizon, since most of thevariance is long range (between sites), core volumewould have little effect on sample number.
Sample NumbersFor undisturbed cores, sample numbers to estimate
the series mean moisture content to within 0.05 m3
m~3 at h = 1.02 m were 26, 13, and 10 sites for A,E, and Bt horizons, respectively. The 1.02-m tensionwas selected since it generally reflects the highest var-iance and therefore the most samples that would haveto be taken. Numbers of samples needed to adequatelydescribe the series mean moisture content at h = 51.0m (disturbed samples) are five sites for the A horizon,Table 3. Means and coefficients of variation of nontransformedsaturated hydraulic conductivities and proportions of variances
of log-transformed Ks attributable to sites,subsites, and replicates.
Horizon
AEBt
Meanf(ms-)
2.54 X 10⁻⁶
2.37 x 10-'1.51 x 10-
% Variance attributable to:
(%)
112.3297.0117.4
Sites
8.40.0
67.7***
Subsites
36.4**30.8*18.5***
Reps
54.469.213.8
****** Significant differences between means within nesting level at the0.05,0.01, and 0.001 levels, respectively.
t Means are expected values for log normal probability densityfunctions.
five sites for the E horizon, and 14 sites for the Bthorizon.
Results for saturated hydraulic conductivity showthat the A horizon requires seven sites to be sampled;the E horizon which has zero site variance could becharacterized by sampling eight subsites in only onesite; and the Bt horizon which has the highest sitevariance needs 15 sites. Due to the high, long-rangevariability and equal cost assumption, trie optimumnumber of replicates per subsite is always one andexcept for the case in which the site variance is zero,the optimum number of subsites per site is also one.
As an indication of the effects of differences in costsof sampling between sites, subsites, and replicates,sampling needs for Ks were recalculated for the Bt ho-rizon assuming the cost of sampling sites was fourtimes greater than the cost of sampling subsites orreplicates. This only reduced the number of sites bytwo (from 15 to 13), but it almost doubled the totalnumber of samples needed (from 15 to 26). This hap-pens because most of the variance occurs at the sitelevel. The original sample number used in this studywas fairly small. A better estimation of populationvariance and therefore sample number could have beendetermined if more sites had been sampled.
CONCLUSIONSCoefficients of variation for moisture retention data
were low, ranging from 1.0 to 14.5%, while those for(untransformed) Ks ranged from 112 to 297%. Obser-vation scale effects evaluated using an analysis of var-iance approach with short (0-0.3 m), medium (0.3-30 m) and long (30 m to about 100 km) range sepa-ration levels showed that variance generally increasedwith increasing separation distance. Sites accountedfor the majority of the variance which was reflectedin the large number of sites needed for series char-acterization. Ten to 26 sites with one subsite per siteand one replicate per subsite should be sampled toadequately describe the series mean moisture reten-tion characteristic to within 0.05 m3 m"3 and sevento 15 sites should be sampled for Ks evaluation towithin one order of magnitude at the 0.05 significancelevel. Results emphasize the need to sample many sitesfor hydraulic properties that have most of their vari-ance at this level.
ACKNOWLEDGMENTSThe authors thank the Virginia Dep. of Health and the
Virginia Soil and Water Conservation Commission for thefinancial support to carry out this research.
1502 SOIL SCI. SOC. AM. J., VOL. 49, 1985
37:413-421.Cameron, D.R. 1978. Variability of soil water retention curves and
predicted hydraulic conductivities on a small plot. Soil Sci.126:364-371.
Cassel, D.K., and A. Bauer. 1975. Spatial variability in soils belowdepth of tillage: Bulk density and fifteen atmosphere percentage.Soil Sci. Soc. Am. Proc. 39:247-250.
Keisling, T.L., J.M. Davidson, D.L. Weeks, and R.D. Morrison.1977. Preciesion with which selected soil physical parameters canbe estimated. Soil Sci. 124:241-248.
Klute, A. 1965. Laboratory measurement of hydraulic conductivityof saturated soil. In C.A. Black (ed.) Methods of soil analysis,Part I. Agronomy 9:210-221.
Mader, D.L. 1963. Soil variability—a serious problem in soil-sitestudies in the North-East. Soil Sci. Soc. Am. Proc. 27:707-709.
Mclntyre, D.S., and C.B. Tanner. 1959. Abnormally distributed soilphysical measurements and nonparametric statistics. Soil Sci.88:133-137.
Nielsen, D.R., J.W. Biggar, and K.T. Erh. 1973. Spatial variabilityof field-measured soil-water properties. Hilgardia 42:215-259.
Sisson, J.B., and P.J. Wierenga. 1981. Spatial variability of steady-state infiltration rates as a stochastic process. Soil Sci. Soc. Am.J. 45:699-704.
Snedecor, G.W., and W.G. Cochran. 1967. Statistical methods. IowaState University Press, Ames.
Warrick, A.W., and D.R. Nielsen. 1980. Spatial variability of soilphysical properties in the field, p. 319-344. In D. Hillel (ed.)Applications of soil physics. Academic Press, Inc. New York.
Webster, R. 1977. Quantitative and numerical methods in soil clas-sification and survey. Clarendon Press. Oxford, England.