Embed Size (px)
Citation preview
Translational Science
Spatially Resolved Transcriptomics EnablesDissection of Genetic Heterogeneity in Stage IIICutaneous Malignant MelanomaKim Thrane1, Hanna Eriksson2,3, Jonas Maaskola1, Johan Hansson2,3, andJoakim Lundeberg1
Abstract
Cutaneous malignant melanoma (melanoma) is character-ized by a high mutational load, extensive intertumoral andintratumoral genetic heterogeneity, and complex tumormicroenvironment (TME) interactions. Further insights intothe mechanisms underlying melanoma are crucial for under-standing tumor progression and responses to treatment. Herewe adapted the technology of spatial transcriptomics (ST) tomelanoma lymph node biopsies and successfully sequencedthe transcriptomes of over 2,200 tissue domains. Deconvolu-tion combined with traditional approaches for dimensionalreduction of transcriptome-wide data enabled us to bothvisualize the transcriptional landscape within the tissue andidentify gene expression profiles linked to specific histologicentities. Our unsupervised analysis revealed a complex spatialintratumoral composition of melanoma metastases that wasnot evident through morphologic annotation. Each biopsyshowed distinct gene expression profiles and included exam-ples of the coexistence of multiple melanoma signatures
within a single tumor region as well as shared profilesfor lymphoid tissue characterized according to their spatiallocation and gene expression profiles. The lymphoid area inclose proximity to the tumor region displayed a specificexpression pattern, which may reflect the TME, a key compo-nent to fully understanding tumor progression. In conclusion,using the ST technology to generate gene expression profilesreveals a detailed landscape of melanoma metastases. Thisshould inspire researchers to integrate spatial informationinto analyses aiming to identify the factors underlyingtumor progression and therapy outcome.
Significance: Applying ST technology to gene expressionprofiling in melanoma lymph node metastases reveals a com-plex transcriptional landscape in a spatial context, which isessential for understanding themultiple components of tumorprogression and therapy outcome. Cancer Res; 78(20); 5970–9.�2018 AACR.
IntroductionMolecular heterogeneity both within and between tumors in
the same patient has been recognized in most cancers, and isespecially prevalent in cutaneous malignant melanoma (mela-noma; refs. 1–5). The combination of an expansion of tumorsubclones with varying genetic and genomic alterations and theinteraction between the tumor cells and the tumor microenvi-ronment (TME), for example, malignant, stromal, and immunecells, during cancer progression presents an intricate situation thatinfluences disease development (6–8). Previous large-scalesequencing studies have concluded that the extensive inter- andintratumoral genetic heterogeneity observed inmelanoma reflects
one of the highest mutational loads in all cancers (4, 5, 8–13).Furthermore, melanoma is a highly immunogenic cancer thatinduces immune responses associated with immune cell infiltra-tion both in localized and metastatic disease. Clinically, thegenetic diversity of the tumor in relation to that of the TME maybe an important factor in explaining tumor progression, responseto treatments, emergence of therapy resistance, and outcomedifferences in melanoma. The heterogeneity of the disease isclearly demonstrated by patients diagnosed with stage III mela-noma, which is a group characterized by a high risk of relapse and5-year relative survival rates between 40% and 70% (14).
Previous research has shown that chemotherapeuticapproaches for treating disseminated melanoma are inefficientand have no noticeable impact on overall survival (15). Therapiesthat both target BRAFV600 mutated melanomas and utilizeimmune checkpoint inhibitors have changed the outlook forpatients with melanoma and also offer potential therapy optionsin the adjuvant setting of stage III melanoma (16). Still, remis-sions do not frequently last long.
Thus, further research is needed to elucidate the molecularmechanisms underlying melanoma pathogenesis, to improvediagnostics and to identify prognostic as well as treatment-pre-dictive biomarkers.
The inter- and intratumoralmolecular heterogeneity in stage IIImelanoma has already been analyzed with an array of analyticalapproaches, including gene expression analyses, IHC, and prote-omic approaches (10, 11, 13, 17–21). Tirosh and colleagues (13)
1Department of Gene Technology, KTH Royal Institute of Technology,SciLifeLab, Stockholm, Sweden. 2Department of Oncology-Pathology,Karolinska Institutet, SE-17176 Stockholm, Sweden. 3Department of Oncology,Karolinska University Hospital, SE-17176 Stockholm, Sweden.
Note: Supplementary data for this article are available at Cancer ResearchOnline (http://cancerres.aacrjournals.org/).
K. Thrane and H. Eriksson contributed equally to this article.
Corresponding Author: Joakim Lundeberg, Royal Institute of Technology,Science for Life Laboratory, Stockholm 171 76, Sweden. Phone:46704582346; E-mail: [email protected]
doi: 10.1158/0008-5472.CAN-18-0747
�2018 American Association for Cancer Research.
CancerResearch
Cancer Res; 78(20) October 15, 20185970
on May 20, 2020. © 2018 American Association for Cancer Research. cancerres.aacrjournals.org Downloaded from
Published OnlineFirst August 28, 2018; DOI: 10.1158/0008-5472.CAN-18-0747
analyzed the transcriptional heterogeneity in melanoma, includ-ing lymph node metastases, with single-cell RNA sequencing(scRNA-seq) and concluded that the intra- and interindividualspatial, functional, and genomic heterogeneity in melanoma andthe associated tumor components shapes the TME. AlthoughscRNA-seq is a powerful tool for addressing transcriptional het-erogeneity, knowledge about the spatial origins of single cells isvital when studying the TME.
We aimed to optimize and apply spatial transcriptomics (ST)technology (22) for the in situ and quantitative detection of geneexpression in stage III melanoma lymph nodemetastases. For thispurpose, we analyzed the transcriptomes of �2,200 tissuedomains in fresh frozen tumor sections. By retaining the posi-tional information of the tissue domains, we could superimposethe transcriptomic data onto histological tissue images and visu-alize gene expression throughout the tumor.
Materials and MethodsMelanoma samples and RNA quality control
Lymph node metastases from four patients diagnosed withstage III melanoma were included in this study. The metastaseshave previously been described as well as molecularly annotatedregarding BRAF, NRAS (23), and CDKN2A (24) status. The freshfrozen tumor tissue was stored at �70� C until analysis. Thepatients were previously categorized as short-term survivors (�13months) or long-term survivors (�60 months) following lym-phadenectomy (24, 25). The staging was performed according tothe American Joint Committee on Cancer system 7 (26) at thetime of diagnosis. This study was conducted in accordance withthe Declaration of Helsinki with written informed consent fromall patients. The project was approved by the Regional EthicsCommittee at the Karolinska Institutet, Stockholm, Sweden.
The tumor samples were embedded in OCT (#4532, Sakura,Alphen aan den Rijn, the Netherlands) before cryosectioning forRNA extraction. A total of four sections permetastasis, eachwith awidth of 10mm,were placed in LysingMatrixD (#116913050;MPBiomedicals) and lysed using FastPrep (MP Biomedicals). TotalRNA was extracted using the RNeasy Plus Mini Kit (#74134;Qiagen) according to the manufacturer's protocol. RIN valueswere determined with a 2100 Bioanalyzer, RNA 6000 Pico Kit(Agilent) according to the manufacturer's protocol.
Hematoxylin and eosin-stained (H&E-stained) images of eachof the four tumor samples were manually annotated by a trainedpathologist to identify melanoma, stromal and lymphoid tissue.The lymphoid tissue was a separate region in two of the samples.The annotation was performed on one of the two consecutivesections used for the spatial arrays.
Preparation of arraysTwo types of arrays, both prepared on CodeLink-activated
microscope glass slides (SurModics) as described by Sta�hl and
colleagues (22), were used in this study. For the optimizationassay, reverse transcription (RT)-primers containing a poly-T20VN capture regionwere immobilized uniformly over the arraysurface, with six identical surfaces generated per glass slide accord-ing to the manufacturer's instructions.
Surface RT-primer for optimization assays:[AmC6]UUUUUGACTCGTAATACGACTCACTATAGGGACA-
CGACGCTCTTCCGATCTNNNNNNNNTTTTTTTTTTTTTTTTTT-TTVN
The arrays for spatial experiments (referred to as spatial arrays)were printed as 1,007 spots of RT-primers containing apoly-T20VN capture region, a spatial barcode and a uniquemolecular identifier (UMI). The spots, with 200 mm center-to-center spacing, a diameter of 100 mm, and approximately 200million RT-primers per spot, were printed according to themanufacturer's instructions (ArrayJet Ltd.). Six identical arraysurfaces, with dimensions of 6,200 � 6,600 mm, were generatedper glass slide.
Surface RT-primer for spatial arrays:[AmC6]UUUUUGACTCGTAATACGACTCACTATAGGGACA-
CGACGCTCTTCCGATCT[18mer_Spatial_Barcode_1to1007]WS-NNWSNNVTTTTTTTTTTTTTTTTTTTTVN
Surface frame oligonucleotide:[AmC6]AAATTTCGTCTGCTATCGCGCTTCTGTACC
Preparation of tumor samples for the ST analysisFresh frozen tumor biopsies were embedded in OCT, cryosec-
tioned at 8 and 14 mm, and placed onto the array surfaces,followed by incubation at 37�C for 1 min. A new glass slide wasused for each of the four tumor samples, however only two arraysurfaces out of six were used to generate sequencing libraries forthe spatial experiments. A fixation solution, which was preparedby diluting 36.5%–38.0% formaldehyde (#F8775; Sigma-Aldrich) 1:10 in 1xPBS (#09-9400; Medicago), was added on topof the tissue sections, incubated for 10minutes, andwashedoff bydipping the glass slides in 1� PBS. The fixated tissue sections werecovered with propan-2-ol (#A461-1; Fisher Scientific). Followingevaporation for 45 seconds,Mayer's hematoxylin (#S3309;Dako)was added and, after a seven-minute incubation, the glass slideswere washed in RNase and DNase free MQwater. The glass slideswere briefly dried and bluing buffer (#CS702; Dako) was addedand washed off with RNase and DNase free MQ water after2 minutes. For eosin staining, the glass slides were immerged ina solution of Eosin (#HT110216) diluted 1:20 in Tris-base [0.45MTris, 0.5M acetic acid, pH 6.0]. The glass slides were thenwashed in RNase and DNase free MQ water and incubated at37�C until dry.
Before imaging, the glass slides were mounted with 85%glycerol (#104094; Merck Millipore) and covered with coverslips(#BB014060A1; Menzel-Gl€aser). Bright field imaging was per-formed at 20x resolution with the Metafer Slide Scanningplatform (MetaSystems). VSlide and VSViewer software (Meta-Systems) was used to stitch the raw images and extract .jpeg files.
The coverslips and glycerol were removed by submerging theglass slides in RNase andDNase freeMQwater until the coverslipscame off, after which the slides were dipped in 70% ethanol.
After drying at 37�C, the glass slides were placed in ArrayITmasks to enable separation of reagents for the six arrays per glassslide.
The glass slides were kept in the masks for the following steps,and removed for the wash preceding tissue removal.
The mRNA capture procedureFor each array surface, 70 mL containing 1� Exonuclease I
Reaction buffer [#B0293S; New England Biolabs (NEB); Ipswich]and 0.19 mg/mL BSA (#B9000S; NEB) was added, followed by anincubation time of 30 minutes at 37�C. After incubation, eacharray was washed by pipetting 100 mL 0.1� SSC (#S6639; Sigma-Aldrich), diluted in MQ RNase and DNase free water. For themRNA optimization assay, 70 mL of 0.1% pepsin (#P7000-25G;
Studying Melanoma with Spatial Transcriptomics
www.aacrjournals.org Cancer Res; 78(20) October 15, 2018 5971
on May 20, 2020. © 2018 American Association for Cancer Research. cancerres.aacrjournals.org Downloaded from
Published OnlineFirst August 28, 2018; DOI: 10.1158/0008-5472.CAN-18-0747
Sigma-Aldrich) dissolved in 0.1M HCl (#318965- 1000ML;Sigma-Aldrich) was added to six optimization surfaces per sam-ple. Incubations were performed at 37�C in duplicates for 10, 12,and 14minutes. The same reagents and volumes were used in thespatial arrays, but incubation timeswere based on results from theoptimization assay. After incubation, reagents were removed bypipetting and the array surface was washed with 100 mL 0.1� SSCas described above.
Reverse transcription, tissue removal, and material cleavageTwo different RT mixtures for were used for the optimiza-
tion- (in which fluorescent cDNA was to be generated) andspatial arrays (intended for library preparation and sequenc-ing). Both incubations were conducted with a total volume of70 mL per array surface, overnight (ON) at 42�C for approxi-mately 15 hours. The reaction mixture for the optimizationassay contained 1� first strand buffer (#18080-044; Invitro-gen), 5 mmol/L DTT (#18080-044; Invitrogen), 0.19 mg/mLBSA, 50 ng/mL Actinomycin D (#A1410-2MG; Sigma-Aldrich),1% DMSO (#472301-500ML; Sigma-Aldrich), 20 U/mL Super-script III (#18080-04; Invitrogen), 2 U/mL RNaseOUT (#10777-019; Invitrogen), 500 mmol/L each of dATP, dGTP, and dTTP,12.5 mmol/L of dCTP, and 25 mmol/L of Cyanine 3-dCTP(#NEL576001EA; PerkinElmer). The same reagents were usedfor the spatial arrays, except that each dNTP (#R0192; FisherScientific) was present at the same concentration of 500 mmol/Land that Cyanine 3-dCTP was excluded.
Residues of melanoma tissue were degraded and removed intwo steps. Each array surface was first incubated with 70 mL ofb-mercaptoethanol (#444203; Calbiochem) in RLT buffer(#79216; Qiagen) at a 1:100 ratio, at 56�C for 1.5 hours, withcontinuous shaking, which was followed by washing with 100mL 0.1� SSC as described above. In the second step, each arraysurface was incubated with 70 mL of Proteinase K (#19131;Qiagen) in PKD buffer (#1034963; Qiagen, pH 7.5) at a 1:7ratio, at 56�C for 1 hour, with interval shaking. The glass slideswere released from the masks and washed in three steps bysubmerging them in beakers containing: 2� SSC with 0.1%SDS (#71736-100ML; Sigma-Aldrich), 0.2� SSC, and 0.1�SSC, respectively. All washing steps were performed in a ther-momixer with continuous shaking; the first at 50�C for 10minutes, and the remaining two at room temperature for 1minute each.
All of the glass slides were spin-dried, after which, the optimi-zation arrays were subjected to fluorescent scanning whereas thespatial arrays were put back into the masks for cleavage of themRNA:cDNA material.
Spatial library preparation and sequencingThe barcoded mRNA/cDNA material was cleaved off from the
arrays and sequencing libraries were prepared in solution. Briefly,second-strand cDNA was synthesized, followed by in vitro tran-scription and adapter ligation. Sequencing handles and indexeswere added in a PCR, and thefinished libraries were sequenced onthe Illumina NextSeq platform with paired-end sequencing, 31bases from read 1 and 121 from read 2. The protocol is describedin detail in Sta
�hl and colleagues (22)
Image alignmentSpot visualization and image alignment were both performed
as previously described by Sta�hl and colleagues (22).
Read alignment and generation of count dataSequencing data were processed using the ST pipeline, with
standard settings, as described by Fern�andez and colleagues(27). In short, read 2 was mapped against the human genome(GRCh38) and read 1 was used for UMI filtering and spatialinformation. The ST pipeline generated one matrix (.tsv-file)per sample containing gene counts per spatial barcode (i.e.,tissue domain) as the output. Data points for complexity curveswere generated using a built-in function of the ST pipeline (27).Annotation reads were subsampled before proceeding to UMI-filtering for each subsample, resulting in a computed numberof unique molecules for a stepwise increasing number ofannotated reads. The resulting data points were plotted inRStudio, version 0.99.903, The R Project for Statistical Com-puting, Vienna, Austria.
Correlation of biological replicatesThe count data were normalized by log2-transformation of
counts permillion (CPM)þ1 pseudocount, and scatterplots weregenerated for each pair of consecutive section using the ggplot2package (28) in RStudio (version 1.1.453). The built-in statspackage was used to compute Pearson correlations.
Principal component analysis and hierarchical clustering of"bulk" data
Matrix data from the ST pipeline were imported into RStudio(version 0.99.903) and count data from all spatial IDs (tissuedomains) within a dataset were merged. Read counts were nor-malizedwithDESeq2 (29), a principal component analysis (PCA)plot was generated with ggplot2 (28), and hierarchical clusteringwas performed with pheatmap (30).
Factor analysisCount data generated from the STpipelinewere analyzedwith a
factor analysis method previously described by Berglund, Maas-kola, Schultz and colleagues (31). Four out of 20 generated factorswere named and classified according the manual histopatholog-ical annotation.
PCA of individual tissue sectionsThe matrix with count data generated from the ST pipeline was
imported into RStudio (version 0.99.903) and filtered by remov-ing all tissue domains with less than 500 genes. The data werenormalized using the scran package (32). Variance calculationsand PCA were conducted using built-in functions.
ResultsOverview of subjects
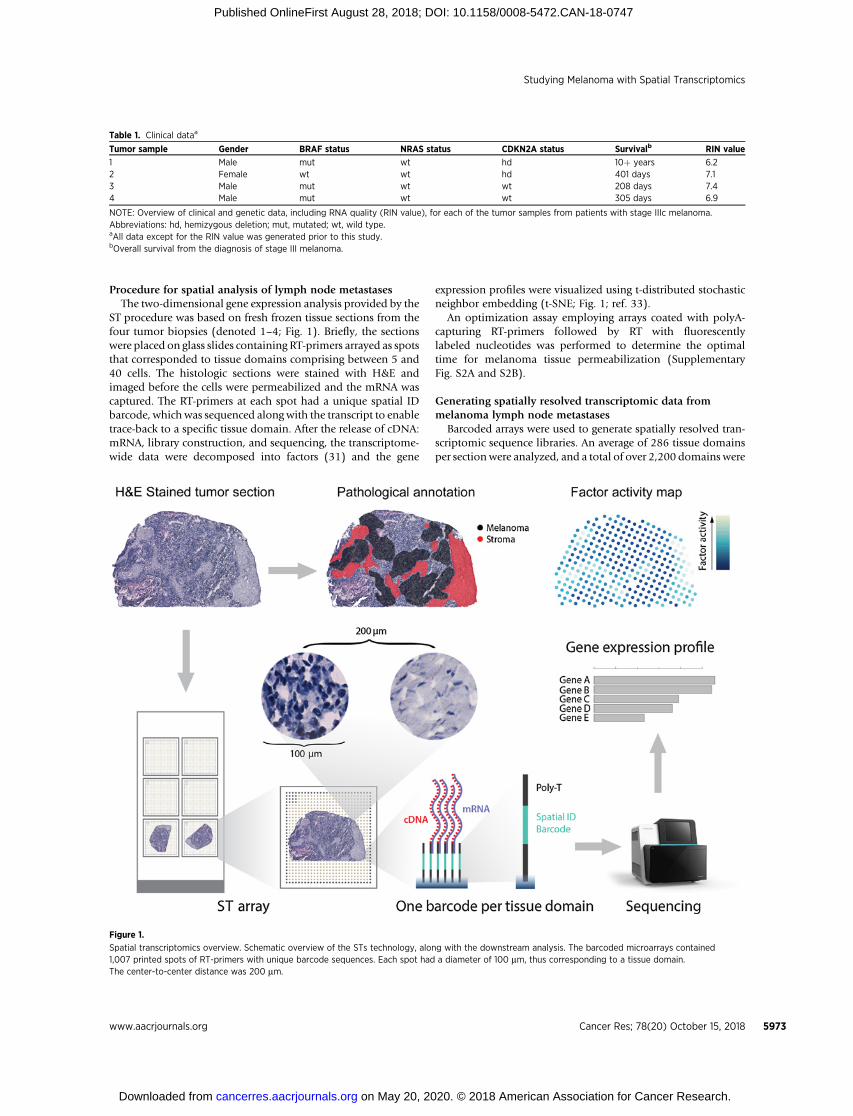
This study included samples from lymph node metastasesfrom four patients with stage IIIc melanoma (Table 1). All butone sample were BRAFv600 positive and one patient was along-term survivor according to the outcome classification byJohansson and colleagues (>60 months; Table 1; ref. 25). TheRNA quality control prior to the ST analysis showed RNAintegrity numbers (RIN) between 6.2 and 7.4 (Table 1). Amanual histologic annotation, performed by a trained pathol-ogist, identified areas of tumor cells (i.e., melanoma), stroma,and lymphoid within the metastases (Supplementary Fig. S1).The annotations were used for comparison with results fromthe ST gene expression analyses.
Thrane et al.
Cancer Res; 78(20) October 15, 2018 Cancer Research5972
on May 20, 2020. © 2018 American Association for Cancer Research. cancerres.aacrjournals.org Downloaded from
Published OnlineFirst August 28, 2018; DOI: 10.1158/0008-5472.CAN-18-0747
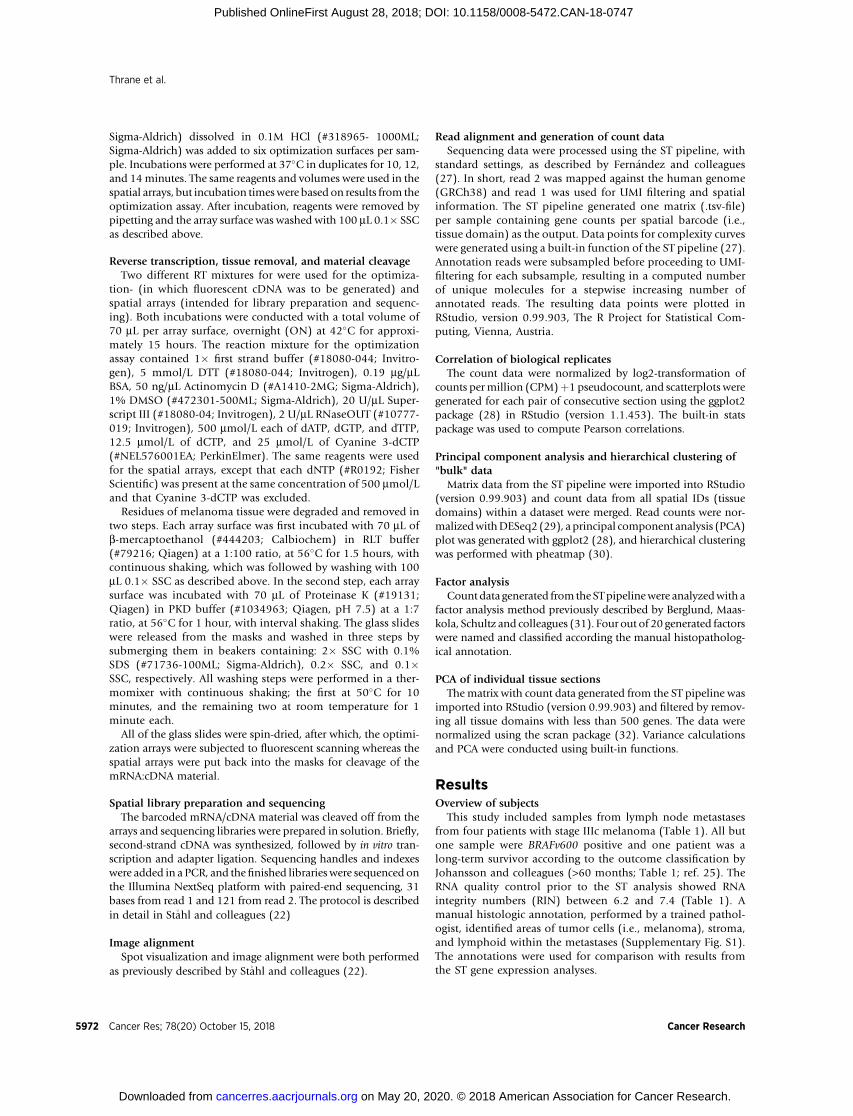
Procedure for spatial analysis of lymph node metastasesThe two-dimensional gene expression analysis provided by the
ST procedure was based on fresh frozen tissue sections from thefour tumor biopsies (denoted 1–4; Fig. 1). Briefly, the sectionswere placed on glass slides containing RT-primers arrayed as spotsthat corresponded to tissue domains comprising between 5 and40 cells. The histologic sections were stained with H&E andimaged before the cells were permeabilized and the mRNA wascaptured. The RT-primers at each spot had a unique spatial IDbarcode, which was sequenced along with the transcript to enabletrace-back to a specific tissue domain. After the release of cDNA:mRNA, library construction, and sequencing, the transcriptome-wide data were decomposed into factors (31) and the gene
expression profiles were visualized using t-distributed stochasticneighbor embedding (t-SNE; Fig. 1; ref. 33).
An optimization assay employing arrays coated with polyA-capturing RT-primers followed by RT with fluorescentlylabeled nucleotides was performed to determine the optimaltime for melanoma tissue permeabilization (SupplementaryFig. S2A and S2B).
Generating spatially resolved transcriptomic data frommelanoma lymph node metastases
Barcoded arrays were used to generate spatially resolved tran-scriptomic sequence libraries. An average of 286 tissue domainsper section were analyzed, and a total of over 2,200 domains were
Table 1. Clinical dataa
Tumor sample Gender BRAF status NRAS status CDKN2A status Survivalb RIN value
1 Male mut wt hd 10þ years 6.22 Female wt wt hd 401 days 7.13 Male mut wt wt 208 days 7.44 Male mut wt wt 305 days 6.9
NOTE: Overview of clinical and genetic data, including RNA quality (RIN value), for each of the tumor samples from patients with stage IIIc melanoma.Abbreviations: hd, hemizygous deletion; mut, mutated; wt, wild type.aAll data except for the RIN value was generated prior to this study.bOverall survival from the diagnosis of stage III melanoma.
Figure 1.
Spatial transcriptomics overview. Schematic overview of the STs technology, along with the downstream analysis. The barcoded microarrays contained1,007 printed spots of RT-primers with unique barcode sequences. Each spot had a diameter of 100 mm, thus corresponding to a tissue domain.The center-to-center distance was 200 mm.
Studying Melanoma with Spatial Transcriptomics
www.aacrjournals.org Cancer Res; 78(20) October 15, 2018 5973
on May 20, 2020. © 2018 American Association for Cancer Research. cancerres.aacrjournals.org Downloaded from
Published OnlineFirst August 28, 2018; DOI: 10.1158/0008-5472.CAN-18-0747
investigated in this study. After data processing and UMI filtering,each tissue section was represented by between 1.4 and 4.2million unique molecules (transcripts), or an average of nearly3,000 transcripts per tissue domain (Supplementary Table S3A).All libraries were sequenced at a depth close to saturation (Sup-plementary Fig. S3B). Scatterplots for each pair of biologicalreplicates and calculated Pearson correlations are included inSupplementary Fig. S3C.
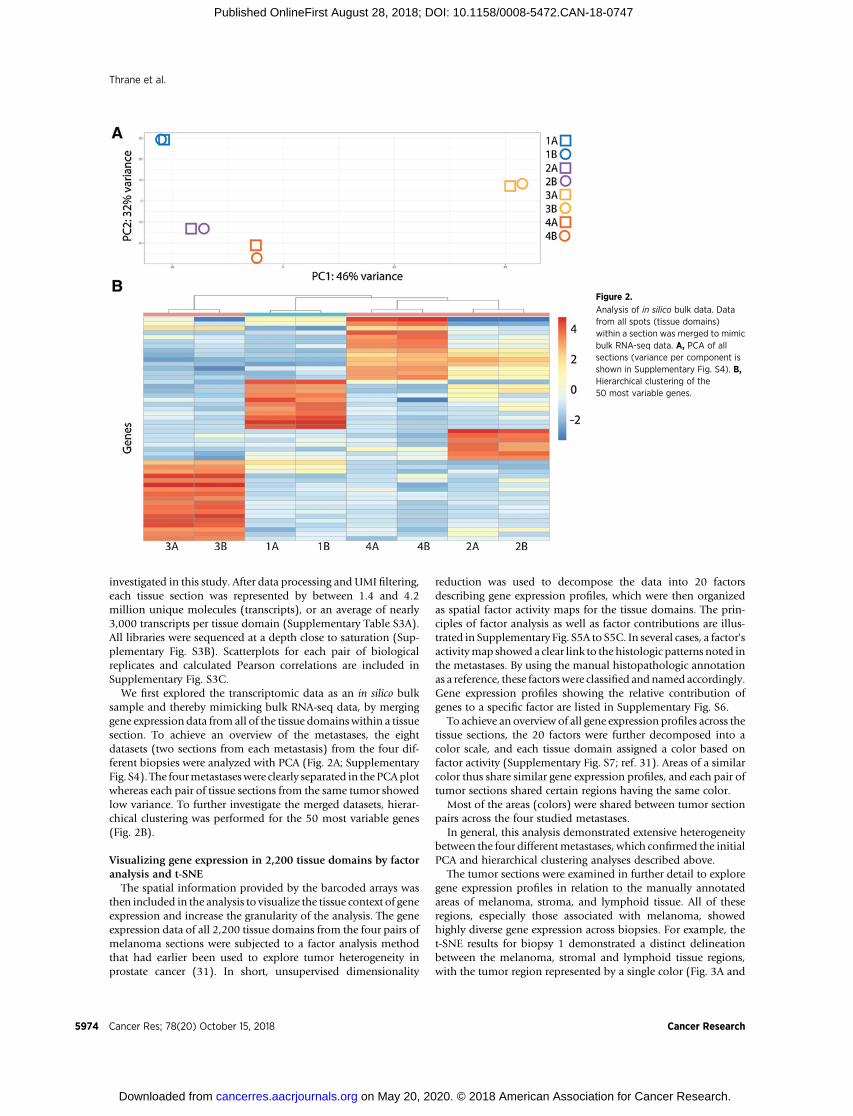
We first explored the transcriptomic data as an in silico bulksample and thereby mimicking bulk RNA-seq data, by merginggene expression data from all of the tissue domainswithin a tissuesection. To achieve an overview of the metastases, the eightdatasets (two sections from each metastasis) from the four dif-ferent biopsies were analyzed with PCA (Fig. 2A; SupplementaryFig. S4). The fourmetastaseswere clearly separated in thePCAplotwhereas each pair of tissue sections from the same tumor showedlow variance. To further investigate the merged datasets, hierar-chical clustering was performed for the 50 most variable genes(Fig. 2B).
Visualizing gene expression in 2,200 tissue domains by factoranalysis and t-SNE
The spatial information provided by the barcoded arrays wasthen included in the analysis to visualize the tissue context of geneexpression and increase the granularity of the analysis. The geneexpression data of all 2,200 tissue domains from the four pairs ofmelanoma sections were subjected to a factor analysis methodthat had earlier been used to explore tumor heterogeneity inprostate cancer (31). In short, unsupervised dimensionality
reduction was used to decompose the data into 20 factorsdescribing gene expression profiles, which were then organizedas spatial factor activity maps for the tissue domains. The prin-ciples of factor analysis as well as factor contributions are illus-trated in Supplementary Fig. S5A to S5C. In several cases, a factor'sactivitymap showed a clear link to the histologic patterns noted inthe metastases. By using the manual histopathologic annotationas a reference, these factorswere classified andnamed accordingly.Gene expression profiles showing the relative contribution ofgenes to a specific factor are listed in Supplementary Fig. S6.
To achieve an overview of all gene expression profiles across thetissue sections, the 20 factors were further decomposed into acolor scale, and each tissue domain assigned a color based onfactor activity (Supplementary Fig. S7; ref. 31). Areas of a similarcolor thus share similar gene expression profiles, and each pair oftumor sections shared certain regions having the same color.
Most of the areas (colors) were shared between tumor sectionpairs across the four studied metastases.
In general, this analysis demonstrated extensive heterogeneitybetween the four differentmetastases, which confirmed the initialPCA and hierarchical clustering analyses described above.
The tumor sections were examined in further detail to exploregene expression profiles in relation to the manually annotatedareas of melanoma, stroma, and lymphoid tissue. All of theseregions, especially those associated with melanoma, showedhighly diverse gene expression across biopsies. For example, thet-SNE results for biopsy 1 demonstrated a distinct delineationbetween the melanoma, stromal and lymphoid tissue regions,with the tumor region represented by a single color (Fig. 3A and
Figure 2.
Analysis of in silico bulk data. Datafrom all spots (tissue domains)within a section was merged to mimicbulk RNA-seq data. A, PCA of allsections (variance per component isshown in Supplementary Fig. S4). B,Hierarchical clustering of the50 most variable genes.
Thrane et al.
Cancer Res; 78(20) October 15, 2018 Cancer Research5974
on May 20, 2020. © 2018 American Association for Cancer Research. cancerres.aacrjournals.org Downloaded from
Published OnlineFirst August 28, 2018; DOI: 10.1158/0008-5472.CAN-18-0747
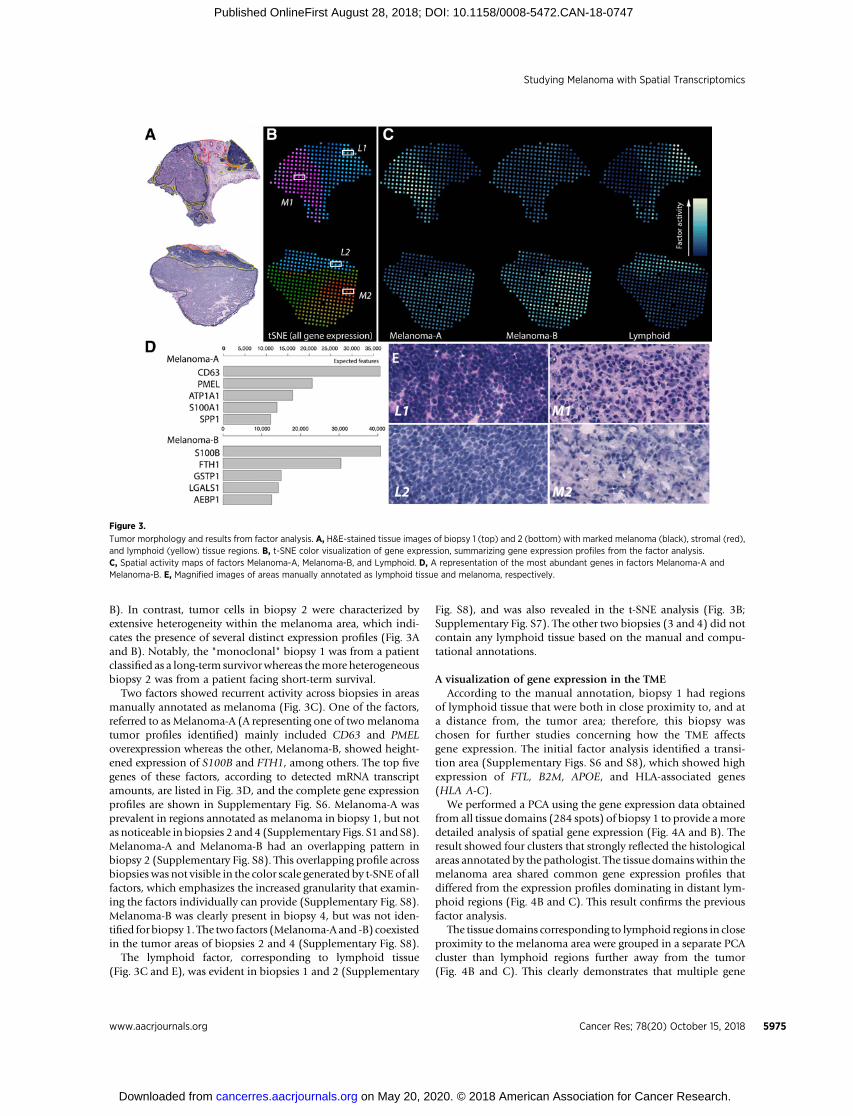
B). In contrast, tumor cells in biopsy 2 were characterized byextensive heterogeneity within the melanoma area, which indi-cates the presence of several distinct expression profiles (Fig. 3Aand B). Notably, the "monoclonal" biopsy 1 was from a patientclassified as a long-term survivorwhereas themore heterogeneousbiopsy 2 was from a patient facing short-term survival.
Two factors showed recurrent activity across biopsies in areasmanually annotated as melanoma (Fig. 3C). One of the factors,referred to as Melanoma-A (A representing one of twomelanomatumor profiles identified) mainly included CD63 and PMELoverexpression whereas the other, Melanoma-B, showed height-ened expression of S100B and FTH1, among others. The top fivegenes of these factors, according to detected mRNA transcriptamounts, are listed in Fig. 3D, and the complete gene expressionprofiles are shown in Supplementary Fig. S6. Melanoma-A wasprevalent in regions annotated as melanoma in biopsy 1, but notas noticeable in biopsies 2 and 4 (Supplementary Figs. S1 and S8).Melanoma-A and Melanoma-B had an overlapping pattern inbiopsy 2 (Supplementary Fig. S8). This overlapping profile acrossbiopsies was not visible in the color scale generated by t-SNE of allfactors, which emphasizes the increased granularity that examin-ing the factors individually can provide (Supplementary Fig. S8).Melanoma-B was clearly present in biopsy 4, but was not iden-tified for biopsy 1. The two factors (Melanoma-A and -B) coexistedin the tumor areas of biopsies 2 and 4 (Supplementary Fig. S8).
The lymphoid factor, corresponding to lymphoid tissue(Fig. 3C and E), was evident in biopsies 1 and 2 (Supplementary
Fig. S8), and was also revealed in the t-SNE analysis (Fig. 3B;Supplementary Fig. S7). The other two biopsies (3 and 4) did notcontain any lymphoid tissue based on the manual and compu-tational annotations.
A visualization of gene expression in the TMEAccording to the manual annotation, biopsy 1 had regions
of lymphoid tissue that were both in close proximity to, and ata distance from, the tumor area; therefore, this biopsy waschosen for further studies concerning how the TME affectsgene expression. The initial factor analysis identified a transi-tion area (Supplementary Figs. S6 and S8), which showed highexpression of FTL, B2M, APOE, and HLA-associated genes(HLA A-C).
We performed a PCA using the gene expression data obtainedfrom all tissue domains (284 spots) of biopsy 1 to provide amoredetailed analysis of spatial gene expression (Fig. 4A and B). Theresult showed four clusters that strongly reflected the histologicalareas annotated by the pathologist. The tissue domains within themelanoma area shared common gene expression profiles thatdiffered from the expression profiles dominating in distant lym-phoid regions (Fig. 4B and C). This result confirms the previousfactor analysis.
The tissue domains corresponding to lymphoid regions in closeproximity to the melanoma area were grouped in a separate PCAcluster than lymphoid regions further away from the tumor(Fig. 4B and C). This clearly demonstrates that multiple gene
Figure 3.
Tumor morphology and results from factor analysis. A, H&E-stained tissue images of biopsy 1 (top) and 2 (bottom) with marked melanoma (black), stromal (red),and lymphoid (yellow) tissue regions. B, t-SNE color visualization of gene expression, summarizing gene expression profiles from the factor analysis.C, Spatial activity maps of factors Melanoma-A, Melanoma-B, and Lymphoid. D, A representation of the most abundant genes in factors Melanoma-A andMelanoma-B. E, Magnified images of areas manually annotated as lymphoid tissue and melanoma, respectively.
Studying Melanoma with Spatial Transcriptomics
www.aacrjournals.org Cancer Res; 78(20) October 15, 2018 5975
on May 20, 2020. © 2018 American Association for Cancer Research. cancerres.aacrjournals.org Downloaded from
Published OnlineFirst August 28, 2018; DOI: 10.1158/0008-5472.CAN-18-0747
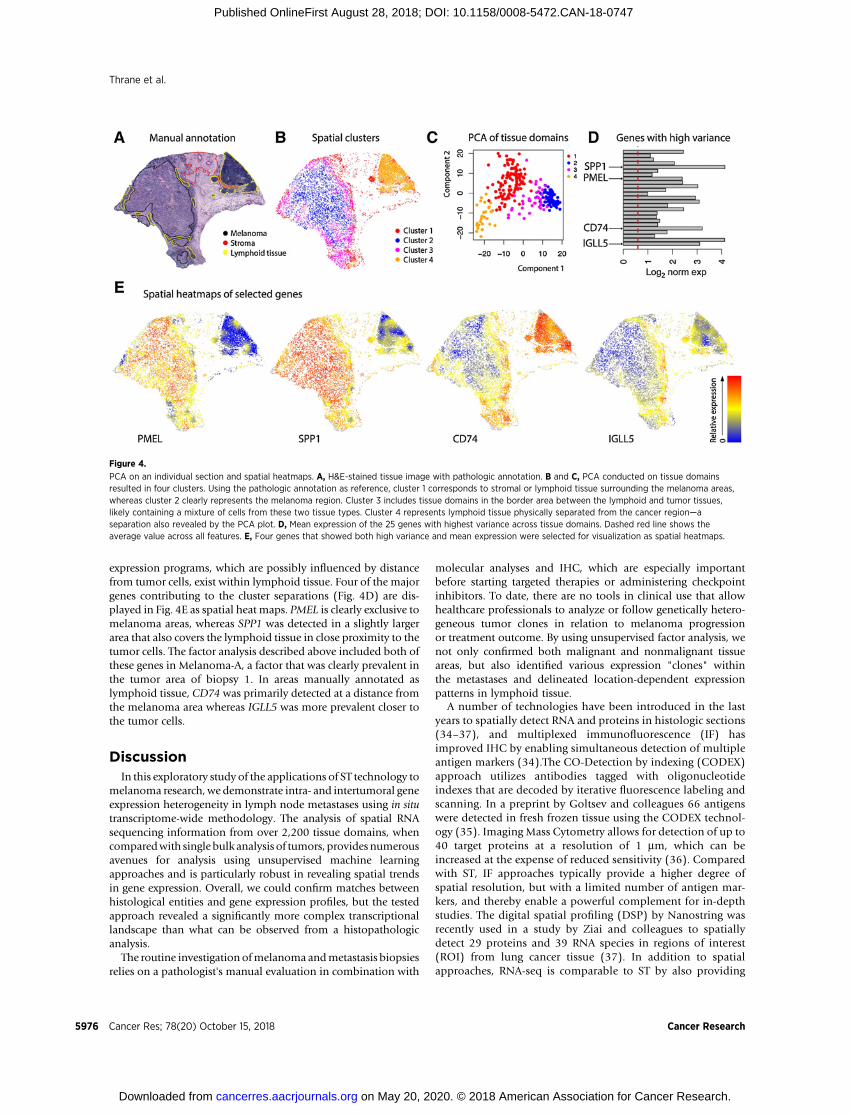
expression programs, which are possibly influenced by distancefrom tumor cells, exist within lymphoid tissue. Four of the majorgenes contributing to the cluster separations (Fig. 4D) are dis-played in Fig. 4E as spatial heat maps. PMEL is clearly exclusive tomelanoma areas, whereas SPP1 was detected in a slightly largerarea that also covers the lymphoid tissue in close proximity to thetumor cells. The factor analysis described above included both ofthese genes in Melanoma-A, a factor that was clearly prevalent inthe tumor area of biopsy 1. In areas manually annotated aslymphoid tissue, CD74 was primarily detected at a distance fromthe melanoma area whereas IGLL5 was more prevalent closer tothe tumor cells.
DiscussionIn this exploratory study of the applications of ST technology to
melanoma research, we demonstrate intra- and intertumoral geneexpression heterogeneity in lymph node metastases using in situtranscriptome-wide methodology. The analysis of spatial RNAsequencing information from over 2,200 tissue domains, whencomparedwith single bulk analysis of tumors, provides numerousavenues for analysis using unsupervised machine learningapproaches and is particularly robust in revealing spatial trendsin gene expression. Overall, we could confirm matches betweenhistological entities and gene expression profiles, but the testedapproach revealed a significantly more complex transcriptionallandscape than what can be observed from a histopathologicanalysis.
The routine investigation ofmelanoma andmetastasis biopsiesrelies on a pathologist's manual evaluation in combination with
molecular analyses and IHC, which are especially importantbefore starting targeted therapies or administering checkpointinhibitors. To date, there are no tools in clinical use that allowhealthcare professionals to analyze or follow genetically hetero-geneous tumor clones in relation to melanoma progressionor treatment outcome. By using unsupervised factor analysis, wenot only confirmed both malignant and nonmalignant tissueareas, but also identified various expression "clones" withinthe metastases and delineated location-dependent expressionpatterns in lymphoid tissue.
A number of technologies have been introduced in the lastyears to spatially detect RNA and proteins in histologic sections(34–37), and multiplexed immunofluorescence (IF) hasimproved IHC by enabling simultaneous detection of multipleantigen markers (34).The CO-Detection by indexing (CODEX)approach utilizes antibodies tagged with oligonucleotideindexes that are decoded by iterative fluorescence labeling andscanning. In a preprint by Goltsev and colleagues 66 antigenswere detected in fresh frozen tissue using the CODEX technol-ogy (35). Imaging Mass Cytometry allows for detection of up to40 target proteins at a resolution of 1 mm, which can beincreased at the expense of reduced sensitivity (36). Comparedwith ST, IF approaches typically provide a higher degree ofspatial resolution, but with a limited number of antigen mar-kers, and thereby enable a powerful complement for in-depthstudies. The digital spatial profiling (DSP) by Nanostring wasrecently used in a study by Ziai and colleagues to spatiallydetect 29 proteins and 39 RNA species in regions of interest(ROI) from lung cancer tissue (37). In addition to spatialapproaches, RNA-seq is comparable to ST by also providing
Figure 4.
PCA on an individual section and spatial heatmaps. A, H&E-stained tissue image with pathologic annotation. B and C, PCA conducted on tissue domainsresulted in four clusters. Using the pathologic annotation as reference, cluster 1 corresponds to stromal or lymphoid tissue surrounding the melanoma areas,whereas cluster 2 clearly represents the melanoma region. Cluster 3 includes tissue domains in the border area between the lymphoid and tumor tissues,likely containing a mixture of cells from these two tissue types. Cluster 4 represents lymphoid tissue physically separated from the cancer region—aseparation also revealed by the PCA plot. D, Mean expression of the 25 genes with highest variance across tissue domains. Dashed red line shows theaverage value across all features. E, Four genes that showed both high variance and mean expression were selected for visualization as spatial heatmaps.
Thrane et al.
Cancer Res; 78(20) October 15, 2018 Cancer Research5976
on May 20, 2020. © 2018 American Association for Cancer Research. cancerres.aacrjournals.org Downloaded from
Published OnlineFirst August 28, 2018; DOI: 10.1158/0008-5472.CAN-18-0747
unbiased, transcriptome-wide data. Sta�hl and colleagues (22)
evaluated the performance of ST by comparing in silico RNA-seqlibraries from spatial data with libraries prepared in solutionfrom extracted and fragmented total RNA frommouse olfactorybulb. They found 0.89% of the genes to be shared, whereas0.053%, and 0.052% were exclusive to the RNA-seq, andthe spatial library, respectively. In total nearly 18,000 geneswere detected and the two libraries showed a Pearson correla-tion of r ¼ 0.94.
Although the PCAperformedon in silicobulk samples indicatedlow variance between the two consecutive sections of each tumorsample, the spatial t-SNE (but not PCA) visualization suggestedheterogeneity, particularly in sample 4. This fact did not appear toaffect the results of the factor analysis, as we still found the samefactors being active in the two replicates, indicating quite subtledifferences between consecutive sections. The scatterplot of thebiological replicates also showed an even representation of highlyand lowly expressed genes, with a Pearson correlation of 0.86. Thereproducibility of ST has previously been evaluated on morehomogenous nontumor tissue (mouse olfactory bulb), showinga Pearson correlation r ¼ 0.97 between two consecutivesections (22).
The signatures of factors Melanoma-A and -B included bothcancer- and immune-associated genes that are most likelyactive in the tumor area. For example, CD63, which showedincreased expression in Melanoma-A, may act either as a tumorsuppressor or participate in cell signaling and aniokis resis-tance through the PI3K signaling pathway independently ofAkt phosphorylation (38). Interestingly, Biopsy 1 from a long-term survivor demonstrated a homogenous expression patternin the melanoma cell area as compared to the correspondingregion in Biopsy 2 from a short-term survivor. This couldrepresent a picture of tumor clonal heterogeneity but it mayalso be related to phenotypic switching, which occurs inmelanoma through epithelial–mesenchymal transition (EMT;ref. 39). Many pathways play a role in EMT, including RAS/RAF/MEK/ERK, PI3K/AKT/mTOR, Wnt/b-catenin as well asdownstream effectors of these pathways, which induce EMTexpression transcription factors. For example, among the geneexpression profiles in our report showing a large contributionof genes related to a specific factor, RTK-genes, such as ERBB3,were represented. Phenotypic switching is critical in melanomathrough melanocyte lineage differentiation during tumor pro-gression and in response to treatment, for example, BRAF- andMEK-inhibiting therapy (40, 41). The ST technology may beapplied to guide microdissection of defined sections to addressthis in future.
The gene expression profile of the lymphoid factor involvedHLA genes and CD74, the latter of which has been shown to beassociated with favorable recurrence-free survival and overallsurvival in stage III melanoma (42). The expression of HLA genesis essential for immune-mediated regression of metastases, withcertain HLA variants causing resistance to immune therapy(43–44). There may thus be a link between HLA genotype andthe immunoediting of oncogenes and tumor suppressors (45).IFNg or TIS signatures describedbyAyers and colleagues (46)werenot found in the factor analysis. As indicated by the manualpathologic annotation, lymphoid areas were only present in twoof the metastases. Therefore, a possible explanation is that T cellactivation is present in too few of the 2,200 tissue domains for thesignature to represent one of the 20 factors generated in our
analyses. However, when examining the signature genes in thespatial data of oneof the tumorswith lymphoid tissue, the IFNg orTIS signatures were expressed particularly within the transitionarea described below (count matrixes for exploring genes / genesignatures of interest are available at http://www.spatialtranscriptomicsresearch.org/).
The expression of HLA genes was also found in the factor weclassified as the transition area, which corresponds to regionsbetween the melanoma and lymphoid areas that could notbe manually defined. Further examination of this transitionarea could provide more information regarding tumor hetero-geneity and resistance mechanisms in melanoma. Tiroshand colleagues (13) analyzed the transcriptional heterogeneityin melanoma, including lymph node metastases, by scRNA-seq,and concluded that the TME is shaped by spatial, functional,and genomic heterogeneity of melanoma as well as the asso-ciated tumor components. They also found that genesexpressed by cancer-associated fibroblasts seem to affect theproportion of T-cells in the melanoma lymph node metastases.We can only speculate about whether the genetically definedtransition areas in the TME identified through our approachhost cancer-derived factors that interact with immune cellssimilarly as what has been described for stromal-derived cellsin melanoma and situations of immune cell abundance. In thepresent report, the most abundantly expressed genes in thetransition area were FTL, B2M, APOE and HLA-associated genes(HLA A-C). These genes have been linked with tumor growthregulation through the GADD45/JNK pathway in other cancerssuch as in glioblastomas (FTL; ref. 47), along with loss ofimmunogenicity and acquired resistance to PD-1 blockade inpatients with melanoma through defects in the pathwaysinvolved in interferon-receptor signaling, such as B2M, and inantigen presentation (43, 44, 48).
For validation, we performed a joint analysis of our data and apublic available dataset from Tirosh and colleagues (13). Insummary, the single-cell RNA-seq data confirmed the extensiveheterogeneity across patients that was also found in the spatialdata. Interestingly however, patient-specific signatures from thesingle-cell data could be detected in specific regions of themetastases.
Our findings that cell–cell interactions in the TME maysupport tumor progression and influence therapy responsewarranted further analyses. We therefore performed individualanalyses of tissue sections to visualize the TME using principlecomponent analysis. This approach identified multiple geneexpression programs in lymphoid tissue that might dependon distance from the tumor cell clusters. Notably, genes such asPMEL and SPP1 were overexpressed in the tumor cell clusterwhereas lymphoid tissue regions far away from, and in closeproximity to, the tumor cell areas were characterized by expres-sion of the immune-related genes CD74 and IGLL5, respective-ly. The transition area could only be clearly identified in oneout of the four tumors analyzed in this study and more sampleswould be required for a deeper understanding of the TME inthis region.
In conclusion, the spatial information added to transcriptomicanalyses has revealed amore detailed portrait of the heterogeneityamong melanoma metastases. The presented results shouldmotivate researchers to integrate the spatial component intoanalyses of the multiple factors underlying tumor progressionand therapy outcome.
Studying Melanoma with Spatial Transcriptomics
www.aacrjournals.org Cancer Res; 78(20) October 15, 2018 5977
on May 20, 2020. © 2018 American Association for Cancer Research. cancerres.aacrjournals.org Downloaded from
Published OnlineFirst August 28, 2018; DOI: 10.1158/0008-5472.CAN-18-0747
Disclosure of Potential Conflicts of InterestJ. Lundeberg is a member of the board for Spatial Transcriptomics AB;
has ownership interest (including stock, patents, etc.) in Spatial Tran-scriptomics AB. No potential conflicts of interest were disclosed by theother authors.
Authors' ContributionsConception and design: K. Thrane, H. Eriksson, J. LundebergDevelopment of methodology: K. Thrane,Acquisition of data (provided animals, acquired and managed patients,provided facilities, etc.): H. Eriksson, J. HanssonAnalysis and interpretation of data (e.g., statistical analysis, biostatistics,computational analysis): K. Thrane, H. Eriksson, J. Maaskola, J. HanssonWriting, review, and/or revision of the manuscript: K. Thrane, H. Eriksson,J. Hansson, J. LundebergAdministrative, technical, or material support (i.e., reporting or organizingdata, constructing databases): K. Thrane, H. ErikssonStudy supervision: J. Hansson, J. Lundeberg
AcknowledgmentsWe acknowledge help from the National Genomics Infrastructure (NGI)
Stockholm and SciLifeLab in providing infrastructural support and from LudvigLarsson and Konstantin Carlberg in bioinformatics support. We also thank allpatients for participating.
This work was supported by Stockholm County Council - Health, Medicineand Technology (grant nos. 20130751, 20160852), Knut and Alice WallenbergFoundation (grant no. 2015.0296), the Swedish Cancer Society (grant no.CAN2014-424), the Swedish Research Council (grant no. 621-2014-5629), theSwedish Society for Medical Research (grant no. 160502), Cancer ResearchFoundations of Radiumhemmet (grant no. 161052), Swedish Society of Med-icine (grant no. 6844391), Alex andEvaWallstr€omFoundation (grant no. 2018-00222), and the KI funds (grant no. 2016fobi50190).
The costs of publication of this articlewere defrayed inpart by the payment ofpage charges. This article must therefore be hereby marked advertisement inaccordance with 18 U.S.C. Section 1734 solely to indicate this fact.
Received March 16, 2018; revised July 3, 2018; accepted August 23, 2018;published first August 28, 2018.
References1. Betensky RA, Louis DN, Cairncross JG. Influence of unrecognized molec-
ular heterogeneity on randomized clinical trials. J Clin Oncol 2002;20:2495–9.
2. MeachamCE,Morrison SJ. Tumour heterogeneity and cancer cell plasticity.Nature 2013;501:328–37.
3. Vogelstein B, PapadopoulosN,VelculescuVE, ZhouS,Diaz LA, Kinzler KW.Cancer genome landscapes. Science 2013;339:1546–58.
4. Hodis E, Watson IR, Kryukov GV, Arold ST, Imielinski M, Theurillat JP,et al. A landscape of driver mutations in melanoma. Cell 2012;150:251–63.
5. Curtin JA, Fridlyand J, Kageshita T, Patel HN, Busam KJ, Kutzner H, et al.Distinct sets of genetic alterations in melanoma. N Engl J Med 2005;353:2135–47.
6. Merlo LMF, Pepper JW, Reid BJ, Maley CC. Cancer as an evolutionary andecological process. Nat Rev Cancer 2006;6:924–35.
7. Klein CA. Selection and adaptation during metastatic cancer progression.Nature 2013;501:365–72.
8. Shain AH, Yeh I, Kovalyshyn I, Sriharan A, Talevich E, Gagnon A, et al. Thegenetic evolution of melanoma from precursor lesions. N Engl J Med2015;373:1926–36.
9. Gerlinger M, Rowan AJ, Horswell S, Larkin J, Endesfelder D, Gronroos E,et al. Intratumor heterogeneity and branched evolution revealed by multi-region sequencing. N Engl J Med 2012;366:883–92.
10. Katona TM, Jones TD, Wang M, Eble JN, Billings SD, Cheng L. Geneticallyheterogeneous and clonally unrelatedmetastasesmay arise in patientswithcutaneous melanoma. Am J Surg Pathol 2007;31:1029–37.
11. Harbst K, Staaf J, Ma�sb€ack A, Olsson H, Ingvar C, Vallon-Christersson J,
et al. Multiple metastases from cutaneous malignant melanoma patientsmay display heterogeneous genomic and epigenomic patterns. MelanomaRes 2010;20:381–91.
12. YancovitzM, Litterman A, Yoon J, Ng E, Shapiro RL, Berman RS, et al. Intra-and inter-tumor heterogeneity of BRAF(V600E))mutations in primary andmetastatic melanoma. PLoS One 2012;7:e29336.
13. Tirosh I, Izar B, Prakadan SM,WadsworthMH, TreacyD, Trombetta JJ, et al.Dissecting the multicellular ecosystem of metastatic melanoma by single-cell RNA-seq. Science 2016;352:189–96.
14. Balch CM, Gershenwald JE, Soong SJ, Thompson JF, Atkins MB, Byrd DR,et al. Final version of 2009 AJCC melanoma staging and classification.J Clin Oncol 2009;27:6199–206.
15. Middleton MR, Grob JJ, Aaronson N, Fierlbeck G, Tilgen W, Seiter S, et al.Randomized phase III study of temozolomide versus dacarbazine in thetreatment of patients with advanced metastatic malignant melanoma.J Clin Oncol 2000;18:158–66.
16. Long GV, Stroyakovskiy D, Gogas H, Levchenko E, De Braud F, Larkin J,et al. Dabrafenib and trametinib versus dabrafenib and placebo for Val600BRAF-mutant melanoma: a multicentre, double-blind, phase 3 rando-mised controlled trial. Lancet 2015;386:444–51.
17. Zand S, Buzney E, Duncan LM, Dadras SS. Heterogeneity of metastaticmelanoma. Am J Clin Pathol 2016;146:353–60.
18. Harbst K, LaussM, Cirenajwis H, Isaksson K, Rosengren F, T€orngren T, et al.Multiregion whole-exome sequencing uncovers the genetic evolution andmutational heterogeneity of early-stage metastatic melanoma. Cancer Res2016;76:4765–74.
19. Sabatino M, Zhao Y, Voiculescu S, Monaco A, Robbins P, Karai L, et al.Conservation of genetic alterations in recurrent melanoma supports themelanoma stem cell hypothesis. Cancer Res 2008;68:122–31.
20. TakataM,MoritaR,TakeharaK.Clonalheterogeneity insporadicmelanomasas revealed by loss-of- heterozygosity analysis. Int J Cancer 2000;85:492–7.
21. Eriksson H, Zebary A, Vassilaki I, Omholt K, Ghaderi M, Hansson J.BRAFV600E protein expression in primary cutaneous malignant melano-mas and paired metastases. JAMA Dermatol 2015;151:410–6.
22. Stahl PL, Salmen F, Vickovic S, Lundmark A, Navarro JF, Magnusson J, et al.Visualization and analysis of gene expression in tissue sections by spatialtranscriptomics. Science 2016;353:78–82.
23. Edlundh-Rose E, Egyh�azi S, Omholt K, Ma�nsson-Brahme E, Platz A,
Hansson J, et al. NRAS and BRAF mutations in melanoma tumours inrelation to clinical characteristics: a study based on mutation screening bypyrosequencing. Melanoma Res 2006;16:471–8.
24. Grafstr€om E, Egyh�azi S, Ringborg U, Hansson J, Platz A. Biallelic deletionsin INK4 in cutaneous melanoma are common and associated withdecreased survival. Clin Cancer Res 2005;11:2991–7.
25. Johansson CC, Egyh�azi S, Masucci G, Harlin H,MougiakakosD, Poschke I,et al. Prognostic significance of tumor iNOS and COX-2 in stage IIImalignant cutaneous melanoma. Cancer Immunol Immunother 2009;58:1085–94.
26. Balch CM, Buzaid AC, Soong SJ, Atkins MB, Cascinelli N, Coit DG, et al.Final version of the American Joint Committee on Cancer staging systemfor cutaneous melanoma. J Clin Oncol 2001;19:3635–48.
27. Navarro JF, Sj€ostrand J, Salm�en F, Lundeberg J, Sta�hl PL. ST Pipeline: an
automated pipeline for spatial mapping of unique transcripts. Bioinfor-matics 2017;33:2591–3.
28. Wickham H. ggplot: Elegant graphics for data analysis. New York, NY:Springer Verlag; 2009.
29. Love MI, Anders S, Huber W. Moderated estimation of fold changeand dispersion for RNA-seq data with DESeq2. Genome Biol 2014;15:550. doi: 10.1186/s13059-014-0550-8.
30. Kolde R. Package 'pheatmap'. Bioconductor 2012;1–6.31. Berglund E, Maaskola J, Schultz N, Marklund M, Friedrich S, Bergenstra
�hle
J, et al. Spatialmaps of prostate cancer transcriptomes reveal an unexploredlandscape of heterogeneity. Nat Commun 2018;9:2419. doi: 10.1038/s41467-018-04724-5.
32. Lun ATL, McCarthy DJ, Marioni JC. A step-by-step workflow for low-levelanalysis of single-cell RNA-seq data with Bioconductor. F1000Research2016;5:2122. doi: 10.12688/f100research.9501.2.
Cancer Res; 78(20) October 15, 2018 Cancer Research5978
Thrane et al.
on May 20, 2020. © 2018 American Association for Cancer Research. cancerres.aacrjournals.org Downloaded from
Published OnlineFirst August 28, 2018; DOI: 10.1158/0008-5472.CAN-18-0747
33. Van Der Maaten L, Hinton G. Visualizing data using t-SNE. J Mach LearnRes 2008;620:267–84.
34. Parra ER.Novel platformsofmultiplexed immunofluorescence for study ofparaffin tumor tissues. J Cancer Treat Diagnosis 2018;2:42–53.
35. Goltsev Y, SamusikN, Kennedy-Darling J, Bhate S,HaleM,VasquezG, et al.Deep profiling of mouse splenic architecture with CODEX multiplexedimaging. bioRxiv 2018; doi: https://doi.org/10.1101/203166.
36. Chang Q, Ornatsky OI, Siddiqui I, Loboda A, Baranov VI, Hedley DW.Imaging mass cytometry. Cytometry A 2017;91:160–9.
37. Ziai J, Caplazi P, Decalf J, Liang Y, de Almeida P, Zollinger D, et al. Highlymultiplexed analysis of immune cell subsets in non-small cell lung cancer:validation of protein and RNA analysis by the Nanostring Digital SpatialProfiling (DSP) platform. Proc Am Assoc Ca Res 2018;59poster #2089.
38. Radford KJ, Mallesch J, Mersey P. Suppression of human melanoma cellgrowth and metastasis by the melanomaassociated antigen CD63(ME491). Int J Cancer 1995;62:631–5.
39. Li FZ, Dhillon AS, Anderson RL, McArthur G, Ferrao PT. Phenotypeswitching in melanoma: implications for progression and therapy. FrontOncol 2015;5:31. doi: 10.3389/fonc.201500031.
40. Kemper K, De Goeje PL, Peeper DS, Van Amerongen R. Phenotype switch-ing: Tumor cell plasticity as a resistance mechanism and target for therapy.Cancer Res 2014;74:5937–41.
41. Konieczkowski DJ, Johannessen CM, Abudayyeh O, Kim JW, Cooper ZA,Piris A, et al. A melanoma cell state distinction influences sensitivity toMAPK pathway inhibitors. Cancer Discov 2014;4:816–27.
42. Ekmekcioglu S,DaviesMA, Tanese K, Roszik J, Shin-SimM,Bassett RL, et al.Inflammatory marker testing identifies CD74 expression in melanomatumor cells, and its expressionassociateswith favorable survival for stage IIImelanoma. Clin Cancer Res 2016;22:3016–24.
43. Budczies J, Bockmayr M, Klauschen F, Endris V, Fr€ohling S, SchirmacherP, et al. Mutation patterns in genes encoding interferon signaling andantigen presentation: a pan-cancer survey with implications for the useof immune checkpoint inhibitors. Genes Chromosom Cancer 2017;56:651–9.
44. Zaretsky JM, Garcia-Diaz A, Shin DS, Escuin-Ordinas H, Hugo W, Hu-Lieskovan S, et al. Mutations associated with acquired resistance to PD-1blockade in melanoma. N Engl J Med 2016;375:819–29.
45. Marty R, Kaabinejadian S, Rossell D, Slifker MJ, van de Haar J, Engin HB,et al. MHC-I genotype restricts the oncogenic mutational landscape. Cell2017;171:1272–83.
46. Ayers M, Lunceford J, Nebozhyn M, Murphy E, Loboda A, Kaufman DR,et al. IFN-g-related mRNA profile predicts clinical response to PD-1blockade. J Clin Invest 2017;127:2930–40.
47. Wu T, Li Y, Liu B, Zhang S, Wu L, Zhu X, et al. Expression of ferritin lightchain (FTL) is elevated in glioblastoma, and FTL silencing inhibits glio-blastoma cell proliferation via the GADD45/JNK pathway. PLoS One2016;11:e0149361.
48. Sucker A, Zhao F, Real B, Heeke C, Bielefeld N, Maßen S, et al. Geneticevolution of T-cell resistance in the course of melanoma progression. ClinCancer Res 2014;20:6593–604.
www.aacrjournals.org Cancer Res; 78(20) October 15, 2018 5979
Studying Melanoma with Spatial Transcriptomics
on May 20, 2020. © 2018 American Association for Cancer Research. cancerres.aacrjournals.org Downloaded from
Published OnlineFirst August 28, 2018; DOI: 10.1158/0008-5472.CAN-18-0747
2018;78:5970-5979. Published OnlineFirst August 28, 2018.Cancer Res Kim Thrane, Hanna Eriksson, Jonas Maaskola, et al. Heterogeneity in Stage III Cutaneous Malignant MelanomaSpatially Resolved Transcriptomics Enables Dissection of Genetic
Updated version
10.1158/0008-5472.CAN-18-0747doi:
Access the most recent version of this article at:
Material
Supplementary
http://cancerres.aacrjournals.org/content/suppl/2018/08/28/0008-5472.CAN-18-0747.DC1
Access the most recent supplemental material at:
Cited articles
http://cancerres.aacrjournals.org/content/78/20/5970.full#ref-list-1
This article cites 44 articles, 14 of which you can access for free at:
Citing articles
http://cancerres.aacrjournals.org/content/78/20/5970.full#related-urls
This article has been cited by 5 HighWire-hosted articles. Access the articles at:
E-mail alerts related to this article or journal.Sign up to receive free email-alerts
Subscriptions
Reprints and
To order reprints of this article or to subscribe to the journal, contact the AACR Publications Department at
Permissions
Rightslink site. Click on "Request Permissions" which will take you to the Copyright Clearance Center's (CCC)
.http://cancerres.aacrjournals.org/content/78/20/5970To request permission to re-use all or part of this article, use this link
on May 20, 2020. © 2018 American Association for Cancer Research. cancerres.aacrjournals.org Downloaded from
Published OnlineFirst August 28, 2018; DOI: 10.1158/0008-5472.CAN-18-0747