Embed Size (px)
Citation preview
GEOGRAFIA, Rio Claro, v. 40, Número Especial, p. 131-143, ago. 2015.
SPATIOTEMPORAL VARIABILITY OF EVAPOTRANSPIRATIONIN PANTANAL, BRAZIL, USING SATELLITE IMAGES
Janice Freitas LEIVAS1
Antônio Heriberto de Castro TEIXEIRA1
Ricardo Guimarães ANDRADE1
Daniel de Castro VICTORIA1
Fabio Enrique TORRESAN1
Abstract
Despite the importance of evapotranspiration (ET) for the Pantanal, there are fewstudies about it. In this study we aim to estimate evapotranspiration in Pantanal byapplying a spectral-agrometeorological model SAFER (Simple Algorithm for RetrievingEvapotranspiration) using satellite images and data from meteorological stations toanalyze spatiotemporal variability of ET biome´s. We used 46 images taken by MODIS(Moderate Resolution Imaging Spectroradiometer) satellite, with a 250 m spatial resolutionand a 16-day resolution time, covering rainy (October 2011 to March 2012) and dry(April to September 2012) periods. The SAFER model was effective to estimate ET largescale for rainy and dry season and was sensitive to variations observed in the land useclass as well as the relation with the air temperature, solar radiation and rainfall. Thehighest values of ET were observed in the rainy season, due to the higher availability ofwater because of rainfall and higher incidence of solar radiation, and the smaller ETvalues were observed in the dry season.
Keywords: Remote sensing. MODIS. Evapotranspiration. Pantanal. Solarradiation.
Resumo
Variabilidade espaço-temporal da evapotranspiração no Pantanal,Brasil, utilizando imagens de satélite
Apesar da importância da evapotranspiração (ET) para o Pantanal, existem poucosestudos sobre o tema. Este estudo tem o objetivo de estimar a evapotranspiração noPantanal aplicando o modelo agrometeorológico-espectral SAFER (Simple Algorithm ForEvapotranspiration Retrieving) e utilizando imagens de satélite e dados de estaçõesmeteorológicas para analisar a variabilidade espaçotemporal dessa variável no bioma.Foram utilizadas 46 imagens do satélite MODIS (Moderate Resolution ImagingSpectroradiometer), com resolução espacial de 250 m e temporal de 16 dias, referentesaos períodos chuvoso (outubro de 2011 a março de 2012) e seco (abril a setembro de2012). Os dados meteorológicos foram agrupados em 16 dias para coincidir com aresolução temporal das imagens. O modelo SAFER foi eficaz para estimar a ET em largaescala, tanto para o período chuvoso quanto para o seco, e foi sensível às variaçõesobservadas entre as classes de uso e cobertura das terras, assim como à relação coma temperatura do ar, radiação solar global e precipitação. Os maiores valores de ETforam observados na estação chuvosa, em decorrência da maior disponibilidade deágua em razão da precipitação e da maior incidência de radiação solar, e os menoresvalores de ET foram observados na estação seca.
Palavras-chave: Sensoriamento remoto. MODIS. Evapotranspiração. Pantanal.Radiação solar.
1 Embrapa Satellite Monitoring Researcher �CNPM. Av. Soldado Passarinho, 303 - 13070-115 -Campinas - SP, Brasil. E-mails: {janice.leivas, heriberto.teixeira, ricardo.andrade, daniel.victoria,fabio.torresan}@embrapa.br
132 GEOGRAFIASpatiotemporal variability of evapotranspiration in
Pantanal, Brazil, using satellite images
INTRODUCTION
Since the 1970s, the Pantanal biome has been changing, especially in relationto evapotranspiration (ET), with its decrease due to the removal of natural vegetation(Grizio-orita and Souza Filho, 2014). Evapotranspiration is one of the most importantvariables in the hydrological cycle, making the link among energy, water availabilityand climate. The change of land use and its cover generates impacts on biosphere/atmosphere interaction, affecting essential climatic variables, such as ET.Evapotranspiration is controlled by atmospheric evaporative demand and the terrestrialsurface, which physiologically and aerodynamically regulates evapotranspiration throughfeatures such as stomata activity and canopy rugosity (MATSUMOTO et al., 2008). Inagriculture, quantitative information of evapotranspiration is of great importance forthe severity assessment, distribution and frequency of drought periods, as well as forthe elaboration of projects and management of irrigation and drainage systems (HENRY;DANTAS, 2007).
The Pantanal biome is the largest tropical humid area of the planet, in whichseasonal flooding occurs by Paraguay River and its tributaries (ABDON, 2004). Thisbiome is characterized by a cycle of dry and flood periods (flood pulse), with anannual flood cycle which covers about 30% of its territory (ANDRADE et al., 2012). Ingeneral, the flood regime influences the main biotic and abiotic processes, and specificlandscape units (ADAMI et al., 2008). In the dry period, for instance, several areasseasonally flooded are used for beef cattle grazing and reproduction (ABDON et al.,2007).
The high evaporative demand of dry and flood periods during most of the year(about four months) makes the Pantanal a highly dynamic environment in relation towater vapor transfer to the atmosphere. The Pantanal has fundamental importance inrainfall recycling through evapotranspiration, being essential for the understanding ofthe broad effects of land use change and forest conversion on Cerrado (savanna)areas, and probably on the Amazon region (LATHUILLIÈRE et al., 2012).
Despite the ET importance, there are few studies on the subject in the Pantanal.Due to extension, water regime and great spatiotemporal variability, satellite imagesare very important for the biome monitoring. Andrade et al. (2010) emphasize thatremote sensing techniques have been efficiently applied because they allow estimatingET of large areas without having to quantify other hydrological processes. Models likeSEBAL (Surface Energy Balance Algorithm for Land), proposed by Bastiaanssen et al.(1998a, 1998b); METRIC (Mapping Evapotranspiration at High Resolution withInternalized Calibration), proposed by Allen et al. (2007a, 2007b), and SAFER (SimpleAlgorithm for Evapotranspiration Retrieving), proposed by Teixeira (2013) have beenimplemented for spatiotemporal assessments of surface biophysical parameters.
In this study, ET estimates were conducted based on satellite images andmeteorological data, through the application of the spectral-agrometeorological modelSAFER. This algorithm has the advantage of not needing a thermal band and thepossibility of application with data from different types of stations (agrometeorological,conventional and automatic), an important feature for the historical trends evaluationof the elements of the energy balance and productivity of large-scale water over theyears, given that automatic sensors are relatively recent advances in instrumentaltechnology (TEIXEIRA et al., 2013b).
The aim of this study is to estimate the evapotranspiration in the Pantanalbiome by applying SAFER algorithm and using MODIS images and data from weatherstations, with the purpose to analyze the spatiotemporal variability of that variable inthe Pantanal.
133
Leivas, J. F. / Teixeira, A. H. de C. /Andrade, R. G. / Victoria, D. de C. /
Torresan, F. E.v. 40, Número Especial ago. 2015
MATERIAL AND METHODS
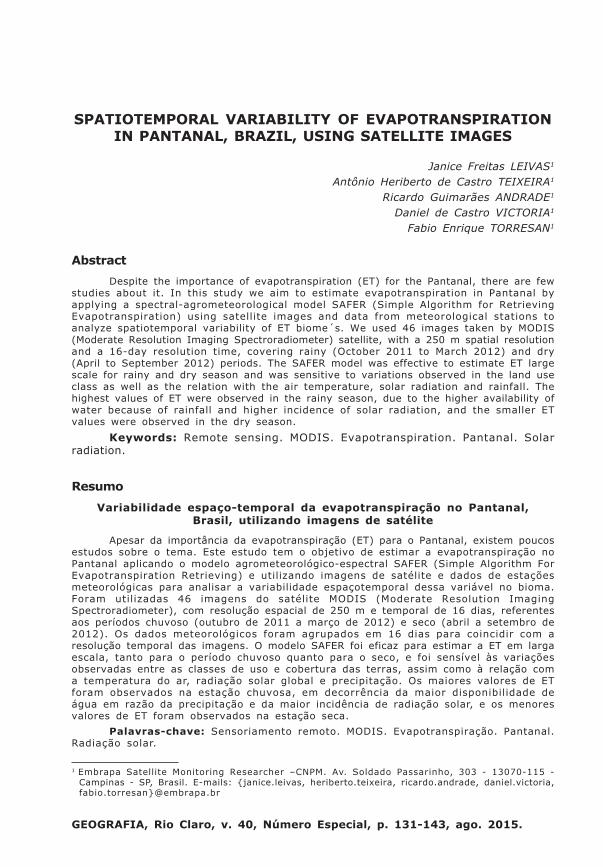
The study area is the Pantanal biome (Figure 1), which encompasses MatoGrosso and Mato Grosso do Sul states. The Pantanal has an area of 150,355 km2
(ABDON et al., 2007) and suffers the biogeographical influence of nearby biomes,such as the Cerrado (East), the Amazon (North), and the Chaco (Southwest). Theclimate of the region is classified, according to Köppen, as Aw, hot sub-humid tropicalclimate, with rainy season in summer and drought in winter, with an average annualrainfall of 1200 mm. The rainy season extends from October to March, and the dryperiod is between April and September, which has the lowest precipitation betweenJuly and August (ZAVATTINI, 2009). The soil can also be considered a criterion ofdelimitation for the Pantanal, as well as the land relief, flood regime and vegetation(VILA DA SILVA, 1998).
In this study we analyzed the influence of seasonality on the ET estimateflood during the rainy season (October 2011 to March 2012) and the dry period (Aprilto September 2012). Daily data of air temperature, solar radiation and precipitationobtained during the period from the Julian Day (JD) 273/2011 to 257/2012, providedby the Meteorological database for training and research (Banco de DadosMeteorológicos para Ensino e Pesquisa - BDMEP) of the National Institute of Meteorology(INMET, Brazil). The data collected during 16 days were grouped together to coincidewith the MODIS sensor temporal resolution. The Penmann-Monteith method was appliedfor estimating evapotranspiration through data from surface weather stations. Inaddition, MODIS/Earth sensor images were used (October 2011 to September 2012).
Figure 1 - Location of the Pantanal biome with classes of land use and cover(Probio), 1: 250,000 scale. Agriculture (Ac), water (Água), planted pasture(Ap), seasonal decidual forest (C), semi-decidual seasonal forest (F),anthropogenic areas (OA), pioneer formations (P), Savanna/Cerrado (S),steppic savanna/Chaco (T), secondary vegetation (Vs) and vegetationrefuges (r). Source: Adapted from Andrade et al., 2012
134 GEOGRAFIASpatiotemporal variability of evapotranspiration in
Pantanal, Brazil, using satellite images
For the evaluation of surface ET estimation, according to the classes of land useand cover of the Pantanal Biome, the Project for the Conservation and SustainableUse of Brazilian Biological Diversity (Probio) was used, according to a survey and amapping of the remnant vegetation of the Pantanal Biome (in 2002) on the 1: 250,000scale (EMBRAPA, 2004).
For the ET estimation, 46 MODIS images were obtained (which are available onthe website: http://edcimswww.cr.usgs.gov/pub/imswelcome/). The images refer totiles H12V10 and H12V11 of the years 2011/2012 along with data from weather stationsprovided by INMET. In SAFER, the surface albedo (α0) was estimated from the MODISbands 1 and 2 with 250 m spatial resolution:
α0 = a + bα1 + cα2
where α1 and α2 are reflectance at spectral bands of the MODIS sensor bands 1 and 2,and a, b and c are regression coefficients which feature, respectively, 0.08, 0.41 and0.14 (Teixeira et al., 2014). The surface temperature (ST) was estimated by the residuein the daily radiation balance (TEIXEIRA et al., 2014b):
where RG and Ta are, respectively, the daily values of global solar radiation and airaverage temperature measures on agrometeorological stations; RN is the balance ofdaily radiation; εS and εA are respectively the emissivity of the surface and atmosphere;
and σ is the Stefan-Boltzmann constant (5.67 x 10⁻⁸ W m-2 K-4).
εS and εA were calculated as follows (Teixeira, 2010; Teixeira et al., 2014):
εS = aS 1n NDVI +bS
where τ is the atmospheric transmissivity calculated as the RG ratio of radiation incidentat the top of the atmosphere; NDVI is the Normalized Difference Vegetation Index;and aS, bS, aA and bA are regression coefficients: 0.06, 1.00, 0.94 and 0.10, accordingto Tahir (2010) and Teixeira et al. (2014a).
The Rn was obtained by the daily values of the number of shortwave radiationthrough the Slob�s equation (Teixeira et al., 2013, 2014a):
Rn = (1- α0)RG - aL τ
where the regression coefficient aL was spatially distributed according to its relationshipwith air temperature (Teixeira et al., 2013; 2014a):
aL = aTTa � bT
in which the values adopted (6.99 and 29.93) for aT and bT regression coefficientswere Teixeira�s. (2014a).
135
Leivas, J. F. / Teixeira, A. H. de C. /Andrade, R. G. / Victoria, D. de C. /
Torresan, F. E.v. 40, Número Especial ago. 2015
The ET was obtained with the spectral agro-meteorological model-SAFER and itwas transformed into latent heat flux (λE) (TEIXEIRA et al., 2013, 2014a,b):
where the original coefficients as and bs (1.9 and -0.008) were used, but with a correctionfactor ET0year/5, in which ET0year is the annual reference ET int 2012 of the meteorologicalstations in the Pantanal and 5 is the ET0 annual value of the region where the modelwas developed.
For the results analysis of the model used to obtain ET, the Probio project classesof land use and cover were used (Embrapa, 2004). Due to the high number of classesin the caption, they were grouped according to Victoria et al. (2009). To subsidize theresults, meteorological stations data from Corumbá (19° 00� S latitude; 57° 64� Wlongitude) and Aquidauana (20° 48� S latitude; 55° 78� W longitude), in Mato Grossodo Sul state (MS), were analyzed. The data were grouped according to averages (airtemperature, solar radiation) and sum (pluvial precipitation) for 16 days, in order tocoincide with the date of acquisition of images throughout the study period. With theweather stations data, evapotranspiration was estimate by the Penman-Monteithmethod proposed in FAO-56 Bulletin (ALLEN et al., 1998).
RESULTS AND DISCUSSION
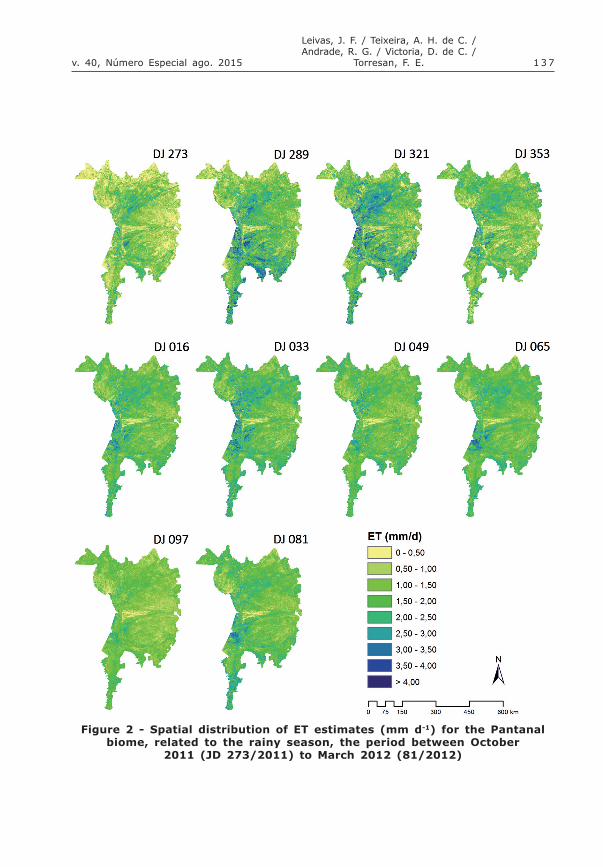
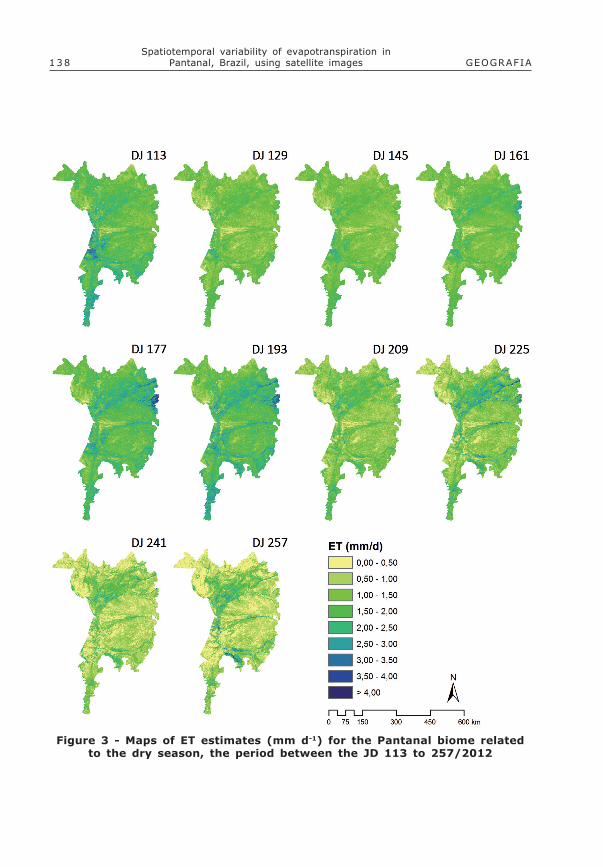
Analyzing the estimated ET spatial distribution, through spectral-agrometeorological model SAFER estimated in the Pantanal, one notes that accordingto the classes of land use and cover, different values of evapotranspiration wereobtained in the rainy season, between October and March (JD 273/97 of 2011/2012),and in the dry season, between April and September (JD 113 to 257/2012), accordingto Figures 2 and 3, respectively. The statistics were drawn taking into considerationsample agriculture classes (Ac), water (Ag), planted pasture (Ap), seasonal decidualforest (C), seasonal semi-decidual forest (F), anthropogenic areas (OA), pioneerformations (P), Savanna/Cerrado (S), steppic savanna/Chaco (T), secondary vegetation(Vs) and vegetation refuges (r).
In the rainy season (Figure 2), the daily average for the class �seasonal decidualforest� was 2.72 ± 0.48 mm d-1. In agriculture areas, the ET was 1.84 ± 0.83 mm d-1;in areas occupied by man, 0.92 ± 0.65 mm d-1; on the Savanna/Cerrado it was 1.47 ±0.59 mm d-1 and steppic savanna/Chaco, 1.38 ± 0.53 mm d-1. In the dry season(Figure 3), the class �seasonal decidual forest� presented 2.09 ± 0.31 mm d-1; inagriculture areas, 1.98 ± 0.51 mm d-1. In the anthropized area, ET was 0.85 ± 0.53mm d-1; in the Savanna/Cerrado, 1.26 ± 0.31 mm d-1; and in the Chaco, 1.47 ± 0.33mm d-1.
For �water�, the results obtained in the rainy season were around 1.92mm.day-1, being the value below the one reported in literature. This discrepancy maybe due to the fact that the shape data used was from 2002 (Probio project), and theimages and meteorological data are from 2011/2012. Another factor that may haveinfluenced the low values of ET can be related to the negative NDVI in water bodies,although there is little water in the Pantanal and in the submerged vegetation, which
136 GEOGRAFIASpatiotemporal variability of evapotranspiration in
Pantanal, Brazil, using satellite images
means that the NDVI values may not have been considered negative, but close tozero, due to the influence of the vegetation reflectance.
The results obtained with the application of the SAFER model confirm Oliveiraand Pereira�s results (2012). The authors analyzed the historical series of the MODISevapotranspiration (MOD16A2), 1 km resolution, and observed large seasonal amplitudeof ET. The minimum value of ET was 35.30 mm.month-1, occurring in the dry period,and the maximum value of 188.40 mm.month-1 was found in 2003 (due to highprecipitation in the same year and in 2002, which possibly resulted in a greateravailability of water on the soil, further development of vegetation, resulting in greaterevapotranspiration). Andrade et al. (2009) in a study on the Pantanal, using SEBALmodel and MODIS image (7/21/2008), with a 250 m resolution, obtained biophysicalparameters for the biome, finding average daily evapotranspiration of 2.6 mm d-1. Ina study conducted by Andrade et al. (2012), using the algorithm SEBAL, values ofaverage daily ET of 2.4 mm day-1 were obtained on the steppic Savanna/chaco. Inareas related to Savanna (Cerrado), livestock (planted pasture) and anthropized areas,the daily ET ranged from 1.3 to 1.9 mm day-1.
In general, at a seasonal scale, the lowest ET were observed in the dry period(compared to the rainy season), which indicates that the main active component on ETis solar radiation. Lathuillière et al. (2012) stressed the importance of the Pantanalbiome in rainfall recycling through evapotranspiration, being essential for theunderstanding of the effects of land use change and forest conversion in Cerrado andprobably in the Amazon region.
137
Leivas, J. F. / Teixeira, A. H. de C. /Andrade, R. G. / Victoria, D. de C. /
Torresan, F. E.v. 40, Número Especial ago. 2015
Figure 2 - Spatial distribution of ET estimates (mm d-1) for the Pantanalbiome, related to the rainy season, the period between October
2011 (JD 273/2011) to March 2012 (81/2012)
138 GEOGRAFIASpatiotemporal variability of evapotranspiration in
Pantanal, Brazil, using satellite images
Figure 3 - Maps of ET estimates (mm d-1) for the Pantanal biome relatedto the dry season, the period between the JD 113 to 257/2012
139
Leivas, J. F. / Teixeira, A. H. de C. /Andrade, R. G. / Victoria, D. de C. /
Torresan, F. E.v. 40, Número Especial ago. 2015
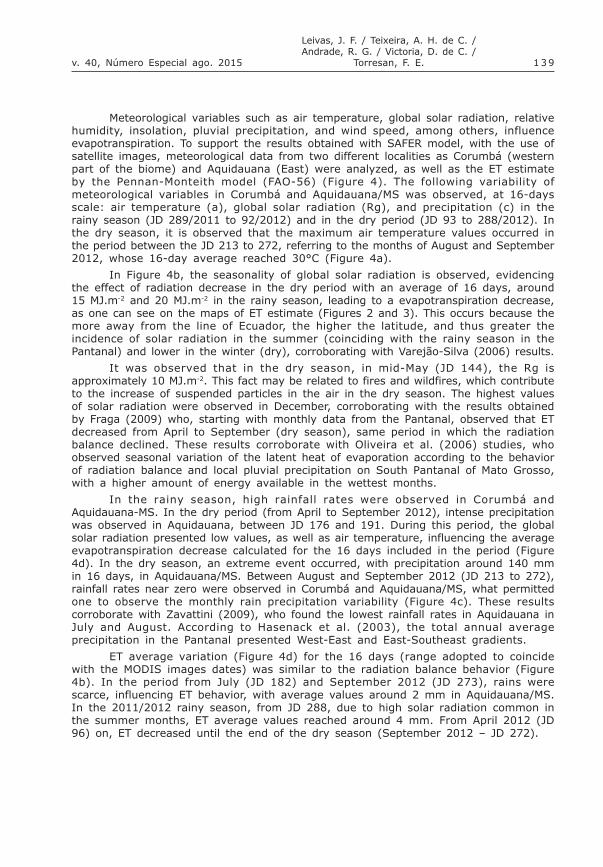
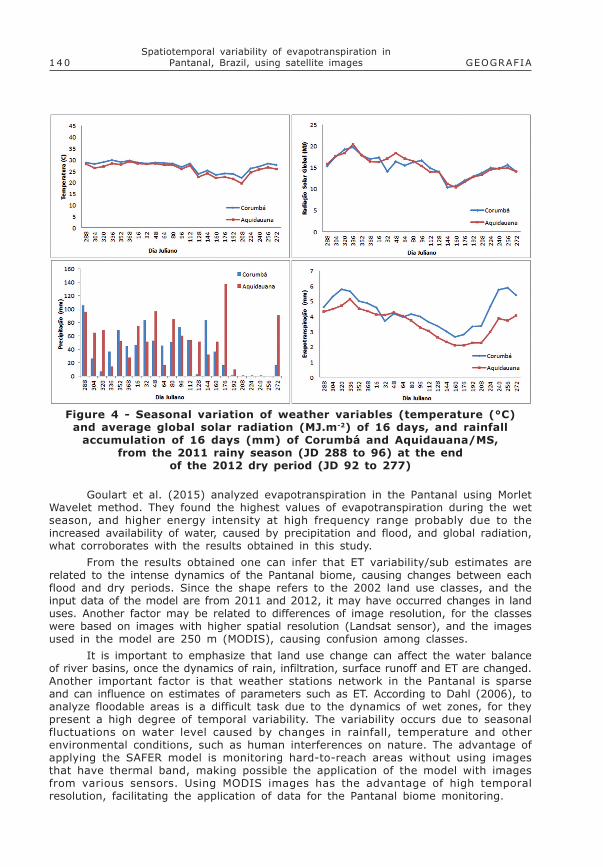
Meteorological variables such as air temperature, global solar radiation, relativehumidity, insolation, pluvial precipitation, and wind speed, among others, influenceevapotranspiration. To support the results obtained with SAFER model, with the use ofsatellite images, meteorological data from two different localities as Corumbá (westernpart of the biome) and Aquidauana (East) were analyzed, as well as the ET estimateby the Pennan-Monteith model (FAO-56) (Figure 4). The following variability ofmeteorological variables in Corumbá and Aquidauana/MS was observed, at 16-daysscale: air temperature (a), global solar radiation (Rg), and precipitation (c) in therainy season (JD 289/2011 to 92/2012) and in the dry period (JD 93 to 288/2012). Inthe dry season, it is observed that the maximum air temperature values occurred inthe period between the JD 213 to 272, referring to the months of August and September2012, whose 16-day average reached 30°C (Figure 4a).
In Figure 4b, the seasonality of global solar radiation is observed, evidencingthe effect of radiation decrease in the dry period with an average of 16 days, around15 MJ.m-2 and 20 MJ.m-2 in the rainy season, leading to a evapotranspiration decrease,as one can see on the maps of ET estimate (Figures 2 and 3). This occurs because themore away from the line of Ecuador, the higher the latitude, and thus greater theincidence of solar radiation in the summer (coinciding with the rainy season in thePantanal) and lower in the winter (dry), corroborating with Varejão-Silva (2006) results.
It was observed that in the dry season, in mid-May (JD 144), the Rg isapproximately 10 MJ.m-2. This fact may be related to fires and wildfires, which contributeto the increase of suspended particles in the air in the dry season. The highest valuesof solar radiation were observed in December, corroborating with the results obtainedby Fraga (2009) who, starting with monthly data from the Pantanal, observed that ETdecreased from April to September (dry season), same period in which the radiationbalance declined. These results corroborate with Oliveira et al. (2006) studies, whoobserved seasonal variation of the latent heat of evaporation according to the behaviorof radiation balance and local pluvial precipitation on South Pantanal of Mato Grosso,with a higher amount of energy available in the wettest months.
In the rainy season, high rainfall rates were observed in Corumbá andAquidauana-MS. In the dry period (from April to September 2012), intense precipitationwas observed in Aquidauana, between JD 176 and 191. During this period, the globalsolar radiation presented low values, as well as air temperature, influencing the averageevapotranspiration decrease calculated for the 16 days included in the period (Figure4d). In the dry season, an extreme event occurred, with precipitation around 140 mmin 16 days, in Aquidauana/MS. Between August and September 2012 (JD 213 to 272),rainfall rates near zero were observed in Corumbá and Aquidauana/MS, what permittedone to observe the monthly rain precipitation variability (Figure 4c). These resultscorroborate with Zavattini (2009), who found the lowest rainfall rates in Aquidauana inJuly and August. According to Hasenack et al. (2003), the total annual averageprecipitation in the Pantanal presented West-East and East-Southeast gradients.
ET average variation (Figure 4d) for the 16 days (range adopted to coincidewith the MODIS images dates) was similar to the radiation balance behavior (Figure4b). In the period from July (JD 182) and September 2012 (JD 273), rains werescarce, influencing ET behavior, with average values around 2 mm in Aquidauana/MS.In the 2011/2012 rainy season, from JD 288, due to high solar radiation common inthe summer months, ET average values reached around 4 mm. From April 2012 (JD96) on, ET decreased until the end of the dry season (September 2012 � JD 272).
140 GEOGRAFIASpatiotemporal variability of evapotranspiration in
Pantanal, Brazil, using satellite images
Goulart et al. (2015) analyzed evapotranspiration in the Pantanal using MorletWavelet method. They found the highest values of evapotranspiration during the wetseason, and higher energy intensity at high frequency range probably due to theincreased availability of water, caused by precipitation and flood, and global radiation,what corroborates with the results obtained in this study.
From the results obtained one can infer that ET variability/sub estimates arerelated to the intense dynamics of the Pantanal biome, causing changes between eachflood and dry periods. Since the shape refers to the 2002 land use classes, and theinput data of the model are from 2011 and 2012, it may have occurred changes in landuses. Another factor may be related to differences of image resolution, for the classeswere based on images with higher spatial resolution (Landsat sensor), and the imagesused in the model are 250 m (MODIS), causing confusion among classes.
It is important to emphasize that land use change can affect the water balanceof river basins, once the dynamics of rain, infiltration, surface runoff and ET are changed.Another important factor is that weather stations network in the Pantanal is sparseand can influence on estimates of parameters such as ET. According to Dahl (2006), toanalyze floodable areas is a difficult task due to the dynamics of wet zones, for theypresent a high degree of temporal variability. The variability occurs due to seasonalfluctuations on water level caused by changes in rainfall, temperature and otherenvironmental conditions, such as human interferences on nature. The advantage ofapplying the SAFER model is monitoring hard-to-reach areas without using imagesthat have thermal band, making possible the application of the model with imagesfrom various sensors. Using MODIS images has the advantage of high temporalresolution, facilitating the application of data for the Pantanal biome monitoring.
Figure 4 - Seasonal variation of weather variables (temperature (°C)and average global solar radiation (MJ.m-2) of 16 days, and rainfall
accumulation of 16 days (mm) of Corumbá and Aquidauana/MS,from the 2011 rainy season (JD 288 to 96) at the end
of the 2012 dry period (JD 92 to 277)
141
Leivas, J. F. / Teixeira, A. H. de C. /Andrade, R. G. / Victoria, D. de C. /
Torresan, F. E.v. 40, Número Especial ago. 2015
CONCLUSIONS
According to the results we can conclude that the integrated analysis of satelliteimages with data from weather stations, using the SAFER model, permits monitoringevapotranspiration at regional scale.
The results were satisfactory, allowing better understanding about theevapotranspiration dynamics of floodable areas and their relation with air temperature,solar radiation and precipitation. The highest evapotranspiration values were found inthe rainy season because of the increased availability of water due to precipitationand a higher solar radiation incidence.
SAFER model proved effective for the ET estimation at a large scale, both forthe rainy and the dry season, being sensitive to the variations observed between theclasses of land cover and land use. Thus, for future studies, we suggest the use ofimages with a higher spatial resolution and greater amount of data from weatherstations, enabling the model functionality for hydrometeorological monitoring of thePantanal.
REFERENCES
ABDON, M. M. Os impactos ambientais no meio físico � Erosão e assoreamentona bacia hidrográfica do rio Taquari, MS, em decorrência da pecuária. 2004. 302f.Tese (Doutorado em Ciências da Engenharia Ambiental) - Escola de Engenharia daUniversidade de São Paulo, São Carlos, 2004.
ABDON, M. de M.; SILVA, J. dos S. V. da; SOUZA, I. de M. e S.; ROMON, V. T.;RAMPAZZO, J.; FERRARI, D. L. Desmatamento no bioma Pantanal até o ano 2002:relações com a fitofisionomia e limites municipais. Revista Brasileira de Cartografia,Rio de Janeiro, v. 59, n. 1, p. 17-24, 2007.
ADAMI, M.; FREITAS, R. M. de; PADOVANI, C. R.; SHIMABUKURO, Y. E.; MOREIRA, M.A. Estudo da dinâmica espaço-temporal do bioma Pantanal por meio de imagensMODIS. Pesquisa Agropecuária Brasileira, Brasília, v. 43, n. 10, p. 1371-1378,2008.
ALLEN, R.G., PEREIRA, L.S., RAES, D., SMITH, M. Crop evapotranspiration, Guidelinesfor computing crop water requirements, FAO Irrigation and Drainage Paper 56.Rome, Italy, 300 pp., 1998.
ALLEN, R.; TASUMI, M.; TREZZA, R. Satellite-based energy balance for mappingevapotranspiration with internalized calibration (METRIC) model. Journal of Irrigationand Drainage Engineering, v. 133, n. 4, p. 380-394, 2007a.
ALLEN, R.; TASUMI, M.; TREZZA, R. Satellite-based energy balance for mappingevapotranspiration with internalized calibration (METRIC) applications. Journal ofIrrigation and Drainage Engineering, v. 133, n. 4, p. 395-405, 2007b.
ANDRADE, R. G.; SEDIYAMA, G. C.; BATISTELLA, M.; VICTORIA, D. de C.; PAZ, A.R.; LIMA, E. de P.; NOGUEIRA, S. F. Mapeamento de parâmetros biofísicos e daevapotranspiração no Pantanal usando técnicas de sensoriamento remoto. In:SIMPÓSIO DE GEOTECNOLOGIAS NO PANTANAL, 2., 2009. Corumbá, MS. Anais...Campinas: Embrapa Informática Agropecuária; INPE, 2009. p. 695-704.
ANDRADE, R. G.; PAZ, A. R. da; VICTORIA, D. de C.; DELGADO, R. C.; LIMA, E. de P.Análise da evapotranspiração real diária em diferentes classes de uso e cobertura daterra na região do Pantanal. In: CONGRESSO BRASILEIRO DE METEOROLOGIA, 16.,2010. Belém, PA. Anais... Belém, PA: SBMET, 2010.
142 GEOGRAFIASpatiotemporal variability of evapotranspiration in
Pantanal, Brazil, using satellite images
ANDRADE, R. G.; SEDIYAMA, G. C.; PAZ, A. R.; LIMA, E. P.; FACCO, A. G.Geotecnologias aplicadas à avaliação de parâmetros biofísicos do Pantanal. PesquisaAgropecuária Brasileira, Brasília, v. 47, n. 9, p. 1227-1234, 2012.
BASTIAANSSEN, W. G. M.; MENENTI, M.; FEDDES, R. A.; HOLTSLAG, A. A. M. A remotesensing surface energy balance algorithm for land (SEBAL): 1. Formulation. Journalof Hydrology, v. 212/213, p. 198-212, 1998a.
BASTIAANSSEN, W. G. M.; PELGRUM, H.; WANG, J.; MA, Y.; MORENO, J. F.; ROERINK,G. J.; VAN DER WAL, T. A remote sensing surface energy balance algorithm for land(SEBAL): 2. Validation. Journal of Hydrology, v. 212/213, p. 213-229, 1998b.
DAHL, T. E. Status and trends of wetlands in the conterminous United States1998�2004. Washington, DC: Fish and Wildlife Service, 2006.
EMBRAPA. Levantamento e mapeamento dos remanescentes da coberturavegetal do bioma Pantanal, período de 2002 na escala de 1:250.000.Campinas: Embrapa Informática Agropecuária, ago. 2004. 43p.
FRAGA, C. I. M. Evapotranspiração e fator de desacoplamento em área decambarazal no Pantanal. 2009, 56f. Dissertação (Mestrado em Física e MeioAmbiente) - Instituto de Física, Universidade Federal de Mato Grosso, Cuiabá, 2009.
GOULART, M. A.; SANCHES, L.; VILANI, M. T.; PINTO JÚNIOR, O. B. Análise daevapotranspiração por wavelet de Morlet em área de Vochysia divergens Pohl noPantanal. Revista Brasileira de Engenharia Agrícola e Ambiental, v.19, n.2,p.93�98, 2015.
GRIZIO-ORITA, E.V.; SOUZA FILHO, E.E.; Modificação da evapotranspiração edisponibilidade hídrica no sistema do Rio Paraguai, Revista Geonorte, Edição Especial4, n. 1, v. 10, p.233 - 239, 2014.
HASENACK, H.; CORDEIRO, J. L. P.; HOFMANN, G. S. O clima da RPPN SESC Pantanal.Porto Alegre: UFRGS, 2003. 27 p.
HENRIQUE, F. A. N.; DANTAS, R. T. Estimativa da evapotranspiração de referência emCampina Grande, Paraíba. Revista Brasileira de Engenharia Agrícola eAmbiental, Campina Grande, v.11, n.6, p.594-599, 2007.
LATHUILLIÈRE, M. J.; JOHNSON M. S.; DONNER, S. D. Water use by terrestrialecosystems: Temporal variability in rainforest and agricultural contributions toevapotranspiration in Mato Grosso, Brazil. Environmental Research Letters, v.7,p.1-12, 2012.
MATSUMOTO, K.; OHTA, T.; NAKAI, T.; KUWADA, T.; DAIKOKU, K.; IIDA, S.; YABUKI,H.; KONONOV, A. V.; VAN DER MOLEN, M.. K.; KODAMA, Y.; MAXIMOV, T. C.; DOLMAN,A. J.; HATTORI, S. Responses of surface conductance to forest environments in theFar East. Agricultural and Forest Meteorology, v. 148, 1926-1940, dez. 2008.
OLIVEIRA, M. B. L.; VON RANDOW, C.; MANZI, A. O.; ALVALÁ, R. C. S.; ORTEGA-FARIAS, S. O.; CUENCA, R. H.; EK, M. Daytime variation of sensible heat flux estimatedby the bulk aerodynamic method over a grass canopy. Agricultural and ForestMeteorology, v. 81, p. 131-143, set. 1996.
OLIVEIRA, M. B. L.; VON RANDOW, C.; MANZI, A. O.; ALVALÁ, R. C. S.;SÁ, L. D. A.;LEITÃO, M. M. V. B.R.; SOUZA, A. Fluxos turbulentos de energia sobre o Pantanal sulmato-grossense. Revista Brasileira de Meteorologia, v. 21, p. 371-377, Dezembro,2006.
143
Leivas, J. F. / Teixeira, A. H. de C. /Andrade, R. G. / Victoria, D. de C. /
Torresan, F. E.v. 40, Número Especial ago. 2015
OLIVEIRA, B. S.; PEREIRA, B. Avaliação da evapotranspiração em diferentes usos dosolo no Pantanal utilizando dados do sensor Terra-MODIS. In: SIMPÓSIO DEGEOTECNOLOGIAS NO PANTANAL, 4., 2012. Bonito, MS. Anais... Campinas: EmbrapaInformática Agropecuária; INPE, 2012. p. 870 -878.
TEIXEIRA, A. H. DE C. Determining regional actual evapotranspiration of irrigated andnatural vegetation in the São Francisco river basin (Brazil) using remote sensing andPenman-Monteith equation. Remote Sensing, v. 2, 1287-1319, 2010.
TEIXEIRA, A. H. DE C.; HERNANDEZ, F. B. T. ; ANDRADE, R. G. ; LEIVAS, F. L.;VICTORIA, D. DE C. ; BOLFE, E. L. Irrigation performance Assessments for corn cropwith Landsat mages in the São Paulo state, Brazil. In: INTERNATIONAL INOVAGRIMEETING, 2., 2014, Fortaleza. Proceedings... Fortaleza: INOVAGRI, 2014b. p. 739-748.
TEIXEIRA, A. H. DE C.; HERNANDEZ, F. B. T.; LOPES, H. L.; SCHERER-WARREN, M.;BASSOI, L. H. A Comparative Study of Techniques for Modeling the SpatiotemporalDistribution of Heat and Moisture Fluxes in Different Agroecosystems in Brazil. In:PETROPOULOS, G. G. (Org.). Remote Sensing of Energy Fluxes and Soil MoistureContent. 1ed. Boca Raton, FL: CRC Group; Taylor and Francis, 2014a, p. 169-191.
TEIXEIRA, A. H. DE C.; SCHERER-WARREN, M.; HERNANDEZ, F. B. T.; ANDRADE, R.G.; LEIVAS, J. F.; Large-Scale Water Productivity Assessments with MODIS Images ina Changing Semi-Arid Environment: A Brazilian Case Study. Remote Sensing, v. 11,p. 5783-5804, 2013.
TEIXEIRA, A. H. DE C.; HERNANDEZ, F. B. T. ; LOPES, H. L. Up Scaling Table GrapeWater Requirements in the Low-Middle São. Acta Horticulturae, v. 1038, p. 655-662, 2014
VAREJÃO-SILVA, M. A. Meteorologia e climatologia. Versão digital 2. Recife, Brasil,449p, 2006.
VICTÓRIA, D. DE C.; ANDRADE, R. G.; PAZ, A. R. Série temporal de imagens EVI/MODIS para discriminação de formações vegetais do Pantanal. Geografia, Rio Claro,v. 34, número especial, p. 721-729, 2009.