Embed Size (px)
Citation preview
Special Diets Expert Review Committee
Final Report
Prepared For:
The Ministry of Community and Social Services
April 2008
1
INDEX
Committee Members 4
Preamble 5
Rationales/Discussions 7
Specific Medical Conditions:
Allergy to Wheat and Celiac Disease 9
Diabetes
Insufficient Lactation to Sustain Breastfeeding or
12
Gestational Diabetes 15
Obesity 18
Dyslipidemia 20
Hypertension 22
Dysphagia Requiring Thickened Fluids 25
Failure of Growth 26
Food Allergy – Eggs 29
Food Allergy – Milk and Alternatives 30
Lactose Intolerance 33
Food Allergy – Soy 35
Breastfeeding is Contraindicated 36
Metabolic Bone Disease 38
Osteoporosis 39
Renal Failure 40
Chronic Wounds and Burns 43
Unintended Weight Loss 45
Congestive Heart Failure 46
2
Ostomies 47
Unintended Weight Loss Due to One or More of the Following
Appendix 6 – Calculation of Cost to Provide Maximum # of Servings of Canada’s
Medical Conditions 48
Microcytic / Macrocytic Anemia 50
Detailed Explanation of Costing Methodology 51
References 55
Appendix 1 – Ontario Nutritious Food Basket Cost Averages 2005 59
Appendix 2 – Specialty Items Costing Sheet 62
Appendix 3 – Calculation of Average Cost per Serving 66
Appendix 4 – Calculation of Cost of Healthy, Low Fat Meat Choices 68
Appendix 5 – Calculation of Energy Provided by Canada’s Food Guide (2007) 69
Food Guide (2007) 70
Appendix 7 – Summary of Dietary Interventions Used for Costing 71
Appendix 8 – Summary of Amounts Payable 73
Appendix 9 – Northern Food Prices 77
Appendix 10 – Nutritional Supplements 80
3

COMMITTEE MEMBERS
Donna Danelon, Registered Dietitian
Dr. Greg De Marchi, Co-Chair
Stephanie De Maio, Registered Dietitian
Janet Dubeau, Registered Dietitan
Dr. Raphael Folman
Gloria Mamakwa, Wunnumin Lake First Nation, Community Health Worker
Connie O’Connor, Registered Dietitian
Dr. Janis Randall-Simpson
Dr. Brian Roy, Co-chair
Uma Sebastiampillai, Registered Dietitian
Dr. Chandrakant P. Shah
Maria Spray, Registered Nurse
Dr. William Sullivan
Lorraine Willows, Registered Dietitian
4
PREAMBLE
The Ministry of Community and Social Services (“Ministry”) established the Special Diets Expert Review Committee (“Committee”) in June 2006 to provide advice to the Ministry regarding the content of the Special Diets Schedule. The Committee comprises a variety of health experts and professionals from across Ontario, including: physicians, registered nurses, clinical dieticians, academics with expertise in human nutrition, metabolism, and others. The Committee includes representation from remote northern communities.
As co-chair of the Committee, the Ministry’s Chief Medical Advisor acted as a coordinator and facilitator during the review process. He clarified policy, responded to the Committee’s issues on behalf of the Ministry, and provided input based on his experience as a physician.
The Committee’s process was complex and required a multifaceted approach to developing advice for the Ministry’s consideration. In the course of its work, the Committee focused on two key tasks in regards to the Special Diet Schedule:
• To provide advice to the Ministry on the medical conditions for which a special diet is generally recognized by the Ontario medical community as an adjuvant to the treatment of that medical condition based on established best practices and guidelines (e.g., Manual of Clinical Dietetics, Krause’s Food, Nutrition and Diet Therapy, Escott-Stump Nutrition and Diagnosis-Related Care, etc.).
• To provide advice to the Ministry on the extraordinary cost of those special diets.
It was not within the Committee’s mandate to address issues regarding the Special Diet Allowance policy, individual cases, and/or social assistance in general. However, it was the consensus of the Committee members who are external to the government that the following points needed to be emphasized in any preamble to its initial recommendations:
1. The delivery of this report in no way advocates for the current rates of social assistance in regard to proper nutrition and health, nor does it confirm their adequacy.
2. Persons living in Northern and remote communities may face additional challenges in regards to health and well balanced nutrition. Due to the extreme costs of foods within the north and the random availability, even with social assistance and the special diet supplement persons living in the north have difficulties obtaining healthy, well balanced nutrition. The Committee recognized that these issues go beyond the mandate of this Committee and the Ministry; however, it deemed it necessary to bring this issue forward with its recommendation that this be addressed in some manner.
5
3. The cost of special diets (see attached) should be adjusted for the cost of inflation on an annual basis. Furthermore, upon release of any further revisions to Canada’s Food Guide to Healthy Eating (following 2007 revision), both the Special Diets Schedule and costings should be further reviewed.
The points set out above are the views of the members of the Committee external to the government and not those of members of the Committee who are internal to the government (members internal to government include the Chief Medical Advisor).
Based on the Committee’s discussions, the following chart sets out its advice regarding the medical conditions for which a special diet is generally recognized by the Ontario medical community as adjuvant to the treatment of that medical condition based on established best practices and guidelines. For an abbreviated list of the conditions and costs, please see Appendix 8, and there are also recommendations for the removal of formally listed conditions.
6
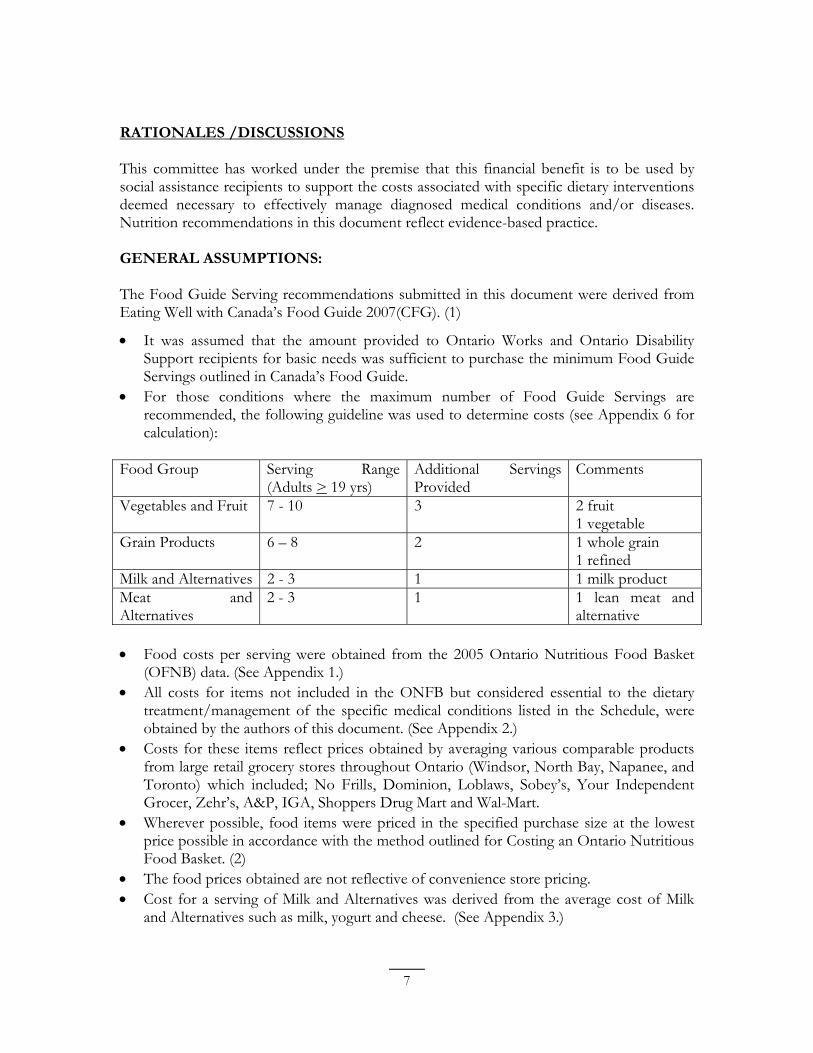
RATIONALES /DISCUSSIONS
This committee has worked under the premise that this financial benefit is to be used by social assistance recipients to support the costs associated with specific dietary interventions deemed necessary to effectively manage diagnosed medical conditions and/or diseases. Nutrition recommendations in this document reflect evidence-based practice.
GENERAL ASSUMPTIONS:
The Food Guide Serving recommendations submitted in this document were derived from Eating Well with Canada’s Food Guide 2007(CFG). (1)
• It was assumed that the amount provided to Ontario Works and Ontario Disability Support recipients for basic needs was sufficient to purchase the minimum Food Guide Servings outlined in Canada’s Food Guide.
• For those conditions where the maximum number of Food Guide Servings are recommended, the following guideline was used to determine costs (see Appendix 6 for calculation):
Food Group Serving Range (Adults > 19 yrs)
Additional Servings Provided
Comments
Vegetables and Fruit 7 - 10 3 2 fruit 1 vegetable
Grain Products 6 – 8 2 1 whole grain 1 refined
Milk and Alternatives 2 - 3 1 1 milk product Meat and Alternatives
2 - 3 1 1 lean meat and alternative
• Food costs per serving were obtained from the 2005 Ontario Nutritious Food Basket (OFNB) data. (See Appendix 1.)
• All costs for items not included in the ONFB but considered essential to the dietary treatment/management of the specific medical conditions listed in the Schedule, were obtained by the authors of this document. (See Appendix 2.)
• Costs for these items reflect prices obtained by averaging various comparable products from large retail grocery stores throughout Ontario (Windsor, North Bay, Napanee, and Toronto) which included; No Frills, Dominion, Loblaws, Sobey’s, Your Independent Grocer, Zehr’s, A&P, IGA, Shoppers Drug Mart and Wal-Mart.
• Wherever possible, food items were priced in the specified purchase size at the lowest price possible in accordance with the method outlined for Costing an Ontario Nutritious Food Basket. (2)
• The food prices obtained are not reflective of convenience store pricing. • Cost for a serving of Milk and Alternatives was derived from the average cost of Milk
and Alternatives such as milk, yogurt and cheese. (See Appendix 3.)
7
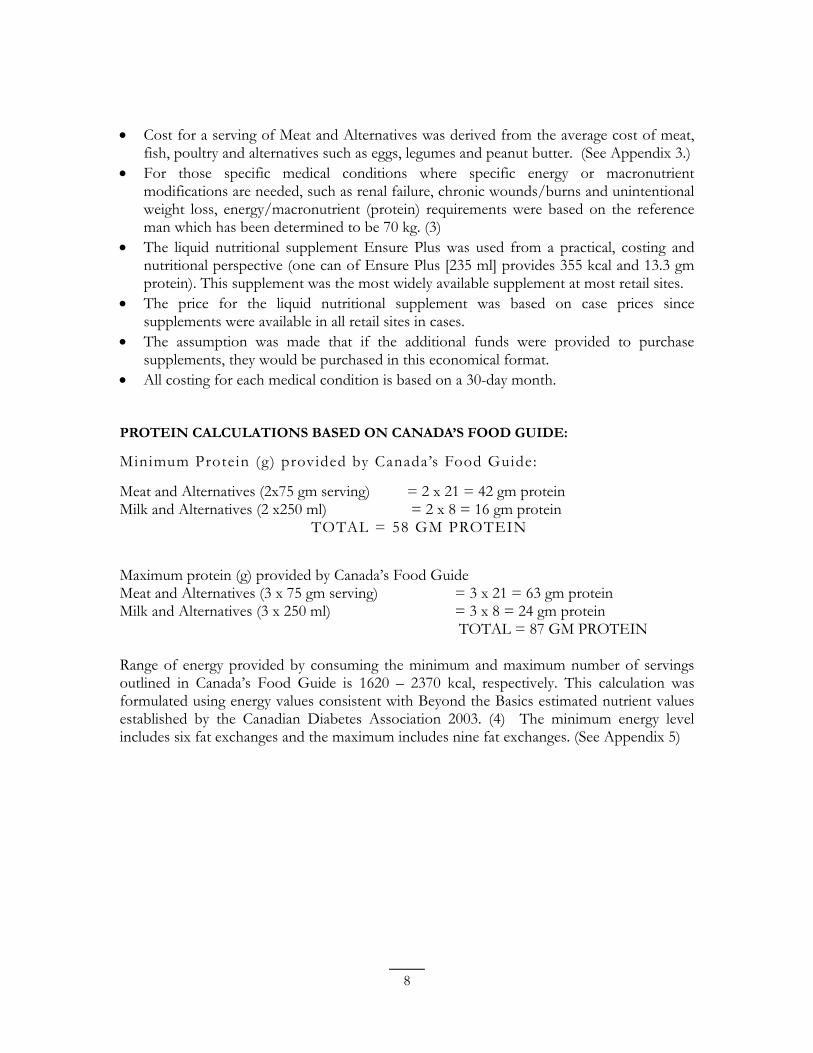
• Cost for a serving of Meat and Alternatives was derived from the average cost of meat, fish, poultry and alternatives such as eggs, legumes and peanut butter. (See Appendix 3.)
• For those specific medical conditions where specific energy or macronutrient modifications are needed, such as renal failure, chronic wounds/burns and unintentional weight loss, energy/macronutrient (protein) requirements were based on the reference man which has been determined to be 70 kg. (3)
• The liquid nutritional supplement Ensure Plus was used from a practical, costing and nutritional perspective (one can of Ensure Plus [235 ml] provides 355 kcal and 13.3 gm protein). This supplement was the most widely available supplement at most retail sites.
• The price for the liquid nutritional supplement was based on case prices since supplements were available in all retail sites in cases.
• The assumption was made that if the additional funds were provided to purchase supplements, they would be purchased in this economical format.
• All costing for each medical condition is based on a 30-day month.
PROTEIN CALCULATIONS BASED ON CANADA’S FOOD GUIDE:
Minimum Protein (g) provided by Canada’s Food Guide:
Meat and Alternatives (2x75 gm serving) = 2 x 21 = 42 gm protein Milk and Alternatives (2 x250 ml) = 2 x 8 = 16 gm protein
TOTAL = 58 GM PROTEIN
Maximum protein (g) provided by Canada’s Food Guide Meat and Alternatives (3 x 75 gm serving) = 3 x 21 = 63 gm protein Milk and Alternatives (3 x 250 ml) = 3 x 8 = 24 gm protein
TOTAL = 87 GM PROTEIN
Range of energy provided by consuming the minimum and maximum number of servings outlined in Canada’s Food Guide is 1620 – 2370 kcal, respectively. This calculation was formulated using energy values consistent with Beyond the Basics estimated nutrient values established by the Canadian Diabetes Association 2003. (4) The minimum energy level includes six fat exchanges and the maximum includes nine fat exchanges. (See Appendix 5)
8
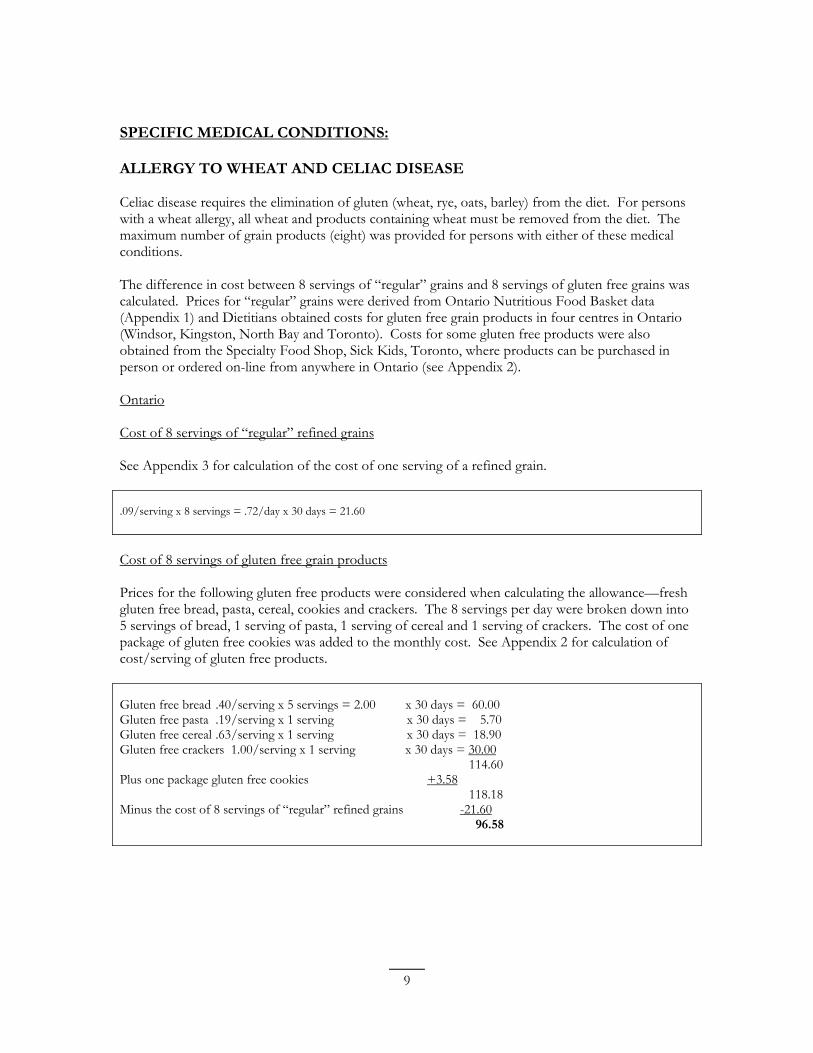
SPECIFIC MEDICAL CONDITIONS:
ALLERGY TO WHEAT AND CELIAC DISEASE
Celiac disease requires the elimination of gluten (wheat, rye, oats, barley) from the diet. For persons with a wheat allergy, all wheat and products containing wheat must be removed from the diet. The maximum number of grain products (eight) was provided for persons with either of these medical conditions.
The difference in cost between 8 servings of “regular” grains and 8 servings of gluten free grains was calculated. Prices for “regular” grains were derived from Ontario Nutritious Food Basket data (Appendix 1) and Dietitians obtained costs for gluten free grain products in four centres in Ontario (Windsor, Kingston, North Bay and Toronto). Costs for some gluten free products were also obtained from the Specialty Food Shop, Sick Kids, Toronto, where products can be purchased in person or ordered on-line from anywhere in Ontario (see Appendix 2).
Ontario
Cost of 8 servings of “regular” refined grains
See Appendix 3 for calculation of the cost of one serving of a refined grain.
.09/serving x 8 servings = .72/day x 30 days = 21.60
Cost of 8 servings of gluten free grain products
Prices for the following gluten free products were considered when calculating the allowance—fresh gluten free bread, pasta, cereal, cookies and crackers. The 8 servings per day were broken down into 5 servings of bread, 1 serving of pasta, 1 serving of cereal and 1 serving of crackers. The cost of one package of gluten free cookies was added to the monthly cost. See Appendix 2 for calculation of cost/serving of gluten free products.
Gluten free bread .40/serving x 5 servings = 2.00 x 30 days = 60.00 Gluten free pasta .19/serving x 1 serving x 30 days = 5.70 Gluten free cereal .63/serving x 1 serving x 30 days = 18.90 Gluten free crackers 1.00/serving x 1 serving x 30 days = 30.00
114.60 Plus one package gluten free cookies +3.58
118.18 Minus the cost of 8 servings of “regular” refined grains -21.60
96.58
9
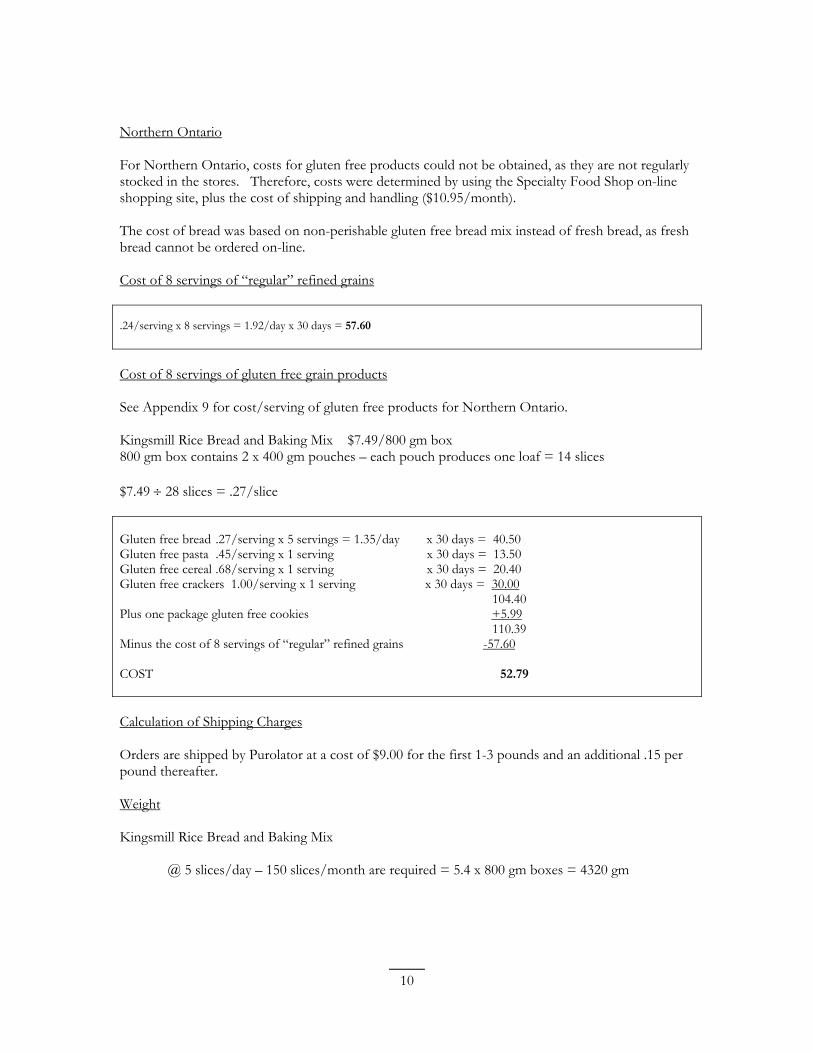
Northern Ontario
For Northern Ontario, costs for gluten free products could not be obtained, as they are not regularly stocked in the stores. Therefore, costs were determined by using the Specialty Food Shop on-line shopping site, plus the cost of shipping and handling ($10.95/month).
The cost of bread was based on non-perishable gluten free bread mix instead of fresh bread, as fresh bread cannot be ordered on-line.
Cost of 8 servings of “regular” refined grains
.24/serving x 8 servings = 1.92/day x 30 days = 57.60
Cost of 8 servings of gluten free grain products
See Appendix 9 for cost/serving of gluten free products for Northern Ontario.
Kingsmill Rice Bread and Baking Mix $7.49/800 gm box 800 gm box contains 2 x 400 gm pouches – each pouch produces one loaf = 14 slices
$7.49 ÷ 28 slices = .27/slice
Gluten free bread .27/serving x 5 servings = 1.35/day x 30 days = 40.50 Gluten free pasta .45/serving x 1 serving x 30 days = 13.50 Gluten free cereal .68/serving x 1 serving x 30 days = 20.40 Gluten free crackers 1.00/serving x 1 serving x 30 days = 30.00
104.40 Plus one package gluten free cookies +5.99
110.39 Minus the cost of 8 servings of “regular” refined grains -57.60
COST 52.79
Calculation of Shipping Charges
Orders are shipped by Purolator at a cost of $9.00 for the first 1-3 pounds and an additional .15 per pound thereafter.
Weight
Kingsmill Rice Bread and Baking Mix
@ 5 slices/day – 150 slices/month are required = 5.4 x 800 gm boxes = 4320 gm
10
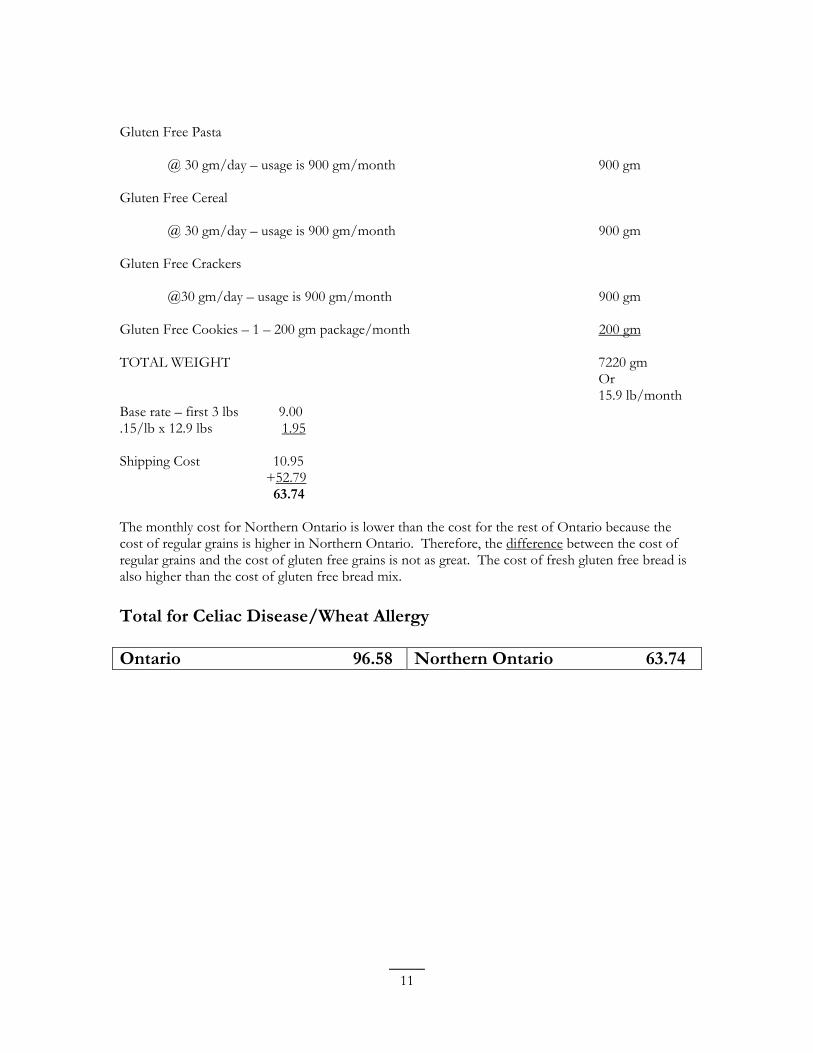
Gluten Free Pasta
@ 30 gm/day – usage is 900 gm/month 900 gm
Gluten Free Cereal
@ 30 gm/day – usage is 900 gm/month 900 gm
Gluten Free Crackers
@30 gm/day – usage is 900 gm/month 900 gm
Gluten Free Cookies – 1 – 200 gm package/month 200 gm
TOTAL WEIGHT
Base rate – first 3 lbs .15/lb x 12.9 lbs
9.00 1.95
7220 gm Or
15.9 lb/month
Shipping Cost 10.95 +52.79
63.74
The monthly cost for Northern Ontario is lower than the cost for the rest of Ontario because the cost of regular grains is higher in Northern Ontario. Therefore, the difference between the cost of regular grains and the cost of gluten free grains is not as great. The cost of fresh gluten free bread is also higher than the cost of gluten free bread mix.
Total for Celiac Disease/Wheat Allergy
Ontario 96.58 Northern Ontario 63.74
11
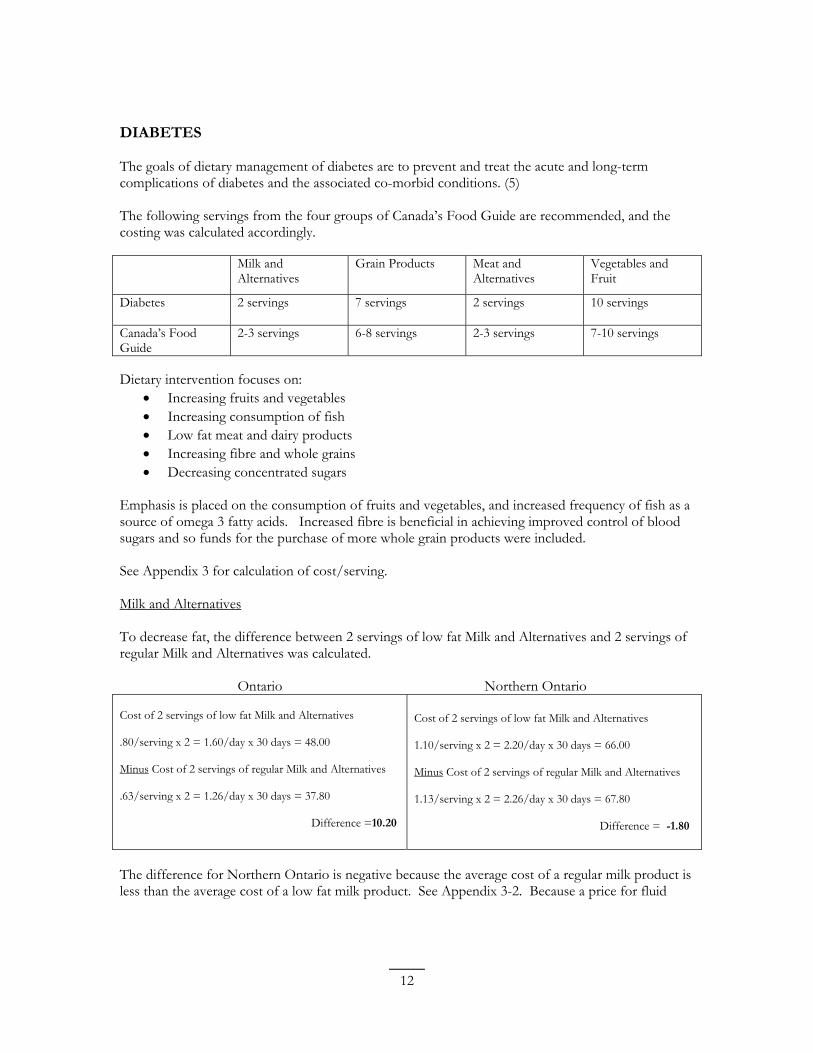
DIABETES
The goals of dietary management of diabetes are to prevent and treat the acute and long-term complications of diabetes and the associated co-morbid conditions. (5)
The following servings from the four groups of Canada’s Food Guide are recommended, and the costing was calculated accordingly.
Milk and Alternatives
Grain Products Meat and Alternatives
Vegetables and Fruit
Diabetes 2 servings 7 servings 2 servings 10 servings
Canada’s Food Guide
2-3 servings 6-8 servings 2-3 servings 7-10 servings
Dietary intervention focuses on: • Increasing fruits and vegetables • Increasing consumption of fish • Low fat meat and dairy products • Increasing fibre and whole grains • Decreasing concentrated sugars
Emphasis is placed on the consumption of fruits and vegetables, and increased frequency of fish as a source of omega 3 fatty acids. Increased fibre is beneficial in achieving improved control of blood sugars and so funds for the purchase of more whole grain products were included.
See Appendix 3 for calculation of cost/serving.
Milk and Alternatives
To decrease fat, the difference between 2 servings of low fat Milk and Alternatives and 2 servings of regular Milk and Alternatives was calculated.
Ontario Northern Ontario
Cost of 2 servings of low fat Milk and Alternatives Cost of 2 servings of low fat Milk and Alternatives
.80/serving x 2 = 1.60/day x 30 days = 48.00 1.10/serving x 2 = 2.20/day x 30 days = 66.00
Minus Cost of 2 servings of regular Milk and Alternatives Minus Cost of 2 servings of regular Milk and Alternatives
.63/serving x 2 = 1.26/day x 30 days = 37.80 1.13/serving x 2 = 2.26/day x 30 days = 67.80
Difference =10.20 Difference = -1.80
The difference for Northern Ontario is negative because the average cost of a regular milk product is less than the average cost of a low fat milk product. See Appendix 3-2. Because a price for fluid
12
skim milk was not available, a price for skim milk powder was used, resulting in a lower cost/serving than fluid 2% milk.
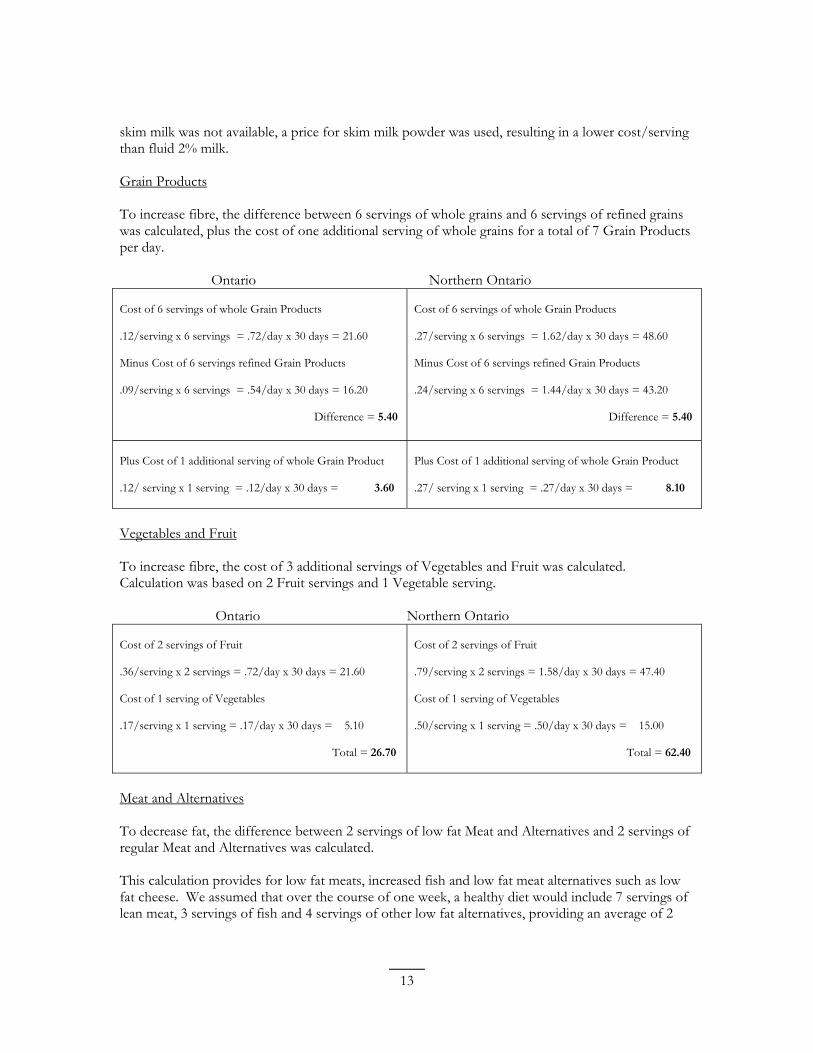
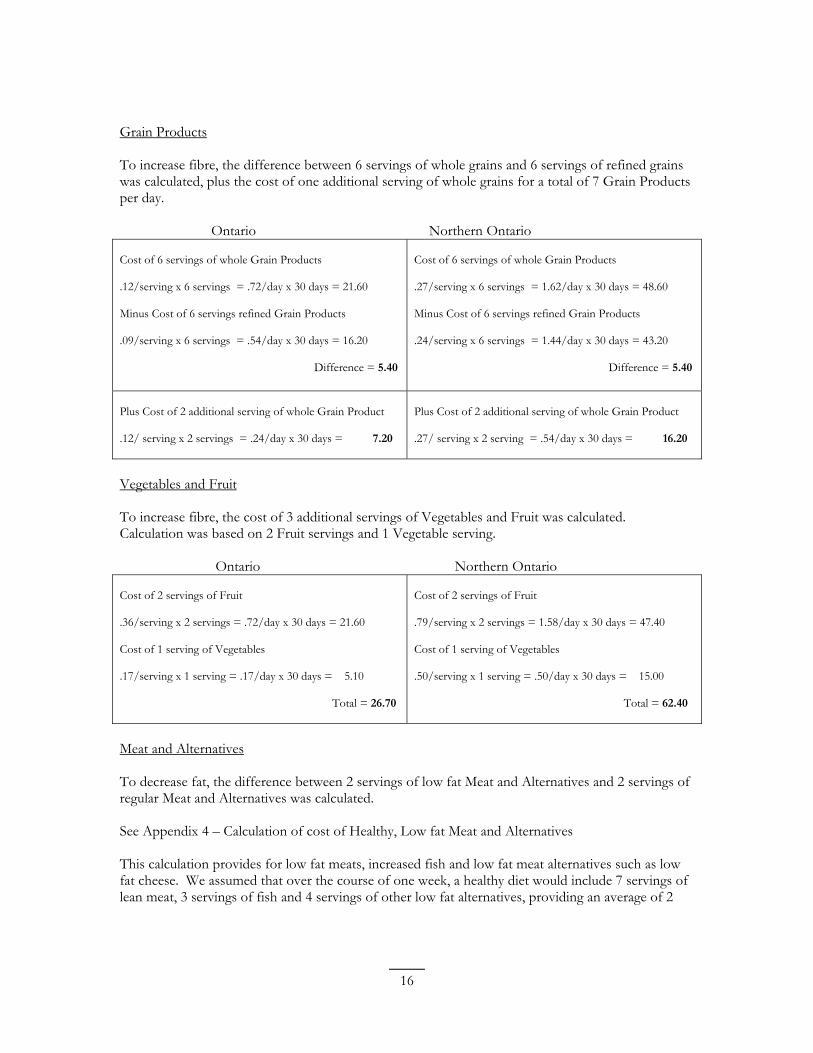
Grain Products
To increase fibre, the difference between 6 servings of whole grains and 6 servings of refined grains was calculated, plus the cost of one additional serving of whole grains for a total of 7 Grain Products per day.
Ontario Northern Ontario
Cost of 6 servings of whole Grain Products
.12/serving x 6 servings = .72/day x 30 days = 21.60
Minus Cost of 6 servings refined Grain Products
.09/serving x 6 servings = .54/day x 30 days = 16.20
Difference = 5.40
Cost of 6 servings of whole Grain Products
.27/serving x 6 servings = 1.62/day x 30 days = 48.60
Minus Cost of 6 servings refined Grain Products
.24/serving x 6 servings = 1.44/day x 30 days = 43.20
Difference = 5.40
Plus Cost of 1 additional serving of whole Grain Product
.12/ serving x 1 serving = .12/day x 30 days = 3.60
Plus Cost of 1 additional serving of whole Grain Product
.27/ serving x 1 serving = .27/day x 30 days = 8.10
Vegetables and Fruit
To increase fibre, the cost of 3 additional servings of Vegetables and Fruit was calculated. Calculation was based on 2 Fruit servings and 1 Vegetable serving.
Ontario Northern Ontario
Cost of 2 servings of Fruit Cost of 2 servings of Fruit
.36/serving x 2 servings = .72/day x 30 days = 21.60 .79/serving x 2 servings = 1.58/day x 30 days = 47.40
Cost of 1 serving of Vegetables Cost of 1 serving of Vegetables
.17/serving x 1 serving = .17/day x 30 days = 5.10 .50/serving x 1 serving = .50/day x 30 days = 15.00
Total = 26.70 Total = 62.40
Meat and Alternatives
To decrease fat, the difference between 2 servings of low fat Meat and Alternatives and 2 servings of regular Meat and Alternatives was calculated.
This calculation provides for low fat meats, increased fish and low fat meat alternatives such as low fat cheese. We assumed that over the course of one week, a healthy diet would include 7 servings of lean meat, 3 servings of fish and 4 servings of other low fat alternatives, providing an average of 2
13
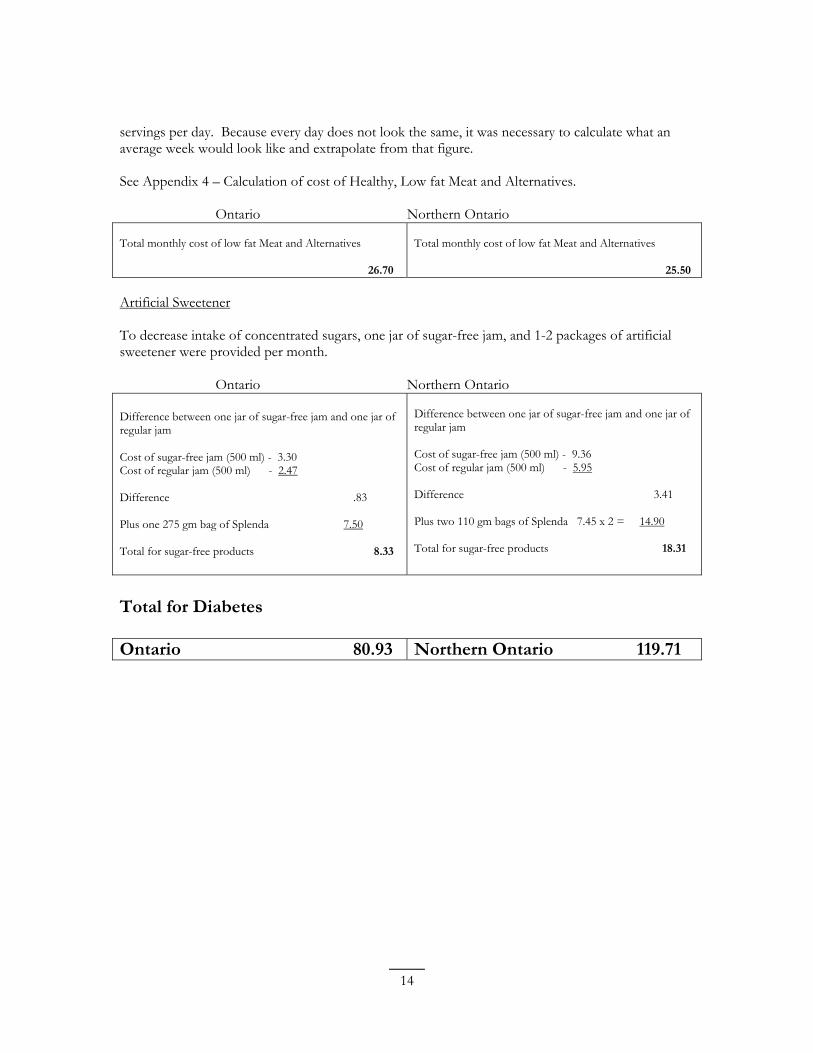
servings per day. Because every day does not look the same, it was necessary to calculate what an average week would look like and extrapolate from that figure.
See Appendix 4 – Calculation of cost of Healthy, Low fat Meat and Alternatives.
Ontario Northern Ontario
Total monthly cost of low fat Meat and Alternatives Total monthly cost of low fat Meat and Alternatives
26.70
Artificial Sweetener
To decrease intake of concentrated sugars, one jar of sugar-free jam, and 1-2 packages of artificial sweetener were provided per month.
Ontario Northern Ontario
Difference between one jar of sugar-free jam and one jar of regular jam
Difference between one jar of sugar-free jam and one jar of regular jam
Cost of sugar-free jam (500 ml) - 9.36Cost of sugar-free jam (500 ml) - 3.30 Cost of regular jam (500 ml) - 5.95Cost of regular jam (500 ml) - 2.47
Difference 3.41 Difference .83
Plus one 275 gm bag of Splenda 7.50 Plus two 110 gm bags of Splenda 7.45 x 2 = 14.90
Total for sugar-free products 18.31Total for sugar-free products 8.33
Total for Diabetes
Ontario 80.93 Northern Ontario 119.71
14
25.50
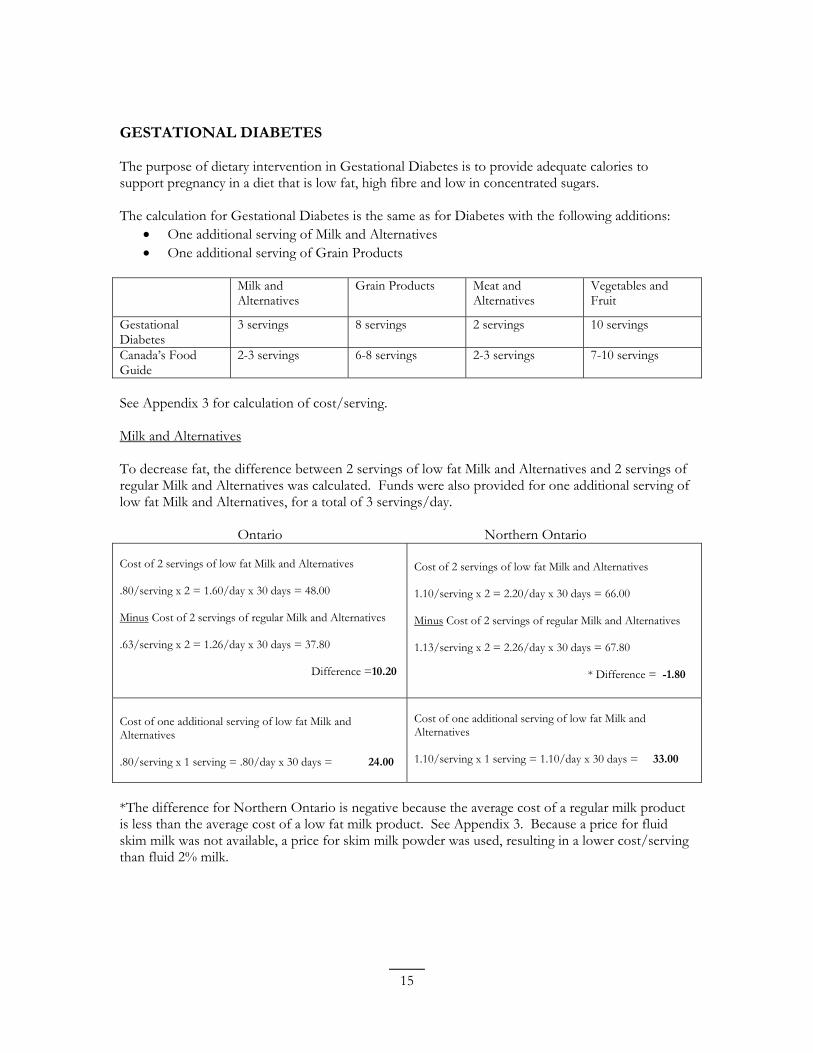
GESTATIONAL DIABETES
The purpose of dietary intervention in Gestational Diabetes is to provide adequate calories to support pregnancy in a diet that is low fat, high fibre and low in concentrated sugars.
The calculation for Gestational Diabetes is the same as for Diabetes with the following additions: • One additional serving of Milk and Alternatives • One additional serving of Grain Products
Milk and Alternatives
Grain Products Meat and Alternatives
Vegetables and Fruit
Gestational Diabetes
3 servings 8 servings 2 servings 10 servings
Canada’s Food Guide
2-3 servings 6-8 servings 2-3 servings 7-10 servings
See Appendix 3 for calculation of cost/serving.
Milk and Alternatives
To decrease fat, the difference between 2 servings of low fat Milk and Alternatives and 2 servings of regular Milk and Alternatives was calculated. Funds were also provided for one additional serving of low fat Milk and Alternatives, for a total of 3 servings/day.
Ontario Northern Ontario
Cost of 2 servings of low fat Milk and Alternatives Cost of 2 servings of low fat Milk and Alternatives
.80/serving x 2 = 1.60/day x 30 days = 48.00 1.10/serving x 2 = 2.20/day x 30 days = 66.00
Minus Cost of 2 servings of regular Milk and Alternatives Minus Cost of 2 servings of regular Milk and Alternatives
.63/serving x 2 = 1.26/day x 30 days = 37.80 1.13/serving x 2 = 2.26/day x 30 days = 67.80
Difference =10.20 * Difference = -1.80
Cost of one additional serving of low fat Milk and Cost of one additional serving of low fat Milk and Alternatives
1.10/serving x 1 serving = 1.10/day x 30 days = 33.00
Alternatives
.80/serving x 1 serving = .80/day x 30 days = 24.00
*The difference for Northern Ontario is negative because the average cost of a regular milk product is less than the average cost of a low fat milk product. See Appendix 3. Because a price for fluid skim milk was not available, a price for skim milk powder was used, resulting in a lower cost/serving than fluid 2% milk.
15
Grain Products
To increase fibre, the difference between 6 servings of whole grains and 6 servings of refined grains was calculated, plus the cost of one additional serving of whole grains for a total of 7 Grain Products per day.
Ontario Northern Ontario
Cost of 6 servings of whole Grain Products
.12/serving x 6 servings = .72/day x 30 days = 21.60
Minus Cost of 6 servings refined Grain Products
.09/serving x 6 servings = .54/day x 30 days = 16.20
Difference = 5.40
Cost of 6 servings of whole Grain Products
.27/serving x 6 servings = 1.62/day x 30 days = 48.60
Minus Cost of 6 servings refined Grain Products
.24/serving x 6 servings = 1.44/day x 30 days = 43.20
Difference = 5.40
Plus Cost of 2 additional serving of whole Grain Product
.12/ serving x 2 servings = .24/day x 30 days = 7.20
Plus Cost of 2 additional serving of whole Grain Product
.27/ serving x 2 serving = .54/day x 30 days = 16.20
Vegetables and Fruit
To increase fibre, the cost of 3 additional servings of Vegetables and Fruit was calculated. Calculation was based on 2 Fruit servings and 1 Vegetable serving.
Ontario Northern Ontario
Cost of 2 servings of Fruit Cost of 2 servings of Fruit
.36/serving x 2 servings = .72/day x 30 days = 21.60 .79/serving x 2 servings = 1.58/day x 30 days = 47.40
Cost of 1 serving of Vegetables Cost of 1 serving of Vegetables
.17/serving x 1 serving = .17/day x 30 days = 5.10 .50/serving x 1 serving = .50/day x 30 days = 15.00
Total = 26.70 Total = 62.40
Meat and Alternatives
To decrease fat, the difference between 2 servings of low fat Meat and Alternatives and 2 servings of regular Meat and Alternatives was calculated.
See Appendix 4 – Calculation of cost of Healthy, Low fat Meat and Alternatives
This calculation provides for low fat meats, increased fish and low fat meat alternatives such as low fat cheese. We assumed that over the course of one week, a healthy diet would include 7 servings of lean meat, 3 servings of fish and 4 servings of other low fat alternatives, providing an average of 2
16
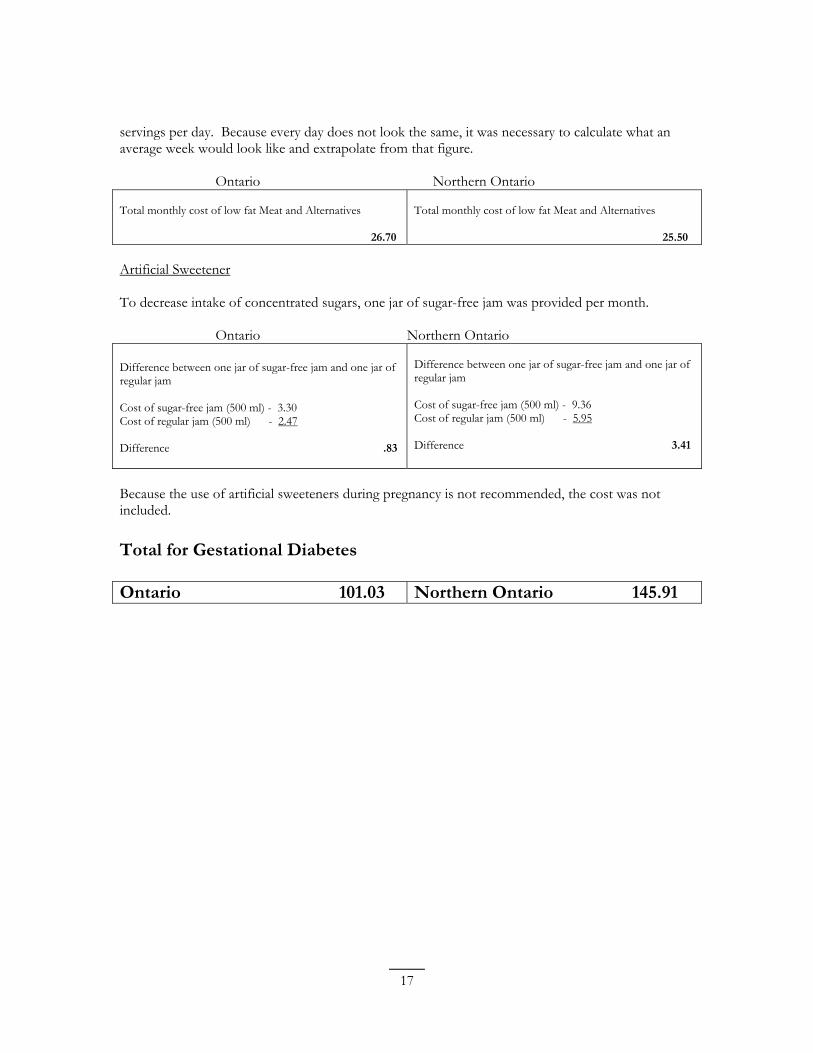
servings per day. Because every day does not look the same, it was necessary to calculate what an average week would look like and extrapolate from that figure.
Ontario Northern Ontario
Total monthly cost of low fat Meat and Alternatives Total monthly cost of low fat Meat and Alternatives
26.70 25.50
Artificial Sweetener
To decrease intake of concentrated sugars, one jar of sugar-free jam was provided per month.
Ontario Northern Ontario
Difference between one jar of sugar-free jam and one jar of Difference between one jar of sugar-free jam and one jar of regular jam regular jam
Cost of sugar-free jam (500 ml) - 9.36Cost of sugar-free jam (500 ml) - 3.30 Cost of regular jam (500 ml) - 5.95Cost of regular jam (500 ml) - 2.47
Difference .83 Difference 3.41
Because the use of artificial sweeteners during pregnancy is not recommended, the cost was not included.
Total for Gestational Diabetes
Ontario 101.03 Northern Ontario 145.91
17
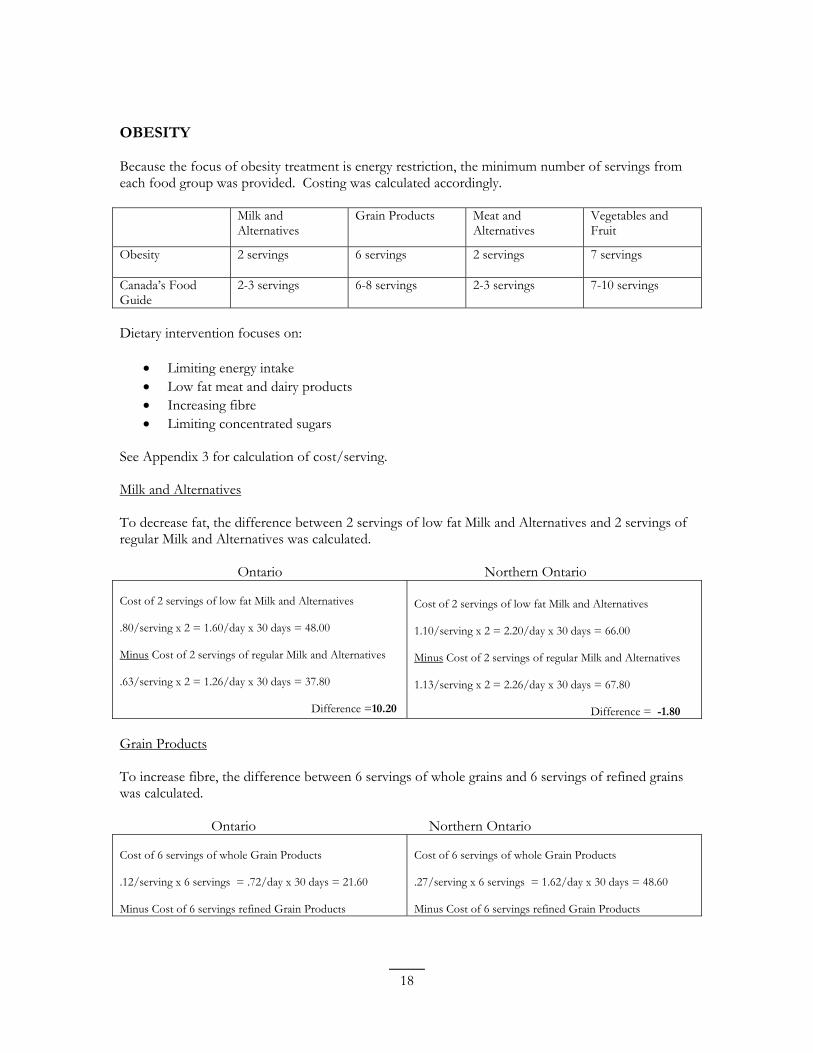
OBESITY
Because the focus of obesity treatment is energy restriction, the minimum number of servings from each food group was provided. Costing was calculated accordingly.
Milk and Alternatives
Grain Products Meat and Alternatives
Vegetables and Fruit
Obesity 2 servings 6 servings 2 servings 7 servings
Canada’s Food Guide
2-3 servings 6-8 servings 2-3 servings 7-10 servings
Dietary intervention focuses on:
• Limiting energy intake • Low fat meat and dairy products • Increasing fibre • Limiting concentrated sugars
See Appendix 3 for calculation of cost/serving.
Milk and Alternatives
To decrease fat, the difference between 2 servings of low fat Milk and Alternatives and 2 servings of regular Milk and Alternatives was calculated.
Ontario Northern Ontario
Cost of 2 servings of low fat Milk and Alternatives Cost of 2 servings of low fat Milk and Alternatives
.80/serving x 2 = 1.60/day x 30 days = 48.00 1.10/serving x 2 = 2.20/day x 30 days = 66.00
Minus Cost of 2 servings of regular Milk and Alternatives Minus Cost of 2 servings of regular Milk and Alternatives
.63/serving x 2 = 1.26/day x 30 days = 37.80 1.13/serving x 2 = 2.26/day x 30 days = 67.80
Difference =10.20 Difference = -1.80
Grain Products
To increase fibre, the difference between 6 servings of whole grains and 6 servings of refined grains was calculated.
Ontario Northern Ontario
Cost of 6 servings of whole Grain Products Cost of 6 servings of whole Grain Products
.12/serving x 6 servings = .72/day x 30 days = 21.60 .27/serving x 6 servings = 1.62/day x 30 days = 48.60
Minus Cost of 6 servings refined Grain Products Minus Cost of 6 servings refined Grain Products
18
.09/serving x 6 servings = .54/day x 30 days = 16.20 .24/serving x 6 servings = 1.44/day x 30 days = 43.20
Difference = 5.40 Difference = 5.40
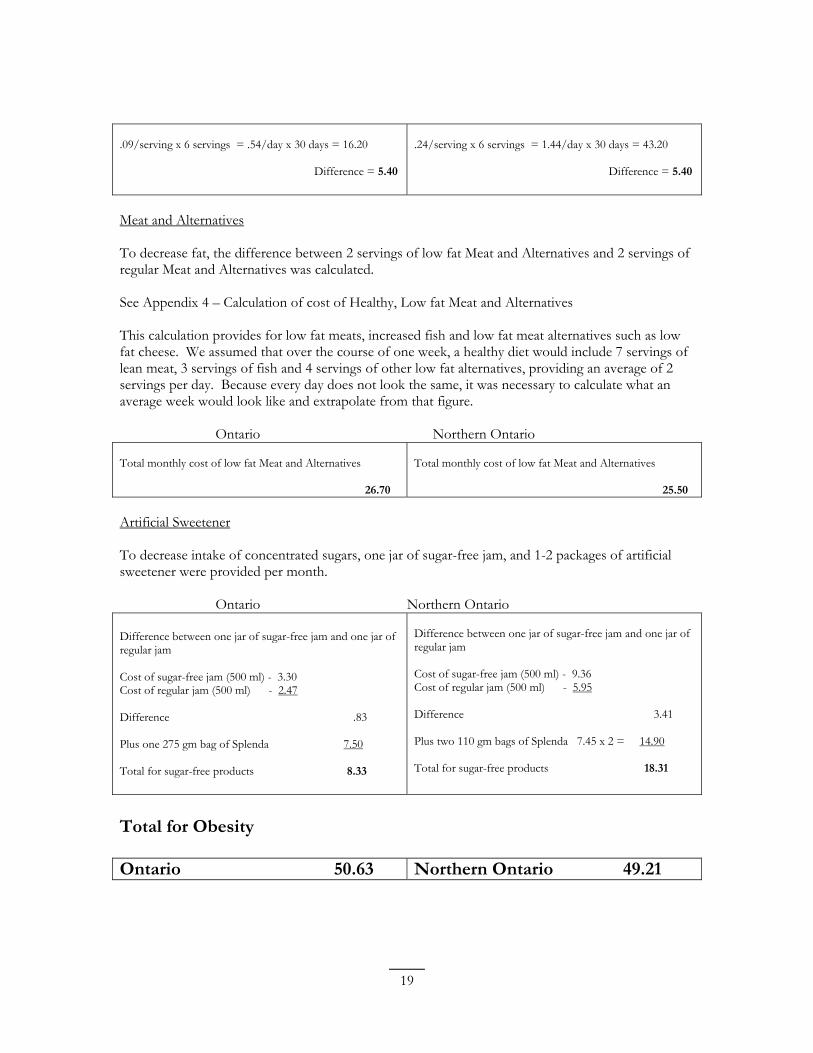
Meat and Alternatives
To decrease fat, the difference between 2 servings of low fat Meat and Alternatives and 2 servings of regular Meat and Alternatives was calculated.
See Appendix 4 – Calculation of cost of Healthy, Low fat Meat and Alternatives
This calculation provides for low fat meats, increased fish and low fat meat alternatives such as low fat cheese. We assumed that over the course of one week, a healthy diet would include 7 servings of lean meat, 3 servings of fish and 4 servings of other low fat alternatives, providing an average of 2 servings per day. Because every day does not look the same, it was necessary to calculate what an average week would look like and extrapolate from that figure.
Ontario Northern Ontario
Total monthly cost of low fat Meat and Alternatives
26.70
Total monthly cost of low fat Meat and Alternatives
25.50
Artificial Sweetener
To decrease intake of concentrated sugars, one jar of sugar-free jam, and 1-2 packages of artificial sweetener were provided per month.
Ontario Northern Ontario
Difference between one jar of sugar-free jam and one jar of regular jam
Difference between one jar of sugar-free jam and one jar of regular jam
Cost of sugar-free jam (500 ml) - 9.36Cost of sugar-free jam (500 ml) - 3.30 Cost of regular jam (500 ml) - 5.95Cost of regular jam (500 ml) - 2.47
Difference 3.41 Difference .83
Plus one 275 gm bag of Splenda 7.50 Plus two 110 gm bags of Splenda 7.45 x 2 = 14.90
Total for sugar-free products 18.31Total for sugar-free products 8.33
Total for Obesity
Ontario 50.63 Northern Ontario 49.21
19
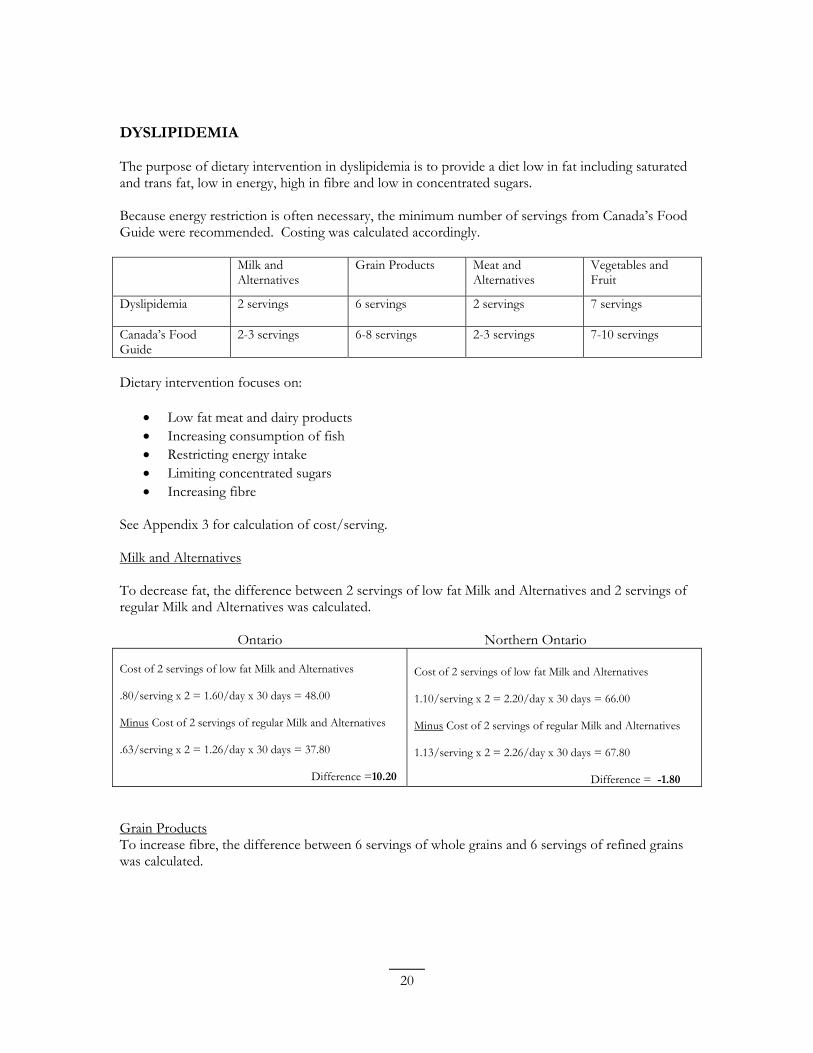
DYSLIPIDEMIA
The purpose of dietary intervention in dyslipidemia is to provide a diet low in fat including saturated and trans fat, low in energy, high in fibre and low in concentrated sugars.
Because energy restriction is often necessary, the minimum number of servings from Canada’s Food Guide were recommended. Costing was calculated accordingly.
Milk and Alternatives
Grain Products Meat and Alternatives
Vegetables and Fruit
Dyslipidemia 2 servings 6 servings 2 servings 7 servings
Canada’s Food Guide
2-3 servings 6-8 servings 2-3 servings 7-10 servings
Dietary intervention focuses on:
• Low fat meat and dairy products • Increasing consumption of fish • Restricting energy intake • Limiting concentrated sugars • Increasing fibre
See Appendix 3 for calculation of cost/serving.
Milk and Alternatives
To decrease fat, the difference between 2 servings of low fat Milk and Alternatives and 2 servings of regular Milk and Alternatives was calculated.
Ontario Northern Ontario
Cost of 2 servings of low fat Milk and Alternatives Cost of 2 servings of low fat Milk and Alternatives
.80/serving x 2 = 1.60/day x 30 days = 48.00 1.10/serving x 2 = 2.20/day x 30 days = 66.00
Minus Cost of 2 servings of regular Milk and Alternatives Minus Cost of 2 servings of regular Milk and Alternatives
.63/serving x 2 = 1.26/day x 30 days = 37.80 1.13/serving x 2 = 2.26/day x 30 days = 67.80
Difference =10.20 Difference = -1.80
Grain Products To increase fibre, the difference between 6 servings of whole grains and 6 servings of refined grains was calculated.
20
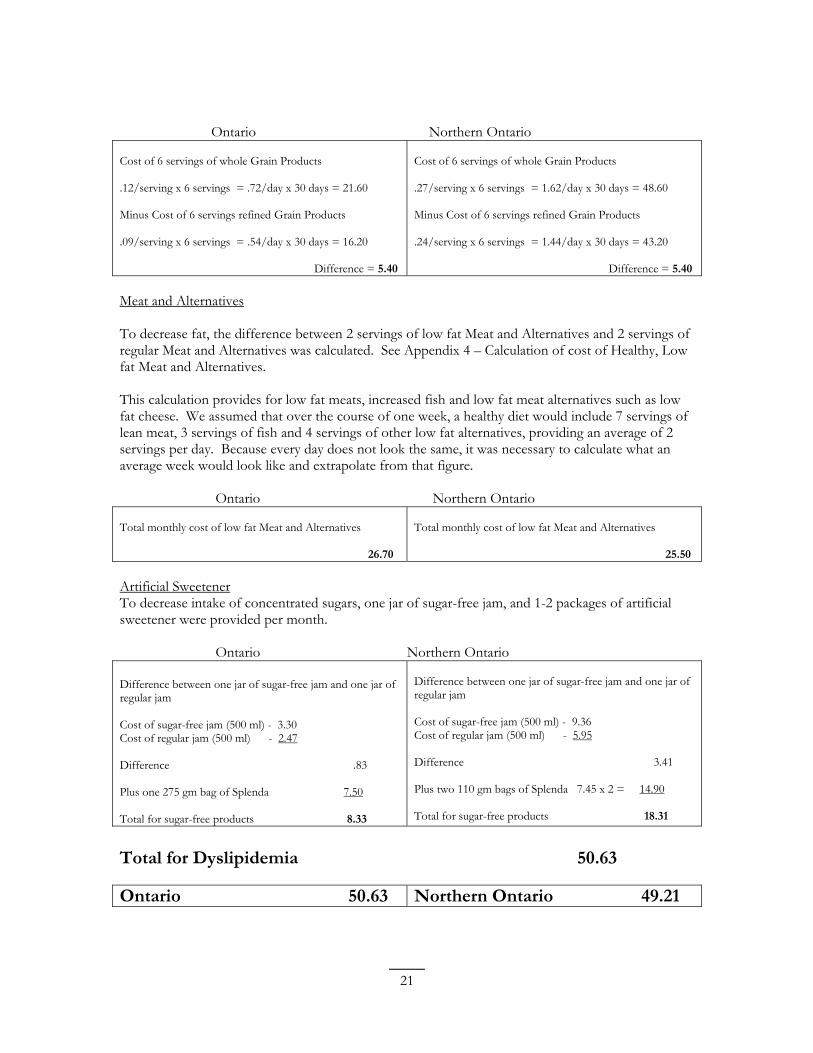
Ontario Northern Ontario
Cost of 6 servings of whole Grain Products Cost of 6 servings of whole Grain Products
.12/serving x 6 servings = .72/day x 30 days = 21.60 .27/serving x 6 servings = 1.62/day x 30 days = 48.60
Minus Cost of 6 servings refined Grain Products Minus Cost of 6 servings refined Grain Products
.09/serving x 6 servings = .54/day x 30 days = 16.20 .24/serving x 6 servings = 1.44/day x 30 days = 43.20
Difference = 5.40 Difference = 5.40
Meat and Alternatives
To decrease fat, the difference between 2 servings of low fat Meat and Alternatives and 2 servings of regular Meat and Alternatives was calculated. See Appendix 4 – Calculation of cost of Healthy, Low fat Meat and Alternatives.
This calculation provides for low fat meats, increased fish and low fat meat alternatives such as low fat cheese. We assumed that over the course of one week, a healthy diet would include 7 servings of lean meat, 3 servings of fish and 4 servings of other low fat alternatives, providing an average of 2 servings per day. Because every day does not look the same, it was necessary to calculate what an average week would look like and extrapolate from that figure.
Ontario Northern Ontario
Total monthly cost of low fat Meat and Alternatives
26.70
Total monthly cost of low fat Meat and Alternatives
25.50
Artificial Sweetener To decrease intake of concentrated sugars, one jar of sugar-free jam, and 1-2 packages of artificial sweetener were provided per month.
Ontario Northern Ontario
Difference between one jar of sugar-free jam and one jar of Difference between one jar of sugar-free jam and one jar of regular jam
Cost of sugar-free jam (500 ml) - 9.36
regular jam
Cost of sugar-free jam (500 ml) - 3.30 Cost of regular jam (500 ml) - 5.95Cost of regular jam (500 ml) - 2.47
Difference 3.41 Difference .83
Plus one 275 gm bag of Splenda 7.50 Plus two 110 gm bags of Splenda 7.45 x 2 = 14.90
Total for sugar-free products 18.31Total for sugar-free products 8.33
Total for Dyslipidemia 50.63
Ontario 50.63 Northern Ontario 49.21
21
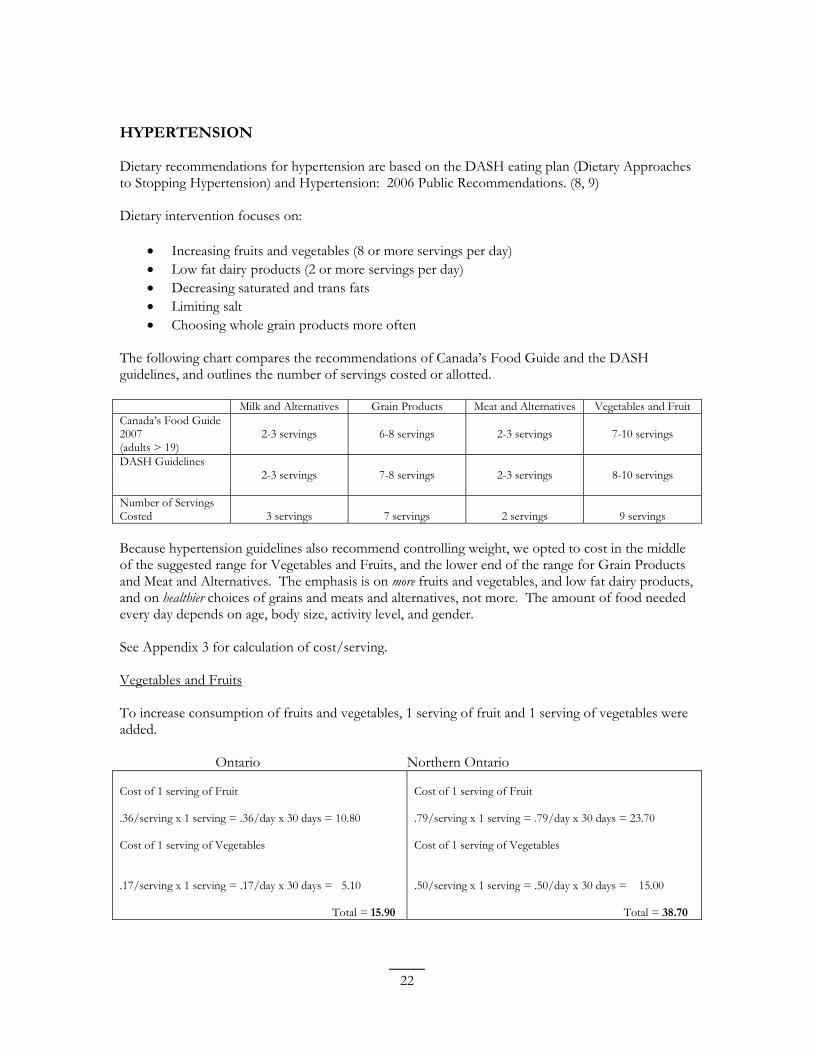
HYPERTENSION
Dietary recommendations for hypertension are based on the DASH eating plan (Dietary Approaches to Stopping Hypertension) and Hypertension: 2006 Public Recommendations. (8, 9)
Dietary intervention focuses on:
• Increasing fruits and vegetables (8 or more servings per day) • Low fat dairy products (2 or more servings per day) • Decreasing saturated and trans fats • Limiting salt • Choosing whole grain products more often
The following chart compares the recommendations of Canada’s Food Guide and the DASH guidelines, and outlines the number of servings costed or allotted.
Milk and Alternatives Grain Products Meat and Alternatives Vegetables and Fruit Canada’s Food Guide 2007 (adults > 19)
2-3 servings 6-8 servings 2-3 servings 7-10 servings
DASH Guidelines 2-3 servings 7-8 servings 2-3 servings 8-10 servings
Number of Servings Costed 3 servings 7 servings 2 servings 9 servings
Because hypertension guidelines also recommend controlling weight, we opted to cost in the middle of the suggested range for Vegetables and Fruits, and the lower end of the range for Grain Products and Meat and Alternatives. The emphasis is on more fruits and vegetables, and low fat dairy products, and on healthier choices of grains and meats and alternatives, not more. The amount of food needed every day depends on age, body size, activity level, and gender.
See Appendix 3 for calculation of cost/serving.
Vegetables and Fruits
To increase consumption of fruits and vegetables, 1 serving of fruit and 1 serving of vegetables were added.
Ontario Northern Ontario
Cost of 1 serving of Fruit Cost of 1 serving of Fruit
.36/serving x 1 serving = .36/day x 30 days = 10.80 .79/serving x 1 serving = .79/day x 30 days = 23.70
Cost of 1 serving of Vegetables Cost of 1 serving of Vegetables
.17/serving x 1 serving = .17/day x 30 days = 5.10 .50/serving x 1 serving = .50/day x 30 days = 15.00
Total = 15.90 Total = 38.70
22
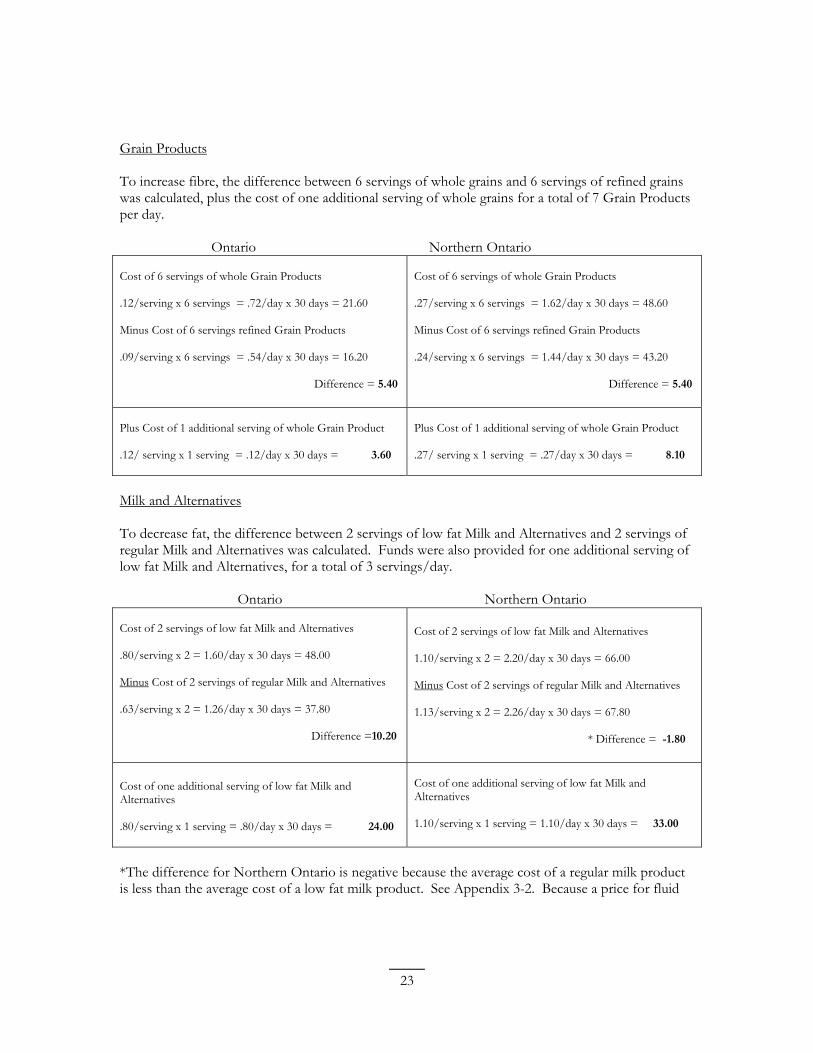
Grain Products
To increase fibre, the difference between 6 servings of whole grains and 6 servings of refined grains was calculated, plus the cost of one additional serving of whole grains for a total of 7 Grain Products per day.
Ontario Northern Ontario
Cost of 6 servings of whole Grain Products
.12/serving x 6 servings = .72/day x 30 days = 21.60
Minus Cost of 6 servings refined Grain Products
.09/serving x 6 servings = .54/day x 30 days = 16.20
Difference = 5.40
Cost of 6 servings of whole Grain Products
.27/serving x 6 servings = 1.62/day x 30 days = 48.60
Minus Cost of 6 servings refined Grain Products
.24/serving x 6 servings = 1.44/day x 30 days = 43.20
Difference = 5.40
Plus Cost of 1 additional serving of whole Grain Product
.12/ serving x 1 serving = .12/day x 30 days = 3.60
Plus Cost of 1 additional serving of whole Grain Product
.27/ serving x 1 serving = .27/day x 30 days = 8.10
Milk and Alternatives
To decrease fat, the difference between 2 servings of low fat Milk and Alternatives and 2 servings of regular Milk and Alternatives was calculated. Funds were also provided for one additional serving of low fat Milk and Alternatives, for a total of 3 servings/day.
Ontario Northern Ontario
Cost of 2 servings of low fat Milk and Alternatives Cost of 2 servings of low fat Milk and Alternatives
.80/serving x 2 = 1.60/day x 30 days = 48.00 1.10/serving x 2 = 2.20/day x 30 days = 66.00
Minus Cost of 2 servings of regular Milk and Alternatives Minus Cost of 2 servings of regular Milk and Alternatives
.63/serving x 2 = 1.26/day x 30 days = 37.80 1.13/serving x 2 = 2.26/day x 30 days = 67.80
Difference =10.20 * Difference = -1.80
Cost of one additional serving of low fat Milk and Cost of one additional serving of low fat Milk and Alternatives
1.10/serving x 1 serving = 1.10/day x 30 days = 33.00
Alternatives
.80/serving x 1 serving = .80/day x 30 days = 24.00
*The difference for Northern Ontario is negative because the average cost of a regular milk product is less than the average cost of a low fat milk product. See Appendix 3-2. Because a price for fluid
23
skim milk was not available, a price for skim milk powder was used, resulting in a lower cost/serving than fluid 2% milk.
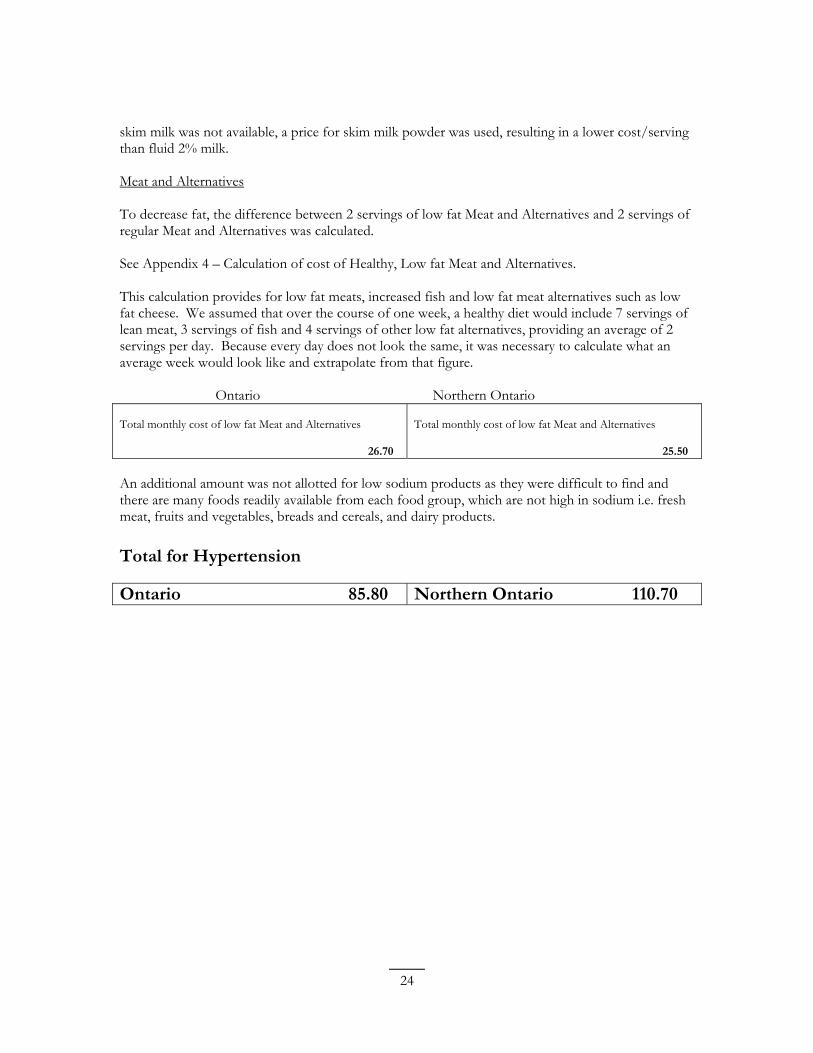
Meat and Alternatives
To decrease fat, the difference between 2 servings of low fat Meat and Alternatives and 2 servings of regular Meat and Alternatives was calculated.
See Appendix 4 – Calculation of cost of Healthy, Low fat Meat and Alternatives.
This calculation provides for low fat meats, increased fish and low fat meat alternatives such as low fat cheese. We assumed that over the course of one week, a healthy diet would include 7 servings of lean meat, 3 servings of fish and 4 servings of other low fat alternatives, providing an average of 2 servings per day. Because every day does not look the same, it was necessary to calculate what an average week would look like and extrapolate from that figure.
Ontario Northern Ontario
Total monthly cost of low fat Meat and Alternatives
26.70
Total monthly cost of low fat Meat and Alternatives
25.50
An additional amount was not allotted for low sodium products as they were difficult to find and there are many foods readily available from each food group, which are not high in sodium i.e. fresh meat, fruits and vegetables, breads and cereals, and dairy products.
Total for Hypertension
Ontario 85.80 Northern Ontario 110.70
24
DYSPHAGIA REQUIRING THICKENED FLUIDS
A diagnosis of dysphagia requires the modification of fluids to a thickened state in situations where the person is at risk for aspiration. The recommendations are based on satisfying a fluid requirement of 2000 ml per day in an effort to reduce the potential for dehydration.
Costing is based on the purchase of a thickening agent to produce a honey-thickened consistency of the volume required.
Preparation instructions require the addition of 3 Tbsp. (13.5 gm) of thickening agent to 250 ml of liquid. (26)
2000 ml/day ÷ 250 ml = 8 servings/day
8 servings/day x 13.5 gm = 108 gm required/day x 30 days = 3240 gm required/month
3240 gm ÷ 227 gm/can = 14.3 cans/month (rounded off to 15 cans)
Ontario Northern Ontario
Cost per 227 gm can = 8.29 Cost per 227 gm can = 9.00
8.29 x 15 cans/month = 124.35 9.00 x 15 cans/month = 135.00
Total for Dysphagia
Ontario 124.35 Northern Ontario 135.00
25
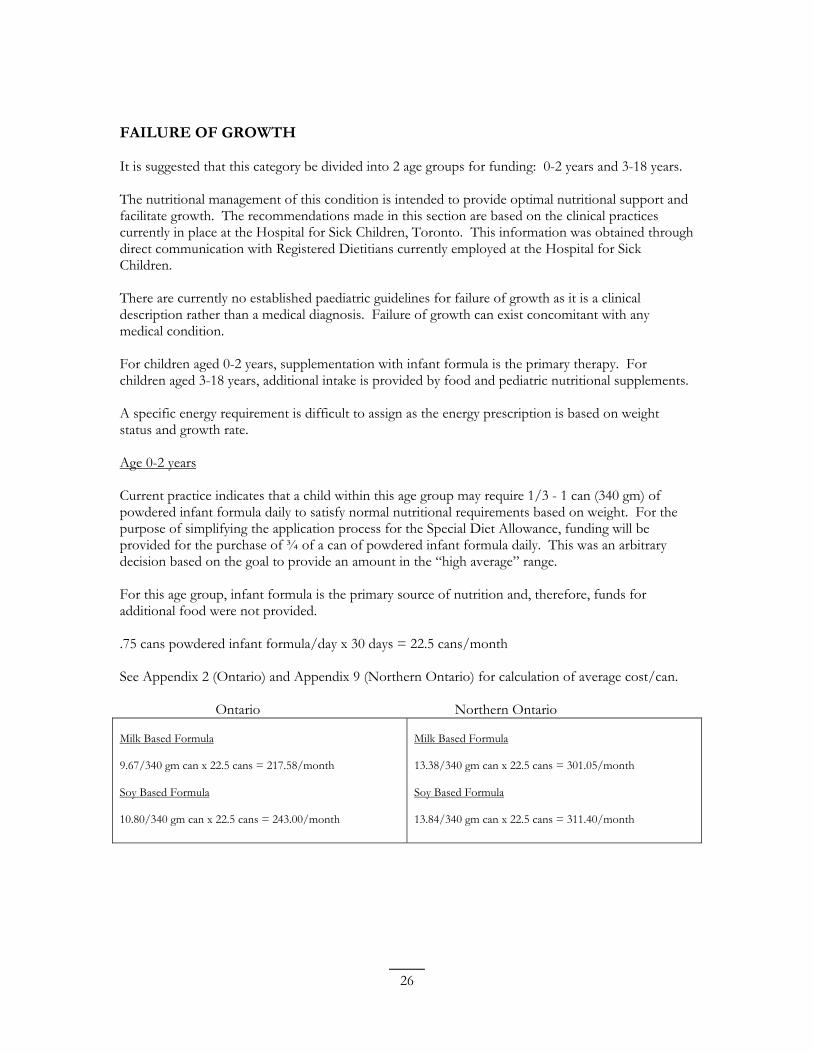
FAILURE OF GROWTH
It is suggested that this category be divided into 2 age groups for funding: 0-2 years and 3-18 years.
The nutritional management of this condition is intended to provide optimal nutritional support and facilitate growth. The recommendations made in this section are based on the clinical practices currently in place at the Hospital for Sick Children, Toronto. This information was obtained through direct communication with Registered Dietitians currently employed at the Hospital for Sick Children.
There are currently no established paediatric guidelines for failure of growth as it is a clinical description rather than a medical diagnosis. Failure of growth can exist concomitant with any medical condition.
For children aged 0-2 years, supplementation with infant formula is the primary therapy. For children aged 3-18 years, additional intake is provided by food and pediatric nutritional supplements.
A specific energy requirement is difficult to assign as the energy prescription is based on weight status and growth rate.
Age 0-2 years
Current practice indicates that a child within this age group may require 1/3 - 1 can (340 gm) of powdered infant formula daily to satisfy normal nutritional requirements based on weight. For the purpose of simplifying the application process for the Special Diet Allowance, funding will be provided for the purchase of ¾ of a can of powdered infant formula daily. This was an arbitrary decision based on the goal to provide an amount in the “high average” range.
For this age group, infant formula is the primary source of nutrition and, therefore, funds for additional food were not provided.
.75 cans powdered infant formula/day x 30 days = 22.5 cans/month
See Appendix 2 (Ontario) and Appendix 9 (Northern Ontario) for calculation of average cost/can.
Ontario Northern Ontario
Milk Based Formula Milk Based Formula
9.67/340 gm can x 22.5 cans = 217.58/month 13.38/340 gm can x 22.5 cans = 301.05/month
Soy Based Formula Soy Based Formula
10.80/340 gm can x 22.5 cans = 243.00/month 13.84/340 gm can x 22.5 cans = 311.40/month
26
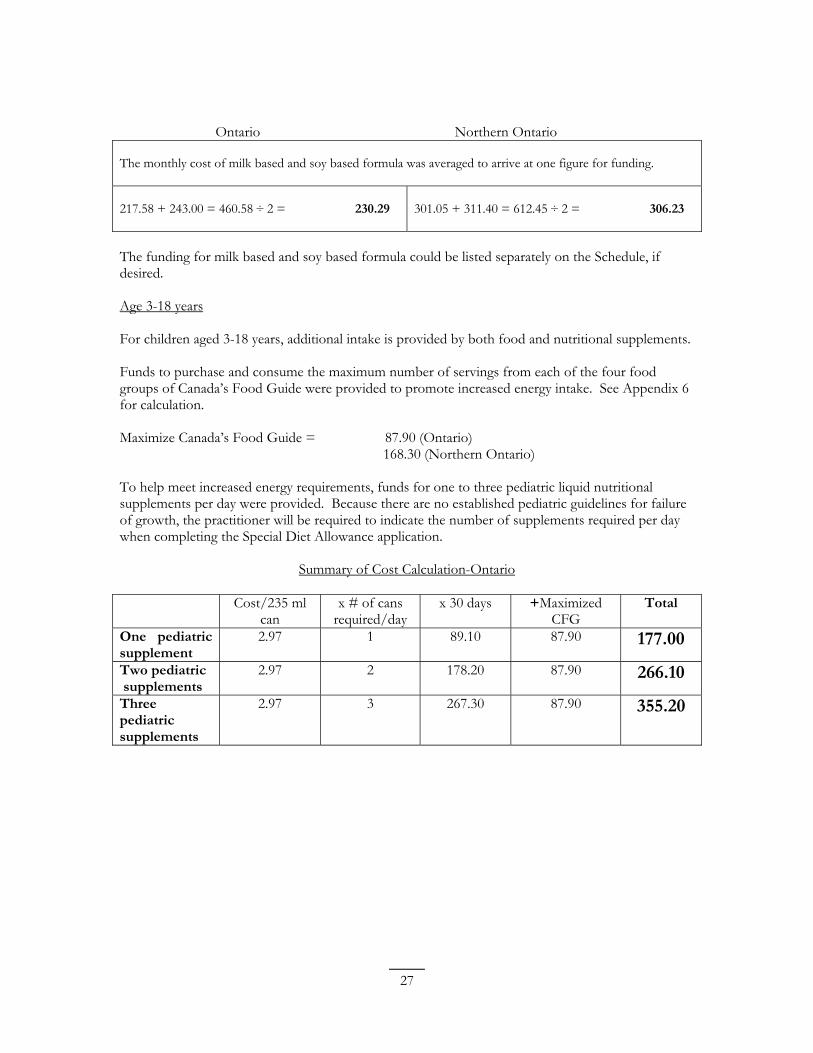
Ontario Northern Ontario
The monthly cost of milk based and soy based formula was averaged to arrive at one figure for funding.
217.58 + 243.00 = 460.58 ÷ 2 = 230.29 301.05 + 311.40 = 612.45 ÷ 2 = 306.23
The funding for milk based and soy based formula could be listed separately on the Schedule, if desired.
Age 3-18 years
For children aged 3-18 years, additional intake is provided by both food and nutritional supplements.
Funds to purchase and consume the maximum number of servings from each of the four food groups of Canada’s Food Guide were provided to promote increased energy intake. See Appendix 6 for calculation.
Maximize Canada’s Food Guide = 87.90 (Ontario) 168.30 (Northern Ontario)
To help meet increased energy requirements, funds for one to three pediatric liquid nutritional supplements per day were provided. Because there are no established pediatric guidelines for failure of growth, the practitioner will be required to indicate the number of supplements required per day when completing the Special Diet Allowance application.
Summary of Cost Calculation-Ontario
Cost/235 ml can
x # of cans required/day
x 30 days +Maximized CFG
Total
One pediatric supplement
2.97 1 89.10 87.90 177.00
Two pediatric supplements
2.97 2 178.20 87.90 266.10
Three pediatric supplements
2.97 3 267.30 87.90 355.20
27
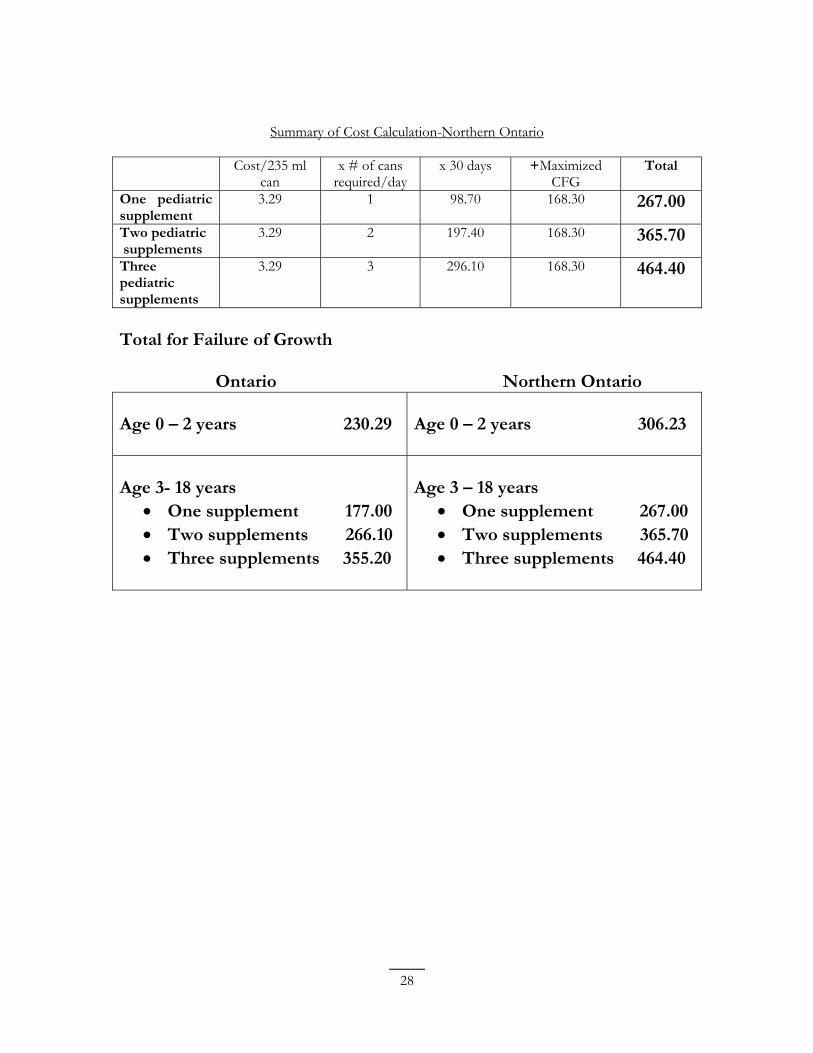
Summary of Cost Calculation-Northern Ontario
Cost/235 ml can
x # of cans required/day
x 30 days +Maximized CFG
Total
One pediatric supplement
3.29 1 98.70 168.30 267.00
Two pediatric supplements
3.29 2 197.40 168.30 365.70
Three pediatric supplements
3.29 3 296.10 168.30 464.40
Total for Failure of Growth
Ontario Northern Ontario
Age 0 – 2 years 230.29 Age 0 – 2 years 306.23
Age 3- 18 years • One supplement • Two supplements • Three supplements
177.00 266.10 355.20
Age 3 – 18 years • One supplement • Two supplements • Three supplements
267.00 365.70 464.40
28
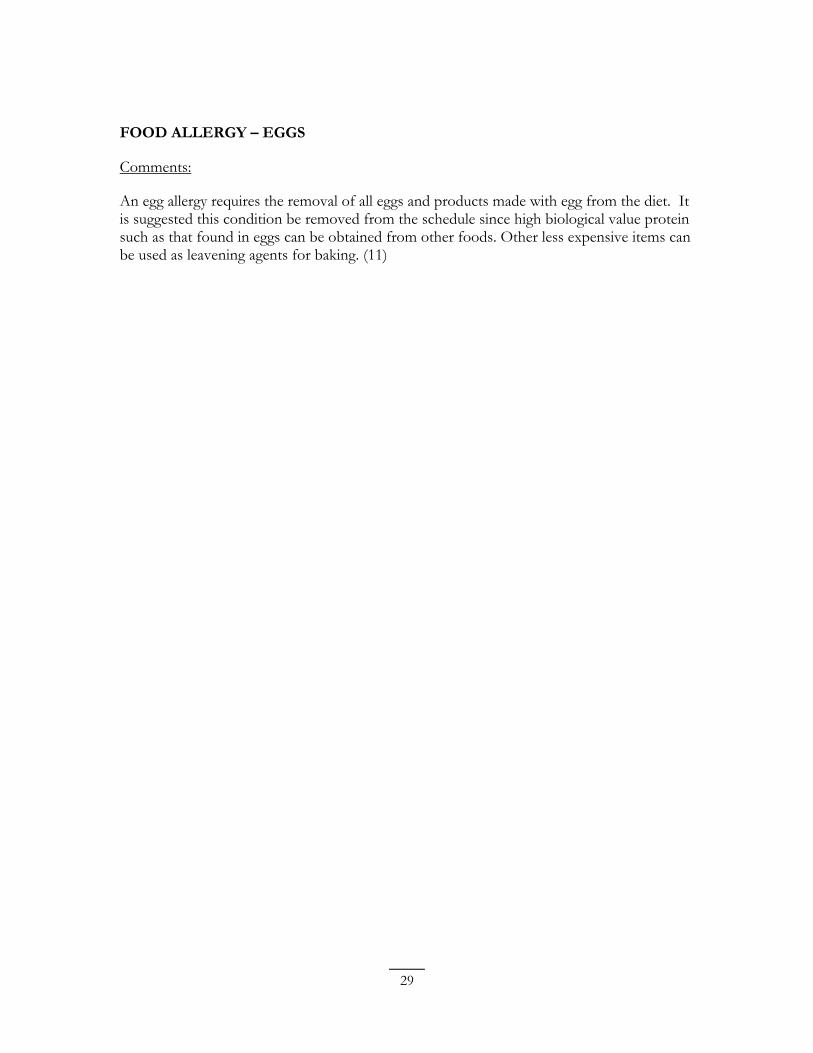
FOOD ALLERGY – EGGS
Comments:
An egg allergy requires the removal of all eggs and products made with egg from the diet. It is suggested this condition be removed from the schedule since high biological value protein such as that found in eggs can be obtained from other foods. Other less expensive items can be used as leavening agents for baking. (11)
29
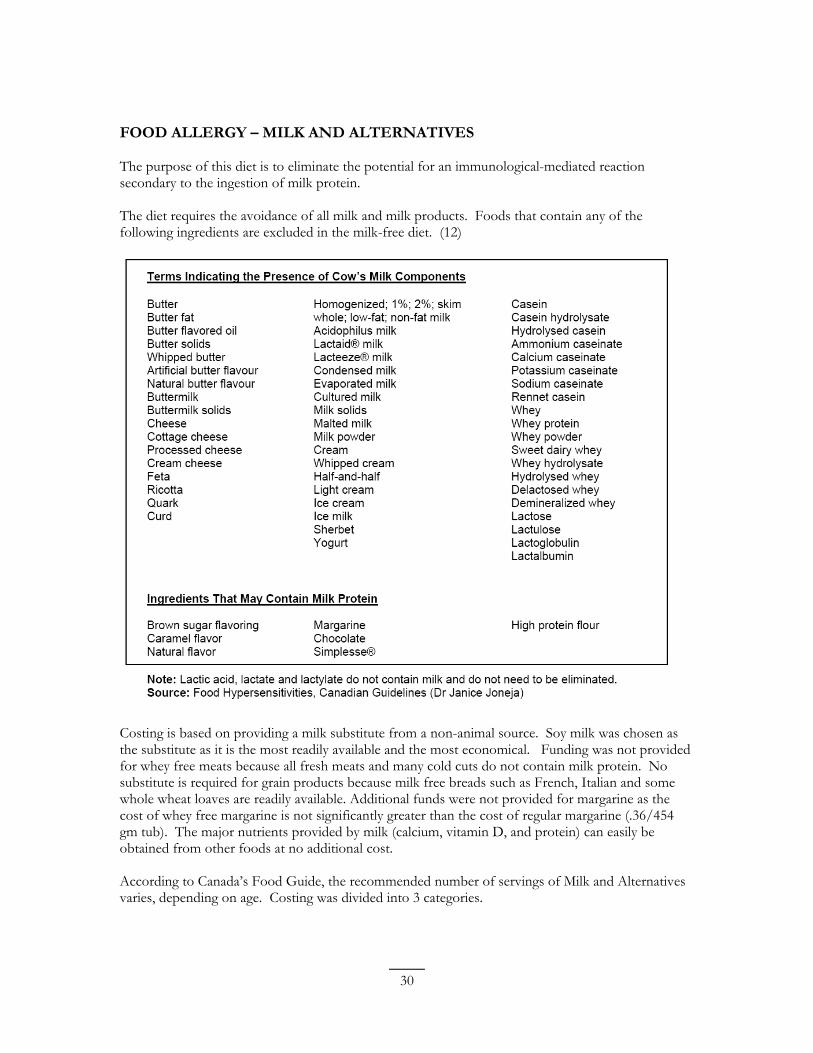
FOOD ALLERGY – MILK AND ALTERNATIVES
The purpose of this diet is to eliminate the potential for an immunological-mediated reaction secondary to the ingestion of milk protein.
The diet requires the avoidance of all milk and milk products. Foods that contain any of the following ingredients are excluded in the milk-free diet. (12)
Costing is based on providing a milk substitute from a non-animal source. Soy milk was chosen as the substitute as it is the most readily available and the most economical. Funding was not provided for whey free meats because all fresh meats and many cold cuts do not contain milk protein. No substitute is required for grain products because milk free breads such as French, Italian and some whole wheat loaves are readily available. Additional funds were not provided for margarine as the cost of whey free margarine is not significantly greater than the cost of regular margarine (.36/454 gm tub). The major nutrients provided by milk (calcium, vitamin D, and protein) can easily be obtained from other foods at no additional cost.
According to Canada’s Food Guide, the recommended number of servings of Milk and Alternatives varies, depending on age. Costing was divided into 3 categories.
30
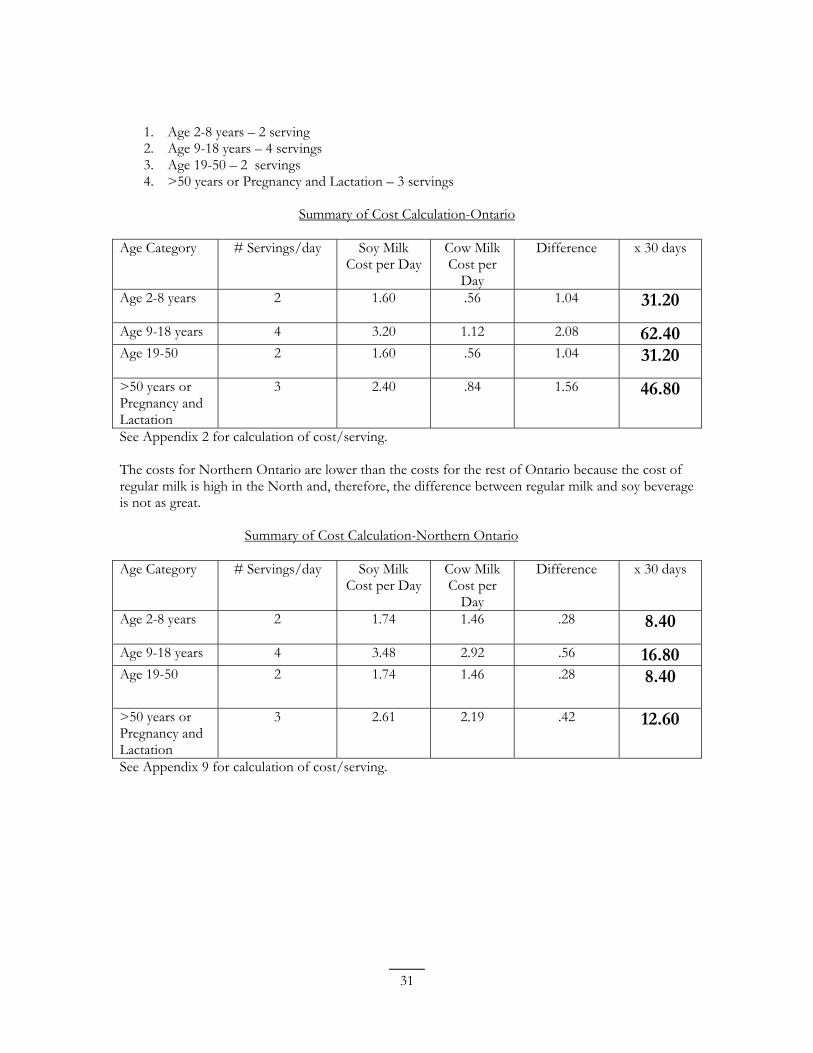
1. Age 2-8 years – 2 serving 2. Age 9-18 years – 4 servings 3. Age 19-50 – 2 servings 4. >50 years or Pregnancy and Lactation – 3 servings
Summary of Cost Calculation-Ontario
Age Category # Servings/day Soy Milk Cost per Day
Cow Milk Cost per
Day
Difference x 30 days
Age 2-8 years 2 1.60 .56 1.04 31.20
Age 9-18 years 4 3.20 1.12 2.08 62.40 Age 19-50 2 1.60 .56 1.04 31.20
>50 years or Pregnancy and Lactation
3 2.40 .84 1.56 46.80
See Appendix 2 for calculation of cost/serving.
The costs for Northern Ontario are lower than the costs for the rest of Ontario because the cost of regular milk is high in the North and, therefore, the difference between regular milk and soy beverage is not as great.
Summary of Cost Calculation-Northern Ontario
Age Category # Servings/day Soy Milk Cost per Day
Cow Milk Cost per
Day
Difference x 30 days
Age 2-8 years 2 1.74 1.46 .28 8.40
Age 9-18 years 4 3.48 2.92 .56 16.80 Age 19-50 2 1.74 1.46 .28 8.40
>50 years or Pregnancy and Lactation
3 2.61 2.19 .42 12.60
See Appendix 9 for calculation of cost/serving.
31
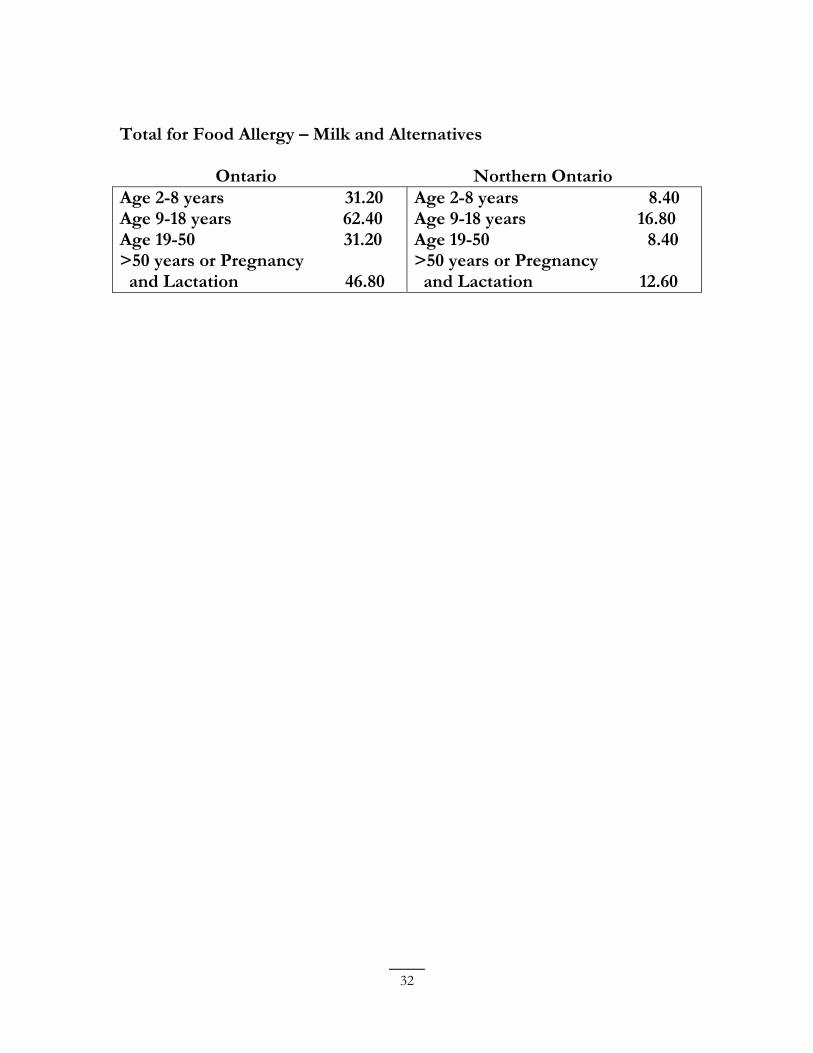
Total for Food Allergy – Milk and Alternatives
Ontario Northern Ontario Age 2-8 years 31.20 Age 2-8 years 8.40 Age 9-18 years 62.40 Age 9-18 years 16.80 Age 19-50 31.20 Age 19-50 8.40 >50 years or Pregnancy >50 years or Pregnancy and Lactation 46.80 and Lactation 12.60
32
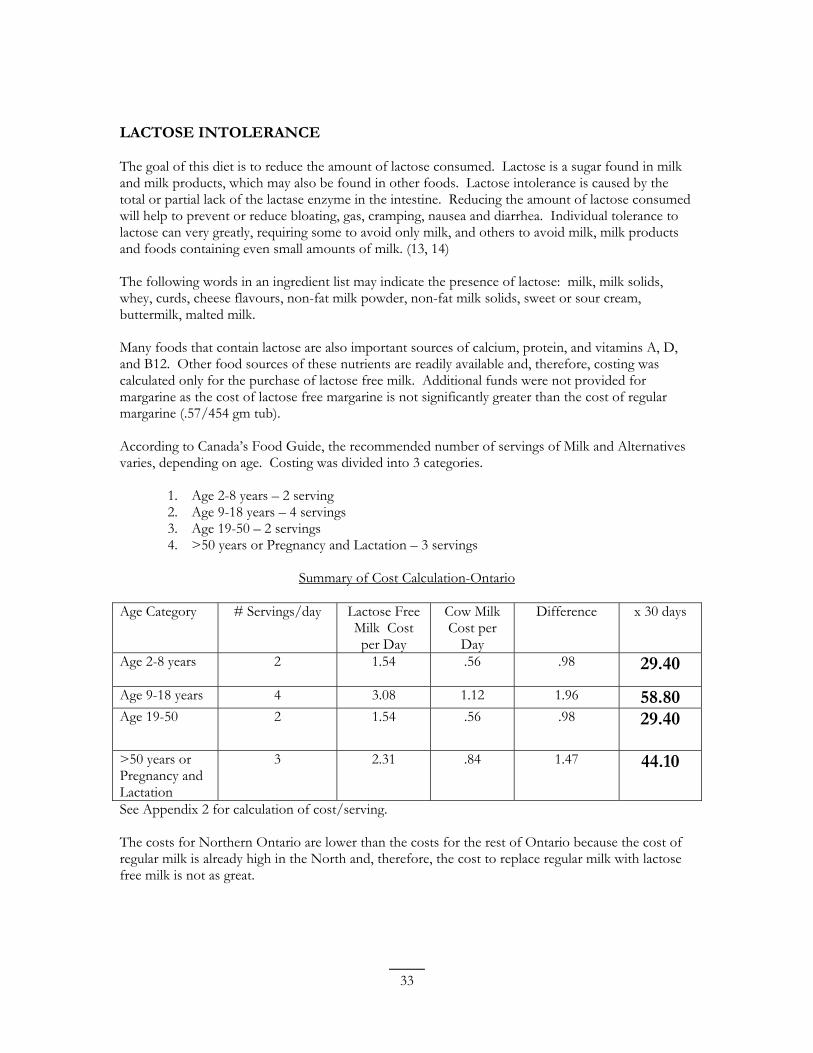
LACTOSE INTOLERANCE
The goal of this diet is to reduce the amount of lactose consumed. Lactose is a sugar found in milk and milk products, which may also be found in other foods. Lactose intolerance is caused by the total or partial lack of the lactase enzyme in the intestine. Reducing the amount of lactose consumed will help to prevent or reduce bloating, gas, cramping, nausea and diarrhea. Individual tolerance to lactose can very greatly, requiring some to avoid only milk, and others to avoid milk, milk products and foods containing even small amounts of milk. (13, 14)
The following words in an ingredient list may indicate the presence of lactose: milk, milk solids, whey, curds, cheese flavours, non-fat milk powder, non-fat milk solids, sweet or sour cream, buttermilk, malted milk.
Many foods that contain lactose are also important sources of calcium, protein, and vitamins A, D, and B12. Other food sources of these nutrients are readily available and, therefore, costing was calculated only for the purchase of lactose free milk. Additional funds were not provided for margarine as the cost of lactose free margarine is not significantly greater than the cost of regular margarine (.57/454 gm tub).
According to Canada’s Food Guide, the recommended number of servings of Milk and Alternatives varies, depending on age. Costing was divided into 3 categories.
1. Age 2-8 years – 2 serving 2. Age 9-18 years – 4 servings 3. Age 19-50 – 2 servings 4. >50 years or Pregnancy and Lactation – 3 servings
Summary of Cost Calculation-Ontario
Age Category # Servings/day Lactose Free Milk Cost per Day
Cow Milk Cost per
Day
Difference x 30 days
Age 2-8 years 2 1.54 .56 .98 29.40
Age 9-18 years 4 3.08 1.12 1.96 58.80 Age 19-50 2 1.54 .56 .98 29.40
>50 years or Pregnancy and Lactation
3 2.31 .84 1.47 44.10
See Appendix 2 for calculation of cost/serving.
The costs for Northern Ontario are lower than the costs for the rest of Ontario because the cost of regular milk is already high in the North and, therefore, the cost to replace regular milk with lactose free milk is not as great.
33
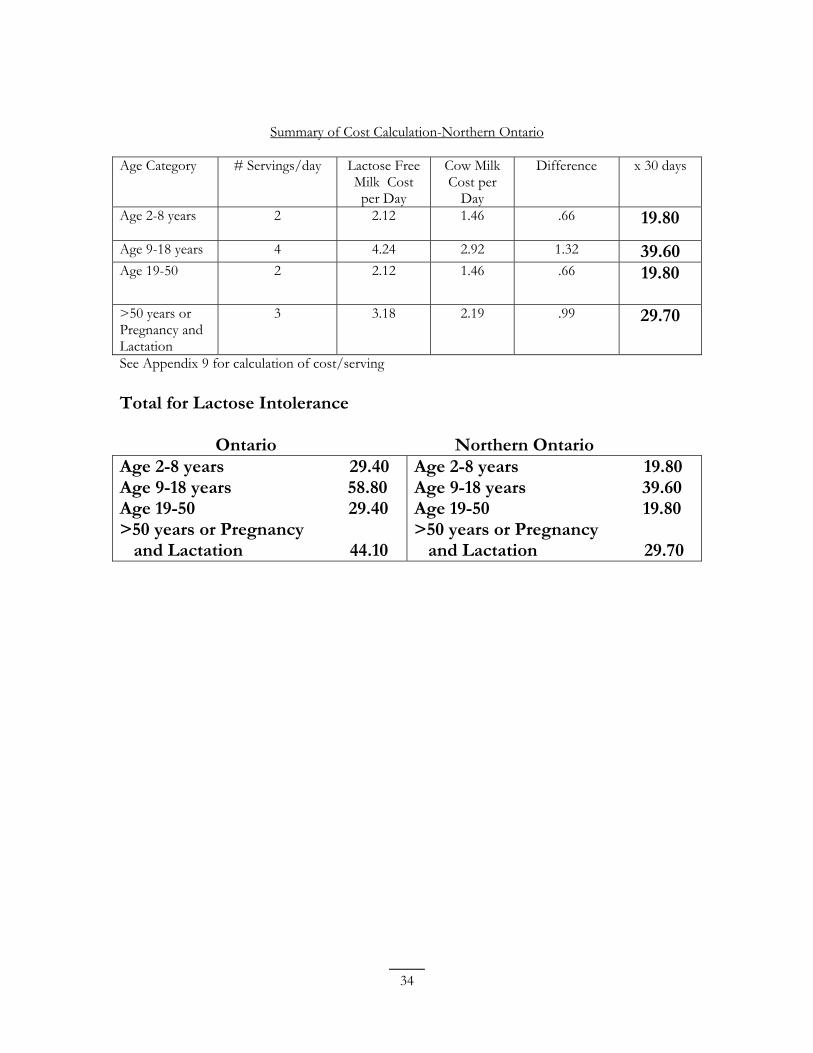
Summary of Cost Calculation-Northern Ontario
Age Category # Servings/day Lactose Free Milk Cost per Day
Cow Milk Cost per
Day
Difference x 30 days
Age 2-8 years 2 2.12 1.46 .66 19.80
Age 9-18 years 4 4.24 2.92 1.32 39.60 Age 19-50 2 2.12 1.46 .66 19.80
>50 years or Pregnancy and Lactation
3 3.18 2.19 .99 29.70
See Appendix 9 for calculation of cost/serving
Total for Lactose Intolerance
Ontario Age 2-8 years Age 9-18 years Age 19-50 >50 years or Pregnancy
and Lactation
29.40 58.80 29.40
44.10
Northern Ontario Age 2-8 years Age 9-18 years Age 19-50 >50 years or Pregnancy
and Lactation
19.80 39.60 19.80
29.70
34

FOOD ALLERGY – SOY
Suggest removing this condition since this can be accommodated by alternative food choices.
35
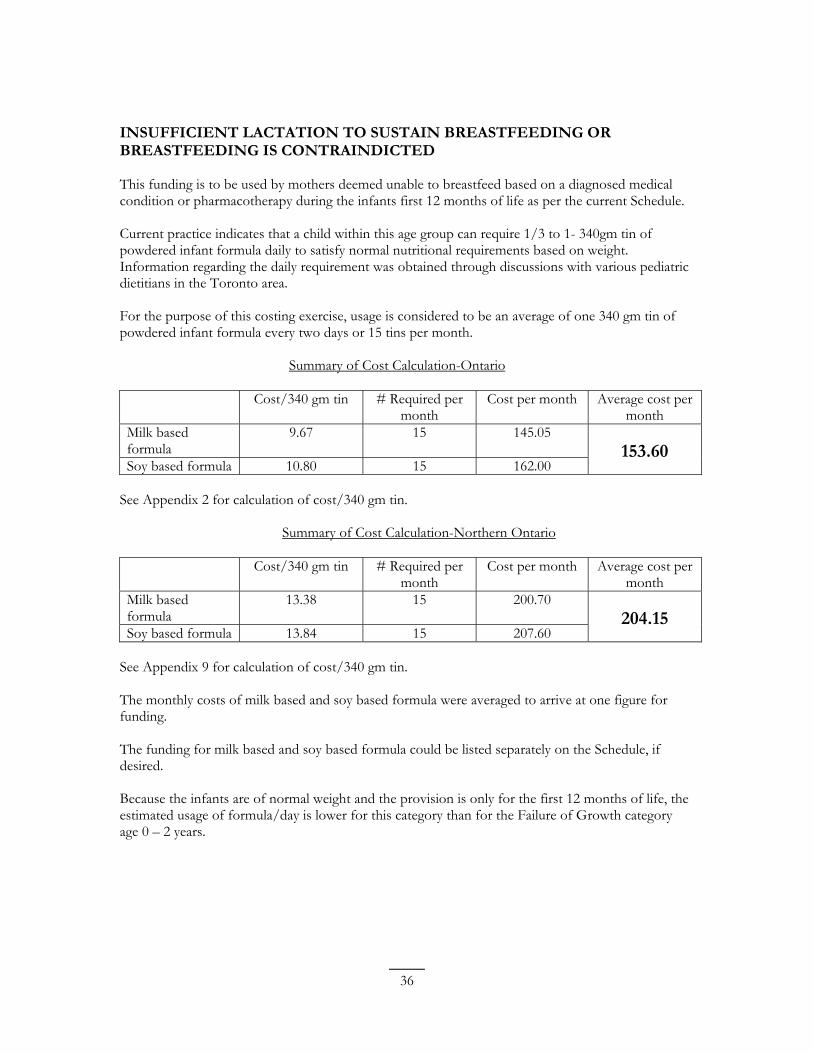
INSUFFICIENT LACTATION TO SUSTAIN BREASTFEEDING OR BREASTFEEDING IS CONTRAINDICTED
This funding is to be used by mothers deemed unable to breastfeed based on a diagnosed medical condition or pharmacotherapy during the infants first 12 months of life as per the current Schedule.
Current practice indicates that a child within this age group can require 1/3 to 1- 340gm tin of powdered infant formula daily to satisfy normal nutritional requirements based on weight. Information regarding the daily requirement was obtained through discussions with various pediatric dietitians in the Toronto area.
For the purpose of this costing exercise, usage is considered to be an average of one 340 gm tin of powdered infant formula every two days or 15 tins per month.
Summary of Cost Calculation-Ontario
Cost/340 gm tin # Required per month
Cost per month Average cost per month
Milk based formula
9.67 15 145.05 153.60
Soy based formula 10.80 15 162.00
See Appendix 2 for calculation of cost/340 gm tin.
Summary of Cost Calculation-Northern Ontario
Cost/340 gm tin # Required per month
Cost per month Average cost per month
Milk based formula
13.38 15 200.70 204.15
Soy based formula 13.84 15 207.60
See Appendix 9 for calculation of cost/340 gm tin.
The monthly costs of milk based and soy based formula were averaged to arrive at one figure for funding.
The funding for milk based and soy based formula could be listed separately on the Schedule, if desired.
Because the infants are of normal weight and the provision is only for the first 12 months of life, the estimated usage of formula/day is lower for this category than for the Failure of Growth category age 0 – 2 years.
36
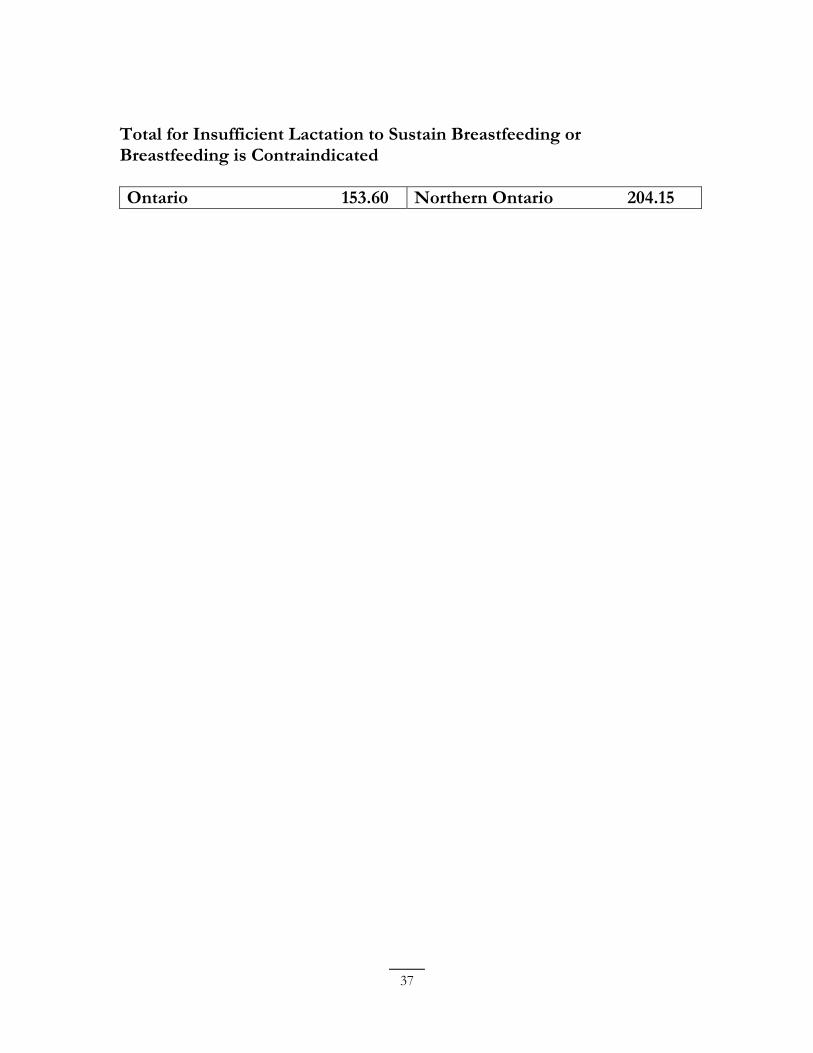
Total for Insufficient Lactation to Sustain Breastfeeding or Breastfeeding is Contraindicated
Ontario 153.60 Northern Ontario 204.15
37

METABOLIC BONE DISEASE
Suggest removing osteopenia and osteomalacia since there are no established nutritional recommendations for these conditions.
38
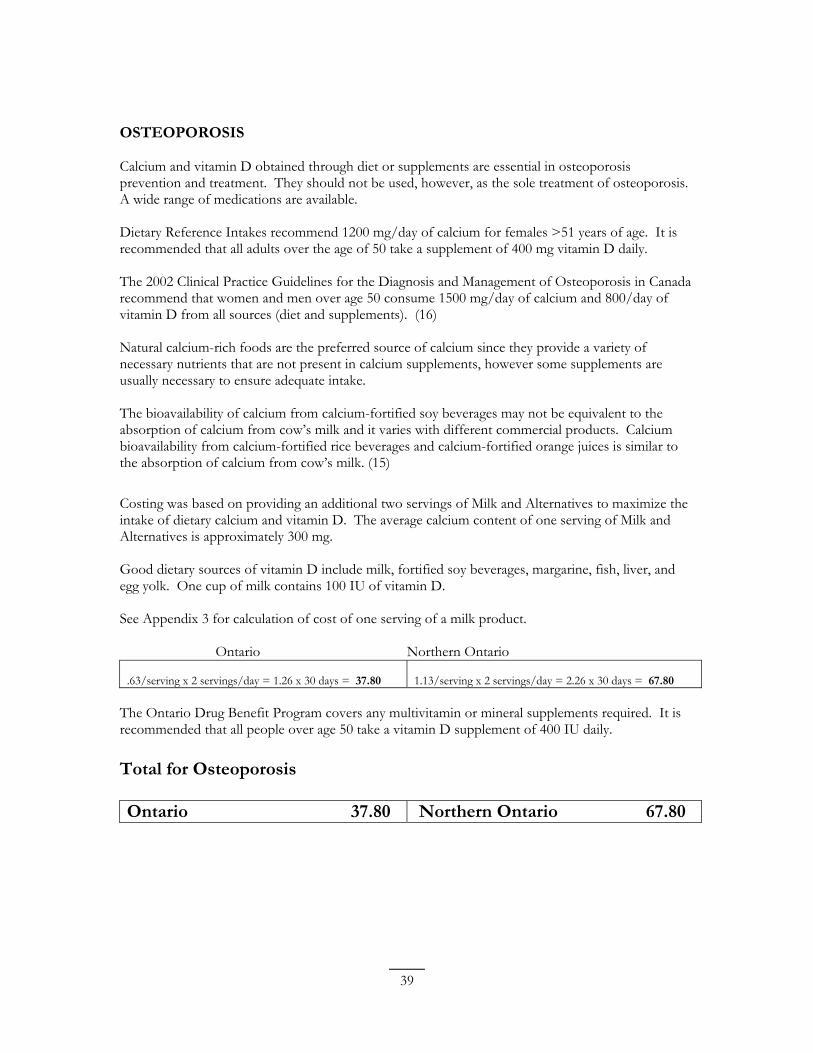
OSTEOPOROSIS
Calcium and vitamin D obtained through diet or supplements are essential in osteoporosis prevention and treatment. They should not be used, however, as the sole treatment of osteoporosis. A wide range of medications are available.
Dietary Reference Intakes recommend 1200 mg/day of calcium for females >51 years of age. It is recommended that all adults over the age of 50 take a supplement of 400 mg vitamin D daily.
The 2002 Clinical Practice Guidelines for the Diagnosis and Management of Osteoporosis in Canada recommend that women and men over age 50 consume 1500 mg/day of calcium and 800/day of vitamin D from all sources (diet and supplements). (16)
Natural calcium-rich foods are the preferred source of calcium since they provide a variety of necessary nutrients that are not present in calcium supplements, however some supplements are usually necessary to ensure adequate intake.
The bioavailability of calcium from calcium-fortified soy beverages may not be equivalent to the absorption of calcium from cow’s milk and it varies with different commercial products. Calcium bioavailability from calcium-fortified rice beverages and calcium-fortified orange juices is similar to the absorption of calcium from cow’s milk. (15)
Costing was based on providing an additional two servings of Milk and Alternatives to maximize the intake of dietary calcium and vitamin D. The average calcium content of one serving of Milk and Alternatives is approximately 300 mg.
Good dietary sources of vitamin D include milk, fortified soy beverages, margarine, fish, liver, and egg yolk. One cup of milk contains 100 IU of vitamin D.
See Appendix 3 for calculation of cost of one serving of a milk product.
Ontario Northern Ontario
.63/serving x 2 servings/day = 1.26 x 30 days = 37.80 1.13/serving x 2 servings/day = 2.26 x 30 days = 67.80
The Ontario Drug Benefit Program covers any multivitamin or mineral supplements required. It is recommended that all people over age 50 take a vitamin D supplement of 400 IU daily.
Total for Osteoporosis
Ontario 37.80 Northern Ontario 67.80
39
RENAL FAILURE
The primary goal of nutrition intervention in renal failure is to maintain or improve nutritional status while controlling the accumulation of uremic toxins, correct fluid and electrolyte imbalances. (17)
The various stages of renal failure must be considered when assigning extraordinary costs as nutritional needs vary.
Emphasis is placed on obtaining adequate amounts of high biological value protein in the presence of compromised renal function.
Predialysis
Dietary intervention focuses on providing:
1. High quality protein, not increased protein 2. Adequate energy
Protein requirement for predialysis is .6-.8 gm/kg/day. This translates into a protein requirement of 42-56 gm/day for the 70 kg man. This is met by the minimum number of servings of Canada’s Food Guide which provides approximately 58 grams of protein/day.
High quality protein is derived from foods of animal origin such as beef, pork, poultry, fish and eggs. Plant based sources of protein such as legumes, nuts, peanut butter are not ideal because they contain higher amounts of phosphorus and potassium, which often need to be limited.
Energy requirement for predialysis is 30-35 kcal/kg/day which translates into a daily energy requirement of 2100-2450 kcal/day for the 70 kg man.
Additional carbohydrates such as grains, sugar, jelly, jam, hard candy, honey and syrup may be used to increase energy intake without significantly increasing protein intake. Fats such as non-hydrogenated margarines, canola oil or olive oil may also be used. The cost of increasing energy intake with additional fats and sugars is not significant and, therefore, additional funding was not included.
See Appendix 3 for calculation of average cost/serving.
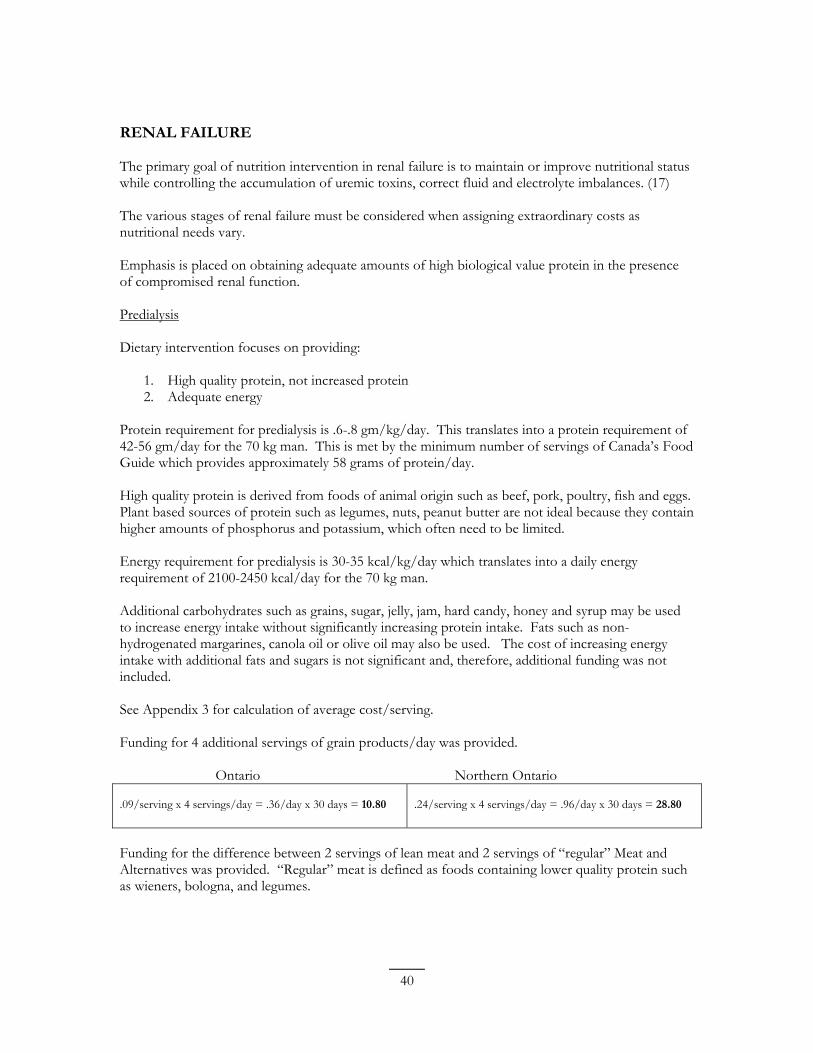
Funding for 4 additional servings of grain products/day was provided.
Ontario Northern Ontario
.09/serving x 4 servings/day = .36/day x 30 days = 10.80 .24/serving x 4 servings/day = .96/day x 30 days = 28.80
Funding for the difference between 2 servings of lean meat and 2 servings of “regular” Meat and Alternatives was provided. “Regular” meat is defined as foods containing lower quality protein such as wieners, bologna, and legumes.
40
Ontario
1.20/serving lean meat - .52/serving of “regular” meat = .68 x 2 servings/day = 1.36/day x 30 days = 40.80
Northern Ontario
1.89/serving lean meat – 1.11/serving of “regular” meat = .78 x 2 servings/day = 1.56/day x 30 days = 46.80
Total 51.60 Total 75.60
Peritoneal/Hemodialysis
Dietary intervention focuses on:
1. Increased protein of high biological value 2. Sodium restriction 3. Phosphorus restriction 4. Potassium restriction or increased requirement
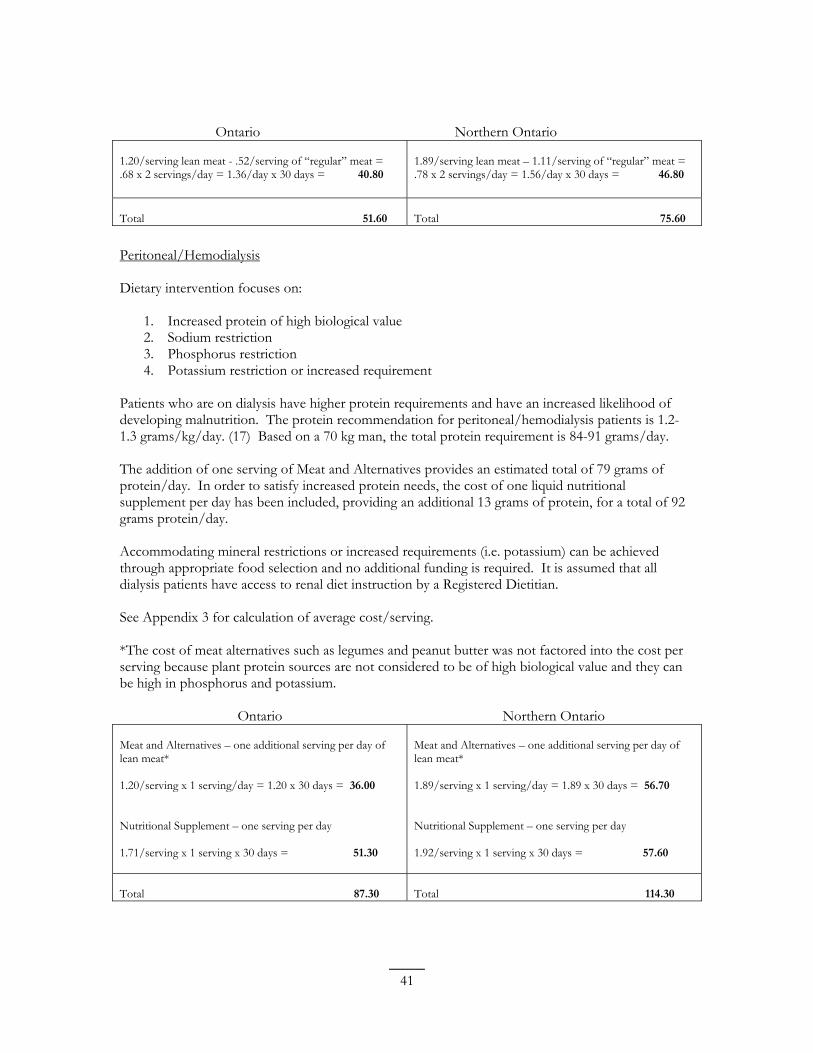
Patients who are on dialysis have higher protein requirements and have an increased likelihood of developing malnutrition. The protein recommendation for peritoneal/hemodialysis patients is 1.21.3 grams/kg/day. (17) Based on a 70 kg man, the total protein requirement is 84-91 grams/day.
The addition of one serving of Meat and Alternatives provides an estimated total of 79 grams of protein/day. In order to satisfy increased protein needs, the cost of one liquid nutritional supplement per day has been included, providing an additional 13 grams of protein, for a total of 92 grams protein/day.
Accommodating mineral restrictions or increased requirements (i.e. potassium) can be achieved through appropriate food selection and no additional funding is required. It is assumed that all dialysis patients have access to renal diet instruction by a Registered Dietitian.
See Appendix 3 for calculation of average cost/serving.
*The cost of meat alternatives such as legumes and peanut butter was not factored into the cost per serving because plant protein sources are not considered to be of high biological value and they can be high in phosphorus and potassium.
Ontario Northern Ontario
Meat and Alternatives – one additional serving per day of lean meat*
1.20/serving x 1 serving/day = 1.20 x 30 days = 36.00
Nutritional Supplement – one serving per day
1.71/serving x 1 serving x 30 days = 51.30
Meat and Alternatives – one additional serving per day of lean meat*
1.89/serving x 1 serving/day = 1.89 x 30 days = 56.70
Nutritional Supplement – one serving per day
1.92/serving x 1 serving x 30 days = 57.60
Total 87.30 Total 114.30
41
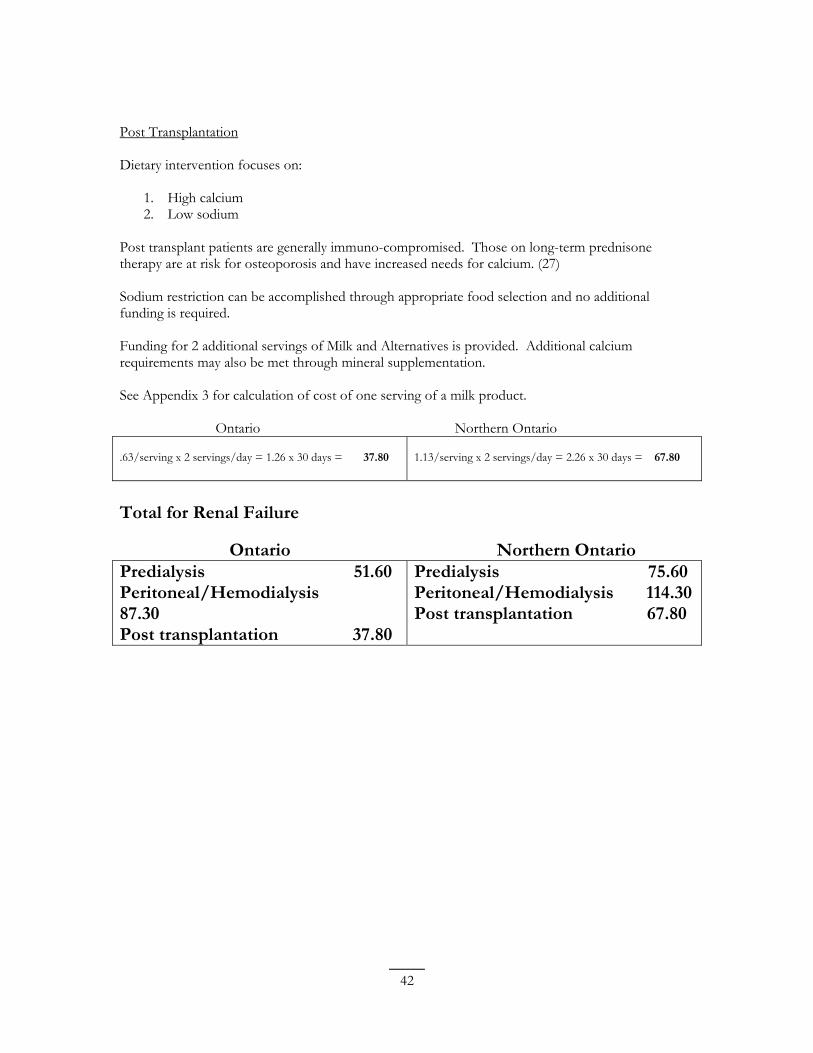
Post Transplantation
Dietary intervention focuses on:
1. High calcium 2. Low sodium
Post transplant patients are generally immuno-compromised. Those on long-term prednisone therapy are at risk for osteoporosis and have increased needs for calcium. (27)
Sodium restriction can be accomplished through appropriate food selection and no additional funding is required.
Funding for 2 additional servings of Milk and Alternatives is provided. Additional calcium requirements may also be met through mineral supplementation.
See Appendix 3 for calculation of cost of one serving of a milk product.
Ontario Northern Ontario
.63/serving x 2 servings/day = 1.26 x 30 days = 37.80 1.13/serving x 2 servings/day = 2.26 x 30 days = 67.80
Total for Renal Failure
OntarioPredialysis Peritoneal/Hemodialysis 87.30 Post transplantation
51.60
37.80
Northern Ontario Predialysis Peritoneal/Hemodialysis Post transplantation
75.60 114.30 67.80
42
CHRONIC WOUNDS AND BURNS
Wounds
The assumption was made that any trauma requiring additional protein is wound based and therefore the term “trauma” has been removed from the description.
The nutritional requirements for wounds are based on the classification of wounds as Stage I, II, III and IV and the requirements for energy and protein. (19)
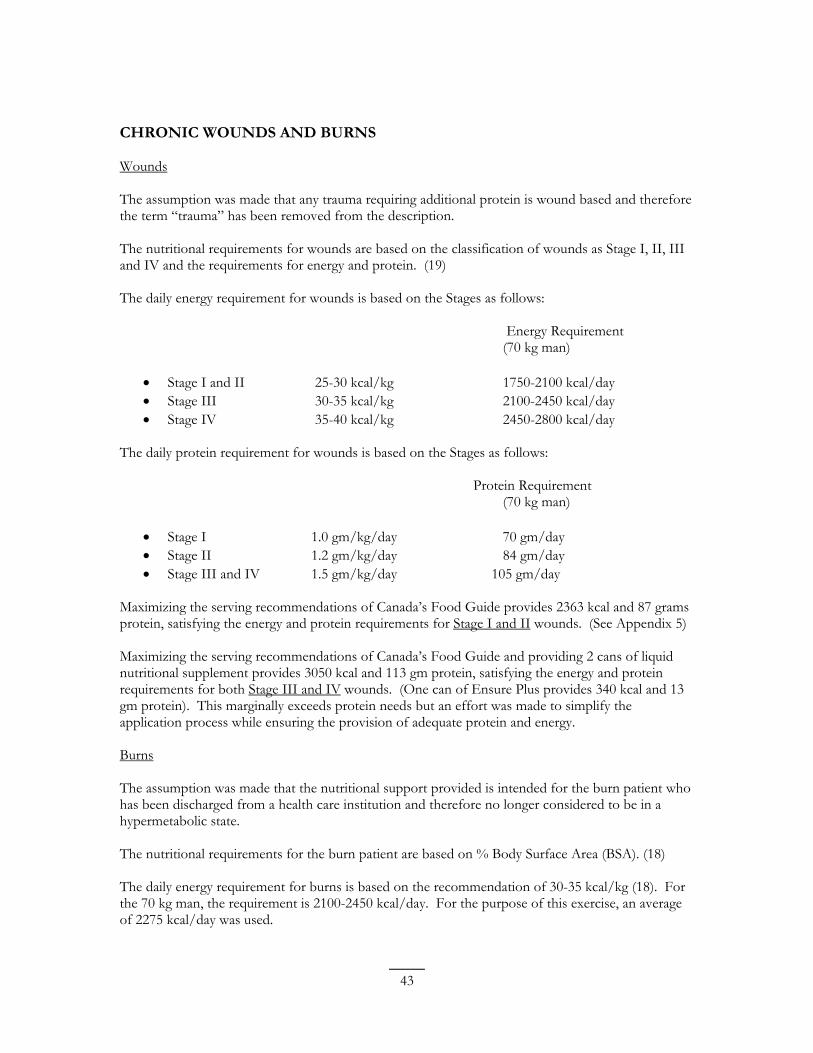
The daily energy requirement for wounds is based on the Stages as follows:
Energy Requirement (70 kg man)
• Stage I and II 25-30 kcal/kg 1750-2100 kcal/day • Stage III 30-35 kcal/kg 2100-2450 kcal/day • Stage IV 35-40 kcal/kg 2450-2800 kcal/day
The daily protein requirement for wounds is based on the Stages as follows:
Protein Requirement (70 kg man)
• Stage I 1.0 gm/kg/day 70 gm/day • Stage II 1.2 gm/kg/day 84 gm/day • Stage III and IV 1.5 gm/kg/day 105 gm/day
Maximizing the serving recommendations of Canada’s Food Guide provides 2363 kcal and 87 grams protein, satisfying the energy and protein requirements for Stage I and II wounds. (See Appendix 5)
Maximizing the serving recommendations of Canada’s Food Guide and providing 2 cans of liquid nutritional supplement provides 3050 kcal and 113 gm protein, satisfying the energy and protein requirements for both Stage III and IV wounds. (One can of Ensure Plus provides 340 kcal and 13 gm protein). This marginally exceeds protein needs but an effort was made to simplify the application process while ensuring the provision of adequate protein and energy.
Burns
The assumption was made that the nutritional support provided is intended for the burn patient who has been discharged from a health care institution and therefore no longer considered to be in a hypermetabolic state.
The nutritional requirements for the burn patient are based on % Body Surface Area (BSA). (18)
The daily energy requirement for burns is based on the recommendation of 30-35 kcal/kg (18). For the 70 kg man, the requirement is 2100-2450 kcal/day. For the purpose of this exercise, an average of 2275 kcal/day was used.
43
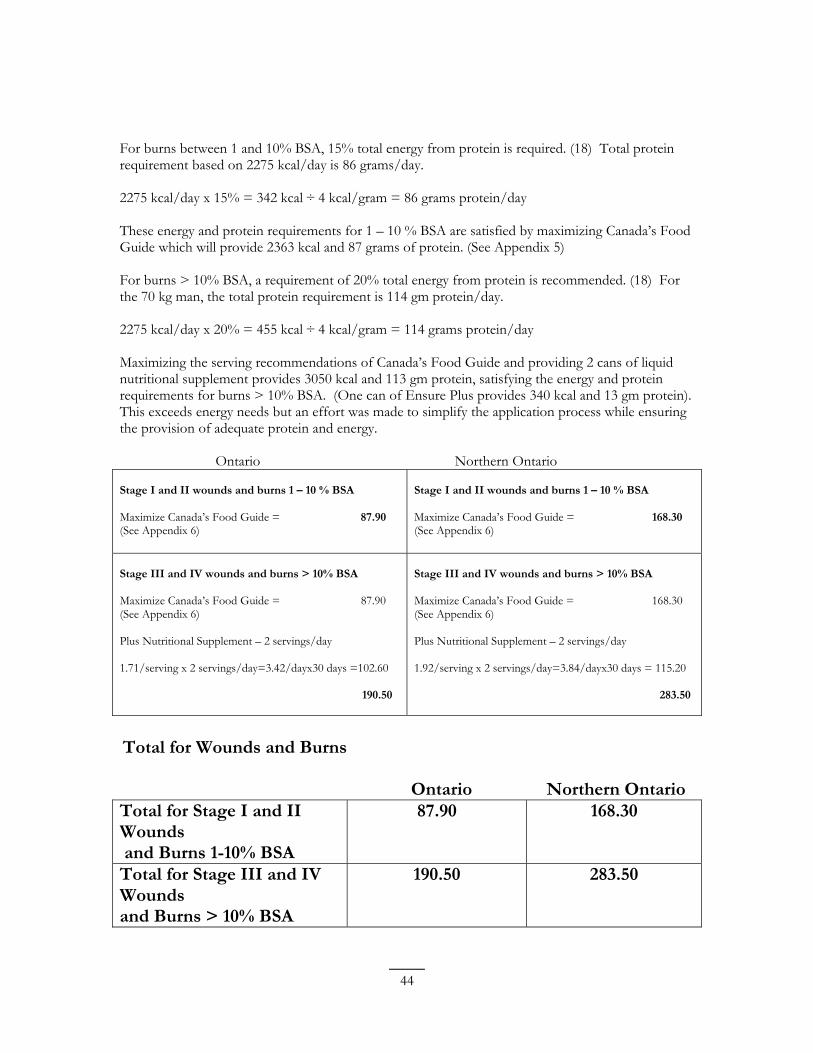
For burns between 1 and 10% BSA, 15% total energy from protein is required. (18) Total protein requirement based on 2275 kcal/day is 86 grams/day.
2275 kcal/day x 15% = 342 kcal ÷ 4 kcal/gram = 86 grams protein/day
These energy and protein requirements for 1 – 10 % BSA are satisfied by maximizing Canada’s Food Guide which will provide 2363 kcal and 87 grams of protein. (See Appendix 5)
For burns > 10% BSA, a requirement of 20% total energy from protein is recommended. (18) For the 70 kg man, the total protein requirement is 114 gm protein/day.
2275 kcal/day x 20% = 455 kcal ÷ 4 kcal/gram = 114 grams protein/day
Maximizing the serving recommendations of Canada’s Food Guide and providing 2 cans of liquid nutritional supplement provides 3050 kcal and 113 gm protein, satisfying the energy and protein requirements for burns > 10% BSA. (One can of Ensure Plus provides 340 kcal and 13 gm protein). This exceeds energy needs but an effort was made to simplify the application process while ensuring the provision of adequate protein and energy.
Ontario Northern Ontario
Stage I and II wounds and burns 1 – 10 % BSA
Maximize Canada’s Food Guide = 87.90 (See Appendix 6)
Stage I and II wounds and burns 1 – 10 % BSA
Maximize Canada’s Food Guide = 168.30 (See Appendix 6)
Stage III and IV wounds and burns > 10% BSA
Maximize Canada’s Food Guide = 87.90 (See Appendix 6)
Plus Nutritional Supplement – 2 servings/day
1.71/serving x 2 servings/day=3.42/dayx30 days =102.60
190.50
Stage III and IV wounds and burns > 10% BSA
Maximize Canada’s Food Guide = 168.30 (See Appendix 6)
Plus Nutritional Supplement – 2 servings/day
1.92/serving x 2 servings/day=3.84/dayx30 days = 115.20
283.50
Total for Wounds and Burns
Total for Stage I and II Wounds and Burns 1-10% BSA Total for Stage III and IV Wounds and Burns > 10% BSA
Ontario 87.90
190.50
Northern Ontario 168.30
283.50
44
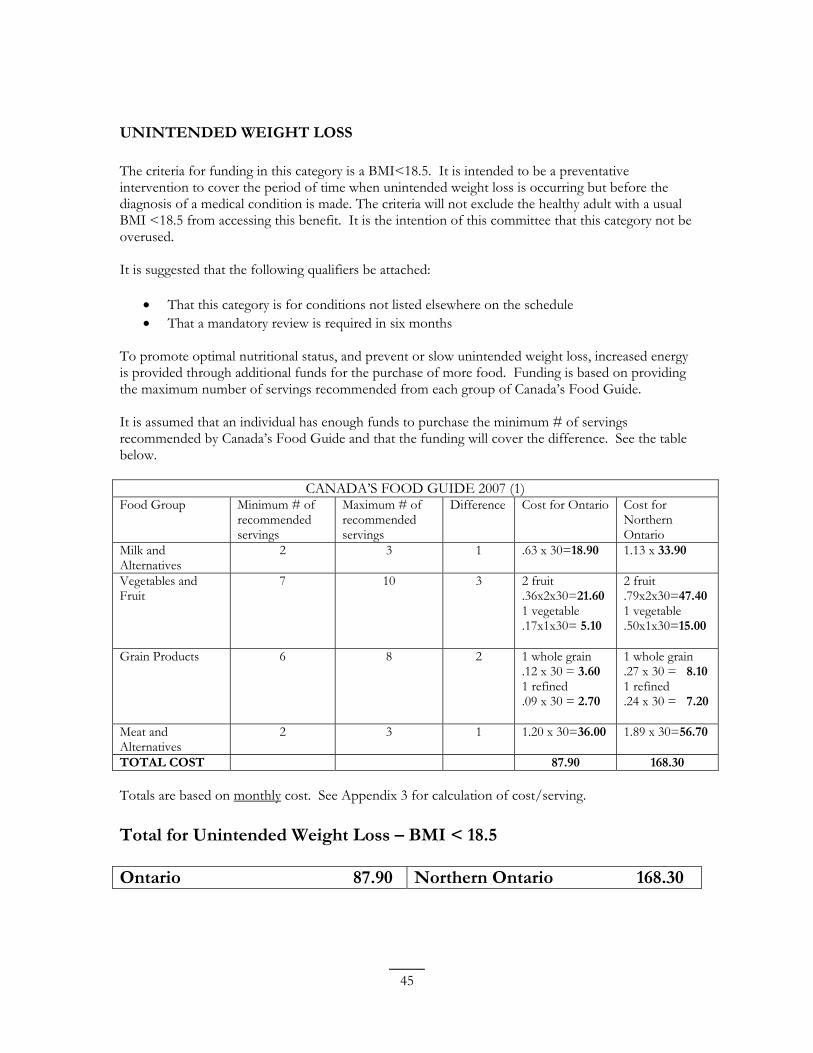
UNINTENDED WEIGHT LOSS
The criteria for funding in this category is a BMI<18.5. It is intended to be a preventative intervention to cover the period of time when unintended weight loss is occurring but before the diagnosis of a medical condition is made. The criteria will not exclude the healthy adult with a usual BMI <18.5 from accessing this benefit. It is the intention of this committee that this category not be overused.
It is suggested that the following qualifiers be attached:
• That this category is for conditions not listed elsewhere on the schedule • That a mandatory review is required in six months
To promote optimal nutritional status, and prevent or slow unintended weight loss, increased energy is provided through additional funds for the purchase of more food. Funding is based on providing the maximum number of servings recommended from each group of Canada’s Food Guide.
It is assumed that an individual has enough funds to purchase the minimum # of servings recommended by Canada’s Food Guide and that the funding will cover the difference. See the table below.
CANADA’S FOOD GUIDE 2007 (1) Food Group Minimum # of
recommended servings
Maximum # of recommended servings
Difference Cost for Ontario Cost for Northern Ontario
Milk and Alternatives
2 3 1 .63 x 30=18.90 1.13 x 33.90
Vegetables and Fruit
7 10 3 2 fruit .36x2x30=21.60 1 vegetable .17x1x30= 5.10
2 fruit .79x2x30=47.40 1 vegetable .50x1x30=15.00
Grain Products 6 8 2 1 whole grain .12 x 30 = 3.60 1 refined .09 x 30 = 2.70
1 whole grain .27 x 30 = 8.10 1 refined .24 x 30 = 7.20
Meat and Alternatives
2 3 1 1.20 x 30=36.00 1.89 x 30=56.70
TOTAL COST 87.90 168.30
Totals are based on monthly cost. See Appendix 3 for calculation of cost/serving.
Total for Unintended Weight Loss – BMI < 18.5
Ontario 87.90 Northern Ontario 168.30
45
CONGESTIVE HEART FAILURE
Sodium restriction is the primary nutritional therapy for treatment of Congestive Heart Failure (CHF).
Current nutritional guidelines recommend a level of sodium restriction of 87 – 130 mmol. (20) Patients with severe CHF have increased energy and protein requirements 20 – 30% above basal requirements. (21) This subset of CHF patients will be captured in the ‘unintended weight loss due to…’ category.
Suggest: Remove this category as sodium restriction is the primary therapy and there are no extraordinary costs associated with this restriction. Patients with CHF are at risk of cardiac cachexia. Those recipients with measurable weight loss would be accommodated under the “Unintended weight loss….” which is based on percentage of usual weight.
46
OSTOMIES
Suggest eliminating this based on the absence of evidence to support special dietary interventions based solely on the presence of the ostomy. The only nutritional intervention is rehydration solution, which is easily prepared at home or obtained via prescription (i.e. Gastrolyte).
In the presence of steatorrhea, fat restriction is recommended but this concern is captured in the ‘Unintended weight loss’ group.
47
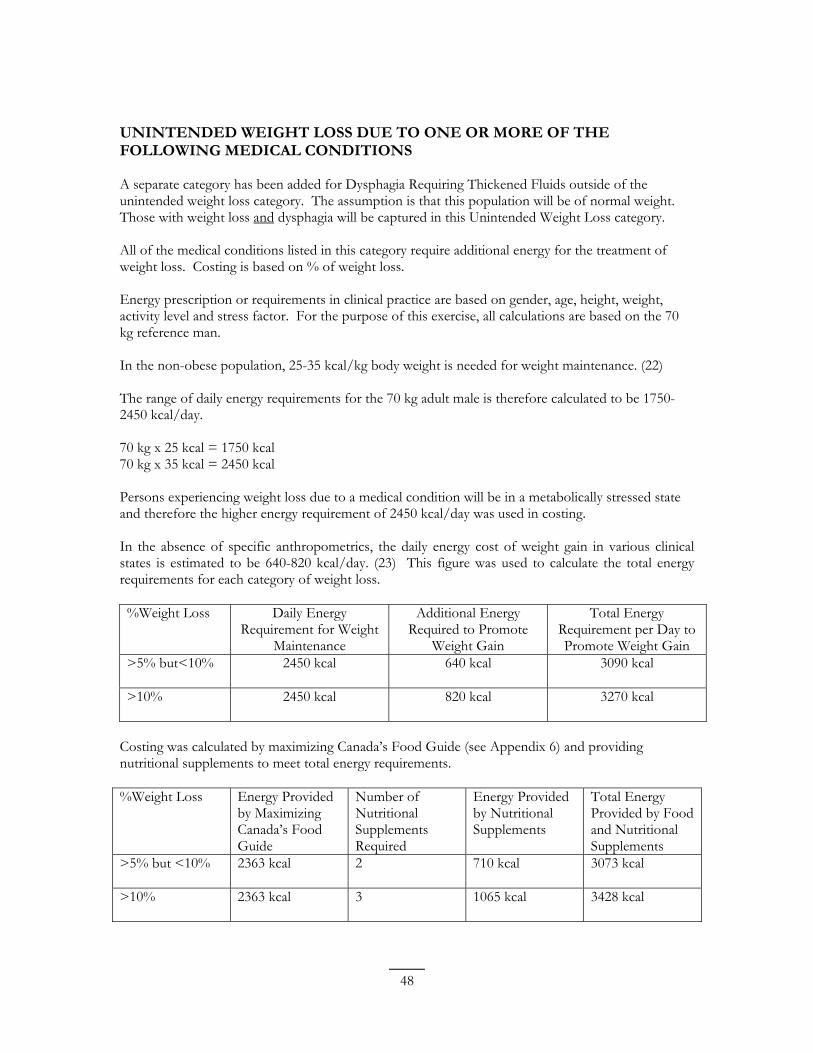
UNINTENDED WEIGHT LOSS DUE TO ONE OR MORE OF THE FOLLOWING MEDICAL CONDITIONS
A separate category has been added for Dysphagia Requiring Thickened Fluids outside of the unintended weight loss category. The assumption is that this population will be of normal weight. Those with weight loss and dysphagia will be captured in this Unintended Weight Loss category.
All of the medical conditions listed in this category require additional energy for the treatment of weight loss. Costing is based on % of weight loss.
Energy prescription or requirements in clinical practice are based on gender, age, height, weight, activity level and stress factor. For the purpose of this exercise, all calculations are based on the 70 kg reference man.
In the non-obese population, 25-35 kcal/kg body weight is needed for weight maintenance. (22)
The range of daily energy requirements for the 70 kg adult male is therefore calculated to be 17502450 kcal/day.
70 kg x 25 kcal = 1750 kcal 70 kg x 35 kcal = 2450 kcal
Persons experiencing weight loss due to a medical condition will be in a metabolically stressed state and therefore the higher energy requirement of 2450 kcal/day was used in costing.
In the absence of specific anthropometrics, the daily energy cost of weight gain in various clinical states is estimated to be 640-820 kcal/day. (23) This figure was used to calculate the total energy requirements for each category of weight loss.
%Weight Loss Daily Energy Requirement for Weight
Maintenance
Additional Energy Required to Promote
Weight Gain
Total Energy Requirement per Day to Promote Weight Gain
>5% but<10% 2450 kcal 640 kcal 3090 kcal
>10% 2450 kcal 820 kcal 3270 kcal
Costing was calculated by maximizing Canada’s Food Guide (see Appendix 6) and providing nutritional supplements to meet total energy requirements.
%Weight Loss Energy Provided by Maximizing Canada’s Food Guide
Number of Nutritional Supplements Required
Energy Provided by Nutritional Supplements
Total Energy Provided by Food and Nutritional Supplements
>5% but <10% 2363 kcal 2 710 kcal 3073 kcal
>10% 2363 kcal 3 1065 kcal 3428 kcal
48
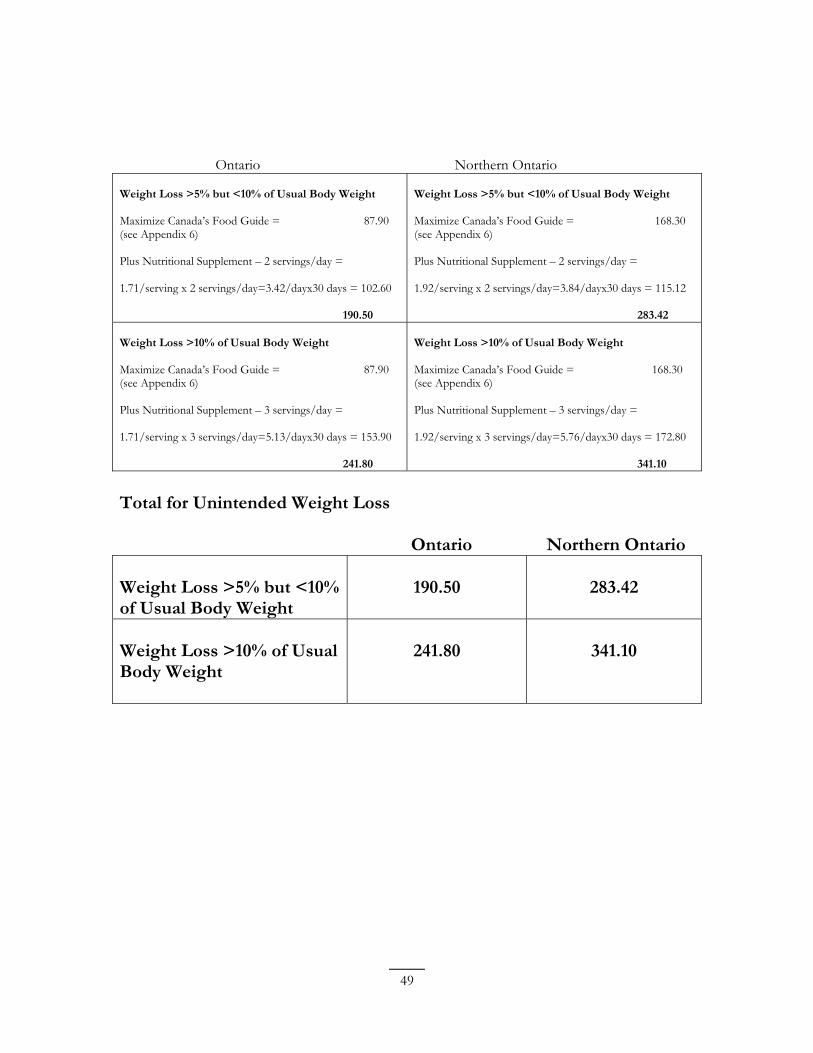
Ontario Northern Ontario
Weight Loss >5% but <10% of Usual Body Weight
Maximize Canada’s Food Guide = 87.90 (see Appendix 6)
Plus Nutritional Supplement – 2 servings/day =
1.71/serving x 2 servings/day=3.42/dayx30 days = 102.60
190.50
Weight Loss >5% but <10% of Usual Body Weight
Maximize Canada’s Food Guide = 168.30 (see Appendix 6)
Plus Nutritional Supplement – 2 servings/day =
1.92/serving x 2 servings/day=3.84/dayx30 days = 115.12
283.42
Weight Loss >10% of Usual Body Weight
Maximize Canada’s Food Guide = 87.90 (see Appendix 6)
Plus Nutritional Supplement – 3 servings/day =
1.71/serving x 3 servings/day=5.13/dayx30 days = 153.90
241.80
Weight Loss >10% of Usual Body Weight
Maximize Canada’s Food Guide = 168.30 (see Appendix 6)
Plus Nutritional Supplement – 3 servings/day =
1.92/serving x 3 servings/day=5.76/dayx30 days = 172.80
341.10
Total for Unintended Weight Loss
Ontario Northern Ontario
Weight Loss >5% but <10% of Usual Body Weight
190.50 283.42
Weight Loss >10% of Usual Body Weight
241.80 341.10
49
MICROCYTIC/MACROCYTIC ANEMIA
Macrocytic – vitamin B12 and folate deficiency. Most appropriate treatment is supplementation with Vitamin B12 and Folic Acid. Since the level of these micronutrients required to adequately treat the anemia far exceeds that available through diet, it is recommended this condition be removed from the schedule. (24)
Microcytic – iron deficiency anemia. Nutrition recommendations are available for a high iron diet. These guidelines are established to promote adequate iron consumption and are not sufficient to correct a deficiency. (24) The most appropriate treatment is supplementation with elemental iron. Since the level of iron required to adequately treat the anemia far exceeds that available through diet, it is recommended this condition be removed from the Schedule.
50
DETAILED EXPLANATION OF COSTING METHODOLOGY:
The specific methodology used to determine the actual additional nutritional costs of the listed medical conditions involved 4 steps.
Step 1 - Using Ontario Nutritious Food Basket data (ONFB) (2005) from 20 health units, calculated average purchase unit prices for 66 food items i.e. 4 litre bag of milk. (See Appendix 1)
Step 2 - Calculated average cost per serving size for each food item (i.e. 250 ml serving of milk). (See Appendix 1)
Step 3 - It was determined that costs for an additional list of food items were required that were not included in the ONFB. These items included products such as low fat meats, whole grain products, low fat dairy products, low sodium products, lactose free and gluten free products, artificial sweeteners, nutritional supplements and infant formulas. These costs were obtained from 2-3 grocery stores in each of 4 different areas of Ontario (Napanee, Windsor, Toronto, North Bay). As with the ONFB prices, the average cost per purchase unit was determined, and then a cost per serving was calculated. These prices were collected in September 2006. (See Appendix 2)
When prices for specialty products could not be found elsewhere, prices were obtained from the Specialty Food Shop, Sick Kids, Toronto. (25)
Nutritional supplement cost was based on case prices since supplements were available in all retail sites in cases. The assumption was made that if the additional funds were provided to purchase supplements, they would be purchased in this economical format. Nutritional supplement prices were obtained from grocery stores, drug stores and box stores (i.e. Walmart).
Step 4-Prior to calculating the cost for a special diet, an average cost for a serving of each was calculated.
• A regular dairy product (i.e. 2% milk, cheese, yogurt) • A low fat dairy product (i.e. skim milk, low fat cheese, low fat yogurt) • A whole grain product (i.e. whole wheat bread, bran cereal, brown rice) • A refined grain product (i.e. white bread, white rice, pasta, Corn Flakes) • A regular meat serving (i.e. chicken leg, wieners, medium ground beef) • A low fat meat serving (i.e. chicken breast, low fat wieners, stewing beef) • A fruit serving (i.e. fresh fruit, canned fruit, fruit juice) • A vegetable serving (i.e. fresh vegetables, canned vegetables, frozen vegetables)
This was to ensure that the final costing reflected the cost of consuming a variety of foods
51
from each food group. (See Appendix 3)
This 4-step approach is best detailed using specific examples of actual listed medical conditions. The examples that will be outlined include; Hypertension and Unintended Weight Loss Due to One or More of the Following Medical Conditions.
EXAMPLE 1 - Detailed Calculation of Special Diet Allowance for Hyper tension
Dietary recommendations for hypertension are based on the DASH eating plan (Dietary Approaches to Stopping Hypertension) and Hypertension: 2006 Public Recommendations. (8)
Dietary recommendations suggest eating a healthy diet that includes lots of fruits and vegetables (8 or more servings per day) and low fat dairy products (2 or more servings per day), and other food low in saturated and trans fat and salt. Choosing whole grain products more often is encouraged.
The following chart compares the recommendations of Canada’s Food Guide and DASH, and outlines the number of servings costed or allotted.
Milk and Alternatives
Grain Products Meat and Alternatives
Vegetables and Fruit
Canada’s Food Guide 2007 (adults > 19)
2-3 6-8 2-3 7-10
DASH Guidelines 2-3 7-8 2-3 8-10
Number of Servings Costed 3 7 2 9
Because hypertension guidelines also recommend controlling weight, we opted to cost in the middle of the suggested range for Vegetables and Fruits, and the lower end of the range for Grain Products and Meat and Alternatives. The emphasis is on more fruits and vegetables, and low fat dairy products, and on healthier choices of grains and meats and alternatives, not more. The amount of food needed every day depends on age, body size, activity level, and gender.
Vegetables and Fruits Cost for 2 additional servings:
52
1 serving of fruit .47 x 30 days = $14.10 1 serving of vegetables .26 x 30 days = 7.80
Grain Products Cost of difference between 6 whole grains and 6 refined grains
6 whole grains – 6 refined grains (.12 x 6) – (.09 x 6) .72 - .54 = .18 x 30 days = 5.40
Plus cost of one additional whole grain serving 1 serving of whole grains .12 x 30 days = 3.60
Milk and Alternatives Cost of difference between 2 low fat milk servings and 2 regular fat milk servings
2 low fat milk – 2 regular fat milk (.80 x 2) - (.63 x 2)
1.60 1.26 .34 x 30 days = 10.20
Plus cost of one additional low fat milk serving 1 serving of low fat milk product .80 x 30 days = 24.00
Meat and Alternatives We assumed that over the course of one week, a healthy diet would include 7 servings of lean meat, 3 servings of fish and 4 servings of other low fat alternatives. (See Appendix 4)
Cost of difference between 2 regular meat and alternatives and 2 lean meat and alternatives. = 26.70
TOTAL COST = $91.80
An additional amount was not allotted for low sodium products as they were difficult to find and there are many foods readily available from each food group, which are not high in sodium (i.e. fresh meat, fruits and vegetables, breads and cereals, and dairy products).
EXAMPLE 2 - Unintended Weight Loss due to One or More of the Following Medical Conditions
All of the medical conditions listed in this category require additional energy for the treatment of weight loss.
53
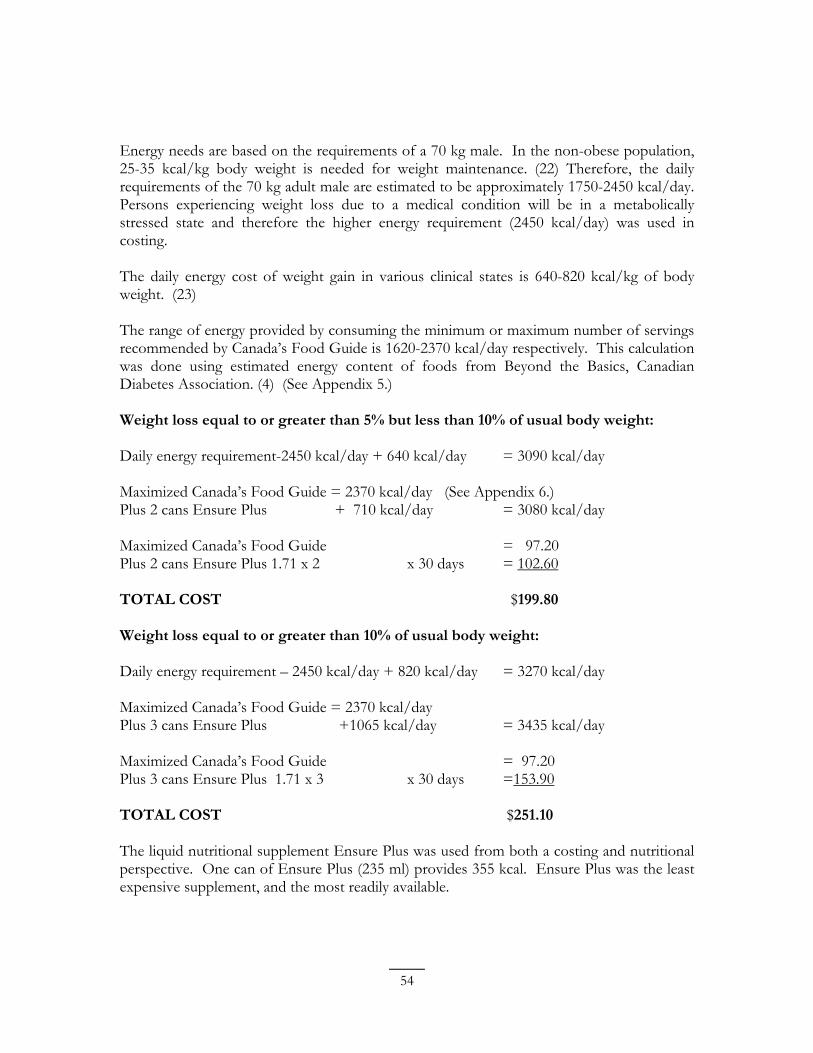
Energy needs are based on the requirements of a 70 kg male. In the non-obese population, 25-35 kcal/kg body weight is needed for weight maintenance. (22) Therefore, the daily requirements of the 70 kg adult male are estimated to be approximately 1750-2450 kcal/day. Persons experiencing weight loss due to a medical condition will be in a metabolically stressed state and therefore the higher energy requirement (2450 kcal/day) was used in costing.
The daily energy cost of weight gain in various clinical states is 640-820 kcal/kg of body weight. (23)
The range of energy provided by consuming the minimum or maximum number of servings recommended by Canada’s Food Guide is 1620-2370 kcal/day respectively. This calculation was done using estimated energy content of foods from Beyond the Basics, Canadian Diabetes Association. (4) (See Appendix 5.)
Weight loss equal to or greater than 5% but less than 10% of usual body weight:
Daily energy requirement-2450 kcal/day + 640 kcal/day = 3090 kcal/day
Maximized Canada’s Food Guide = 2370 kcal/day (See Appendix 6.) Plus 2 cans Ensure Plus + 710 kcal/day = 3080 kcal/day
Maximized Canada’s Food Guide = 97.20 Plus 2 cans Ensure Plus 1.71 x 2 x 30 days = 102.60
TOTAL COST $199.80
Weight loss equal to or greater than 10% of usual body weight:
Daily energy requirement – 2450 kcal/day + 820 kcal/day = 3270 kcal/day
Maximized Canada’s Food Guide = 2370 kcal/day Plus 3 cans Ensure Plus +1065 kcal/day = 3435 kcal/day
Maximized Canada’s Food Guide = 97.20 Plus 3 cans Ensure Plus 1.71 x 3 x 30 days =153.90
TOTAL COST $251.10
The liquid nutritional supplement Ensure Plus was used from both a costing and nutritional perspective. One can of Ensure Plus (235 ml) provides 355 kcal. Ensure Plus was the least expensive supplement, and the most readily available.
54
REFERENCES
1. Health Canada, Eating Well with Canada’s Food Guide, February 2007 Available at: www.hc-sc.gc.ca/fn-an/food-guide-aliment/index_e.html
2. Association of Public Health Epidemiologists in Ontario, Cost of a Nutritious Food Basket, March 31, 2006, Available at: www.apheo.ca/indicators/index.html
3. Heatley, R., Green, J., and Losowsky, Consensus in Clinical Nutrition, Cambridge University Press, 1994
4. Canadian Diabetes Association, Helpful Hints: Beyond the Basics, September 2005 Available at: www.diabetes.ca/files/BeyondTheBasicsTips.pdf
5. Canadian Diabetes Association, Nutrition Therapy, Clinical Practice Guidelines Expert Committee, Can J Diabetes. 2003: 27(suppl 2)
6. Canadian Diabetes Association, 2003 Clinical Practice Guidelines for the Prevention and Management of Diabetes in Canada, Definition, Classification and Diagnosis of Diabetes and other Dysglycemic Categories, Can J Diabetes. 2003: 27(suppl 2)
7. Dietitians of Canada, Practice-Based Evidence Nutrition, Dyslipidemia: Practice Guidance Summary, January 2007 Available at: www.dieteticsatwork.com/pen/KnowledgePathway.asp?kpid=2878&trcatid=43&trid=4080
8. HEART AND STROKE FOUNDATION OF CANADA, THE DASH DIET, 2002 Available at: www.heartandstroke.ca
9. Heart and Stroke Foundation of Canada, Canadian Hypertension Education Program, Canadian Hypertension Society, 2006 Public Recommendations, Canadian Coalition for High Blood Pressure Prevention and Control. Available at: www.heartandstroke.ca
10. Dietitians of Canada, Practice-Based Evidence Nutrition, Hypertension: Practice Guidance Summary, September 2005 Available at: www.dieteticsatwork.com/pen/KnowledgePathway.asp?kpid=674&trcatid=43&trid =812
11. Vickerstaff, J. 2005, Client Information: Egg-Free Diet, Reprinted by Dietitians of Canada, April 27, 2006. Available at: www.dieteticsatwork.com/pen/includes/imageserver.asp?id=307
12. Vickerstaff, J. 2005, Client Information: Milk-Free Diet, Reprinted by Dietitians of
55
Canada, April 27, 2006 Available at: www.dieteticsatwork.com/pen/includes/imageserver.asp?id=305
13. Dietitians of Canada, Practice-Based Evidence Nutrition, Lactose Intolerance: Practice Guidance Summary, February 2006 Available at: www.dieteticsatwork.com/pen/KnowledgePathway.asp?kpid=1820&trcatid=43
14. Dietitians of Canada, Practice-Based Evidence Nutrition, Food Choices for Reducing Lactose in Your Diet, 2006 Available at: www.dieteticsatwork.com/pen/includes/imageserver.asp?id=156
15. Dietitians of Canada, Practice-Based Evidence Nutrition, Osteoporosis: Practice Guidance Summary, April 2007 Available at: www.dieteticsatwork.com/pen/KnowledgePathway.asp?kpid=553&trcatid=43&trid =852
16. BROWN, J AND JOSSE, R.AND THE SCIENTIFIC ADVISORY COUNCIL OF THE OSTEOPOROSIS SOCIETY OF CANADA, 2002 CLINICAL PRACTICE GUIDELINES FOR THE DIAGNOSIS AND MANAGEMENT OF OSTEOPOROSIS IN CANADA, CMAJ, 167(10) S1-S34
17. American Dietetic Association/Dietitians of Canada, Manual of Clinical Dietetics, Sixth Edition, 2000, p 449
18. American Dietetic Association/Dietitians of Canada, Manual of Clinical Dietetics, Sixth Edition, 2000, p 224
19. Jackobs, M. The Cost of Medical Nutrition Therapy in Healing Pressure Ulcers, Top Clin Nutr 1999;14(2):41-47
20. American Dietetic Association/Dietitians of Canada, Manual of Clinical Dietetics, Sixth Edition, 2000, p 259
21. American Dietetic Association/Dietitians of Canada, Manual of Clinical Dietetics, Sixth Edition, 2000, p 260
22. American Dietetic Association/Dietitians of Canada, Manual of Clinical Dietetics, Sixth Edition, 2000, p 31
23. American Dietetic Association/Dietitians of Canada, Manual of Clinical Dietetics, Sixth Edition, 2000, p 29
24. Dietitians of Canada, Practice-Based Evidence Nutrition Hematology/Anemia:
56
Evidence Summary, February 2006 Available at: www.dieteticsatwork.com/pen/KnowledgePathway.asp?kpid=403&trcatid=42&trid =1961
25. Specialty Food Shop, Sick Kids Hospital, Toronto Available at: www.sickkids.on.ca/
26. Novartis Nutrition Corporation, Novartis Nutrition Resource Manual, “Resource Thicken-Up Quantity Preparation”, Whitby, 2001
27. American Dietetic Association/Dietitians of Canada, Manual of Clinical Dietetics, Sixth Edition, 2000, p 530
28. Health Canada website: www.hc-sc.gc.ca/fn-an/food-guide-aliment/index_e.html
APPENDICES
57
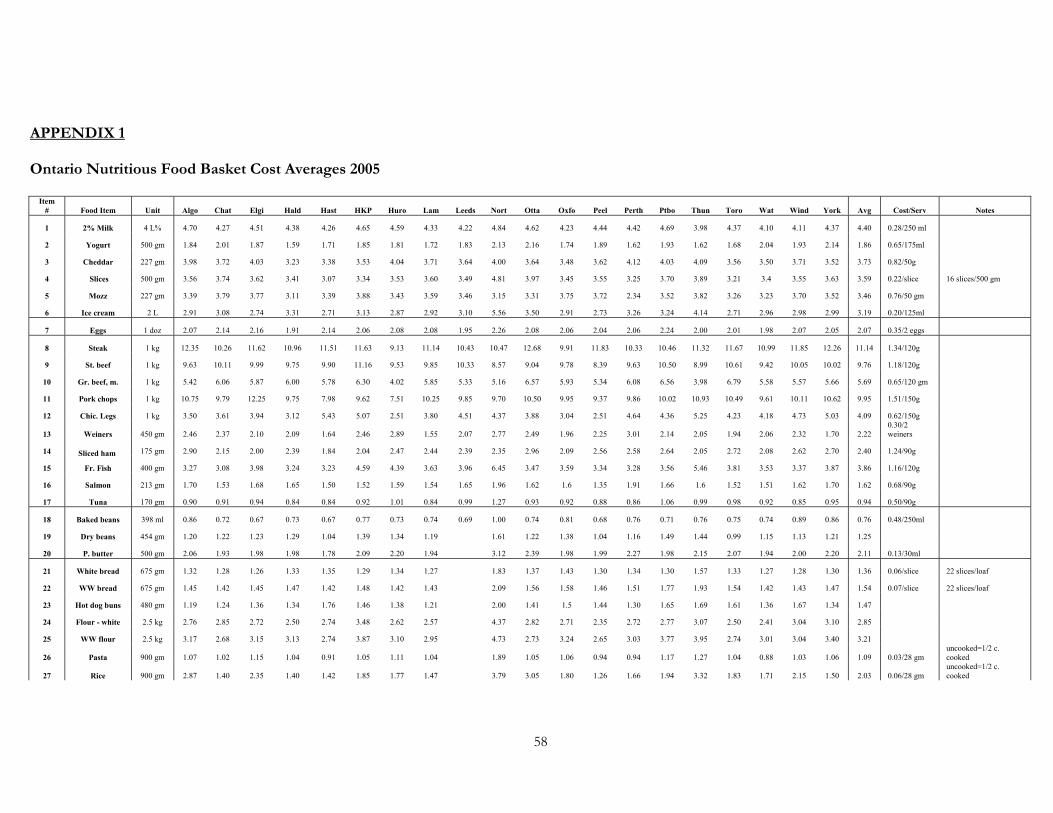
1
2
3
4
5
6
7
8
9
10
11
12
13
14
15
16
17
18
19
20
21
22
23
24
25
26
27
APPENDIX 1
Ontario Nutritious Food Basket Cost Averages 2005
Item # Food Item Unit Algo Chat Elgi Hald Hast HKP Huro Lam Leeds Nort Otta Oxfo Peel Perth Ptbo Thun Toro Wat Wind York Avg Cost/Serv Notes
2% Milk
Yogurt
Cheddar
Slices
Mozz
Ice cream
4 L%
500 gm
227 gm
500 gm
227 gm
2 L
4.70
1.84
3.98
3.56
3.39
2.91
4.27
2.01
3.72
3.74
3.79
3.08
4.51
1.87
4.03
3.62
3.77
2.74
4.38
1.59
3.23
3.41
3.11
3.31
4.26
1.71
3.38
3.07
3.39
2.71
4.65
1.85
3.53
3.34
3.88
3.13
4.59
1.81
4.04
3.53
3.43
2.87
4.33
1.72
3.71
3.60
3.59
2.92
4.22
1.83
3.64
3.49
3.46
3.10
4.84
2.13
4.00
4.81
3.15
5.56
4.62
2.16
3.64
3.97
3.31
3.50
4.23
1.74
3.48
3.45
3.75
2.91
4.44
1.89
3.62
3.55
3.72
2.73
4.42
1.62
4.12
3.25
2.34
3.26
4.69
1.93
4.03
3.70
3.52
3.24
3.98
1.62
4.09
3.89
3.82
4.14
4.37
1.68
3.56
3.21
3.26
2.71
4.10
2.04
3.50
3.4
3.23
2.96
4.11
1.93
3.71
3.55
3.70
2.98
4.37
2.14
3.52
3.63
3.52
2.99
4.40
1.86
3.73
3.59
3.46
3.19
0.28/250 ml
0.65/175ml
0.82/50g
0.22/slice
0.76/50 gm
0.20/125ml
16 slices/500 gm
Eggs 1 doz 2.07 2.14 2.16 1.91 2.14 2.06 2.08 2.08 1.95 2.26 2.08 2.06 2.04 2.06 2.24 2.00 2.01 1.98 2.07 2.05 2.07 0.35/2 eggs
Steak
St. beef
Gr. beef, m.
Pork chops
Chic. Legs
Weiners
Sliced ham
Fr. Fish
Salmon
Tuna
1 kg
1 kg
1 kg
1 kg
1 kg
450 gm
175 gm
400 gm
213 gm
170 gm
12.35
9.63
5.42
10.75
3.50
2.46
2.90
3.27
1.70
0.90
10.26
10.11
6.06
9.79
3.61
2.37
2.15
3.08
1.53
0.91
11.62
9.99
5.87
12.25
3.94
2.10
2.00
3.98
1.68
0.94
10.96
9.75
6.00
9.75
3.12
2.09
2.39
3.24
1.65
0.84
11.51
9.90
5.78
7.98
5.43
1.64
1.84
3.23
1.50
0.84
11.63
11.16
6.30
9.62
5.07
2.46
2.04
4.59
1.52
0.92
9.13
9.53
4.02
7.51
2.51
2.89
2.47
4.39
1.59
1.01
11.14
9.85
5.85
10.25
3.80
1.55
2.44
3.63
1.54
0.84
10.43
10.33
5.33
9.85
4.51
2.07
2.39
3.96
1.65
0.99
10.47
8.57
5.16
9.70
4.37
2.77
2.35
6.45
1.96
1.27
12.68
9.04
6.57
10.50
3.88
2.49
2.96
3.47
1.62
0.93
9.91
9.78
5.93
9.95
3.04
1.96
2.09
3.59
1.6
0.92
11.83
8.39
5.34
9.37
2.51
2.25
2.56
3.34
1.35
0.88
10.33
9.63
6.08
9.86
4.64
3.01
2.58
3.28
1.91
0.86
10.46
10.50
6.56
10.02
4.36
2.14
2.64
3.56
1.66
1.06
11.32
8.99
3.98
10.93
5.25
2.05
2.05
5.46
1.6
0.99
11.67
10.61
6.79
10.49
4.23
1.94
2.72
3.81
1.52
0.98
10.99
9.42
5.58
9.61
4.18
2.06
2.08
3.53
1.51
0.92
11.85
10.05
5.57
10.11
4.73
2.32
2.62
3.37
1.62
0.85
12.26
10.02
5.66
10.62
5.03
1.70
2.70
3.87
1.70
0.95
11.14
9.76
5.69
9.95
4.09
2.22
2.40
3.86
1.62
0.94
1.34/120g
1.18/120g
0.65/120 gm
1.51/150g
0.62/150g 0.30/2 weiners
1.24/90g
1.16/120g
0.68/90g
0.50/90g
Baked beans
Dry beans
P. butter
398 ml
454 gm
500 gm
0.86
1.20
2.06
0.72
1.22
1.93
0.67
1.23
1.98
0.73
1.29
1.98
0.67
1.04
1.78
0.77
1.39
2.09
0.73
1.34
2.20
0.74
1.19
1.94
0.69 1.00
1.61
3.12
0.74
1.22
2.39
0.81
1.38
1.98
0.68
1.04
1.99
0.76
1.16
2.27
0.71
1.49
1.98
0.76
1.44
2.15
0.75
0.99
2.07
0.74
1.15
1.94
0.89
1.13
2.00
0.86
1.21
2.20
0.76
1.25
2.11
0.48/250ml
0.13/30ml
White bread
WW bread
Hot dog buns
Flour - white
WW flour
Pasta
Rice
675 gm
675 gm
480 gm
2.5 kg
2.5 kg
900 gm
900 gm
1.32
1.45
1.19
2.76
3.17
1.07
2.87
1.28
1.42
1.24
2.85
2.68
1.02
1.40
1.26
1.45
1.36
2.72
3.15
1.15
2.35
1.33
1.47
1.34
2.50
3.13
1.04
1.40
1.35
1.42
1.76
2.74
2.74
0.91
1.42
1.29
1.48
1.46
3.48
3.87
1.05
1.85
1.34
1.42
1.38
2.62
3.10
1.11
1.77
1.27
1.43
1.21
2.57
2.95
1.04
1.47
1.83
2.09
2.00
4.37
4.73
1.89
3.79
1.37
1.56
1.41
2.82
2.73
1.05
3.05
1.43
1.58
1.5
2.71
3.24
1.06
1.80
1.30
1.46
1.44
2.35
2.65
0.94
1.26
1.34
1.51
1.30
2.72
3.03
0.94
1.66
1.30
1.77
1.65
2.77
3.77
1.17
1.94
1.57
1.93
1.69
3.07
3.95
1.27
3.32
1.33
1.54
1.61
2.50
2.74
1.04
1.83
1.27
1.42
1.36
2.41
3.01
0.88
1.71
1.28
1.43
1.67
3.04
3.04
1.03
2.15
1.30
1.47
1.34
3.10
3.40
1.06
1.50
1.36
1.54
1.47
2.85
3.21
1.09
2.03
0.06/slice
0.07/slice
0.03/28 gm
0.06/28 gm
22 slices/loaf
22 slices/loaf
uncooked=1/2 c. cooked uncooked=1/2 c. cooked
58
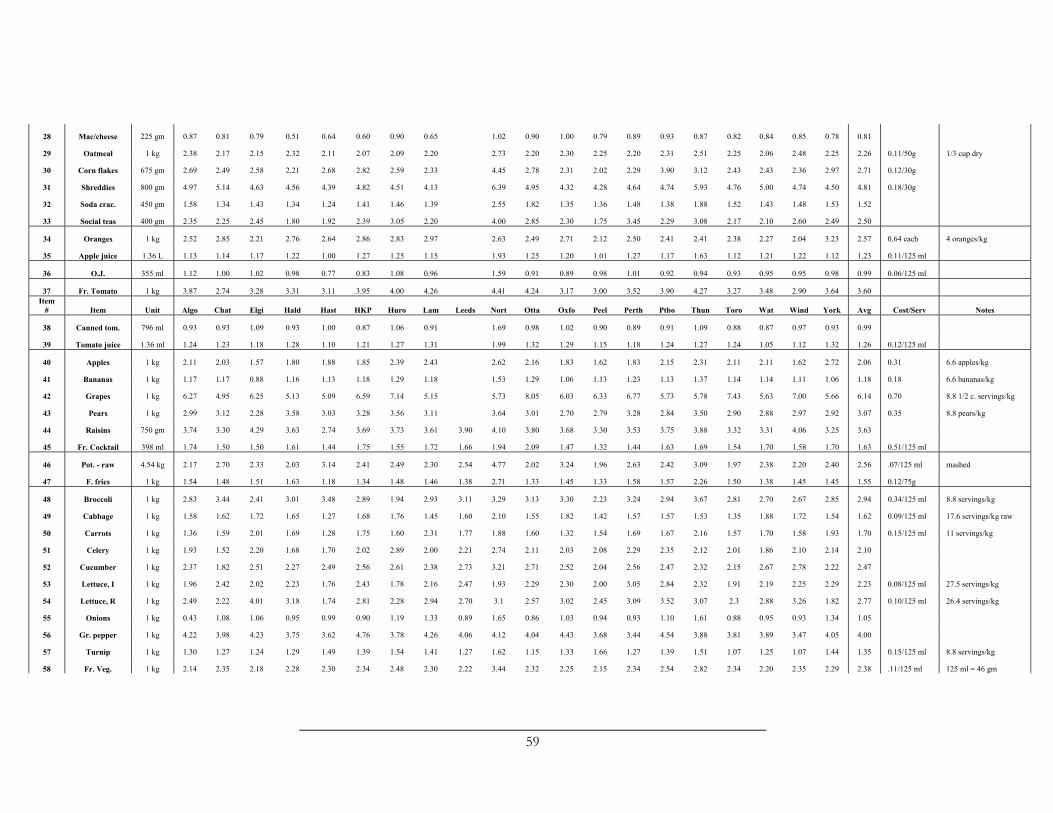
28 Mac/cheese 225 gm 0.87 0.81 0.79 0.51 0.64 0.60 0.90 0.65 1.02 0.90 1.00 0.79 0.89 0.93 0.87 0.82 0.84 0.85 0.78 0.81
29 Oatmeal 1 kg 2.38 2.17 2.15 2.32 2.11 2.07 2.09 2.20 2.73 2.20 2.30 2.25 2.20 2.31 2.51 2.25 2.06 2.48 2.25 2.26 0.11/50g 1/3 cup dry
30 Corn flakes 675 gm 2.69 2.49 2.58 2.21 2.68 2.82 2.59 2.33 4.45 2.78 2.31 2.02 2.29 3.90 3.12 2.43 2.43 2.36 2.97 2.71 0.12/30g
31 Shreddies 800 gm 4.97 5.14 4.63 4.56 4.39 4.82 4.51 4.13 6.39 4.95 4.32 4.28 4.64 4.74 5.93 4.76 5.00 4.74 4.50 4.81 0.18/30g
32 Soda crac. 450 gm 1.58 1.34 1.43 1.34 1.24 1.41 1.46 1.39 2.55 1.82 1.35 1.36 1.48 1.38 1.88 1.52 1.43 1.48 1.53 1.52
33 Social teas 400 gm 2.35 2.25 2.45 1.80 1.92 2.39 3.05 2.20 4.00 2.85 2.30 1.75 3.45 2.29 3.08 2.17 2.10 2.60 2.49 2.50
34 Oranges 1 kg 2.52 2.85 2.21 2.76 2.64 2.86 2.83 2.97 2.63 2.49 2.71 2.12 2.50 2.41 2.41 2.38 2.27 2.04 3.23 2.57 0.64 each 4 oranges/kg
35 Apple juice 1.36 L 1.13 1.14 1.17 1.22 1.00 1.27 1.25 1.15 1.93 1.25 1.20 1.01 1.27 1.17 1.63 1.12 1.21 1.22 1.12 1.23 0.11/125 ml
36 O.J. 355 ml 1.12 1.00 1.02 0.98 0.77 0.83 1.08 0.96 1.59 0.91 0.89 0.98 1.01 0.92 0.94 0.93 0.95 0.95 0.98 0.99 0.06/125 ml
37 Fr. Tomato 1 kg 3.87 2.74 3.28 3.31 3.11 3.95 4.00 4.26 4.41 4.24 3.17 3.00 3.52 3.90 4.27 3.27 3.48 2.90 3.64 3.60 Item
# Item Unit Algo Chat Elgi Hald Hast HKP Huro Lam Leeds Nort Otta Oxfo Peel Perth Ptbo Thun Toro Wat Wind York Avg Cost/Serv Notes
38 Canned tom. 796 ml 0.93 0.93 1.09 0.93 1.00 0.87 1.06 0.91 1.69 0.98 1.02 0.90 0.89 0.91 1.09 0.88 0.87 0.97 0.93 0.99
39 Tomato juice 1.36 ml 1.24 1.23 1.18 1.28 1.10 1.21 1.27 1.31 1.99 1.32 1.29 1.15 1.18 1.24 1.27 1.24 1.05 1.12 1.32 1.26 0.12/125 ml
40 Apples 1 kg 2.11 2.03 1.57 1.80 1.88 1.85 2.39 2.43 2.62 2.16 1.83 1.62 1.83 2.15 2.31 2.11 2.11 1.62 2.72 2.06 0.31 6.6 apples/kg
41 Bananas 1 kg 1.17 1.17 0.88 1.16 1.13 1.18 1.29 1.18 1.53 1.29 1.06 1.13 1.23 1.13 1.37 1.14 1.14 1.11 1.06 1.18 0.18 6.6 bananas/kg
42 Grapes 1 kg 6.27 4.95 6.25 5.13 5.09 6.59 7.14 5.15 5.73 8.05 6.03 6.33 6.77 5.73 5.78 7.43 5.63 7.00 5.66 6.14 0.70 8.8 1/2 c. servings/kg
43 Pears 1 kg 2.99 3.12 2.28 3.58 3.03 3.28 3.56 3.11 3.64 3.01 2.70 2.79 3.28 2.84 3.50 2.90 2.88 2.97 2.92 3.07 0.35 8.8 pears/kg
44 Raisins 750 gm 3.74 3.30 4.29 3.63 2.74 3.69 3.73 3.61 3.90 4.10 3.80 3.68 3.30 3.53 3.75 3.88 3.32 3.31 4.06 3.25 3.63
45 Fr. Cocktail 398 ml 1.74 1.50 1.50 1.61 1.44 1.75 1.55 1.72 1.66 1.94 2.09 1.47 1.32 1.44 1.63 1.69 1.54 1.70 1.58 1.70 1.63 0.51/125 ml
46 Pot. - raw 4.54 kg 2.17 2.70 2.33 2.03 3.14 2.41 2.49 2.30 2.54 4.77 2.02 3.24 1.96 2.63 2.42 3.09 1.97 2.38 2.20 2.40 2.56 .07/125 ml mashed
47 F. fries 1 kg 1.54 1.48 1.51 1.63 1.18 1.34 1.48 1.46 1.38 2.71 1.33 1.45 1.33 1.58 1.57 2.26 1.50 1.38 1.45 1.45 1.55 0.12/75g
48 Broccoli 1 kg 2.83 3.44 2.41 3.01 3.48 2.89 1.94 2.93 3.11 3.29 3.13 3.30 2.23 3.24 2.94 3.67 2.81 2.70 2.67 2.85 2.94 0.34/125 ml 8.8 servings/kg
49 Cabbage 1 kg 1.58 1.62 1.72 1.65 1.27 1.68 1.76 1.45 1.60 2.10 1.55 1.82 1.42 1.57 1.57 1.53 1.35 1.88 1.72 1.54 1.62 0.09/125 ml 17.6 servings/kg raw
50 Carrots 1 kg 1.36 1.59 2.01 1.69 1.28 1.75 1.60 2.31 1.77 1.88 1.60 1.32 1.54 1.69 1.67 2.16 1.57 1.70 1.58 1.93 1.70 0.15/125 ml 11 servings/kg
51 Celery 1 kg 1.93 1.52 2.20 1.68 1.70 2.02 2.89 2.00 2.21 2.74 2.11 2.03 2.08 2.29 2.35 2.12 2.01 1.86 2.10 2.14 2.10
52 Cucumber 1 kg 2.37 1.82 2.51 2.27 2.49 2.56 2.61 2.38 2.73 3.21 2.71 2.52 2.04 2.56 2.47 2.32 2.15 2.67 2.78 2.22 2.47
53 Lettuce, I 1 kg 1.96 2.42 2.02 2.23 1.76 2.43 1.78 2.16 2.47 1.93 2.29 2.30 2.00 3.05 2.84 2.32 1.91 2.19 2.25 2.29 2.23 0.08/125 ml 27.5 servings/kg
54 Lettuce, R 1 kg 2.49 2.22 4.01 3.18 1.74 2.81 2.28 2.94 2.70 3.1 2.57 3.02 2.45 3.09 3.52 3.07 2.3 2.88 3.26 1.82 2.77 0.10/125 ml 26.4 servings/kg
55 Onions 1 kg 0.43 1.08 1.06 0.95 0.99 0.90 1.19 1.33 0.89 1.65 0.86 1.03 0.94 0.93 1.10 1.61 0.88 0.95 0.93 1.34 1.05
56 Gr. pepper 1 kg 4.22 3.98 4.23 3.75 3.62 4.76 3.78 4.26 4.06 4.12 4.04 4.43 3.68 3.44 4.54 3.88 3.81 3.89 3.47 4.05 4.00
57 Turnip 1 kg 1.30 1.27 1.24 1.29 1.49 1.39 1.54 1.41 1.27 1.62 1.15 1.33 1.66 1.27 1.39 1.51 1.07 1.25 1.07 1.44 1.35 0.15/125 ml 8.8 servings/kg
58 Fr. Veg. 1 kg 2.14 2.35 2.18 2.28 2.30 2.34 2.48 2.30 2.22 3.44 2.32 2.25 2.15 2.34 2.54 2.82 2.34 2.20 2.35 2.29 2.38 .11/125 ml 125 ml = 46 gm
59
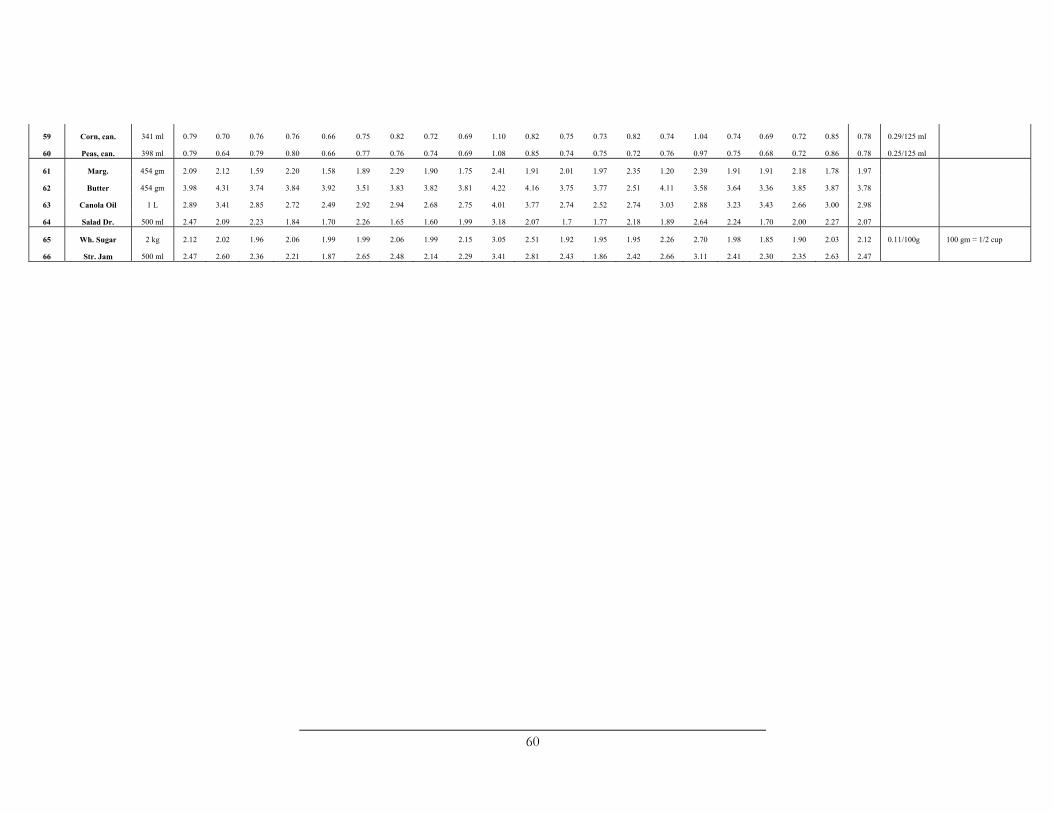
59 Corn, can. 341 ml 0.79 0.70 0.76 0.76 0.66 0.75 0.82 0.72 0.69 1.10 0.82 0.75 0.73 0.82 0.74 1.04 0.74 0.69 0.72 0.85 0.78 0.29/125 ml
60 Peas, can. 398 ml 0.79 0.64 0.79 0.80 0.66 0.77 0.76 0.74 0.69 1.08 0.85 0.74 0.75 0.72 0.76 0.97 0.75 0.68 0.72 0.86 0.78 0.25/125 ml
61 Marg. 454 gm 2.09 2.12 1.59 2.20 1.58 1.89 2.29 1.90 1.75 2.41 1.91 2.01 1.97 2.35 1.20 2.39 1.91 1.91 2.18 1.78 1.97
62 Butter 454 gm 3.98 4.31 3.74 3.84 3.92 3.51 3.83 3.82 3.81 4.22 4.16 3.75 3.77 2.51 4.11 3.58 3.64 3.36 3.85 3.87 3.78
63 Canola Oil 1 L 2.89 3.41 2.85 2.72 2.49 2.92 2.94 2.68 2.75 4.01 3.77 2.74 2.52 2.74 3.03 2.88 3.23 3.43 2.66 3.00 2.98
64 Salad Dr. 500 ml 2.47 2.09 2.23 1.84 1.70 2.26 1.65 1.60 1.99 3.18 2.07 1.7 1.77 2.18 1.89 2.64 2.24 1.70 2.00 2.27 2.07
65 Wh. Sugar 2 kg 2.12 2.02 1.96 2.06 1.99 1.99 2.06 1.99 2.15 3.05 2.51 1.92 1.95 1.95 2.26 2.70 1.98 1.85 1.90 2.03 2.12 0.11/100g 100 gm = 1/2 cup
66 Str. Jam 500 ml 2.47 2.60 2.36 2.21 1.87 2.65 2.48 2.14 2.29 3.41 2.81 2.43 1.86 2.42 2.66 3.11 2.41 2.30 2.35 2.63 2.47
60
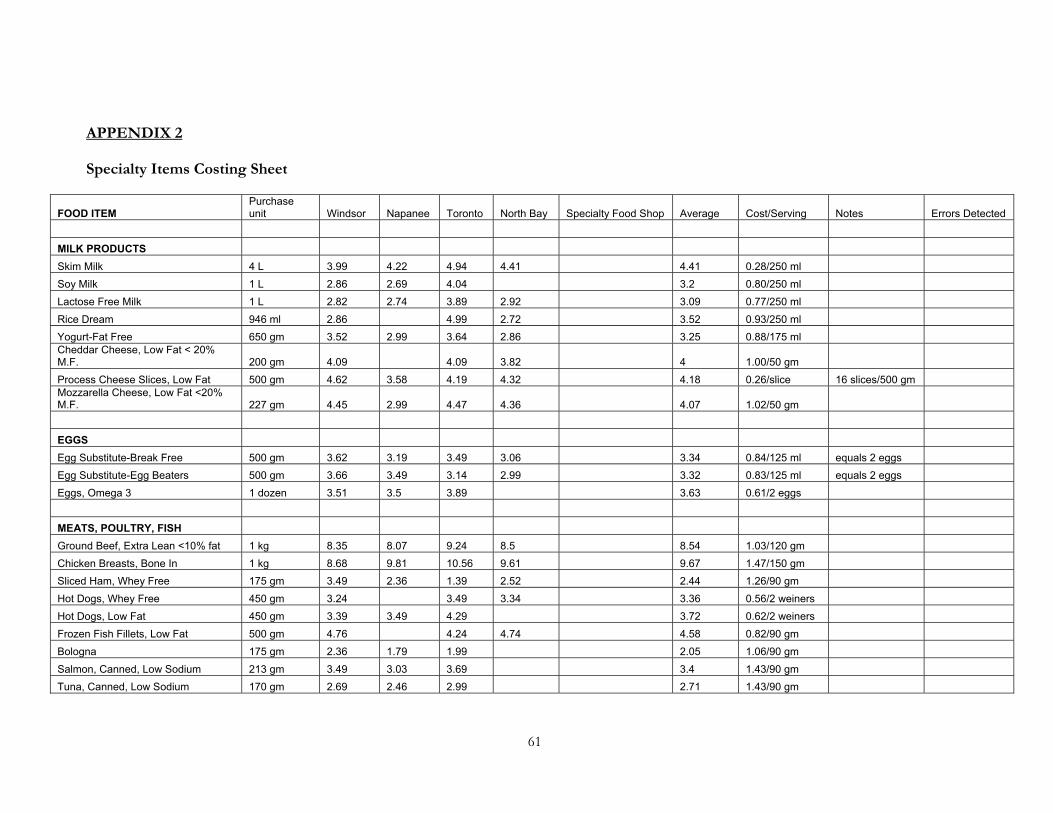
APPENDIX 2
Specialty Items Costing Sheet
FOOD ITEM Purchase unit Windsor Napanee Toronto North Bay Specialty Food Shop Average Cost/Serving Notes Errors Detected
MILK PRODUCTS Skim Milk 4 L 3.99 4.22 4.94 4.41 4.41 0.28/250 ml Soy Milk 1 L 2.86 2.69 4.04 3.2 0.80/250 ml Lactose Free Milk 1 L 2.82 2.74 3.89 2.92 3.09 0.77/250 ml Rice Dream 946 ml 2.86 4.99 2.72 3.52 0.93/250 ml Yogurt-Fat Free 650 gm 3.52 2.99 3.64 2.86 3.25 0.88/175 ml Cheddar Cheese, Low Fat < 20% M.F. 200 gm 4.09 4.09 3.82 4 1.00/50 gm Process Cheese Slices, Low Fat 500 gm 4.62 3.58 4.19 4.32 4.18 0.26/slice 16 slices/500 gm Mozzarella Cheese, Low Fat <20% M.F. 227 gm 4.45 2.99 4.47 4.36 4.07 1.02/50 gm
EGGS Egg Substitute-Break Free 500 gm 3.62 3.19 3.49 3.06 3.34 0.84/125 ml equals 2 eggs Egg Substitute-Egg Beaters 500 gm 3.66 3.49 3.14 2.99 3.32 0.83/125 ml equals 2 eggs Eggs, Omega 3 1 dozen 3.51 3.5 3.89 3.63 0.61/2 eggs
MEATS, POULTRY, FISH Ground Beef, Extra Lean <10% fat 1 kg 8.35 8.07 9.24 8.5 8.54 1.03/120 gm Chicken Breasts, Bone In 1 kg 8.68 9.81 10.56 9.61 9.67 1.47/150 gm Sliced Ham, Whey Free 175 gm 3.49 2.36 1.39 2.52 2.44 1.26/90 gm Hot Dogs, Whey Free 450 gm 3.24 3.49 3.34 3.36 0.56/2 weiners Hot Dogs, Low Fat 450 gm 3.39 3.49 4.29 3.72 0.62/2 weiners Frozen Fish Fillets, Low Fat 500 gm 4.76 4.24 4.74 4.58 0.82/90 gm Bologna 175 gm 2.36 1.79 1.99 2.05 1.06/90 gm Salmon, Canned, Low Sodium 213 gm 3.49 3.03 3.69 3.4 1.43/90 gm Tuna, Canned, Low Sodium 170 gm 2.69 2.46 2.99 2.71 1.43/90 gm
61
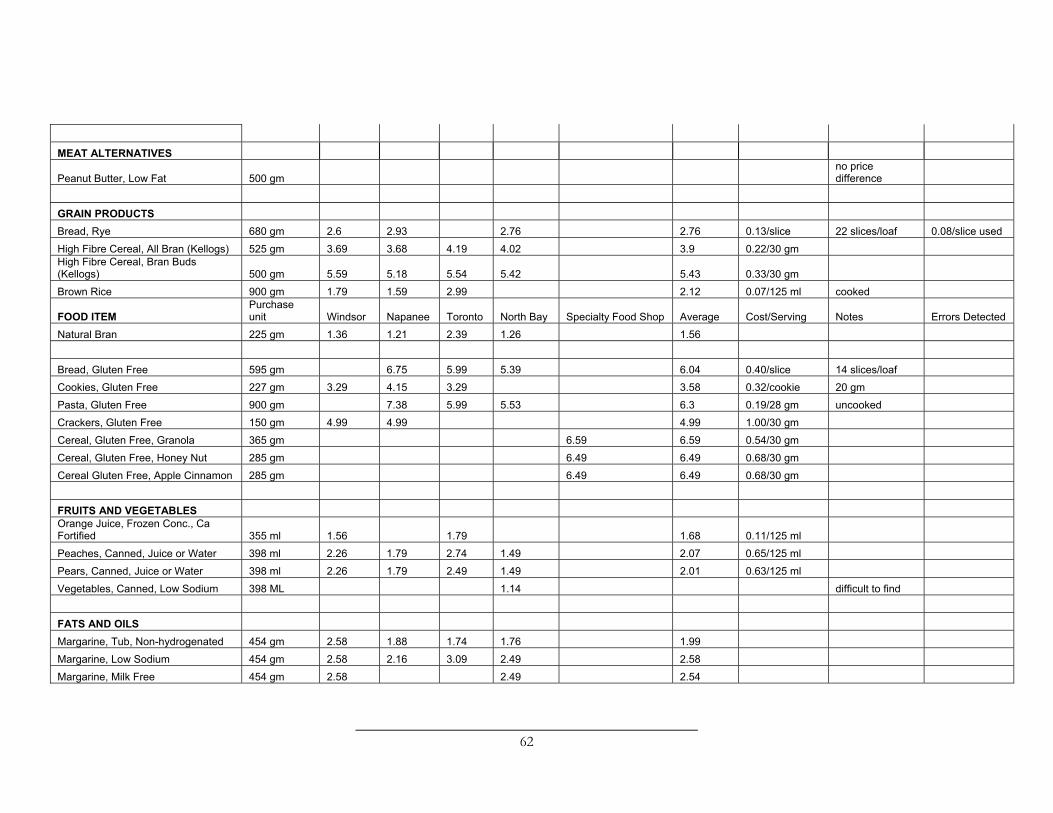
MEAT ALTERNATIVES
Peanut Butter, Low Fat 500 gm no price difference
GRAIN PRODUCTS Bread, Rye 680 gm 2.6 2.93 2.76 2.76 0.13/slice 22 slices/loaf 0.08/slice used High Fibre Cereal, All Bran (Kellogs) 525 gm 3.69 3.68 4.19 4.02 3.9 0.22/30 gm High Fibre Cereal, Bran Buds (Kellogs) 500 gm 5.59 5.18 5.54 5.42 5.43 0.33/30 gm Brown Rice 900 gm 1.79 1.59 2.99 2.12 0.07/125 ml cooked
FOOD ITEM Purchase unit Windsor Napanee Toronto North Bay Specialty Food Shop Average Cost/Serving Notes Errors Detected
Natural Bran 225 gm 1.36 1.21 2.39 1.26 1.56
Bread, Gluten Free 595 gm 6.75 5.99 5.39 6.04 0.40/slice 14 slices/loaf Cookies, Gluten Free 227 gm 3.29 4.15 3.29 3.58 0.32/cookie 20 gm Pasta, Gluten Free 900 gm 7.38 5.99 5.53 6.3 0.19/28 gm uncooked Crackers, Gluten Free 150 gm 4.99 4.99 4.99 1.00/30 gm Cereal, Gluten Free, Granola 365 gm 6.59 6.59 0.54/30 gm Cereal, Gluten Free, Honey Nut 285 gm 6.49 6.49 0.68/30 gm Cereal Gluten Free, Apple Cinnamon 285 gm 6.49 6.49 0.68/30 gm
FRUITS AND VEGETABLES Orange Juice, Frozen Conc., Ca Fortified 355 ml 1.56 1.79 1.68 0.11/125 ml Peaches, Canned, Juice or Water 398 ml 2.26 1.79 2.74 1.49 2.07 0.65/125 ml Pears, Canned, Juice or Water 398 ml 2.26 1.79 2.49 1.49 2.01 0.63/125 ml Vegetables, Canned, Low Sodium 398 ML 1.14 difficult to find
FATS AND OILS Margarine, Tub, Non-hydrogenated 454 gm 2.58 1.88 1.74 1.76 1.99 Margarine, Low Sodium 454 gm 2.58 2.16 3.09 2.49 2.58 Margarine, Milk Free 454 gm 2.58 2.49 2.54
62
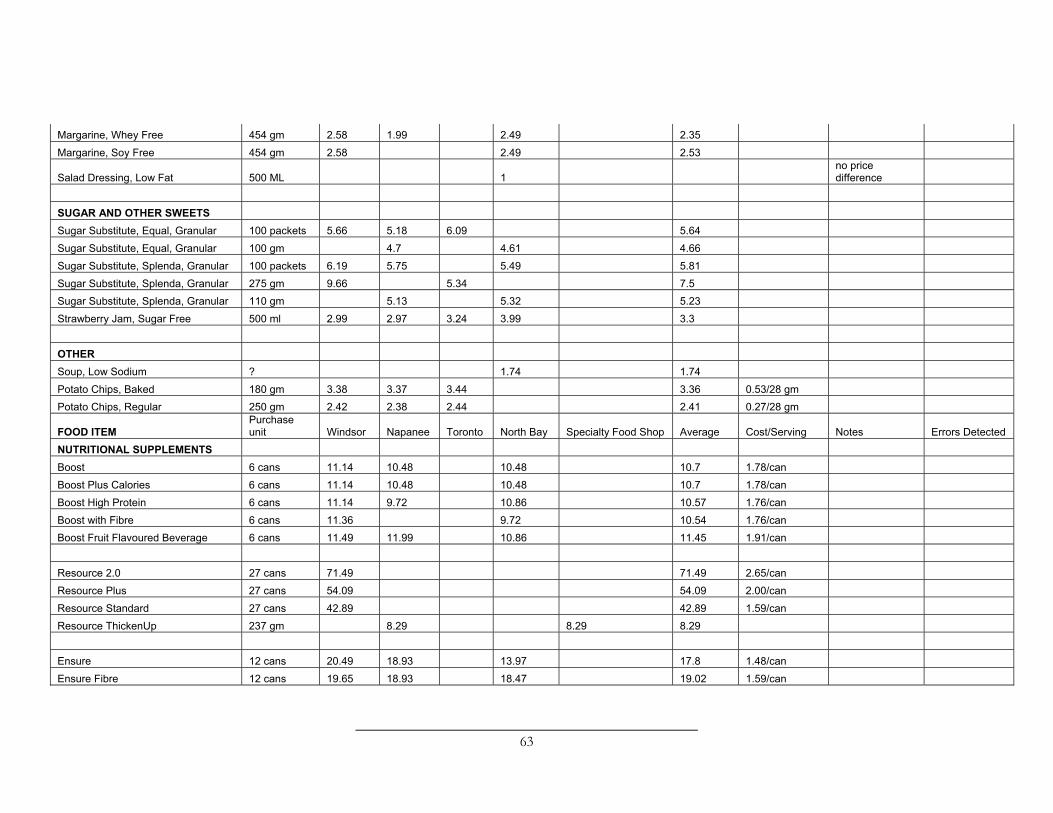
Margarine, Whey Free 454 gm 2.58 1.99 2.49 2.35
Margarine, Soy Free 454 gm 2.58 2.49 2.53
Salad Dressing, Low Fat 500 ML 1 no price difference
SUGAR AND OTHER SWEETS Sugar Substitute, Equal, Granular 100 packets 5.66 5.18 6.09 5.64 Sugar Substitute, Equal, Granular 100 gm 4.7 4.61 4.66 Sugar Substitute, Splenda, Granular 100 packets 6.19 5.75 5.49 5.81 Sugar Substitute, Splenda, Granular 275 gm 9.66 5.34 7.5 Sugar Substitute, Splenda, Granular 110 gm 5.13 5.32 5.23 Strawberry Jam, Sugar Free 500 ml 2.99 2.97 3.24 3.99 3.3
OTHER Soup, Low Sodium ? 1.74 1.74 Potato Chips, Baked 180 gm 3.38 3.37 3.44 3.36 0.53/28 gm Potato Chips, Regular 250 gm 2.42 2.38 2.44 2.41 0.27/28 gm
Purchase FOOD ITEM unit Windsor Napanee Toronto North Bay Specialty Food Shop Average Cost/Serving Notes Errors Detected NUTRITIONAL SUPPLEMENTS Boost 6 cans 11.14 10.48 10.48 10.7 1.78/can Boost Plus Calories 6 cans 11.14 10.48 10.48 10.7 1.78/can Boost High Protein 6 cans 11.14 9.72 10.86 10.57 1.76/can Boost with Fibre 6 cans 11.36 9.72 10.54 1.76/can Boost Fruit Flavoured Beverage 6 cans 11.49 11.99 10.86 11.45 1.91/can
Resource 2.0 27 cans 71.49 71.49 2.65/can Resource Plus 27 cans 54.09 54.09 2.00/can Resource Standard 27 cans 42.89 42.89 1.59/can Resource ThickenUp 237 gm 8.29 8.29 8.29
Ensure 12 cans 20.49 18.93 13.97 17.8 1.48/can Ensure Fibre 12 cans 19.65 18.93 18.47 19.02 1.59/can
63
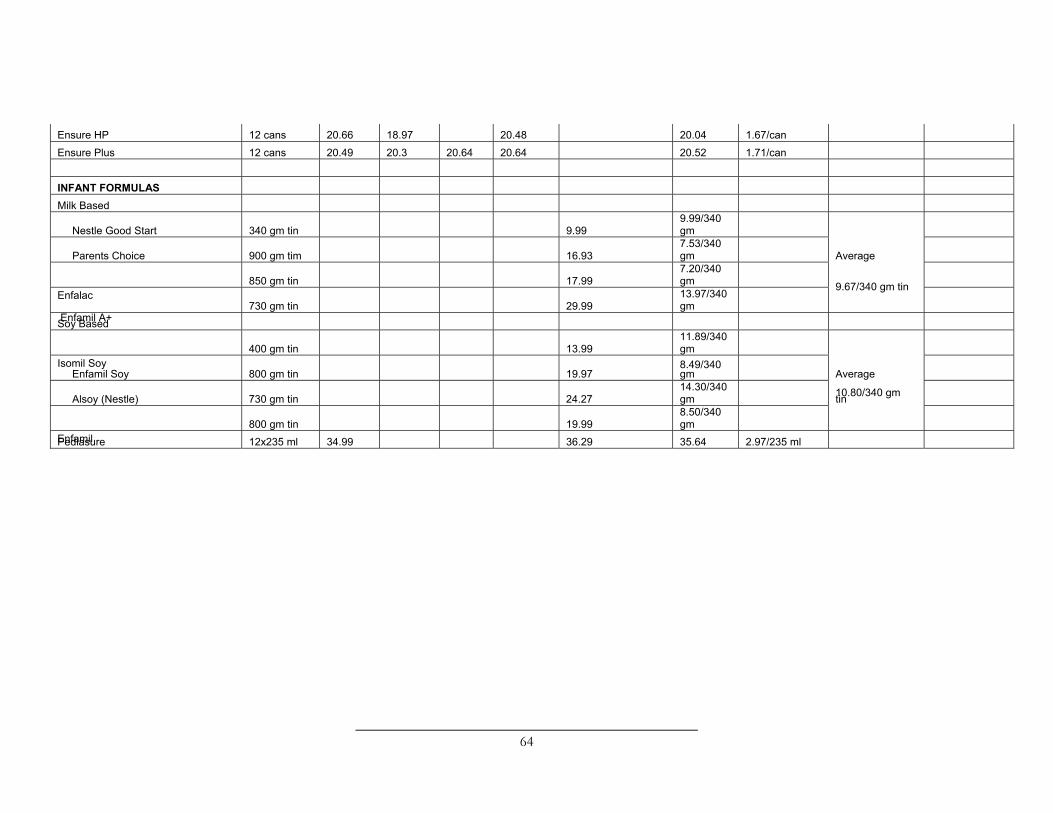
Ensure HP 12 cans 20.66 18.97 20.48 20.04 1.67/can
Ensure Plus 12 cans 20.49 20.3 20.64 20.64 20.52 1.71/can
INFANT FORMULAS Milk Based
Nestle Good Start 340 gm tin 9.99 9.99/340 gm
Parents Choice 900 gm tim 16.93 7.53/340 gm Average
Enfalac 850 gm tin 17.99
7.20/340 gm 9.67/340 gm tin
Enfamil A+ 730 gm tin 29.99
13.97/340 gm
Soy Based
Isomil Soy 400 gm tin 13.99
11.89/340 gm
Enfamil Soy 800 gm tin 19.97 8.49/340 gm Average
Alsoy (Nestle) 730 gm tin 24.27 14.30/340 gm 10.80/340 gm tin
Enfamil 800 gm tin 19.99
8.50/340 gm
Pediasure 12x235 ml 34.99 36.29 35.64 2.97/235 ml
64
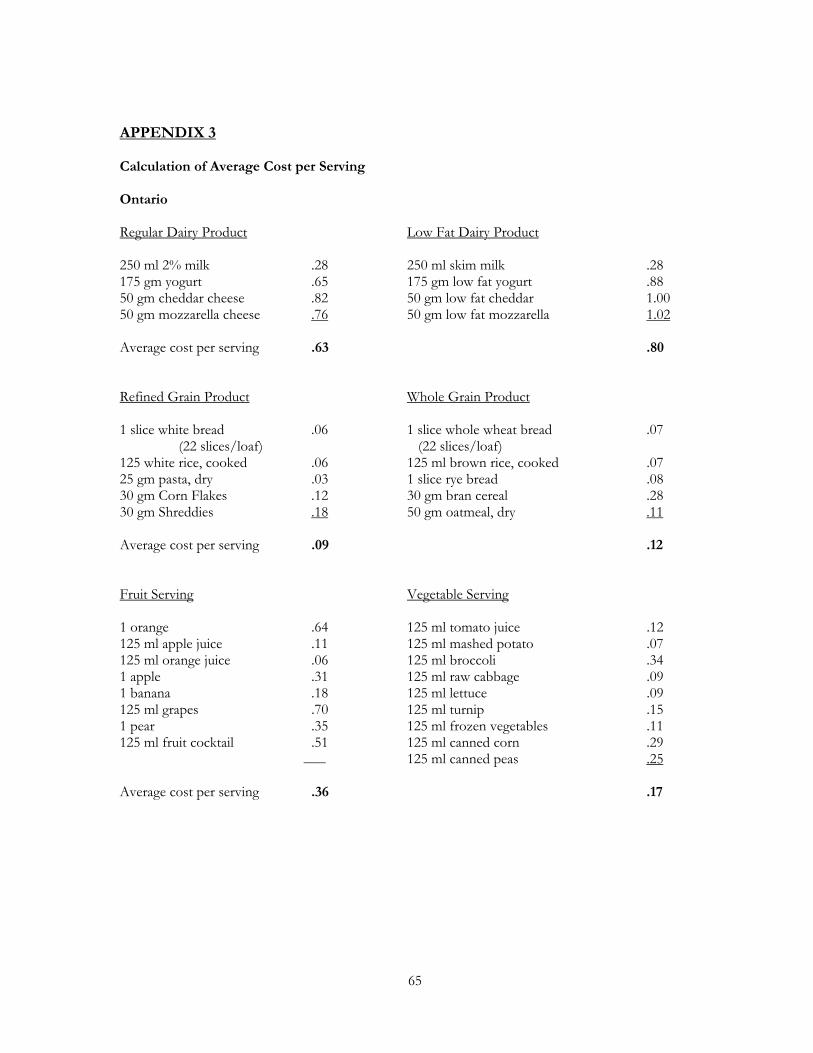
APPENDIX 3
Calculation of Average Cost per Serving
Ontario
Regular Dairy Product Low Fat Dairy Product
250 ml 2% milk .28 250 ml skim milk .28 175 gm yogurt .65 175 gm low fat yogurt .88 50 gm cheddar cheese .82 50 gm low fat cheddar 1.00 50 gm mozzarella cheese .76 50 gm low fat mozzarella 1.02
Average cost per serving .63 .80
Refined Grain Product Whole Grain Product
1 slice white bread .06 1 slice whole wheat bread .07 (22 slices/loaf) (22 slices/loaf)
125 white rice, cooked .06 125 ml brown rice, cooked .07 25 gm pasta, dry .03 1 slice rye bread .08 30 gm Corn Flakes .12 30 gm bran cereal .28 30 gm Shreddies .18 50 gm oatmeal, dry .11
Average cost per serving .09 .12
Fruit Serving Vegetable Serving
1 orange .64 125 ml tomato juice .12 125 ml apple juice .11 125 ml mashed potato .07 125 ml orange juice .06 125 ml broccoli .34 1 apple .31 125 ml raw cabbage .09 1 banana .18 125 ml lettuce .09 125 ml grapes .70 125 ml turnip .15 1 pear .35 125 ml frozen vegetables .11 125 ml fruit cocktail .51 125 ml canned corn .29
___ 125 ml canned peas .25
Average cost per serving .36 .17
65
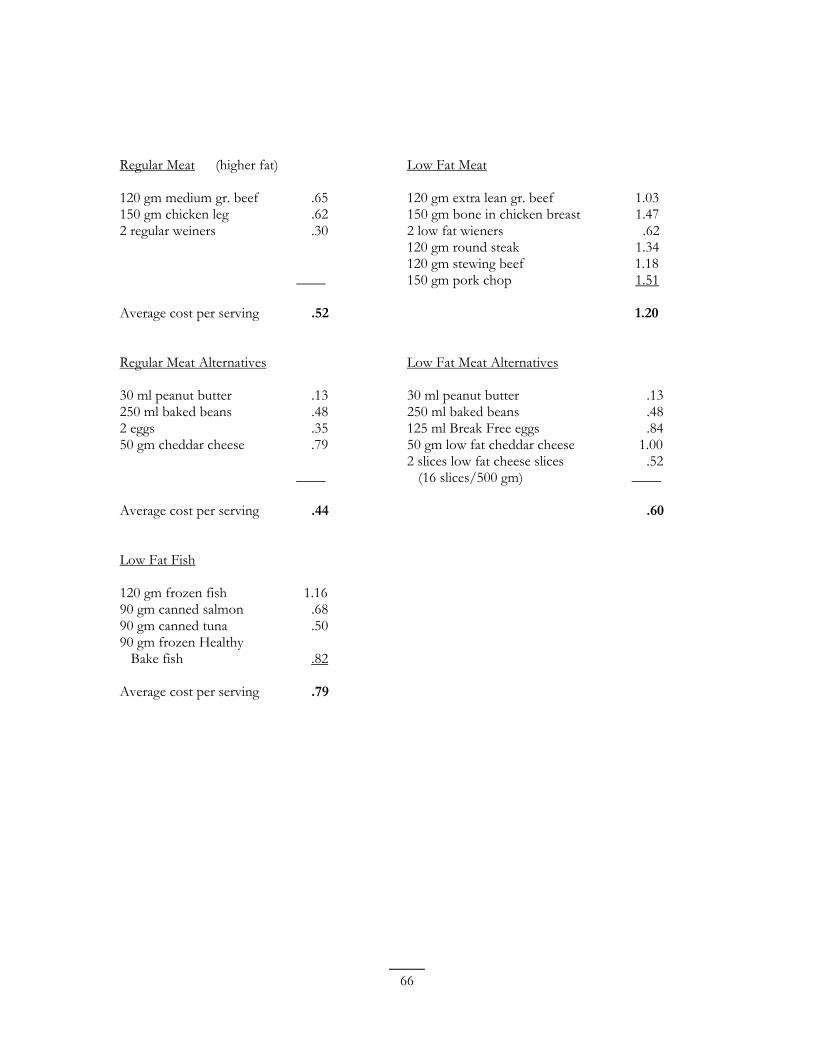
Regular Meat (higher fat) Low Fat Meat
120 gm medium gr. beef .65 120 gm extra lean gr. beef 1.03 150 gm chicken leg .62 150 gm bone in chicken breast 1.47 2 regular weiners .30 2 low fat wieners .62
120 gm round steak 1.34 120 gm stewing beef 1.18
____ 150 gm pork chop 1.51
Average cost per serving .52 1.20
Regular Meat Alternatives Low Fat Meat Alternatives
30 ml peanut butter .13 30 ml peanut butter .13 250 ml baked beans .48 250 ml baked beans .48 2 eggs .35 125 ml Break Free eggs .84 50 gm cheddar cheese .79 50 gm low fat cheddar cheese 1.00 2 slices low fat cheese slices .52
____ (16 slices/500 gm) ____
Average cost per serving .44 .60
Low Fat Fish
120 gm frozen fish 1.16 90 gm canned salmon .68 90 gm canned tuna .50 90 gm frozen Healthy
Bake fish .82
Average cost per serving .79
66
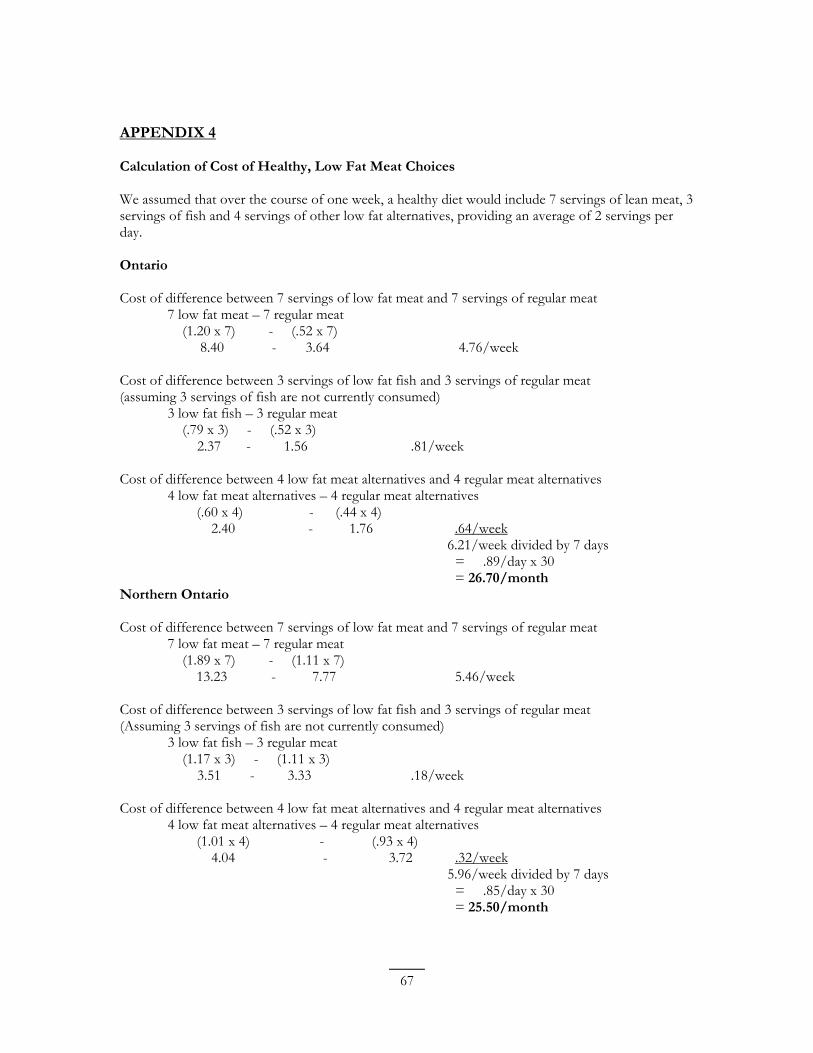
APPENDIX 4
Calculation of Cost of Healthy, Low Fat Meat Choices
We assumed that over the course of one week, a healthy diet would include 7 servings of lean meat, 3 servings of fish and 4 servings of other low fat alternatives, providing an average of 2 servings per day.
Ontario
Cost of difference between 7 servings of low fat meat and 7 servings of regular meat 7 low fat meat – 7 regular meat
(1.20 x 7) - (.52 x 7) 8.40 - 3.64 4.76/week
Cost of difference between 3 servings of low fat fish and 3 servings of regular meat (assuming 3 servings of fish are not currently consumed)
3 low fat fish – 3 regular meat (.79 x 3) - (.52 x 3)
2.37 - 1.56 .81/week
Cost of difference between 4 low fat meat alternatives and 4 regular meat alternatives 4 low fat meat alternatives – 4 regular meat alternatives
(.60 x 4) - (.44 x 4) 2.40 - 1.76 .64/week
6.21/week divided by 7 days = .89/day x 30 = 26.70/month
Northern Ontario
Cost of difference between 7 servings of low fat meat and 7 servings of regular meat 7 low fat meat – 7 regular meat
(1.89 x 7) - (1.11 x 7) 13.23 - 7.77 5.46/week
Cost of difference between 3 servings of low fat fish and 3 servings of regular meat (Assuming 3 servings of fish are not currently consumed)
3 low fat fish – 3 regular meat (1.17 x 3) - (1.11 x 3)
3.51 - 3.33 .18/week
Cost of difference between 4 low fat meat alternatives and 4 regular meat alternatives 4 low fat meat alternatives – 4 regular meat alternatives
(1.01 x 4) - (.93 x 4) 4.04 - 3.72 .32/week
5.96/week divided by 7 days = .85/day x 30 = 25.50/month
67
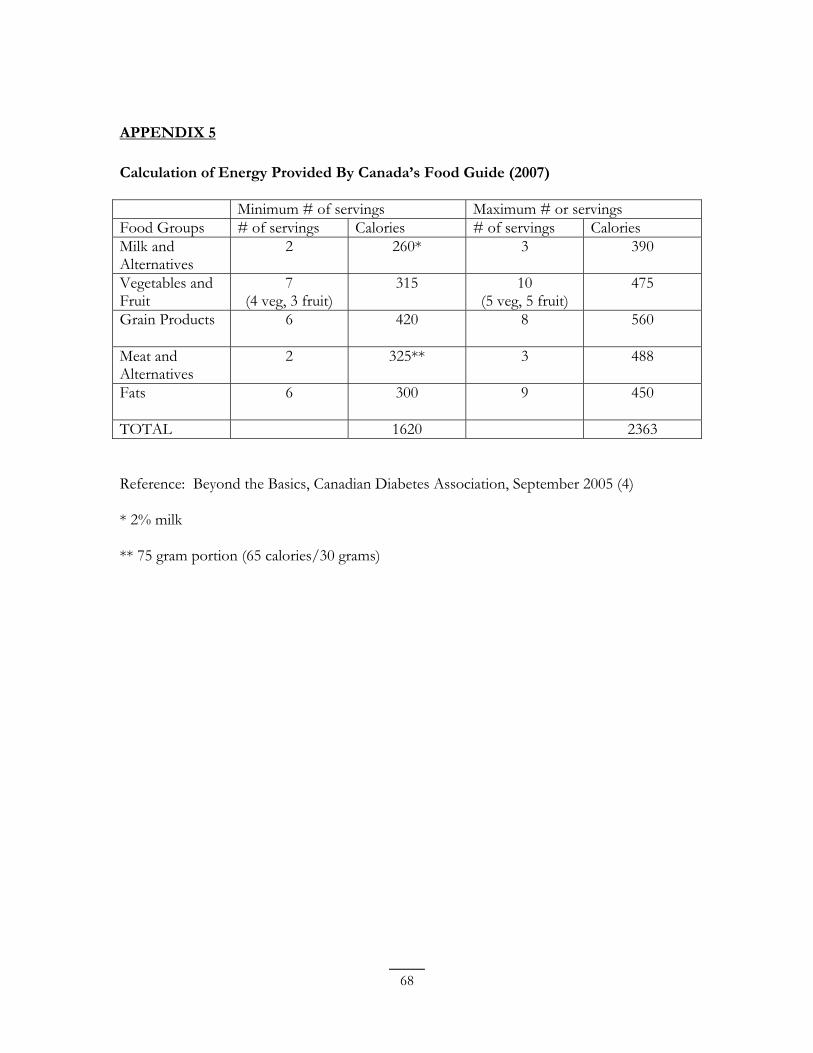
APPENDIX 5
Calculation of Energy Provided By Canada’s Food Guide (2007)
Minimum # of servings Maximum # or servings Food Groups # of servings Calories # of servings Calories Milk and Alternatives
2 260* 3 390
Vegetables and Fruit
7 (4 veg, 3 fruit)
315 10 (5 veg, 5 fruit)
475
Grain Products 6 420 8 560
Meat and Alternatives
2 325** 3 488
Fats 6 300 9 450
TOTAL 1620 2363
Reference: Beyond the Basics, Canadian Diabetes Association, September 2005 (4)
* 2% milk
** 75 gram portion (65 calories/30 grams)
68
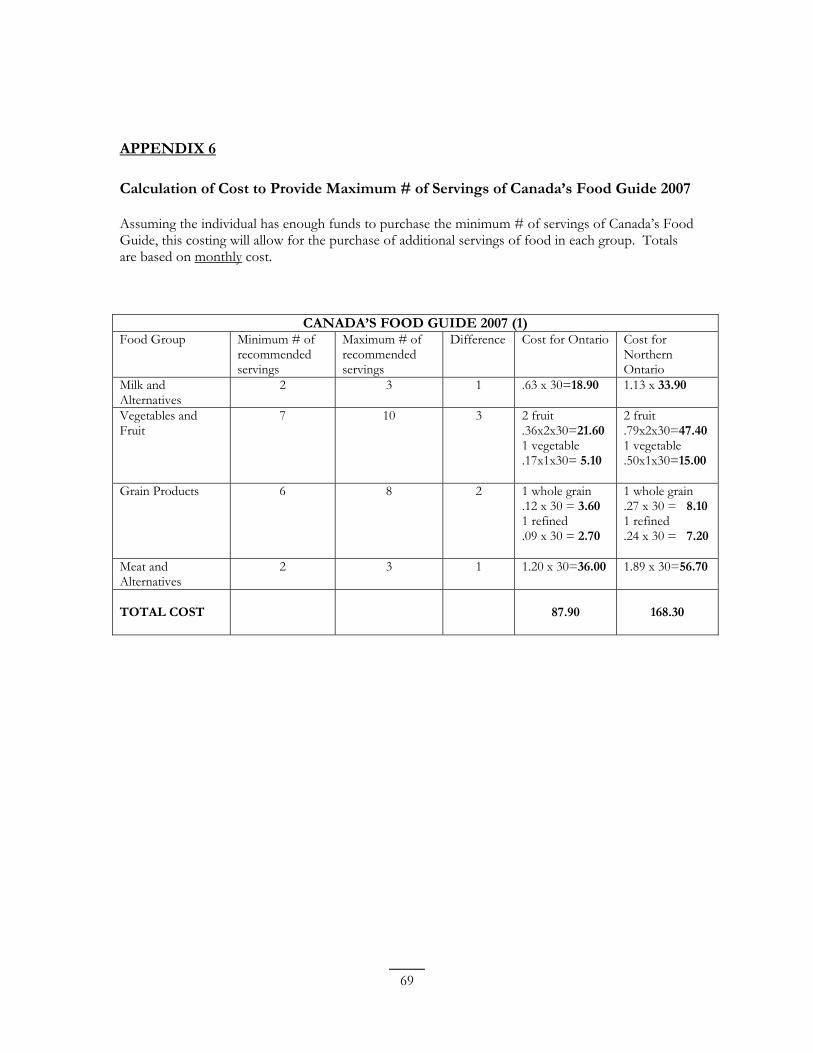
APPENDIX 6
Calculation of Cost to Provide Maximum # of Servings of Canada’s Food Guide 2007
Assuming the individual has enough funds to purchase the minimum # of servings of Canada’s Food Guide, this costing will allow for the purchase of additional servings of food in each group. Totals are based on monthly cost.
CANADA’S FOOD GUIDE 2007 (1) Food Group Minimum # of
recommended servings
Maximum # of recommended servings
Difference Cost for Ontario Cost for Northern Ontario
Milk and Alternatives
2 3 1 .63 x 30=18.90 1.13 x 33.90
Vegetables and Fruit
7 10 3 2 fruit .36x2x30=21.60 1 vegetable .17x1x30= 5.10
2 fruit .79x2x30=47.40 1 vegetable .50x1x30=15.00
Grain Products 6 8 2 1 whole grain .12 x 30 = 3.60 1 refined .09 x 30 = 2.70
1 whole grain .27 x 30 = 8.10 1 refined .24 x 30 = 7.20
Meat and Alternatives
2 3 1 1.20 x 30=36.00 1.89 x 30=56.70
TOTAL COST 87.90 168.30
69
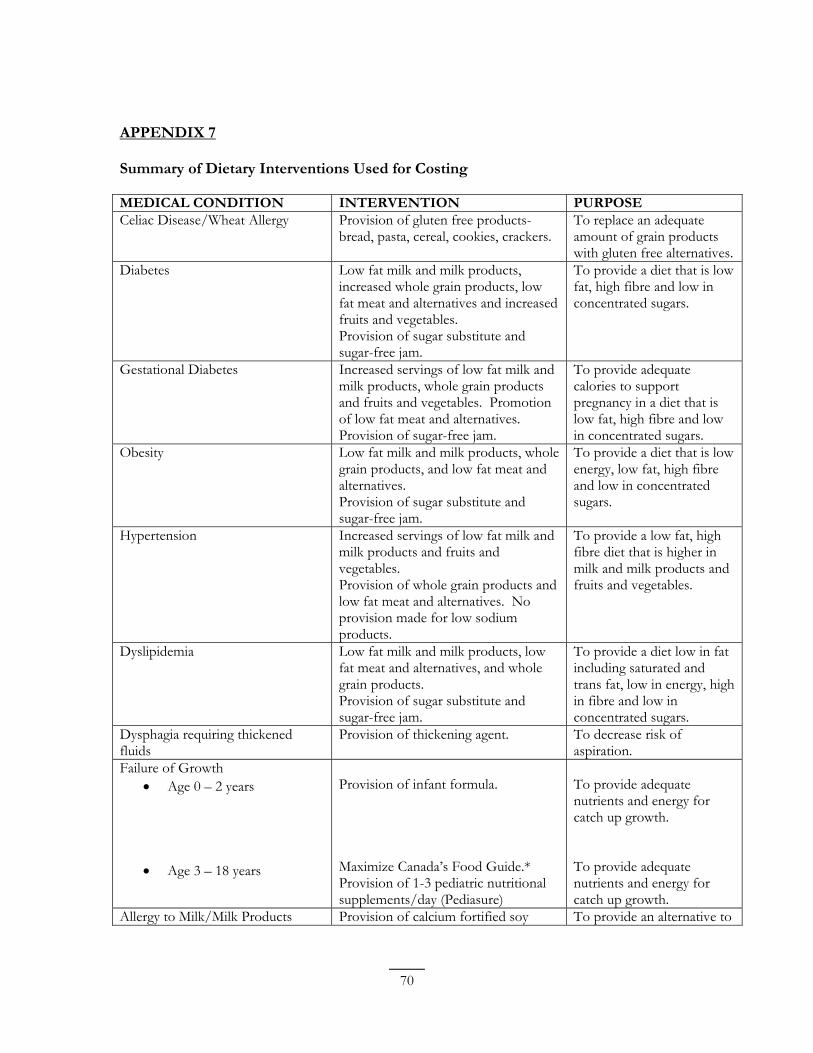
APPENDIX 7
Summary of Dietary Interventions Used for Costing
MEDICAL CONDITION INTERVENTION PURPOSE Celiac Disease/Wheat Allergy Provision of gluten free products-
bread, pasta, cereal, cookies, crackers. To replace an adequate amount of grain products with gluten free alternatives.
Diabetes Low fat milk and milk products, increased whole grain products, low fat meat and alternatives and increased fruits and vegetables. Provision of sugar substitute and sugar-free jam.
To provide a diet that is low fat, high fibre and low in concentrated sugars.
Gestational Diabetes Increased servings of low fat milk and milk products, whole grain products and fruits and vegetables. Promotion of low fat meat and alternatives. Provision of sugar-free jam.
To provide adequate calories to support pregnancy in a diet that is low fat, high fibre and low in concentrated sugars.
Obesity Low fat milk and milk products, whole grain products, and low fat meat and alternatives. Provision of sugar substitute and sugar-free jam.
To provide a diet that is low energy, low fat, high fibre and low in concentrated sugars.
Hypertension Increased servings of low fat milk and milk products and fruits and vegetables. Provision of whole grain products and low fat meat and alternatives. No provision made for low sodium products.
To provide a low fat, high fibre diet that is higher in milk and milk products and fruits and vegetables.
Dyslipidemia Low fat milk and milk products, low fat meat and alternatives, and whole grain products. Provision of sugar substitute and sugar-free jam.
To provide a diet low in fat including saturated and trans fat, low in energy, high in fibre and low in concentrated sugars.
Dysphagia requiring thickened fluids
Provision of thickening agent. To decrease risk of aspiration.
Failure of Growth • Age 0 – 2 years
• Age 3 – 18 years
Provision of infant formula.
Maximize Canada’s Food Guide.* Provision of 1-3 pediatric nutritional supplements/day (Pediasure)
To provide adequate nutrients and energy for catch up growth.
To provide adequate nutrients and energy for catch up growth.
Allergy to Milk/Milk Products Provision of calcium fortified soy To provide an alternative to
70
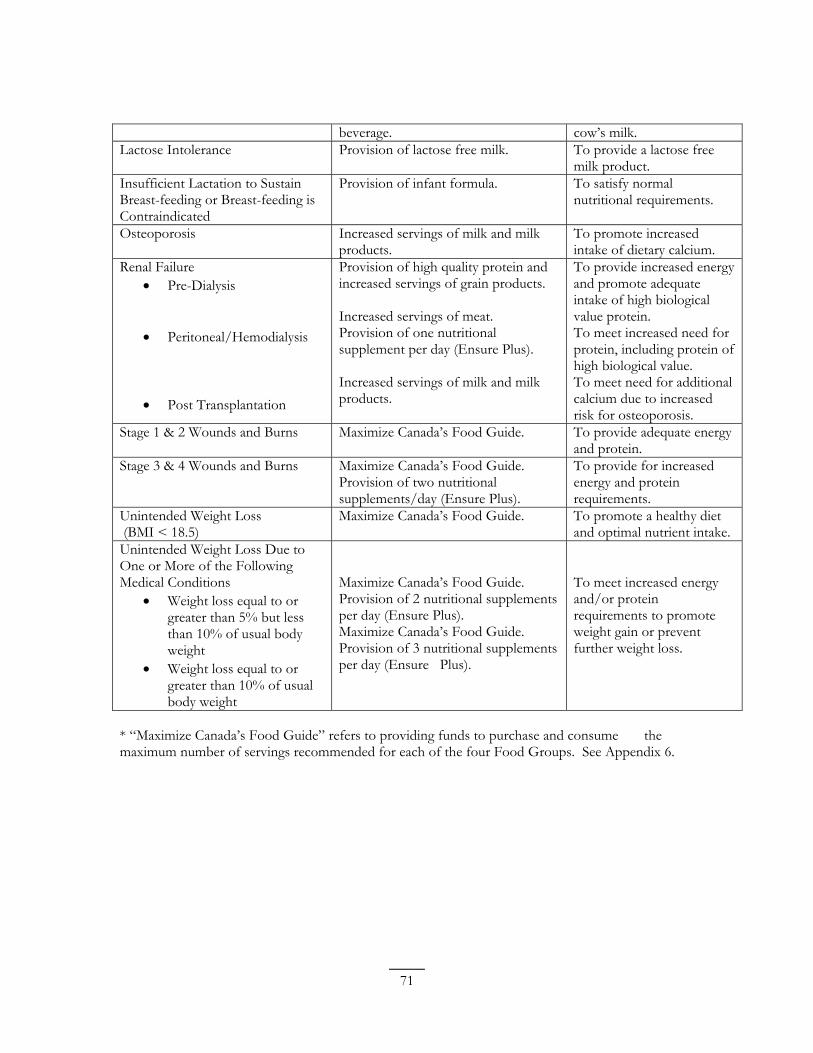
beverage. cow’s milk. Lactose Intolerance Provision of lactose free milk. To provide a lactose free
milk product. Insufficient Lactation to Sustain Breast-feeding or Breast-feeding is Contraindicated
Provision of infant formula. To satisfy normal nutritional requirements.
Osteoporosis Increased servings of milk and milk products.
To promote increased intake of dietary calcium.
Renal Failure • Pre-Dialysis
• Peritoneal/Hemodialysis
• Post Transplantation
Provision of high quality protein and increased servings of grain products.
Increased servings of meat. Provision of one nutritional supplement per day (Ensure Plus).
Increased servings of milk and milk products.
To provide increased energy and promote adequate intake of high biological value protein. To meet increased need for protein, including protein of high biological value. To meet need for additional calcium due to increased risk for osteoporosis.
Stage 1 & 2 Wounds and Burns Maximize Canada’s Food Guide. To provide adequate energy and protein.
Stage 3 & 4 Wounds and Burns Maximize Canada’s Food Guide. Provision of two nutritional supplements/day (Ensure Plus).
To provide for increased energy and protein requirements.
Unintended Weight Loss (BMI < 18.5)
Maximize Canada’s Food Guide. To promote a healthy diet and optimal nutrient intake.
Unintended Weight Loss Due to One or More of the Following Medical Conditions
• Weight loss equal to or greater than 5% but less than 10% of usual body weight
• Weight loss equal to or greater than 10% of usual body weight
Maximize Canada’s Food Guide. Provision of 2 nutritional supplements per day (Ensure Plus). Maximize Canada’s Food Guide. Provision of 3 nutritional supplements per day (Ensure Plus).
To meet increased energy and/or protein requirements to promote weight gain or prevent further weight loss.
* “Maximize Canada’s Food Guide” refers to providing funds to purchase and consume the maximum number of servings recommended for each of the four Food Groups. See Appendix 6.
71
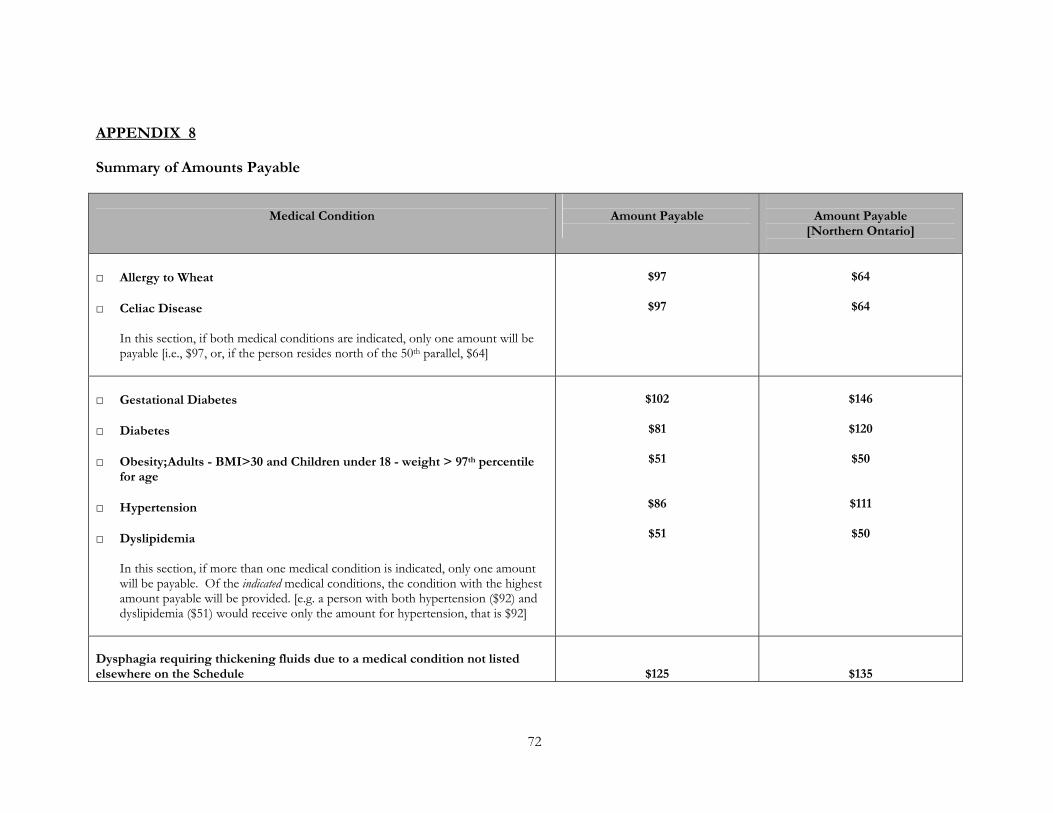
APPENDIX 8
Summary of Amounts Payable
Medical Condition Amount Payable Amount Payable [Northern Ontario]
□ Allergy to Wheat
□ Celiac Disease
In this section, if both medical conditions are indicated, only one amount will be payable [i.e., $97, or, if the person resides north of the 50th parallel, $64]
$97
$97
$64
$64
□ Gestational Diabetes
□ Diabetes
□ Obesity; Adults - BMI>30 and Children under 18 - weight > 97th percentile for age
□ Hypertension
□ Dyslipidemia
In this section, if more than one medical condition is indicated, only one amount will be payable. Of the indicated medical conditions, the condition with the highest amount payable will be provided. [e.g. a person with both hypertension ($92) and dyslipidemia ($51) would receive only the amount for hypertension, that is $92]
$102
$81
$51
$86
$51
$146
$120
$50
$111
$50
Dysphagia requiring thickening fluids due to a medical condition not listed elsewhere on the Schedule $125 $135
72
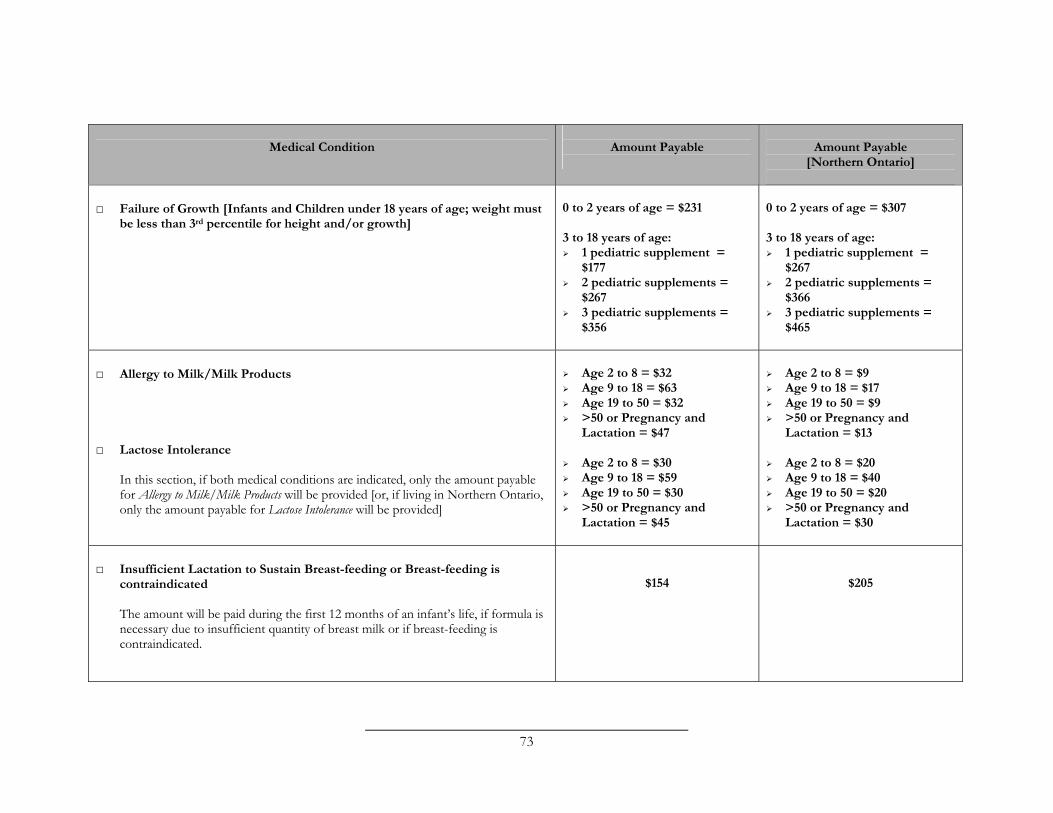
Medical Condition Amount Payable Amount Payable [Northern Ontario]
□ Failure of Growth [Infants and Children under 18 years of age; weight must be less than 3rd percentile for height and/or growth]
0 to 2 years of age = $231
3 to 18 years of age: ¾ 1 pediatric supplement =
$177 ¾ 2 pediatric supplements =
$267 ¾ 3 pediatric supplements =
$356
0 to 2 years of age = $307
3 to 18 years of age: ¾ 1 pediatric supplement =
$267 ¾ 2 pediatric supplements =
$366 ¾ 3 pediatric supplements =
$465
□ Allergy to Milk/Milk Products
□ Lactose Intolerance
In this section, if both medical conditions are indicated, only the amount payable for Allergy to Milk/Milk Products will be provided [or, if living in Northern Ontario, only the amount payable for Lactose Intolerance will be provided]
¾ Age 2 to 8 = $32 ¾ Age 9 to 18 = $63 ¾ Age 19 to 50 = $32 ¾ >50 or Pregnancy and
Lactation = $47
¾ Age 2 to 8 = $30 ¾ Age 9 to 18 = $59 ¾ Age 19 to 50 = $30 ¾ >50 or Pregnancy and
Lactation = $45
¾ Age 2 to 8 = $9 ¾ Age 9 to 18 = $17 ¾ Age 19 to 50 = $9 ¾ >50 or Pregnancy and
Lactation = $13
¾ Age 2 to 8 = $20 ¾ Age 9 to 18 = $40 ¾ Age 19 to 50 = $20 ¾ >50 or Pregnancy and
Lactation = $30
□ Insufficient Lactation to Sustain Breast-feeding or Breast-feeding is contraindicated
The amount will be paid during the first 12 months of an infant’s life, if formula is necessary due to insufficient quantity of breast milk or if breast-feeding is contraindicated.
$154 $205
73
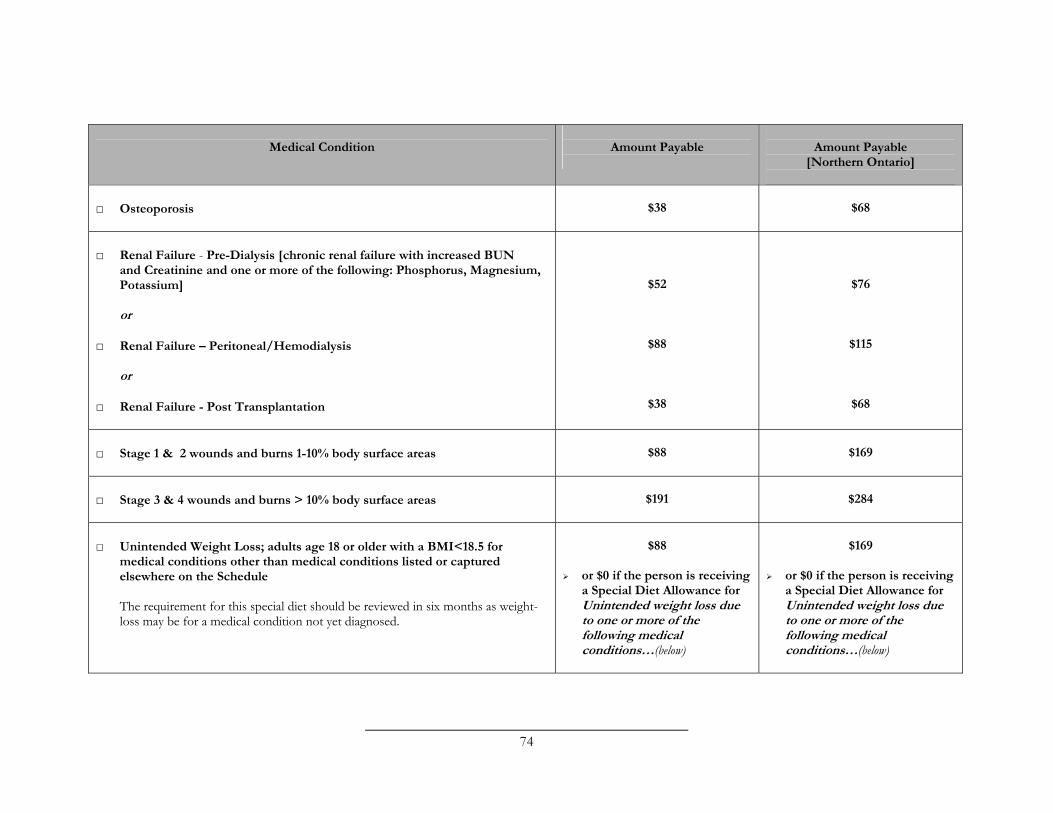
Medical Condition Amount Payable Amount Payable [Northern Ontario]
□ Osteoporosis $38 $68
□ Renal Failure - Pre-Dialysis [chronic renal failure with increased BUN and Creatinine and one or more of the following: Phosphorus, Magnesium, Potassium]
or
□ Renal Failure – Peritoneal/Hemodialysis
or
□ Renal Failure - Post Transplantation
$52
$88
$38
$76
$115
$68
□ Stage 1 & 2 wounds and burns 1-10% body surface areas $88 $169
□ Stage 3 & 4 wounds and burns > 10% body surface areas $191 $284
□ Unintended Weight Loss; adults age 18 or older with a BMI<18.5 for medical conditions other than medical conditions listed or captured elsewhere on the Schedule
The requirement for this special diet should be reviewed in six months as weight-loss may be for a medical condition not yet diagnosed.
¾
$88
or $0 if the person is receiving a Special Diet Allowance for Unintended weight loss due to one or more of the following medical conditions…(below)
¾
$169
or $0 if the person is receiving a Special Diet Allowance for Unintended weight loss due to one or more of the following medical conditions…(below)
74
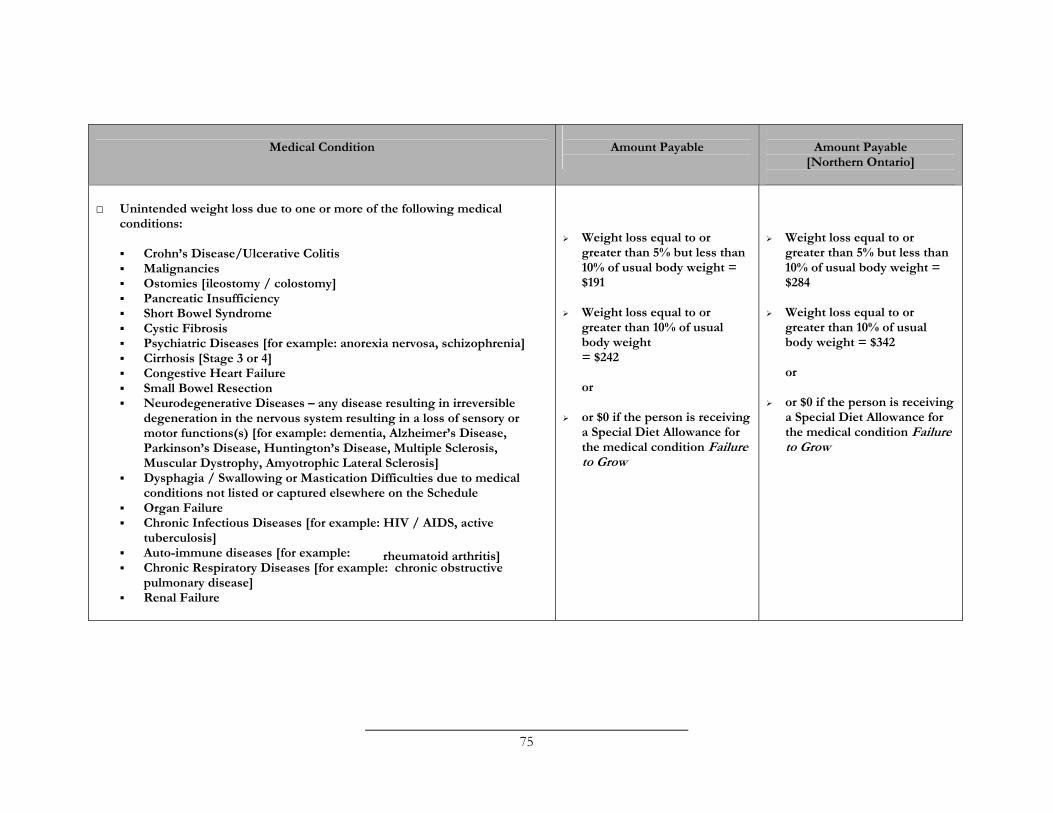
Medical Condition Amount Payable Amount Payable [Northern Ontario]
□ Unintended weight loss due to one or more of the following medical conditions:
� Crohn’s Disease/Ulcerative Colitis � Malignancies � Ostomies [ileostomy / colostomy] � Pancreatic Insufficiency � Short Bowel Syndrome � Cystic Fibrosis � Psychiatric Diseases [for example: anorexia nervosa, schizophrenia] � Cirrhosis [Stage 3 or 4] � Congestive Heart Failure � Small Bowel Resection � Neurodegenerative Diseases – any disease resulting in irreversible
degeneration in the nervous system resulting in a loss of sensory or motor functions(s) [for example: dementia, Alzheimer’s Disease, Parkinson’s Disease, Huntington’s Disease, Multiple Sclerosis, Muscular Dystrophy, Amyotrophic Lateral Sclerosis]
� Dysphagia / Swallowing or Mastication Difficulties due to medical conditions not listed or captured elsewhere on the Schedule
� Organ Failure � Chronic Infectious Diseases [for example: HIV / AIDS, active
tuberculosis] � Auto-immune diseases [for example: rheumatoid arthritis] � Chronic Respiratory Diseases [for example: chronic obstructive
pulmonary disease] � Renal Failure
¾
¾
¾
Weight loss equal to or greater than 5% but less than 10% of usual body weight = $191
Weight loss equal to or greater than 10% of usual body weight = $242
or
or $0 if the person is receiving a Special Diet Allowance for the medical condition Failure to Grow
¾
¾
¾
Weight loss equal to or greater than 5% but less than 10% of usual body weight = $284
Weight loss equal to or greater than 10% of usual body weight = $342
or
or $0 if the person is receiving a Special Diet Allowance for the medical condition Failure to Grow
75
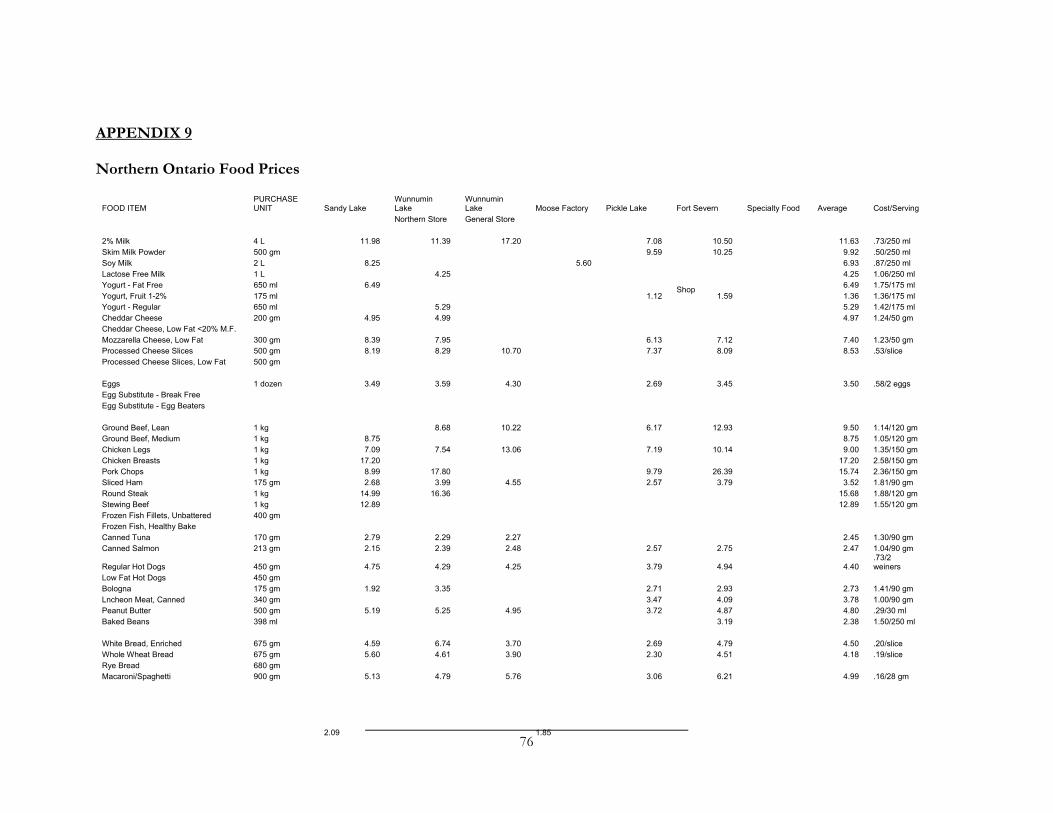
APPENDIX 9
Northern Ontario Food Prices
FOOD ITEM PURCHASE UNIT Sandy Lake
Wunnumin Lake
Northern Store
Wunnumin Lake General Store
Moose Factory Pickle Lake Fort Severn Specialty Food
Shop
Average Cost/Serving
2% Milk Skim Milk Powder Soy Milk Lactose Free Milk Yogurt - Fat Free Yogurt, Fruit 1-2% Yogurt - Regular Cheddar Cheese Cheddar Cheese, Low Fat <20% M.F. Mozzarella Cheese, Low Fat Processed Cheese Slices Processed Cheese Slices, Low Fat
4 L 500 gm 2 L 1 L 650 ml 175 ml 650 ml 200 gm
300 gm 500 gm 500 gm
11.98
8.25
6.49
4.95
8.39 8.19
11.39
4.25
5.29 4.99
7.95 8.29
17.20
10.70
5.60
7.08 9.59
1.12
6.13 7.37
10.50 10.25
1.59
7.12 8.09
11.63 9.92 6.93 4.25 6.49 1.36 5.29 4.97
7.40 8.53
.73/250 ml
.50/250 ml
.87/250 ml 1.06/250 ml 1.75/175 ml 1.36/175 ml 1.42/175 ml 1.24/50 gm
1.23/50 gm .53/slice
Eggs Egg Substitute - Break Free Egg Substitute - Egg Beaters
1 dozen 3.49 3.59 4.30 2.69 3.45 3.50 .58/2 eggs
Ground Beef, Lean Ground Beef, Medium Chicken Legs Chicken Breasts Pork Chops Sliced Ham Round Steak Stewing Beef Frozen Fish Fillets, Unbattered Frozen Fish, Healthy Bake Canned Tuna Canned Salmon
Regular Hot Dogs Low Fat Hot Dogs Bologna Lncheon Meat, Canned Peanut Butter Baked Beans
1 kg 1 kg 1 kg 1 kg 1 kg 175 gm 1 kg 1 kg 400 gm
170 gm 213 gm
450 gm 450 gm 175 gm 340 gm 500 gm 398 ml
8.75 7.09
17.20 8.99 2.68
14.99 12.89
2.79 2.15
4.75
1.92
5.19
8.68
7.54
17.80 3.99
16.36
2.29 2.39
4.29
3.35
5.25
2.09
10.22
13.06
4.55
2.27 2.48
4.25
4.95
6.17
7.19
9.79 2.57
2.57
3.79
2.71 3.47 3.72
1.85
12.93
10.14
26.39 3.79
2.75
4.94
2.93 4.09 4.87 3.19
9.50 8.75 9.00
17.20 15.74 3.52
15.68 12.89
2.45 2.47
4.40
2.73 3.78 4.80 2.38
1.14/120 gm 1.05/120 gm 1.35/150 gm 2.58/150 gm 2.36/150 gm 1.81/90 gm 1.88/120 gm 1.55/120 gm
1.30/90 gm 1.04/90 gm .73/2 weiners
1.41/90 gm 1.00/90 gm .29/30 ml 1.50/250 ml
White Bread, Enriched Whole Wheat Bread Rye Bread Macaroni/Spaghetti
675 gm 675 gm 680 gm 900 gm
4.59 5.60
5.13
6.74 4.61
4.79
3.70 3.90
5.76
2.69 2.30
3.06
4.79 4.51
6.21
4.50 4.18
4.99
.20/slice
.19/slice
.16/28 gm
76
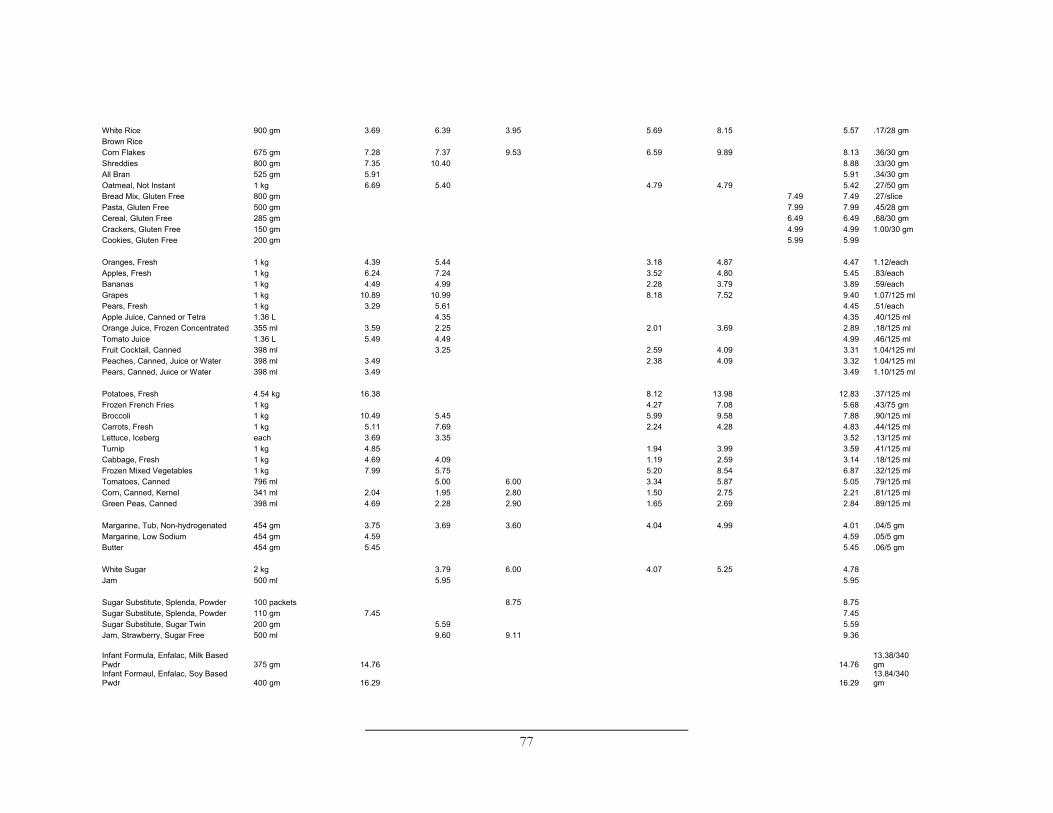
White Rice 900 gm 3.69 6.39 3.95 5.69 8.15 5.57 .17/28 gm Brown Rice Corn Flakes 675 gm 7.28 7.37 9.53 6.59 9.89 8.13 .36/30 gm Shreddies 800 gm 7.35 10.40 8.88 .33/30 gm All Bran 525 gm 5.91 5.91 .34/30 gm Oatmeal, Not Instant 1 kg 6.69 5.40 4.79 4.79 5.42 .27/50 gm Bread Mix, Gluten Free 800 gm 7.49 7.49 .27/slice Pasta, Gluten Free 500 gm 7.99 7.99 .45/28 gm Cereal, Gluten Free 285 gm 6.49 6.49 .68/30 gm Crackers, Gluten Free 150 gm 4.99 4.99 1.00/30 gm Cookies, Gluten Free 200 gm 5.99 5.99
Oranges, Fresh 1 kg 4.39 5.44 3.18 4.87 4.47 1.12/each Apples, Fresh 1 kg 6.24 7.24 3.52 4.80 5.45 .83/each Bananas 1 kg 4.49 4.99 2.28 3.79 3.89 .59/each Grapes 1 kg 10.89 10.99 8.18 7.52 9.40 1.07/125 ml Pears, Fresh 1 kg 3.29 5.61 4.45 .51/each Apple Juice, Canned or Tetra 1.36 L 4.35 4.35 .40/125 ml Orange Juice, Frozen Concentrated 355 ml 3.59 2.25 2.01 3.69 2.89 .18/125 ml Tomato Juice 1.36 L 5.49 4.49 4.99 .46/125 ml Fruit Cocktail, Canned 398 ml 3.25 2.59 4.09 3.31 1.04/125 ml Peaches, Canned, Juice or Water 398 ml 3.49 2.38 4.09 3.32 1.04/125 ml Pears, Canned, Juice or Water 398 ml 3.49 3.49 1.10/125 ml
Potatoes, Fresh 4.54 kg 16.38 8.12 13.98 12.83 .37/125 ml Frozen French Fries 1 kg 4.27 7.08 5.68 .43/75 gm Broccoli 1 kg 10.49 5.45 5.99 9.58 7.88 .90/125 ml Carrots, Fresh 1 kg 5.11 7.69 2.24 4.28 4.83 .44/125 ml Lettuce, Iceberg each 3.69 3.35 3.52 .13/125 ml Turnip 1 kg 4.85 1.94 3.99 3.59 .41/125 ml Cabbage, Fresh 1 kg 4.69 4.09 1.19 2.59 3.14 .18/125 ml Frozen Mixed Vegetables 1 kg 7.99 5.75 5.20 8.54 6.87 .32/125 ml Tomatoes, Canned 796 ml 5.00 6.00 3.34 5.87 5.05 .79/125 ml Corn, Canned, Kernel 341 ml 2.04 1.95 2.80 1.50 2.75 2.21 .81/125 ml Green Peas, Canned 398 ml 4.69 2.28 2.90 1.65 2.69 2.84 .89/125 ml
Margarine, Tub, Non-hydrogenated 454 gm 3.75 3.69 3.60 4.04 4.99 4.01 .04/5 gm Margarine, Low Sodium 454 gm 4.59 4.59 .05/5 gm Butter 454 gm 5.45 5.45 .06/5 gm
White Sugar 2 kg 3.79 6.00 4.07 5.25 4.78 Jam 500 ml 5.95 5.95
Sugar Substitute, Splenda, Powder 100 packets 8.75 8.75 Sugar Substitute, Splenda, Powder 110 gm 7.45 7.45 Sugar Substitute, Sugar Twin 200 gm 5.59 5.59 Jam, Strawberry, Sugar Free 500 ml 9.60 9.11 9.36
Infant Formula, Enfalac, Milk Based Pwdr 375 gm 14.76 14.76
13.38/340 gm
Infant Formaul, Enfalac, Soy Based Pwdr 400 gm 16.29 16.29
13.84/340 gm
77
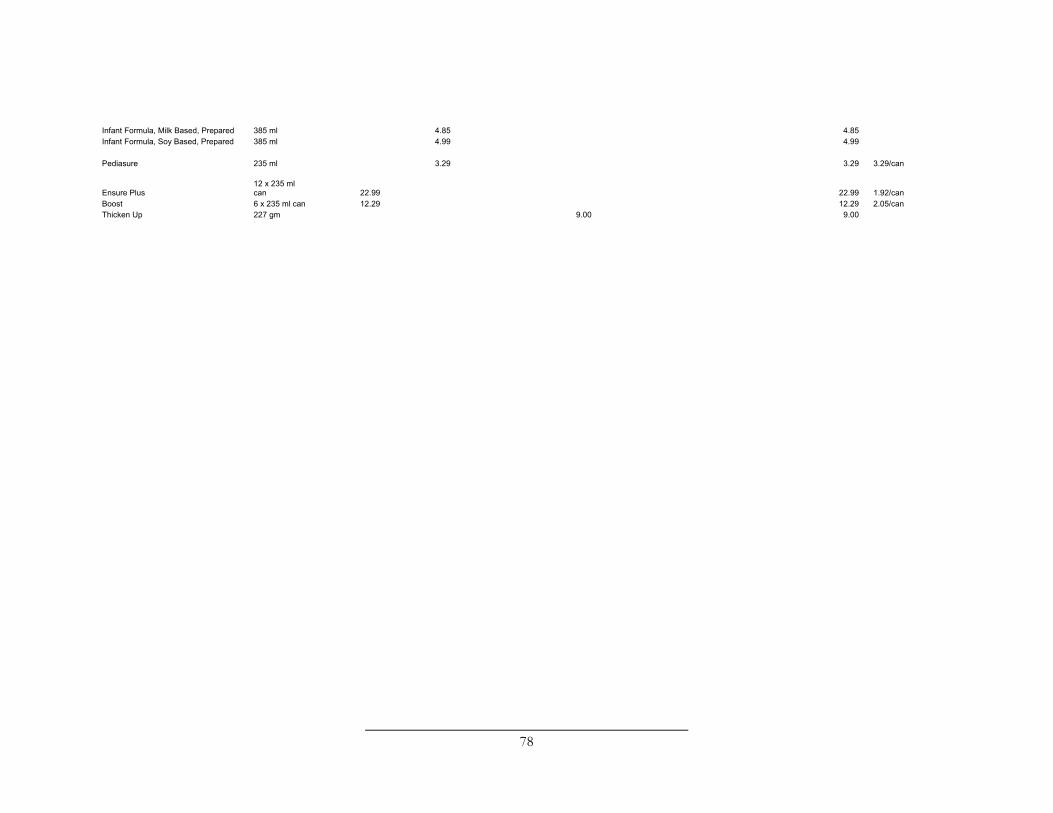
Infant Formula, Milk Based, Prepared Infant Formula, Soy Based, Prepared
385 ml 385 ml
4.85 4.99
4.85 4.99
Pediasure 235 ml 3.29 3.29 3.29/can
Ensure Plus Boost Thicken Up
12 x 235 ml can 6 x 235 ml can 227 gm
22.99 12.29
9.00
22.99 12.29 9.00
1.92/can 2.05/can
78
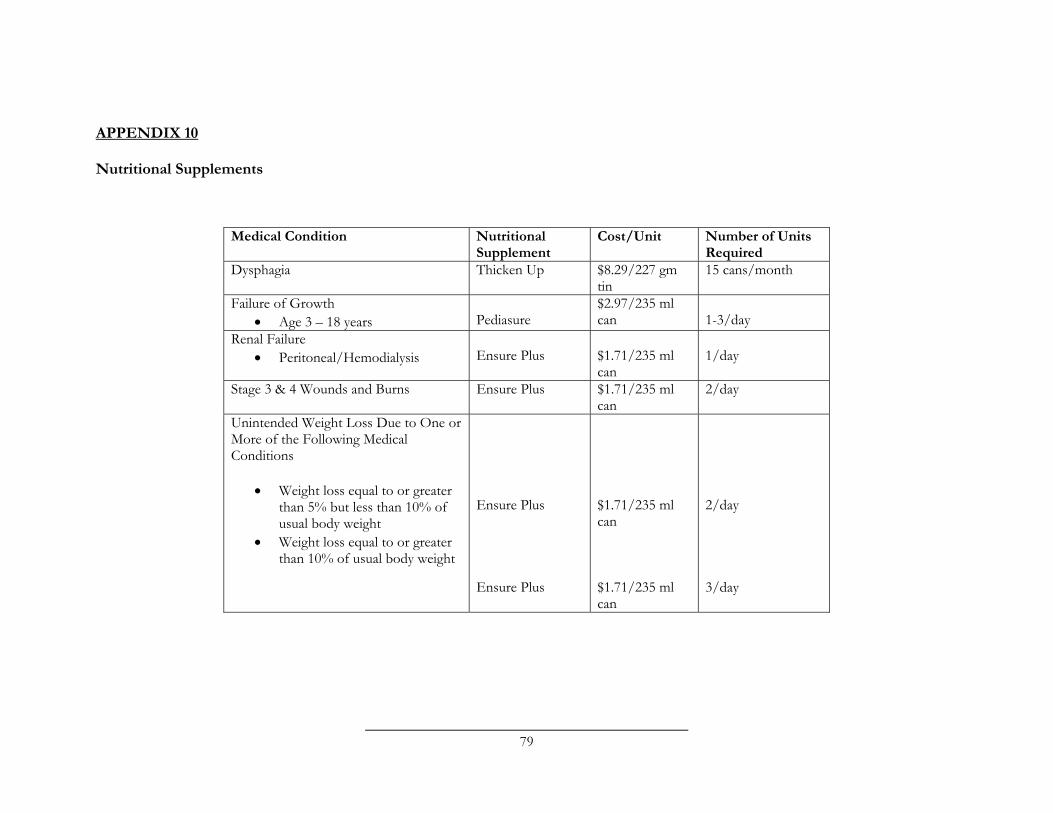
APPENDIX 10
Nutritional Supplements
Medical Condition Nutritional Supplement
Cost/Unit Number of Units Required
Dysphagia Thicken Up $8.29/227 gm tin
15 cans/month
Failure of Growth • Age 3 – 18 years Pediasure
$2.97/235 ml can 1-3/day
Renal Failure • Peritoneal/Hemodialysis Ensure Plus $1.71/235 ml
can 1/day
Stage 3 & 4 Wounds and Burns Ensure Plus $1.71/235 ml can
2/day
Unintended Weight Loss Due to One or More of the Following Medical Conditions
• Weight loss equal to or greater than 5% but less than 10% of usual body weight
• Weight loss equal to or greater than 10% of usual body weight
Ensure Plus
Ensure Plus
$1.71/235 ml can
$1.71/235 ml can
2/day
3/day
79