Embed Size (px)
Citation preview
Special Eurobarometer 412
SPORT AND PHYSICAL ACTIVITY
SUMMARY
Fieldwork: November – December 2013
Publication: March 2014
This survey has been requested by the European Commission, Directorate-General for Education
and Culture and co-ordinated by Directorate-General for Communication.
http://ec.europa.eu/public_opinion/index_en.htm
This document does not represent the point of view of the European Commission. The interpretations and opinions contained in it are solely those of the authors.
Special Eurobarometer 412 / Wave EB80.2 – TNS Opinion & Social
Special Eurobarometer 412
Sport and physical activity
Conducted by TNS Opinion & Social at the request of the Directorate-General for Education and Culture
Survey co-ordinated by the Directorate-General for
Communication
(DG COMM “Strategy, Corporate Communication Actions and
Eurobarometer” Unit)

Project number 20.143.316
Project title Special Eurobarometer 412 “Sport and physical activity”
Linguistic Version EN
Catalogue Number NC-04-14-311-EN-N
ISBN 978-92-79-36791-5
DOI 10.2766/7294
SPECIAL EUROBAROMETER 412 “Sport and physical activity”
1
TABLE OF CONTENTS
MAIN FINDINGS ...................................................................................... 4
1. FREQUENCY AND LEVELS OF ENGAGEMENT IN SPORT AND OTHER
PHYSICAL ACTIVITY ............................................................................ 6
1.1. Frequency .................................................................................................................... 6
1.1.1. Exercising or playing sport .................................................................................... 6
1.1.2. Engaging in other physical activity .................................................................... 10
1.2. Levels of engagement ............................................................................................. 13
1.2.1. Vigorous physical activity ..................................................................................... 13
1.2.2. Moderate physical activity .................................................................................... 15
1.2.3. Walking .................................................................................................................... 17
1.2.4. Sitting ....................................................................................................................... 19
2. WHERE CITIZENS ENGAGE IN SPORT AND OTHER PHYSICAL
ACTIVITY ........................................................................................... 21
2.1. Different settings ..................................................................................................... 21
2.2. Club membership ...................................................................................................... 22
3. UNDERSTANDING MOTIVATORS AND BARRIERS TO SPORT
PARTICIPATION ................................................................................ 23
3.1. Motivators ................................................................................................................... 23
3.2. Barriers ........................................................................................................................ 24
4. SUPPORT FOR SPORT PARTICIPATION IN CITIZENS’ LOCAL AREA .... 25
4.1. Opportunities in the local area ............................................................................. 25
4.2. Opportunities offered by local sport clubs and other providers ................. 26
4.3. Local authority provisions ..................................................................................... 27
5. VOLUNTEERING IN SPORT ................................................................. 28
5.1. Prevalence of volunteering .................................................................................... 28
5.2. Time spent on volunteering .................................................................................. 29
5.3. Type of activities ...................................................................................................... 31
CONCLUSIONS ....................................................................................... 32
SPECIAL EUROBAROMETER 412 “Sport and physical activity”
2
INTRODUCTION
In 2007, the White Paper on Sport was issued by the European Commission as the first
policy document addressing sport on behalf of the European Union. The Lisbon Treaty,
into force since December 2009, introduced a specific article, namely Article 165 TFEU,
which gave the EU a new supporting competence for sport. This article entails provisions
for promoting European sporting issues and calls for EU action to develop the European
dimension in sport.
In early 2011, the Commission adopted a Communication entitled "Developing the
European Dimension in Sport" providing for specific actions regarding the societal role of
sport, sport's economic dimension and the organisation of sport. Based on this
Communication, the Council adopted a Resolution on an EU Work Plan for Sport 2011-
2014, which further strengthened European cooperation on sport by setting priorities for
EU level work engaging the EU Member States and the Commission. The EU Work Plan
identified the social values of sport, in particular the promotion of participation in sport
and physical activity among the priority themes. To implement the Work Plan, work at
the expert level inter alia focused on providing input to the questionnaire of the present
Eurobarometer. In 2012, the Council adopted conclusions on promoting health-enhancing
physical activity and on strengthening the evidence-base for sport policy making, both
calling on the Commission to issue regular surveys on sport and physical activity.
Following a proposal from the Commission, for the first time, financial support for sport is
now included in form of a specific chapter in Erasmus+, the new EU programme for
education, training, youth and sport for the period 2014-2020. In May 2014, the Council
is expected to adopt a new multiannual EU Work Plan for Sport. The strengthening of the
evidence base for sport policy-making is also likely to remain a key principle under this
new Work Plan.
This Eurobarometer survey, which follows on from comparable surveys conducted in
2002 and 2009, will contribute to providing some of the data to support the developing
policy framework for promoting sport and physical activity described above. Moreover, it
will allow policy makers, researchers and other interested parties to deliver trend
analysis on various matters compared to 11 and 4 years respectively.
This survey was carried out by TNS Opinion & Social network in the 28 Member States of
the European Union between 23 November and 2 December 2013. Some 27.919
respondents from different social and demographic groups were interviewed face-to-face
at home in their mother tongue on behalf of the Directorate-General for Education and
Culture ("Sport" Unit). The methodology used is that of Eurobarometer surveys1 as
carried out by the Directorate-General for Communication (“Strategy, Corporate
Communication Actions and Eurobarometer” Unit).
1 http://ec.europa.eu/public_opinion/index_en.htm
SPECIAL EUROBAROMETER 412 “Sport and physical activity”
3
Note: In this report, countries are referred to by their official abbreviation. The
abbreviations used in this report correspond to:
ABBREVIATIONS
BE Belgium LT Lithuania
BG Bulgaria LU Luxembourg
CZ Czech Republic HU Hungary
DK Denmark MT Malta
DE Germany NL The Netherlands
EE Estonia AT Austria
EL Greece PL Poland
ES Spain PT Portugal
FR France RO Romania
HR Croatia SI Slovenia
IE Ireland SK Slovakia
IT Italy FI Finland
CY Republic of Cyprus* SE Sweden
LV Latvia UK The United Kingdom
EU28 European Union – 28 Member States
* Cyprus as a whole is one of the 28 European Union Member States. However, the ‘acquis communautaire’ has
been suspended in the part of the country which is not controlled by the government of the Republic of Cyprus.
For practical reasons, only the interviews carried out in the part of the country controlled by the government of
the Republic of Cyprus are included in the ‘CY’ category and in the EU28 average.
* * * * *
We wish to thank the people throughout the European Union who have given their time
to take part in this survey. Without their active participation, this study would not have
been possible.
SPECIAL EUROBAROMETER 412 “Sport and physical activity”
4
MAIN FINDINGS
The main findings of this Eurobarometer survey on sport and physical activity are as
follows:
41% of Europeans exercise or play sport at least once a week, while an important
proportion of EU citizens (59%) never or seldom do so. The figures have not
changed substantially since 2009. However, the proportion that never exercises or
plays sport has increased from 39% to 42%.
48% do some form of other physical activity (such as cycling, dancing or
gardening) at least once a week, while 30% never do this kind of activity at all.
Overall, men in the EU exercise, play sport or engage in other physical activity
more than women. However, this disparity is particularly marked in the 15-24 age
group, with young men tending to exercise or play sport on a regular basis
considerably more than young women (74% vs 55%). The amount of regular
activity that people do tends to decrease with age, notably 71% of women and
70% of men in the 55+ age groups never or seldom exercise or play sport.
Generally speaking, citizens in the Northern part of the EU are the most physically
active. The proportion that exercises or plays sport at least once a week is 70% in
Sweden, 68% in Denmark, 66% in Finland, 58% in the Netherlands and 54% in
Luxembourg. The lowest levels of participation are clustered in the Southern EU
Member States. Most respondents who never exercise or play sport can be found
in Bulgaria (78%), Malta (75%), Portugal (64%), Romania (60%) and Italy
(60%).
As for the levels of engagement in physical activity within a week, 54% of all
respondents did not do any vigorous activity (-4 percentage points –pp- compared
to 2002) and 44% did not do any moderate physical activity (+3 pp). Moreover,
13% of EU citizens did not walk for at least 10 minutes at a time on a given day
within a week (-4 pp). In addition, on a usual day, about two-thirds (69%) of
respondents spend between 2.5 and 8.5 hours sitting (+5 pp), while at other
extremes, 11% sit for more than 8.5 hours and 17% 2.5 hours or less.
Sport or physical activity takes place in a wide range of locations, most commonly
in parks and outdoors (40%), at home (36%) or on the journey between home
and school, work or shops (25%).2
2 To be noted: the response category 'at home' was new in this survey. Other figures have not changed
substantially since 2009.
SPECIAL EUROBAROMETER 412 “Sport and physical activity”
5
Almost three-quarters of EU citizens (74%) say that they are not members of any
club, a considerable increase since 2009 (67%). There were no substantial
changes for any of the individual types of club; however, there was a slight
increase in memberships of health or fitness centres (from 9% to 11%).
The most common reason for engaging in sport or physical activity is to improve
health (62%). Other popular reasons include improving fitness (40%), relaxing
(36%) and having fun (30%). These figures have not changed substantially since
2009.
A shortage of time is by far the main reason given for not practising sport more
regularly (42%). Other factors mentioned are a lack of motivation or interest
(20%), having a disability or illness (13%) or that it is too expensive (10%). In
2009 lack of time was also mentioned (45%) as the main reason that prevented
people from doing sport more often.3
Three-quarters of respondents (76%) agree that in their local area there are
opportunities to be physically active, and the majority of EU citizens (74%) think
that their local sport clubs and other providers offer them such opportunities. The
figures have not changed substantially since 2009. However, there are more
mixed views as to whether local authorities do enough to provide their citizens
with such opportunities: 39% of respondents think that they do not do enough,
while 52% think they do. Here views expressed have been slightly more negative
since 2009 (35% and 54% respectively).
Overall, 7% of EU citizens say that they engage in voluntary work that supports
sport activities. More than a third of respondents (35%) devote at least six hours
of their time each month to volunteering in sport, with 8% of those surveyed
giving 21 hours or more. These figures have not changed substantially since
2009; however, a shift can be seen to volunteer more and not only occasionally,
at individual events. The most common activity is organising or helping to run a
sporting event.
3 However, due to important changes in the response categories a coherent trend analysis cannot be done.
SPECIAL EUROBAROMETER 412 “Sport and physical activity”
6
1. FREQUENCY AND LEVELS OF ENGAGEMENT IN SPORT AND OTHER
PHYSICAL ACTIVITY
This chapter examines frequency and levels of engagement in sport and other physical
activity. It looks in detail at the amount of time EU citizens spend doing vigorous and
moderate physical activity as well as time spent walking and sitting down. As a result, it
provides a comprehensive picture of behaviour in relation to sport and physical activity.
1.1. Frequency
This first section looks at the proportion of EU citizens who exercise or play sport and
who engage in other physical activity.
1.1.1. Exercising or playing sport
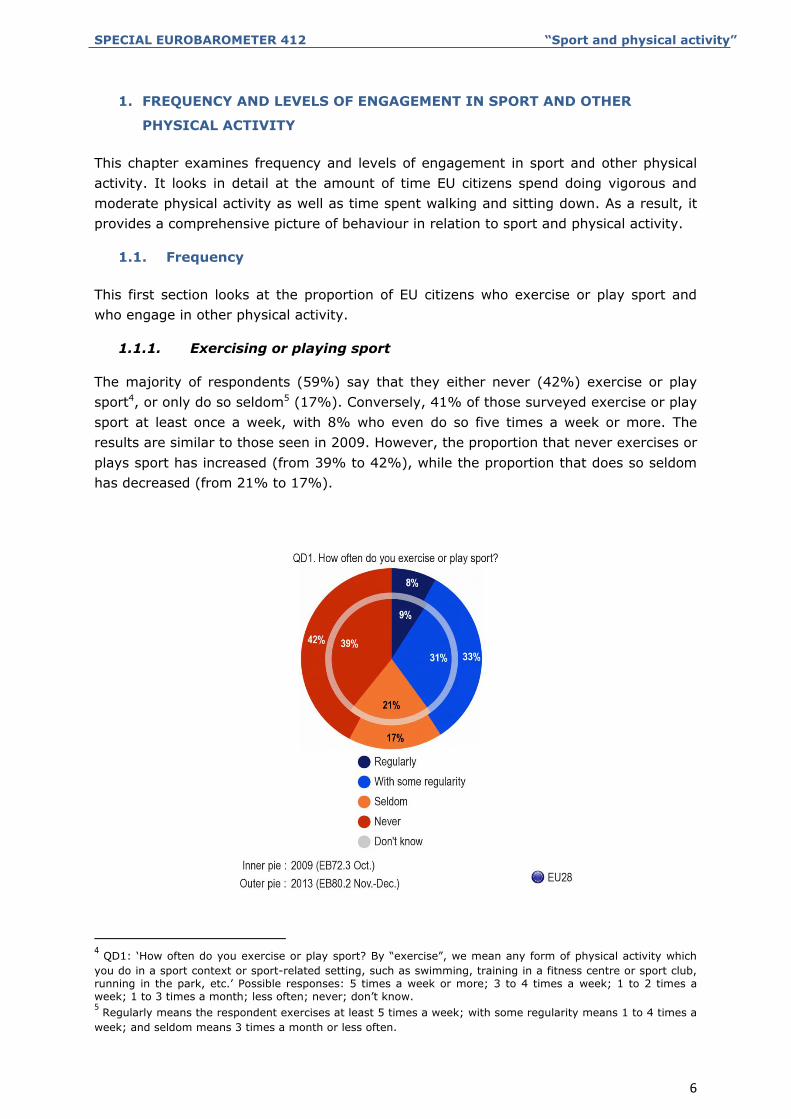
The majority of respondents (59%) say that they either never (42%) exercise or play
sport4, or only do so seldom5 (17%). Conversely, 41% of those surveyed exercise or play
sport at least once a week, with 8% who even do so five times a week or more. The
results are similar to those seen in 2009. However, the proportion that never exercises or
plays sport has increased (from 39% to 42%), while the proportion that does so seldom
has decreased (from 21% to 17%).
4 QD1: ‘How often do you exercise or play sport? By “exercise”, we mean any form of physical activity which
you do in a sport context or sport-related setting, such as swimming, training in a fitness centre or sport club,
running in the park, etc.’ Possible responses: 5 times a week or more; 3 to 4 times a week; 1 to 2 times a
week; 1 to 3 times a month; less often; never; don’t know. 5 Regularly means the respondent exercises at least 5 times a week; with some regularity means 1 to 4 times a
week; and seldom means 3 times a month or less often.
SPECIAL EUROBAROMETER 412 “Sport and physical activity”
7
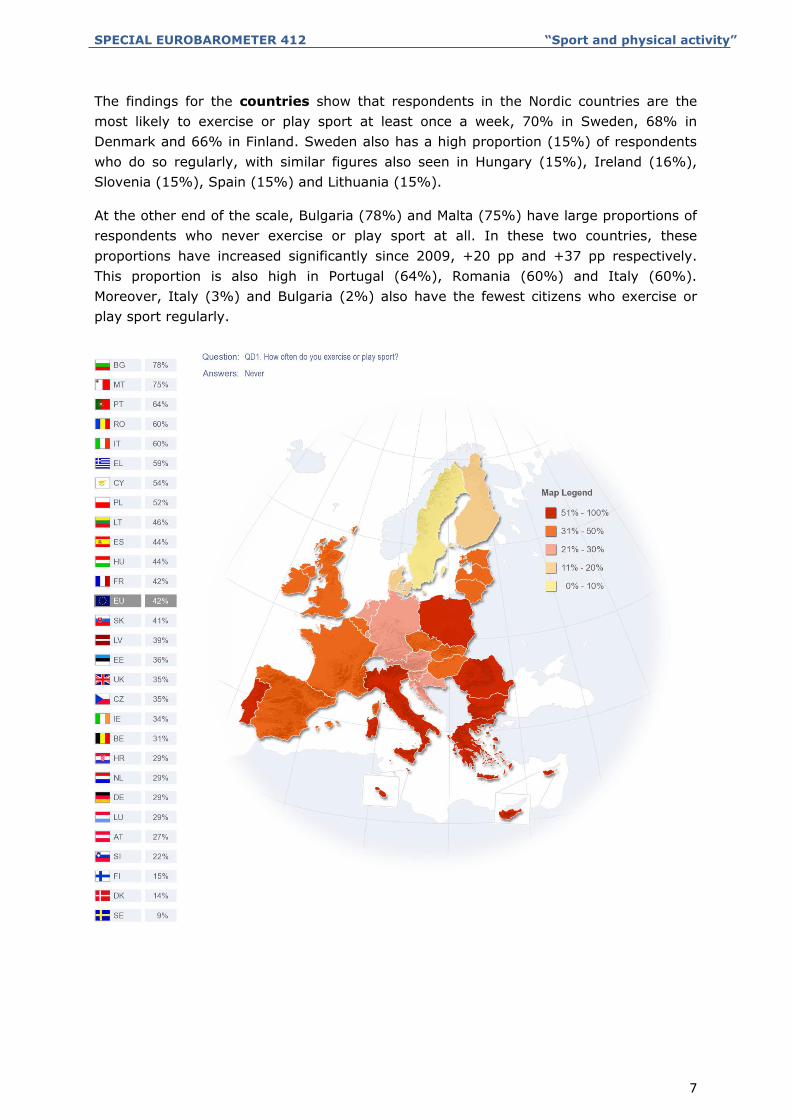
The findings for the countries show that respondents in the Nordic countries are the
most likely to exercise or play sport at least once a week, 70% in Sweden, 68% in
Denmark and 66% in Finland. Sweden also has a high proportion (15%) of respondents
who do so regularly, with similar figures also seen in Hungary (15%), Ireland (16%),
Slovenia (15%), Spain (15%) and Lithuania (15%).
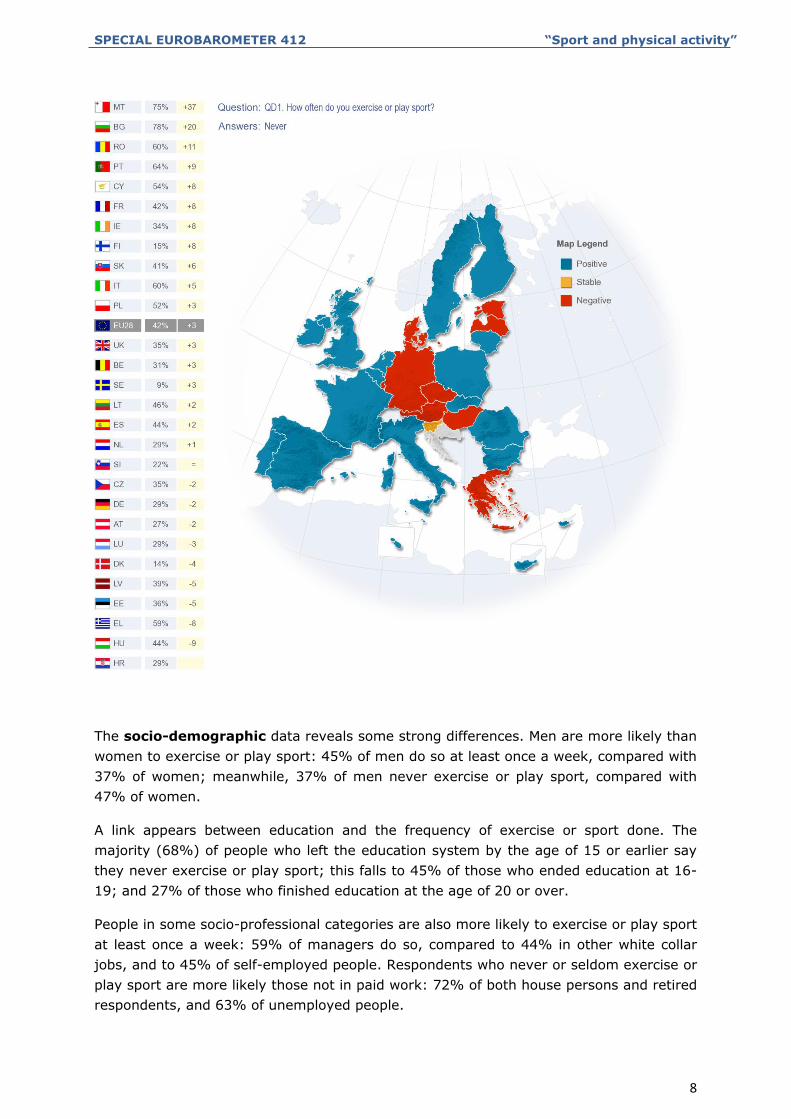
At the other end of the scale, Bulgaria (78%) and Malta (75%) have large proportions of
respondents who never exercise or play sport at all. In these two countries, these
proportions have increased significantly since 2009, +20 pp and +37 pp respectively.
This proportion is also high in Portugal (64%), Romania (60%) and Italy (60%).
Moreover, Italy (3%) and Bulgaria (2%) also have the fewest citizens who exercise or
play sport regularly.
SPECIAL EUROBAROMETER 412 “Sport and physical activity”
8
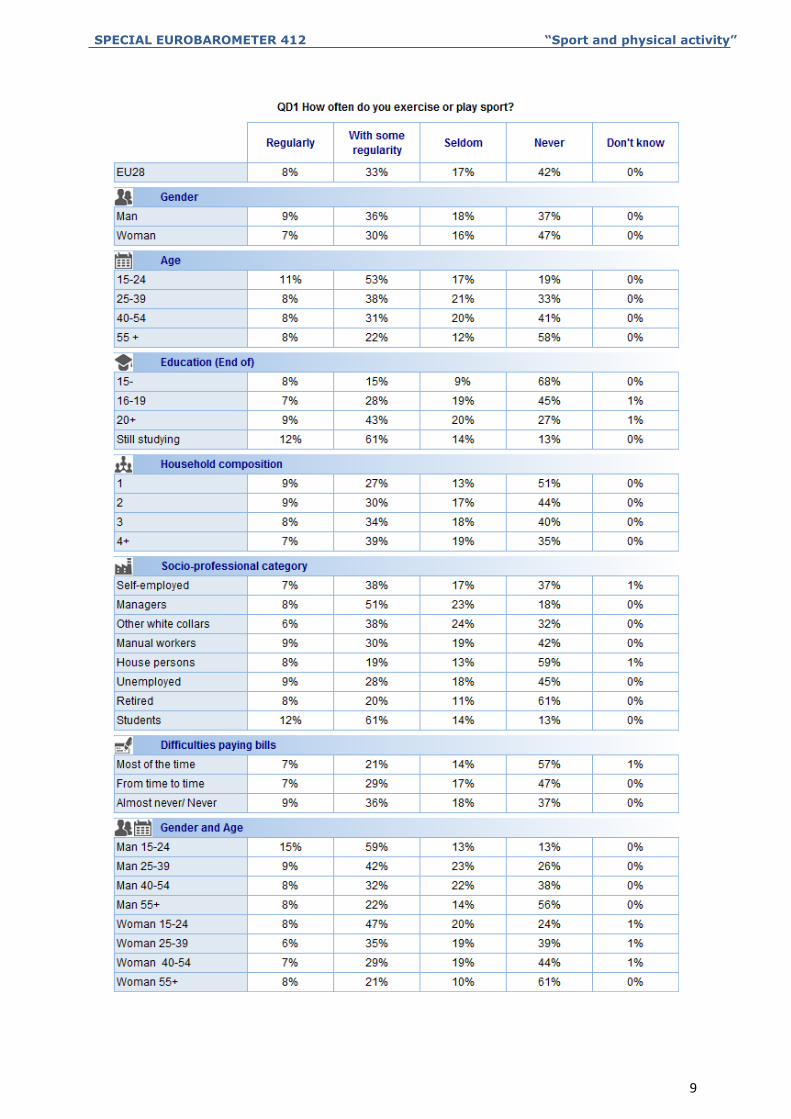
The socio-demographic data reveals some strong differences. Men are more likely than
women to exercise or play sport: 45% of men do so at least once a week, compared with
37% of women; meanwhile, 37% of men never exercise or play sport, compared with
47% of women.
A link appears between education and the frequency of exercise or sport done. The
majority (68%) of people who left the education system by the age of 15 or earlier say
they never exercise or play sport; this falls to 45% of those who ended education at 16-
19; and 27% of those who finished education at the age of 20 or over.
People in some socio-professional categories are also more likely to exercise or play sport
at least once a week: 59% of managers do so, compared to 44% in other white collar
jobs, and to 45% of self-employed people. Respondents who never or seldom exercise or
play sport are more likely those not in paid work: 72% of both house persons and retired
respondents, and 63% of unemployed people.
SPECIAL EUROBAROMETER 412 “Sport and physical activity”
9
SPECIAL EUROBAROMETER 412 “Sport and physical activity”
10
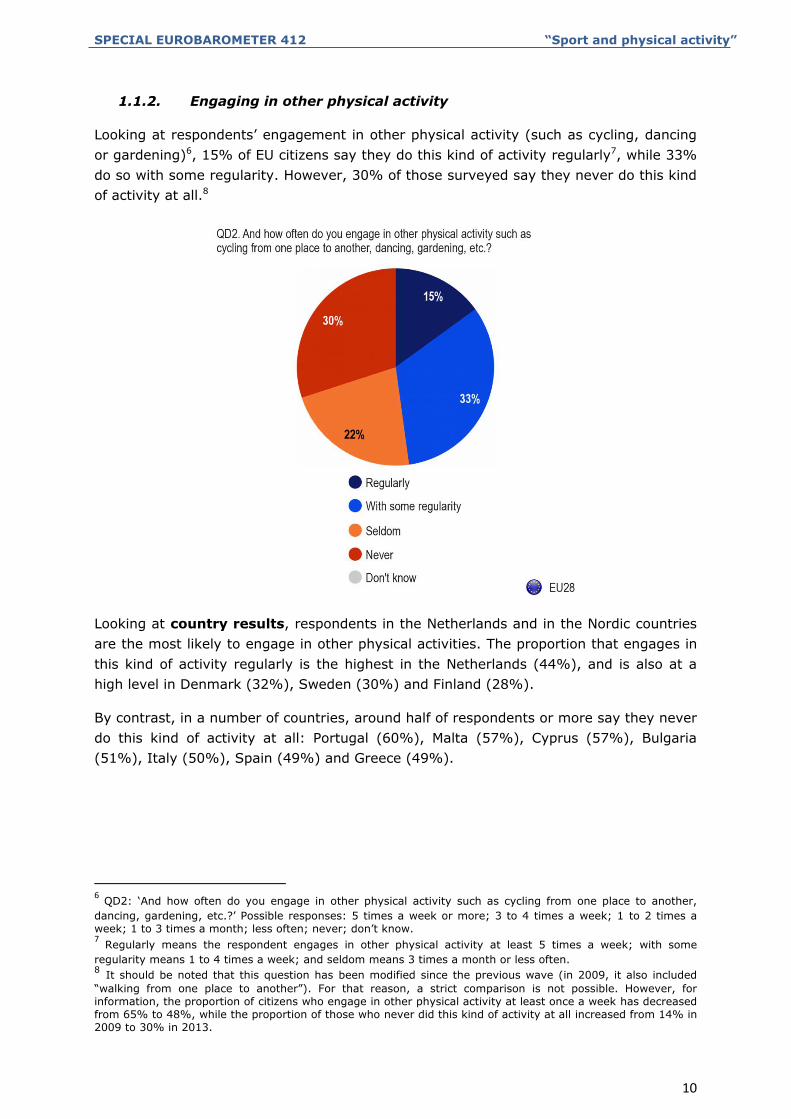
1.1.2. Engaging in other physical activity
Looking at respondents’ engagement in other physical activity (such as cycling, dancing
or gardening)6, 15% of EU citizens say they do this kind of activity regularly7, while 33%
do so with some regularity. However, 30% of those surveyed say they never do this kind
of activity at all.8
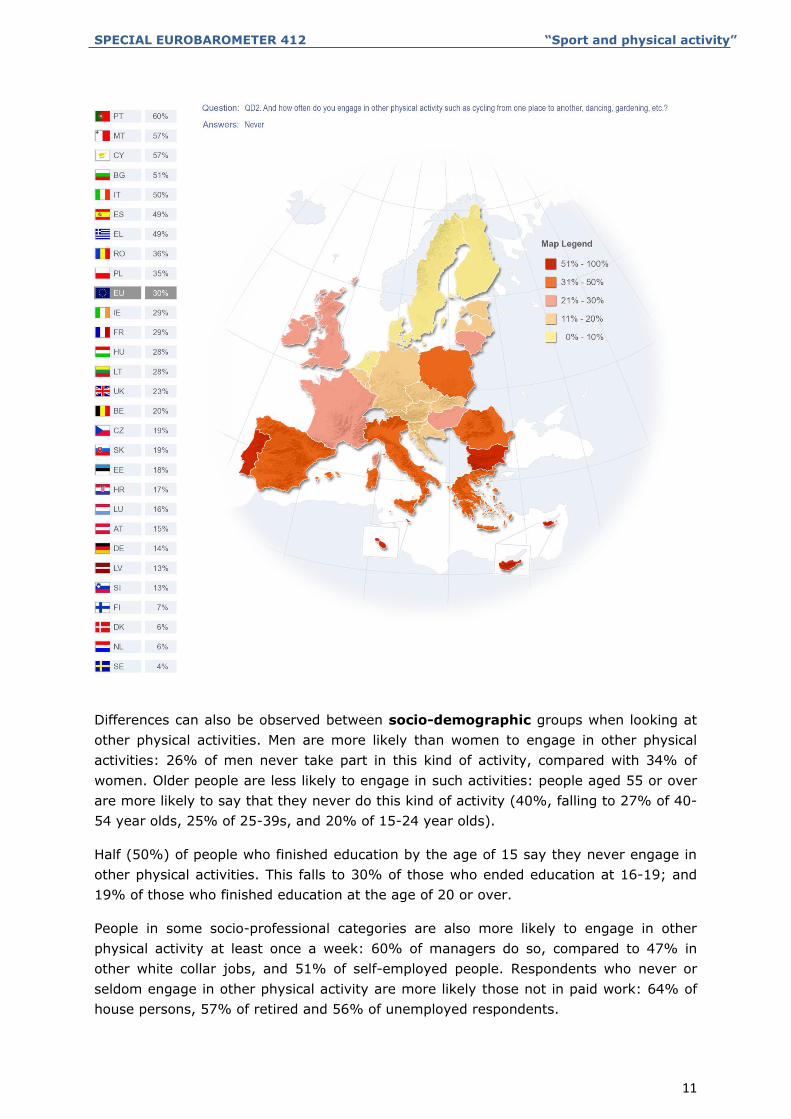
Looking at country results, respondents in the Netherlands and in the Nordic countries
are the most likely to engage in other physical activities. The proportion that engages in
this kind of activity regularly is the highest in the Netherlands (44%), and is also at a
high level in Denmark (32%), Sweden (30%) and Finland (28%).
By contrast, in a number of countries, around half of respondents or more say they never
do this kind of activity at all: Portugal (60%), Malta (57%), Cyprus (57%), Bulgaria
(51%), Italy (50%), Spain (49%) and Greece (49%).
6 QD2: ‘And how often do you engage in other physical activity such as cycling from one place to another,
dancing, gardening, etc.?’ Possible responses: 5 times a week or more; 3 to 4 times a week; 1 to 2 times a
week; 1 to 3 times a month; less often; never; don’t know. 7 Regularly means the respondent engages in other physical activity at least 5 times a week; with some
regularity means 1 to 4 times a week; and seldom means 3 times a month or less often. 8 It should be noted that this question has been modified since the previous wave (in 2009, it also included
“walking from one place to another”). For that reason, a strict comparison is not possible. However, for
information, the proportion of citizens who engage in other physical activity at least once a week has decreased
from 65% to 48%, while the proportion of those who never did this kind of activity at all increased from 14% in
2009 to 30% in 2013.
SPECIAL EUROBAROMETER 412 “Sport and physical activity”
11
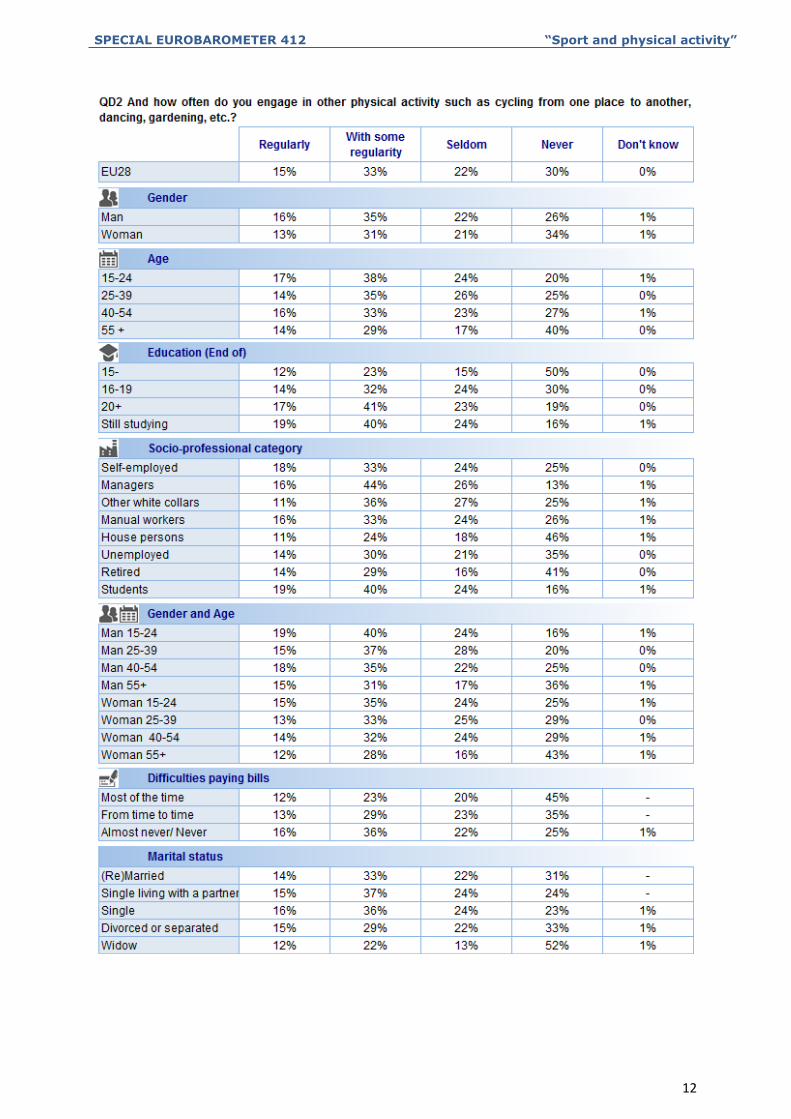
Differences can also be observed between socio-demographic groups when looking at
other physical activities. Men are more likely than women to engage in other physical
activities: 26% of men never take part in this kind of activity, compared with 34% of
women. Older people are less likely to engage in such activities: people aged 55 or over
are more likely to say that they never do this kind of activity (40%, falling to 27% of 40-
54 year olds, 25% of 25-39s, and 20% of 15-24 year olds).
Half (50%) of people who finished education by the age of 15 say they never engage in
other physical activities. This falls to 30% of those who ended education at 16-19; and
19% of those who finished education at the age of 20 or over.
People in some socio-professional categories are also more likely to engage in other
physical activity at least once a week: 60% of managers do so, compared to 47% in
other white collar jobs, and 51% of self-employed people. Respondents who never or
seldom engage in other physical activity are more likely those not in paid work: 64% of
house persons, 57% of retired and 56% of unemployed respondents.
SPECIAL EUROBAROMETER 412 “Sport and physical activity”
12
SPECIAL EUROBAROMETER 412 “Sport and physical activity”
13
1.2. Levels of engagement
This second section examines in detail the amount of time respondents spend doing
vigorous and moderate physical activity as well as walking and sitting.
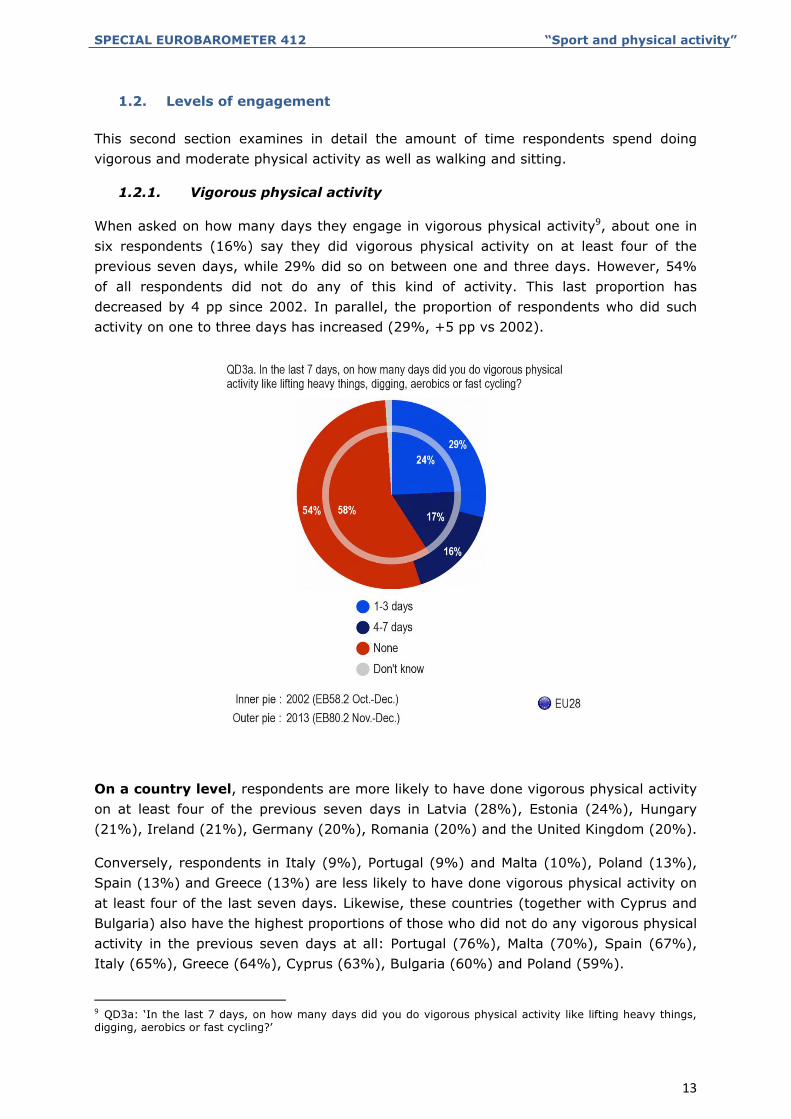
1.2.1. Vigorous physical activity
When asked on how many days they engage in vigorous physical activity9, about one in
six respondents (16%) say they did vigorous physical activity on at least four of the
previous seven days, while 29% did so on between one and three days. However, 54%
of all respondents did not do any of this kind of activity. This last proportion has
decreased by 4 pp since 2002. In parallel, the proportion of respondents who did such
activity on one to three days has increased (29%, +5 pp vs 2002).
On a country level, respondents are more likely to have done vigorous physical activity
on at least four of the previous seven days in Latvia (28%), Estonia (24%), Hungary
(21%), Ireland (21%), Germany (20%), Romania (20%) and the United Kingdom (20%).
Conversely, respondents in Italy (9%), Portugal (9%) and Malta (10%), Poland (13%),
Spain (13%) and Greece (13%) are less likely to have done vigorous physical activity on
at least four of the last seven days. Likewise, these countries (together with Cyprus and
Bulgaria) also have the highest proportions of those who did not do any vigorous physical
activity in the previous seven days at all: Portugal (76%), Malta (70%), Spain (67%),
Italy (65%), Greece (64%), Cyprus (63%), Bulgaria (60%) and Poland (59%).
9 QD3a: ‘In the last 7 days, on how many days did you do vigorous physical activity like lifting heavy things,
digging, aerobics or fast cycling?’
SPECIAL EUROBAROMETER 412 “Sport and physical activity”
14
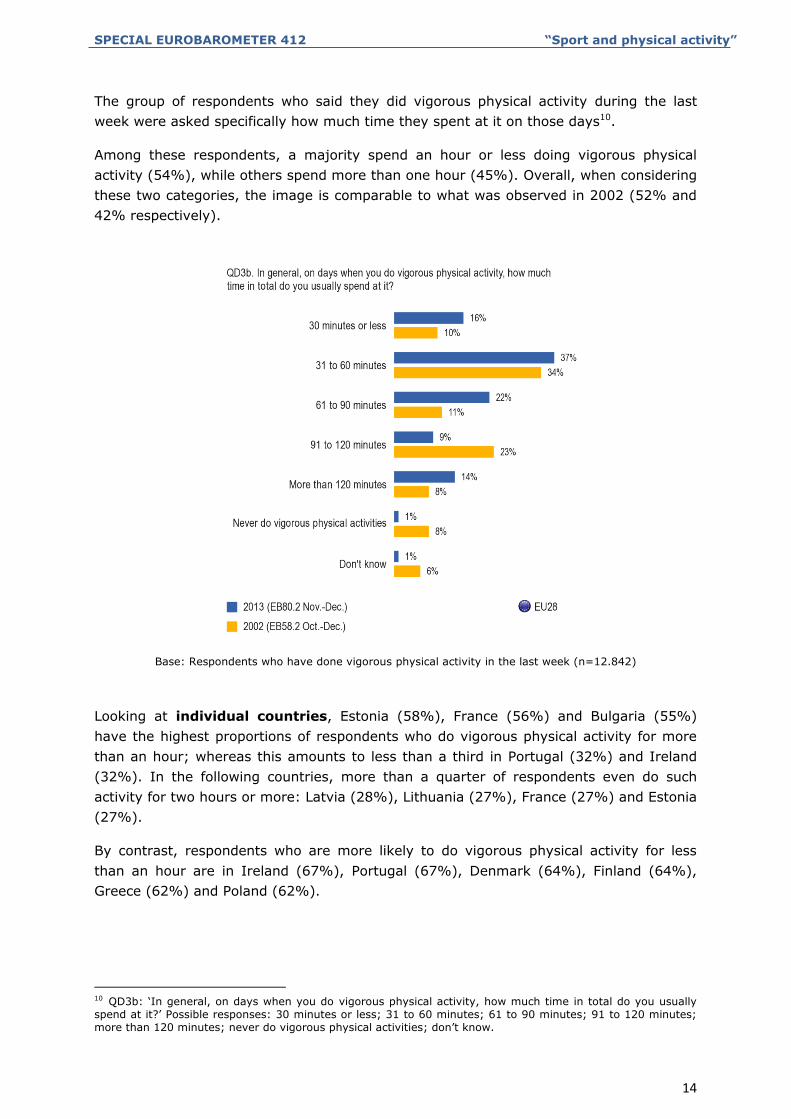
The group of respondents who said they did vigorous physical activity during the last
week were asked specifically how much time they spent at it on those days10.
Among these respondents, a majority spend an hour or less doing vigorous physical
activity (54%), while others spend more than one hour (45%). Overall, when considering
these two categories, the image is comparable to what was observed in 2002 (52% and
42% respectively).
Base: Respondents who have done vigorous physical activity in the last week (n=12.842)
Looking at individual countries, Estonia (58%), France (56%) and Bulgaria (55%)
have the highest proportions of respondents who do vigorous physical activity for more
than an hour; whereas this amounts to less than a third in Portugal (32%) and Ireland
(32%). In the following countries, more than a quarter of respondents even do such
activity for two hours or more: Latvia (28%), Lithuania (27%), France (27%) and Estonia
(27%).
By contrast, respondents who are more likely to do vigorous physical activity for less
than an hour are in Ireland (67%), Portugal (67%), Denmark (64%), Finland (64%),
Greece (62%) and Poland (62%).
10 QD3b: ‘In general, on days when you do vigorous physical activity, how much time in total do you usually
spend at it?’ Possible responses: 30 minutes or less; 31 to 60 minutes; 61 to 90 minutes; 91 to 120 minutes;
more than 120 minutes; never do vigorous physical activities; don’t know.
SPECIAL EUROBAROMETER 412 “Sport and physical activity”
15
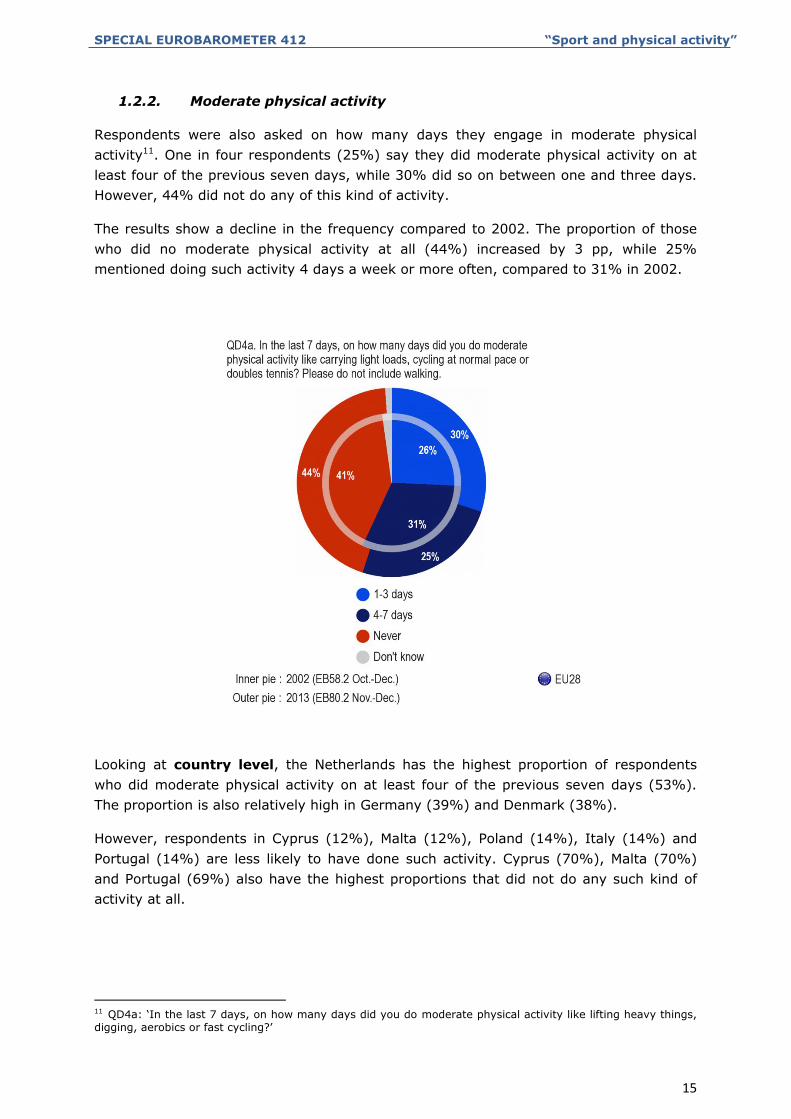
1.2.2. Moderate physical activity
Respondents were also asked on how many days they engage in moderate physical
activity11. One in four respondents (25%) say they did moderate physical activity on at
least four of the previous seven days, while 30% did so on between one and three days.
However, 44% did not do any of this kind of activity.
The results show a decline in the frequency compared to 2002. The proportion of those
who did no moderate physical activity at all (44%) increased by 3 pp, while 25%
mentioned doing such activity 4 days a week or more often, compared to 31% in 2002.
Looking at country level, the Netherlands has the highest proportion of respondents
who did moderate physical activity on at least four of the previous seven days (53%).
The proportion is also relatively high in Germany (39%) and Denmark (38%).
However, respondents in Cyprus (12%), Malta (12%), Poland (14%), Italy (14%) and
Portugal (14%) are less likely to have done such activity. Cyprus (70%), Malta (70%)
and Portugal (69%) also have the highest proportions that did not do any such kind of
activity at all.
11 QD4a: ‘In the last 7 days, on how many days did you do moderate physical activity like lifting heavy things,
digging, aerobics or fast cycling?’
SPECIAL EUROBAROMETER 412 “Sport and physical activity”
16
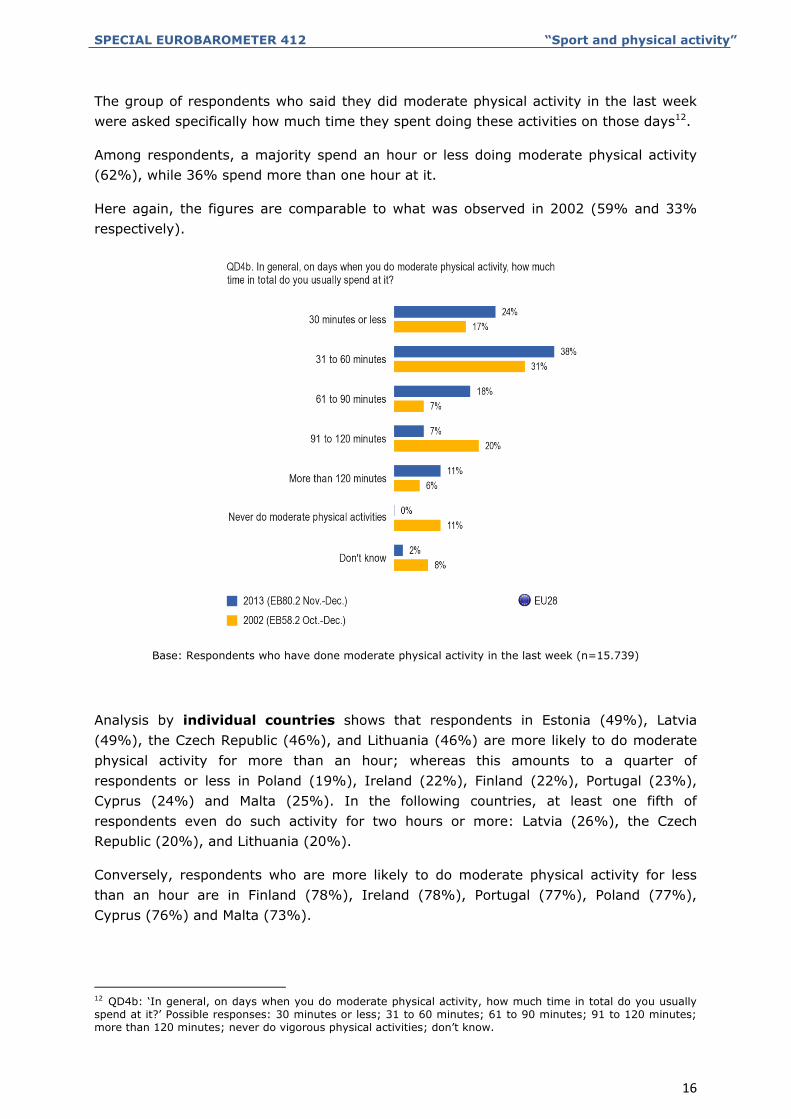
The group of respondents who said they did moderate physical activity in the last week
were asked specifically how much time they spent doing these activities on those days12.
Among respondents, a majority spend an hour or less doing moderate physical activity
(62%), while 36% spend more than one hour at it.
Here again, the figures are comparable to what was observed in 2002 (59% and 33%
respectively).
Base: Respondents who have done moderate physical activity in the last week (n=15.739)
Analysis by individual countries shows that respondents in Estonia (49%), Latvia
(49%), the Czech Republic (46%), and Lithuania (46%) are more likely to do moderate
physical activity for more than an hour; whereas this amounts to a quarter of
respondents or less in Poland (19%), Ireland (22%), Finland (22%), Portugal (23%),
Cyprus (24%) and Malta (25%). In the following countries, at least one fifth of
respondents even do such activity for two hours or more: Latvia (26%), the Czech
Republic (20%), and Lithuania (20%).
Conversely, respondents who are more likely to do moderate physical activity for less
than an hour are in Finland (78%), Ireland (78%), Portugal (77%), Poland (77%),
Cyprus (76%) and Malta (73%).
12 QD4b: ‘In general, on days when you do moderate physical activity, how much time in total do you usually
spend at it?’ Possible responses: 30 minutes or less; 31 to 60 minutes; 61 to 90 minutes; 91 to 120 minutes;
more than 120 minutes; never do vigorous physical activities; don’t know.
SPECIAL EUROBAROMETER 412 “Sport and physical activity”
17
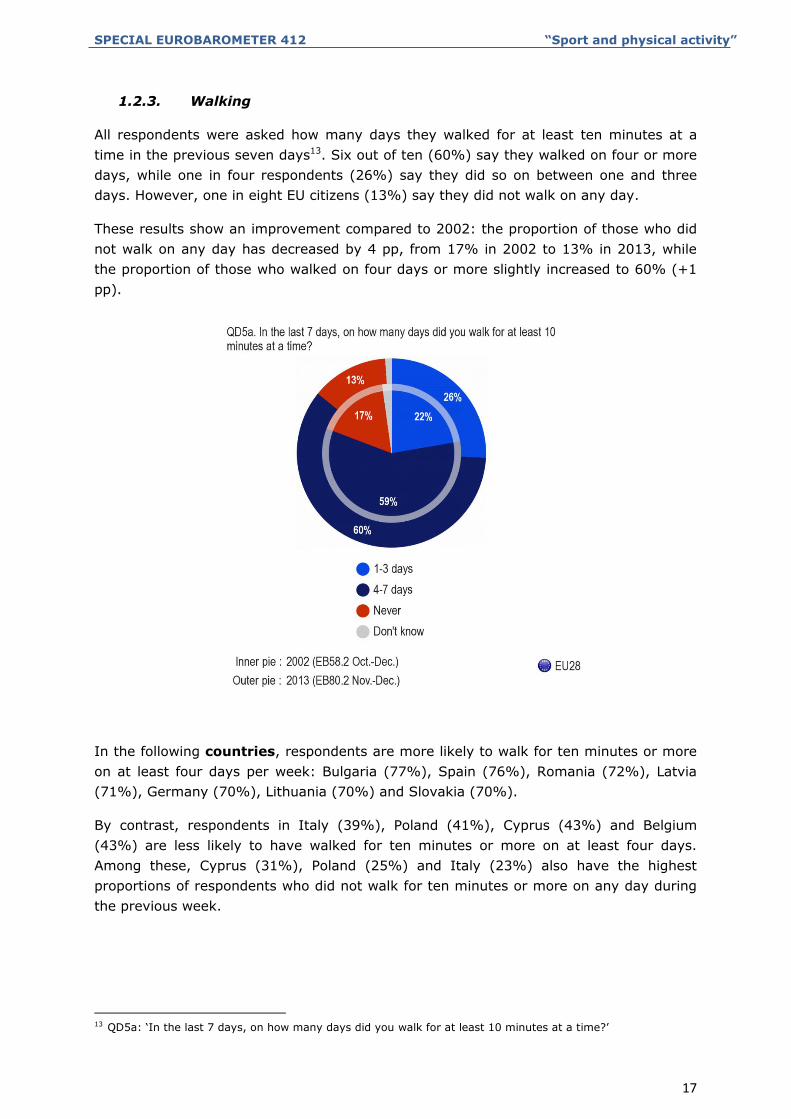
1.2.3. Walking
All respondents were asked how many days they walked for at least ten minutes at a
time in the previous seven days13. Six out of ten (60%) say they walked on four or more
days, while one in four respondents (26%) say they did so on between one and three
days. However, one in eight EU citizens (13%) say they did not walk on any day.
These results show an improvement compared to 2002: the proportion of those who did
not walk on any day has decreased by 4 pp, from 17% in 2002 to 13% in 2013, while
the proportion of those who walked on four days or more slightly increased to 60% (+1
pp).
In the following countries, respondents are more likely to walk for ten minutes or more
on at least four days per week: Bulgaria (77%), Spain (76%), Romania (72%), Latvia
(71%), Germany (70%), Lithuania (70%) and Slovakia (70%).
By contrast, respondents in Italy (39%), Poland (41%), Cyprus (43%) and Belgium
(43%) are less likely to have walked for ten minutes or more on at least four days.
Among these, Cyprus (31%), Poland (25%) and Italy (23%) also have the highest
proportions of respondents who did not walk for ten minutes or more on any day during
the previous week.
13 QD5a: ‘In the last 7 days, on how many days did you walk for at least 10 minutes at a time?’
SPECIAL EUROBAROMETER 412 “Sport and physical activity”
18
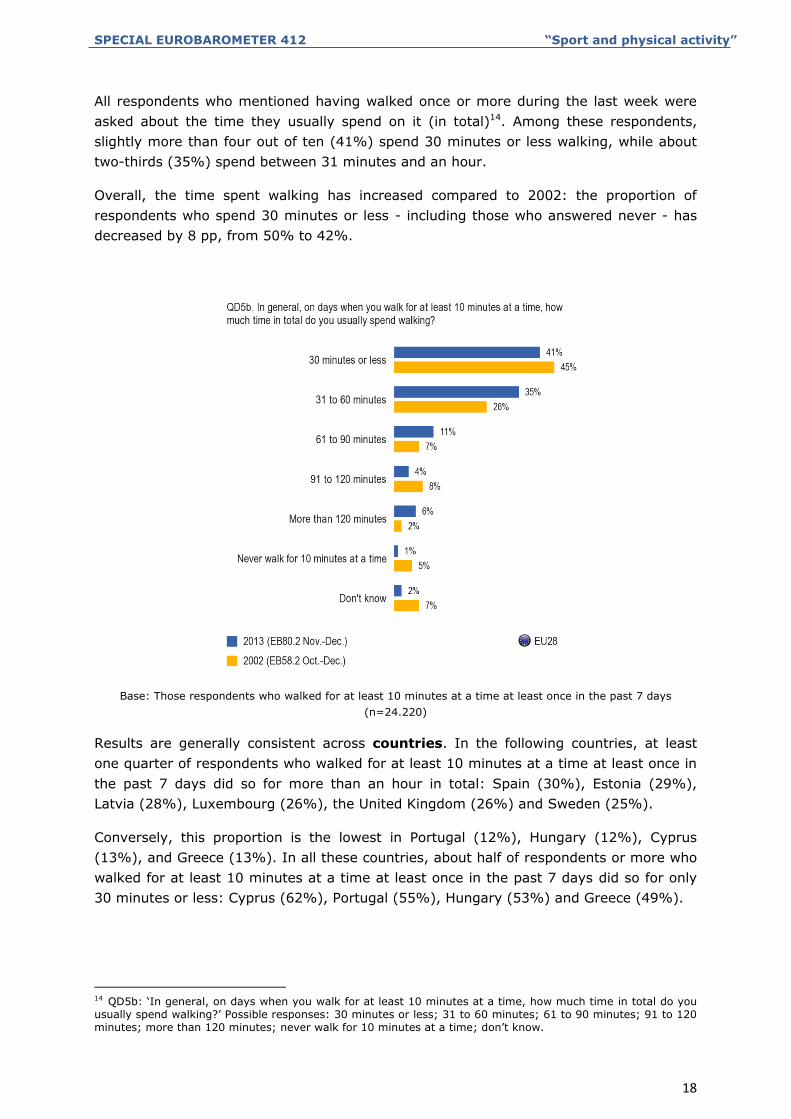
All respondents who mentioned having walked once or more during the last week were
asked about the time they usually spend on it (in total)14. Among these respondents,
slightly more than four out of ten (41%) spend 30 minutes or less walking, while about
two-thirds (35%) spend between 31 minutes and an hour.
Overall, the time spent walking has increased compared to 2002: the proportion of
respondents who spend 30 minutes or less - including those who answered never - has
decreased by 8 pp, from 50% to 42%.
Base: Those respondents who walked for at least 10 minutes at a time at least once in the past 7 days
(n=24.220)
Results are generally consistent across countries. In the following countries, at least
one quarter of respondents who walked for at least 10 minutes at a time at least once in
the past 7 days did so for more than an hour in total: Spain (30%), Estonia (29%),
Latvia (28%), Luxembourg (26%), the United Kingdom (26%) and Sweden (25%).
Conversely, this proportion is the lowest in Portugal (12%), Hungary (12%), Cyprus
(13%), and Greece (13%). In all these countries, about half of respondents or more who
walked for at least 10 minutes at a time at least once in the past 7 days did so for only
30 minutes or less: Cyprus (62%), Portugal (55%), Hungary (53%) and Greece (49%).
14 QD5b: ‘In general, on days when you walk for at least 10 minutes at a time, how much time in total do you
usually spend walking?’ Possible responses: 30 minutes or less; 31 to 60 minutes; 61 to 90 minutes; 91 to 120
minutes; more than 120 minutes; never walk for 10 minutes at a time; don’t know.
SPECIAL EUROBAROMETER 412 “Sport and physical activity”
19
1.2.4. Sitting
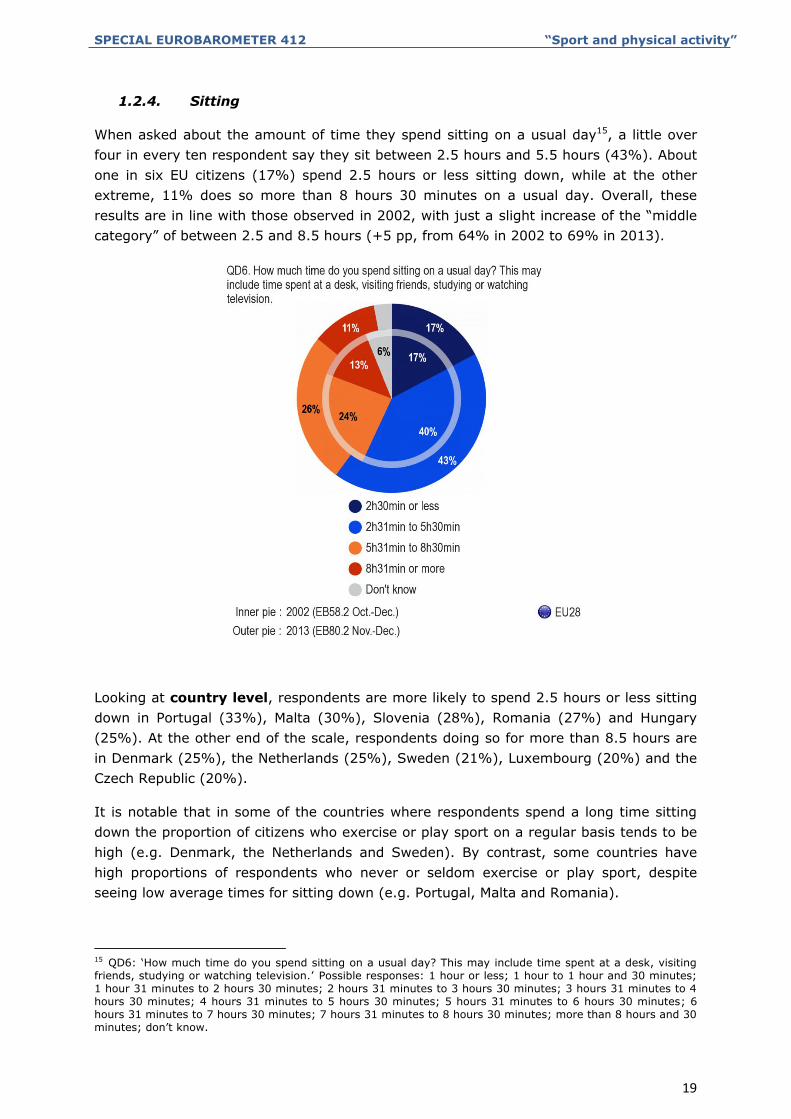
When asked about the amount of time they spend sitting on a usual day15, a little over
four in every ten respondent say they sit between 2.5 hours and 5.5 hours (43%). About
one in six EU citizens (17%) spend 2.5 hours or less sitting down, while at the other
extreme, 11% does so more than 8 hours 30 minutes on a usual day. Overall, these
results are in line with those observed in 2002, with just a slight increase of the “middle
category” of between 2.5 and 8.5 hours (+5 pp, from 64% in 2002 to 69% in 2013).
Looking at country level, respondents are more likely to spend 2.5 hours or less sitting
down in Portugal (33%), Malta (30%), Slovenia (28%), Romania (27%) and Hungary
(25%). At the other end of the scale, respondents doing so for more than 8.5 hours are
in Denmark (25%), the Netherlands (25%), Sweden (21%), Luxembourg (20%) and the
Czech Republic (20%).
It is notable that in some of the countries where respondents spend a long time sitting
down the proportion of citizens who exercise or play sport on a regular basis tends to be
high (e.g. Denmark, the Netherlands and Sweden). By contrast, some countries have
high proportions of respondents who never or seldom exercise or play sport, despite
seeing low average times for sitting down (e.g. Portugal, Malta and Romania).
15 QD6: ‘How much time do you spend sitting on a usual day? This may include time spent at a desk, visiting
friends, studying or watching television.’ Possible responses: 1 hour or less; 1 hour to 1 hour and 30 minutes;
1 hour 31 minutes to 2 hours 30 minutes; 2 hours 31 minutes to 3 hours 30 minutes; 3 hours 31 minutes to 4
hours 30 minutes; 4 hours 31 minutes to 5 hours 30 minutes; 5 hours 31 minutes to 6 hours 30 minutes; 6
hours 31 minutes to 7 hours 30 minutes; 7 hours 31 minutes to 8 hours 30 minutes; more than 8 hours and 30
minutes; don’t know.
SPECIAL EUROBAROMETER 412 “Sport and physical activity”
20
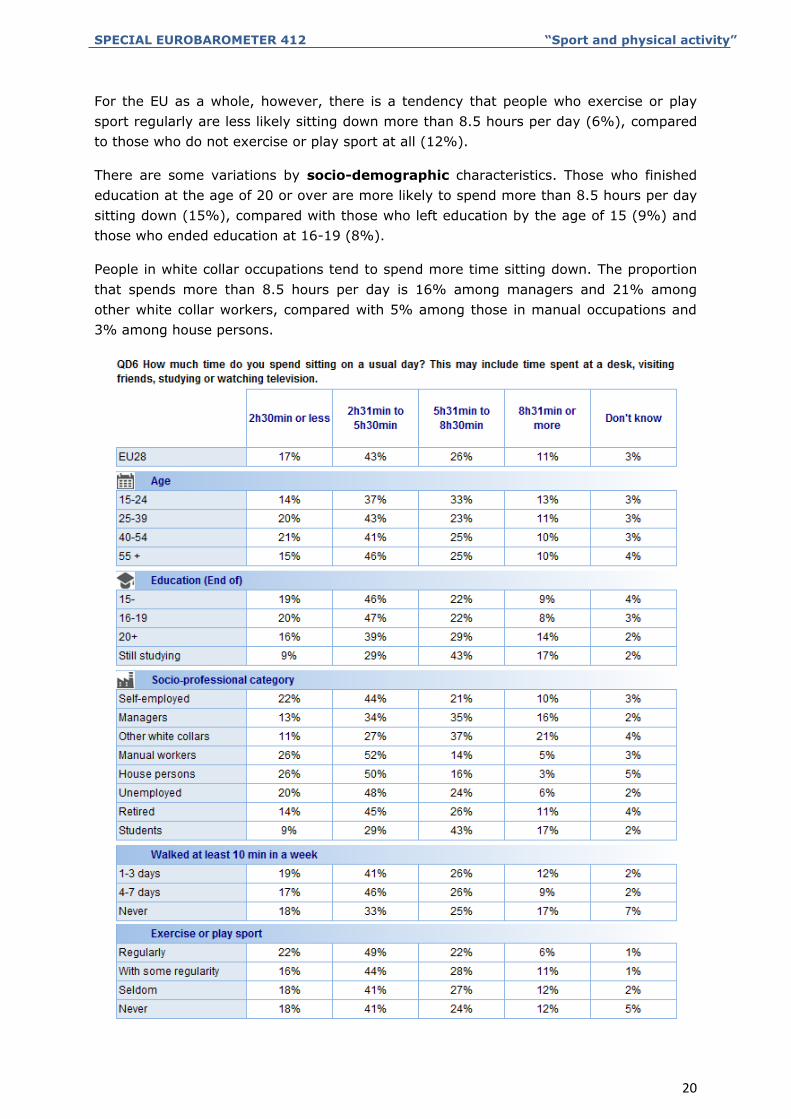
For the EU as a whole, however, there is a tendency that people who exercise or play
sport regularly are less likely sitting down more than 8.5 hours per day (6%), compared
to those who do not exercise or play sport at all (12%).
There are some variations by socio-demographic characteristics. Those who finished
education at the age of 20 or over are more likely to spend more than 8.5 hours per day
sitting down (15%), compared with those who left education by the age of 15 (9%) and
those who ended education at 16-19 (8%).
People in white collar occupations tend to spend more time sitting down. The proportion
that spends more than 8.5 hours per day is 16% among managers and 21% among
other white collar workers, compared with 5% among those in manual occupations and
3% among house persons.
SPECIAL EUROBAROMETER 412 “Sport and physical activity”
21
2. WHERE CITIZENS ENGAGE IN SPORT AND OTHER PHYSICAL ACTIVITY
This chapter focuses on where EU citizens engage in sport and other physical activity;
and it also examines club membership.
2.1. Different settings
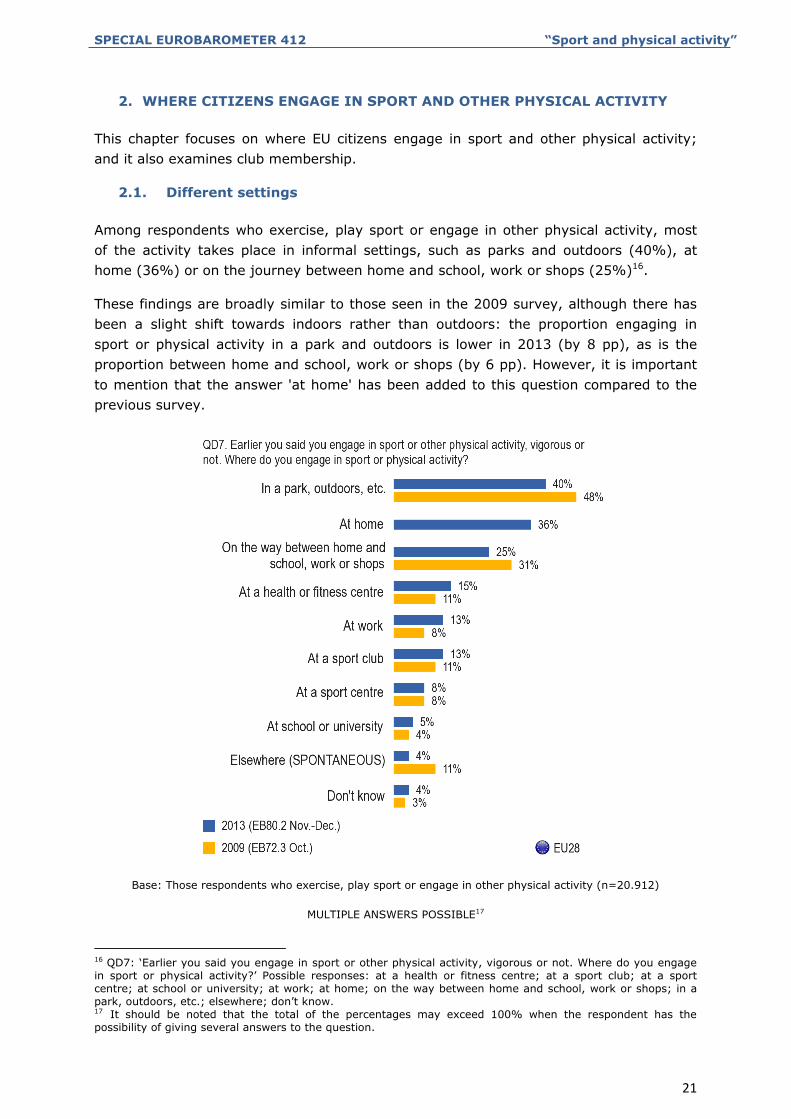
Among respondents who exercise, play sport or engage in other physical activity, most
of the activity takes place in informal settings, such as parks and outdoors (40%), at
home (36%) or on the journey between home and school, work or shops (25%)16.
These findings are broadly similar to those seen in the 2009 survey, although there has
been a slight shift towards indoors rather than outdoors: the proportion engaging in
sport or physical activity in a park and outdoors is lower in 2013 (by 8 pp), as is the
proportion between home and school, work or shops (by 6 pp). However, it is important
to mention that the answer 'at home' has been added to this question compared to the
previous survey.
Base: Those respondents who exercise, play sport or engage in other physical activity (n=20.912)
MULTIPLE ANSWERS POSSIBLE17
16 QD7: ‘Earlier you said you engage in sport or other physical activity, vigorous or not. Where do you engage
in sport or physical activity?’ Possible responses: at a health or fitness centre; at a sport club; at a sport
centre; at school or university; at work; at home; on the way between home and school, work or shops; in a
park, outdoors, etc.; elsewhere; don’t know. 17 It should be noted that the total of the percentages may exceed 100% when the respondent has the
possibility of giving several answers to the question.
SPECIAL EUROBAROMETER 412 “Sport and physical activity”
22
2.2. Club membership
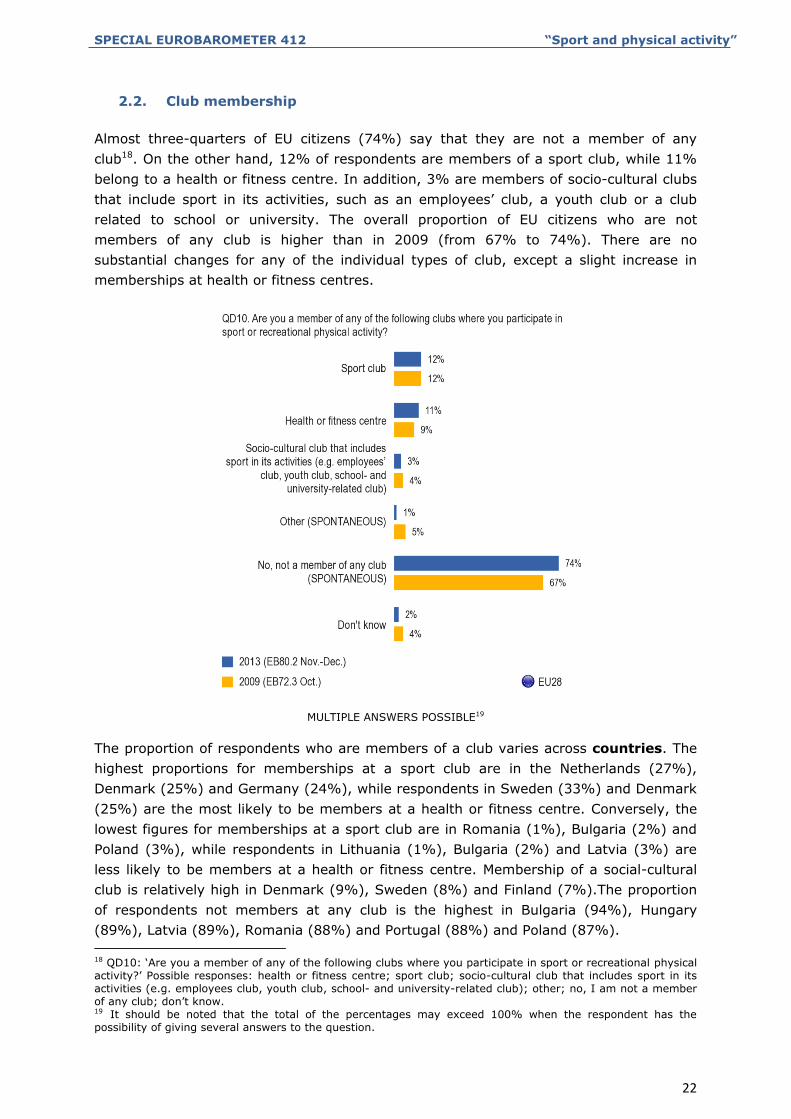
Almost three-quarters of EU citizens (74%) say that they are not a member of any
club18. On the other hand, 12% of respondents are members of a sport club, while 11%
belong to a health or fitness centre. In addition, 3% are members of socio-cultural clubs
that include sport in its activities, such as an employees’ club, a youth club or a club
related to school or university. The overall proportion of EU citizens who are not
members of any club is higher than in 2009 (from 67% to 74%). There are no
substantial changes for any of the individual types of club, except a slight increase in
memberships at health or fitness centres.
MULTIPLE ANSWERS POSSIBLE19
The proportion of respondents who are members of a club varies across countries. The
highest proportions for memberships at a sport club are in the Netherlands (27%),
Denmark (25%) and Germany (24%), while respondents in Sweden (33%) and Denmark
(25%) are the most likely to be members at a health or fitness centre. Conversely, the
lowest figures for memberships at a sport club are in Romania (1%), Bulgaria (2%) and
Poland (3%), while respondents in Lithuania (1%), Bulgaria (2%) and Latvia (3%) are
less likely to be members at a health or fitness centre. Membership of a social-cultural
club is relatively high in Denmark (9%), Sweden (8%) and Finland (7%).The proportion
of respondents not members at any club is the highest in Bulgaria (94%), Hungary
(89%), Latvia (89%), Romania (88%) and Portugal (88%) and Poland (87%).
18 QD10: ‘Are you a member of any of the following clubs where you participate in sport or recreational physical
activity?’ Possible responses: health or fitness centre; sport club; socio-cultural club that includes sport in its
activities (e.g. employees club, youth club, school- and university-related club); other; no, I am not a member
of any club; don’t know. 19 It should be noted that the total of the percentages may exceed 100% when the respondent has the
possibility of giving several answers to the question.
SPECIAL EUROBAROMETER 412 “Sport and physical activity”
23
3. UNDERSTANDING MOTIVATORS AND BARRIERS TO SPORT
PARTICIPATION
This chapter looks at the reasons why people engage in sport and other physical activity,
as well as the barriers to practising sport more regularly.
3.1. Motivators
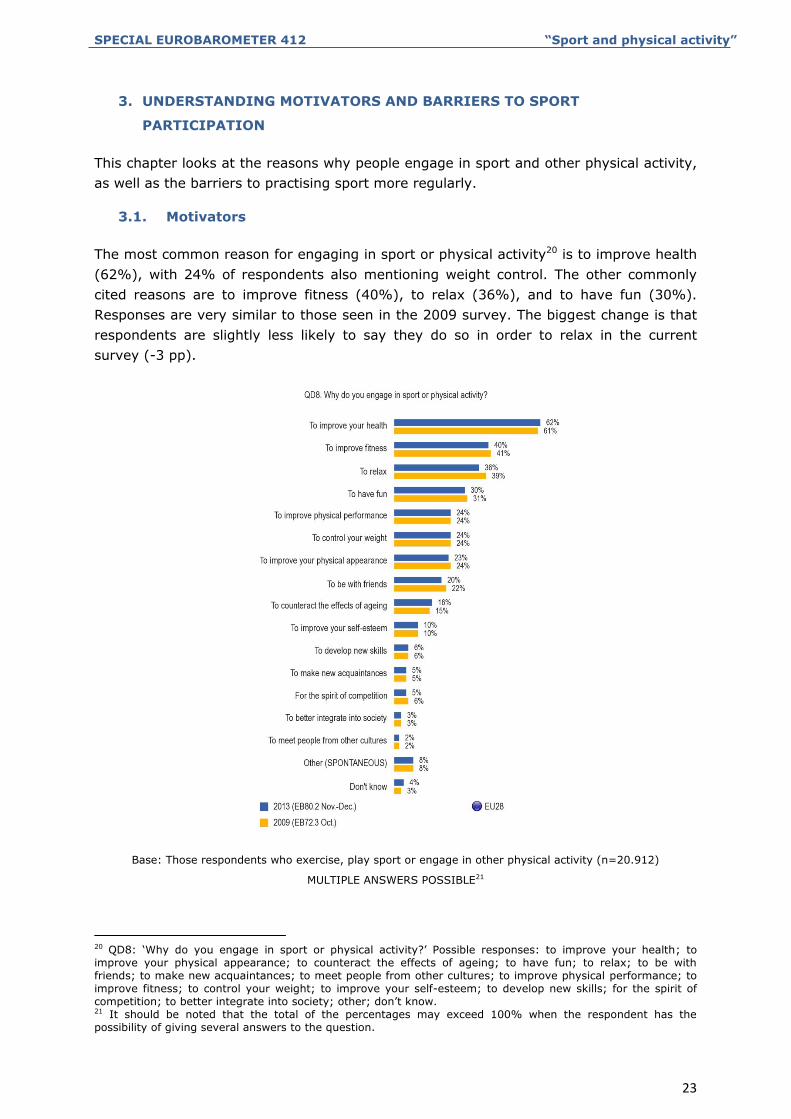
The most common reason for engaging in sport or physical activity20 is to improve health
(62%), with 24% of respondents also mentioning weight control. The other commonly
cited reasons are to improve fitness (40%), to relax (36%), and to have fun (30%).
Responses are very similar to those seen in the 2009 survey. The biggest change is that
respondents are slightly less likely to say they do so in order to relax in the current
survey (-3 pp).
Base: Those respondents who exercise, play sport or engage in other physical activity (n=20.912)
MULTIPLE ANSWERS POSSIBLE21
20 QD8: ‘Why do you engage in sport or physical activity?’ Possible responses: to improve your health; to
improve your physical appearance; to counteract the effects of ageing; to have fun; to relax; to be with
friends; to make new acquaintances; to meet people from other cultures; to improve physical performance; to
improve fitness; to control your weight; to improve your self-esteem; to develop new skills; for the spirit of
competition; to better integrate into society; other; don’t know. 21 It should be noted that the total of the percentages may exceed 100% when the respondent has the
possibility of giving several answers to the question.
SPECIAL EUROBAROMETER 412 “Sport and physical activity”
24
3.2. Barriers
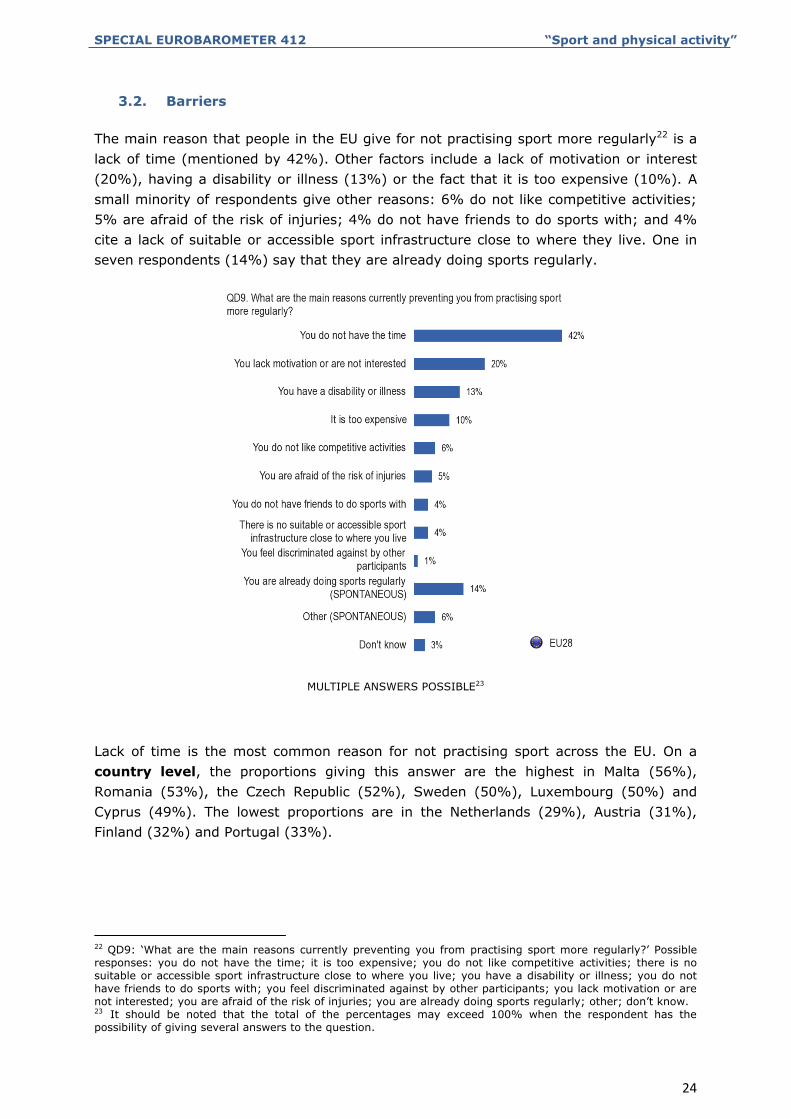
The main reason that people in the EU give for not practising sport more regularly22 is a
lack of time (mentioned by 42%). Other factors include a lack of motivation or interest
(20%), having a disability or illness (13%) or the fact that it is too expensive (10%). A
small minority of respondents give other reasons: 6% do not like competitive activities;
5% are afraid of the risk of injuries; 4% do not have friends to do sports with; and 4%
cite a lack of suitable or accessible sport infrastructure close to where they live. One in
seven respondents (14%) say that they are already doing sports regularly.
MULTIPLE ANSWERS POSSIBLE23
Lack of time is the most common reason for not practising sport across the EU. On a
country level, the proportions giving this answer are the highest in Malta (56%),
Romania (53%), the Czech Republic (52%), Sweden (50%), Luxembourg (50%) and
Cyprus (49%). The lowest proportions are in the Netherlands (29%), Austria (31%),
Finland (32%) and Portugal (33%).
22 QD9: ‘What are the main reasons currently preventing you from practising sport more regularly?’ Possible
responses: you do not have the time; it is too expensive; you do not like competitive activities; there is no
suitable or accessible sport infrastructure close to where you live; you have a disability or illness; you do not
have friends to do sports with; you feel discriminated against by other participants; you lack motivation or are
not interested; you are afraid of the risk of injuries; you are already doing sports regularly; other; don’t know. 23 It should be noted that the total of the percentages may exceed 100% when the respondent has the
possibility of giving several answers to the question.
SPECIAL EUROBAROMETER 412 “Sport and physical activity”
25
4. SUPPORT FOR SPORT PARTICIPATION IN CITIZENS’ LOCAL AREA
Respondents were invited to give their opinion on a number of statements relating to
sport and physical activity. These statements relate to how people perceive the
opportunities to be physically active in their local area, and to the performance of the
local authority in providing these opportunities.
4.1. Opportunities in the local area
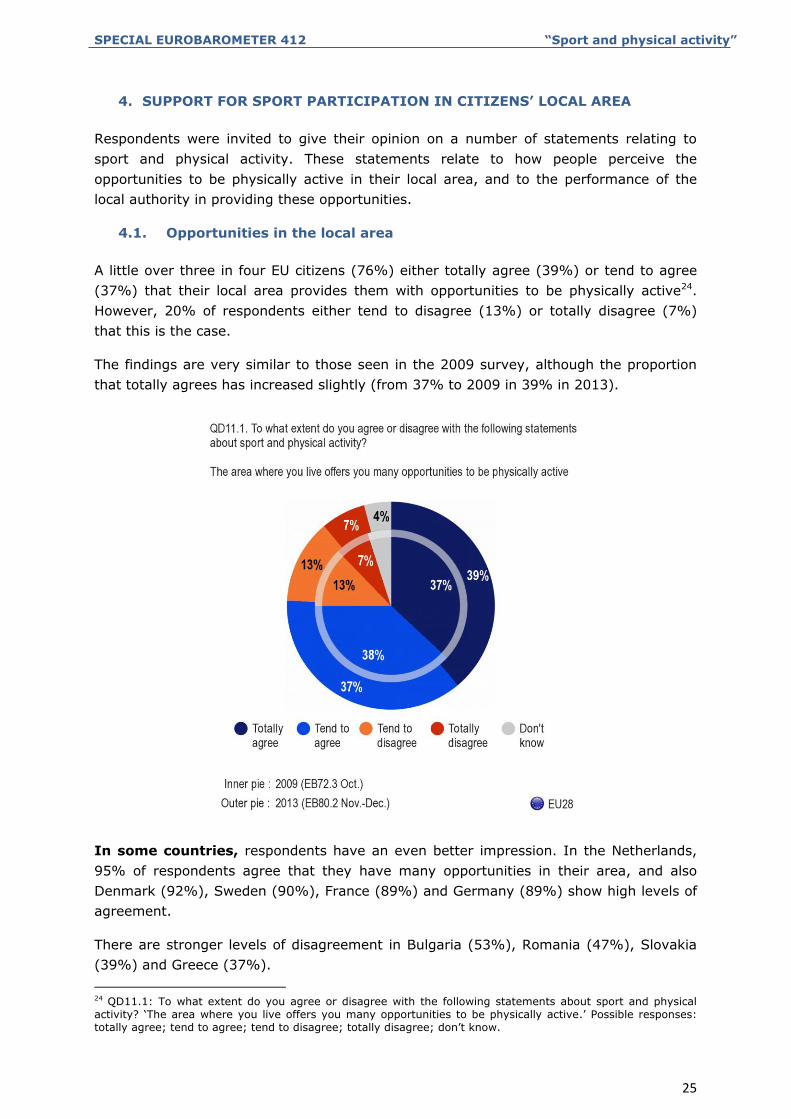
A little over three in four EU citizens (76%) either totally agree (39%) or tend to agree
(37%) that their local area provides them with opportunities to be physically active24.
However, 20% of respondents either tend to disagree (13%) or totally disagree (7%)
that this is the case.
The findings are very similar to those seen in the 2009 survey, although the proportion
that totally agrees has increased slightly (from 37% to 2009 in 39% in 2013).
In some countries, respondents have an even better impression. In the Netherlands,
95% of respondents agree that they have many opportunities in their area, and also
Denmark (92%), Sweden (90%), France (89%) and Germany (89%) show high levels of
agreement.
There are stronger levels of disagreement in Bulgaria (53%), Romania (47%), Slovakia
(39%) and Greece (37%).
24 QD11.1: To what extent do you agree or disagree with the following statements about sport and physical
activity? ‘The area where you live offers you many opportunities to be physically active.’ Possible responses:
totally agree; tend to agree; tend to disagree; totally disagree; don’t know.
SPECIAL EUROBAROMETER 412 “Sport and physical activity”
26
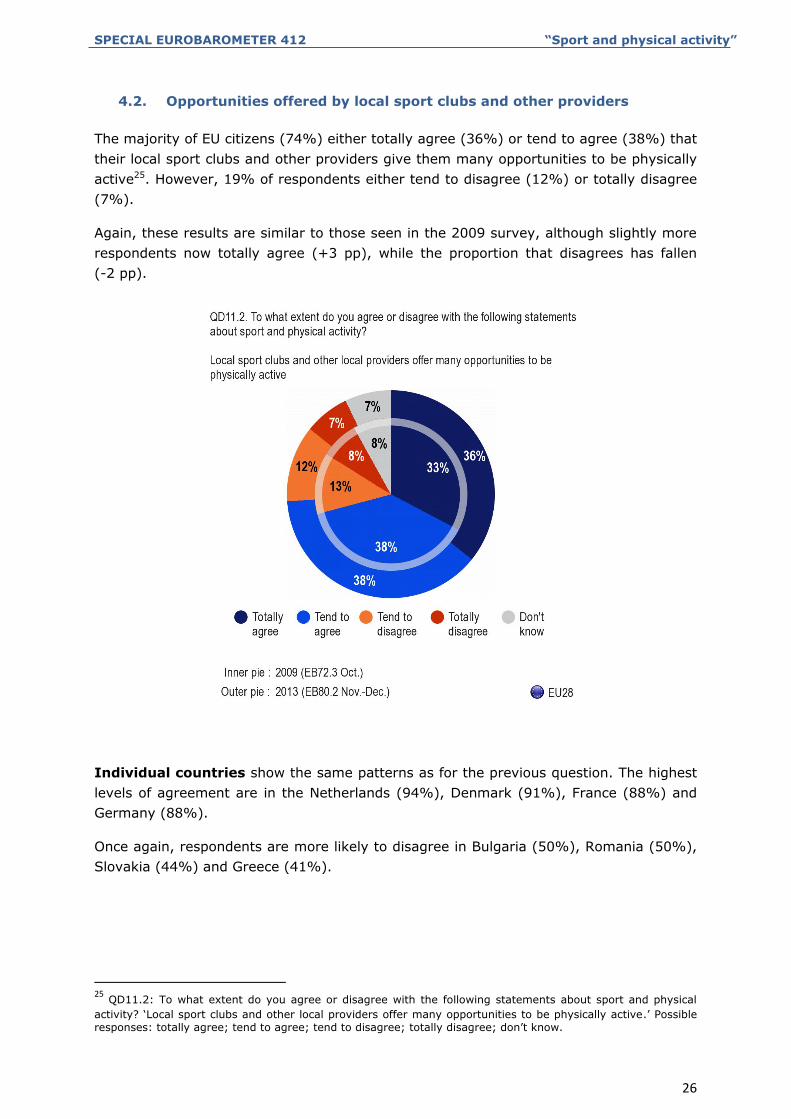
4.2. Opportunities offered by local sport clubs and other providers
The majority of EU citizens (74%) either totally agree (36%) or tend to agree (38%) that
their local sport clubs and other providers give them many opportunities to be physically
active25. However, 19% of respondents either tend to disagree (12%) or totally disagree
(7%).
Again, these results are similar to those seen in the 2009 survey, although slightly more
respondents now totally agree (+3 pp), while the proportion that disagrees has fallen
(-2 pp).
Individual countries show the same patterns as for the previous question. The highest
levels of agreement are in the Netherlands (94%), Denmark (91%), France (88%) and
Germany (88%).
Once again, respondents are more likely to disagree in Bulgaria (50%), Romania (50%),
Slovakia (44%) and Greece (41%).
25 QD11.2: To what extent do you agree or disagree with the following statements about sport and physical
activity? ‘Local sport clubs and other local providers offer many opportunities to be physically active.’ Possible
responses: totally agree; tend to agree; tend to disagree; totally disagree; don’t know.
SPECIAL EUROBAROMETER 412 “Sport and physical activity”
27
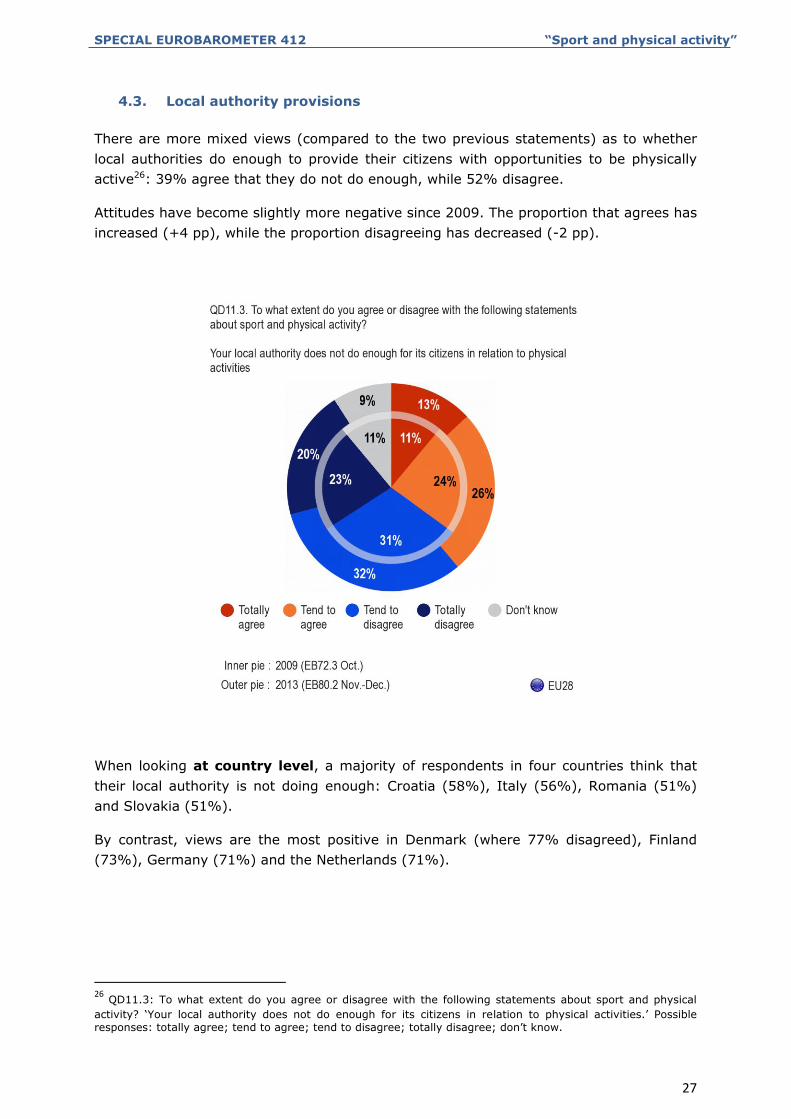
4.3. Local authority provisions
There are more mixed views (compared to the two previous statements) as to whether
local authorities do enough to provide their citizens with opportunities to be physically
active26: 39% agree that they do not do enough, while 52% disagree.
Attitudes have become slightly more negative since 2009. The proportion that agrees has
increased (+4 pp), while the proportion disagreeing has decreased (-2 pp).
When looking at country level, a majority of respondents in four countries think that
their local authority is not doing enough: Croatia (58%), Italy (56%), Romania (51%)
and Slovakia (51%).
By contrast, views are the most positive in Denmark (where 77% disagreed), Finland
(73%), Germany (71%) and the Netherlands (71%).
26 QD11.3: To what extent do you agree or disagree with the following statements about sport and physical
activity? ‘Your local authority does not do enough for its citizens in relation to physical activities.’ Possible
responses: totally agree; tend to agree; tend to disagree; totally disagree; don’t know.
SPECIAL EUROBAROMETER 412 “Sport and physical activity”
28
5. VOLUNTEERING IN SPORT
This chapter examines engagement in voluntary work that supports sporting activities. It
also provides details on the amount of time spent on volunteering in sport, and the type
of activities that people do.
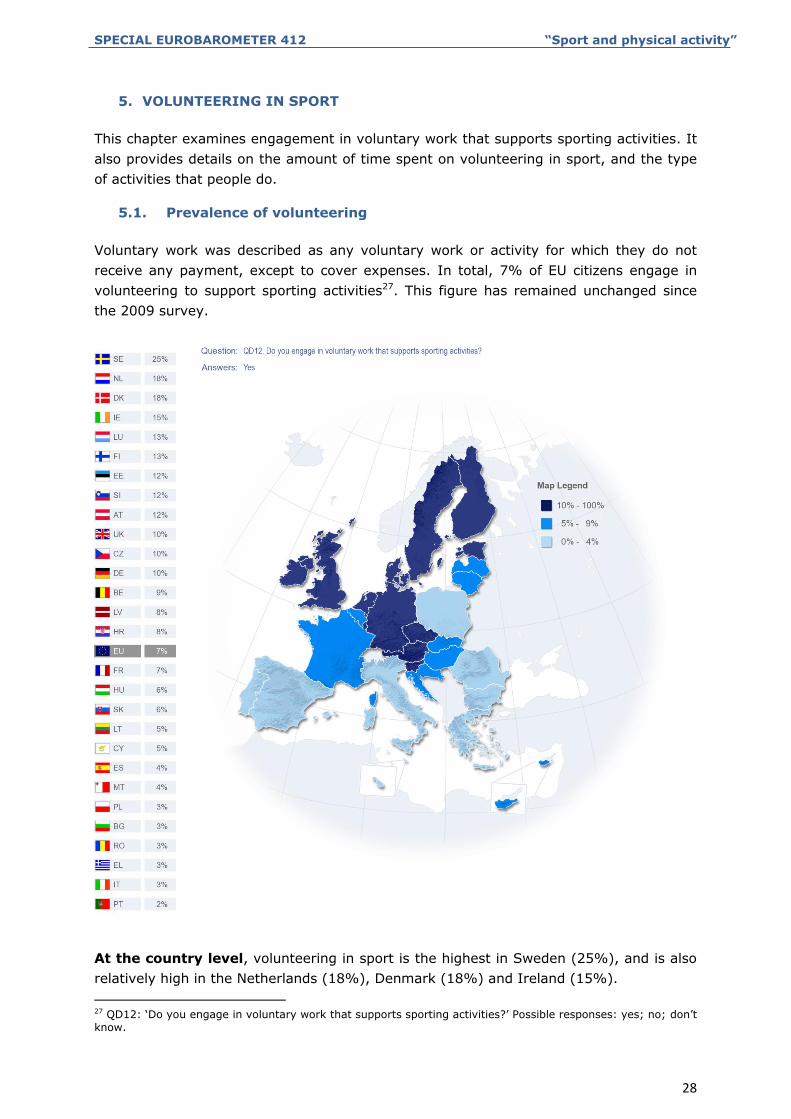
5.1. Prevalence of volunteering
Voluntary work was described as any voluntary work or activity for which they do not
receive any payment, except to cover expenses. In total, 7% of EU citizens engage in
volunteering to support sporting activities27. This figure has remained unchanged since
the 2009 survey.
At the country level, volunteering in sport is the highest in Sweden (25%), and is also
relatively high in the Netherlands (18%), Denmark (18%) and Ireland (15%).
27 QD12: ‘Do you engage in voluntary work that supports sporting activities?’ Possible responses: yes; no; don’t
know.
SPECIAL EUROBAROMETER 412 “Sport and physical activity”
29
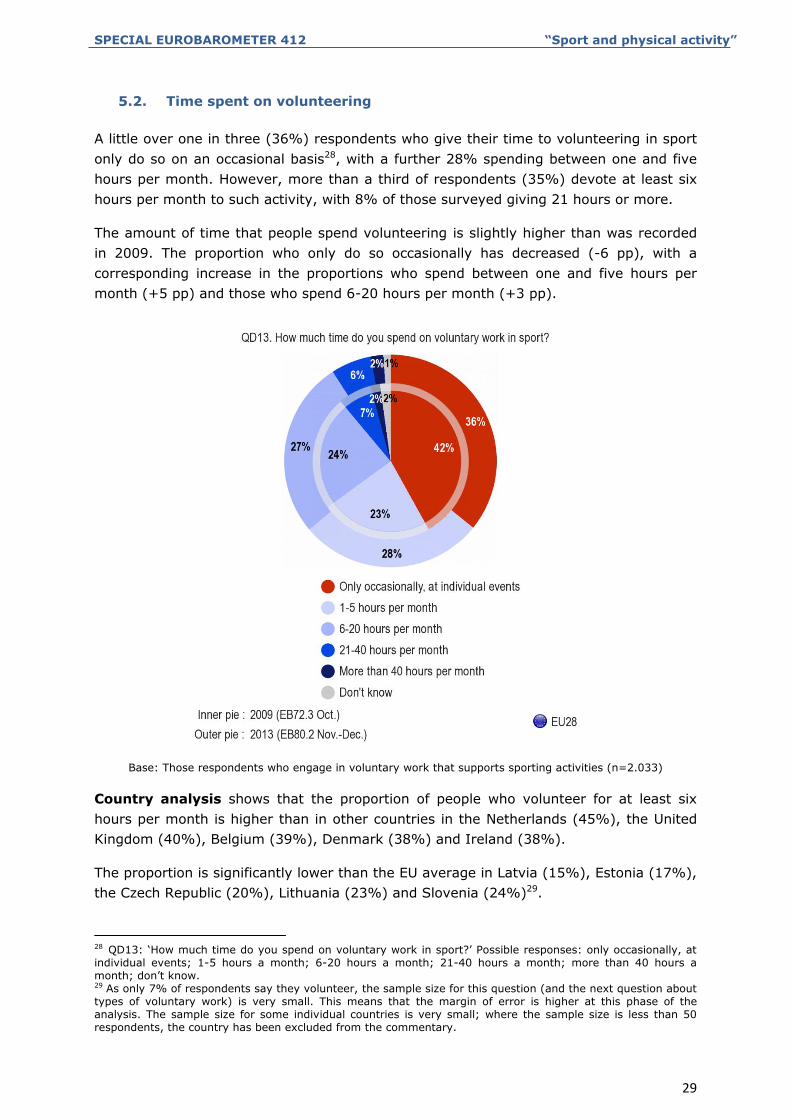
5.2. Time spent on volunteering
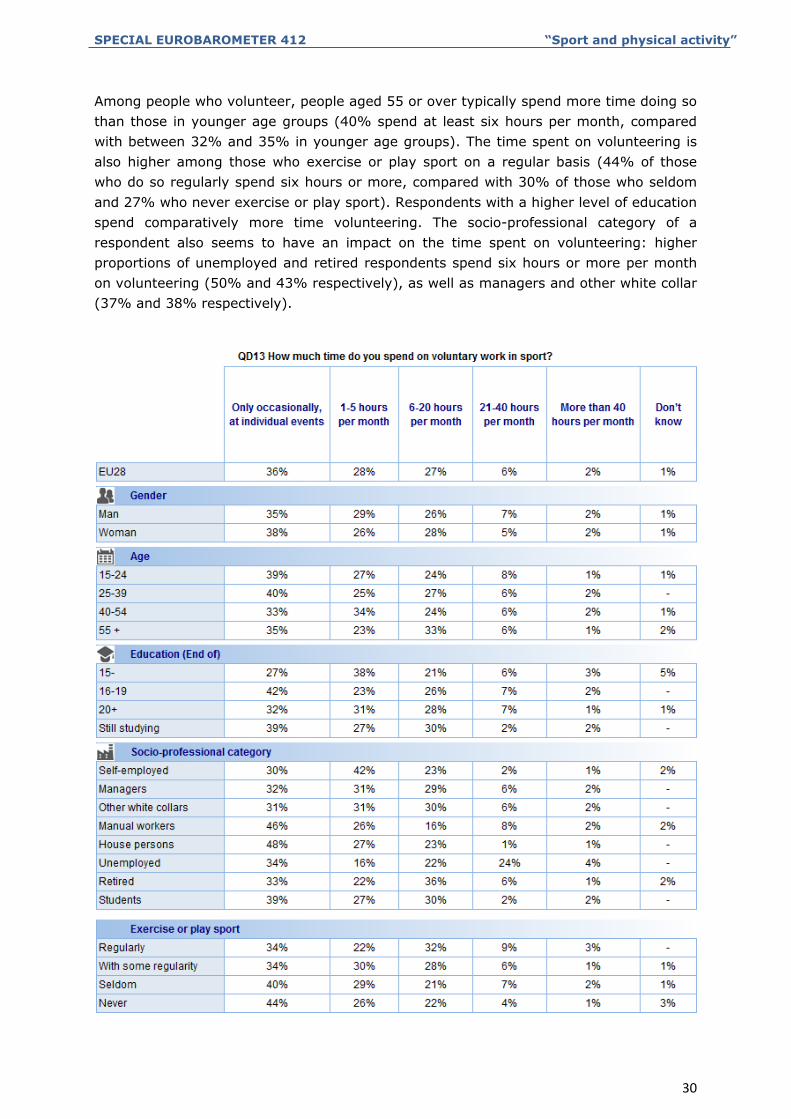
A little over one in three (36%) respondents who give their time to volunteering in sport
only do so on an occasional basis28, with a further 28% spending between one and five
hours per month. However, more than a third of respondents (35%) devote at least six
hours per month to such activity, with 8% of those surveyed giving 21 hours or more.
The amount of time that people spend volunteering is slightly higher than was recorded
in 2009. The proportion who only do so occasionally has decreased (-6 pp), with a
corresponding increase in the proportions who spend between one and five hours per
month (+5 pp) and those who spend 6-20 hours per month (+3 pp).
Base: Those respondents who engage in voluntary work that supports sporting activities (n=2.033)
Country analysis shows that the proportion of people who volunteer for at least six
hours per month is higher than in other countries in the Netherlands (45%), the United
Kingdom (40%), Belgium (39%), Denmark (38%) and Ireland (38%).
The proportion is significantly lower than the EU average in Latvia (15%), Estonia (17%),
the Czech Republic (20%), Lithuania (23%) and Slovenia (24%)29.
28 QD13: ‘How much time do you spend on voluntary work in sport?’ Possible responses: only occasionally, at
individual events; 1-5 hours a month; 6-20 hours a month; 21-40 hours a month; more than 40 hours a
month; don’t know. 29 As only 7% of respondents say they volunteer, the sample size for this question (and the next question about
types of voluntary work) is very small. This means that the margin of error is higher at this phase of the
analysis. The sample size for some individual countries is very small; where the sample size is less than 50
respondents, the country has been excluded from the commentary.
SPECIAL EUROBAROMETER 412 “Sport and physical activity”
30
Among people who volunteer, people aged 55 or over typically spend more time doing so
than those in younger age groups (40% spend at least six hours per month, compared
with between 32% and 35% in younger age groups). The time spent on volunteering is
also higher among those who exercise or play sport on a regular basis (44% of those
who do so regularly spend six hours or more, compared with 30% of those who seldom
and 27% who never exercise or play sport). Respondents with a higher level of education
spend comparatively more time volunteering. The socio-professional category of a
respondent also seems to have an impact on the time spent on volunteering: higher
proportions of unemployed and retired respondents spend six hours or more per month
on volunteering (50% and 43% respectively), as well as managers and other white collar
(37% and 38% respectively).
SPECIAL EUROBAROMETER 412 “Sport and physical activity”
31
5.3. Type of activities
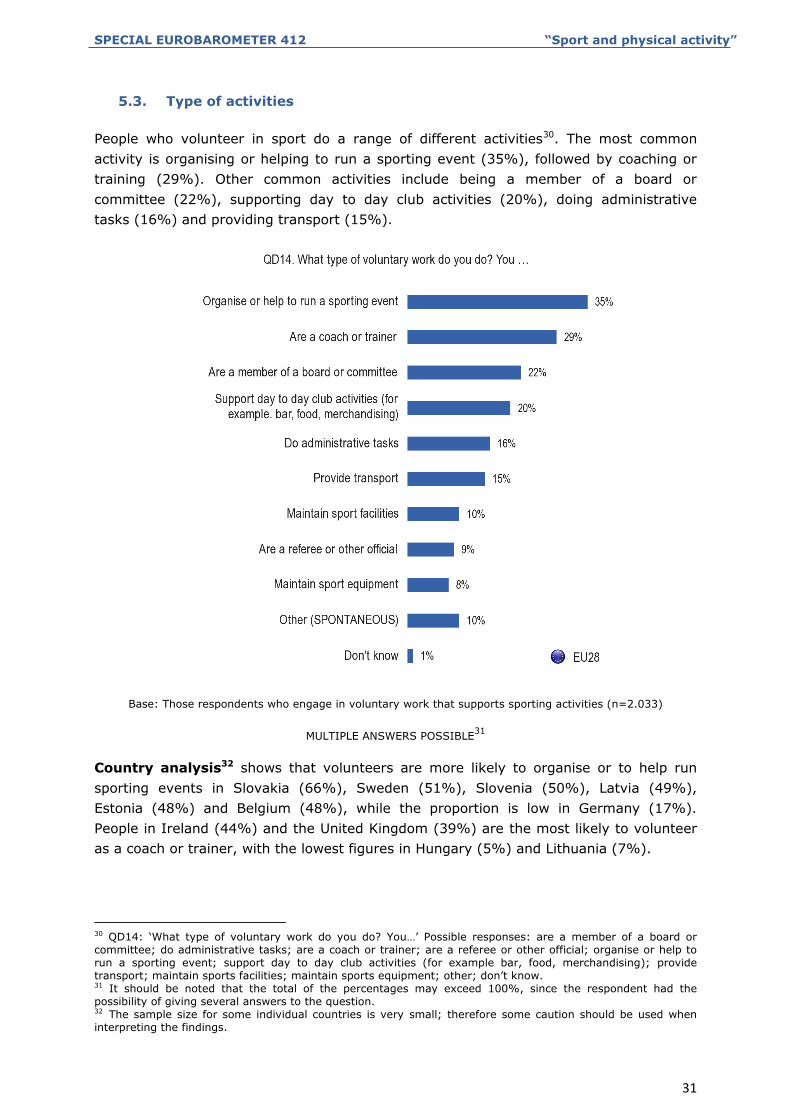
People who volunteer in sport do a range of different activities30. The most common
activity is organising or helping to run a sporting event (35%), followed by coaching or
training (29%). Other common activities include being a member of a board or
committee (22%), supporting day to day club activities (20%), doing administrative
tasks (16%) and providing transport (15%).
Base: Those respondents who engage in voluntary work that supports sporting activities (n=2.033)
MULTIPLE ANSWERS POSSIBLE31
Country analysis32 shows that volunteers are more likely to organise or to help run
sporting events in Slovakia (66%), Sweden (51%), Slovenia (50%), Latvia (49%),
Estonia (48%) and Belgium (48%), while the proportion is low in Germany (17%).
People in Ireland (44%) and the United Kingdom (39%) are the most likely to volunteer
as a coach or trainer, with the lowest figures in Hungary (5%) and Lithuania (7%).
30 QD14: ‘What type of voluntary work do you do? You…’ Possible responses: are a member of a board or
committee; do administrative tasks; are a coach or trainer; are a referee or other official; organise or help to
run a sporting event; support day to day club activities (for example bar, food, merchandising); provide
transport; maintain sports facilities; maintain sports equipment; other; don’t know. 31 It should be noted that the total of the percentages may exceed 100%, since the respondent had the
possibility of giving several answers to the question. 32 The sample size for some individual countries is very small; therefore some caution should be used when
interpreting the findings.
SPECIAL EUROBAROMETER 412 “Sport and physical activity”
32
CONCLUSIONS
Despite the growing importance attached to the promotion of physical activity in EU
Member States, the previous Eurobarometer survey in 2009 identified “alarmingly high”
rates of physical inactivity in the EU, and found that the vast majority of Europeans
(60%) never exercise or play sport.33 In the 2013 survey, with 59%, this proportion of
citizens remains unacceptably high. In fact, there is even a slight increase from the 2009
figure for those who do not exercise or play sport at all (i.e. from 39% to 42%). This
survey also found that a substantial proportion of respondents (13%) had not walked for
ten minutes at a time in the previous week. Such findings might indicate that the
message about the importance of sport and physical activity for an individual's health
and wellbeing has not yet got through to significant segments of the EU population.
The survey also indicates demographic variations. For instance, women (in particular in
the younger age groups) are far less active than their male counterparts, and young
women are more likely to feel that local authorities do not do enough for its citizens in
relation to offering opportunities for physical activity. This suggests that women might
need more encouragement and support to be more physically active. The inactivity
figures for both women and men of those aged 55 and over are extremely high, 71% of
women and 70% of men of that age group do never or seldom exercise or play sport.
As in 2009, the survey's results show large disparities among EU Member States on
many questions. The more physically active countries are overall clustered in the
Northern part of the EU, while the less active are mainly the Southern countries. These
variations are likely to reflect the facilities and infrastructure available; in fact, the same
country patterns apply when respondents were asked about opportunities for physical
activity. Such findings suggest that there might be scope for some Member States to
learn from good practices established in other countries.
The survey also made it clear that most sport or physical activity takes place in informal
settings – in parks and outdoors, at home, or on the journey between home and school,
work or shops, as well as at work or at school or university. This suggests that such
opportunities to engage in physical activity should be promoted alongside the practice of
sport and physical activity in organised settings.
Engagement in volunteering in sport remains important for a number of EU citizens (7%)
and, in most EU Member States, constitutes a crucial element to ensure that sport and
physical activity can be offered to the wider population. Strategies to increase
volunteering could therefore acknowledge the fact that there are numerous ways in
which different people can get involved and that without such engagement, many of the
existing possibilities for sport and physical activity could simply not be offered.
33 European Commission: Special Eurobarometer 334 - Sport and Physical Activity
(http://ec.europa.eu/public_opinion/archives/ebs/ebs_334_en.pdf)