Embed Size (px)
Citation preview
Special Eurobarometer 422a
QUALITY OF TRANSPORT
REPORT
Fieldwork: October 2014
Publication: December 2014
This survey has been requested by the European Commission, Directorate-General for Mobility and
Transport (DG MOVE) and co-ordinated by Directorate-General for Communication (DG COMM).
http://ec.europa.eu/public_opinion/index_en.htm
This document does not represent the point of view of the European Commission. The interpretations and opinions contained in it are solely those of the authors.
Special Eurobarometer 422a / Wave EB82.2 – TNS Opinion & Social
Special Eurobarometer 422a
Quality of transport
Conducted by TNS Opinion & Social at the request of
Directorate-General for Mobility and Transport (DG MOVE)
Survey co-ordinated by Directorate-General Communication (DG COMM “Strategy, Corporate Communication Actions and
Eurobarometer” Unit)

Project title Special Eurobarometer 422a “Quality of Transport”
Linguistic Version EN
Catalogue Number MI-06-14-188-EN-N
ISBN 978-92-79-44436-4
DOI 10.2832/783021
© European Union, 2014
SPECIAL EUROBAROMETER 422a “Quality of transport”
1
TABLE OF CONTENTS
INTRODUCTION .................................................................................................. 3
EXECUTIVE SUMMARY ........................................................................................ 5
1. TRANSPORT HABITS FOR EVERYDAY JOURNEYS .......................................... 7
1.1. The most frequently used modes of transport ........................................... 7
1.2. Reasons for using different modes of transport ...................................... 14
1.3. Ways of encouraging the use of public transport .................................... 19
2. TRANSPORT HABITS WHEN MAKING LONG JOURNEYS WITHIN THE EU ..... 24
2.1. Frequency of long journeys ..................................................................... 24
2.2. The most frequently used modes of transport for long journeys ............. 28
2.3. Reasons for using the respective modes of transport when making long
journeys ........................................................................................................... 32
2.4. Satisfaction with different aspects of long journeys ................................ 37
3. PERCEPTION OF THE QUALITY OF DIFFERENT MEANS OF TRANSPORT OVER
RECENT YEARS ................................................................................................. 41
4. ROAD TRANSPORT ...................................................................................... 42
4.1. Perceptions of the quality of road transport ............................................ 42
4.2. The most serious problems affecting roads ............................................. 46
4.3. Priorities for improving safety on roads .................................................. 51
4.4. General attitudes about online availiability of the vehicle’s location ....... 56
5. AIR TRANSPORT ......................................................................................... 59
5.1. Perceptions of the quality of air transport ............................................... 59
5.2. The most serious problems affecting air transport .................................. 64
5.3. Perception of the importance of the restriction on liquids in hand-luggage
................................................................................................................ 68
SPECIAL EUROBAROMETER 422a “Quality of transport”
2
6. RAIL TRANSPORT ....................................................................................... 71
6.1. Perceptions of the quality of rail transport .............................................. 71
6.2. The most serious problems affecting rail transport ................................. 75
7. SEA AND RIVER TRANSPORT ...................................................................... 79
7.1. Perceptions of the quality of sea or river transport ................................. 79
7.2. The most serious problems affecting sea or river transport .................... 81
8. SUGGESTIONS FOR MAKING THE TRANSPORT SECTOR MORE ATTRACTIVE
TO JOB SEEKERS ............................................................................................... 85
CONCLUSIONS .................................................................................................. 89
ANNEXES
Technical specifications
Questionnaire
Tables
SPECIAL EUROBAROMETER 422a “Quality of transport”
3
INTRODUCTION
Transport directly affects everyone in Europe. Whatever age we are and whatever
activities we undertake, transportation and mobility play a fundamental role for our daily
lives and for business. The estimated annual budget of the average EU household for
transport is € 4 530. With a population of over 505 million this represents a significant
investment.
The aim of the European Commission's Directorate General for Mobility and Transport
(DG MOVE) is to promote transport solutions that are efficient, safe, secure and
environmentally friendly and to create the conditions for a competitive industry,
generating growth and jobs. With this in mind, DG MOVE is actively working on a range
of activities that concern all modes of transportation: policy making and the proposition
of new laws, project funding and research as well as activities to increase citizen's
awareness. Furthermore, DG MOVE provides statistical insights to all interested parties:
decision makers, industries, citizens and media - for example, the annual statistical
pocketbook or the recent EU Transport Scoreboard.
DG MOVE commissioned this survey to gather information from European citizens,
understand their habits, hear their opinions and analyse their perceptions of transport
related matters. The survey focussed on:
The most frequently used modes of transport for daily trips and long journeys and
the reasons these modes were chosen;
How to encourage people who use cars and motorbikes to use public transport ;
The perceptions of the quality of road, air, rail and sea transport over the last five
years and the most serious problems affecting these modes of transport;
How to make the transport sector more appealing for job seekers.
Results are presented first for the EU as a whole, then for individual countries, followed
by socio-demographic analyses.
SPECIAL EUROBAROMETER 422a “Quality of transport”
4
This survey was carried out by TNS Opinion & Social network in the 28 Member States of
the European Union between the 11th and 20th of October 2014. Some 27.868
respondents from different social and demographic groups were interviewed face-to-face
at home in their mother tongue on behalf of the Directorate-General for Mobility and
Transport. The methodology used is that of Eurobarometer surveys as carried out by the
Directorate-General for Communication (“Strategy, Corporate Communication Actions
and Eurobarometer” Unit)1.. A technical note on the manner in which interviews were
conducted by the Institutes within the TNS Opinion & Social network is appended as an
annex to this report. Also included are the interview methods and confidence intervals2.
Note: In this report, countries are referred to by their official abbreviation. The
abbreviations used in this report correspond to:
ABBREVIATIONS BE Belgium LV Latvia BG Bulgaria LU Luxembourg CZ Czech Republic HU Hungary DK Denmark MT Malta DE Germany NL The Netherlands EE Estonia AT Austria EL Greece PL Poland ES Spain PT Portugal FR France RO Romania HR Croatia SI Slovenia IE Ireland SK Slovakia IT Italy FI Finland CY Republic of Cyprus*** SE Sweden LT Lithuania UK The United Kingdom EU28 European Union – 28 Member States EU15 BE, IT, FR, DE, LU, NL, DK, UK, IE, PT, ES, EL, AT, SE, FI*
NMS13 BG, CZ, EE, HR, CY, LT, LV, MT, HU, PL, RO, SI, SK**
EURO AREA
BE, FR, IT, LV, LU, DE, AT, ES, PT, IE, NL, FI, EL, EE, SI,
CY, MT, SK
* EU15 refers to the 15 countries forming the European Union before the enlargements of 2004, 2007 and
2013
** The NMS13 are the 13 ‘new Member States’ which joined the European Union during the 2004, 2007 and
2013 enlargements
*** Cyprus as a whole is one of the 28 European Union Member States. However, the ‘acquis communautaire’
has been suspended in the part of the country which is not controlled by the government of the Republic of
Cyprus. For practical reasons, only the interviews carried out in the part of the country controlled by the
government of the Republic of Cyprus are included in the ‘CY’ category and in the EU28 average.
* * * * *
We wish to thank the people throughout Europe who have given their time to take part in
this survey. Without their active participation, this study would not have been possible.
1 http://ec.europa.eu/public_opinion/index_en.htm 2 The results tables are included in the annex. It should be noted that the total of the percentages in the tables of this report may exceed 100% when the respondent has the possibility of giving several answers to the question.
SPECIAL EUROBAROMETER 422a “Quality of transport”
5
EXECUTIVE SUMMARY
Modes of transport used for everyday trips and long journeys
Cars were by far the most used mode of daily transport (54%) followed by urban
public transport (19%).
Convenience (61%) and speed (31%) were much more important than price
(12%) when choosing a mode of daily transport.
Frequent services (27%), better coverage (26%) and cheaper or seasonal ticket
options (25%) were the most likely to encourage Europeans out of their cars and
motorbikes and onto public transport. However 21% said nothing would
encourage them to swap their vehicle for public transport.
Around six in ten (59%) had made at least one journey of 300 km or more within
the EU in the last 12 months, with a cars or campervans (66%), planes (23%) or
trains (15%) being the most common form of transport used.
Once again convenience (61%) and speed (41%) were the most common reasons
for choosing a particular means of transport for a journey of at least 300 km.
Price was mentioned as an important factor by only 18%.
Most respondents were satisfied with the safety (93%), amenities (89%), value
(85%) and time taken (72%) for their long journey (300 km or more).
Road transport
Overall, opinion is divided over whether the quality of road transport has
improved (38%) or deteriorated (36%) in the last five years, and the same
conclusion can be made when looking more specifically at the car users (38%
improved vs. 40% deteriorated).
Six in ten respondents (60%) said congestion was the most serious problem for
roads in their country, while almost as many mentioned road maintenance (59%).
More than half of the respondents (56%) said improving road maintenance should
be the priority for improving safety on roads, although almost as many mentioned
zero alcohol tolerance (49%). Stricter speed limits and stricter controls on the use
of electronic devices were both mentioned by 27% of respondents. Motorbike
users were the most likely to say improved road maintenance should be the
priority compared to users of other transport modes (65% vs. 49%-59%).
Just over half of respondents (51%) would be willing to have a connected vehicle,
but for most of them (38%) this would be conditional to data anonymity or the
possibility to decide when to be connected.
SPECIAL EUROBAROMETER 422a “Quality of transport”
6
Air transport
More than one in three (36%) said the quality of air transport in their country has
improved in the last five years while 13% said it has deteriorated. Those who
used a plane in the last 12 months were more likely than those who used another
mode of transport to say that air transport had improved (57% vs. 37%-53%).
Ticket prices were most likely to be considered the most serious problem for air
transport (37%). Air pollution, lack of destinations from the closest airport, or
availability of public transport to and from that airport were the next most
mentioned problems (all 16%).
The majority said it wasn’t important to be able to bring more liquids than
currently allowed on board of airplanes (53%), while 30% said it is important.
Respondents who had taken a journey by plane in the last 12 months were more
likely than those who had not to say it was important to them to be able to bring
more liquids onto the plane (41% vs. 30%).
Rail transport
More than one third said rail transport had improved (34%) while 27% said it had
deteriorated. Respondents who used the train for both daily transport and long
journeys (300 km or more) were more likely than those using other modes to say
rail transport had improved (50% and 51% vs. 29%-40% and 35%-41%).
Ticket prices were considered the most serious problem for rail transport (46%) –
considerably higher than the proportion who mentioned the lack of reliable or
punctual services (33%). Missing links and rail maintenance were considered
serious problems by at least one in five (21%).
Transport by boat or ship
Less than one in five (18%) of respondents said the quality of sea or river
transport in their country had stayed the same over the last five years, while 14%
said it had improved, and just 6% said it had deteriorated. Respondents who had
taken a journey by boat in the last 12 months were more likely than those who
used other modes to say the quality of sea or river transport had improved (48%
vs. 15%-20%).
Ticket prices were considered the most serious problem for sea or river transport
(18%), followed by water pollution and reduced links (both 15%).
Jobs in the Transport Sector
Higher wages (41%) and better working conditions (37%) would make transport
jobs more attractive to job seekers.
SPECIAL EUROBAROMETER 422a “Quality of transport”
7
1. TRANSPORT HABITS FOR EVERYDAY JOURNEYS
1.1. THE MOST FREQUENTLY USED MODES OF TRANSPORT
- On a typical day, cars were by far the most used mode of transport -
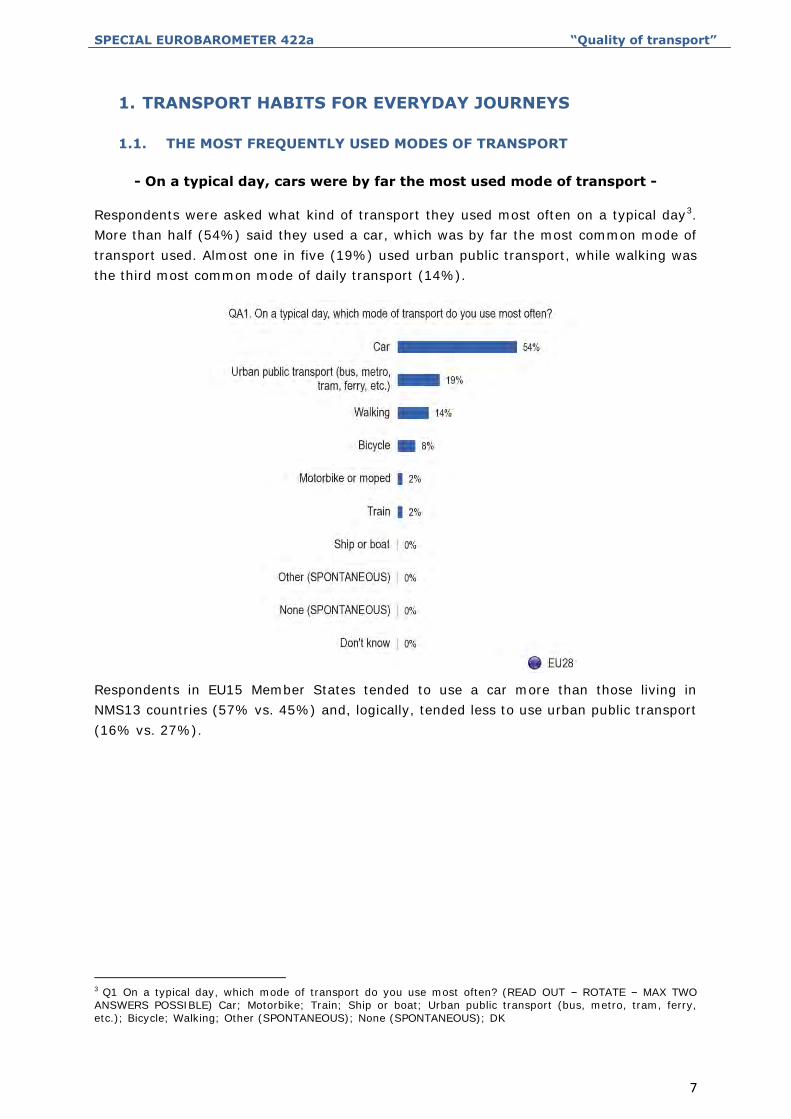
Respondents were asked what kind of transport they used most often on a typical day3.
More than half (54%) said they used a car, which was by far the most common mode of
transport used. Almost one in five (19%) used urban public transport, while walking was
the third most common mode of daily transport (14%).
Respondents in EU15 Member States tended to use a car more than those living in
NMS13 countries (57% vs. 45%) and, logically, tended less to use urban public transport
(16% vs. 27%).
3 Q1 On a typical day, which mode of transport do you use most often? (READ OUT – ROTATE – MAX TWO ANSWERS POSSIBLE) Car; Motorbike; Train; Ship or boat; Urban public transport (bus, metro, tram, ferry, etc.); Bicycle; Walking; Other (SPONTANEOUS); None (SPONTANEOUS); DK
SPECIAL EUROBAROMETER 422a “Quality of transport”
8
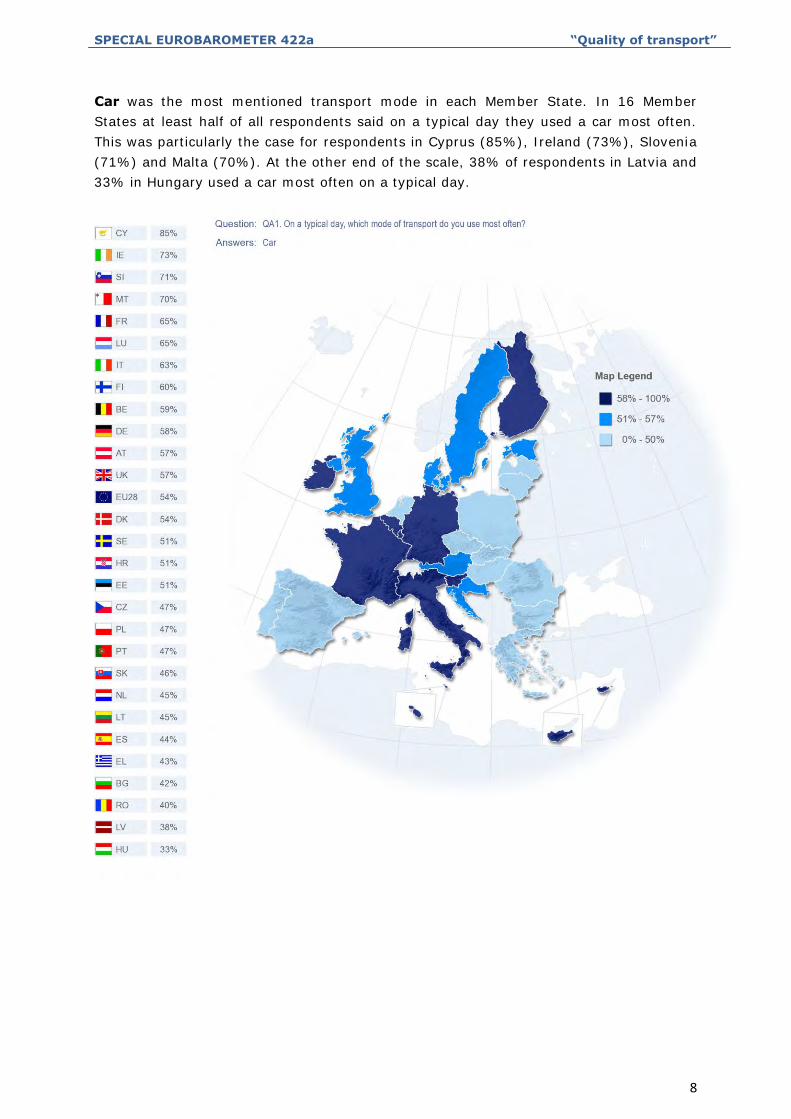
Car was the most mentioned transport mode in each Member State. In 16 Member
States at least half of all respondents said on a typical day they used a car most often.
This was particularly the case for respondents in Cyprus (85%), Ireland (73%), Slovenia
(71%) and Malta (70%). At the other end of the scale, 38% of respondents in Latvia and
33% in Hungary used a car most often on a typical day.
SPECIAL EUROBAROMETER 422a “Quality of transport”
9
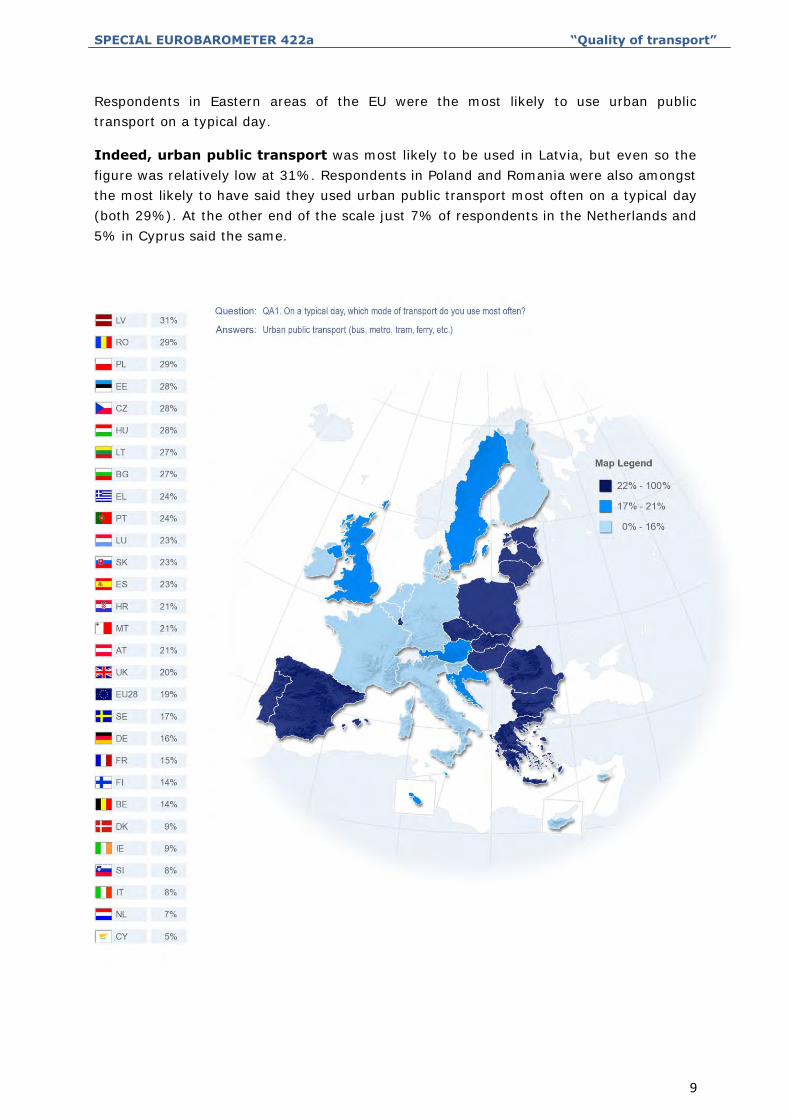
Respondents in Eastern areas of the EU were the most likely to use urban public
transport on a typical day.
Indeed, urban public transport was most likely to be used in Latvia, but even so the
figure was relatively low at 31%. Respondents in Poland and Romania were also amongst
the most likely to have said they used urban public transport most often on a typical day
(both 29%). At the other end of the scale just 7% of respondents in the Netherlands and
5% in Cyprus said the same.
SPECIAL EUROBAROMETER 422a “Quality of transport”
10
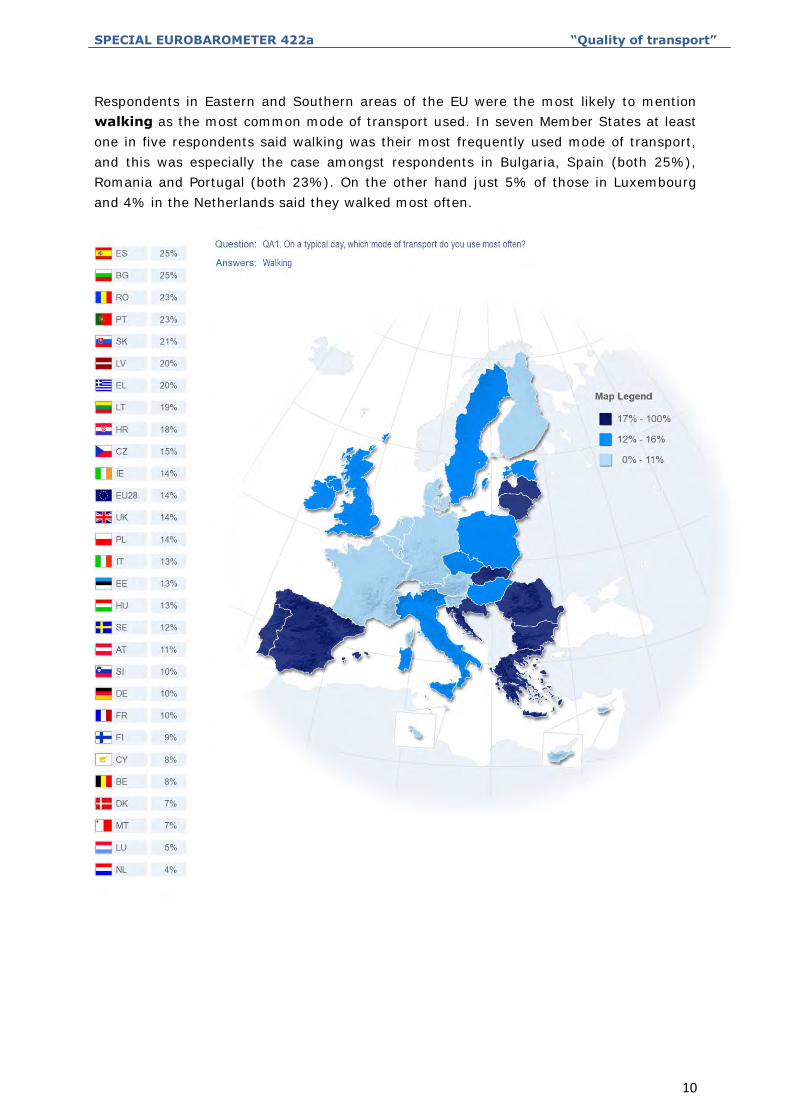
Respondents in Eastern and Southern areas of the EU were the most likely to mention
walking as the most common mode of transport used. In seven Member States at least
one in five respondents said walking was their most frequently used mode of transport,
and this was especially the case amongst respondents in Bulgaria, Spain (both 25%),
Romania and Portugal (both 23%). On the other hand just 5% of those in Luxembourg
and 4% in the Netherlands said they walked most often.
SPECIAL EUROBAROMETER 422a “Quality of transport”
11
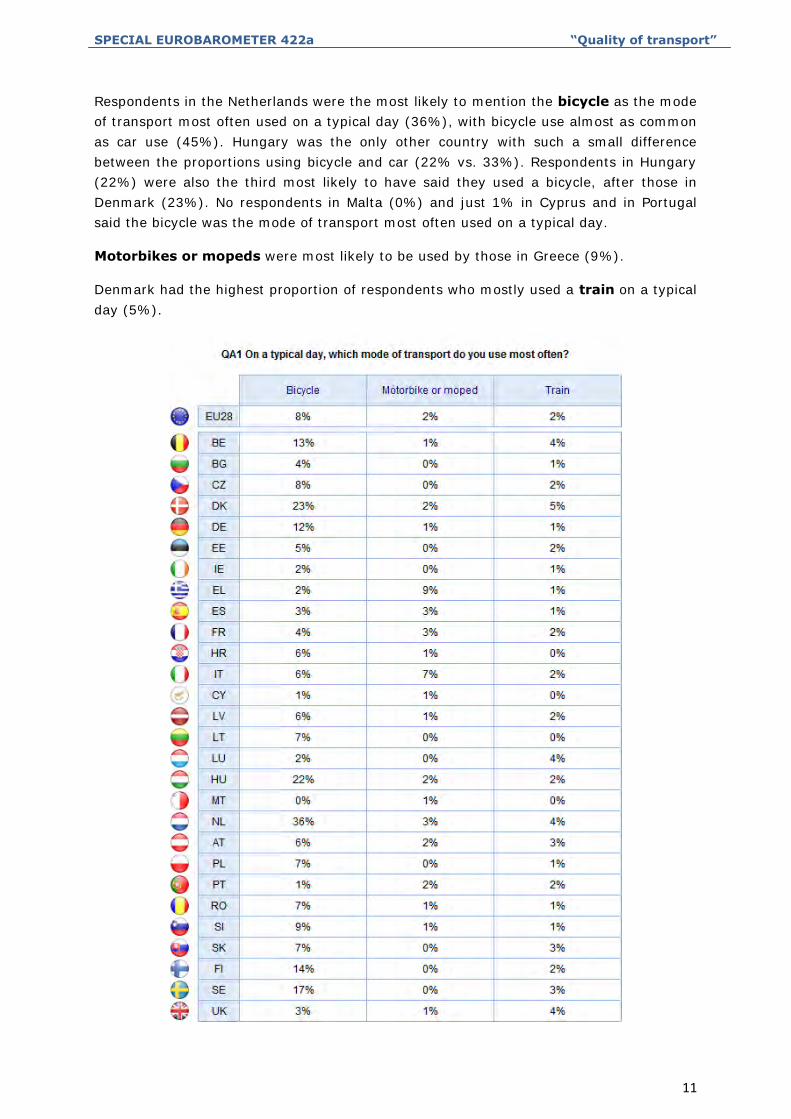
Respondents in the Netherlands were the most likely to mention the bicycle as the mode
of transport most often used on a typical day (36%), with bicycle use almost as common
as car use (45%). Hungary was the only other country with such a small difference
between the proportions using bicycle and car (22% vs. 33%). Respondents in Hungary
(22%) were also the third most likely to have said they used a bicycle, after those in
Denmark (23%). No respondents in Malta (0%) and just 1% in Cyprus and in Portugal
said the bicycle was the mode of transport most often used on a typical day.
Motorbikes or mopeds were most likely to be used by those in Greece (9%).
Denmark had the highest proportion of respondents who mostly used a train on a typical
day (5%).
SPECIAL EUROBAROMETER 422a “Quality of transport”
12
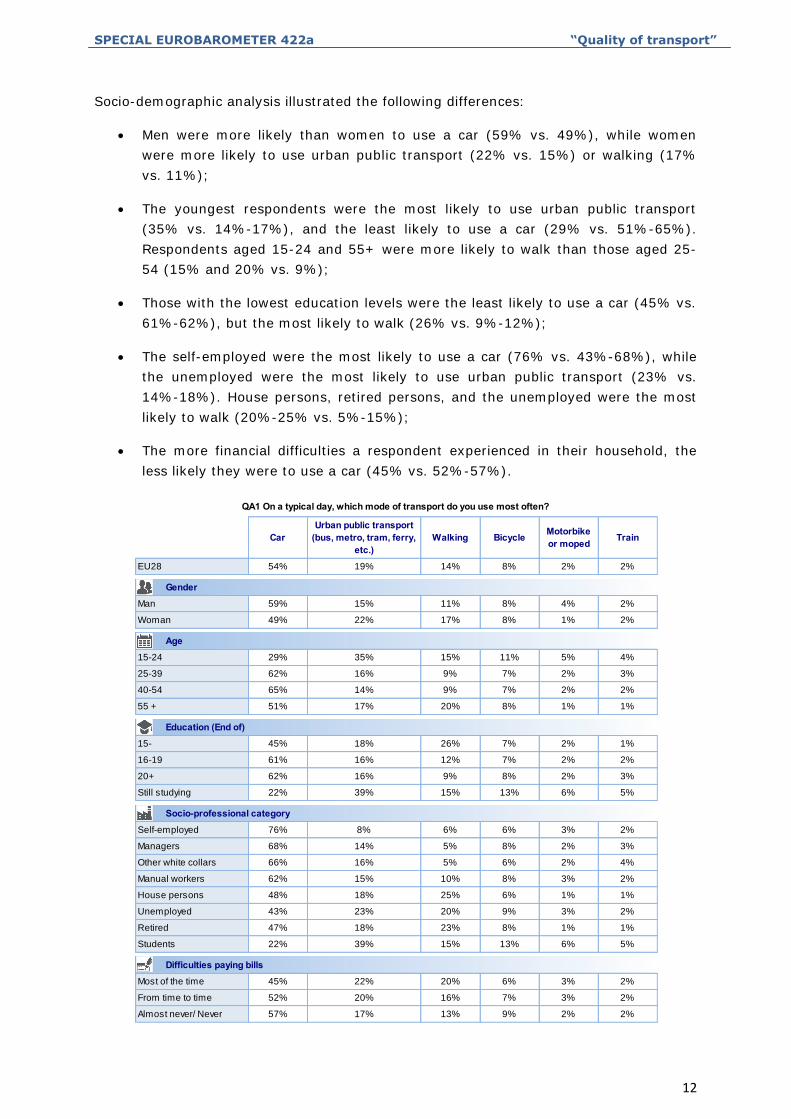
Socio-demographic analysis illustrated the following differences:
Men were more likely than women to use a car (59% vs. 49%), while women
were more likely to use urban public transport (22% vs. 15%) or walking (17%
vs. 11%);
The youngest respondents were the most likely to use urban public transport
(35% vs. 14%-17%), and the least likely to use a car (29% vs. 51%-65%).
Respondents aged 15-24 and 55+ were more likely to walk than those aged 25-
54 (15% and 20% vs. 9%);
Those with the lowest education levels were the least likely to use a car (45% vs.
61%-62%), but the most likely to walk (26% vs. 9%-12%);
The self-employed were the most likely to use a car (76% vs. 43%-68%), while
the unemployed were the most likely to use urban public transport (23% vs.
14%-18%). House persons, retired persons, and the unemployed were the most
likely to walk (20%-25% vs. 5%-15%);
The more financial difficulties a respondent experienced in their household, the
less likely they were to use a car (45% vs. 52%-57%).
CarUrban public transport
(bus, metro, tram, ferry, etc.)
Walking Bicycle Motorbike or moped Train
EU28 54% 19% 14% 8% 2% 2%
Man 59% 15% 11% 8% 4% 2%
Woman 49% 22% 17% 8% 1% 2%
15-24 29% 35% 15% 11% 5% 4%
25-39 62% 16% 9% 7% 2% 3%
40-54 65% 14% 9% 7% 2% 2%
55 + 51% 17% 20% 8% 1% 1%
15- 45% 18% 26% 7% 2% 1%
16-19 61% 16% 12% 7% 2% 2%
20+ 62% 16% 9% 8% 2% 3%
Still studying 22% 39% 15% 13% 6% 5%
Self-employed 76% 8% 6% 6% 3% 2%
Managers 68% 14% 5% 8% 2% 3%
Other white collars 66% 16% 5% 6% 2% 4%
Manual workers 62% 15% 10% 8% 3% 2%
House persons 48% 18% 25% 6% 1% 1%
Unemployed 43% 23% 20% 9% 3% 2%
Retired 47% 18% 23% 8% 1% 1%
Students 22% 39% 15% 13% 6% 5%
Most of the time 45% 22% 20% 6% 3% 2%
From time to time 52% 20% 16% 7% 3% 2%
Almost never/ Never 57% 17% 13% 9% 2% 2%
Difficulties paying bills
QA1 On a typical day, which mode of transport do you use most often?
Gender
Age
Education (End of)
Socio-professional category
SPECIAL EUROBAROMETER 422a “Quality of transport”
13
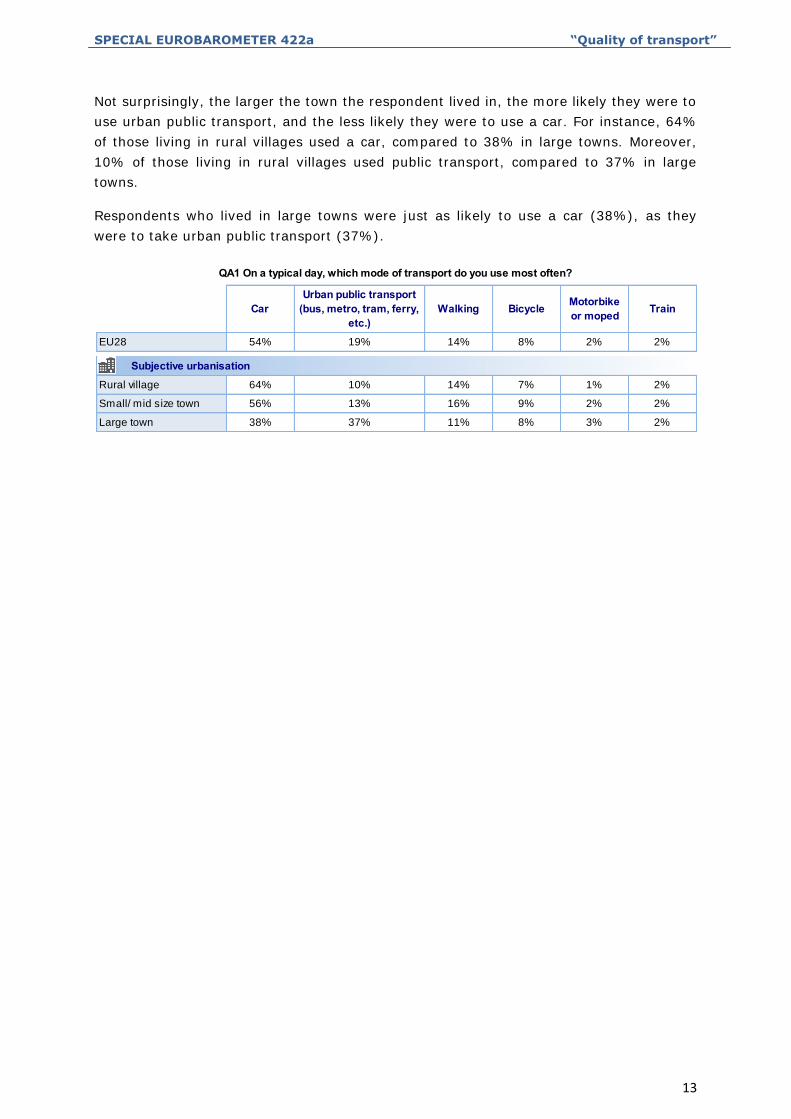
Not surprisingly, the larger the town the respondent lived in, the more likely they were to
use urban public transport, and the less likely they were to use a car. For instance, 64%
of those living in rural villages used a car, compared to 38% in large towns. Moreover,
10% of those living in rural villages used public transport, compared to 37% in large
towns.
Respondents who lived in large towns were just as likely to use a car (38%), as they
were to take urban public transport (37%).
CarUrban public transport
(bus, metro, tram, ferry, etc.)
Walking Bicycle Motorbike or moped Train
EU28 54% 19% 14% 8% 2% 2%
Rural village 64% 10% 14% 7% 1% 2%
Small/ mid size town 56% 13% 16% 9% 2% 2%
Large town 38% 37% 11% 8% 3% 2%
Subjective urbanisation
QA1 On a typical day, which mode of transport do you use most often?
SPECIAL EUROBAROMETER 422a “Quality of transport”
14
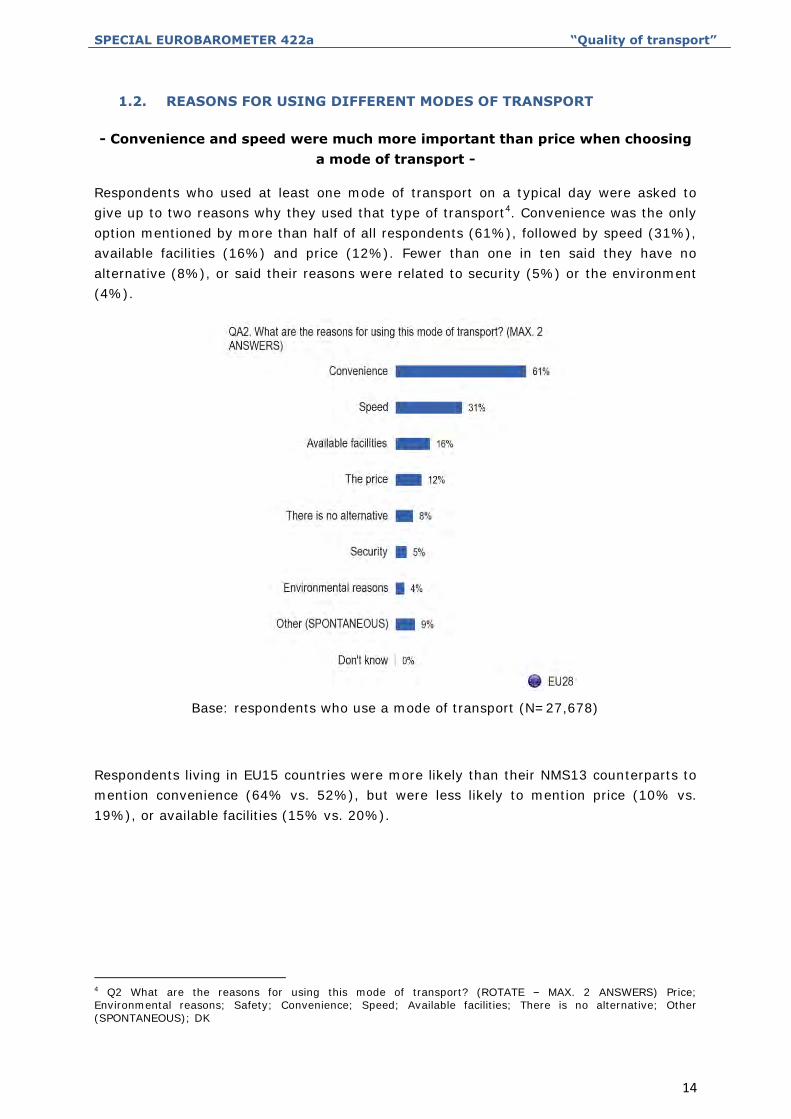
1.2. REASONS FOR USING DIFFERENT MODES OF TRANSPORT
- Convenience and speed were much more important than price when choosing
a mode of transport -
Respondents who used at least one mode of transport on a typical day were asked to
give up to two reasons why they used that type of transport4. Convenience was the only
option mentioned by more than half of all respondents (61%), followed by speed (31%),
available facilities (16%) and price (12%). Fewer than one in ten said they have no
alternative (8%), or said their reasons were related to security (5%) or the environment
(4%).
Base: respondents who use a mode of transport (N=27,678)
Respondents living in EU15 countries were more likely than their NMS13 counterparts to
mention convenience (64% vs. 52%), but were less likely to mention price (10% vs.
19%), or available facilities (15% vs. 20%).
4 Q2 What are the reasons for using this mode of transport? (ROTATE – MAX. 2 ANSWERS) Price; Environmental reasons; Safety; Convenience; Speed; Available facilities; There is no alternative; Other (SPONTANEOUS); DK
SPECIAL EUROBAROMETER 422a “Quality of transport”
15
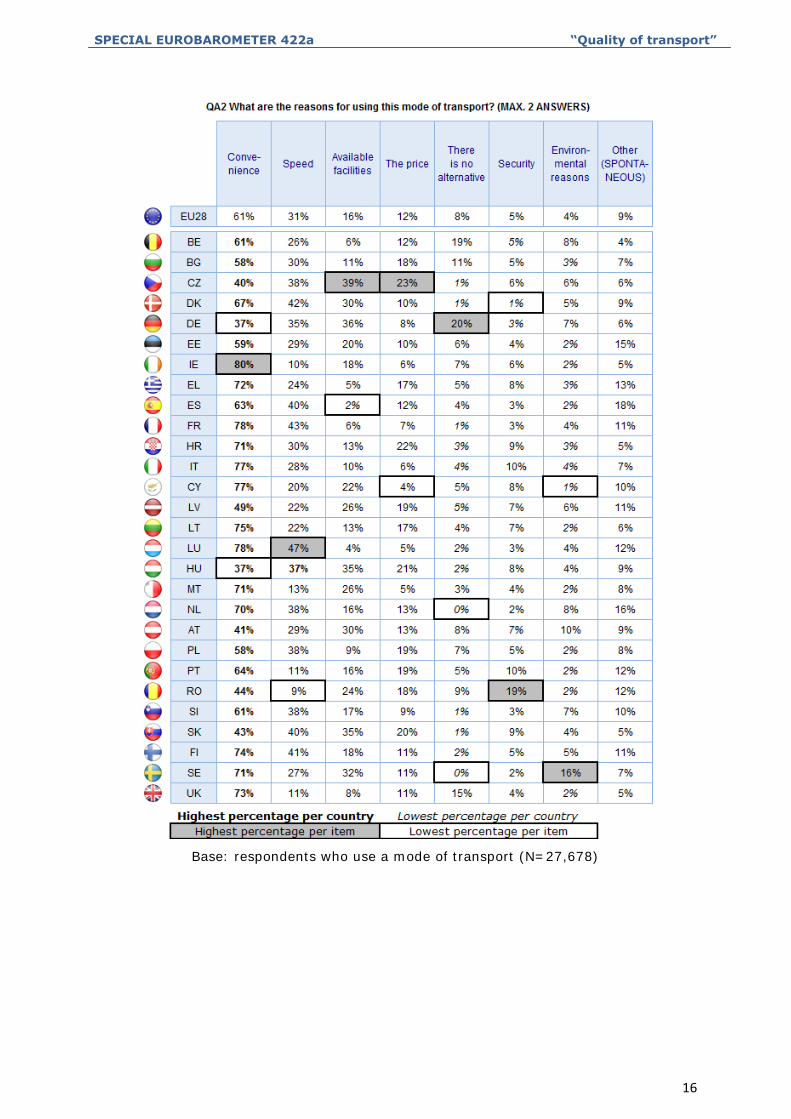
At least half of all respondents in 21 Member States said convenience was the reason
for using their chosen mode of transport, and convenience was also the most mentioned
reason in each Member State. Across the EU respondents in Ireland who were the most
likely to mention convenience (80%), followed by those in France, Luxembourg (both
78%), Italy and Cyprus (both 77%). In contrast convenience was cited as a reason by
37% of respondents in Hungary and Germany.
Respondents in Luxembourg (47%), France (43%) and Denmark (42%) were the most
likely to mention speed as a reason. This compares to just 10% of respondents in
Ireland and 9% in Romania. Overall at least one in five respondents in 23 Member States
mentioned speed as a reason for their chosen mode of transport.
At least one third of respondents in the Czech Republic (39%), Germany (36%), Slovakia
and Hungary (both 35%) mentioned available facilities as the reason for their choice of
transport. Few respondents in Luxembourg (4%) or Spain (2%) mentioned this reason.
The Czech Republic (23%), Croatia (22%), Hungary (21%) and Slovakia (20%) were the
only Member States where at least one in five said price was the reason for using their
chosen mode of transport. This compared to just 5% of those in in Luxembourg and
Malta and 4% of respondents in Cyprus.
One in five respondents in Germany said they chose their usual mode of daily transport
because there was no alternative (20%), as did 19% of those in Belgium. No
respondents in Sweden or the Netherlands mentioned this reason (both 0%).
Respondents in Romania were the most likely across the EU to choose their transport
based on security (19%), while those in Denmark were the least likely to have done so
(1%). Sweden and Austria were the only Member States where at least one in ten
mentioned environmental reasons for their transport choice (16% and 10%
respectively). Only 1% of respondents in Cyprus said the same.
In most Member States convenience was by far the most often common reason
mentioned. However, in Germany, Hungary, the Czech Republic and Slovakia speed and
available facilities were just as likely to be mentioned by respondents.
SPECIAL EUROBAROMETER 422a “Quality of transport”
16
Base: respondents who use a mode of transport (N=27,678)
SPECIAL EUROBAROMETER 422a “Quality of transport”
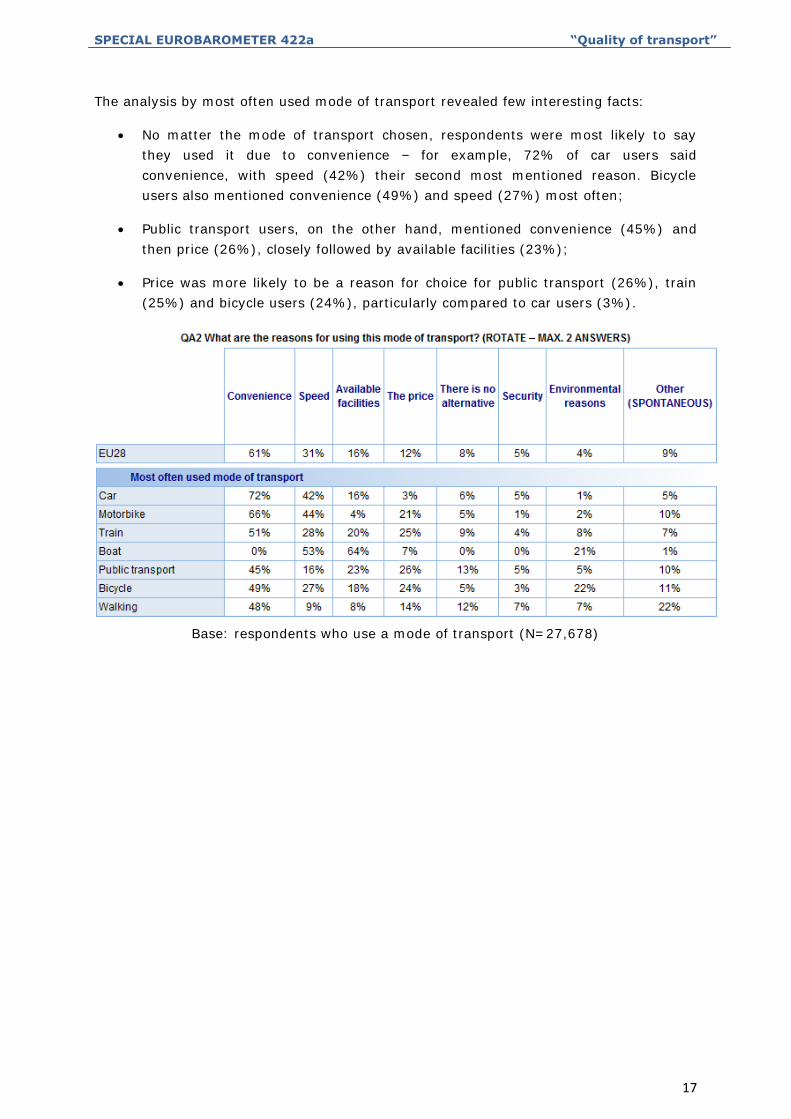
17
The analysis by most often used mode of transport revealed few interesting facts:
No matter the mode of transport chosen, respondents were most likely to say
they used it due to convenience – for example, 72% of car users said
convenience, with speed (42%) their second most mentioned reason. Bicycle
users also mentioned convenience (49%) and speed (27%) most often;
Public transport users, on the other hand, mentioned convenience (45%) and
then price (26%), closely followed by available facilities (23%);
Price was more likely to be a reason for choice for public transport (26%), train
(25%) and bicycle users (24%), particularly compared to car users (3%).
Base: respondents who use a mode of transport (N=27,678)
SPECIAL EUROBAROMETER 422a “Quality of transport”
18
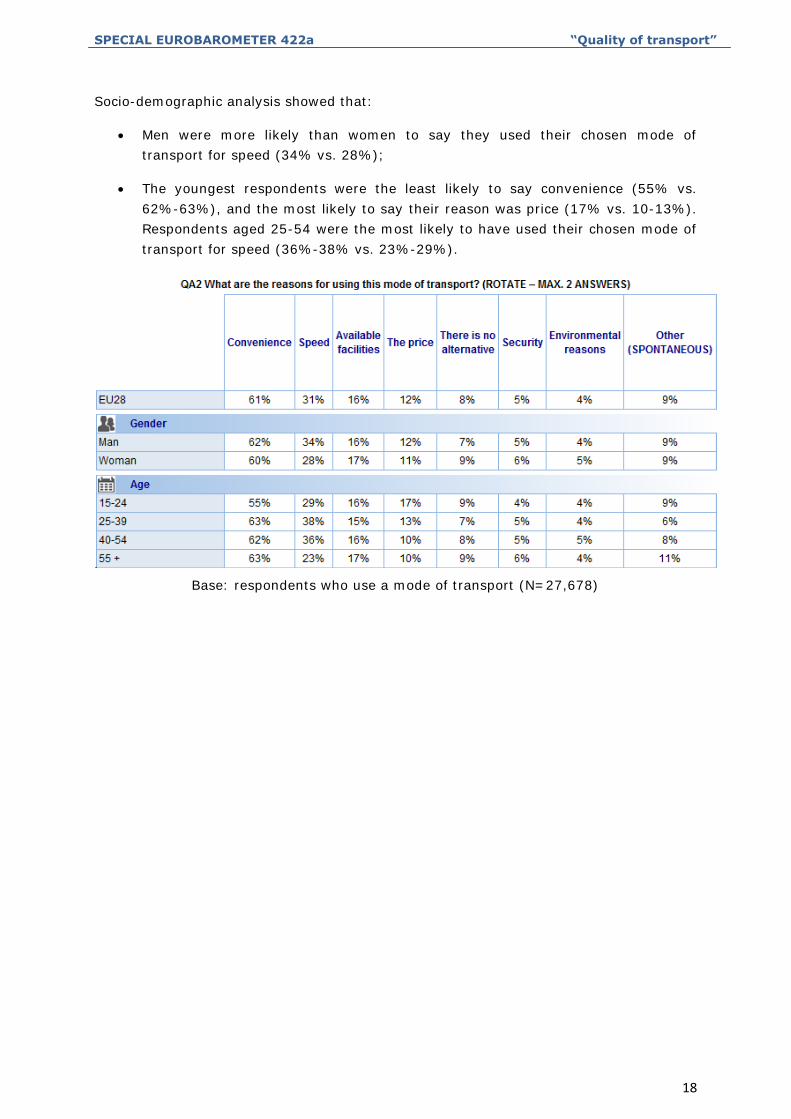
Socio-demographic analysis showed that:
Men were more likely than women to say they used their chosen mode of
transport for speed (34% vs. 28%);
The youngest respondents were the least likely to say convenience (55% vs.
62%-63%), and the most likely to say their reason was price (17% vs. 10-13%).
Respondents aged 25-54 were the most likely to have used their chosen mode of
transport for speed (36%-38% vs. 23%-29%).
Base: respondents who use a mode of transport (N=27,678)
SPECIAL EUROBAROMETER 422a “Quality of transport”
19
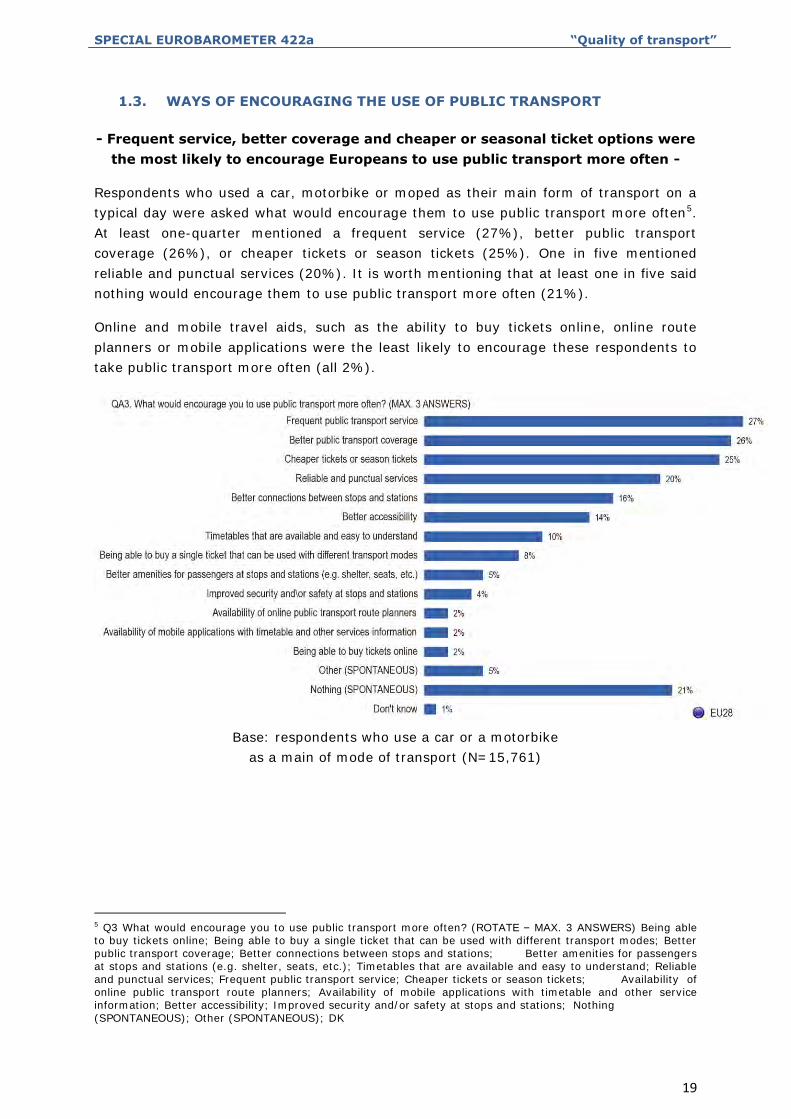
1.3. WAYS OF ENCOURAGING THE USE OF PUBLIC TRANSPORT
- Frequent service, better coverage and cheaper or seasonal ticket options were
the most likely to encourage Europeans to use public transport more often -
Respondents who used a car, motorbike or moped as their main form of transport on a
typical day were asked what would encourage them to use public transport more often5.
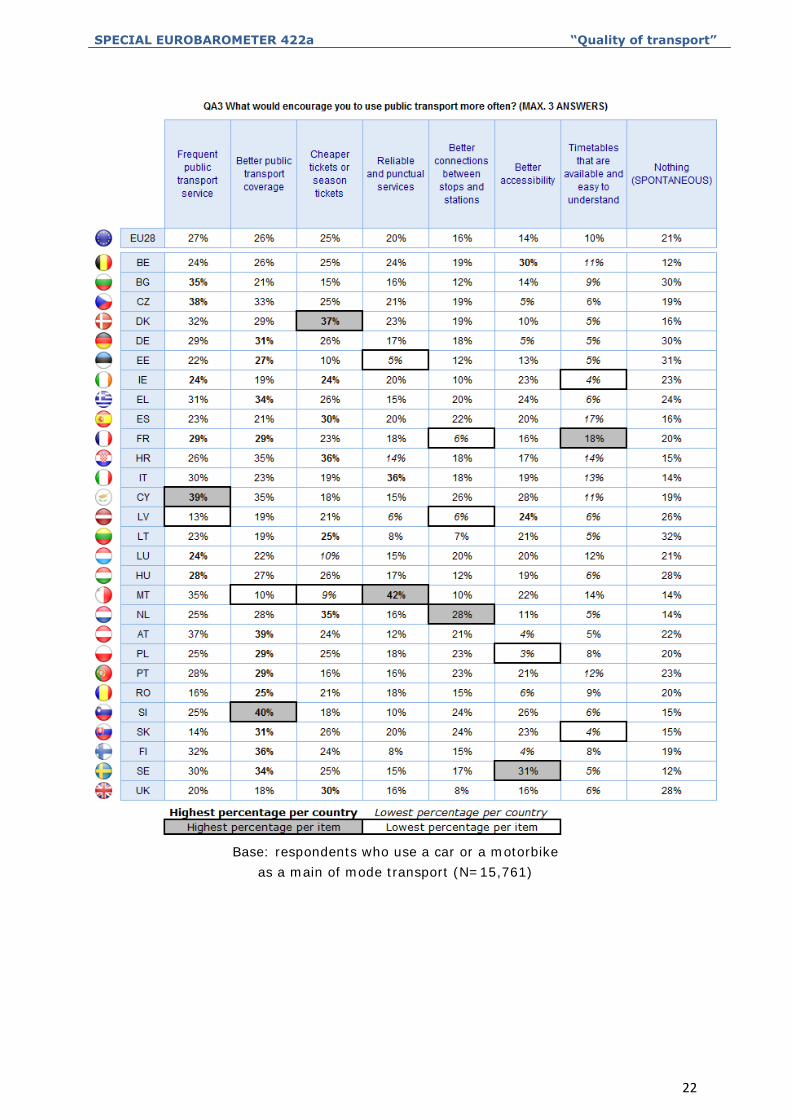
At least one-quarter mentioned a frequent service (27%), better public transport
coverage (26%), or cheaper tickets or season tickets (25%). One in five mentioned
reliable and punctual services (20%). It is worth mentioning that at least one in five said
nothing would encourage them to use public transport more often (21%).
Online and mobile travel aids, such as the ability to buy tickets online, online route
planners or mobile applications were the least likely to encourage these respondents to
take public transport more often (all 2%).
Base: respondents who use a car or a motorbike
as a main of mode of transport (N=15,761)
5 Q3 What would encourage you to use public transport more often? (ROTATE – MAX. 3 ANSWERS) Being able to buy tickets online; Being able to buy a single ticket that can be used with different transport modes; Better public transport coverage; Better connections between stops and stations; Better amenities for passengers at stops and stations (e.g. shelter, seats, etc.); Timetables that are available and easy to understand; Reliable and punctual services; Frequent public transport service; Cheaper tickets or season tickets; Availability of online public transport route planners; Availability of mobile applications with timetable and other service information; Better accessibility; Improved security and/or safety at stops and stations; Nothing (SPONTANEOUS); Other (SPONTANEOUS); DK
SPECIAL EUROBAROMETER 422a “Quality of transport”
20
Car, motorbike or moped users were asked what would encourage them to use public
transport more often:
Frequent public transport service was the reason most mentioned in seven
Member States: Cyprus, Czech Republic, Bulgaria, France, Hungary,
Luxembourg and Ireland;
Better public transport coverage was the reason most mentioned in twelve
Member States: Slovenia, Austria, Finland, Greece, Sweden, Germany,
Slovakia, France, Portugal, Poland, Estonia and Romania;
Cheaper tickets or season tickets was the reason most mentioned in seven
Member States: Denmark, Croatia, the Netherlands, Spain, the United
Kingdom, Lithuania and Ireland;
Reliable and punctual services was the reason most mentioned in two
Member States: Malta and Italy;
Better accessibility was the reason most mentioned in two Member States:
Belgium and Latvia.
The most likely to say that frequent public transport service would encourage them
to use public transport more often were respondents in Cyprus (39%), the Czech
Republic (38%) and Bulgaria (35%). Only 16% of respondents in Romania, 14% in
Slovakia and 13% in Latvia said the same.
Respondents in Slovenia (40%), Austria (39%) and Finland (36%) were the most likely
to say that better public transport coverage would encourage them to use public
transport more often, compared to just 10% in Malta. Overall at least one in five vehicle
users in 23 Member States said better coverage would encourage them to use public
transport more often.
Respondents in Denmark (37%), Croatia (36%) and the Netherlands (35%) were the
most likely to say that cheaper tickets or season tickets would encourage them to
use public transport more often. At the other end of the scale 10% of respondents in
Luxembourg and Estonia and 9% in Malta mentioned cheaper tickets or season tickets.
Respondents in Malta (42%) and Italy (36%) were most likely to say reliable and
punctual services would encourage them to use public transport more often, followed
by those in Belgium (24%) and Denmark (23%). Just 5% of respondents in Estonia
mentioned reliable and punctual services.
Respondents in the Netherlands (28%), Cyprus (26%), Slovenia and Slovakia (both
24%) were the most likely to say better connections between stops and stations
would encourage them to use public transport more often. At the other end of the scale
just 6% of respondents in France and Latvia mentioned better connections between
stops and stations
Almost one third of respondents in Sweden mentioned better accessibility (31%)
compared with just 3% in Poland.
SPECIAL EUROBAROMETER 422a “Quality of transport”
21
Timetables that are available and easy to understand would be most likely to
encourage respondents in France (18%) and Spain (17%). But only 4% in Ireland and in
Slovakia would be encouraged to use public transport more by such a measure. In 15
Member States at least one in five vehicle users said nothing would encourage them to
use public transport more often. This opinion was most widespread amongst those in
Lithuania (32%), Estonia (31%), Germany and Bulgaria (both 30%). In the case of
Lithuania and Estonia, this may be linked to perceived improvements in road transport,
with at least six out of ten in each country saying it had improved. The same is not true,
however, for Germany, where 59% said the quality of road transport had deteriorated
over the last five years.
Overall, at least one in ten vehicle users in each Member State said nothing would
encourage them to use public transport more often, with those in Sweden and Belgium
the least likely to say this (both 12%).
SPECIAL EUROBAROMETER 422a “Quality of transport”
22
Base: respondents who use a car or a motorbike
as a main of mode transport (N=15,761)
SPECIAL EUROBAROMETER 422a “Quality of transport”
23
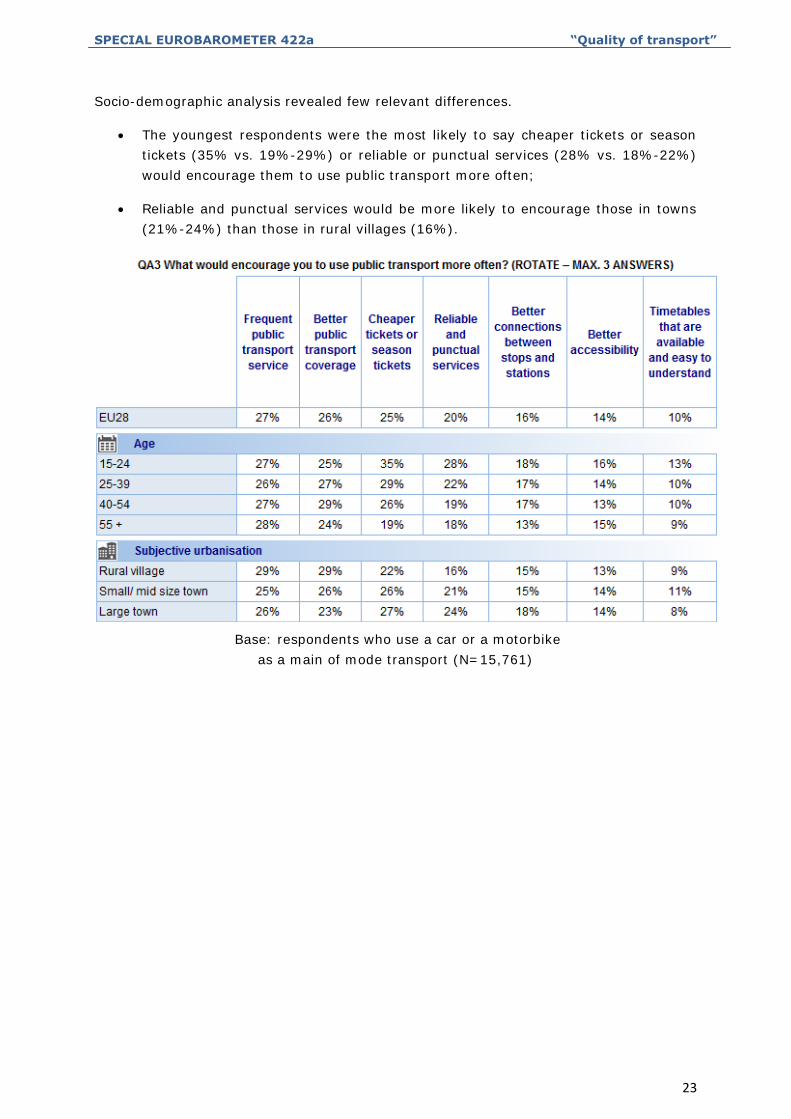
Socio-demographic analysis revealed few relevant differences.
The youngest respondents were the most likely to say cheaper tickets or season
tickets (35% vs. 19%-29%) or reliable or punctual services (28% vs. 18%-22%)
would encourage them to use public transport more often;
Reliable and punctual services would be more likely to encourage those in towns
(21%-24%) than those in rural villages (16%).
Base: respondents who use a car or a motorbike
as a main of mode transport (N=15,761)
SPECIAL EUROBAROMETER 422a “Quality of transport”
24
2. TRANSPORT HABITS WHEN MAKING LONG JOURNEYS
WITHIN THE EU
2.1. FREQUENCY OF LONG JOURNEYS
- Almost six out of ten made at least one journey of 300 km or more within the
EU in the last 12 months –
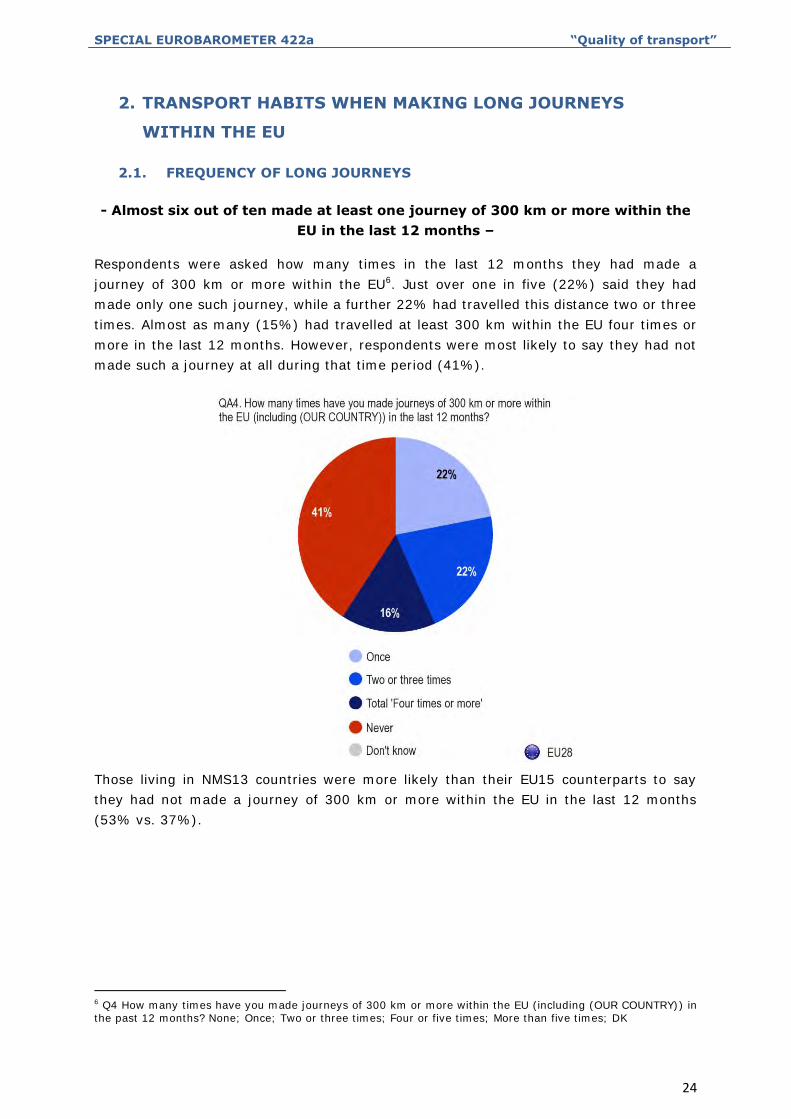
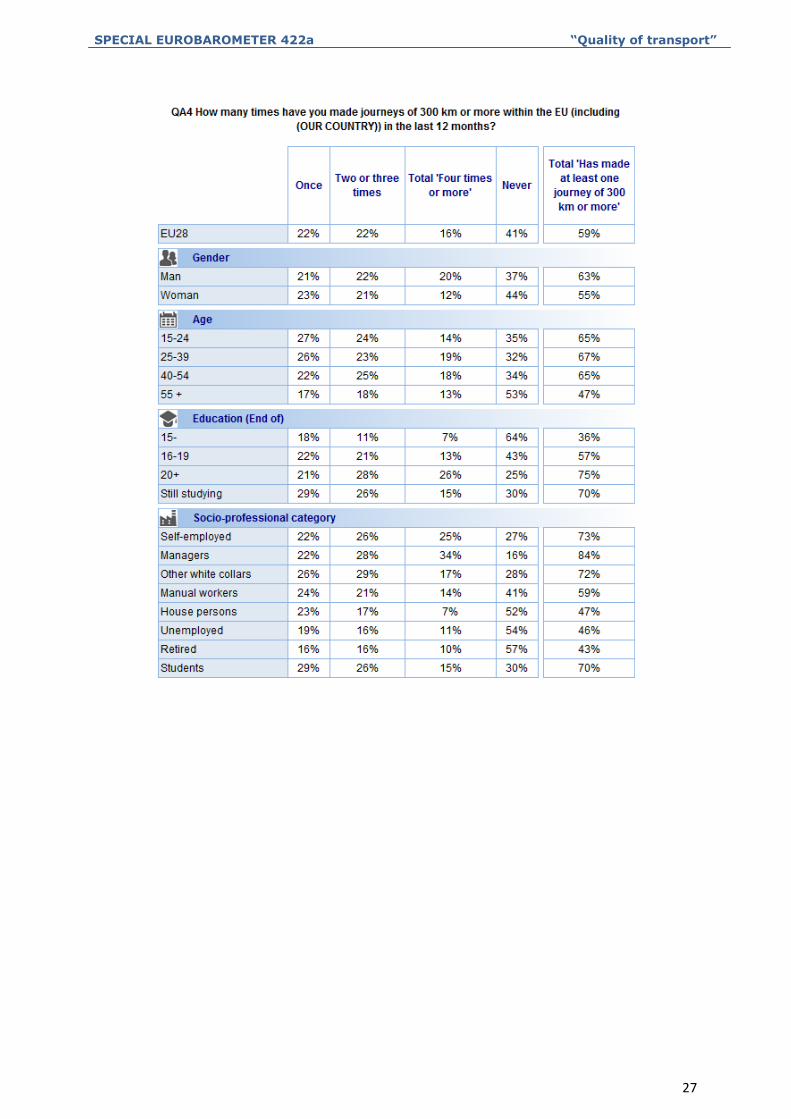
Respondents were asked how many times in the last 12 months they had made a
journey of 300 km or more within the EU6. Just over one in five (22%) said they had
made only one such journey, while a further 22% had travelled this distance two or three
times. Almost as many (15%) had travelled at least 300 km within the EU four times or
more in the last 12 months. However, respondents were most likely to say they had not
made such a journey at all during that time period (41%).
Those living in NMS13 countries were more likely than their EU15 counterparts to say
they had not made a journey of 300 km or more within the EU in the last 12 months
(53% vs. 37%).
6 Q4 How many times have you made journeys of 300 km or more within the EU (including (OUR COUNTRY)) in the past 12 months? None; Once; Two or three times; Four or five times; More than five times; DK
SPECIAL EUROBAROMETER 422a “Quality of transport”
25
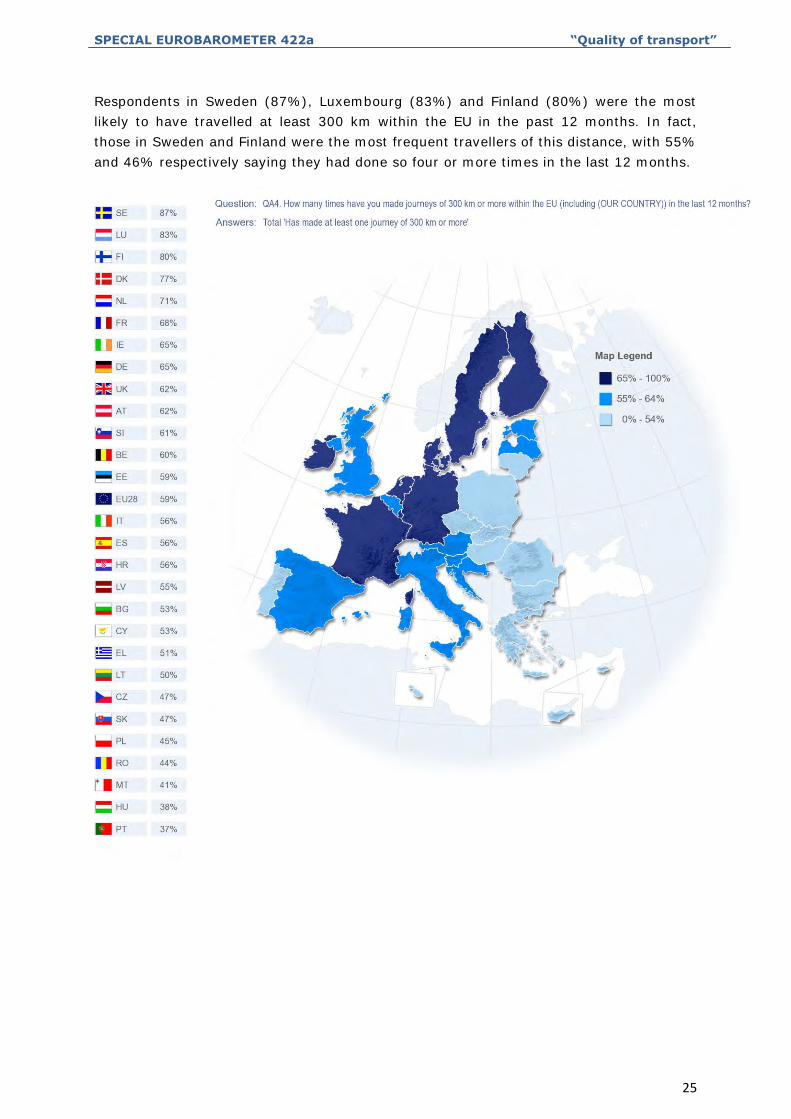
Respondents in Sweden (87%), Luxembourg (83%) and Finland (80%) were the most
likely to have travelled at least 300 km within the EU in the past 12 months. In fact,
those in Sweden and Finland were the most frequent travellers of this distance, with 55%
and 46% respectively saying they had done so four or more times in the last 12 months.
SPECIAL EUROBAROMETER 422a “Quality of transport”
26
The socio-demographic analysis highlighted several differences:
Women were more likely than men to say they had not made a journey of 300 km
or more within the EU in the last 12 months (44% vs. 37%). Men, on the other
hand, were more likely to have made such a journey four times or more (20% vs.
12%);
Respondents aged 55+ were the most likely to say they had not made such a
journey in the last 12 months (53% vs. 32%-35%), and the least likely to have
made such a journey one (17%), two or three times (18%);
The longer a respondent remained in education, the more likely they were to say
they had made at least two journeys of 300 km or more within the EU in the last
12 months. For example 26% of those with the highest education levels had made
four or more such journeys, compared to 13% of those who finished education
aged 16-19, and 7% of those with the lowest education levels;
Managers were the most likely to have made at least one journey of 300 km or
more within the EU in the last 12 months (84% vs. 43%-73%).
SPECIAL EUROBAROMETER 422a “Quality of transport”
27
SPECIAL EUROBAROMETER 422a “Quality of transport”
28
2.2. THE MOST FREQUENTLY USED MODES OF TRANSPORT FOR LONG
JOURNEYS
- Cars or campervans were the most popular mode of transport for journeys of
at least 300 km within the EU -
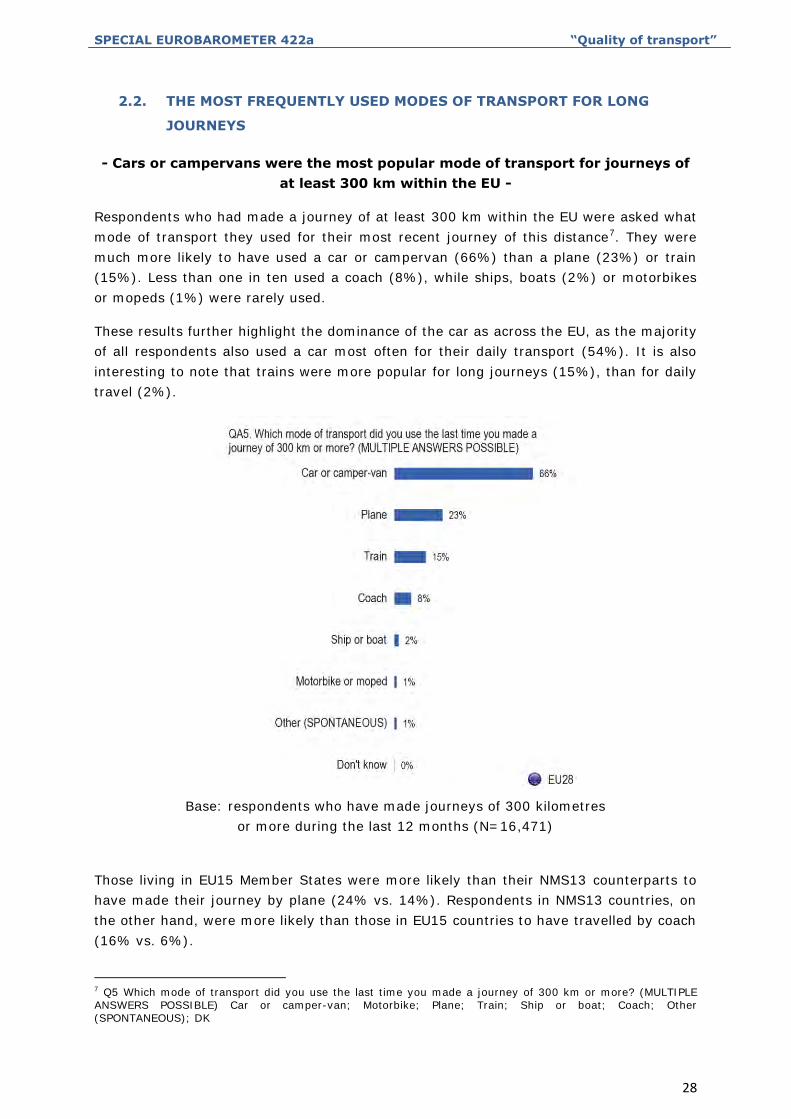
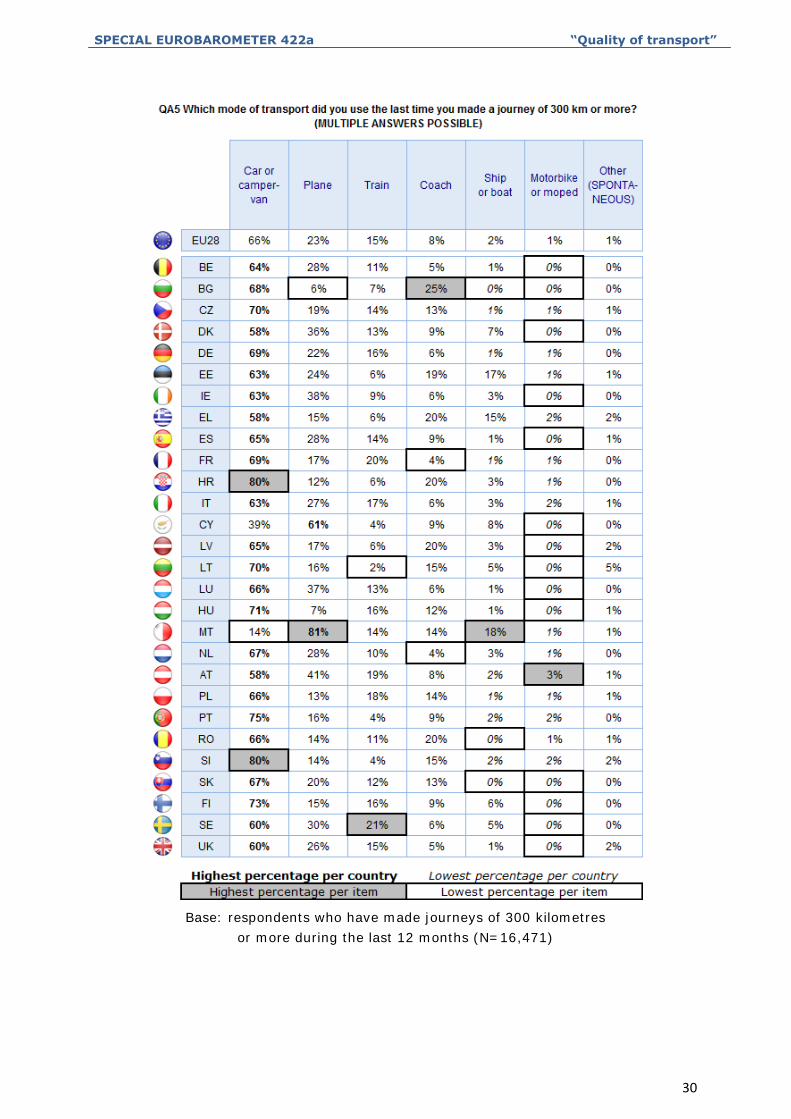
Respondents who had made a journey of at least 300 km within the EU were asked what
mode of transport they used for their most recent journey of this distance7. They were
much more likely to have used a car or campervan (66%) than a plane (23%) or train
(15%). Less than one in ten used a coach (8%), while ships, boats (2%) or motorbikes
or mopeds (1%) were rarely used.
These results further highlight the dominance of the car as across the EU, as the majority
of all respondents also used a car most often for their daily transport (54%). It is also
interesting to note that trains were more popular for long journeys (15%), than for daily
travel (2%).
Base: respondents who have made journeys of 300 kilometres
or more during the last 12 months (N=16,471)
Those living in EU15 Member States were more likely than their NMS13 counterparts to
have made their journey by plane (24% vs. 14%). Respondents in NMS13 countries, on
the other hand, were more likely than those in EU15 countries to have travelled by coach
(16% vs. 6%).
7 Q5 Which mode of transport did you use the last time you made a journey of 300 km or more? (MULTIPLE ANSWERS POSSIBLE) Car or camper-van; Motorbike; Plane; Train; Ship or boat; Coach; Other (SPONTANEOUS); DK
SPECIAL EUROBAROMETER 422a “Quality of transport”
29
In all but two Member States at least half of all the respondents who had made a journey
of at least 300 km within the EU used a car or campervan, with respondents in
Slovenia, Croatia (both 80%) and Portugal (75%) the most likely to have done so. The
exceptions were Cyprus (39%) and Malta (14%). Given these are both islands it is likely
that these modes of transport were used in conjunction with either a plane or ship or
boat, as this question allowed for multiple responses.
In these two member States respondents were much more likely to have used a plane
(MT: 81%, CY: 61%) – not surprising given these are both islands. In fact respondents in
these two countries were the most likely to mention plane, and Malta and Cyprus only
countries where at least half of all respondents did so. Respondents in Malta (18%) were
also the most likely to have used a ship or boat, followed by those in Estonia (17%) and
Greece (15%).
Across the EU, respondents in Sweden (21%) and France (20%) were the most likely to
have used a train, particularly compared to those in Lithuania (2%). Those in Bulgaria
(25%) were the most likely to have used a coach, with those in Austria the most likely
to have used a motorbike or moped (3%).
SPECIAL EUROBAROMETER 422a “Quality of transport”
30
Base: respondents who have made journeys of 300 kilometres
or more during the last 12 months (N=16,471)
SPECIAL EUROBAROMETER 422a “Quality of transport”
31
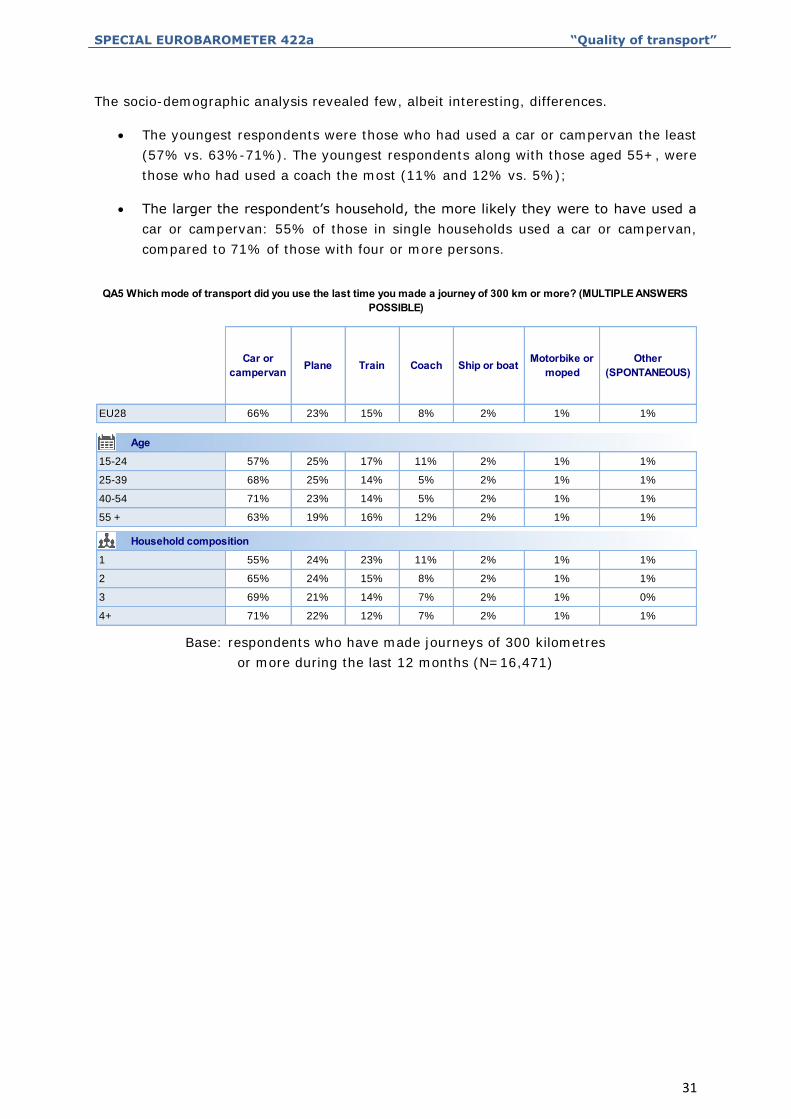
The socio-demographic analysis revealed few, albeit interesting, differences.
The youngest respondents were those who had used a car or campervan the least
(57% vs. 63%-71%). The youngest respondents along with those aged 55+, were
those who had used a coach the most (11% and 12% vs. 5%);
The larger the respondent’s household, the more likely they were to have used a
car or campervan: 55% of those in single households used a car or campervan,
compared to 71% of those with four or more persons.
Car or campervan Plane Train Coach Ship or boat Motorbike or
mopedOther
(SPONTANEOUS)
EU28 66% 23% 15% 8% 2% 1% 1%
15-24 57% 25% 17% 11% 2% 1% 1%
25-39 68% 25% 14% 5% 2% 1% 1%
40-54 71% 23% 14% 5% 2% 1% 1%
55 + 63% 19% 16% 12% 2% 1% 1%
1 55% 24% 23% 11% 2% 1% 1%
2 65% 24% 15% 8% 2% 1% 1%
3 69% 21% 14% 7% 2% 1% 0%
4+ 71% 22% 12% 7% 2% 1% 1%
QA5 Which mode of transport did you use the last time you made a journey of 300 km or more? (MULTIPLE ANSWERS POSSIBLE)
Age
Household composition
Base: respondents who have made journeys of 300 kilometres
or more during the last 12 months (N=16,471)
SPECIAL EUROBAROMETER 422a “Quality of transport”
32
2.3. REASONS FOR USING THE RESPECTIVE MODES OF TRANSPORT WHEN
MAKING LONG JOURNEYS
- Convenience was by far the most common reason for choosing a particular
transport option for a journey of at least 300 km -
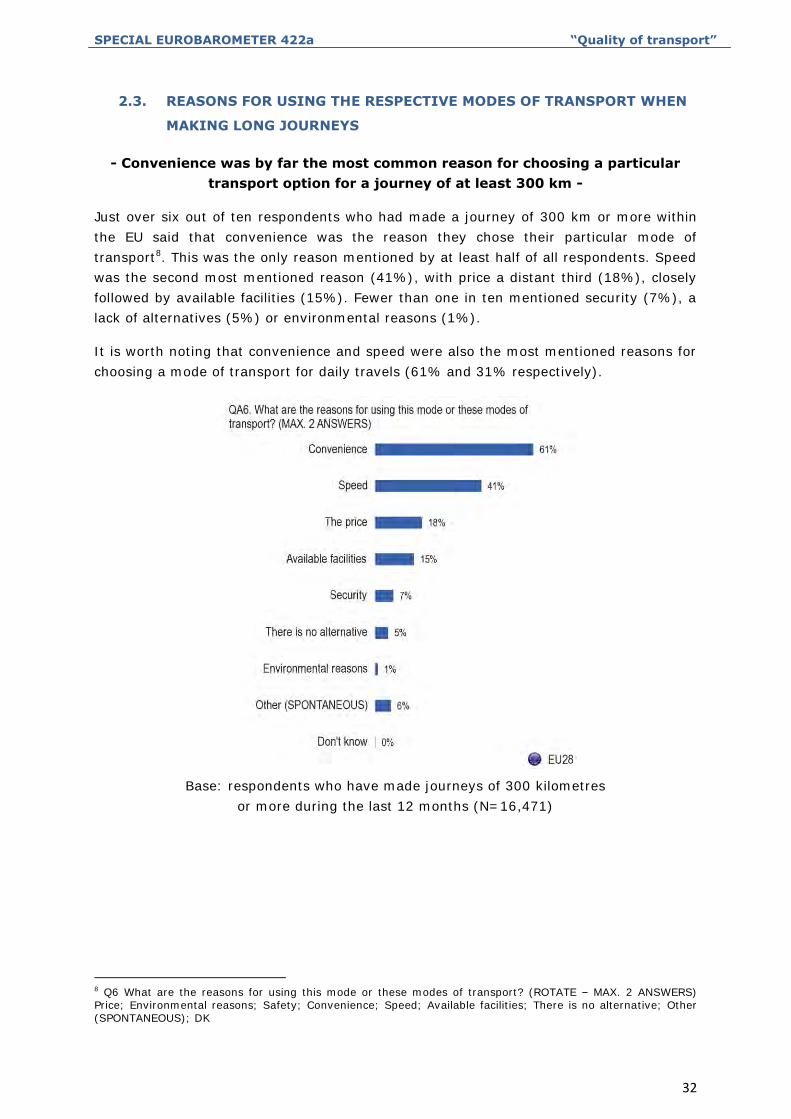
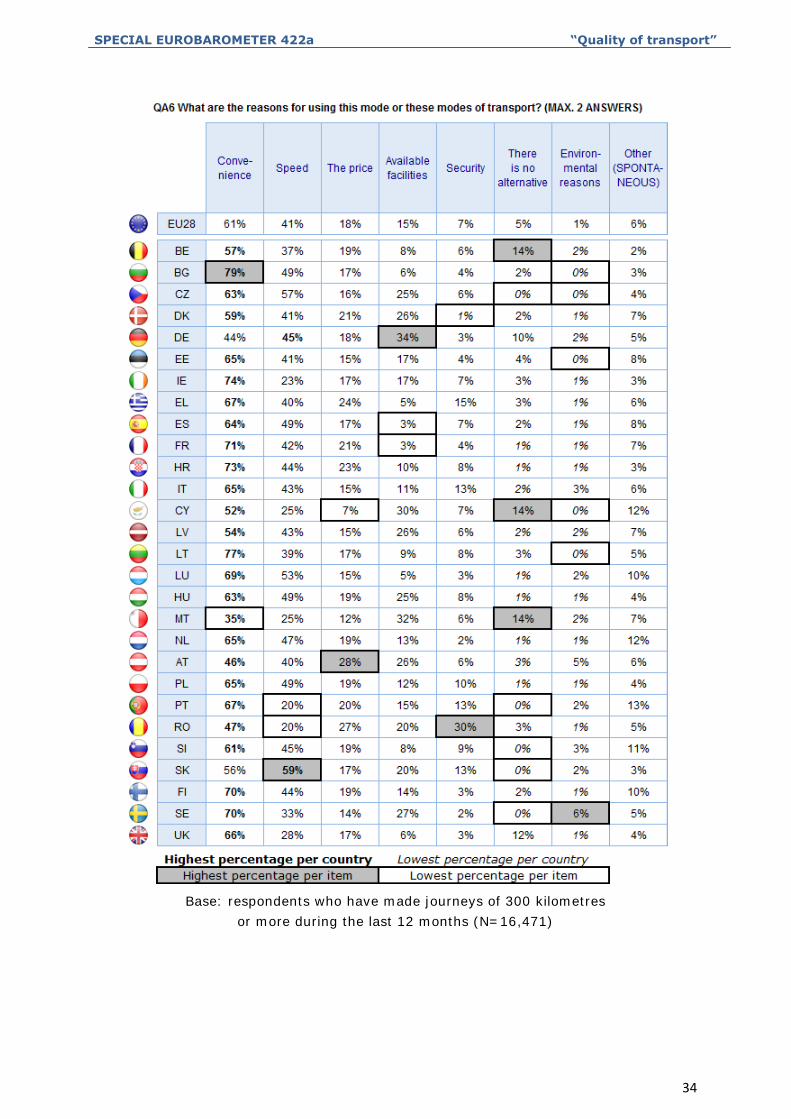
Just over six out of ten respondents who had made a journey of 300 km or more within
the EU said that convenience was the reason they chose their particular mode of
transport8. This was the only reason mentioned by at least half of all respondents. Speed
was the second most mentioned reason (41%), with price a distant third (18%), closely
followed by available facilities (15%). Fewer than one in ten mentioned security (7%), a
lack of alternatives (5%) or environmental reasons (1%).
It is worth noting that convenience and speed were also the most mentioned reasons for
choosing a mode of transport for daily travels (61% and 31% respectively).
Base: respondents who have made journeys of 300 kilometres
or more during the last 12 months (N=16,471)
8 Q6 What are the reasons for using this mode or these modes of transport? (ROTATE – MAX. 2 ANSWERS) Price; Environmental reasons; Safety; Convenience; Speed; Available facilities; There is no alternative; Other (SPONTANEOUS); DK
SPECIAL EUROBAROMETER 422a “Quality of transport”
33
At least half of all respondents in 24 Member States said convenience was the reason
they chose a particular mode of transport for their journey of 300 km or more within the
EU. Convenience was the most mentioned answer given by respondents in Bulgaria
(79%), Lithuania (77%), Ireland (74%) and Croatia (73%). Romania (47%), Austria
(46%), Germany (44%) and Malta (35%) were the only Member States where fewer
than half mentioned convenience.
Respondents in Slovakia mentioned speed the most as the reason for their choice of
transport, although it was only slightly more mentioned than convenience (59% vs.
56%). Speed was also the most mentioned reason in Germany (45%), and was also
widely mentioned by respondents in the Czech Republic (57%) and Luxembourg (53%).
Respondents in Portugal and Romania were the least likely to mention speed as a reason
for their chosen mode of transport (both 20%).
In seven Member States, at least one in five respondents mentioned price, with those in
Austria (28%) and Romania (27%) the most likely to do so. This compares to just 7% in
Cyprus.
Respondents in Germany (34%), Malta (32%) and Cyprus (30%) mentioned available
facilities the most, compared to just 3% in France and Spain.
Security was mentioned more as a reason by respondents in Romania than in any other
Member State (30% vs. 1%-15%).
Respondents in Cyprus, Malta and Belgium (all 14%) were the most likely to say there
was no alternative to their chosen mode of transport.
Respondents in Sweden and Austria were the most likely across the EU to say they made
their choice for environmental reasons (6% and 5% respectively).
SPECIAL EUROBAROMETER 422a “Quality of transport”
34
Base: respondents who have made journeys of 300 kilometres
or more during the last 12 months (N=16,471)
SPECIAL EUROBAROMETER 422a “Quality of transport”
35
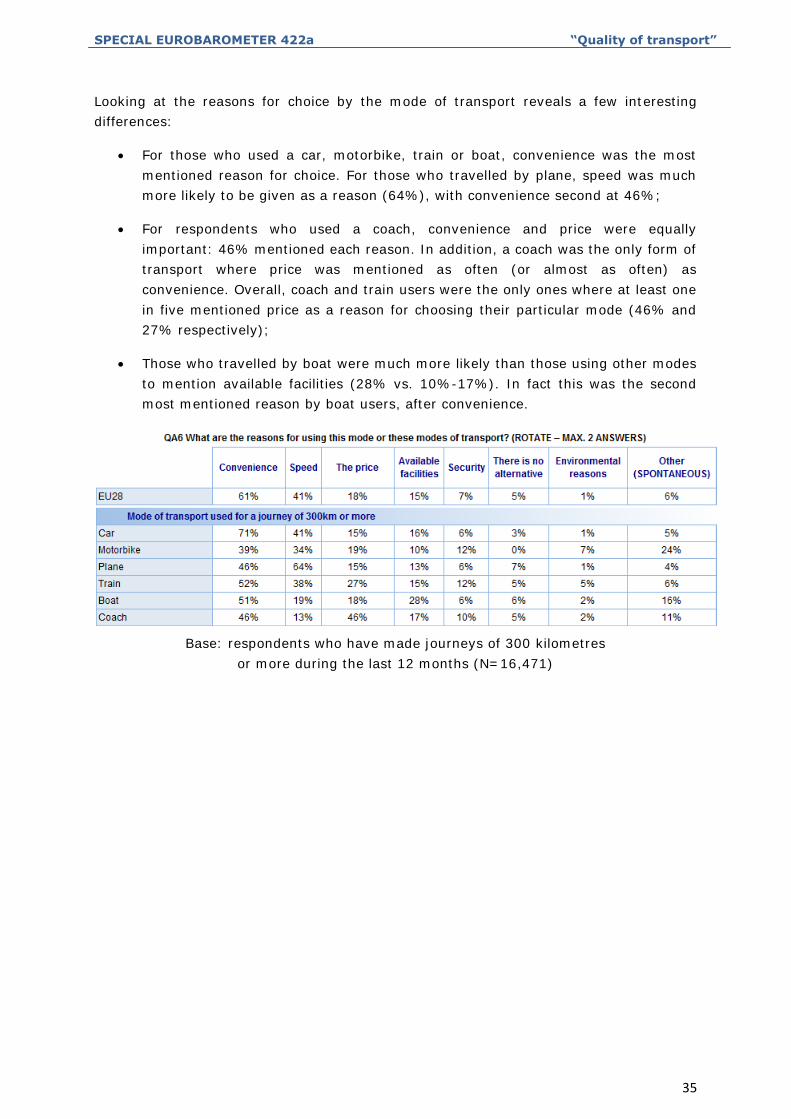
Looking at the reasons for choice by the mode of transport reveals a few interesting
differences:
For those who used a car, motorbike, train or boat, convenience was the most
mentioned reason for choice. For those who travelled by plane, speed was much
more likely to be given as a reason (64%), with convenience second at 46%;
For respondents who used a coach, convenience and price were equally
important: 46% mentioned each reason. In addition, a coach was the only form of
transport where price was mentioned as often (or almost as often) as
convenience. Overall, coach and train users were the only ones where at least one
in five mentioned price as a reason for choosing their particular mode (46% and
27% respectively);
Those who travelled by boat were much more likely than those using other modes
to mention available facilities (28% vs. 10%-17%). In fact this was the second
most mentioned reason by boat users, after convenience.
Base: respondents who have made journeys of 300 kilometres
or more during the last 12 months (N=16,471)
SPECIAL EUROBAROMETER 422a “Quality of transport”
36
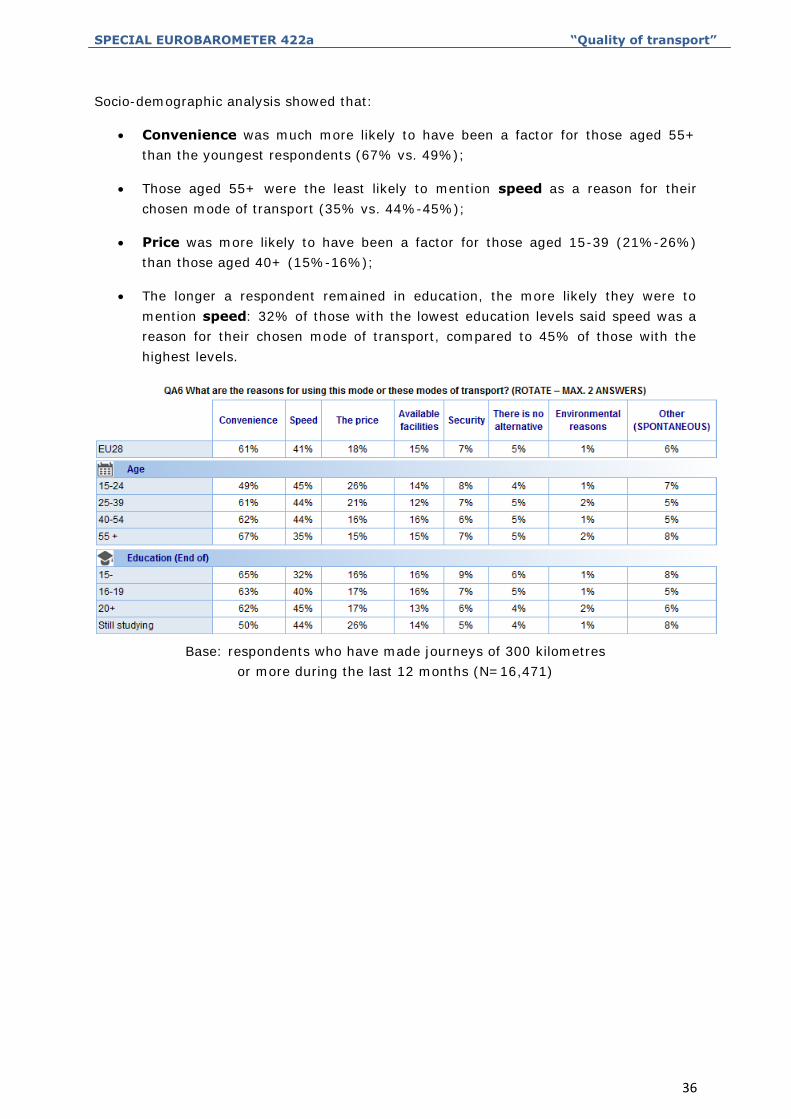
Socio-demographic analysis showed that:
Convenience was much more likely to have been a factor for those aged 55+
than the youngest respondents (67% vs. 49%);
Those aged 55+ were the least likely to mention speed as a reason for their
chosen mode of transport (35% vs. 44%-45%);
Price was more likely to have been a factor for those aged 15-39 (21%-26%)
than those aged 40+ (15%-16%);
The longer a respondent remained in education, the more likely they were to
mention speed: 32% of those with the lowest education levels said speed was a
reason for their chosen mode of transport, compared to 45% of those with the
highest levels.
Base: respondents who have made journeys of 300 kilometres
or more during the last 12 months (N=16,471)
SPECIAL EUROBAROMETER 422a “Quality of transport”
37
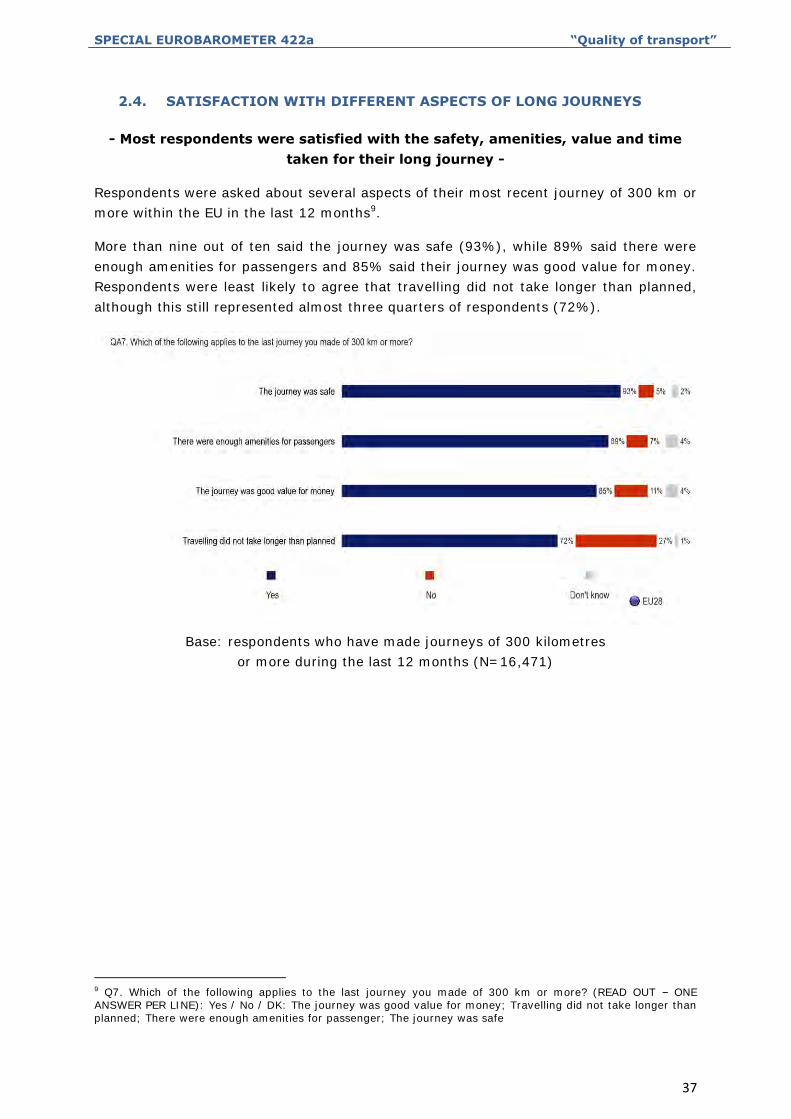
2.4. SATISFACTION WITH DIFFERENT ASPECTS OF LONG JOURNEYS
- Most respondents were satisfied with the safety, amenities, value and time
taken for their long journey -
Respondents were asked about several aspects of their most recent journey of 300 km or
more within the EU in the last 12 months9.
More than nine out of ten said the journey was safe (93%), while 89% said there were
enough amenities for passengers and 85% said their journey was good value for money.
Respondents were least likely to agree that travelling did not take longer than planned,
although this still represented almost three quarters of respondents (72%).
Base: respondents who have made journeys of 300 kilometres
or more during the last 12 months (N=16,471)
9 Q7. Which of the following applies to the last journey you made of 300 km or more? (READ OUT – ONE ANSWER PER LINE): Yes / No / DK: The journey was good value for money; Travelling did not take longer than planned; There were enough amenities for passenger; The journey was safe
SPECIAL EUROBAROMETER 422a “Quality of transport”
38
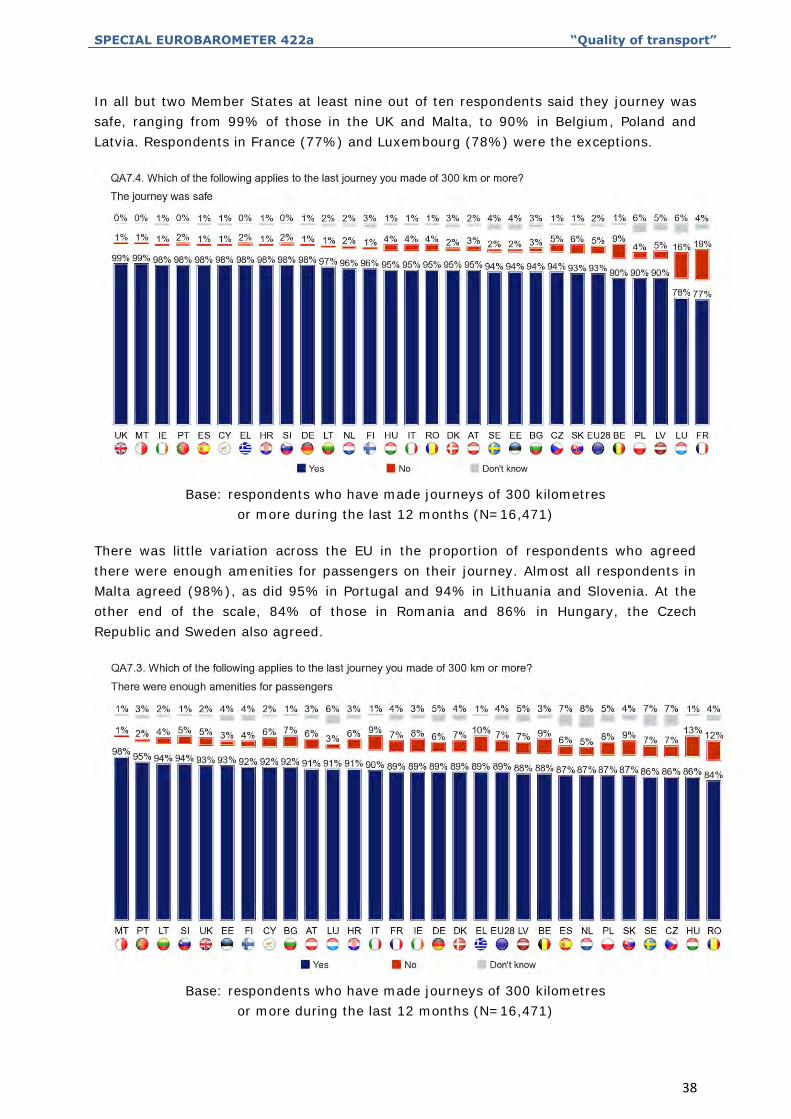
In all but two Member States at least nine out of ten respondents said they journey was
safe, ranging from 99% of those in the UK and Malta, to 90% in Belgium, Poland and
Latvia. Respondents in France (77%) and Luxembourg (78%) were the exceptions.
Base: respondents who have made journeys of 300 kilometres
or more during the last 12 months (N=16,471)
There was little variation across the EU in the proportion of respondents who agreed
there were enough amenities for passengers on their journey. Almost all respondents in
Malta agreed (98%), as did 95% in Portugal and 94% in Lithuania and Slovenia. At the
other end of the scale, 84% of those in Romania and 86% in Hungary, the Czech
Republic and Sweden also agreed.
Base: respondents who have made journeys of 300 kilometres
or more during the last 12 months (N=16,471)
SPECIAL EUROBAROMETER 422a “Quality of transport”
39
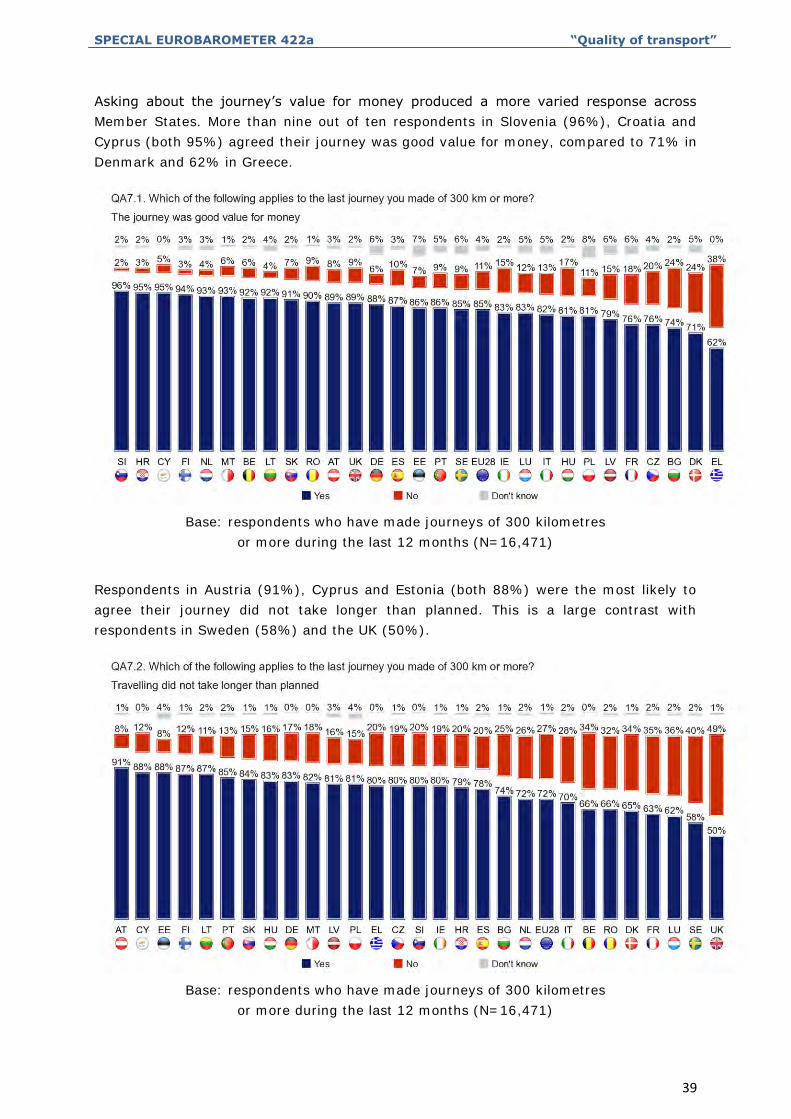
Asking about the journey’s value for money produced a more varied response across
Member States. More than nine out of ten respondents in Slovenia (96%), Croatia and
Cyprus (both 95%) agreed their journey was good value for money, compared to 71% in
Denmark and 62% in Greece.
Base: respondents who have made journeys of 300 kilometres
or more during the last 12 months (N=16,471)
Respondents in Austria (91%), Cyprus and Estonia (both 88%) were the most likely to
agree their journey did not take longer than planned. This is a large contrast with
respondents in Sweden (58%) and the UK (50%).
Base: respondents who have made journeys of 300 kilometres
or more during the last 12 months (N=16,471)
SPECIAL EUROBAROMETER 422a “Quality of transport”
40
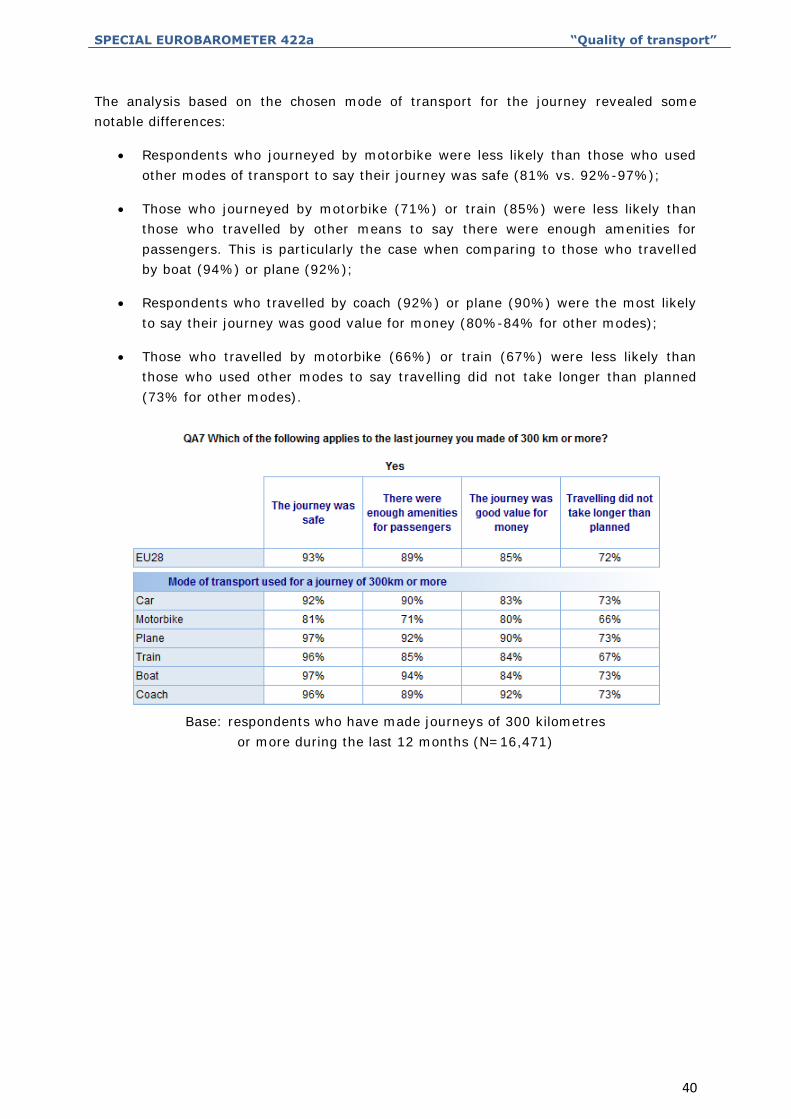
The analysis based on the chosen mode of transport for the journey revealed some
notable differences:
Respondents who journeyed by motorbike were less likely than those who used
other modes of transport to say their journey was safe (81% vs. 92%-97%);
Those who journeyed by motorbike (71%) or train (85%) were less likely than
those who travelled by other means to say there were enough amenities for
passengers. This is particularly the case when comparing to those who travelled
by boat (94%) or plane (92%);
Respondents who travelled by coach (92%) or plane (90%) were the most likely
to say their journey was good value for money (80%-84% for other modes);
Those who travelled by motorbike (66%) or train (67%) were less likely than
those who used other modes to say travelling did not take longer than planned
(73% for other modes).
Base: respondents who have made journeys of 300 kilometres
or more during the last 12 months (N=16,471)
SPECIAL EUROBAROMETER 422a “Quality of transport”
41
3. PERCEPTION OF THE QUALITY OF DIFFERENT MEANS OF
TRANSPORT OVER RECENT YEARS
- At least one third said road, air and rail transport had improved in the last five
years -
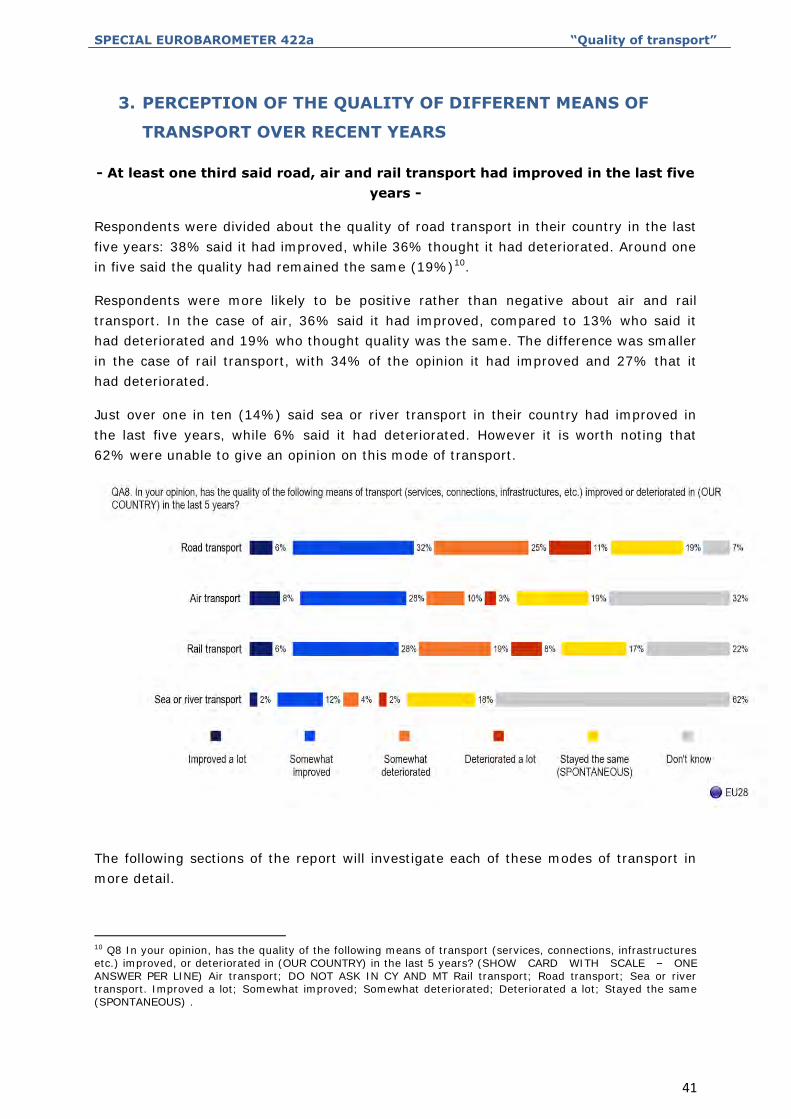
Respondents were divided about the quality of road transport in their country in the last
five years: 38% said it had improved, while 36% thought it had deteriorated. Around one
in five said the quality had remained the same (19%)10.
Respondents were more likely to be positive rather than negative about air and rail
transport. In the case of air, 36% said it had improved, compared to 13% who said it
had deteriorated and 19% who thought quality was the same. The difference was smaller
in the case of rail transport, with 34% of the opinion it had improved and 27% that it
had deteriorated.
Just over one in ten (14%) said sea or river transport in their country had improved in
the last five years, while 6% said it had deteriorated. However it is worth noting that
62% were unable to give an opinion on this mode of transport.
The following sections of the report will investigate each of these modes of transport in
more detail.
10 Q8 In your opinion, has the quality of the following means of transport (services, connections, infrastructures etc.) improved, or deteriorated in (OUR COUNTRY) in the last 5 years? (SHOW CARD WITH SCALE – ONE ANSWER PER LINE) Air transport; DO NOT ASK IN CY AND MT Rail transport; Road transport; Sea or river transport. Improved a lot; Somewhat improved; Somewhat deteriorated; Deteriorated a lot; Stayed the same (SPONTANEOUS) .
SPECIAL EUROBAROMETER 422a “Quality of transport”
42
4. ROAD TRANSPORT
4.1. PERCEPTIONS OF THE QUALITY OF ROAD TRANSPORT
- Opinion is divided over whether the quality of road transport has improved or
deteriorated in the last five years -
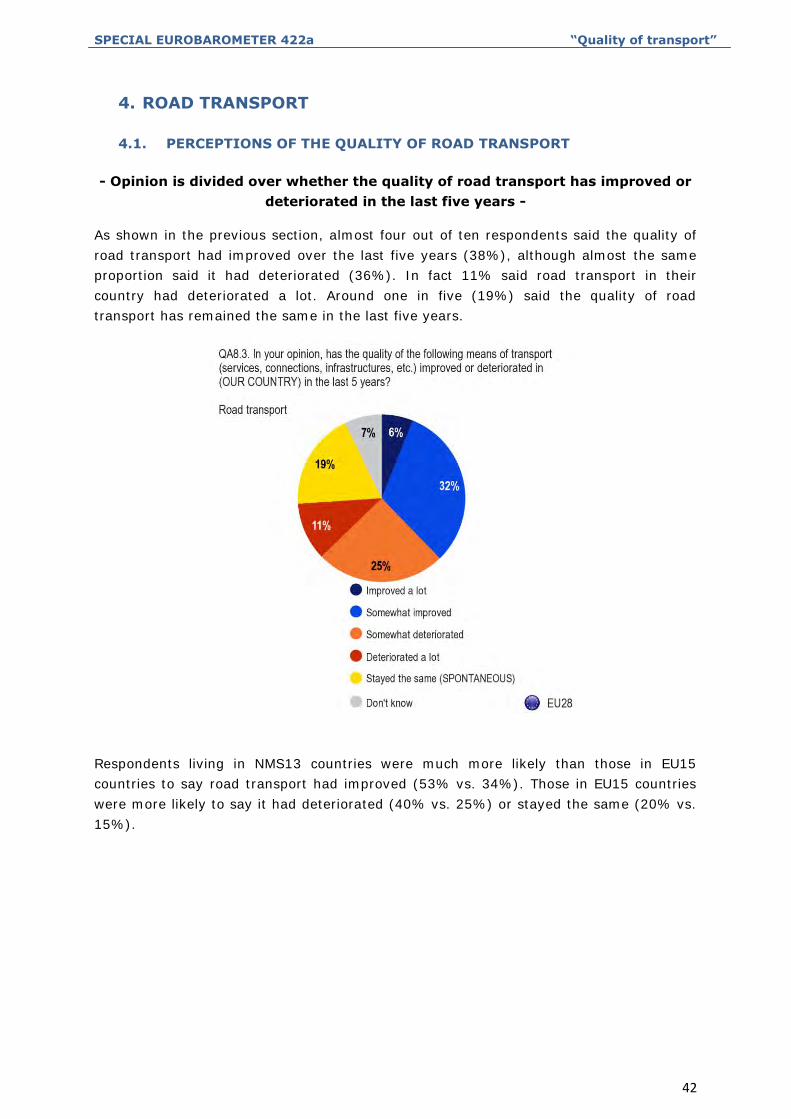
As shown in the previous section, almost four out of ten respondents said the quality of
road transport had improved over the last five years (38%), although almost the same
proportion said it had deteriorated (36%). In fact 11% said road transport in their
country had deteriorated a lot. Around one in five (19%) said the quality of road
transport has remained the same in the last five years.
Respondents living in NMS13 countries were much more likely than those in EU15
countries to say road transport had improved (53% vs. 34%). Those in EU15 countries
were more likely to say it had deteriorated (40% vs. 25%) or stayed the same (20% vs.
15%).
SPECIAL EUROBAROMETER 422a “Quality of transport”
43
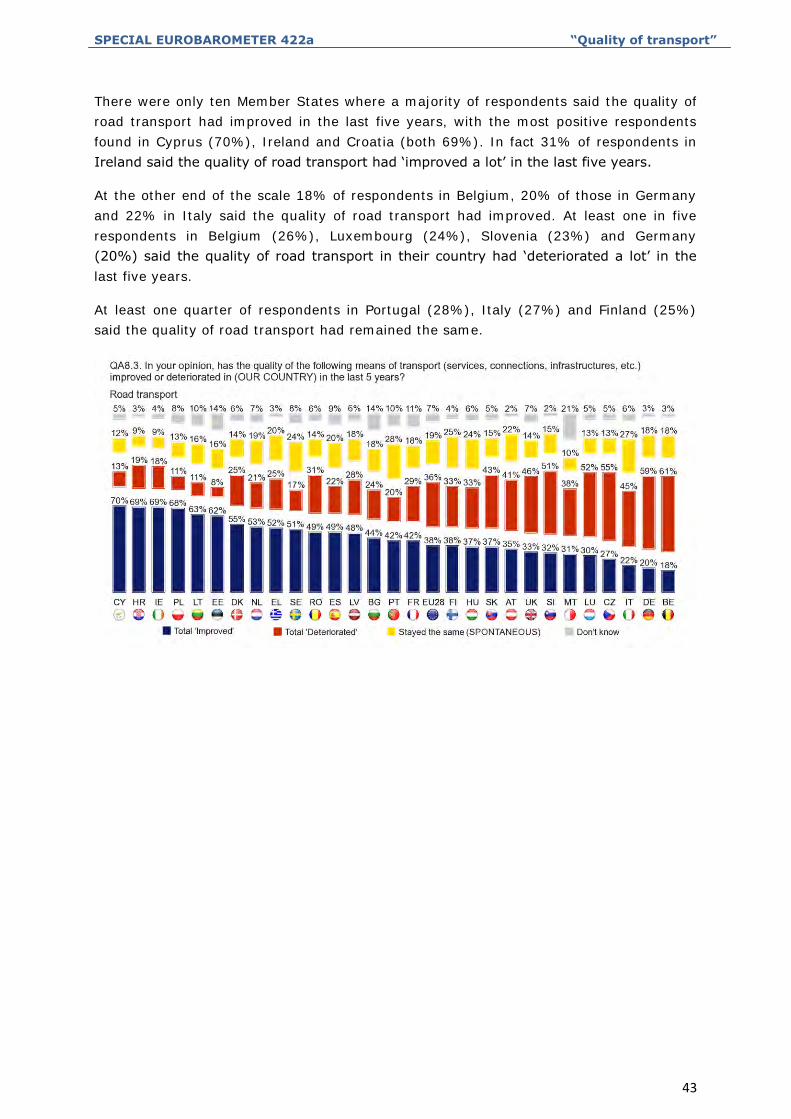
There were only ten Member States where a majority of respondents said the quality of
road transport had improved in the last five years, with the most positive respondents
found in Cyprus (70%), Ireland and Croatia (both 69%). In fact 31% of respondents in
Ireland said the quality of road transport had ‘improved a lot’ in the last five years.
At the other end of the scale 18% of respondents in Belgium, 20% of those in Germany
and 22% in Italy said the quality of road transport had improved. At least one in five
respondents in Belgium (26%), Luxembourg (24%), Slovenia (23%) and Germany
(20%) said the quality of road transport in their country had ‘deteriorated a lot’ in the
last five years.
At least one quarter of respondents in Portugal (28%), Italy (27%) and Finland (25%)
said the quality of road transport had remained the same.
SPECIAL EUROBAROMETER 422a “Quality of transport”
44
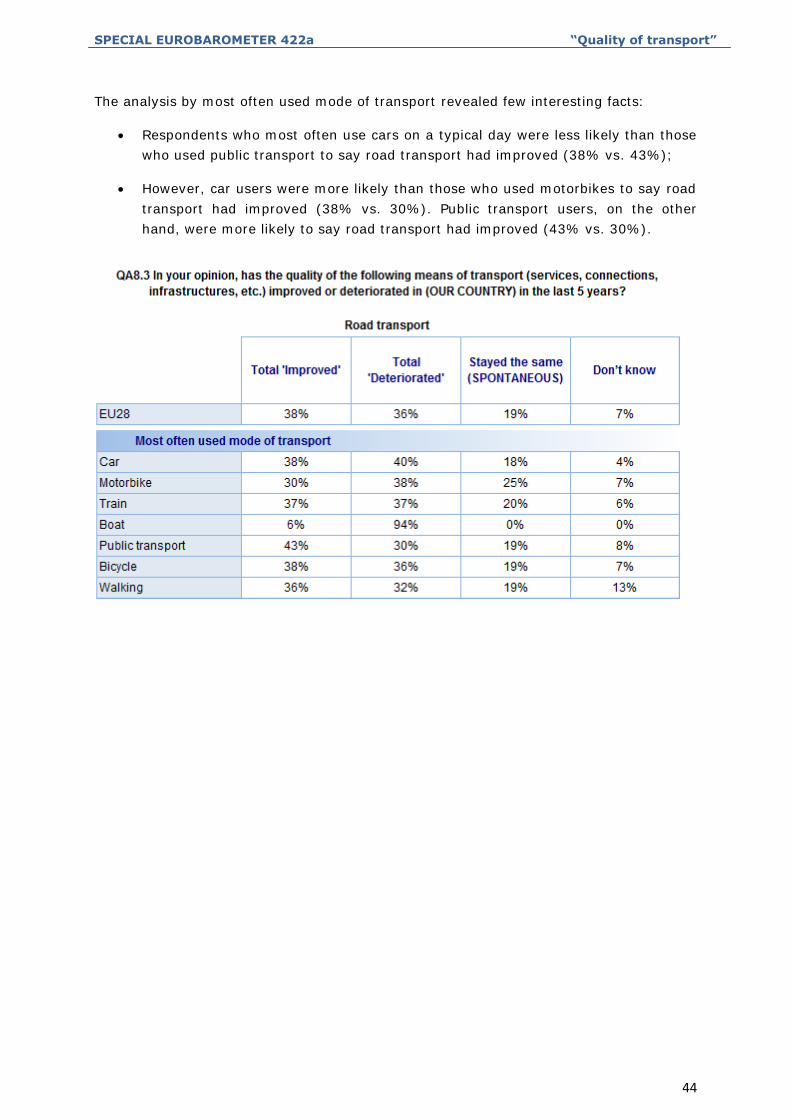
The analysis by most often used mode of transport revealed few interesting facts:
Respondents who most often use cars on a typical day were less likely than those
who used public transport to say road transport had improved (38% vs. 43%);
However, car users were more likely than those who used motorbikes to say road
transport had improved (38% vs. 30%). Public transport users, on the other
hand, were more likely to say road transport had improved (43% vs. 30%).
SPECIAL EUROBAROMETER 422a “Quality of transport”
45
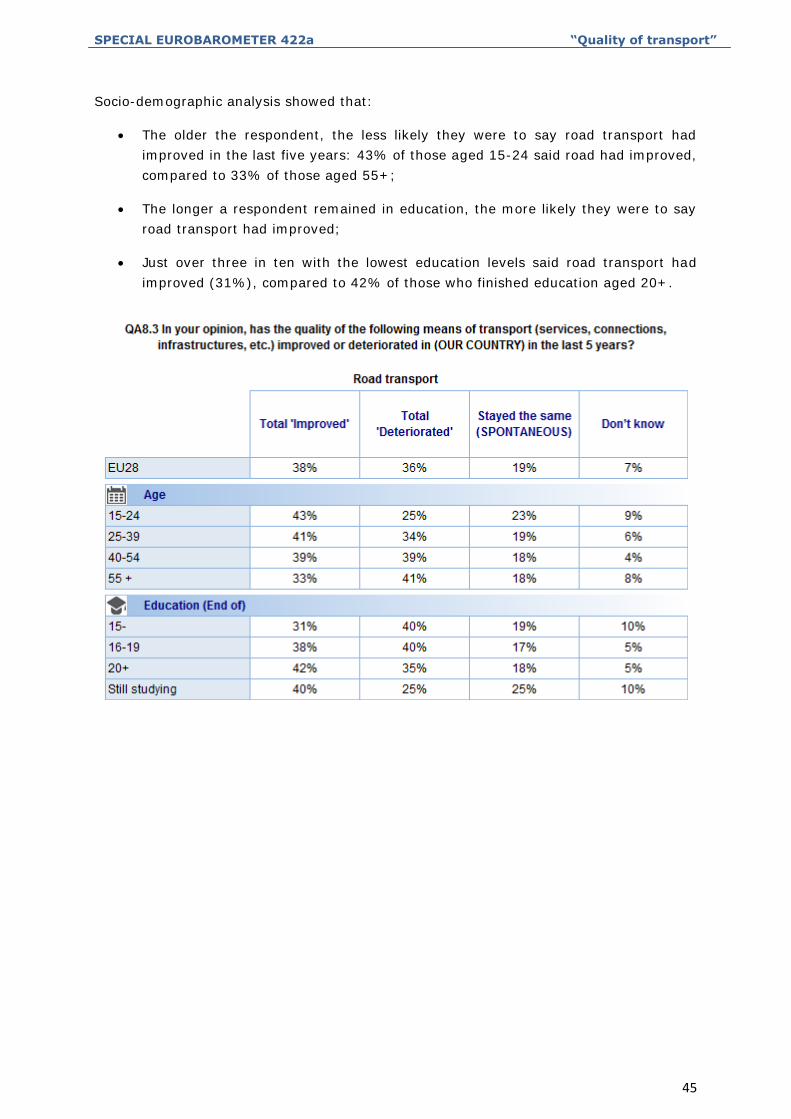
Socio-demographic analysis showed that:
The older the respondent, the less likely they were to say road transport had
improved in the last five years: 43% of those aged 15-24 said road had improved,
compared to 33% of those aged 55+;
The longer a respondent remained in education, the more likely they were to say
road transport had improved;
Just over three in ten with the lowest education levels said road transport had
improved (31%), compared to 42% of those who finished education aged 20+.
SPECIAL EUROBAROMETER 422a “Quality of transport”
46
4.2. THE MOST SERIOUS PROBLEMS AFFECTING ROADS
- The majority agreed congestion and maintenance are the most serious
problems for roads -
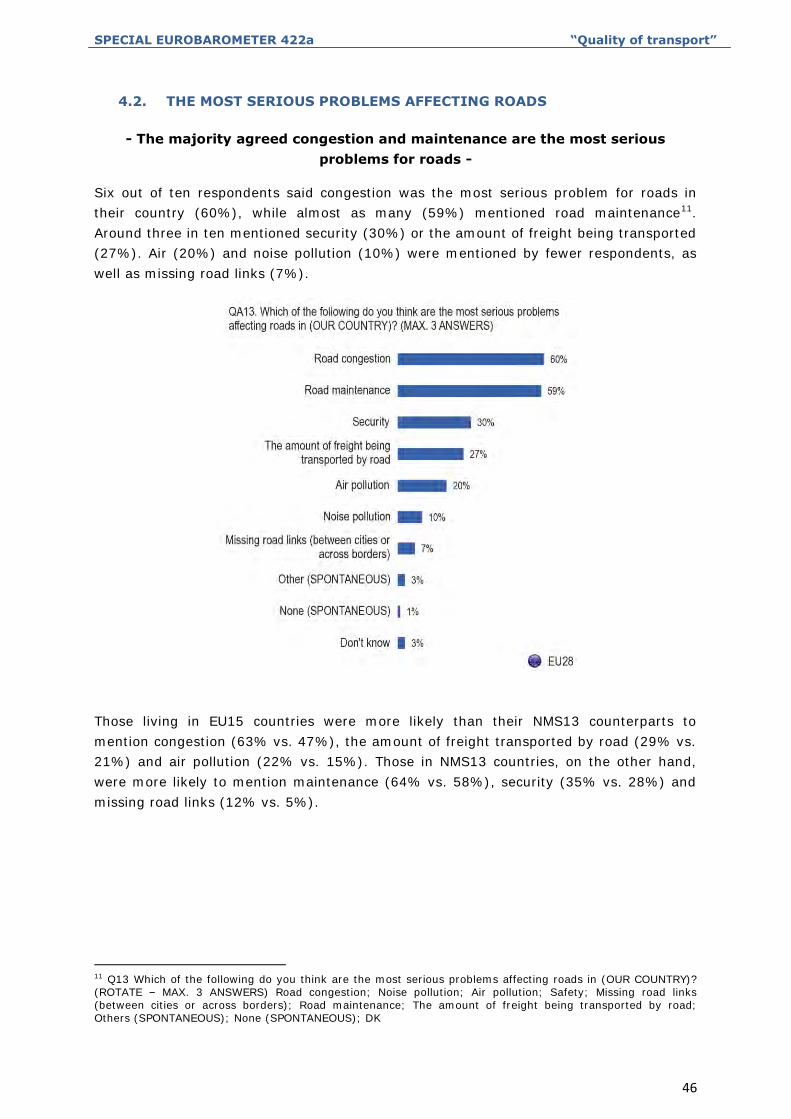
Six out of ten respondents said congestion was the most serious problem for roads in
their country (60%), while almost as many (59%) mentioned road maintenance11.
Around three in ten mentioned security (30%) or the amount of freight being transported
(27%). Air (20%) and noise pollution (10%) were mentioned by fewer respondents, as
well as missing road links (7%).
Those living in EU15 countries were more likely than their NMS13 counterparts to
mention congestion (63% vs. 47%), the amount of freight transported by road (29% vs.
21%) and air pollution (22% vs. 15%). Those in NMS13 countries, on the other hand,
were more likely to mention maintenance (64% vs. 58%), security (35% vs. 28%) and
missing road links (12% vs. 5%).
11 Q13 Which of the following do you think are the most serious problems affecting roads in (OUR COUNTRY)? (ROTATE – MAX. 3 ANSWERS) Road congestion; Noise pollution; Air pollution; Safety; Missing road links (between cities or across borders); Road maintenance; The amount of freight being transported by road; Others (SPONTANEOUS); None (SPONTANEOUS); DK
SPECIAL EUROBAROMETER 422a “Quality of transport”
47
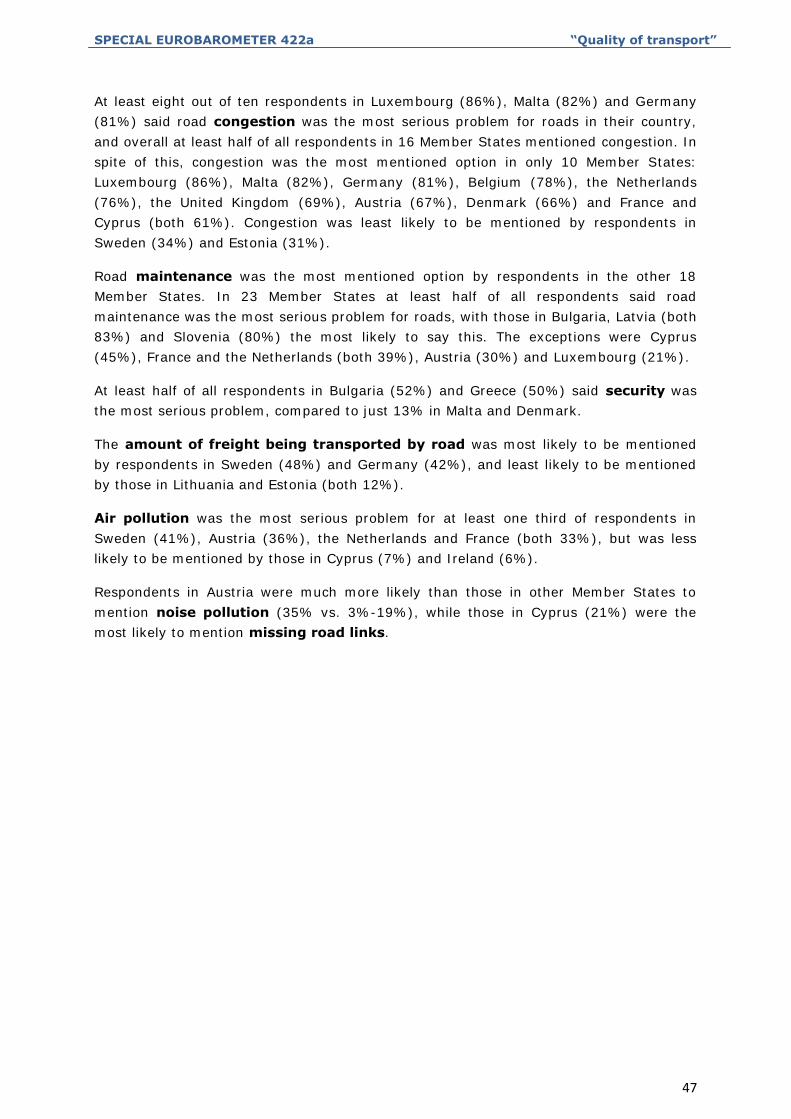
At least eight out of ten respondents in Luxembourg (86%), Malta (82%) and Germany
(81%) said road congestion was the most serious problem for roads in their country,
and overall at least half of all respondents in 16 Member States mentioned congestion. In
spite of this, congestion was the most mentioned option in only 10 Member States:
Luxembourg (86%), Malta (82%), Germany (81%), Belgium (78%), the Netherlands
(76%), the United Kingdom (69%), Austria (67%), Denmark (66%) and France and
Cyprus (both 61%). Congestion was least likely to be mentioned by respondents in
Sweden (34%) and Estonia (31%).
Road maintenance was the most mentioned option by respondents in the other 18
Member States. In 23 Member States at least half of all respondents said road
maintenance was the most serious problem for roads, with those in Bulgaria, Latvia (both
83%) and Slovenia (80%) the most likely to say this. The exceptions were Cyprus
(45%), France and the Netherlands (both 39%), Austria (30%) and Luxembourg (21%).
At least half of all respondents in Bulgaria (52%) and Greece (50%) said security was
the most serious problem, compared to just 13% in Malta and Denmark.
The amount of freight being transported by road was most likely to be mentioned
by respondents in Sweden (48%) and Germany (42%), and least likely to be mentioned
by those in Lithuania and Estonia (both 12%).
Air pollution was the most serious problem for at least one third of respondents in
Sweden (41%), Austria (36%), the Netherlands and France (both 33%), but was less
likely to be mentioned by those in Cyprus (7%) and Ireland (6%).
Respondents in Austria were much more likely than those in other Member States to
mention noise pollution (35% vs. 3%-19%), while those in Cyprus (21%) were the
most likely to mention missing road links.
SPECIAL EUROBAROMETER 422a “Quality of transport”
48
SPECIAL EUROBAROMETER 422a “Quality of transport”
49
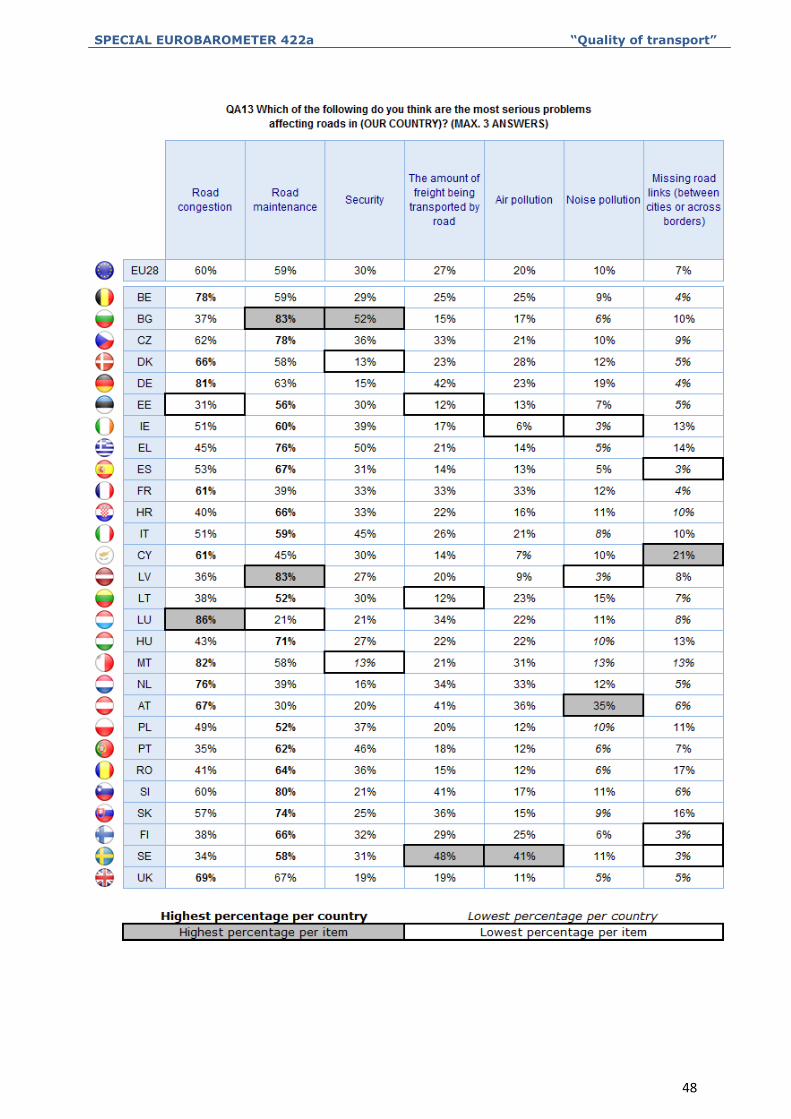
Respondents who chose different modes of daily transport had different perspectives on
the most serious problems affecting roads:
Train (65%), car (63%), bicycle (62%), and public transport (58%) users were
most likely to say congestion was the most serious problem;
Car users (62%) and public transport users (56%) were almost as likely to
mention road maintenance, while for motorbike users and those who walked
maintenance was the most serious problem affecting roads (64% and 56%
respectively);
Security was most likely to be mentioned by motorbike users and walkers (39%
and 34% respectively), while car, train and bicycle users were the most likely to
mention the amount of freight (31%-30% vs. 18%-22%);
Those who chose the bicycle or the train as their most often used mode of daily
transport were more likely than car or motorbike users, or walkers to say air
pollution was one of the most serious problems affecting roads (30% and 25%
vs. 19%).
SPECIAL EUROBAROMETER 422a “Quality of transport”
50
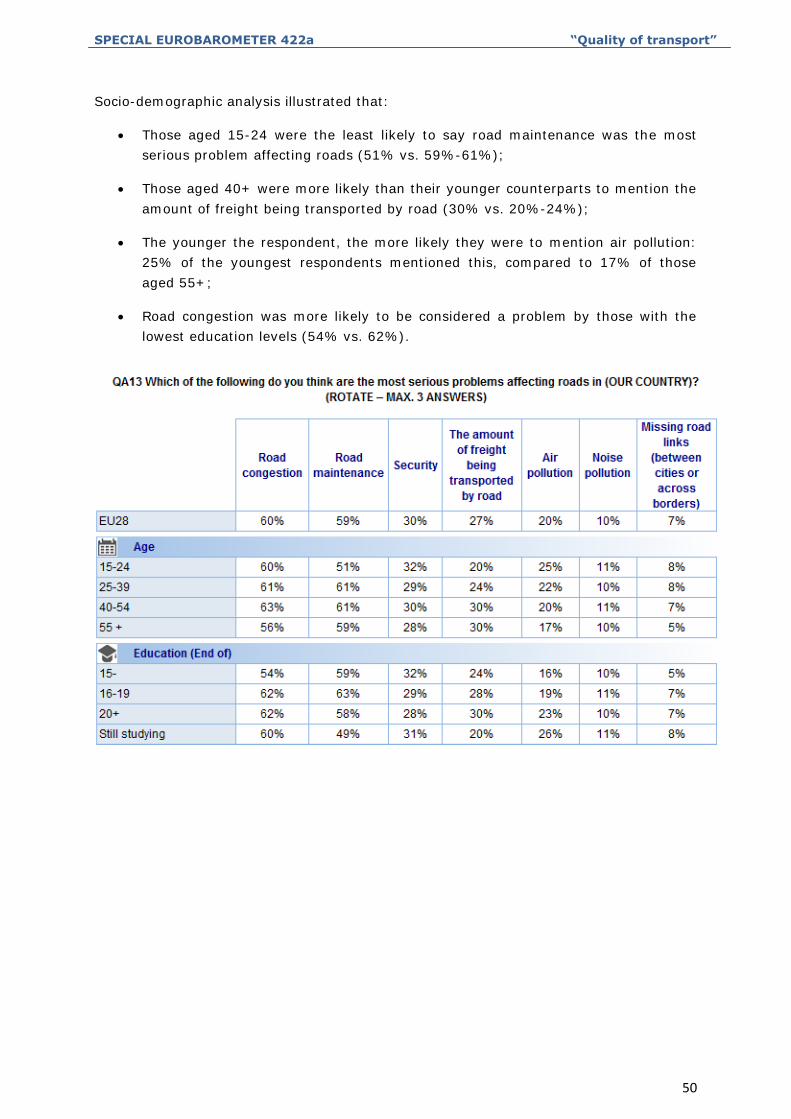
Socio-demographic analysis illustrated that:
Those aged 15-24 were the least likely to say road maintenance was the most
serious problem affecting roads (51% vs. 59%-61%);
Those aged 40+ were more likely than their younger counterparts to mention the
amount of freight being transported by road (30% vs. 20%-24%);
The younger the respondent, the more likely they were to mention air pollution:
25% of the youngest respondents mentioned this, compared to 17% of those
aged 55+;
Road congestion was more likely to be considered a problem by those with the
lowest education levels (54% vs. 62%).
SPECIAL EUROBAROMETER 422a “Quality of transport”
51
4.3. PRIORITIES FOR IMPROVING SAFETY ON ROADS
- Improved road maintenance should be the priority for improving safety on
roads -
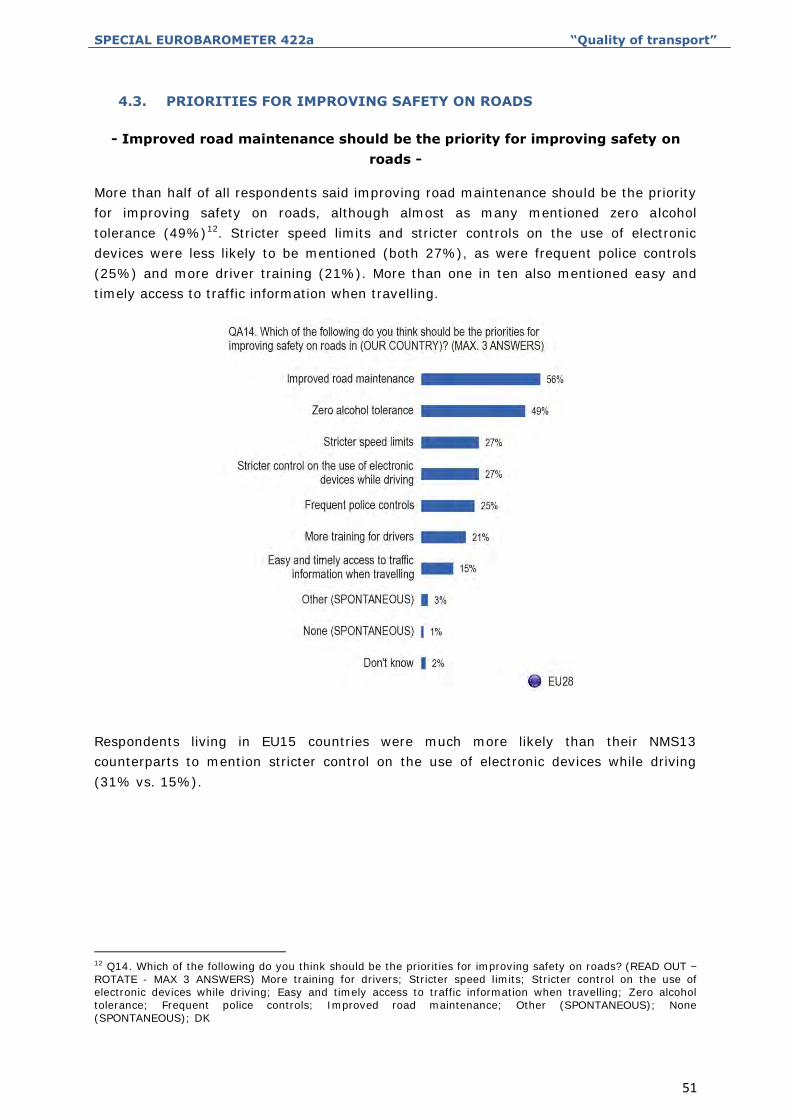
More than half of all respondents said improving road maintenance should be the priority
for improving safety on roads, although almost as many mentioned zero alcohol
tolerance (49%)12. Stricter speed limits and stricter controls on the use of electronic
devices were less likely to be mentioned (both 27%), as were frequent police controls
(25%) and more driver training (21%). More than one in ten also mentioned easy and
timely access to traffic information when travelling.
Respondents living in EU15 countries were much more likely than their NMS13
counterparts to mention stricter control on the use of electronic devices while driving
(31% vs. 15%).
12 Q14. Which of the following do you think should be the priorities for improving safety on roads? (READ OUT – ROTATE - MAX 3 ANSWERS) More training for drivers; Stricter speed limits; Stricter control on the use of electronic devices while driving; Easy and timely access to traffic information when travelling; Zero alcohol tolerance; Frequent police controls; Improved road maintenance; Other (SPONTANEOUS); None (SPONTANEOUS); DK
SPECIAL EUROBAROMETER 422a “Quality of transport”
52
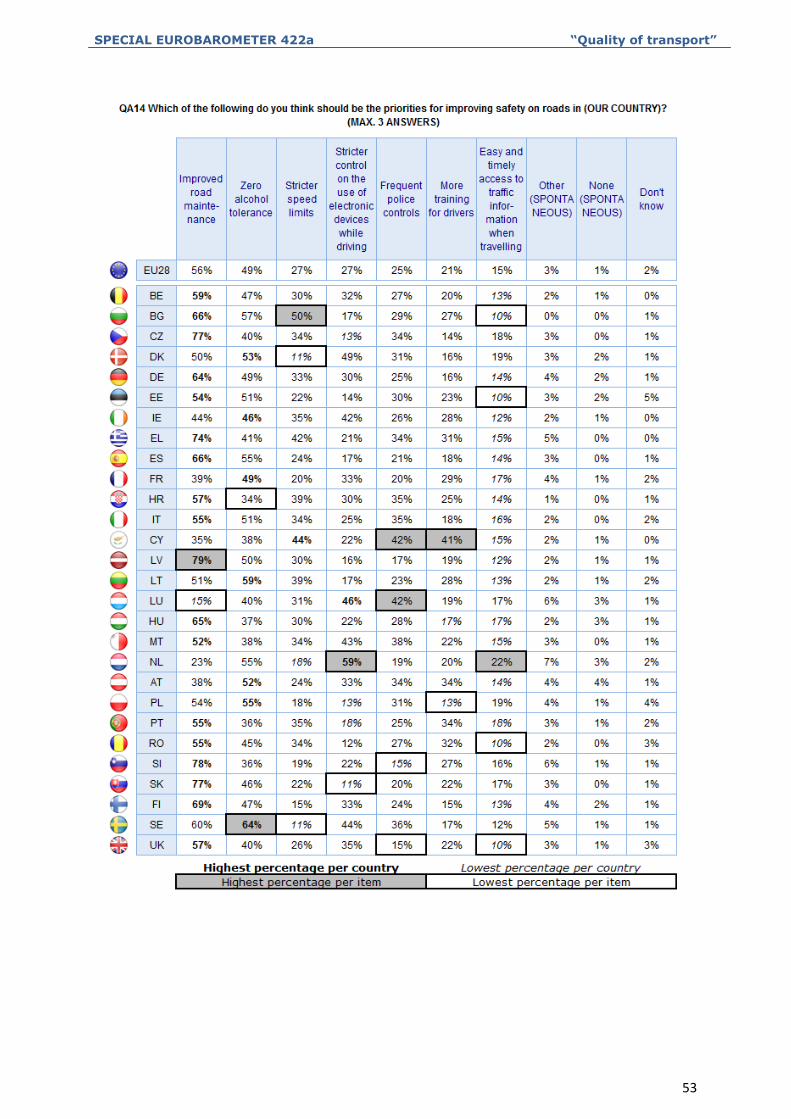
There is a wide variation across the EU in the proportions who said improved road
maintenance should be the priority for improving safety on roads, although this was the
most mentioned priority in 18 Member States. At least three quarters of respondents in
Latvia (79%), Slovenia (78%), the Czech Republic and Slovakia (77%) said this should
be the priority, compared to 23% of those in the Netherlands and 15% in Luxembourg.
Respondents in Sweden (64%), Lithuania (59%) and Bulgaria (57%) who were the most
likely to say zero alcohol tolerance should be the priority for improving road safety,
with this being the most mentioned priority in seven Member States: Sweden (64%),
Lithuania (59%), Poland (55%), Denmark (53%), Austria (52%), France (49%) and
Ireland (46%). This option was least mentioned by respondents in Portugal and Slovenia
(both 36%) and Croatia (34%).
Stricter speed limits was the most mentioned priority for improving safety in roads in
Cyprus (44%), although Bulgaria was the only Member State where at least half said this
should be the priority (50%),.At the other end of the scale only 11% of respondents in
Sweden and Denmark mentioned stricter speed limits as a priority for improving road
safety.
Respondents in the Netherlands (59%), Denmark (49%) and Luxembourg (46%) were
the most likely to say stricter control on the use of electronic devices while
driving should be the priority to improve road safety, and this was also the most
mentioned priority in the Netherlands and Luxembourg. In contrast, 12% of those in
Romania and 11% in Slovakia also mentioned this.
Respondents in Luxembourg and Cyprus were the most likely to favour frequent police
controls (both 42%), but this was less likely to be a priority for those in the UK and
Slovenia (both 15%).
At least one third of respondents in Cyprus (41%), Austria and Portugal (both 34%) said
more driver training should be the priority, compared to 13% of those in Poland and
14% in the Czech Republic.
Finally, there was very little variation across the EU in the proportions who thought easy
and timely access to traffic information when travelling should be the priority –
ranging from 22% of respondents in the Netherlands, to 10% of those in Romania,
Bulgaria, Estonia and the UK.
SPECIAL EUROBAROMETER 422a “Quality of transport”
53
SPECIAL EUROBAROMETER 422a “Quality of transport”
54
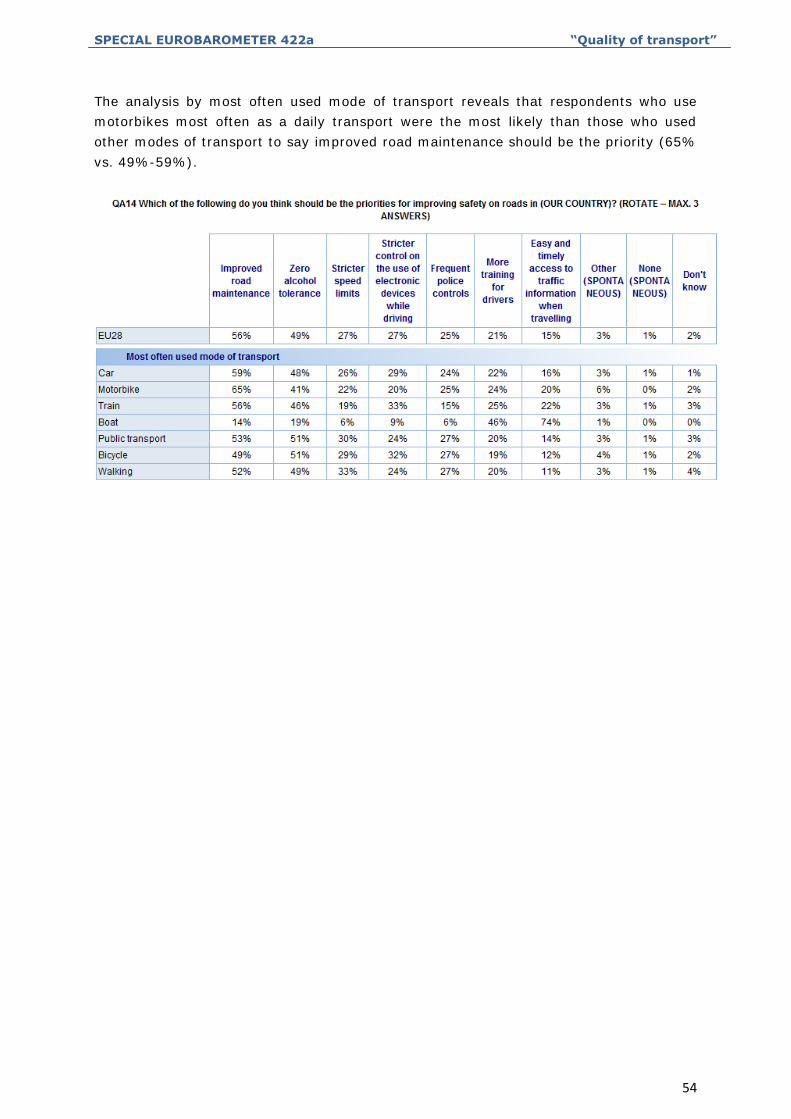
The analysis by most often used mode of transport reveals that respondents who use
motorbikes most often as a daily transport were the most likely than those who used
other modes of transport to say improved road maintenance should be the priority (65%
vs. 49%-59%).
SPECIAL EUROBAROMETER 422a “Quality of transport”
55
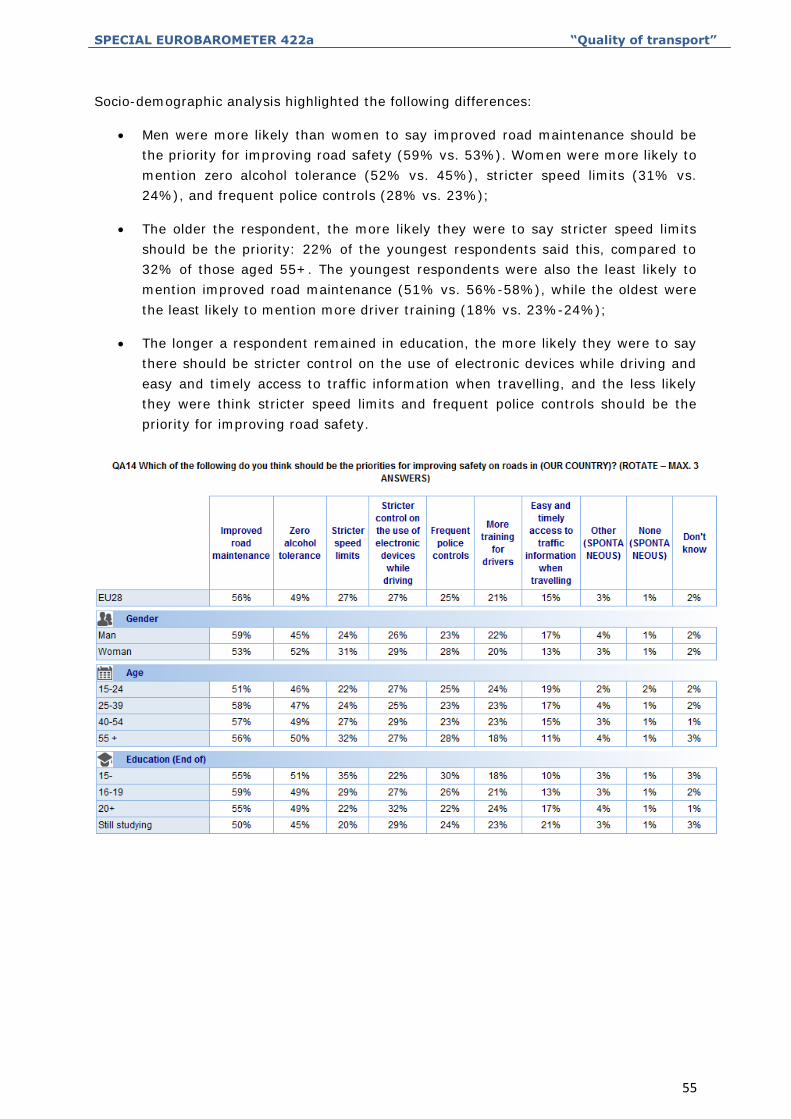
Socio-demographic analysis highlighted the following differences:
Men were more likely than women to say improved road maintenance should be
the priority for improving road safety (59% vs. 53%). Women were more likely to
mention zero alcohol tolerance (52% vs. 45%), stricter speed limits (31% vs.
24%), and frequent police controls (28% vs. 23%);
The older the respondent, the more likely they were to say stricter speed limits
should be the priority: 22% of the youngest respondents said this, compared to
32% of those aged 55+. The youngest respondents were also the least likely to
mention improved road maintenance (51% vs. 56%-58%), while the oldest were
the least likely to mention more driver training (18% vs. 23%-24%);
The longer a respondent remained in education, the more likely they were to say
there should be stricter control on the use of electronic devices while driving and
easy and timely access to traffic information when travelling, and the less likely
they were think stricter speed limits and frequent police controls should be the
priority for improving road safety.
SPECIAL EUROBAROMETER 422a “Quality of transport”
56
4.4. GENERAL ATTITUDES ABOUT ONLINE AVAILIABILITY OF THE
VEHICLE’S LOCATION
- A majority of respondents (51%) would be willing to have their vehicle
connected online, but for most this would be conditional -
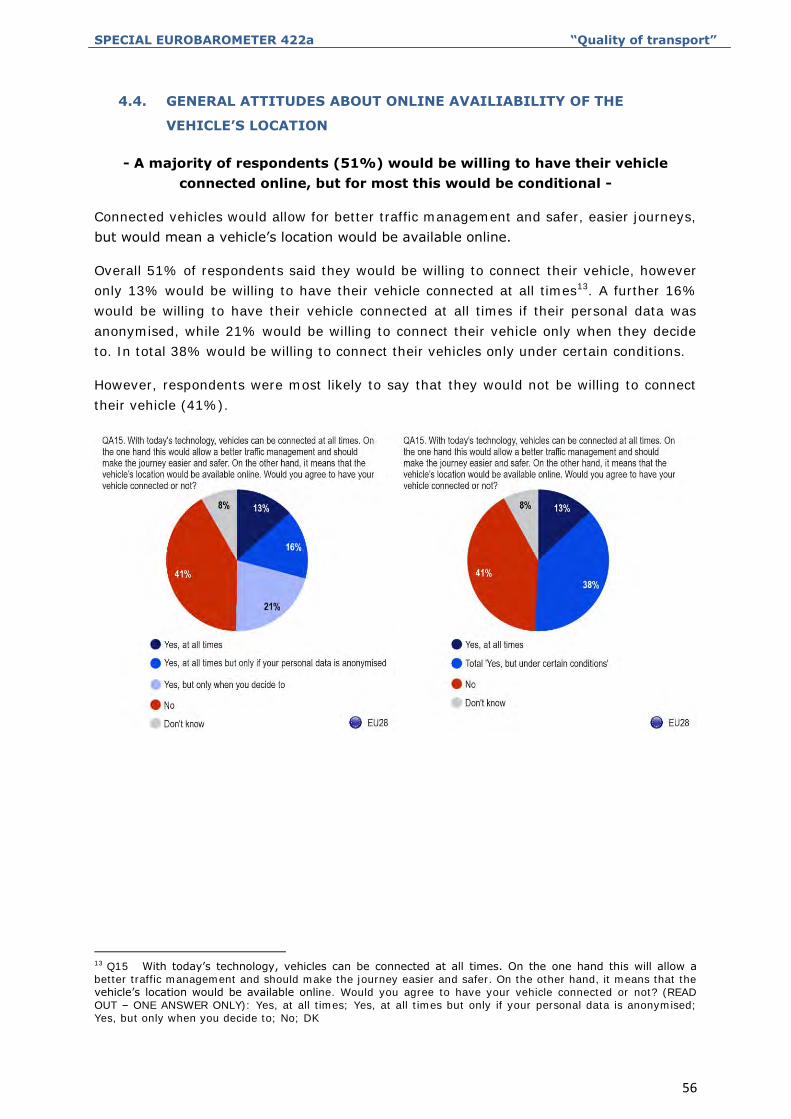
Connected vehicles would allow for better traffic management and safer, easier journeys,
but would mean a vehicle’s location would be available online.
Overall 51% of respondents said they would be willing to connect their vehicle, however
only 13% would be willing to have their vehicle connected at all times13. A further 16%
would be willing to have their vehicle connected at all times if their personal data was
anonymised, while 21% would be willing to connect their vehicle only when they decide
to. In total 38% would be willing to connect their vehicles only under certain conditions.
However, respondents were most likely to say that they would not be willing to connect
their vehicle (41%).
13 Q15 With today’s technology, vehicles can be connected at all times. On the one hand this will allow a better traffic management and should make the journey easier and safer. On the other hand, it means that the vehicle’s location would be available online. Would you agree to have your vehicle connected or not? (READ OUT – ONE ANSWER ONLY): Yes, at all times; Yes, at all times but only if your personal data is anonymised; Yes, but only when you decide to; No; DK
SPECIAL EUROBAROMETER 422a “Quality of transport”
57
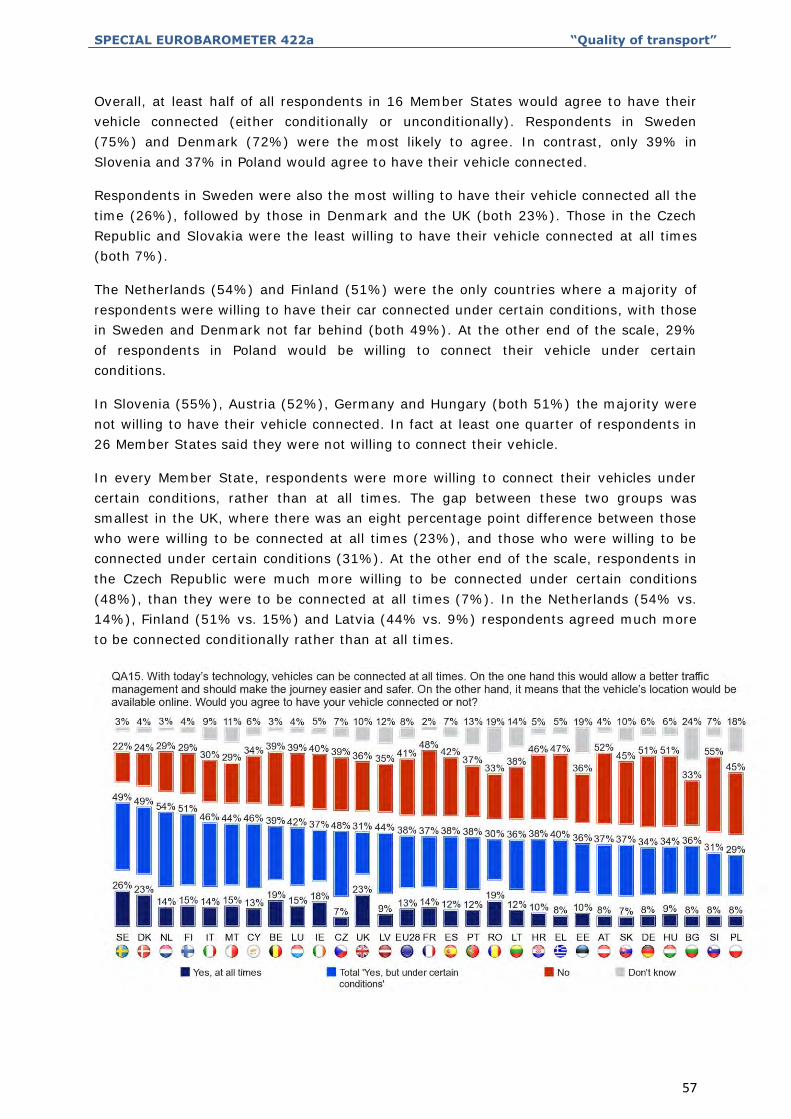
Overall, at least half of all respondents in 16 Member States would agree to have their
vehicle connected (either conditionally or unconditionally). Respondents in Sweden
(75%) and Denmark (72%) were the most likely to agree. In contrast, only 39% in
Slovenia and 37% in Poland would agree to have their vehicle connected.
Respondents in Sweden were also the most willing to have their vehicle connected all the
time (26%), followed by those in Denmark and the UK (both 23%). Those in the Czech
Republic and Slovakia were the least willing to have their vehicle connected at all times
(both 7%).
The Netherlands (54%) and Finland (51%) were the only countries where a majority of
respondents were willing to have their car connected under certain conditions, with those
in Sweden and Denmark not far behind (both 49%). At the other end of the scale, 29%
of respondents in Poland would be willing to connect their vehicle under certain
conditions.
In Slovenia (55%), Austria (52%), Germany and Hungary (both 51%) the majority were
not willing to have their vehicle connected. In fact at least one quarter of respondents in
26 Member States said they were not willing to connect their vehicle.
In every Member State, respondents were more willing to connect their vehicles under
certain conditions, rather than at all times. The gap between these two groups was
smallest in the UK, where there was an eight percentage point difference between those
who were willing to be connected at all times (23%), and those who were willing to be
connected under certain conditions (31%). At the other end of the scale, respondents in
the Czech Republic were much more willing to be connected under certain conditions
(48%), than they were to be connected at all times (7%). In the Netherlands (54% vs.
14%), Finland (51% vs. 15%) and Latvia (44% vs. 9%) respondents agreed much more
to be connected conditionally rather than at all times.
SPECIAL EUROBAROMETER 422a “Quality of transport”
58
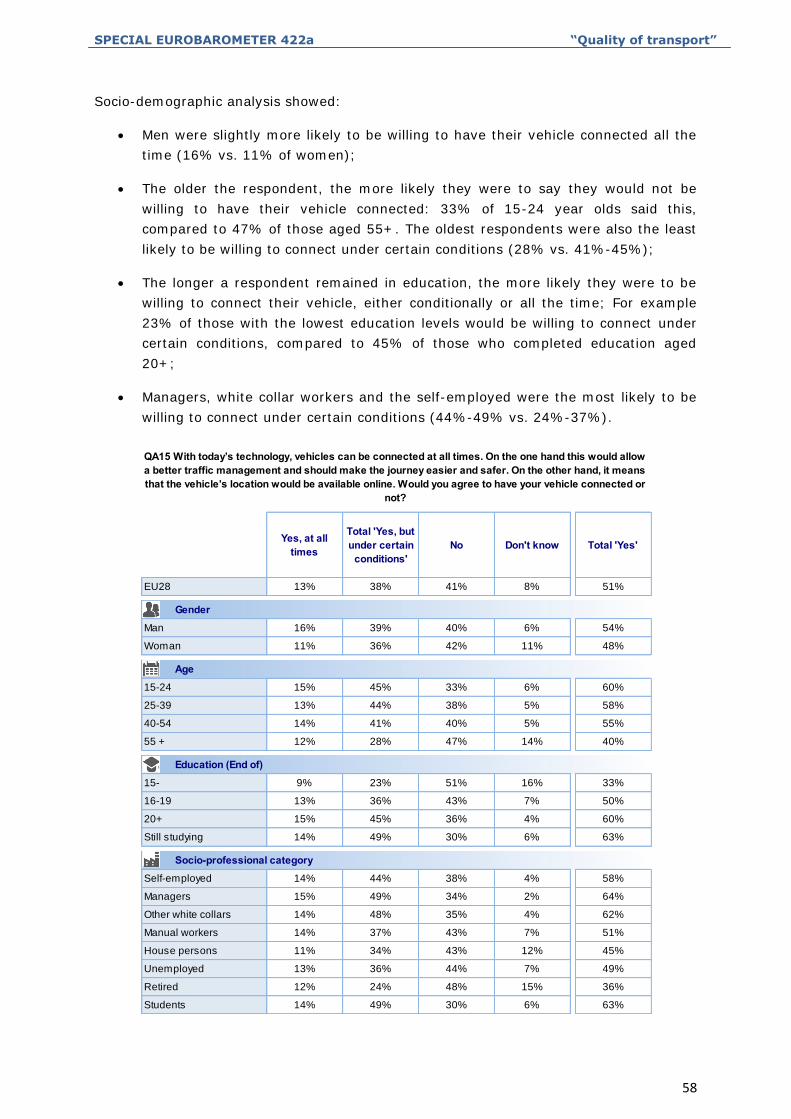
Socio-demographic analysis showed:
Men were slightly more likely to be willing to have their vehicle connected all the
time (16% vs. 11% of women);
The older the respondent, the more likely they were to say they would not be
willing to have their vehicle connected: 33% of 15-24 year olds said this,
compared to 47% of those aged 55+. The oldest respondents were also the least
likely to be willing to connect under certain conditions (28% vs. 41%-45%);
The longer a respondent remained in education, the more likely they were to be
willing to connect their vehicle, either conditionally or all the time; For example
23% of those with the lowest education levels would be willing to connect under
certain conditions, compared to 45% of those who completed education aged
20+;
Managers, white collar workers and the self-employed were the most likely to be
willing to connect under certain conditions (44%-49% vs. 24%-37%).
Yes, at all times
Total 'Yes, but under certain
conditions'No Don't know Total 'Yes'
EU28 13% 38% 41% 8% 51%
Man 16% 39% 40% 6% 54%
Woman 11% 36% 42% 11% 48%
15-24 15% 45% 33% 6% 60%
25-39 13% 44% 38% 5% 58%
40-54 14% 41% 40% 5% 55%
55 + 12% 28% 47% 14% 40%
15- 9% 23% 51% 16% 33%
16-19 13% 36% 43% 7% 50%
20+ 15% 45% 36% 4% 60%
Still studying 14% 49% 30% 6% 63%
Self-employed 14% 44% 38% 4% 58%
Managers 15% 49% 34% 2% 64%
Other white collars 14% 48% 35% 4% 62%
Manual workers 14% 37% 43% 7% 51%
House persons 11% 34% 43% 12% 45%
Unemployed 13% 36% 44% 7% 49%
Retired 12% 24% 48% 15% 36%
Students 14% 49% 30% 6% 63%
QA15 With today’s technology, vehicles can be connected at all times. On the one hand this would allow a better traffic management and should make the journey easier and safer. On the other hand, it means that the vehicle’s location would be available online. Would you agree to have your vehicle connected or
not?
Gender
Age
Education (End of)
Socio-professional category
SPECIAL EUROBAROMETER 422a “Quality of transport”
59
5. AIR TRANSPORT
5.1. PERCEPTIONS OF THE QUALITY OF AIR TRANSPORT
- A majority of respondents (55%) said the quality of air transport in their
country has improved or stayed the same in the last five years -
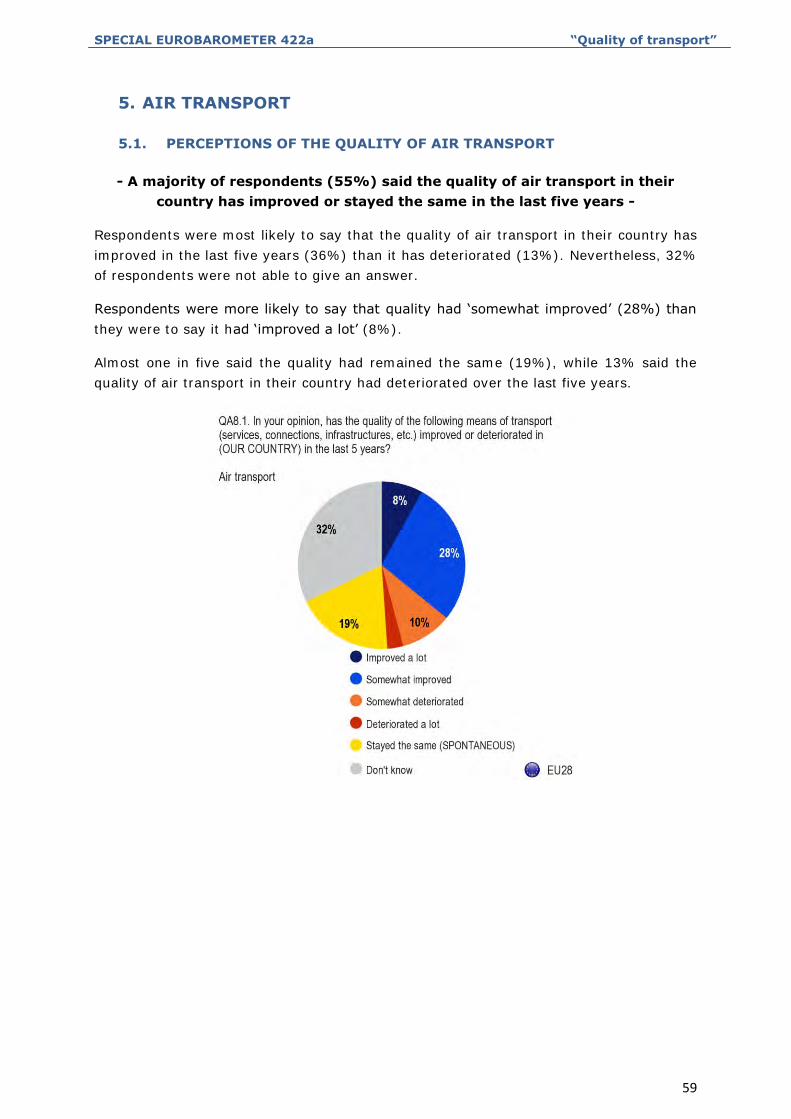
Respondents were most likely to say that the quality of air transport in their country has
improved in the last five years (36%) than it has deteriorated (13%). Nevertheless, 32%
of respondents were not able to give an answer.
Respondents were more likely to say that quality had ‘somewhat improved’ (28%) than
they were to say it had ‘improved a lot’ (8%).
Almost one in five said the quality had remained the same (19%), while 13% said the
quality of air transport in their country had deteriorated over the last five years.
SPECIAL EUROBAROMETER 422a “Quality of transport”
60
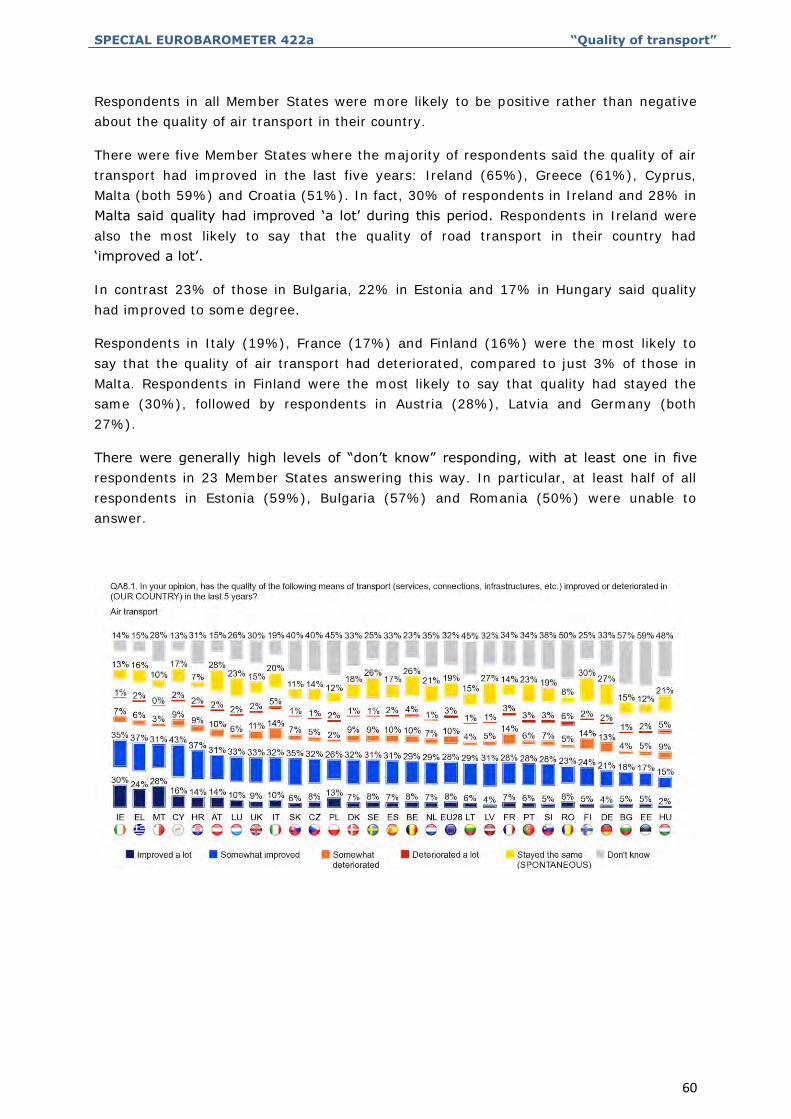
Respondents in all Member States were more likely to be positive rather than negative
about the quality of air transport in their country.
There were five Member States where the majority of respondents said the quality of air
transport had improved in the last five years: Ireland (65%), Greece (61%), Cyprus,
Malta (both 59%) and Croatia (51%). In fact, 30% of respondents in Ireland and 28% in
Malta said quality had improved ‘a lot’ during this period. Respondents in Ireland were
also the most likely to say that the quality of road transport in their country had
‘improved a lot’.
In contrast 23% of those in Bulgaria, 22% in Estonia and 17% in Hungary said quality
had improved to some degree.
Respondents in Italy (19%), France (17%) and Finland (16%) were the most likely to
say that the quality of air transport had deteriorated, compared to just 3% of those in
Malta. Respondents in Finland were the most likely to say that quality had stayed the
same (30%), followed by respondents in Austria (28%), Latvia and Germany (both
27%).
There were generally high levels of “don’t know” responding, with at least one in five
respondents in 23 Member States answering this way. In particular, at least half of all
respondents in Estonia (59%), Bulgaria (57%) and Romania (50%) were unable to
answer.
SPECIAL EUROBAROMETER 422a “Quality of transport”
61
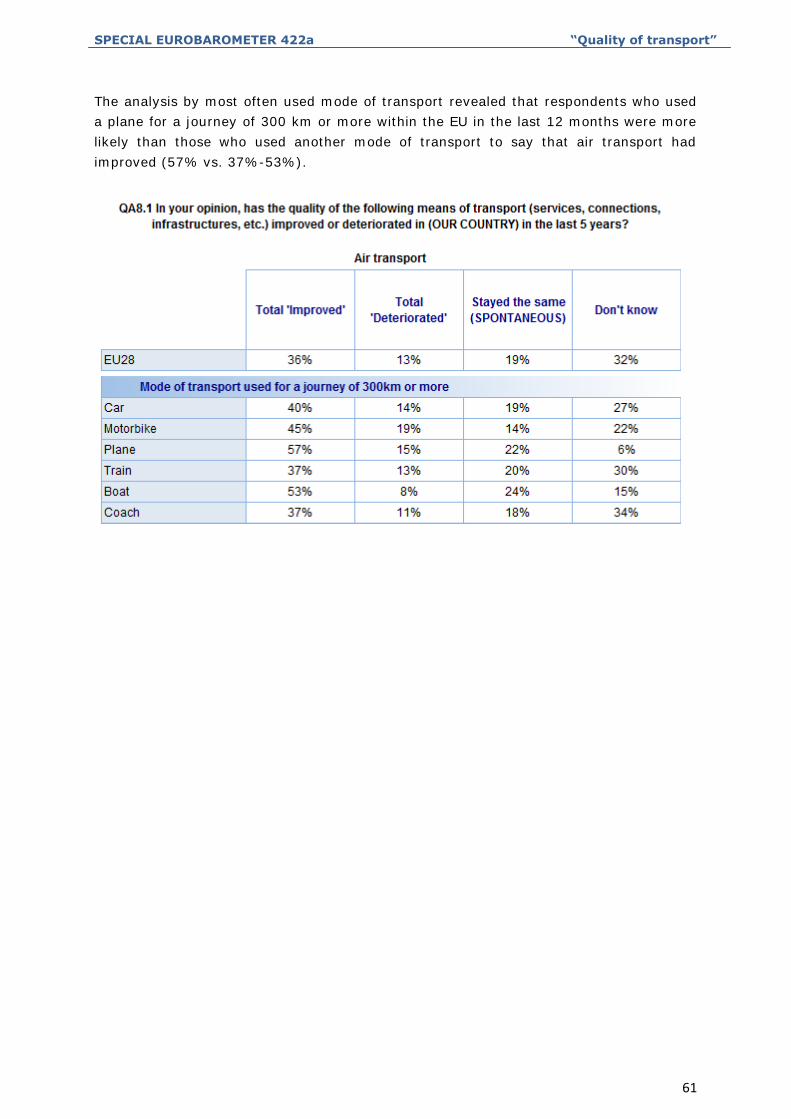
The analysis by most often used mode of transport revealed that respondents who used
a plane for a journey of 300 km or more within the EU in the last 12 months were more
likely than those who used another mode of transport to say that air transport had
improved (57% vs. 37%-53%).
SPECIAL EUROBAROMETER 422a “Quality of transport”
62
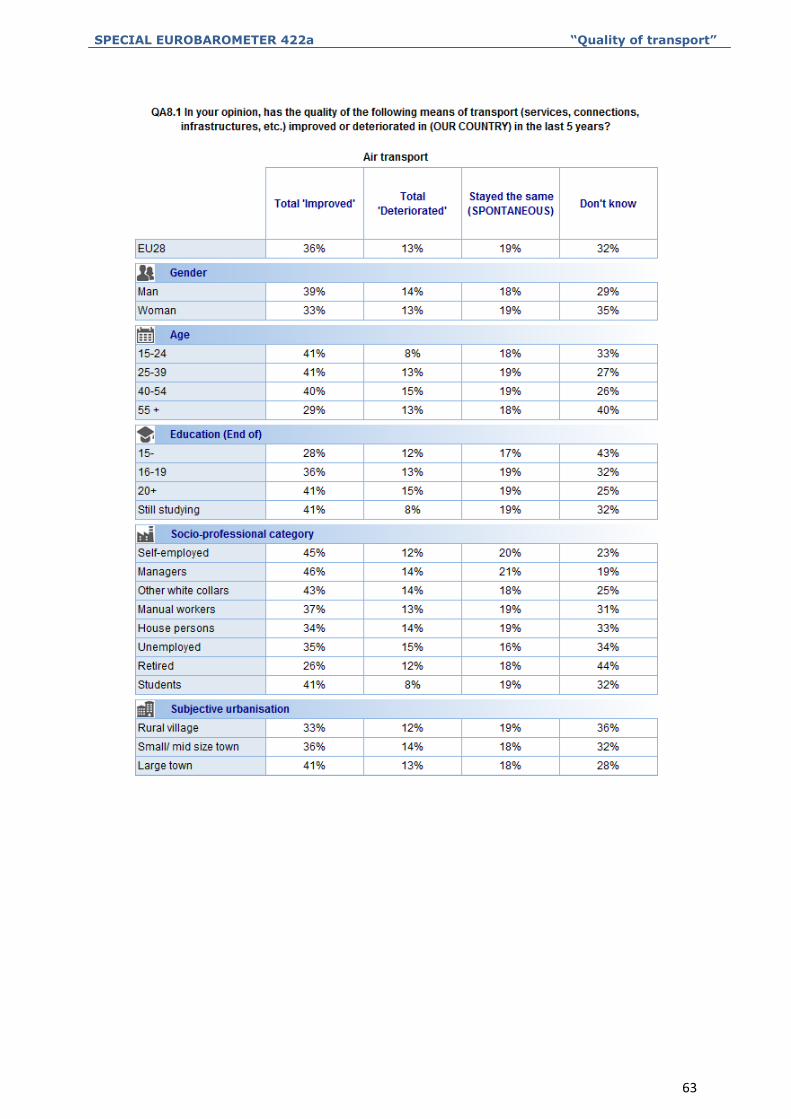
Socio-demographic analysis highlighted that:
Men were more likely than women to say air transport had improved (39% vs.
33%);
The oldest respondents were much less likely to say air transport had
improved (29% vs. 40%-41%);
The longer a respondent remained in education, the more likely they were to
say air transport had improved, (28% and 36% vs. 41%);
Managers, the self-employed and white collar workers were the most likely to
say air transport had improved, and the least likely to say they did not know;
The more urbanised the respondent, the more likely they were to say air
transport had improved (41% and 36% vs. 33% in rural villages).
SPECIAL EUROBAROMETER 422a “Quality of transport”
63
SPECIAL EUROBAROMETER 422a “Quality of transport”
64
5.2. THE MOST SERIOUS PROBLEMS AFFECTING AIR TRANSPORT
- Ticket prices were most likely to be considered the most serious problem for
air transport -
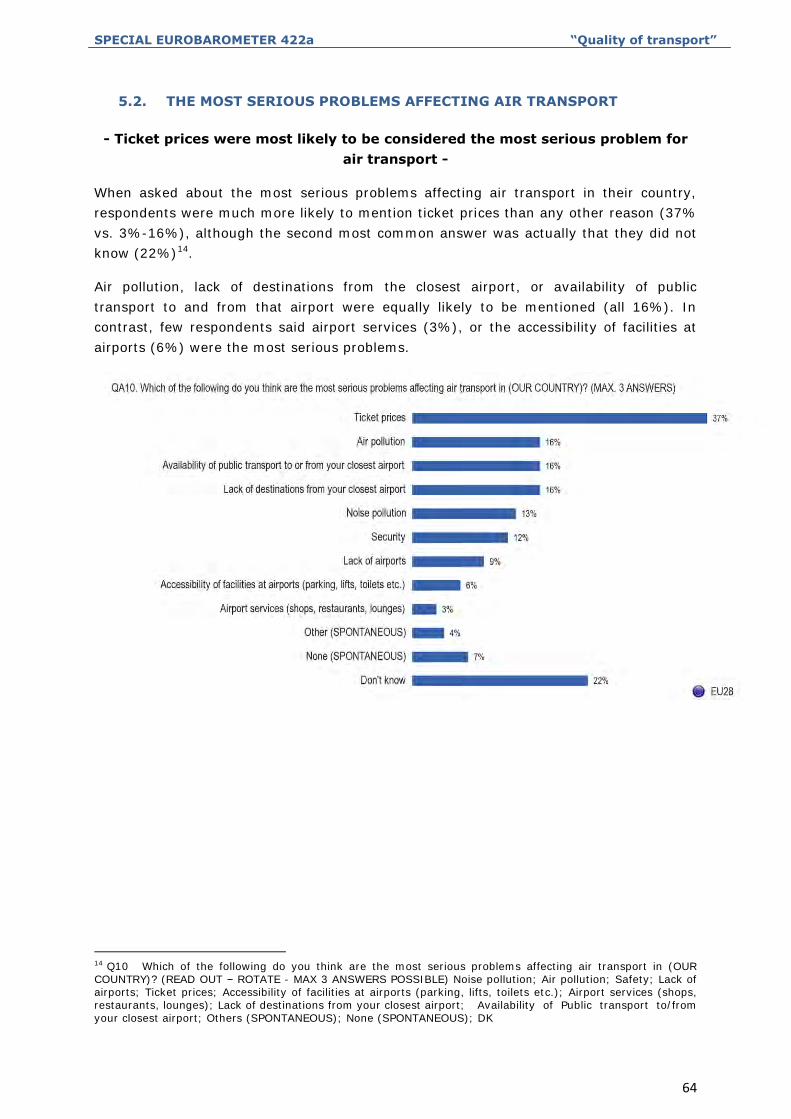
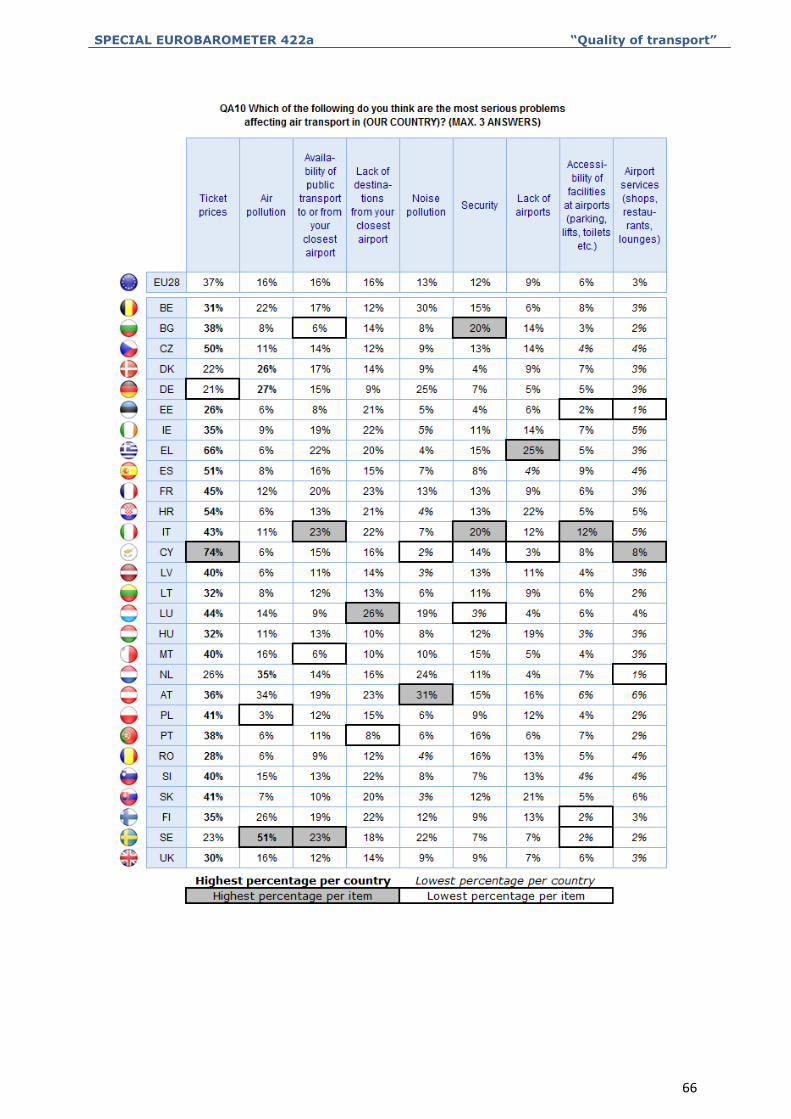
When asked about the most serious problems affecting air transport in their country,
respondents were much more likely to mention ticket prices than any other reason (37%
vs. 3%-16%), although the second most common answer was actually that they did not
know (22%)14.
Air pollution, lack of destinations from the closest airport, or availability of public
transport to and from that airport were equally likely to be mentioned (all 16%). In
contrast, few respondents said airport services (3%), or the accessibility of facilities at
airports (6%) were the most serious problems.
14 Q10 Which of the following do you think are the most serious problems affecting air transport in (OUR COUNTRY)? (READ OUT – ROTATE - MAX 3 ANSWERS POSSIBLE) Noise pollution; Air pollution; Safety; Lack of airports; Ticket prices; Accessibility of facilities at airports (parking, lifts, toilets etc.); Airport services (shops, restaurants, lounges); Lack of destinations from your closest airport; Availability of Public transport to/from your closest airport; Others (SPONTANEOUS); None (SPONTANEOUS); DK
SPECIAL EUROBAROMETER 422a “Quality of transport”
65
Ticket prices was the most mentioned problem for air transport in 24 Member States
and in five of them at least half of respondents shared this view: Cyprus (74%), Greece
(66%), Croatia (54%), Spain (51%) and the Czech Republic (50%). At the other end of
the scale, less than a quarter of respondents in Sweden (23%), Denmark (22%) and
Germany (21%) mentioned ticket prices as the most serious problem for air transport.
Indeed, in these three Member States and in the Netherlands air pollution was the most
mentioned problem. Respondents in Sweden were the most likely to mention air
pollution (51%) as the most serious problem followed by the Netherlands (35%),
Germany (27%) and Denmark (26%). In Austria, although air pollution was not the most
mentioned problem, a large proportion of respondents considered air pollution a serious
problem (35%). In contrast, in Poland only 3% of respondents shared this view.
Respondents in Luxembourg (26%), Austria and France (23%) were the most likely to
say a lack of destinations from their closest airport was the most serious problem
for air transport in their country, but this was less likely to be seen as an issue for those
in Germany (9%) or Portugal (8%).
A lack of public transport to and from their closest airport was considered a
serious problem for at least one in five respondents in Italy and Sweden (both 23%),
Greece (22%) and France (20%), but for only 6% in Malta or Bulgaria.
Noise pollution was the most mentioned problem by respondents in Austria (31%),
Belgium (30%) and Germany (25%), and the least mentioned by those in Cyprus (2%),
Slovakia and Latvia (both 3%).
Security was most likely to be mentioned as a serious problem by respondents in
Bulgaria and Italy (20%), while at least one in five respondents in Greece (25%), Croatia
(22%) and Slovakia (21%) mentioned a lack of airports. Italy was the only Member
State where more than one in ten mentioned the accessibility of facilities at airports
(12%).
At least one in five respondents in 16 Member States said they did not know what the
most serious problem for air transport was in their country.
SPECIAL EUROBAROMETER 422a “Quality of transport”
66
SPECIAL EUROBAROMETER 422a “Quality of transport”
67
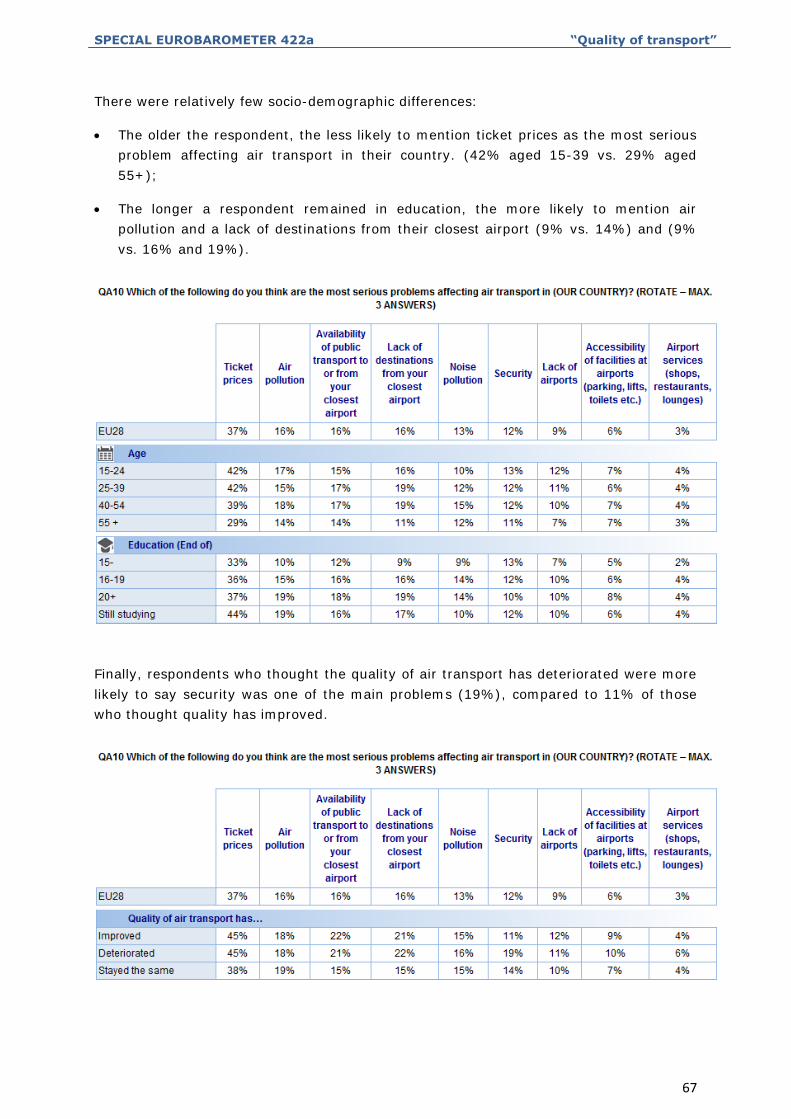
There were relatively few socio-demographic differences:
The older the respondent, the less likely to mention ticket prices as the most serious
problem affecting air transport in their country. (42% aged 15-39 vs. 29% aged
55+);
The longer a respondent remained in education, the more likely to mention air
pollution and a lack of destinations from their closest airport (9% vs. 14%) and (9%
vs. 16% and 19%).
Finally, respondents who thought the quality of air transport has deteriorated were more
likely to say security was one of the main problems (19%), compared to 11% of those
who thought quality has improved.
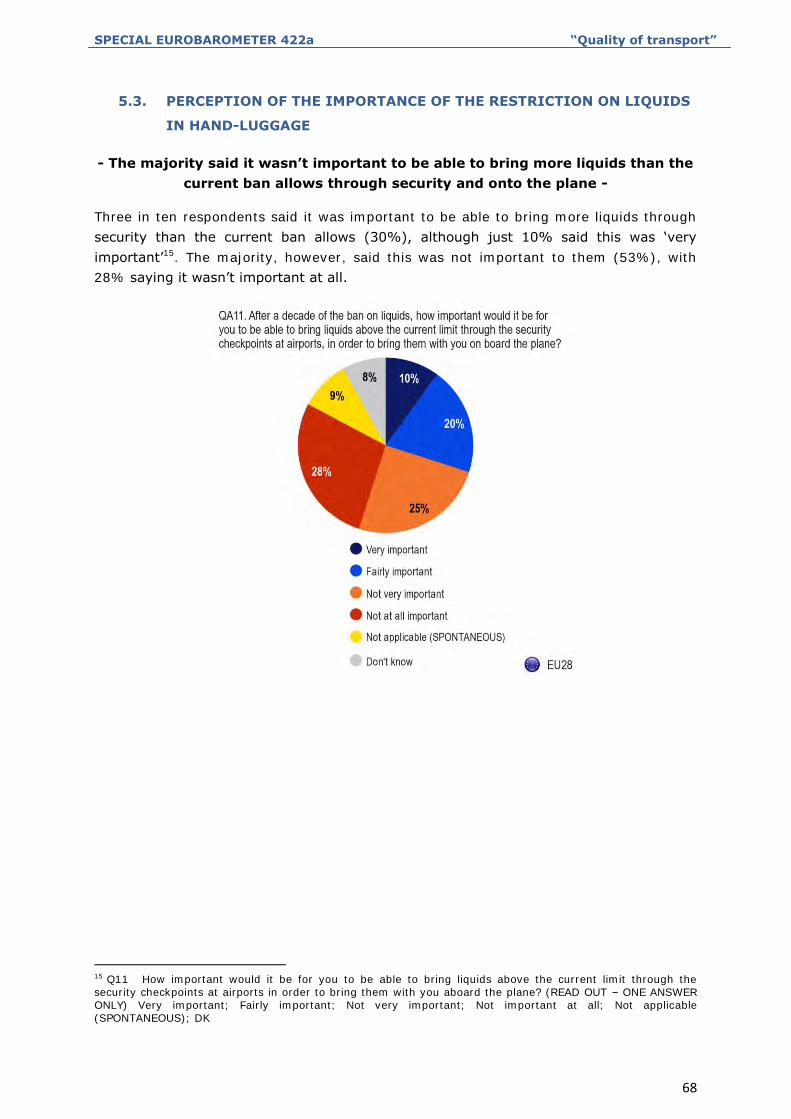
SPECIAL EUROBAROMETER 422a “Quality of transport”
68
5.3. PERCEPTION OF THE IMPORTANCE OF THE RESTRICTION ON LIQUIDS
IN HAND-LUGGAGE
- The majority said it wasn’t important to be able to bring more liquids than the
current ban allows through security and onto the plane -
Three in ten respondents said it was important to be able to bring more liquids through
security than the current ban allows (30%), although just 10% said this was ‘very
important’15. The majority, however, said this was not important to them (53%), with
28% saying it wasn’t important at all.
15 Q11 How important would it be for you to be able to bring liquids above the current limit through the security checkpoints at airports in order to bring them with you aboard the plane? (READ OUT – ONE ANSWER ONLY) Very important; Fairly important; Not very important; Not important at all; Not applicable (SPONTANEOUS); DK
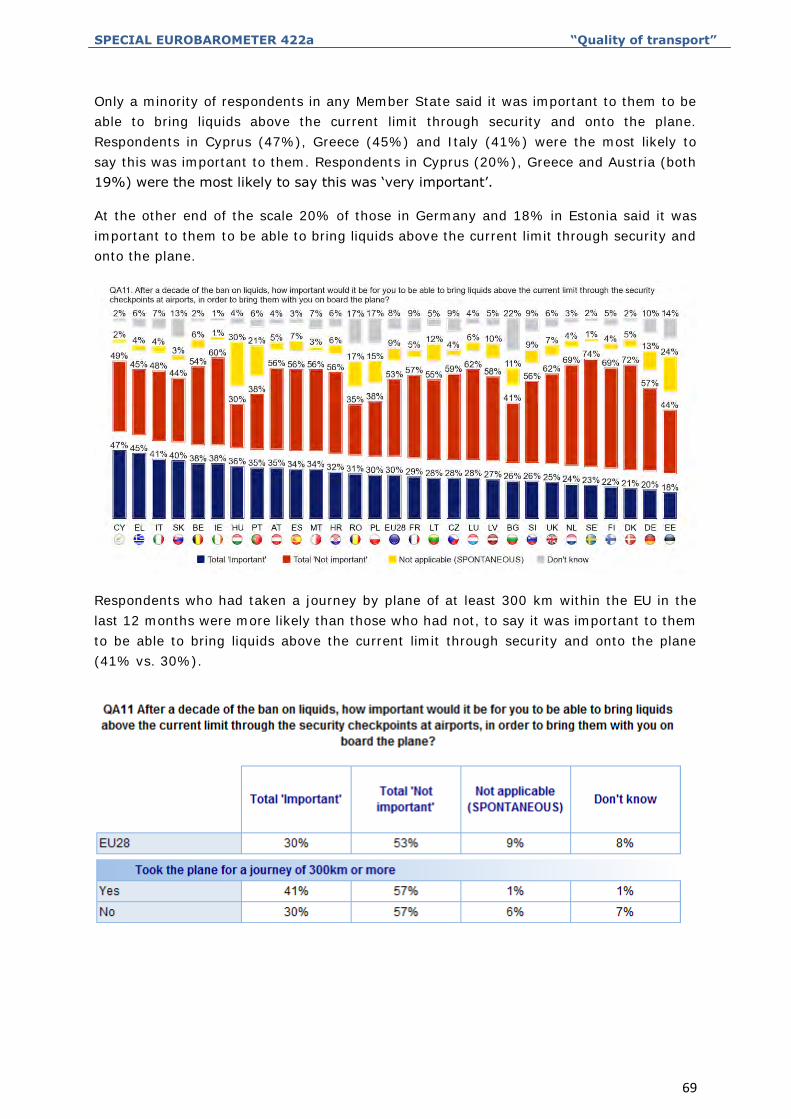
SPECIAL EUROBAROMETER 422a “Quality of transport”
69
Only a minority of respondents in any Member State said it was important to them to be
able to bring liquids above the current limit through security and onto the plane.
Respondents in Cyprus (47%), Greece (45%) and Italy (41%) were the most likely to
say this was important to them. Respondents in Cyprus (20%), Greece and Austria (both
19%) were the most likely to say this was ‘very important’.
At the other end of the scale 20% of those in Germany and 18% in Estonia said it was
important to them to be able to bring liquids above the current limit through security and
onto the plane.
Respondents who had taken a journey by plane of at least 300 km within the EU in the
last 12 months were more likely than those who had not, to say it was important to them
to be able to bring liquids above the current limit through security and onto the plane
(41% vs. 30%).
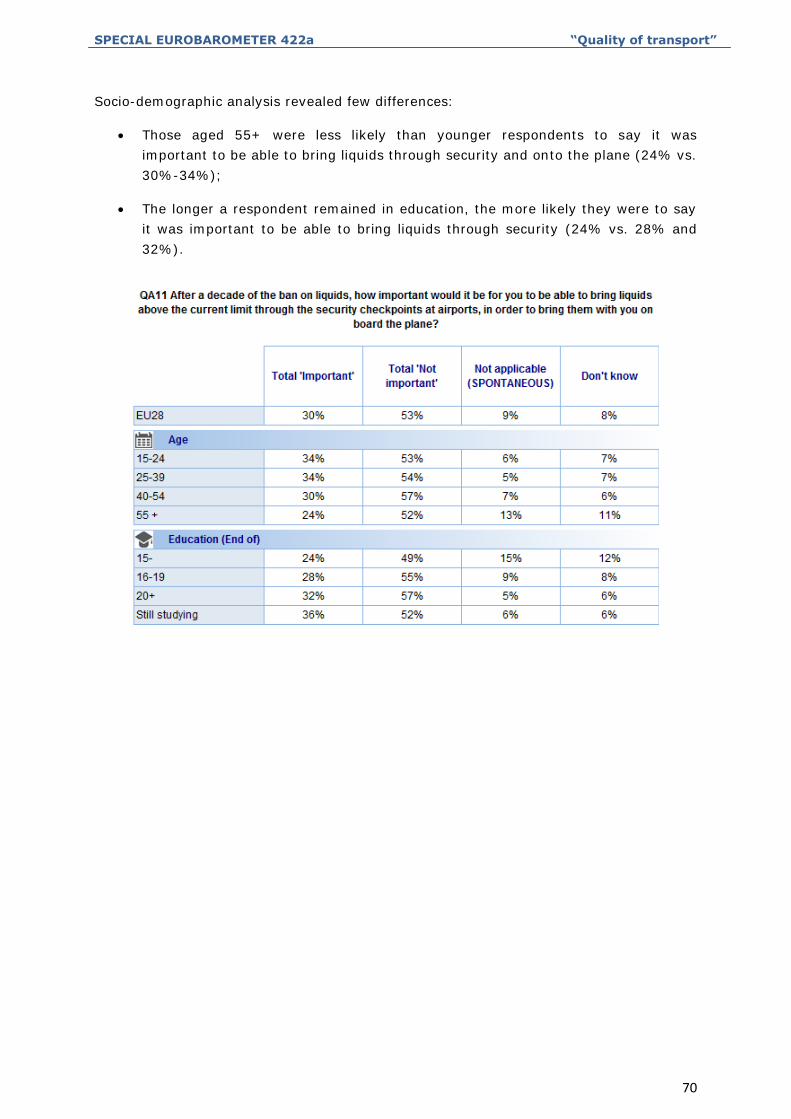
SPECIAL EUROBAROMETER 422a “Quality of transport”
70
Socio-demographic analysis revealed few differences:
Those aged 55+ were less likely than younger respondents to say it was
important to be able to bring liquids through security and onto the plane (24% vs.
30%-34%);
The longer a respondent remained in education, the more likely they were to say
it was important to be able to bring liquids through security (24% vs. 28% and
32%).
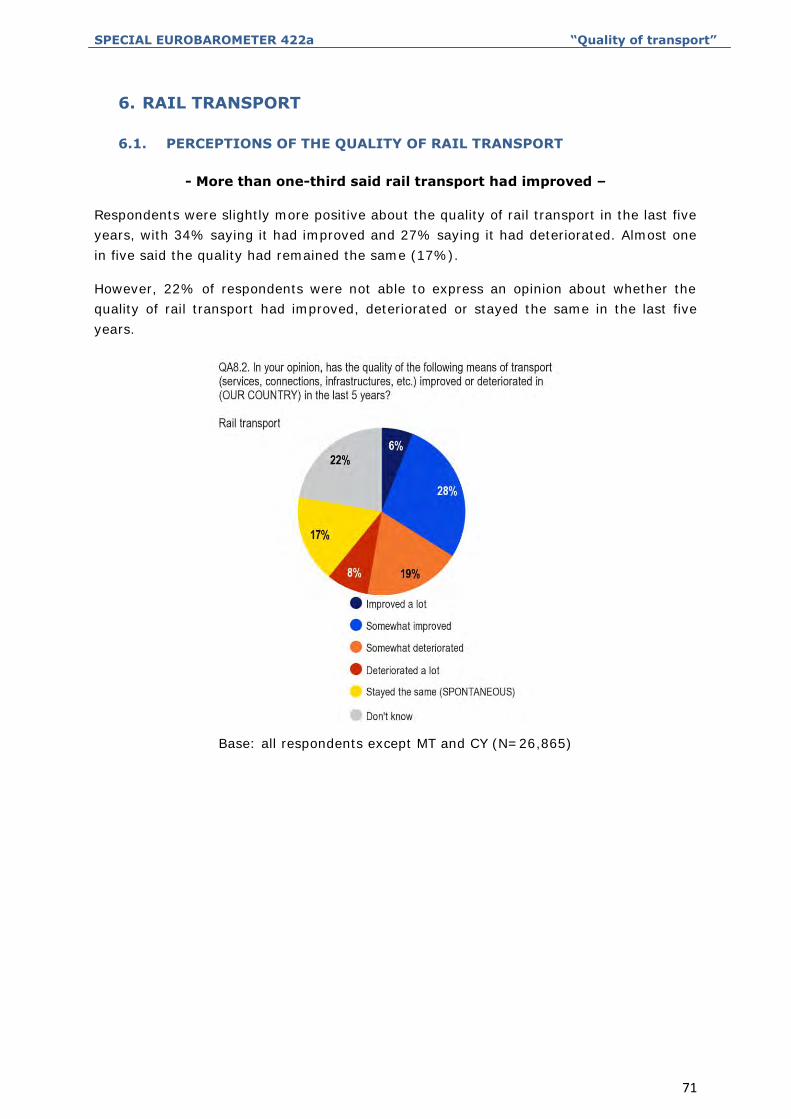
SPECIAL EUROBAROMETER 422a “Quality of transport”
71
6. RAIL TRANSPORT
6.1. PERCEPTIONS OF THE QUALITY OF RAIL TRANSPORT
- More than one-third said rail transport had improved –
Respondents were slightly more positive about the quality of rail transport in the last five
years, with 34% saying it had improved and 27% saying it had deteriorated. Almost one
in five said the quality had remained the same (17%).
However, 22% of respondents were not able to express an opinion about whether the
quality of rail transport had improved, deteriorated or stayed the same in the last five
years.
Base: all respondents except MT and CY (N=26,865)
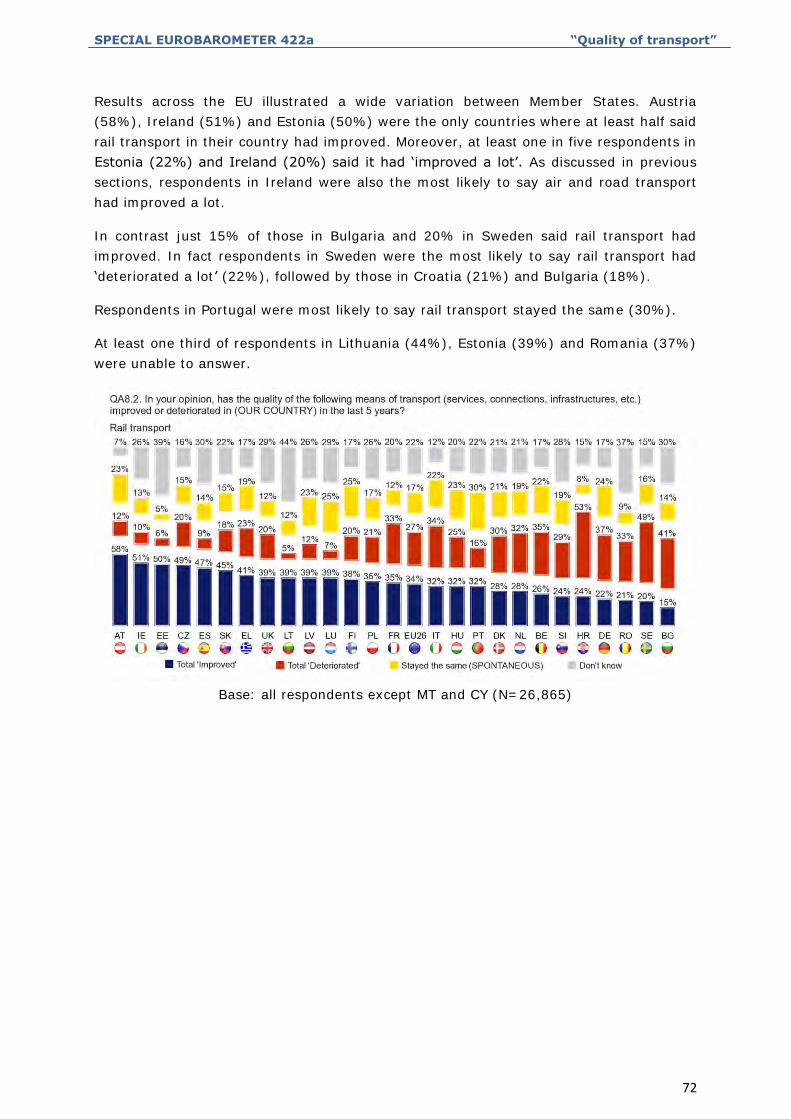
SPECIAL EUROBAROMETER 422a “Quality of transport”
72
Results across the EU illustrated a wide variation between Member States. Austria
(58%), Ireland (51%) and Estonia (50%) were the only countries where at least half said
rail transport in their country had improved. Moreover, at least one in five respondents in
Estonia (22%) and Ireland (20%) said it had ‘improved a lot’. As discussed in previous
sections, respondents in Ireland were also the most likely to say air and road transport
had improved a lot.
In contrast just 15% of those in Bulgaria and 20% in Sweden said rail transport had
improved. In fact respondents in Sweden were the most likely to say rail transport had
‘deteriorated a lot’ (22%), followed by those in Croatia (21%) and Bulgaria (18%).
Respondents in Portugal were most likely to say rail transport stayed the same (30%).
At least one third of respondents in Lithuania (44%), Estonia (39%) and Romania (37%)
were unable to answer.
Base: all respondents except MT and CY (N=26,865)
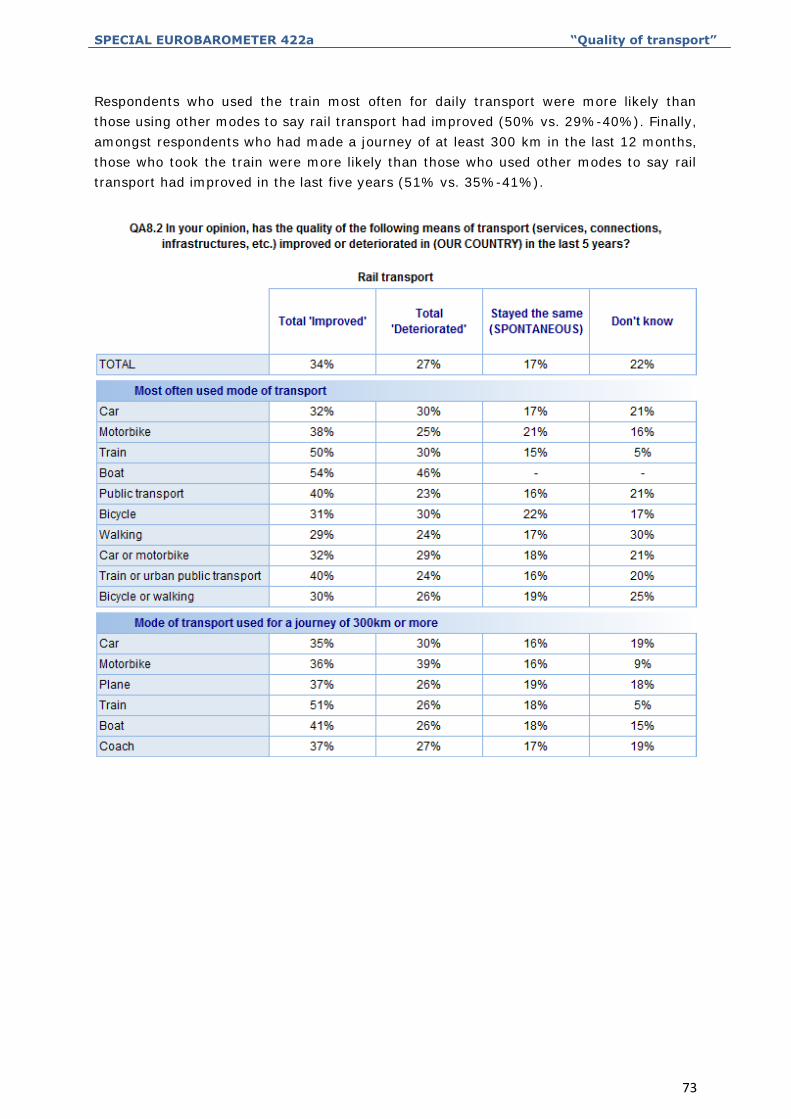
SPECIAL EUROBAROMETER 422a “Quality of transport”
73
Respondents who used the train most often for daily transport were more likely than
those using other modes to say rail transport had improved (50% vs. 29%-40%). Finally,
amongst respondents who had made a journey of at least 300 km in the last 12 months,
those who took the train were more likely than those who used other modes to say rail
transport had improved in the last five years (51% vs. 35%-41%).
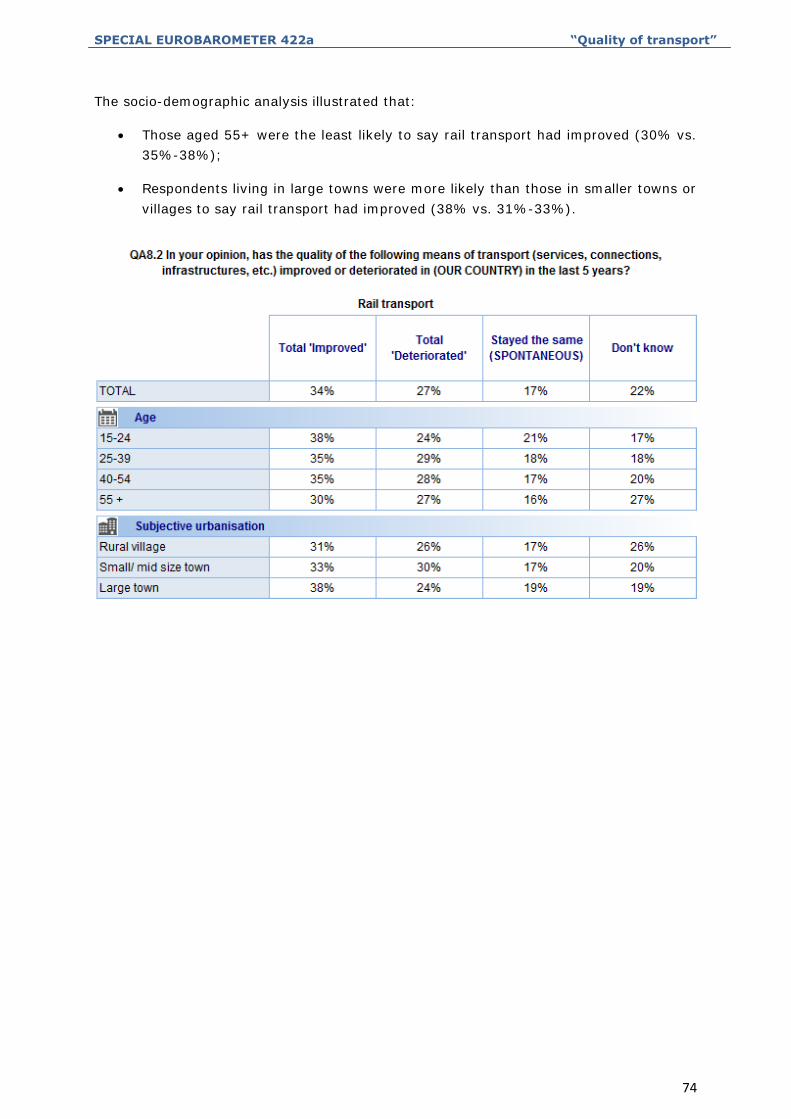
SPECIAL EUROBAROMETER 422a “Quality of transport”
74
The socio-demographic analysis illustrated that:
Those aged 55+ were the least likely to say rail transport had improved (30% vs.
35%-38%);
Respondents living in large towns were more likely than those in smaller towns or
villages to say rail transport had improved (38% vs. 31%-33%).
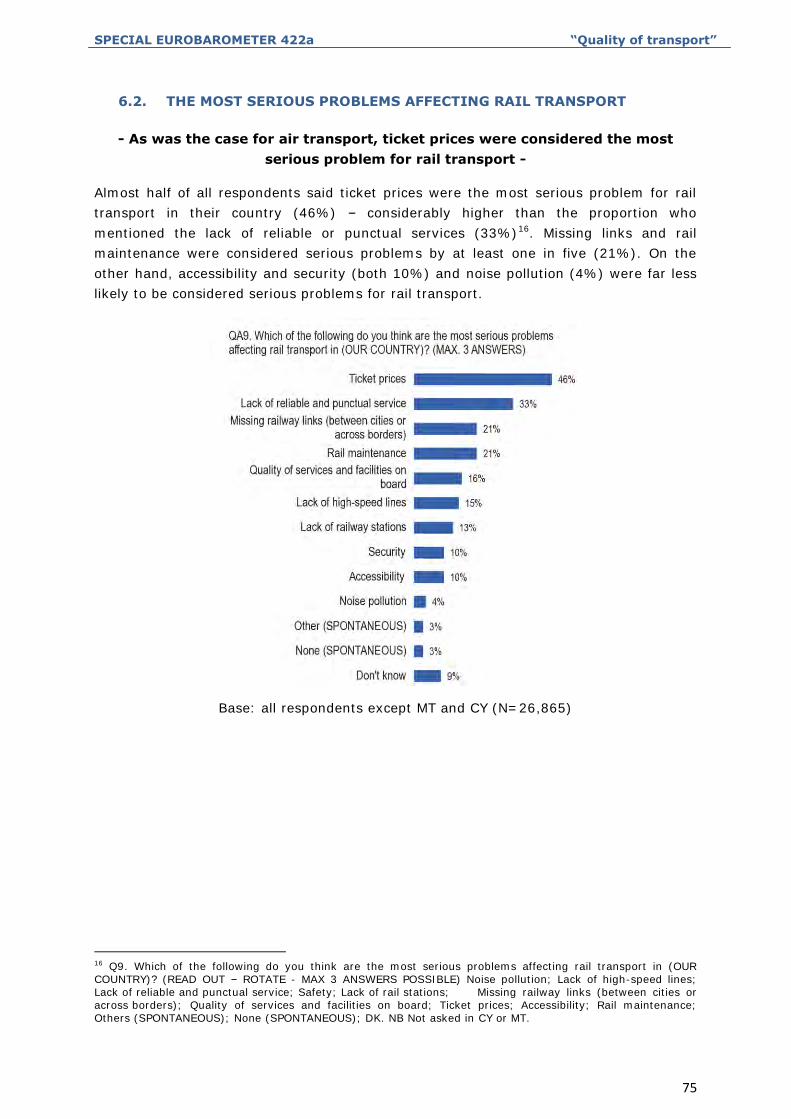
SPECIAL EUROBAROMETER 422a “Quality of transport”
75
6.2. THE MOST SERIOUS PROBLEMS AFFECTING RAIL TRANSPORT
- As was the case for air transport, ticket prices were considered the most
serious problem for rail transport -
Almost half of all respondents said ticket prices were the most serious problem for rail
transport in their country (46%) – considerably higher than the proportion who
mentioned the lack of reliable or punctual services (33%)16. Missing links and rail
maintenance were considered serious problems by at least one in five (21%). On the
other hand, accessibility and security (both 10%) and noise pollution (4%) were far less
likely to be considered serious problems for rail transport.
Base: all respondents except MT and CY (N=26,865)
16 Q9. Which of the following do you think are the most serious problems affecting rail transport in (OUR COUNTRY)? (READ OUT – ROTATE - MAX 3 ANSWERS POSSIBLE) Noise pollution; Lack of high-speed lines; Lack of reliable and punctual service; Safety; Lack of rail stations; Missing railway links (between cities or across borders); Quality of services and facilities on board; Ticket prices; Accessibility; Rail maintenance; Others (SPONTANEOUS); None (SPONTANEOUS); DK. NB Not asked in CY or MT.
SPECIAL EUROBAROMETER 422a “Quality of transport”
76
In 13 Member States, ticket prices was mentioned as the most serious problem
affecting rail transport, and this was the case for at least half the respondents in
Denmark (61%), the UK (57%), France (58%), Germany (56%), and the Netherlands
(55%). In strong contrast, just 12% of respondents in Slovenia and Estonia mentioned
ticket prices.
Belgium (56%) and Italy (49%) were the only Member States where the lack of a
reliable and punctual service was the most mentioned problem. Moreover, although
not the most mentioned, the lack of a reliable and punctual service was also widely
mentioned in Sweden (64%) and in Germany (54%) as the most serious problem
affecting rail transport in the country. On the other hand, only a few respondents in
Estonia (4%) and Lithuania (3%) said the same.
There was less variation across Member States in the proportions who mentioned
missing railway links. Respondents in Slovakia (36%), Greece (32%) and Poland
(31%) were the most likely to mention this, compared to 10% in the UK and 15% in
Romania. Missing railway links were the most mentioned problem by respondents in
Slovakia, Luxembourg (23%), Lithuania and Estonia (both 22%).
Rail maintenance was the most mentioned problem by respondents in Sweden (66%),
Croatia (46%), Slovenia (44%), Romania (38%) and Bulgaria (36%), but was the least
mentioned by those in Luxembourg (4%).
Respondents in the Czech Republic (34%), Italy (29%) and Hungary (27%) were the
most likely across the EU to have said that the quality of services and facilities on
board was the most serious problem for rail transport.
Those in Greece (36%) and Latvia (30%) were most likely to mention a lack of high-
speed lines, although this was also widely mentioned by respondents in Slovenia (37%)
and Croatia (30%).
More than one in five respondents in Finland (27%), Ireland (24%), Portugal (23%) and
Greece (22%) mentioned the lack of railway stations as a serious problem, while
respondents in Bulgaria were much more likely than those in other Member States to
mention security (32%). Respondents in Bulgaria were also the most likely to mention
security as an issue for road and air transport.
Accessibility was most likely to be mentioned as a serious problem by respondents in
Portugal and Slovenia (19%).
Respondents in Austria were the most likely across the EU to mention noise pollution
(15%). Respondents in Austria were also the most likely to mention noise pollution as
problems for road and air transport.
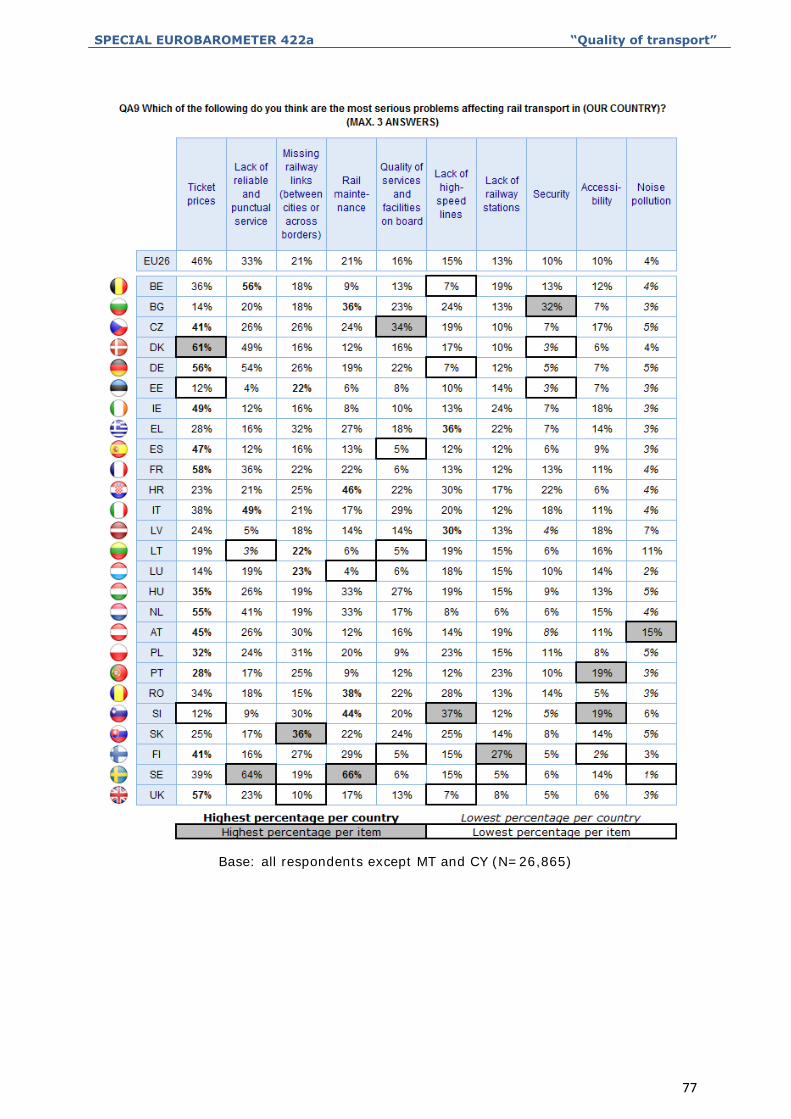
SPECIAL EUROBAROMETER 422a “Quality of transport”
77
Base: all respondents except MT and CY (N=26,865)
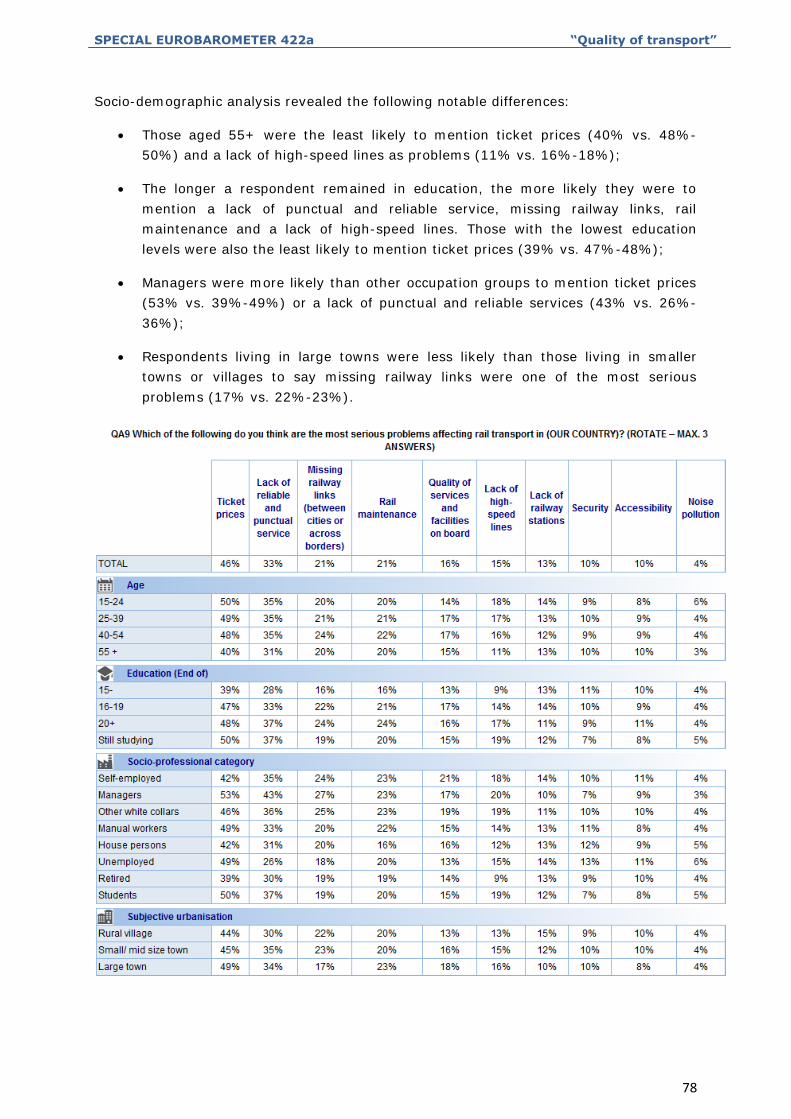
SPECIAL EUROBAROMETER 422a “Quality of transport”
78
Socio-demographic analysis revealed the following notable differences:
Those aged 55+ were the least likely to mention ticket prices (40% vs. 48%-
50%) and a lack of high-speed lines as problems (11% vs. 16%-18%);
The longer a respondent remained in education, the more likely they were to
mention a lack of punctual and reliable service, missing railway links, rail
maintenance and a lack of high-speed lines. Those with the lowest education
levels were also the least likely to mention ticket prices (39% vs. 47%-48%);
Managers were more likely than other occupation groups to mention ticket prices
(53% vs. 39%-49%) or a lack of punctual and reliable services (43% vs. 26%-
36%);
Respondents living in large towns were less likely than those living in smaller
towns or villages to say missing railway links were one of the most serious
problems (17% vs. 22%-23%).
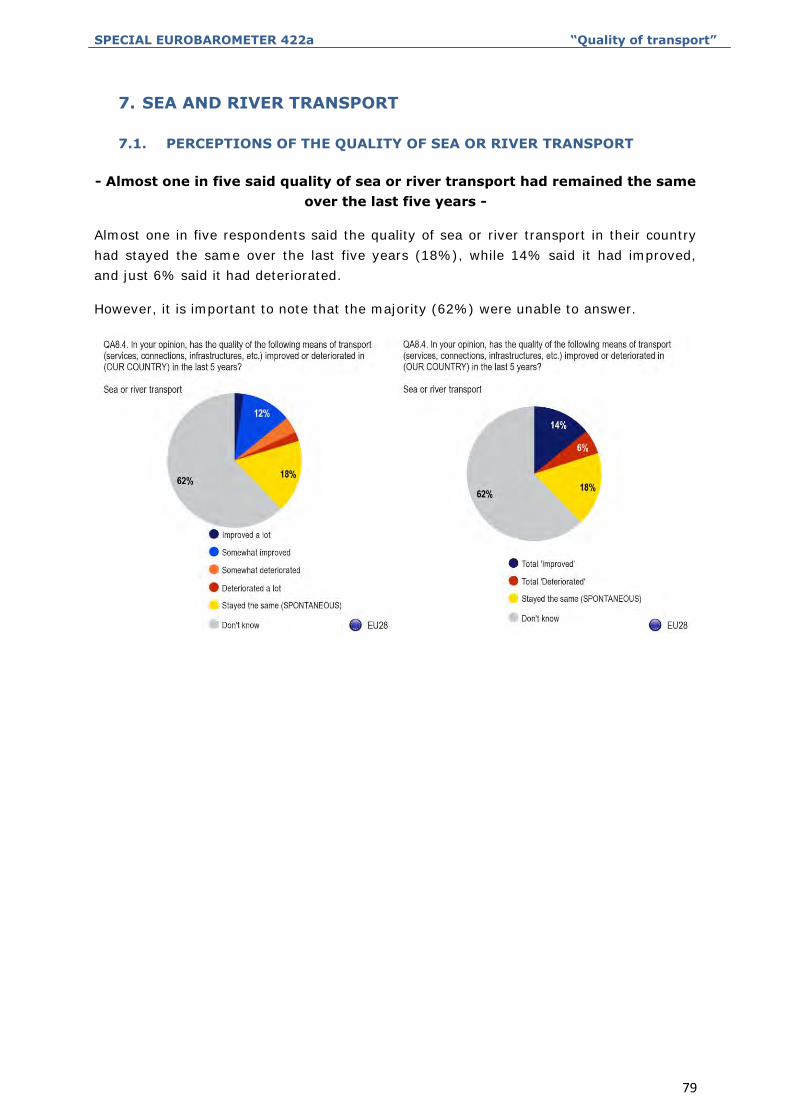
SPECIAL EUROBAROMETER 422a “Quality of transport”
79
7. SEA AND RIVER TRANSPORT
7.1. PERCEPTIONS OF THE QUALITY OF SEA OR RIVER TRANSPORT
- Almost one in five said quality of sea or river transport had remained the same
over the last five years -
Almost one in five respondents said the quality of sea or river transport in their country
had stayed the same over the last five years (18%), while 14% said it had improved,
and just 6% said it had deteriorated.
However, it is important to note that the majority (62%) were unable to answer.
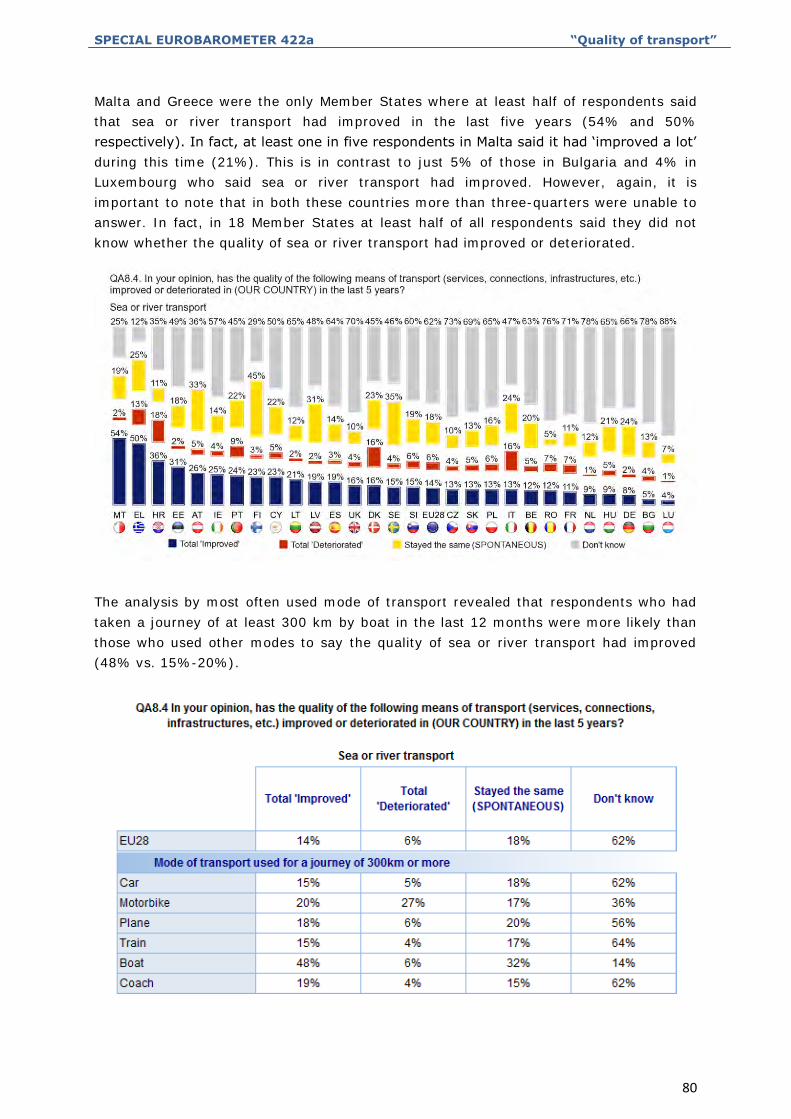
SPECIAL EUROBAROMETER 422a “Quality of transport”
80
Malta and Greece were the only Member States where at least half of respondents said
that sea or river transport had improved in the last five years (54% and 50%
respectively). In fact, at least one in five respondents in Malta said it had ‘improved a lot’
during this time (21%). This is in contrast to just 5% of those in Bulgaria and 4% in
Luxembourg who said sea or river transport had improved. However, again, it is
important to note that in both these countries more than three-quarters were unable to
answer. In fact, in 18 Member States at least half of all respondents said they did not
know whether the quality of sea or river transport had improved or deteriorated.
The analysis by most often used mode of transport revealed that respondents who had
taken a journey of at least 300 km by boat in the last 12 months were more likely than
those who used other modes to say the quality of sea or river transport had improved
(48% vs. 15%-20%).
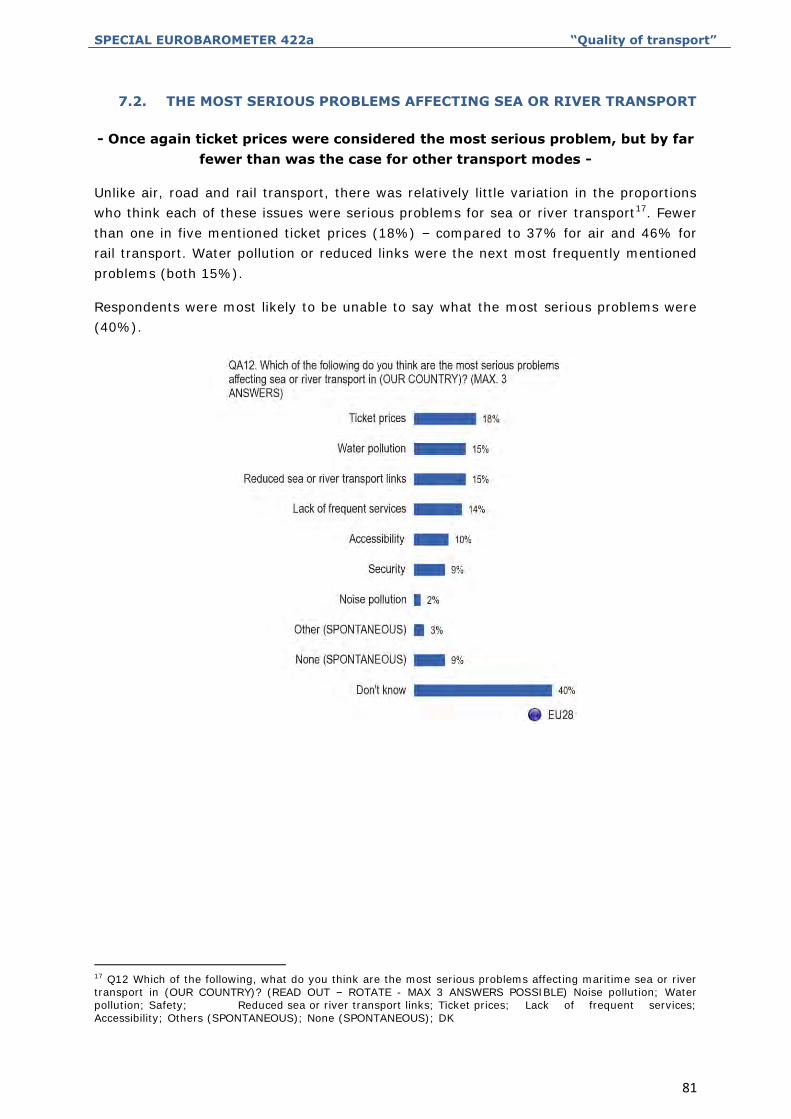
SPECIAL EUROBAROMETER 422a “Quality of transport”
81
7.2. THE MOST SERIOUS PROBLEMS AFFECTING SEA OR RIVER TRANSPORT
- Once again ticket prices were considered the most serious problem, but by far
fewer than was the case for other transport modes -
Unlike air, road and rail transport, there was relatively little variation in the proportions
who think each of these issues were serious problems for sea or river transport17. Fewer
than one in five mentioned ticket prices (18%) – compared to 37% for air and 46% for
rail transport. Water pollution or reduced links were the next most frequently mentioned
problems (both 15%).
Respondents were most likely to be unable to say what the most serious problems were
(40%).
17 Q12 Which of the following, what do you think are the most serious problems affecting maritime sea or river transport in (OUR COUNTRY)? (READ OUT – ROTATE - MAX 3 ANSWERS POSSIBLE) Noise pollution; Water pollution; Safety; Reduced sea or river transport links; Ticket prices; Lack of frequent services; Accessibility; Others (SPONTANEOUS); None (SPONTANEOUS); DK
SPECIAL EUROBAROMETER 422a “Quality of transport”
82
In nine Member States, ticket prices was the most mentioned answer given by
respondents when asked about the most serious problems affecting sea or river transport
in their country: Greece, Cyprus, Croatia, Italy, Denmark, Malta, Spain, Estonia and
Ireland. Greece was the only country where at least half said this (54%), followed by
41% in Cyprus and 39% in Croatia.
In another nine Member states water pollution was the most mentioned problem,
particularly by those in Finland (36%), Sweden (27%) and Belgium (21%). Water
pollution was also mentioned by 23% of those in Austria, although this was not the most
mentioned problem in Austria.
Respondents in Austria were the most likely to mention reduced sea or river transport
links (34%) as the most serious problem, and this was the most mentioned problem for
respondents in Austria as for those in four other Member States: Slovakia (24%),
Hungary (21%), Portugal (18%) and Poland (17%). Nevertheless, respondents in Greece
(40%) were the most likely across the EU to mention reduced links as the most serious
problem of sea or river transport
Lack of frequent services was the most mentioned problem in Ireland (16%) and the
UK (11%), although it has been significantly more widely mentioned by respondents in
Greece (33%).
Those in the Czech Republic (27%), Slovenia (23%), Latvia (20%) and Lithuania (18%)
were most likely to mention accessibility, and this was also mentioned by 20% of those
in Slovakia.
Respondents in Italy were the most likely across the EU to mention security as a serious
problem for sea and river transport (22%).
Respondents in Austria were the most likely to mention noise pollution (6%), as they
were in the case of the other modes of transport discussed in previous sections.
Across the EU it was respondents in Luxembourg who were the least likely to mention
almost all of these problems, with the exceptions of accessibility (Finland 1%).
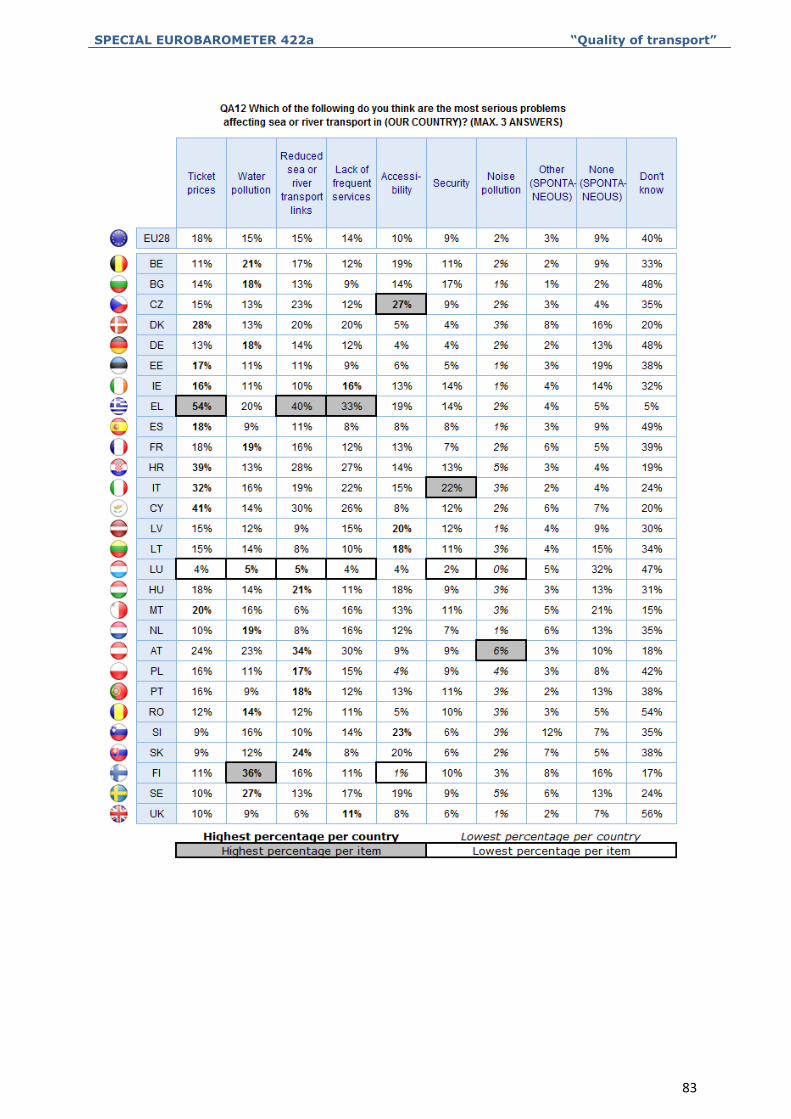
SPECIAL EUROBAROMETER 422a “Quality of transport”
83
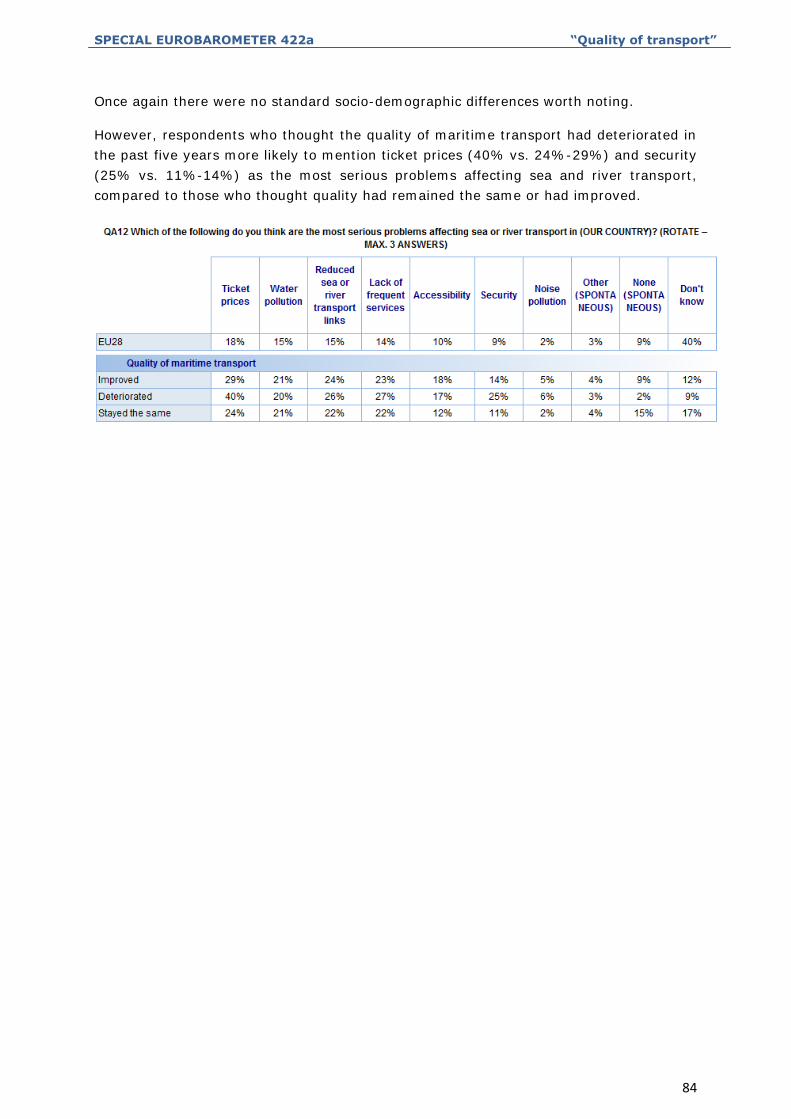
SPECIAL EUROBAROMETER 422a “Quality of transport”
84
Once again there were no standard socio-demographic differences worth noting.
However, respondents who thought the quality of maritime transport had deteriorated in
the past five years more likely to mention ticket prices (40% vs. 24%-29%) and security
(25% vs. 11%-14%) as the most serious problems affecting sea and river transport,
compared to those who thought quality had remained the same or had improved.
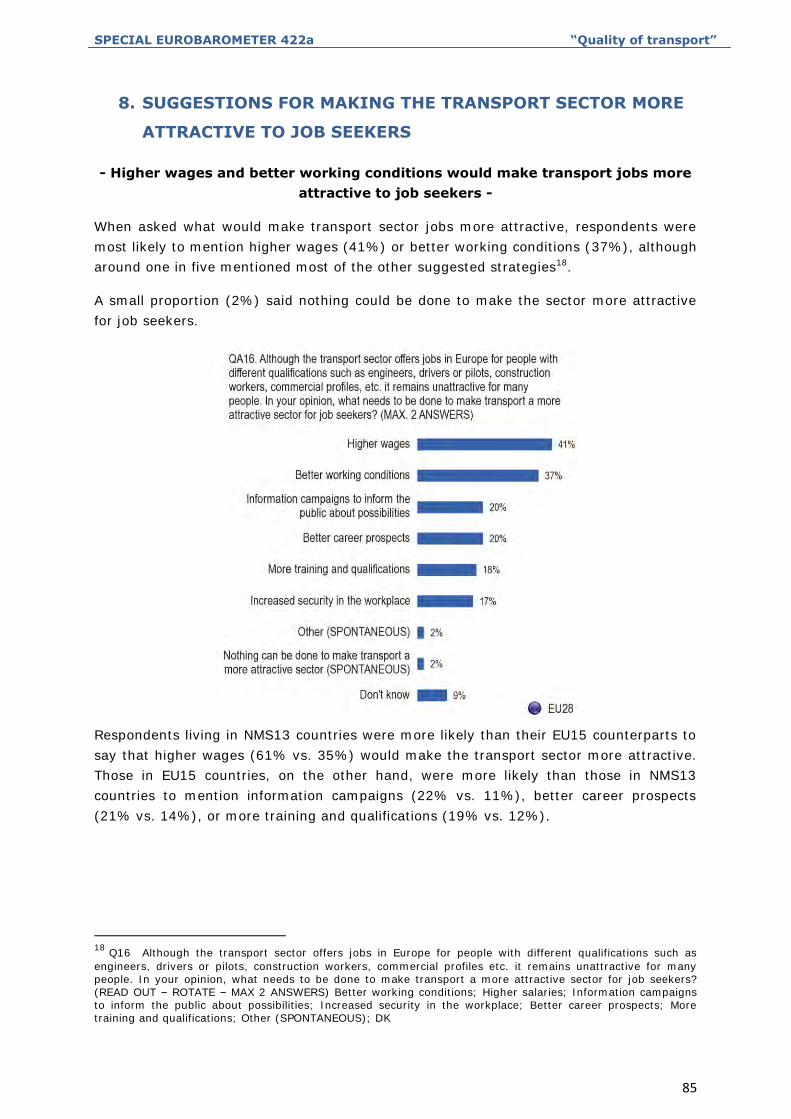
SPECIAL EUROBAROMETER 422a “Quality of transport”
85
8. SUGGESTIONS FOR MAKING THE TRANSPORT SECTOR MORE
ATTRACTIVE TO JOB SEEKERS
- Higher wages and better working conditions would make transport jobs more
attractive to job seekers -
When asked what would make transport sector jobs more attractive, respondents were
most likely to mention higher wages (41%) or better working conditions (37%), although
around one in five mentioned most of the other suggested strategies18.
A small proportion (2%) said nothing could be done to make the sector more attractive
for job seekers.
Respondents living in NMS13 countries were more likely than their EU15 counterparts to
say that higher wages (61% vs. 35%) would make the transport sector more attractive.
Those in EU15 countries, on the other hand, were more likely than those in NMS13
countries to mention information campaigns (22% vs. 11%), better career prospects
(21% vs. 14%), or more training and qualifications (19% vs. 12%).
18
Q16 Although the transport sector offers jobs in Europe for people with different qualifications such as
engineers, drivers or pilots, construction workers, commercial profiles etc. it remains unattractive for many people. In your opinion, what needs to be done to make transport a more attractive sector for job seekers? (READ OUT – ROTATE – MAX 2 ANSWERS) Better working conditions; Higher salaries; Information campaigns to inform the public about possibilities; Increased security in the workplace; Better career prospects; More training and qualifications; Other (SPONTANEOUS); DK
SPECIAL EUROBAROMETER 422a “Quality of transport”
86
At least half of all respondents in 14 Member States said that higher wages would make
the transport sector more attractive. This was particularly the case amongst respondents
in Slovakia (72%), Bulgaria (70%) and Lithuania (69%). Luxembourg was the only
country where fewer than one quarter mentioned higher wages (24%).
At least one quarter of respondents in all but one Member State (Ireland: 24%) said
better working conditions would make the transport sector more attractive to job
seekers, although Sweden was the only country where the majority said this (51%).
Better working conditions were widely mentioned by those in Slovakia, Croatia (both
47%), Austria and Finland (both 46%).
Those in Italy were the most likely to mention information campaigns, and this was
also the most mentioned solution by these respondents (32%). Information campaigns
were also mentioned by 28% in France, and 25% in the Netherlands, but only 7% in
Lithuania and Slovenia. Respondents in Italy were also the most likely to mention
increased workplace security (28%), followed by those in Greece and Sweden (both
27%).
Respondents in Ireland were the most likely across the EU to mention better career
prospects (33%) and more training and qualifications (27%). In fact at least one in
ten respondents in each Member State mentioned each of these options for making the
transport sector more attractive.
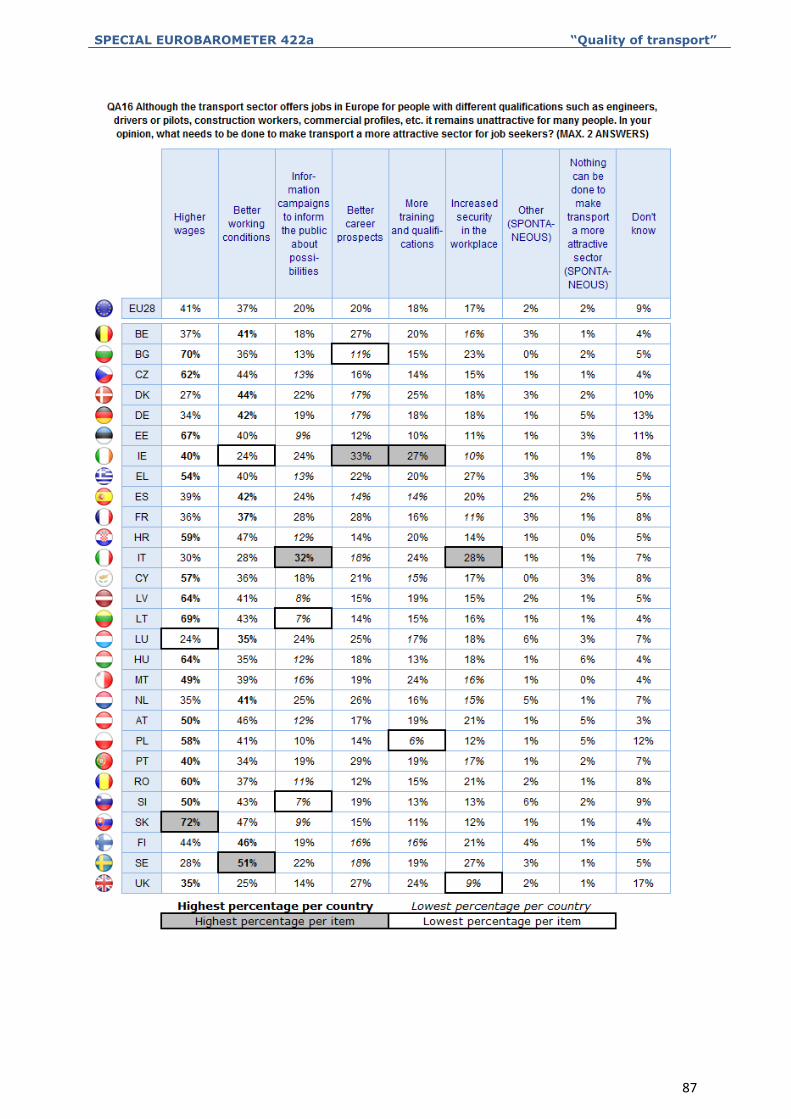
SPECIAL EUROBAROMETER 422a “Quality of transport”
87
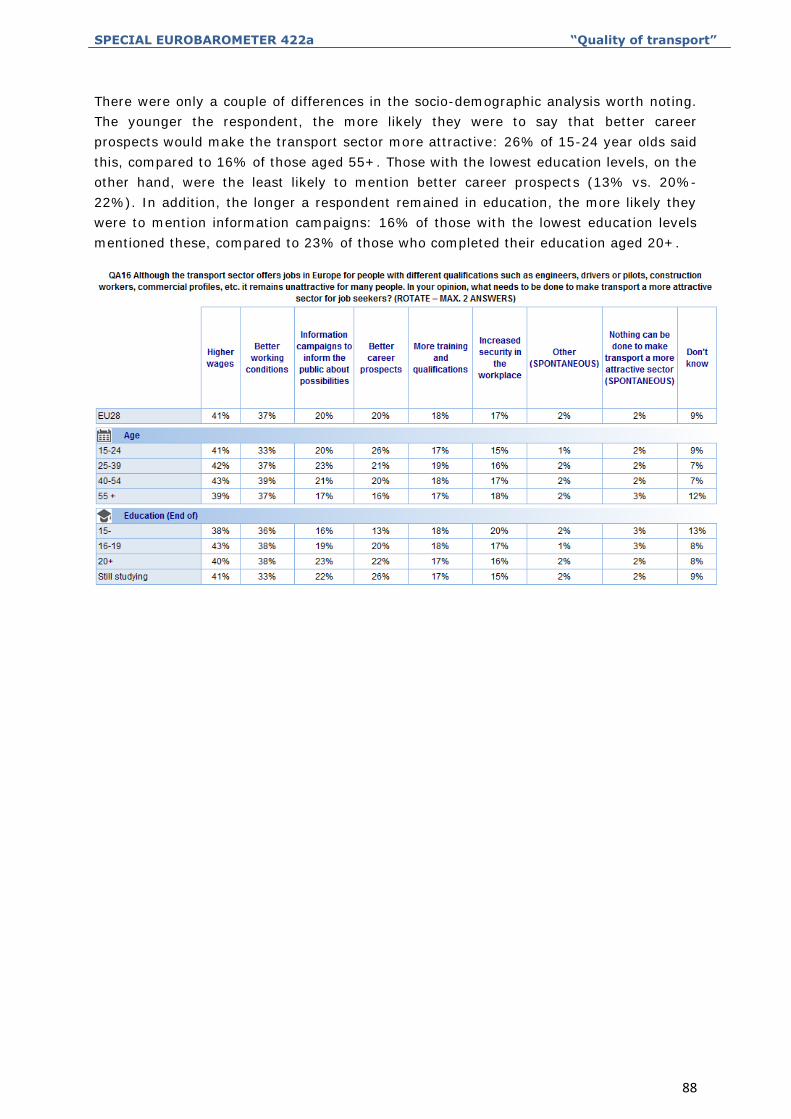
SPECIAL EUROBAROMETER 422a “Quality of transport”
88
There were only a couple of differences in the socio-demographic analysis worth noting.
The younger the respondent, the more likely they were to say that better career
prospects would make the transport sector more attractive: 26% of 15-24 year olds said
this, compared to 16% of those aged 55+. Those with the lowest education levels, on the
other hand, were the least likely to mention better career prospects (13% vs. 20%-
22%). In addition, the longer a respondent remained in education, the more likely they
were to mention information campaigns: 16% of those with the lowest education levels
mentioned these, compared to 23% of those who completed their education aged 20+.
SPECIAL EUROBAROMETER 422a “Quality of transport”
89
CONCLUSIONS
This survey highlighted the dominance of the car as the preferred mode of transport for
both daily and longer trips, particularly for those living in central areas of the EU. Those
in Eastern Member States were the most likely to use urban public transport or to walk
as a daily travel option, although the car was still the dominant choice in these countries
as well.
Opinion was divided about the quality of road transport, with almost equal proportions
saying it had improved or deteriorated. Whatever the opinion on quality, most considered
congestion and maintenance to be the most serious problems affecting roads. Improving
road maintenance was cited as the top priority for improving road safety, although there
was also widespread support for zero alcohol tolerance. One plan to combat congestion is
to have vehicles connected online to allow for better traffic management and advice;
however, this proposal does not have widespread support, with just over one in ten
willing to have their vehicles connected unconditionally.
Most respondents felt the quality of air transport had improved or remained the same
over the last five years, with air travellers more likely to think this way compared to
those who had not taken a plane within the EU. The current ban on liquids over a certain
amount is not a major issue: just over half said it wasn’t important to them to be able to
bring more liquids on board than is currently allowed. In fact, ticket prices were by far
the most mentioned problem for air transport.
Ticket prices were also the most mentioned problem for rail transport, and a lack of
reliable or punctual services was also widely mentioned. In spite of this most Europeans
felt the quality of rail transport had improved or remained the same over the last five
years.
Most respondents were unable to comment on the quality of sea or river transport, but
those who gave an opinion generally thought the quality had stayed the same, or had
improved. Once again ticket prices were considered to be the main problem for this form
of transport, although reduced links, a lack of frequent services and water pollution were
mentioned almost as often.
For both long journeys and daily travelling convenience and speed were generally more
likely than price to be key reasons for choosing a particular mode of transport. Public
transport was the only exception. Public transport users were more likely to consider
price over speed, although convenience was still their primary reason for choosing public
transport over other modes.
Encouraging vehicle users to choose public transport will need to address factors of
convenience and speed. To convince people to switch to public transport also requires a
frequent service with better coverage, and cheaper or more long-term tickets. It is also
important that public transport be reliable.

ANNEXES
TECHNICAL SPECIFICATIONS
SPECIAL EUROBAROMETER 422a “Quality of transport”
TS1
SPECIAL EUROBAROMETER 422a
Quality of transport
TECHNICAL SPECIFICATIONS
Between the 11th and the 20th of October 2014, TNS opinion & social, a consortium created between
TNS political & social, TNS UK and TNS opinion, carried out the wave 82.2 of the EUROBAROMETER survey, on
request of the EUROPEAN COMMISSION, Directorate-General for Communication, “Strategy, Corporate
Communication Actions and Eurobarometer” unit.
The Special Eurobarometer 422a is part of the wave 82.2 and covers the population of the respective nationalities
of the European Union Member States, resident in each of the Member States and aged 15 years and over.
The basic sample design applied in all states is a multi-stage, random (probability) one. In each country, a
number of sampling points was drawn with probability proportional to population size (for a total coverage of the
country) and to population density.
In order to do so, the sampling points were drawn systematically from each of the "administrative regional units",
after stratification by individual unit and type of area. They thus represent the whole territory of the countries
surveyed according to the EUROSTAT NUTS II (or equivalent) and according to the distribution of the resident
population of the respective nationalities in terms of metropolitan, urban and rural areas. In each of the selected
sampling points, a starting address was drawn, at random. Further addresses (every Nth address) were selected
by standard "random route" procedures, from the initial address. In each household, the respondent was drawn,
at random (following the "closest birthday rule"). All interviews were conducted face-to-face in people's homes
and in the appropriate national language. As far as the data capture is concerned, CAPI (Computer Assisted
Personal Interview) was used in those countries where this technique was available.
For each country a comparison between the sample and the universe was carried out. The Universe description
was derived from Eurostat population data or from national statistics offices. For all countries surveyed, a national
weighting procedure, using marginal and intercellular weighting, was carried out based on this Universe
description. In all countries, gender, age, region and size of locality were introduced in the iteration procedure.
For international weighting (i.e. EU averages), TNS Opinion & Social applies the official population figures as
provided by EUROSTAT or national statistic offices. The total population figures for input in this post-weighting
procedure are listed below.
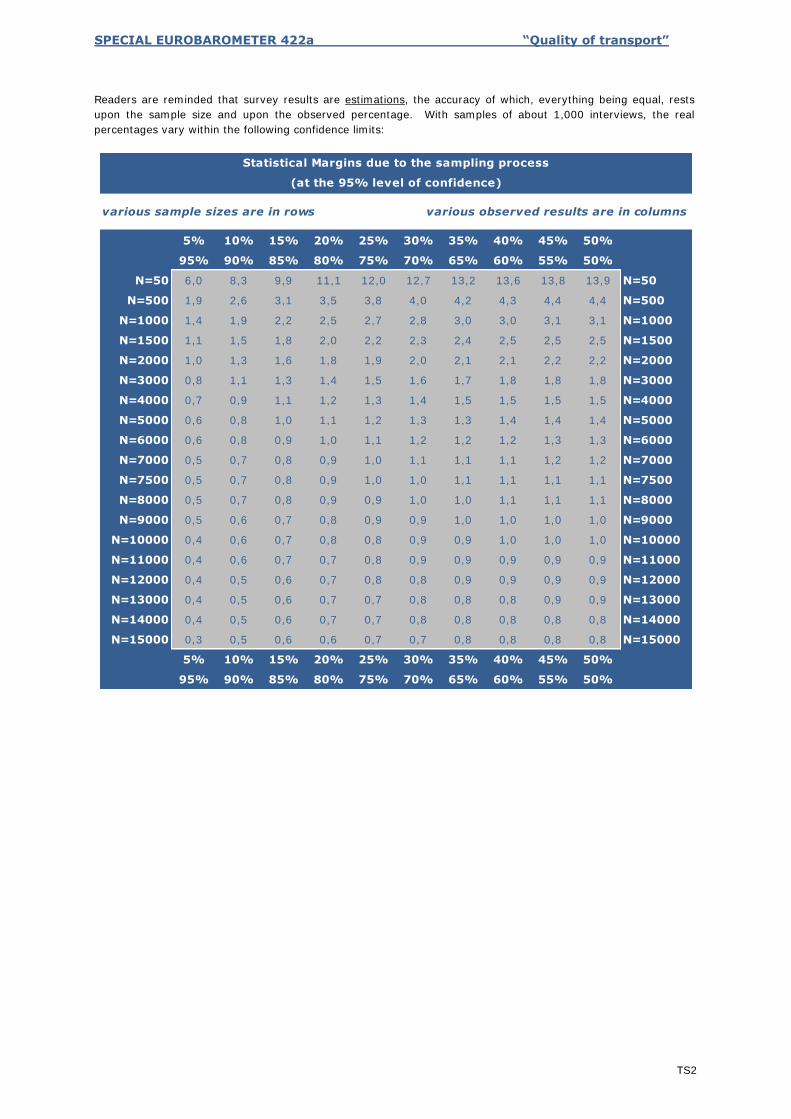
SPECIAL EUROBAROMETER 422a “Quality of transport”
TS2
Readers are reminded that survey results are estimations, the accuracy of which, everything being equal, rests
upon the sample size and upon the observed percentage. With samples of about 1,000 interviews, the real
percentages vary within the following confidence limits:
various sample sizes are in rows various observed results are in columns
5% 10% 15% 20% 25% 30% 35% 40% 45% 50%
95% 90% 85% 80% 75% 70% 65% 60% 55% 50%
N=50 6,0 8,3 9,9 11,1 12,0 12,7 13,2 13,6 13,8 13,9 N=50
N=500 1,9 2,6 3,1 3,5 3,8 4,0 4,2 4,3 4,4 4,4 N=500
N=1000 1,4 1,9 2,2 2,5 2,7 2,8 3,0 3,0 3,1 3,1 N=1000
N=1500 1,1 1,5 1,8 2,0 2,2 2,3 2,4 2,5 2,5 2,5 N=1500
N=2000 1,0 1,3 1,6 1,8 1,9 2,0 2,1 2,1 2,2 2,2 N=2000
N=3000 0,8 1,1 1,3 1,4 1,5 1,6 1,7 1,8 1,8 1,8 N=3000
N=4000 0,7 0,9 1,1 1,2 1,3 1,4 1,5 1,5 1,5 1,5 N=4000
N=5000 0,6 0,8 1,0 1,1 1,2 1,3 1,3 1,4 1,4 1,4 N=5000
N=6000 0,6 0,8 0,9 1,0 1,1 1,2 1,2 1,2 1,3 1,3 N=6000
N=7000 0,5 0,7 0,8 0,9 1,0 1,1 1,1 1,1 1,2 1,2 N=7000
N=7500 0,5 0,7 0,8 0,9 1,0 1,0 1,1 1,1 1,1 1,1 N=7500
N=8000 0,5 0,7 0,8 0,9 0,9 1,0 1,0 1,1 1,1 1,1 N=8000
N=9000 0,5 0,6 0,7 0,8 0,9 0,9 1,0 1,0 1,0 1,0 N=9000
N=10000 0,4 0,6 0,7 0,8 0,8 0,9 0,9 1,0 1,0 1,0 N=10000
N=11000 0,4 0,6 0,7 0,7 0,8 0,9 0,9 0,9 0,9 0,9 N=11000
N=12000 0,4 0,5 0,6 0,7 0,8 0,8 0,9 0,9 0,9 0,9 N=12000
N=13000 0,4 0,5 0,6 0,7 0,7 0,8 0,8 0,8 0,9 0,9 N=13000
N=14000 0,4 0,5 0,6 0,7 0,7 0,8 0,8 0,8 0,8 0,8 N=14000
N=15000 0,3 0,5 0,6 0,6 0,7 0,7 0,8 0,8 0,8 0,8 N=15000
5% 10% 15% 20% 25% 30% 35% 40% 45% 50%
95% 90% 85% 80% 75% 70% 65% 60% 55% 50%
Statistical Margins due to the sampling process
(at the 95% level of confidence)
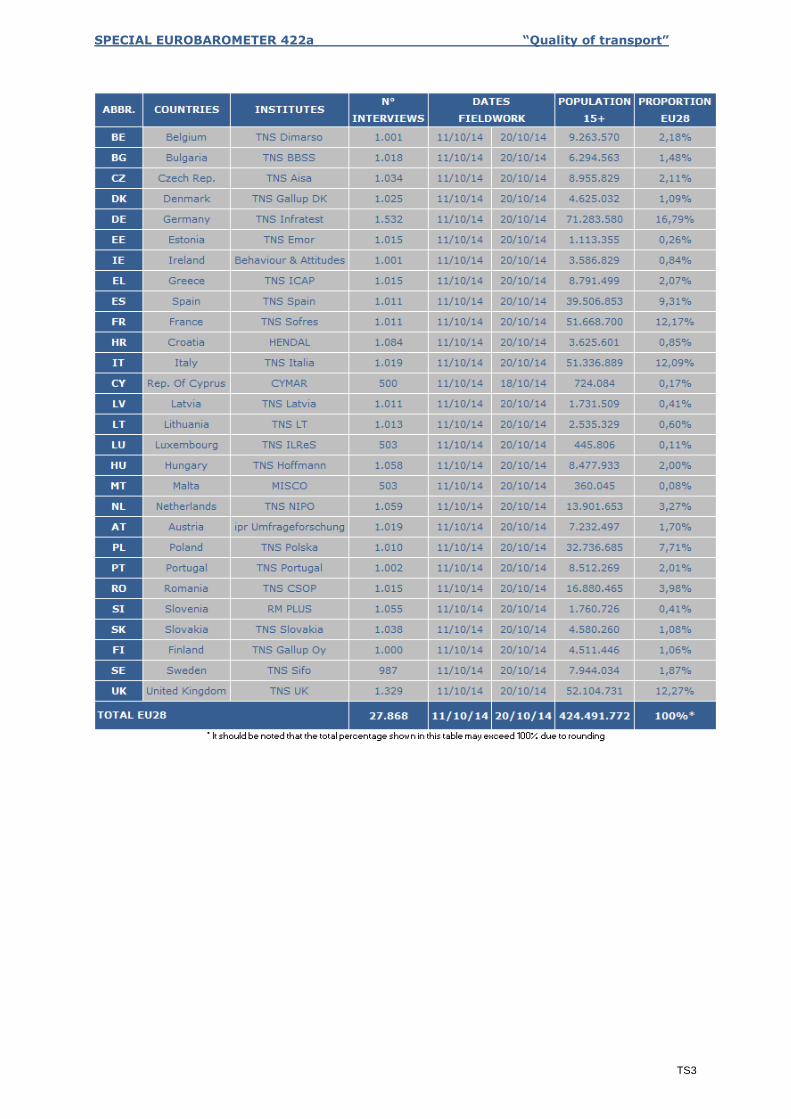
SPECIAL EUROBAROMETER 422a “Quality of transport”
TS3

QUESTIONNAIRE
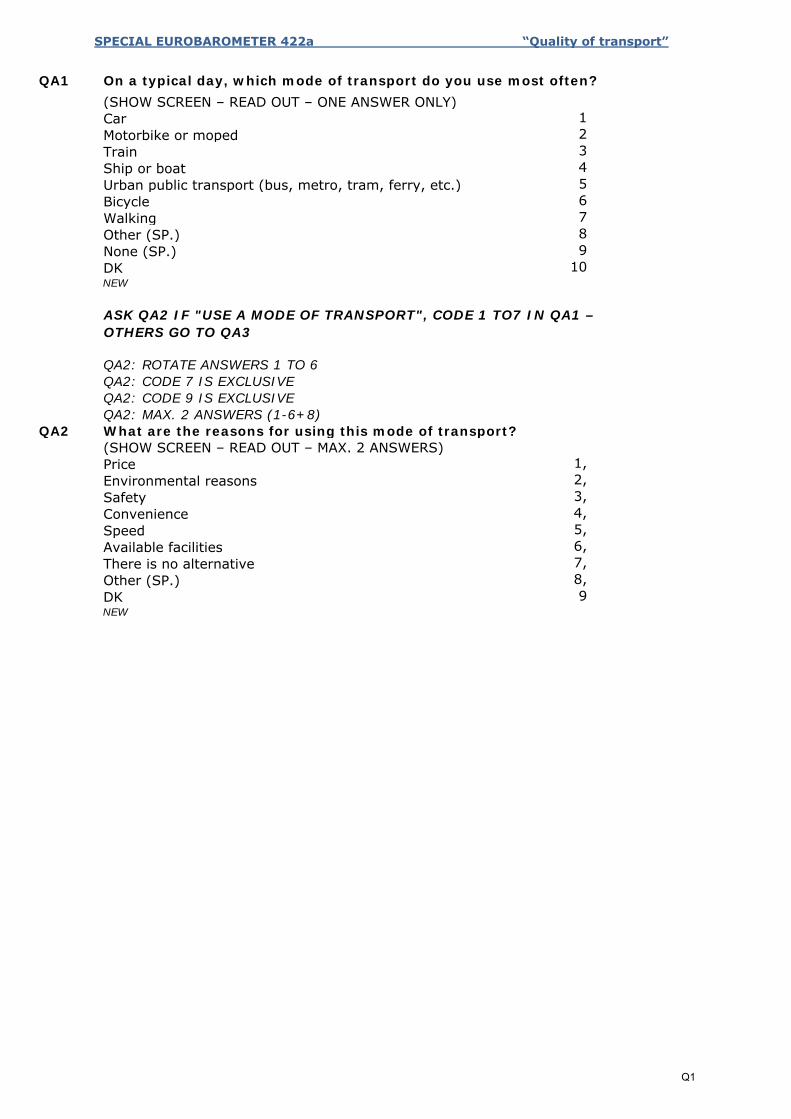
SPECIAL EUROBAROMETER 422a “Quality of transport”
QA1
123456789
10
QA2
1,2,3,4,5,6,7,8,9
Other (SP.)DKNEW
SpeedAvailable facilitiesThere is no alternative
Environmental reasonsSafetyConvenience
What are the reasons for using this mode of transport?(SHOW SCREEN – READ OUT – MAX. 2 ANSWERS)Price
QA2: CODE 7 IS EXCLUSIVEQA2: CODE 9 IS EXCLUSIVEQA2: MAX. 2 ANSWERS (1-6+8)
NEW
ASK QA2 IF "USE A MODE OF TRANSPORT", CODE 1 TO7 IN QA1 – OTHERS GO TO QA3
QA2: ROTATE ANSWERS 1 TO 6
Other (SP.)None (SP.)DK
Urban public transport (bus, metro, tram, ferry, etc.)BicycleWalking
Motorbike or mopedTrainShip or boat
On a typical day, which mode of transport do you use most often?(SHOW SCREEN – READ OUT – ONE ANSWER ONLY)Car
Q1
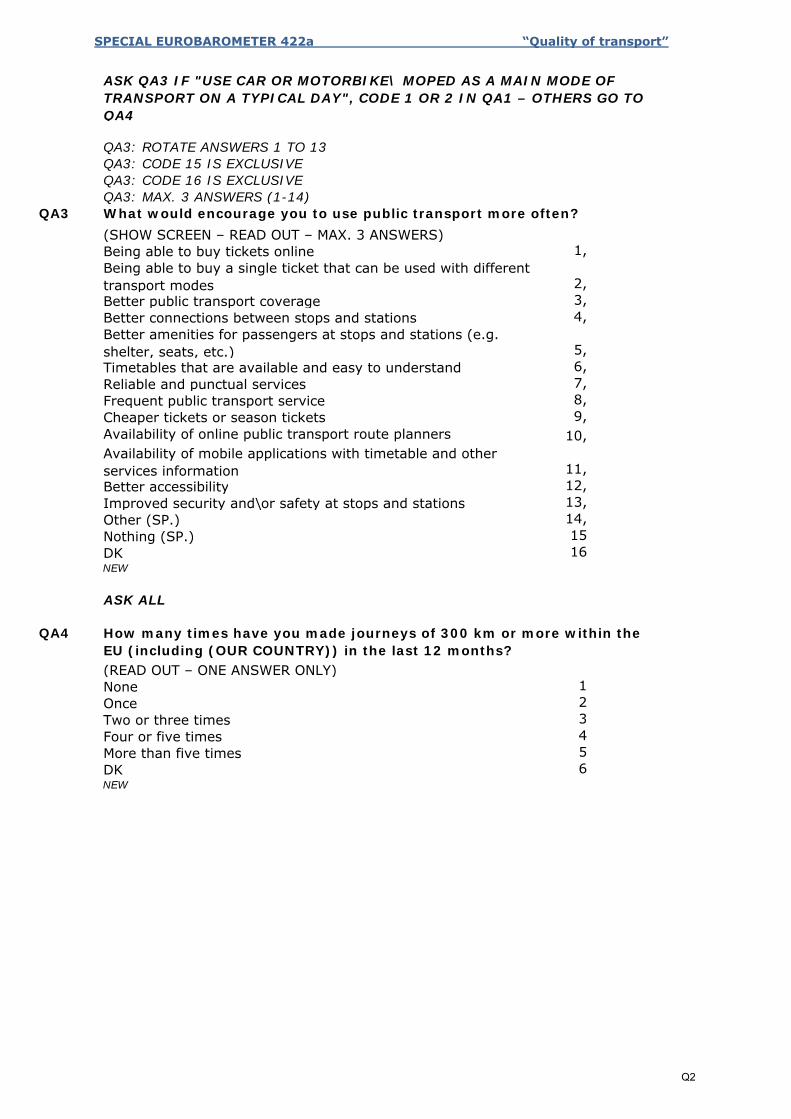
SPECIAL EUROBAROMETER 422a “Quality of transport”
QA3
1,
2,3,4,
5,6,7,8,9,
10,
11,12,13,14,1516
QA4
123456
NEW
Four or five timesMore than five timesDK
NoneOnceTwo or three times
ASK ALL
How many times have you made journeys of 300 km or more within the EU (including (OUR COUNTRY)) in the last 12 months?(READ OUT – ONE ANSWER ONLY)
Nothing (SP.)DKNEW
Better accessibilityImproved security and\or safety at stops and stationsOther (SP.)
Cheaper tickets or season ticketsAvailability of online public transport route plannersAvailability of mobile applications with timetable and other services information
Timetables that are available and easy to understandReliable and punctual servicesFrequent public transport service
Better public transport coverageBetter connections between stops and stationsBetter amenities for passengers at stops and stations (e.g. shelter, seats, etc.)
(SHOW SCREEN – READ OUT – MAX. 3 ANSWERS)Being able to buy tickets onlineBeing able to buy a single ticket that can be used with different transport modes
QA3: CODE 16 IS EXCLUSIVEQA3: MAX. 3 ANSWERS (1-14)What would encourage you to use public transport more often?
ASK QA3 IF "USE CAR OR MOTORBIKE\ MOPED AS A MAIN MODE OF TRANSPORT ON A TYPICAL DAY", CODE 1 OR 2 IN QA1 – OTHERS GO TO QA4
QA3: ROTATE ANSWERS 1 TO 13QA3: CODE 15 IS EXCLUSIVE
Q2
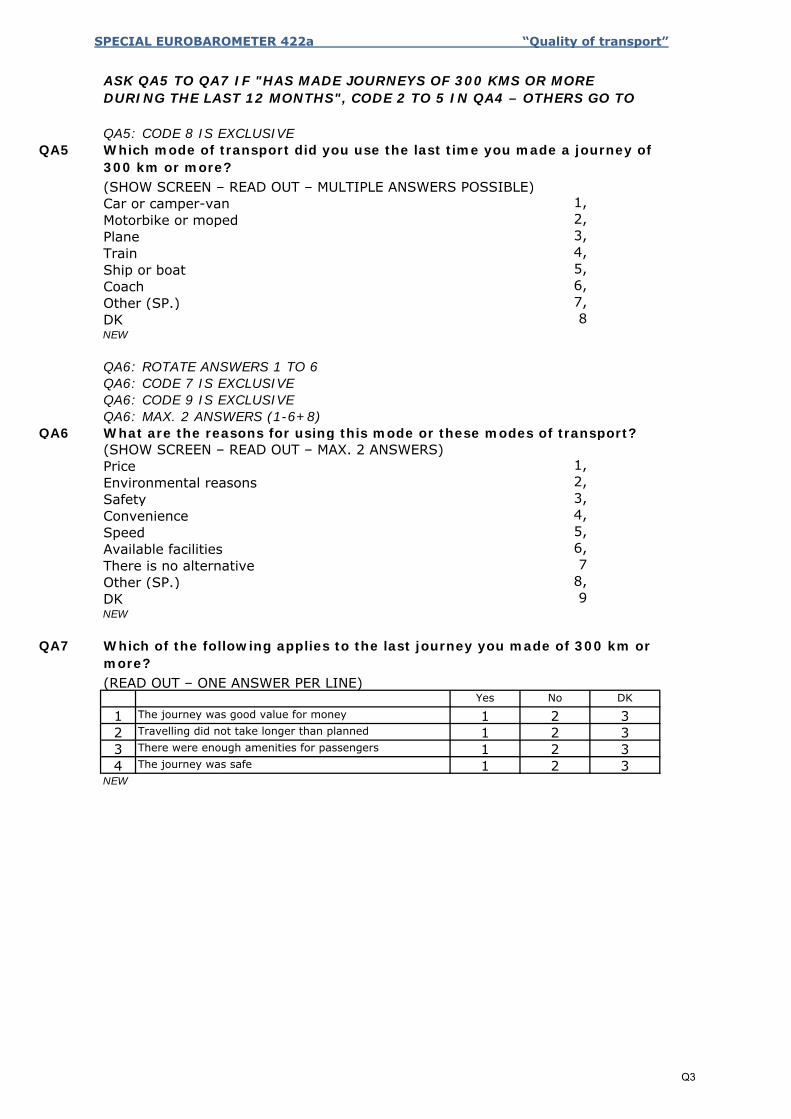
SPECIAL EUROBAROMETER 422a “Quality of transport”
QA5
1,2,3,4,5,6,7,8
QA6
1,2,3,4,5,6,7
8,9
QA7
1234
NEWThe journey was safe 1 2 3There were enough amenities for passengers 1 2 3Travelling did not take longer than planned 1 2 3The journey was good value for money 1 2 3
Which of the following applies to the last journey you made of 300 km or more?(READ OUT – ONE ANSWER PER LINE)
Yes No DK
Other (SP.)DKNEW
SpeedAvailable facilitiesThere is no alternative
Environmental reasonsSafetyConvenience
What are the reasons for using this mode or these modes of transport?(SHOW SCREEN – READ OUT – MAX. 2 ANSWERS)Price
QA6: CODE 7 IS EXCLUSIVEQA6: CODE 9 IS EXCLUSIVEQA6: MAX. 2 ANSWERS (1-6+8)
DKNEW
QA6: ROTATE ANSWERS 1 TO 6
Ship or boatCoachOther (SP.)
Motorbike or mopedPlaneTrain
Which mode of transport did you use the last time you made a journey of 300 km or more?(SHOW SCREEN – READ OUT – MULTIPLE ANSWERS POSSIBLE)Car or camper-van
ASK QA5 TO QA7 IF "HAS MADE JOURNEYS OF 300 KMS OR MORE DURING THE LAST 12 MONTHS", CODE 2 TO 5 IN QA4 – OTHERS GO TO
QA5: CODE 8 IS EXCLUSIVE
Q3
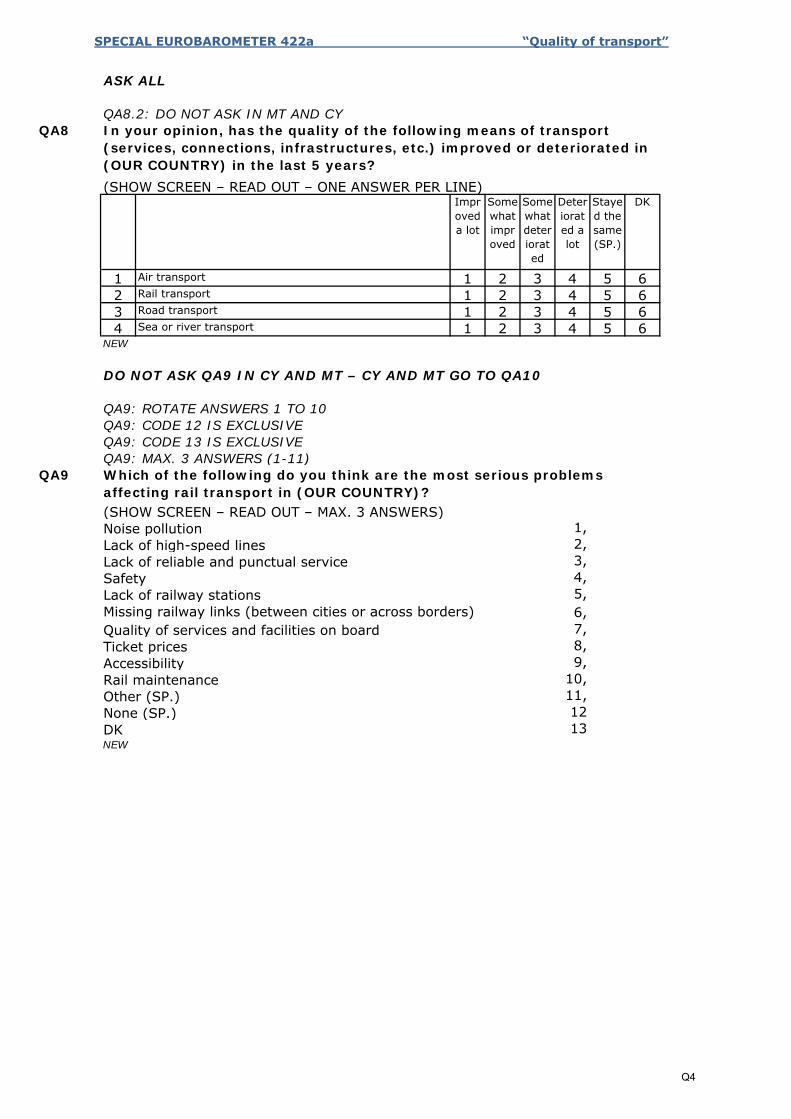
SPECIAL EUROBAROMETER 422a “Quality of transport”
QA8
Improved a lot
Somewhat improved
Somewhat deteriorated
Deteriorated a lot
Stayed the same (SP.)
DK
1 1 2 3 4 5 62 1 2 3 4 5 63 1 2 3 4 5 64 1 2 3 4 5 6
QA9
1,2,3,4,5,6,7,8,9,
10,11,1213
None (SP.)DKNEW
AccessibilityRail maintenanceOther (SP.)
Missing railway links (between cities or across borders)Quality of services and facilities on boardTicket prices
Lack of reliable and punctual serviceSafetyLack of railway stations
(SHOW SCREEN – READ OUT – MAX. 3 ANSWERS)Noise pollutionLack of high-speed lines
QA9: CODE 13 IS EXCLUSIVEQA9: MAX. 3 ANSWERS (1-11)Which of the following do you think are the most serious problems affecting rail transport in (OUR COUNTRY)?
DO NOT ASK QA9 IN CY AND MT – CY AND MT GO TO QA10
QA9: ROTATE ANSWERS 1 TO 10QA9: CODE 12 IS EXCLUSIVE
Road transportSea or river transport
NEW
Air transportRail transport
QA8.2: DO NOT ASK IN MT AND CYIn your opinion, has the quality of the following means of transport (services, connections, infrastructures, etc.) improved or deteriorated in (OUR COUNTRY) in the last 5 years?(SHOW SCREEN – READ OUT – ONE ANSWER PER LINE)
ASK ALL
Q4
SPECIAL EUROBAROMETER 422a “Quality of transport”
QA10
1,2,3,4,5,6,7,8,9,
10,1112
QA11
123456
QA12
1,2,3,4,5,6,7,8,9
10NEW
Other (SP.)None (SP.)DK
Ticket pricesLack of frequent servicesAccessibility
Water pollutionSafetyReduced sea or river transport links
Which of the following do you think are the most serious problems affecting sea or river transport in (OUR COUNTRY)?(SHOW SCREEN – READ OUT – MAX. 3 ANSWERS)Noise pollution
QA12: CODE 9 IS EXCLUSIVEQA12: CODE 10 IS EXCLUSIVEQA12: MAX. 3 ANSWERS (1-8)
DKNEW
QA12: ROTATE ANSWERS 1 TO 7
Not very importantNot at all importantNot applicable (SP.)
(READ OUT – ONE ANSWER ONLY)Very importantFairly important
DKNEW
After a decade of the ban on liquids, how important would it be for you to be able to bring liquids above the current limit through the security checkpoints at airports, in order to bring them with you on board the plane?
Availability of public transport to or from your closest airport Other (SP.)None (SP.)
Accessibility of facilities at airports (parking, lifts, toilets etc.)Airport services (shops, restaurants, lounges)Lack of destinations from your closest airport
SafetyLack of airportsTicket prices
(SHOW SCREEN – READ OUT – MAX. 3 ANSWERS)Noise pollutionAir pollution
QA10: CODE 12 IS EXCLUSIVEQA10: MAX. 3 ANSWERS (1-10)Which of the following do you think are the most serious problems affecting air transport in (OUR COUNTRY)?
ASK ALL
QA10: ROTATE ANSWERS 1 TO 9QA10: CODE 11 IS EXCLUSIVE
Q5
SPECIAL EUROBAROMETER 422a “Quality of transport”
QA13
1,2,3,4,5,6,7,8,9
10
QA14
1,2,3,4,5,6,7,8,9
10
QA15
12345
NEW
Yes, but only when you decide toNoDK
(READ OUT – ONE ANSWER ONLY)Yes, at all timesYes, at all times but only if your personal data is anonymised
DKNEW
With today’s technology, vehicles can be connected at all times. On the one hand this would allow a better traffic management and should make the journey easier and safer. On the other hand, it means that the vehicle’s location would be available online. Would you agree to have your vehicle connected or not?
Improved road maintenanceOther (SP.)None (SP.)
Easy and timely access to traffic information when travellingZero alcohol toleranceFrequent police controls
More training for driversStricter speed limitsStricter control on the use of electronic devices while driving
QA14: MAX. 3 ANSWERS (1-8)Which of the following do you think should be the priorities for improving safety on roads in (OUR COUNTRY)?(SHOW SCREEN – READ OUT – MAX. 3 ANSWERS)
QA14: ROTATE ANSWERS 1 TO 7QA14: CODE 9 IS EXCLUSIVEQA14: CODE 10 IS EXCLUSIVE
None (SP.)DKNEW
Road maintenanceThe amount of freight being transported by roadOther (SP.)
Air pollutionSafetyMissing road links (between cities or across borders)
(SHOW SCREEN – READ OUT – MAX. 3 ANSWERS)Road congestionNoise pollution
QA13: CODE 10 IS EXCLUSIVEQA13: MAX. 3 ANSWERS (1-8)Which of the following do you think are the most serious problems affecting roads in (OUR COUNTRY)?
QA13: ROTATE ANSWERS 1 TO 7QA13: CODE 9 IS EXCLUSIVE
Q6
SPECIAL EUROBAROMETER 422a “Quality of transport”
QA16
1,
2,
3,
4,
5,
6,
7,
8
9
QA16: CODE 9 IS EXCLUSIVE
QA16: MAX. 2 ANSWERS (1-7)
Although the transport sector offers jobs in Europe for people with
different qualifications such as engineers, drivers or pilots, construction
workers, commercial profiles, etc. it remains unattractive for many
people. In your opinion, what needs to be done to make transport a more
attractive sector for job seekers?
QA16: ROTATE ANSWERS 1 TO 6
QA16: CODE 8 IS EXCLUSIVE
More training and qualifications
Other (SP.)
Nothing can be done to make transport a more attractive sector
(SP.)
Information campaigns to inform the public about possibilities
Increased security in the workplace
Better career prospects
(SHOW SCREEN – READ OUT – MAX. 2 ANSWERS)
Better working conditions
Higher salaries
DKNEW
Q7

TABLES
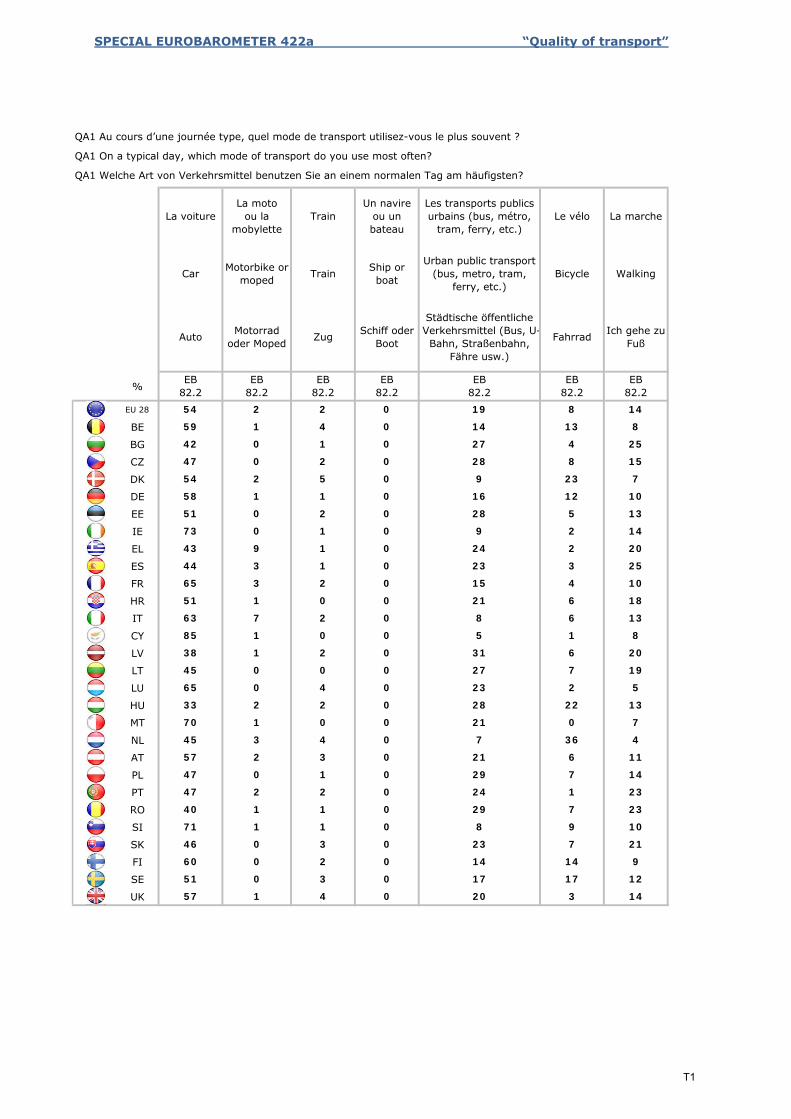
SPECIAL EUROBAROMETER 422a “Quality of transport”
%
EU 28
BE
BG
CZ
DK
DE
EE
IE
EL
ES
FR
HR
IT
CY
LV
LT
LU
HU
MT
NL
AT
PL
PT
RO
SI
SK
FI
SE
UK
Motorrad oder Moped
EB82.2
La voiture
Car
Auto
EB82.2
La moto ou la
mobylette
Motorbike or moped
Schiff oder Boot
EB82.2
Train
Train
Zug
EB82.2
Un navire ou un bateau
Ship or boat
Fahrrad
EB82.2
Les transports publics urbains (bus, métro,
tram, ferry, etc.)
Urban public transport (bus, metro, tram,
ferry, etc.)
Städtische öffentliche Verkehrsmittel (Bus, U-Bahn, Straßenbahn,
Fähre usw.)
EB82.2
Le vélo
Bicycle
La marche
Walking
Ich gehe zu Fuß
EB82.2
19 8 1454 2 2 0
859 1 4 0 14 13
42 0 1 0 27 4 25
1547 0 2 0 28 8
54 2 5 0 9 23 7
58 1 1 0 16 12 10
51 0 2 0 28 5 13
1473 0 1 0 9 2
43 9 1 0 24 2 20
2544 3 1 0 23 3
65 3 2 0 15 4 10
1851 1 0 0 21 6
63 7 2 0 8 6 13
885 1 0 0 5 1
38 1 2 0 31 6 20
1945 0 0 0 27 7
65 0 4 0 23 2 5
1333 2 2 0 28 22
70 1 0 0 21 0 7
445 3 4 0 7 36
57 2 3 0 21 6 11
1447 0 1 0 29 7
47 2 2 0 24 1 23
2340 1 1 0 29 7
71 1 1 0 8 9 10
2146 0 3 0 23 7
60 0 2 0 14 14 9
1251 0 3 0 17 17
57 1 4 0 20 3 14
QA1 Au cours d’une journée type, quel mode de transport utilisez-vous le plus souvent ?
QA1 On a typical day, which mode of transport do you use most often?
QA1 Welche Art von Verkehrsmittel benutzen Sie an einem normalen Tag am häufigsten?
T1
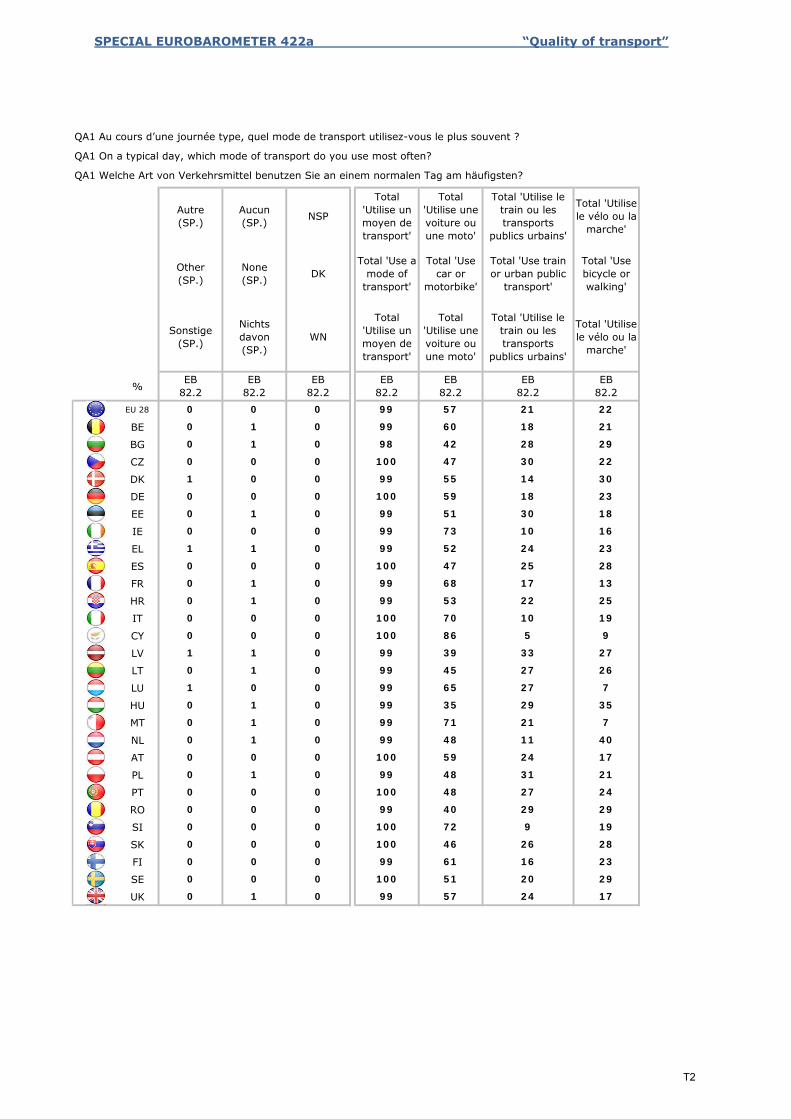
SPECIAL EUROBAROMETER 422a “Quality of transport”
%
EU 28
BE
BG
CZ
DK
DE
EE
IE
EL
ES
FR
HR
IT
CY
LV
LT
LU
HU
MT
NL
AT
PL
PT
RO
SI
SK
FI
SE
UK 24 170 1 0 99 57
0 0 100 51 20 29
16 23
0
0 0 0 99 61
0 0 100 46 26 28
9 19
0
0 0 0 100 72
0 0 99 40 29 29
27 24
0
0 0 0 100 48
1 0 99 48 31 21
24 17
0
0 0 0 100 59
1 0 99 48 11 40
21 7
0
0 1 0 99 71
1 0 99 35 29 35
27 7
0
1 0 0 99 65
1 0 99 45 27 26
33 27
0
1 1 0 99 39
0 0 100 86 5 9
10 19
0
0 0 0 100 70
1 0 99 53 22 25
17 13
0
0 1 0 99 68
0 0 100 47 25 28
24 23
0
1 1 0 99 52
0 0 99 73 10 16
30 18
0
0 1 0 99 51
0 0 100 59 18 23
14 30
0
1 0 0 99 55
0 0 100 47 30 22
28 29
0
0 1 0 98 42
1 0 99 60 18 21
21 22
0
0 0 0 99 57
EB82.2
EB82.2
EB82.2
EB82.2
EB82.2
EB82.2
Total 'Utilise le train ou les transports
publics urbains'
Total 'Utilise le vélo ou la
marche'
EB82.2
Sonstige (SP.)
Nichts davon (SP.)
WN
Total 'Utilise un moyen de transport'
Total 'Utilise une voiture ou une moto'
None (SP.) DK
Total 'Use a mode of
transport'
Total 'Use car or
motorbike'
Total 'Use train or urban public
transport'
Total 'Use bicycle or walking'
Total 'Utilise le train ou les transports
publics urbains'
Total 'Utilise le vélo ou la
marche'
Other (SP.)
Autre (SP.)
Aucun (SP.) NSP
Total 'Utilise un moyen de transport'
Total 'Utilise une voiture ou une moto'
QA1 Au cours d’une journée type, quel mode de transport utilisez-vous le plus souvent ?
QA1 On a typical day, which mode of transport do you use most often?
QA1 Welche Art von Verkehrsmittel benutzen Sie an einem normalen Tag am häufigsten?
T2
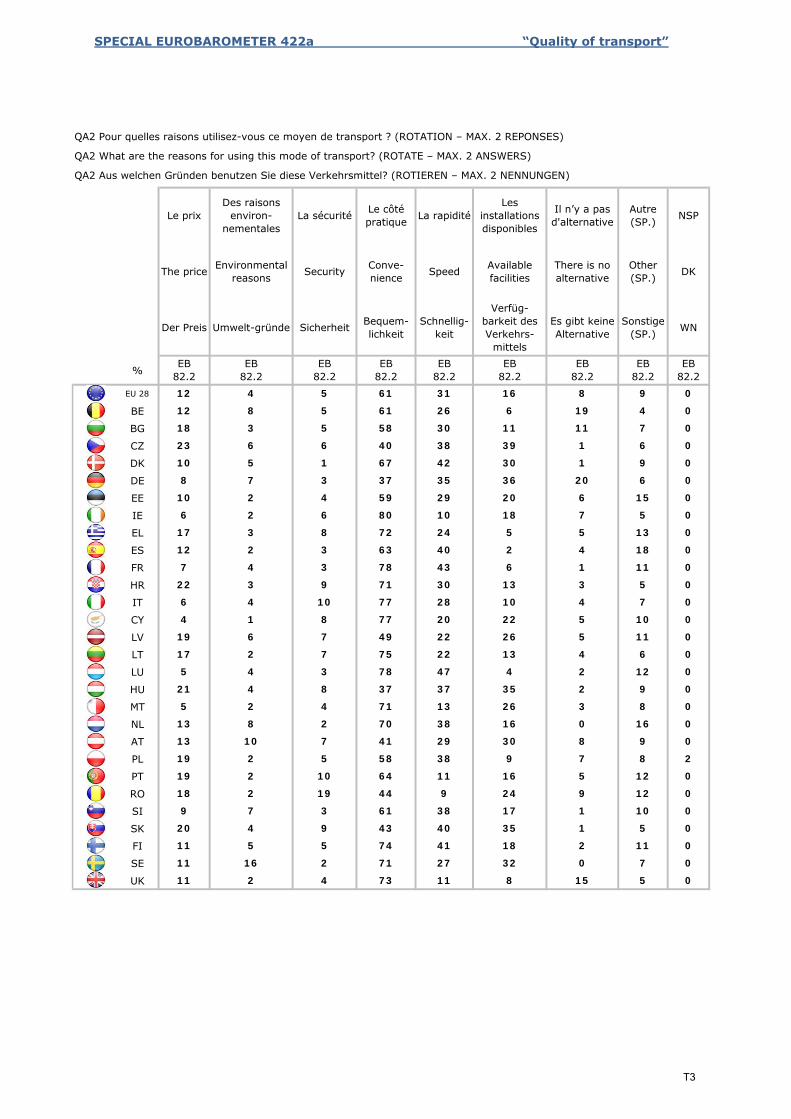
SPECIAL EUROBAROMETER 422a “Quality of transport”
%
EU 28
BE
BG
CZ
DK
DE
EE
IE
EL
ES
FR
HR
IT
CY
LV
LT
LU
HU
MT
NL
AT
PL
PT
RO
SI
SK
FI
SE
UK
Le prix
The price
Der Preis
EB82.2
La sécurité
Security
Sicherheit
EB82.2
Des raisons environ-
nementales
Environmental reasons
Umwelt-gründe
EB82.2
La rapidité
Speed
Schnellig-keit
EB82.2
Le côté pratique
Conve-nience
Bequem-lichkeit
EB82.2
Il n’y a pas d'alternative
There is no alternative
Es gibt keine Alternative
EB82.2
Les installations disponibles
Available facilities
Verfüg-barkeit des Verkehrs-
mittelsEB
82.2
NSP
DK
WN
EB82.2
Autre (SP.)
Other (SP.)
Sonstige (SP.)
EB82.2
31 16 8 912 4 5 61 0
12 8 5 61 26 6 19 4 0
30 11 11 718 3 5 58 0
23 6 6 40 38 39 1 6 0
042 30 1 910 5 1 67
035 36 20 68 7 3 37
29 20 6 1510 2 4 59 0
6 2 6 80 10 18 7 5 0
24 5 5 1317 3 8 72 0
12 2 3 63 40 2 4 18 0
43 6 1 117 4 3 78 0
22 3 9 71 30 13 3 5 0
28 10 4 76 4 10 77 0
4 1 8 77 20 22 5 10 0
22 26 5 1119 6 7 49 0
17 2 7 75 22 13 4 6 0
47 4 2 125 4 3 78 0
21 4 8 37 37 35 2 9 0
13 26 3 85 2 4 71 0
13 8 2 70 38 16 0 16 0
29 30 8 913 10 7 41 0
19 2 5 58 38 9 7 8 2
11 16 5 1219 2 10 64 0
18 2 19 44 9 24 9 12 0
38 17 1 109 7 3 61 0
20 4 9 43 40 35 1 5 0
41 18 2 1111 5 5 74 0
11 16 2 71 27 32 0 7 0
011 8 15 511 2 4 73
QA2 Pour quelles raisons utilisez-vous ce moyen de transport ? (ROTATION – MAX. 2 REPONSES)
QA2 What are the reasons for using this mode of transport? (ROTATE – MAX. 2 ANSWERS)
QA2 Aus welchen Gründen benutzen Sie diese Verkehrsmittel? (ROTIEREN – MAX. 2 NENNUNGEN)
T3
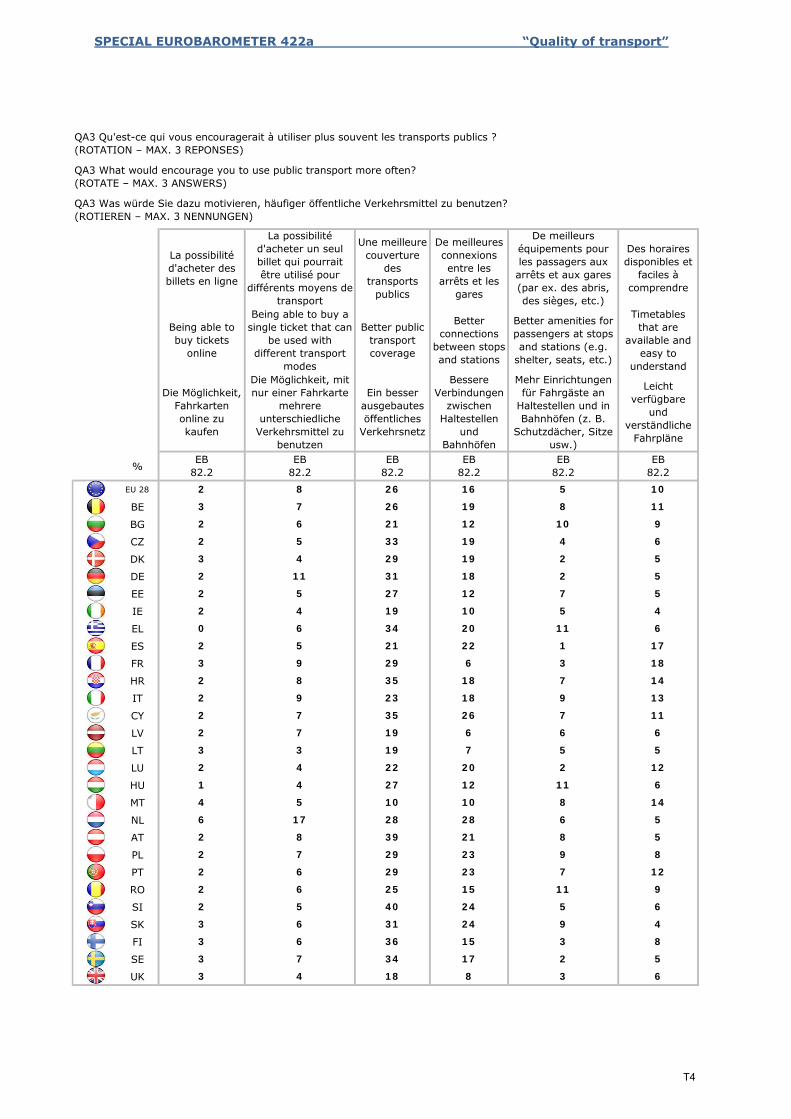
SPECIAL EUROBAROMETER 422a “Quality of transport”
%
EU 28
BE
BG
CZ
DK
DE
EE
IE
EL
ES
FR
HR
IT
CY
LV
LT
LU
HU
MT
NL
AT
PL
PT
RO
SI
SK
FI
SE
UK
Die Möglichkeit, mit nur einer Fahrkarte
mehrere unterschiedliche
Verkehrsmittel zu benutzen
EB82.2
La possibilité d'acheter des billets en ligne
Being able to buy tickets
online
Die Möglichkeit, Fahrkarten online zu kaufen
EB82.2
La possibilité d'acheter un seul billet qui pourrait être utilisé pour
différents moyens de transport
Being able to buy a single ticket that can
be used with different transport
modesBessere
Verbindungen zwischen
Haltestellen und
BahnhöfenEB
82.2
Une meilleure couverture
des transports
publics
Better public transport coverage
Ein besser ausgebautes öffentliches
Verkehrsnetz
EB82.2
De meilleures connexions entre les
arrêts et les gares
Better connections
between stops and stations
Leicht verfügbare
und verständliche
Fahrpläne
EB82.2
De meilleurs équipements pour les passagers aux arrêts et aux gares (par ex. des abris, des sièges, etc.)
Better amenities for passengers at stops and stations (e.g.
shelter, seats, etc.)
Mehr Einrichtungen für Fahrgäste an
Haltestellen und in Bahnhöfen (z. B.
Schutzdächer, Sitze usw.)
EB82.2
Des horaires disponibles et
faciles à comprendre
Timetables that are
available and easy to
understand
5 102 8 26 16
8 113 7 26 19
10 92 6 21 12
4 62 5 33 19
2 53 4 29 19
2 52 11 31 18
7 52 5 27 12
5 42 4 19 10
11 60 6 34 20
1 172 5 21 22
3 183 9 29 6
7 142 8 35 18
9 132 9 23 18
7 112 7 35 26
6 62 7 19 6
5 53 3 19 7
2 122 4 22 20
11 61 4 27 12
8 144 5 10 10
6 56 17 28 28
8 52 8 39 21
9 82 7 29 23
7 122 6 29 23
11 92 6 25 15
5 62 5 40 24
9 43 6 31 24
3 83 6 36 15
2 53 7 34 17
3 63 4 18 8
QA3 Qu'est-ce qui vous encouragerait à utiliser plus souvent les transports publics ? (ROTATION – MAX. 3 REPONSES)
QA3 What would encourage you to use public transport more often? (ROTATE – MAX. 3 ANSWERS)
QA3 Was würde Sie dazu motivieren, häufiger öffentliche Verkehrsmittel zu benutzen? (ROTIEREN – MAX. 3 NENNUNGEN)
T4
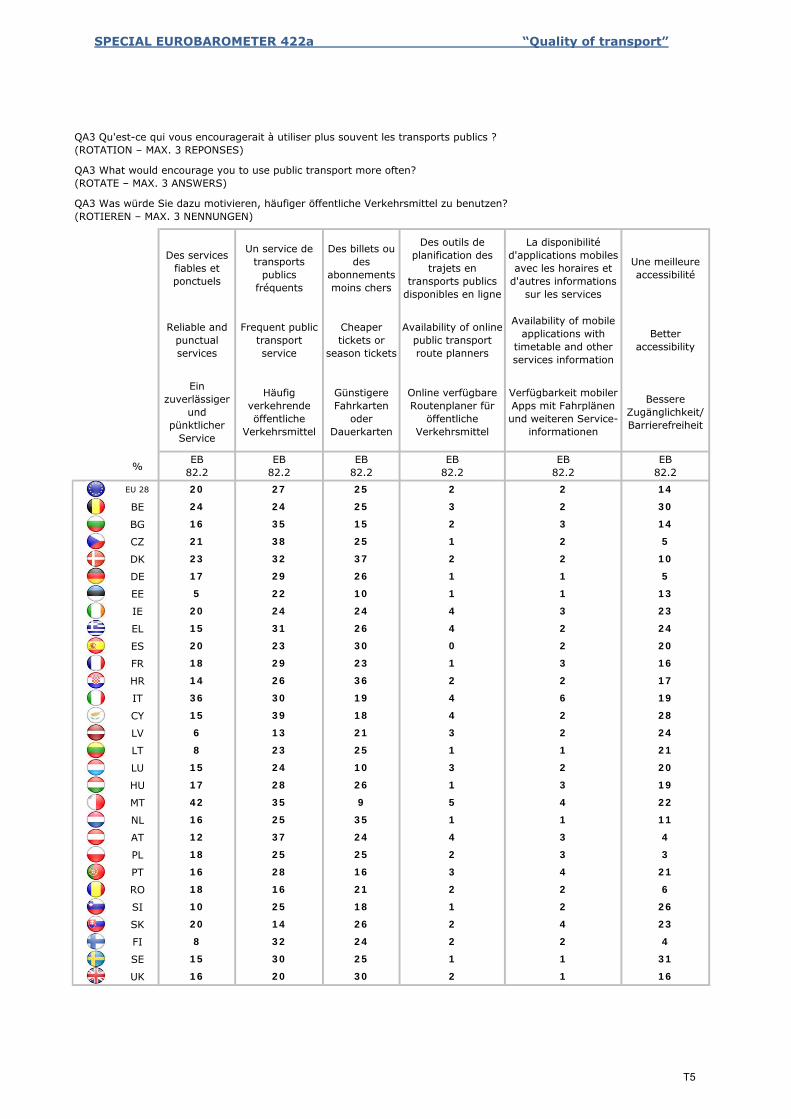
SPECIAL EUROBAROMETER 422a “Quality of transport”
%
EU 28
BE
BG
CZ
DK
DE
EE
IE
EL
ES
FR
HR
IT
CY
LV
LT
LU
HU
MT
NL
AT
PL
PT
RO
SI
SK
FI
SE
UK 16
31
16 20 30 2 1
4
15 30 25 1 1
23
8 32 24 2 2
26
20 14 26 2 4
6
10 25 18 1 2
21
18 16 21 2 2
3
16 28 16 3 4
4
18 25 25 2 3
11
12 37 24 4 3
22
16 25 35 1 1
19
42 35 9 5 4
20
17 28 26 1 3
21
15 24 10 3 2
24
8 23 25 1 1
28
6 13 21 3 2
19
15 39 18 4 2
17
36 30 19 4 6
16
14 26 36 2 2
20
18 29 23 1 3
24
20 23 30 0 2
23
15 31 26 4 2
13
20 24 24 4 3
5
5 22 10 1 1
10
17 29 26 1 1
5
23 32 37 2 2
14
21 38 25 1 2
30
16 35 15 2 3
14
24 24 25 3 2
EB82.2
20 27 25 2 2
Bessere Zugänglichkeit/ Barrierefreiheit
EB82.2
EB82.2
EB82.2
EB82.2
EB82.2
Better accessibility
Ein zuverlässiger
und pünktlicher
Service
Häufig verkehrende öffentliche
Verkehrsmittel
Günstigere Fahrkarten
oder Dauerkarten
Online verfügbare Routenplaner für
öffentliche Verkehrsmittel
Verfügbarkeit mobiler Apps mit Fahrplänen und weiteren Service-
informationen
Une meilleure accessibilité
Reliable and punctual services
Frequent public transport service
Cheaper tickets or
season tickets
Availability of online public transport route planners
Availability of mobile applications with
timetable and other services information
QA3 Qu'est-ce qui vous encouragerait à utiliser plus souvent les transports publics ? (ROTATION – MAX. 3 REPONSES)
QA3 What would encourage you to use public transport more often? (ROTATE – MAX. 3 ANSWERS)
QA3 Was würde Sie dazu motivieren, häufiger öffentliche Verkehrsmittel zu benutzen? (ROTIEREN – MAX. 3 NENNUNGEN)
Des services fiables et ponctuels
Un service de transports
publics fréquents
Des billets ou des
abonnements moins chers
Des outils de planification des
trajets en transports publics
disponibles en ligne
La disponibilité d'applications mobiles avec les horaires et
d'autres informations sur les services
T5
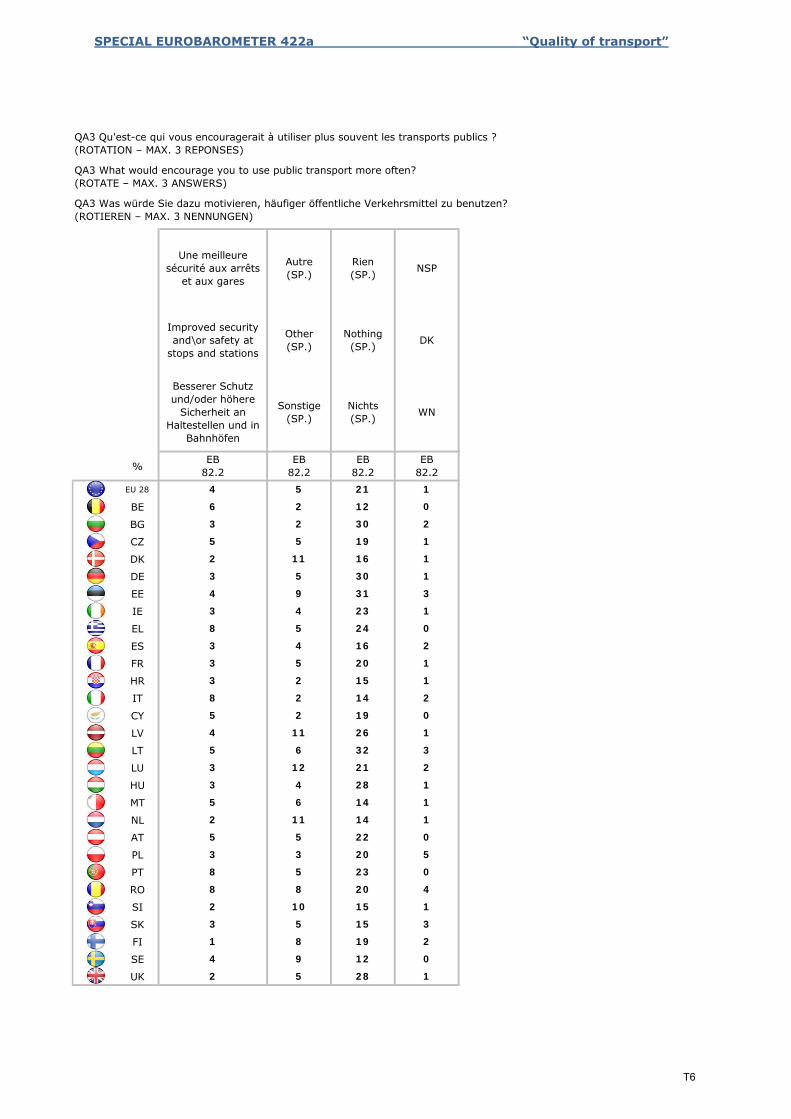
SPECIAL EUROBAROMETER 422a “Quality of transport”
%
EU 28
BE
BG
CZ
DK
DE
EE
IE
EL
ES
FR
HR
IT
CY
LV
LT
LU
HU
MT
NL
AT
PL
PT
RO
SI
SK
FI
SE
UK
QA3 Qu'est-ce qui vous encouragerait à utiliser plus souvent les transports publics ? (ROTATION – MAX. 3 REPONSES)
QA3 What would encourage you to use public transport more often? (ROTATE – MAX. 3 ANSWERS)
QA3 Was würde Sie dazu motivieren, häufiger öffentliche Verkehrsmittel zu benutzen? (ROTIEREN – MAX. 3 NENNUNGEN)
2 5 28 1
4 9 12 0
1 8 19 2
3 5 15 3
2 10 15 1
8 8 20 4
8 5 23 0
3 3 20 5
5 5 22 0
2 11 14 1
5 6 14 1
3 4 28 1
3 12 21 2
5 6 32 3
4 11 26 1
5 2 19 0
8 2 14 2
3 2 15 1
3 5 20 1
3 4 16 2
8 5 24 0
3 4 23 1
4 9 31 3
3 5 30 1
2 11 16 1
5 5 19 1
3 2 30 2
6 2 12 0
4 5 21 1
EB82.2
EB82.2
EB82.2
EB82.2
Besserer Schutz und/oder höhere
Sicherheit an Haltestellen und in
Bahnhöfen
Sonstige (SP.)
Nichts (SP.) WN
Improved security and\or safety at
stops and stations
Other (SP.)
Nothing (SP.) DK
Une meilleure sécurité aux arrêts
et aux gares
Autre (SP.)
Rien (SP.) NSP
T6
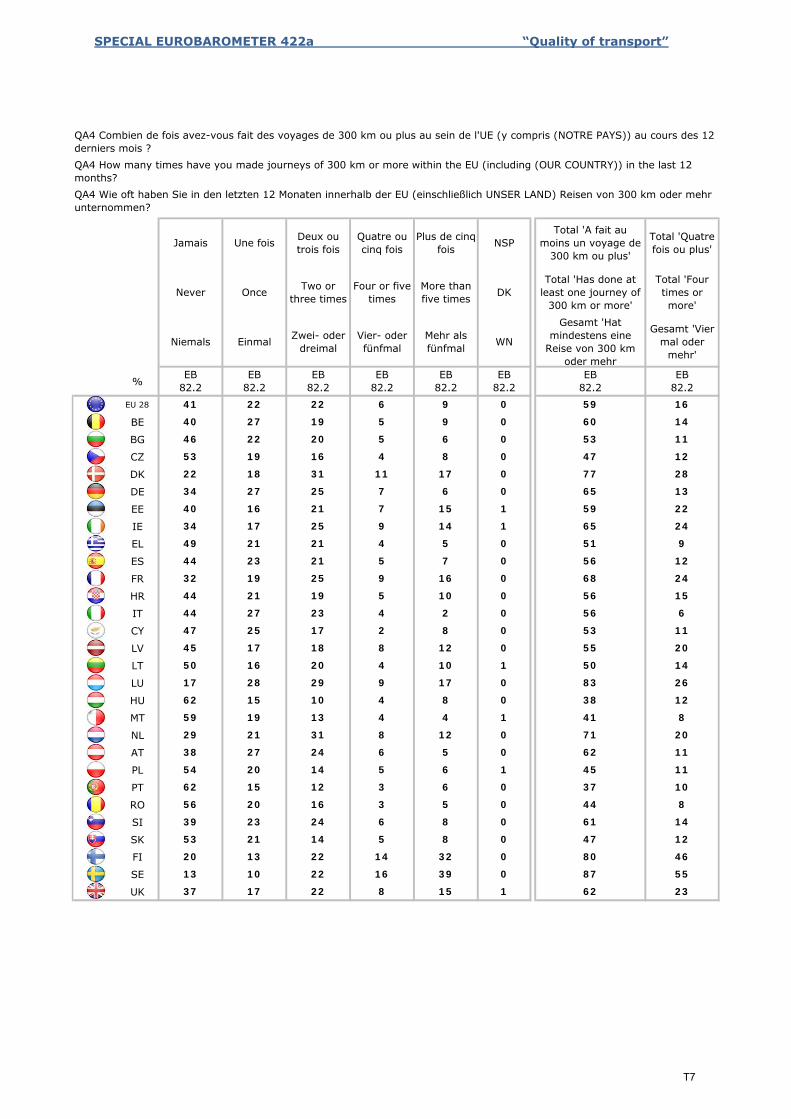
SPECIAL EUROBAROMETER 422a “Quality of transport”
%
EU 28
BE
BG
CZ
DK
DE
EE
IE
EL
ES
FR
HR
IT
CY
LV
LT
LU
HU
MT
NL
AT
PL
PT
RO
SI
SK
FI
SE
UK
Einmal
EB82.2
Jamais
Never
Niemals
EB82.2
Une fois
Once
Vier- oder fünfmal
EB82.2
Deux ou trois fois
Two or three times
Zwei- oder dreimal
EB82.2
Quatre ou cinq fois
Four or five times
WN
EB82.2
Plus de cinq fois
More than five times
Mehr als fünfmal
EB82.2
NSP
DK
Total 'Quatre fois ou plus'
Total 'Four times or more'
Gesamt 'Vier mal oder
mehr'
EB82.2
Total 'A fait au moins un voyage de
300 km ou plus'
Total 'Has done at least one journey of
300 km or more'
Gesamt 'Hat mindestens eine
Reise von 300 km oder mehr
EB82.2
9 0 59 1641 22 22 6
9 0 60 1440 27 19 5
6 0 53 1146 22 20 5
8 0 47 1253 19 16 4
17 0 77 2822 18 31 11
6 0 65 1334 27 25 7
15 1 59 2240 16 21 7
14 1 65 2434 17 25 9
5 0 51 949 21 21 4
7 0 56 1244 23 21 5
16 0 68 2432 19 25 9
10 0 56 1544 21 19 5
2 0 56 644 27 23 4
8 0 53 1147 25 17 2
12 0 55 2045 17 18 8
10 1 50 1450 16 20 4
17 0 83 2617 28 29 9
8 0 38 1262 15 10 4
4 1 41 859 19 13 4
12 0 71 2029 21 31 8
5 0 62 1138 27 24 6
6 1 45 1154 20 14 5
6 0 37 1062 15 12 3
5 0 44 856 20 16 3
8 0 61 1439 23 24 6
8 0 47 1253 21 14 5
32 0 80 4620 13 22 14
39 0 87 5513 10 22 16
15 1 62 2337 17 22 8
QA4 Combien de fois avez-vous fait des voyages de 300 km ou plus au sein de l'UE (y compris (NOTRE PAYS)) au cours des 12 derniers mois ? QA4 How many times have you made journeys of 300 km or more within the EU (including (OUR COUNTRY)) in the last 12 months? QA4 Wie oft haben Sie in den letzten 12 Monaten innerhalb der EU (einschließlich UNSER LAND) Reisen von 300 km oder mehr unternommen?
T7
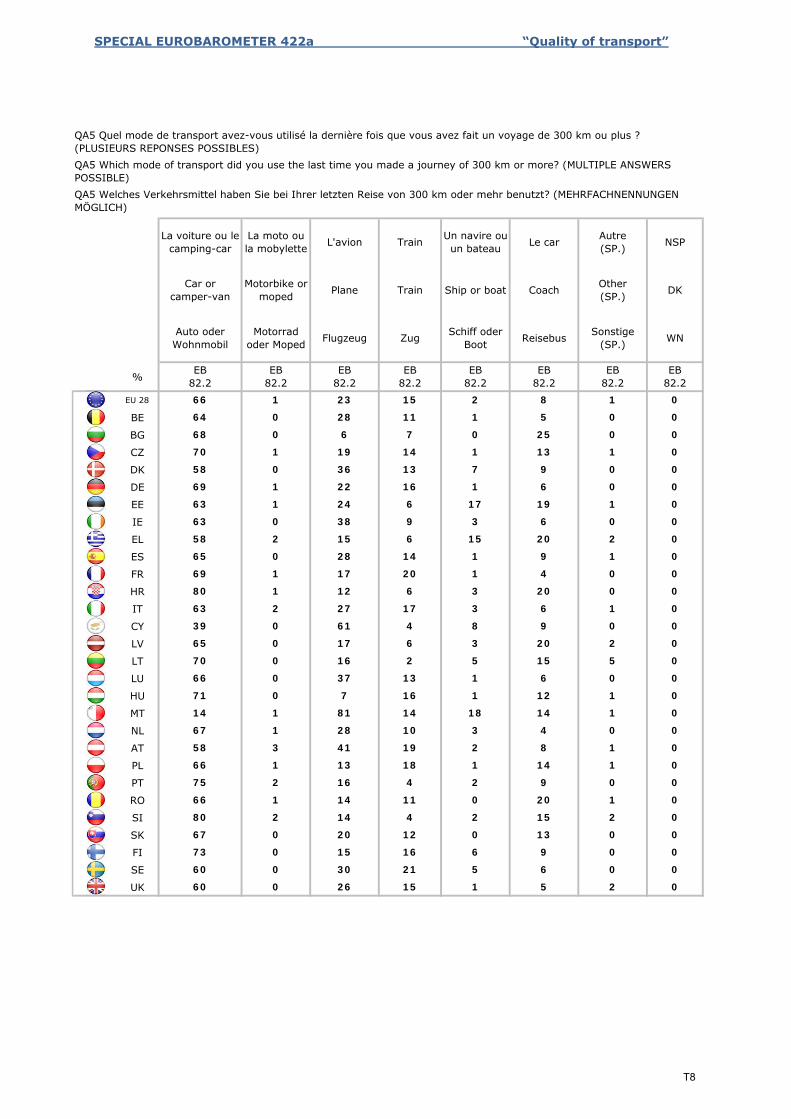
SPECIAL EUROBAROMETER 422a “Quality of transport”
%
EU 28
BE
BG
CZ
DK
DE
EE
IE
EL
ES
FR
HR
IT
CY
LV
LT
LU
HU
MT
NL
AT
PL
PT
RO
SI
SK
FI
SE
UK
Motorrad oder Moped
EB82.2
La voiture ou le camping-car
Car or camper-van
Auto oder Wohnmobil
EB82.2
La moto ou la mobylette
Motorbike or moped
Zug
EB82.2
L'avion
Plane
Flugzeug
EB82.2
Train
Train
Reisebus
EB82.2
Un navire ou un bateau
Ship or boat
Schiff oder Boot
EB82.2
Le car
Coach
NSP
DK
WN
EB82.2
Autre (SP.)
Other (SP.)
Sonstige (SP.)
EB82.2
2 8 1 066 1 23 15
1 5 0 064 0 28 11
0 25 0 068 0 6 7
1 13 1 070 1 19 14
7 9 0 058 0 36 13
1 6 0 069 1 22 16
17 19 1 063 1 24 6
3 6 0 063 0 38 9
15 20 2 058 2 15 6
1 9 1 065 0 28 14
1 4 0 069 1 17 20
3 20 0 080 1 12 6
3 6 1 063 2 27 17
8 9 0 039 0 61 4
3 20 2 065 0 17 6
5 15 5 070 0 16 2
1 6 0 066 0 37 13
1 12 1 071 0 7 16
18 14 1 014 1 81 14
3 4 0 067 1 28 10
2 8 1 058 3 41 19
1 14 1 066 1 13 18
2 9 0 075 2 16 4
0 20 1 066 1 14 11
2 15 2 080 2 14 4
0 13 0 067 0 20 12
6 9 0 073 0 15 16
5 6 0 060 0 30 21
1 5 2 060 0 26 15
QA5 Quel mode de transport avez-vous utilisé la dernière fois que vous avez fait un voyage de 300 km ou plus ? (PLUSIEURS REPONSES POSSIBLES)QA5 Which mode of transport did you use the last time you made a journey of 300 km or more? (MULTIPLE ANSWERS POSSIBLE)QA5 Welches Verkehrsmittel haben Sie bei Ihrer letzten Reise von 300 km oder mehr benutzt? (MEHRFACHNENNUNGEN MÖGLICH)
T8
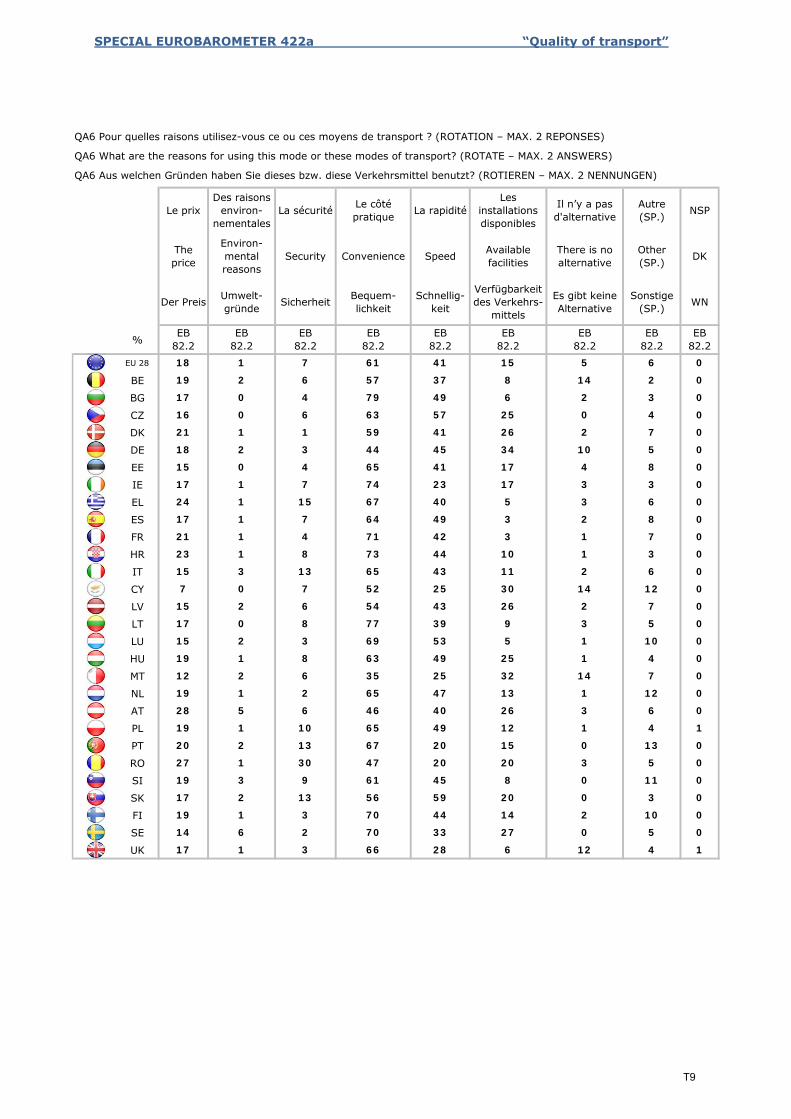
SPECIAL EUROBAROMETER 422a “Quality of transport”
%
EU 28
BE
BG
CZ
DK
DE
EE
IE
EL
ES
FR
HR
IT
CY
LV
LT
LU
HU
MT
NL
AT
PL
PT
RO
SI
SK
FI
SE
UK
Le prix
The price
Der Preis
EB82.2
La sécurité
Security
Sicherheit
EB82.2
Des raisons environ-
nementales
Environ-mental reasons
Umwelt-gründe
EB82.2
La rapidité
Speed
Schnellig-keit
EB82.2
Le côté pratique
Convenience
Bequem-lichkeit
EB82.2
Il n’y a pas d'alternative
There is no alternative
Es gibt keine Alternative
EB82.2
Les installations disponibles
Available facilities
Verfügbarkeit des Verkehrs-
mittels
EB82.2
NSP
DK
WN
EB82.2
Autre (SP.)
Other (SP.)
Sonstige (SP.)
EB82.2
41 15 5 618 1 7 61 0
19 2 6 57 37 8 14 2 0
49 6 2 317 0 4 79 0
16 0 6 63 57 25 0 4 0
041 26 2 721 1 1 59
045 34 10 518 2 3 44
41 17 4 815 0 4 65 0
17 1 7 74 23 17 3 3 0
40 5 3 624 1 15 67 0
17 1 7 64 49 3 2 8 0
42 3 1 721 1 4 71 0
23 1 8 73 44 10 1 3 0
43 11 2 615 3 13 65 0
7 0 7 52 25 30 14 12 0
43 26 2 715 2 6 54 0
17 0 8 77 39 9 3 5 0
53 5 1 1015 2 3 69 0
19 1 8 63 49 25 1 4 0
25 32 14 712 2 6 35 0
19 1 2 65 47 13 1 12 0
40 26 3 628 5 6 46 0
19 1 10 65 49 12 1 4 1
20 15 0 1320 2 13 67 0
27 1 30 47 20 20 3 5 0
45 8 0 1119 3 9 61 0
17 2 13 56 59 20 0 3 0
44 14 2 1019 1 3 70 0
14 6 2 70 33 27 0 5 0
128 6 12 417 1 3 66
QA6 Pour quelles raisons utilisez-vous ce ou ces moyens de transport ? (ROTATION – MAX. 2 REPONSES)
QA6 What are the reasons for using this mode or these modes of transport? (ROTATE – MAX. 2 ANSWERS)
QA6 Aus welchen Gründen haben Sie dieses bzw. diese Verkehrsmittel benutzt? (ROTIEREN – MAX. 2 NENNUNGEN)
T9

SPECIAL EUROBAROMETER 422a “Quality of transport”
%
EU 28
BE
BG
CZ
DK
DE
EE
IE
EL
ES
FR
HR
IT
CY
LV
LT
LU
HU
MT
NL
AT
PL
PT
RO
SI
SK
FI
SE
UK
Oui NSP
DK
WN
EB82.2
Non
No
85 11 4
Yes
Ja
EB82.2
Nein
EB82.2
92 6 2
74 24 2
76 20 4
71 24 5
86 7 7
88 6 6
83 15 2
62 38 0
87 10 3
76 18 6
95 3 2
82 13 5
95 5 0
79 15 6
92 4 4
83 12 5
81 17 2
93 6 1
93 4 3
89 8 3
81 11 8
86 9 5
90 9 1
96 2 2
91 7 2
94 3 3
85 9 6
89 9 2
QA7.1 Laquelle des propositions suivantes s'applique au dernier voyage de 300 km ou plus que vous avez effectué ? Le voyage était d’un bon rapport qualité\prix
QA7.1 Which of the following applies to the last journey you made of 300 km or more? The journey was good value for money
QA7.1 Welche der folgenden Aussagen treffen auf Ihre letzte Reise von 300 km oder mehr zu? Die Reise bot ein gutes Preis-Leistungs-Verhältnis
T10
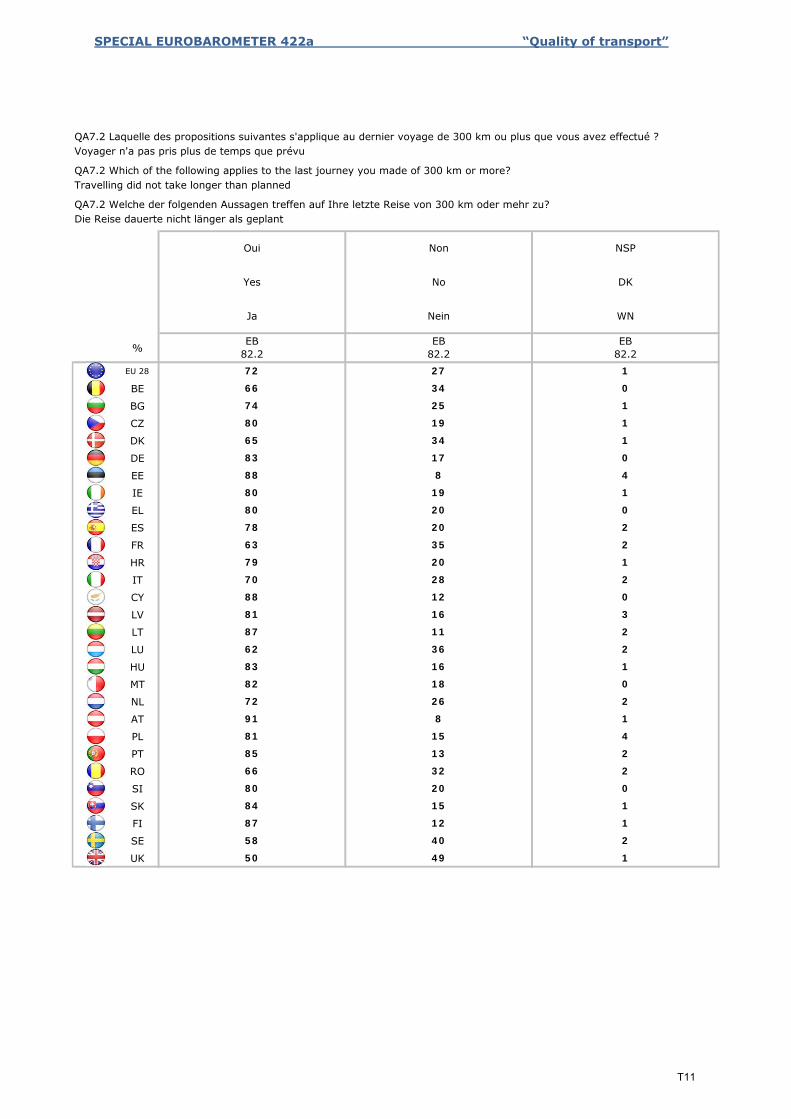
SPECIAL EUROBAROMETER 422a “Quality of transport”
%
EU 28
BE
BG
CZ
DK
DE
EE
IE
EL
ES
FR
HR
IT
CY
LV
LT
LU
HU
MT
NL
AT
PL
PT
RO
SI
SK
FI
SE
UK
Oui NSP
DK
WN
EB82.2
Non
No
72 27 1
Yes
Ja
EB82.2
Nein
EB82.2
66 34 0
74 25 1
80 19 1
65 34 1
88 8 4
83 17 0
80 19 1
80 20 0
78 20 2
63 35 2
79 20 1
70 28 2
88 12 0
81 16 3
87 11 2
62 36 2
83 16 1
82 18 0
72 26 2
91 8 1
81 15 4
85 13 2
66 32 2
80 20 0
84 15 1
87 12 1
58 40 2
50 49 1
QA7.2 Laquelle des propositions suivantes s'applique au dernier voyage de 300 km ou plus que vous avez effectué ? Voyager n'a pas pris plus de temps que prévu
QA7.2 Which of the following applies to the last journey you made of 300 km or more? Travelling did not take longer than planned
QA7.2 Welche der folgenden Aussagen treffen auf Ihre letzte Reise von 300 km oder mehr zu? Die Reise dauerte nicht länger als geplant
T11
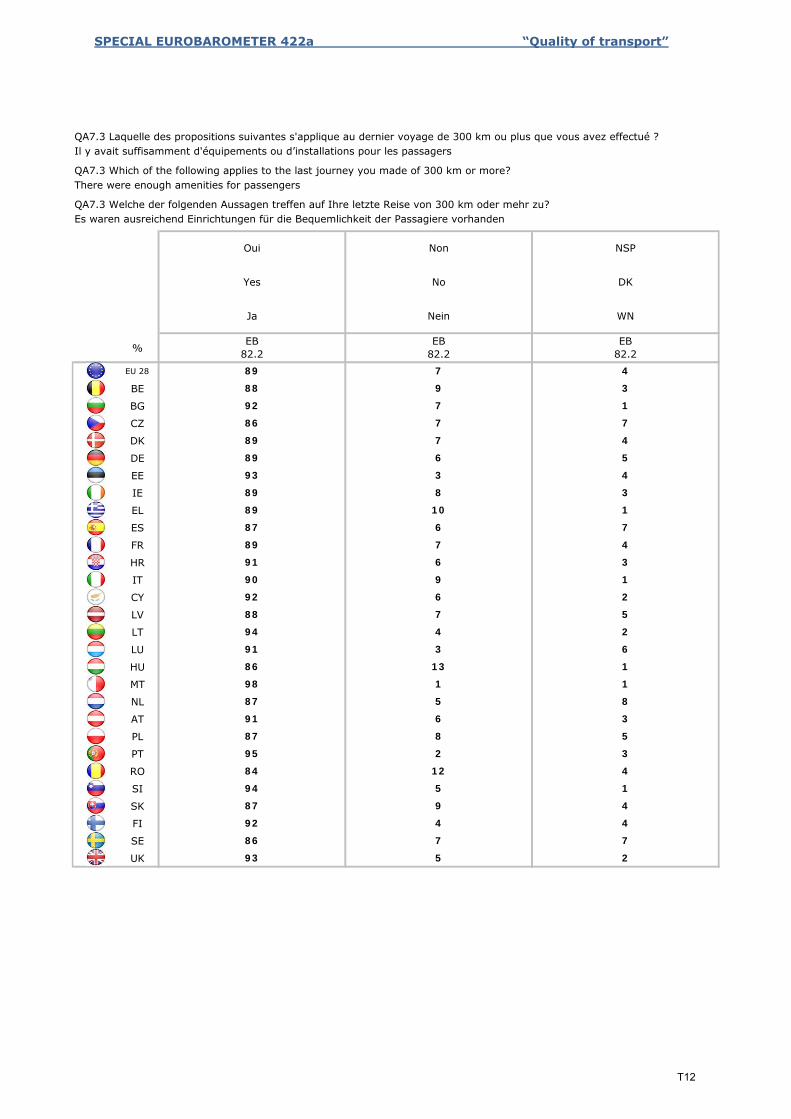
SPECIAL EUROBAROMETER 422a “Quality of transport”
%
EU 28
BE
BG
CZ
DK
DE
EE
IE
EL
ES
FR
HR
IT
CY
LV
LT
LU
HU
MT
NL
AT
PL
PT
RO
SI
SK
FI
SE
UK
Oui NSP
DK
WN
EB82.2
Non
No
89 7 4
Yes
Ja
EB82.2
Nein
EB82.2
88 9 3
92 7 1
86 7 7
89 7 4
93 3 4
89 6 5
89 8 3
89 10 1
87 6 7
89 7 4
91 6 3
90 9 1
92 6 2
88 7 5
94 4 2
91 3 6
86 13 1
98 1 1
87 5 8
91 6 3
87 8 5
95 2 3
84 12 4
94 5 1
87 9 4
92 4 4
86 7 7
93 5 2
QA7.3 Laquelle des propositions suivantes s'applique au dernier voyage de 300 km ou plus que vous avez effectué ? Il y avait suffisamment d'équipements ou d’installations pour les passagers
QA7.3 Which of the following applies to the last journey you made of 300 km or more? There were enough amenities for passengers
QA7.3 Welche der folgenden Aussagen treffen auf Ihre letzte Reise von 300 km oder mehr zu? Es waren ausreichend Einrichtungen für die Bequemlichkeit der Passagiere vorhanden
T12
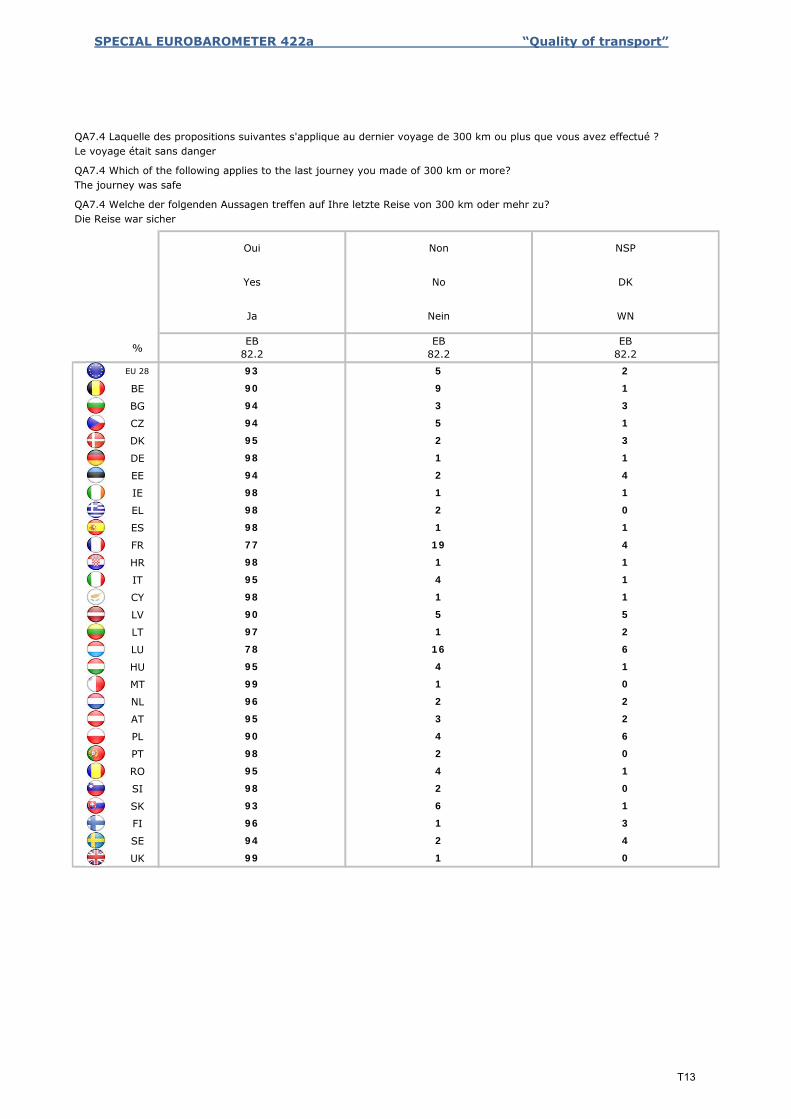
SPECIAL EUROBAROMETER 422a “Quality of transport”
%
EU 28
BE
BG
CZ
DK
DE
EE
IE
EL
ES
FR
HR
IT
CY
LV
LT
LU
HU
MT
NL
AT
PL
PT
RO
SI
SK
FI
SE
UK
Oui NSP
DK
WN
EB82.2
Non
No
93 5 2
Yes
Ja
EB82.2
Nein
EB82.2
90 9 1
94 3 3
94 5 1
95 2 3
94 2 4
98 1 1
98 1 1
98 2 0
98 1 1
77 19 4
98 1 1
95 4 1
98 1 1
90 5 5
97 1 2
78 16 6
95 4 1
99 1 0
96 2 2
95 3 2
90 4 6
98 2 0
95 4 1
98 2 0
93 6 1
96 1 3
94 2 4
99 1 0
QA7.4 Laquelle des propositions suivantes s'applique au dernier voyage de 300 km ou plus que vous avez effectué ? Le voyage était sans danger
QA7.4 Which of the following applies to the last journey you made of 300 km or more? The journey was safe
QA7.4 Welche der folgenden Aussagen treffen auf Ihre letzte Reise von 300 km oder mehr zu? Die Reise war sicher
T13
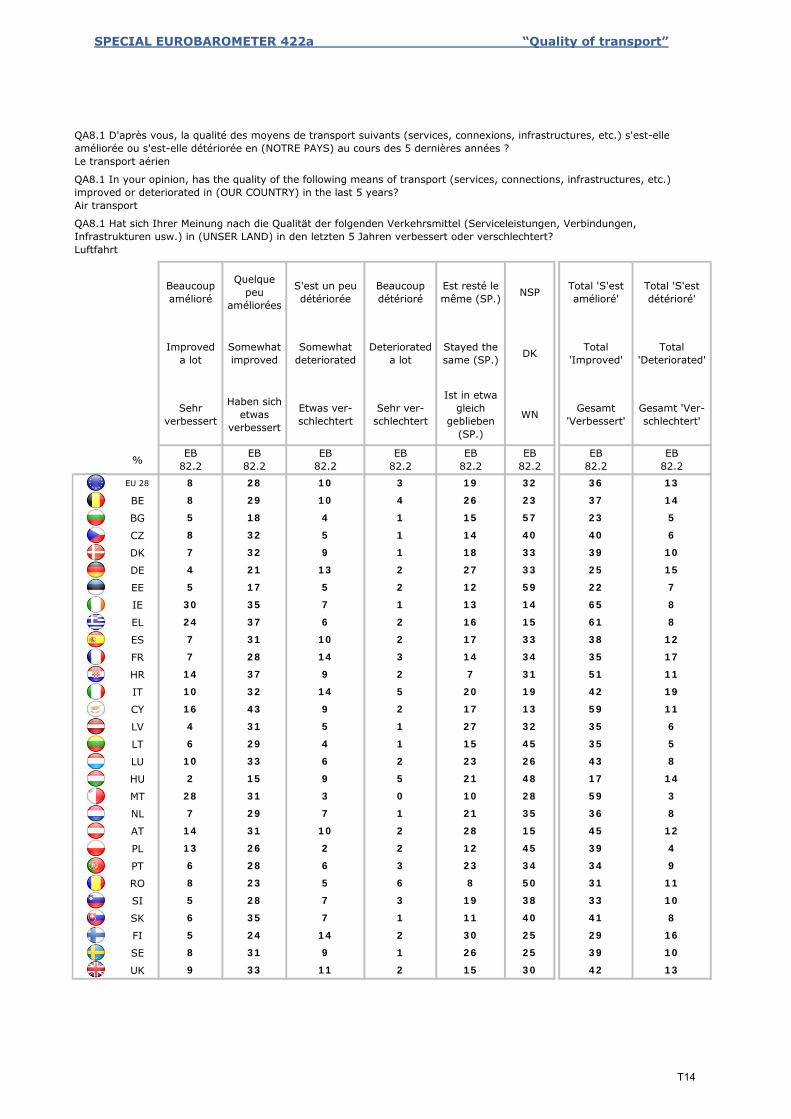
SPECIAL EUROBAROMETER 422a “Quality of transport”
%
EU 28
BE
BG
CZ
DK
DE
EE
IE
EL
ES
FR
HR
IT
CY
LV
LT
LU
HU
MT
NL
AT
PL
PT
RO
SI
SK
FI
SE
UK
Improved a lot
Sehr verbessert
Beaucoup détérioré
Deteriorated a lot
Sehr ver-schlechtert
QA8.1 Hat sich Ihrer Meinung nach die Qualität der folgenden Verkehrsmittel (Serviceleistungen, Verbindungen, Infrastrukturen usw.) in (UNSER LAND) in den letzten 5 Jahren verbessert oder verschlechtert? Luftfahrt
EB82.2
Quelque peu
améliorées
Somewhat improved
Haben sich etwas
verbessert
EB82.2
Somewhat deteriorated
Etwas ver-schlechtert
EB82.2
Beaucoup amélioré
S'est un peu détériorée
EB82.2
Stayed the same (SP.)
Ist in etwa gleich
geblieben (SP.)
EB82.2
NSP
DK
WN
EB82.2
Est resté le même (SP.)
Total 'S'est détérioré'
Total 'Deteriorated'
Gesamt 'Ver-schlechtert'
EB82.2
Total 'S'est amélioré'
Total 'Improved'
Gesamt 'Verbessert'
EB82.2
19 32 36 138 28 10 3
26 23 37 148 29 10 4
15 57 23 55 18 4 1
14 40 40 68 32 5 1
18 33 39 107 32 9 1
27 33 25 154 21 13 2
12 59 22 75 17 5 2
13 14 65 830 35 7 1
16 15 61 824 37 6 2
17 33 38 127 31 10 2
14 34 35 177 28 14 3
7 31 51 1114 37 9 2
20 19 42 1910 32 14 5
17 13 59 1116 43 9 2
27 32 35 64 31 5 1
15 45 35 56 29 4 1
23 26 43 810 33 6 2
21 48 17 142 15 9 5
10 28 59 328 31 3 0
21 35 36 87 29 7 1
28 15 45 1214 31 10 2
12 45 39 413 26 2 2
23 34 34 96 28 6 3
8 50 31 118 23 5 6
19 38 33 105 28 7 3
11 40 41 86 35 7 1
30 25 29 165 24 14 2
26 25 39 108 31 9 1
15 30 42 139 33 11 2
QA8.1 D'après vous, la qualité des moyens de transport suivants (services, connexions, infrastructures, etc.) s'est-elle améliorée ou s'est-elle détériorée en (NOTRE PAYS) au cours des 5 dernières années ? Le transport aérien
QA8.1 In your opinion, has the quality of the following means of transport (services, connections, infrastructures, etc.) improved or deteriorated in (OUR COUNTRY) in the last 5 years? Air transport
T14
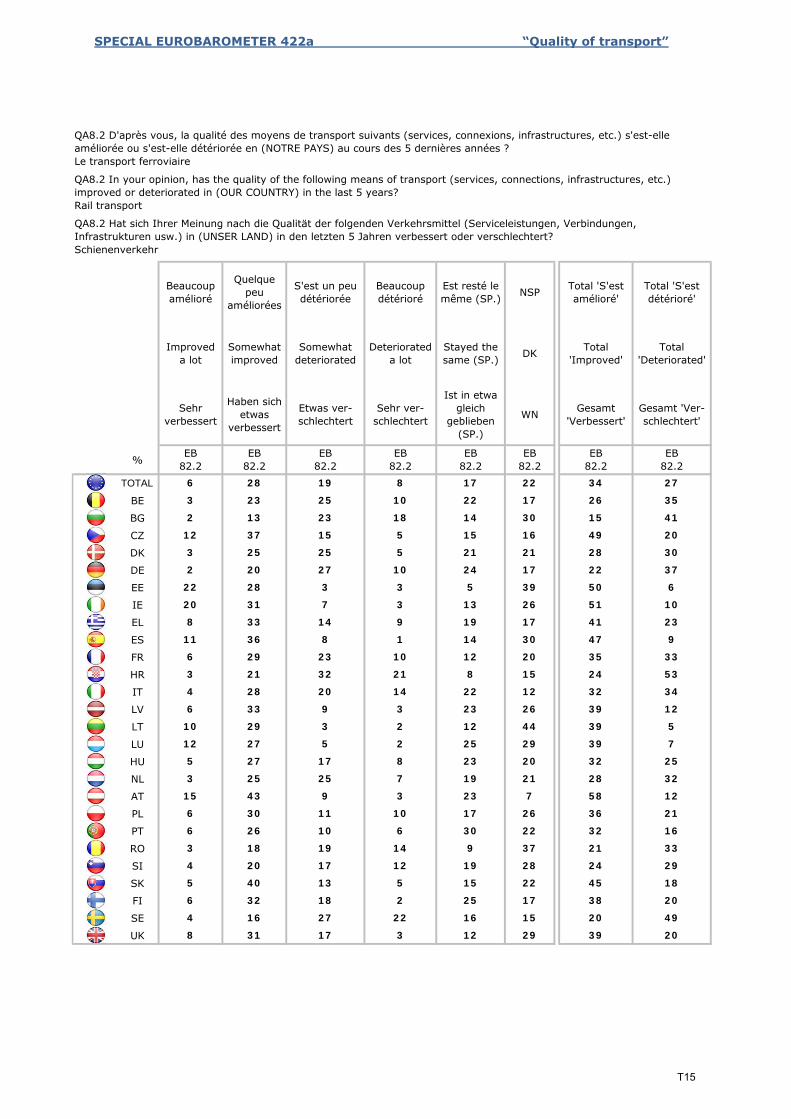
SPECIAL EUROBAROMETER 422a “Quality of transport”
%
TOTAL
BE
BG
CZ
DK
DE
EE
IE
EL
ES
FR
HR
IT
LV
LT
LU
HU
NL
AT
PL
PT
RO
SI
SK
FI
SE
UK
Improved a lot
Sehr verbessert
Beaucoup détérioré
Deteriorated a lot
Sehr ver-schlechtert
QA8.2 Hat sich Ihrer Meinung nach die Qualität der folgenden Verkehrsmittel (Serviceleistungen, Verbindungen, Infrastrukturen usw.) in (UNSER LAND) in den letzten 5 Jahren verbessert oder verschlechtert? Schienenverkehr
EB82.2
Quelque peu
améliorées
Somewhat improved
Haben sich etwas
verbessert
EB82.2
Somewhat deteriorated
Etwas ver-schlechtert
EB82.2
Beaucoup amélioré
S'est un peu détériorée
EB82.2
Stayed the same (SP.)
Ist in etwa gleich
geblieben (SP.)
EB82.2
NSP
DK
WN
EB82.2
Est resté le même (SP.)
Total 'S'est détérioré'
Total 'Deteriorated'
Gesamt 'Ver-schlechtert'
EB82.2
Total 'S'est amélioré'
Total 'Improved'
Gesamt 'Verbessert'
EB82.2
17 22 34 276 28 19 8
22 17 26 353 23 25 10
14 30 15 412 13 23 18
15 16 49 2012 37 15 5
21 21 28 303 25 25 5
24 17 22 372 20 27 10
5 39 50 622 28 3 3
13 26 51 1020 31 7 3
19 17 41 238 33 14 9
14 30 47 911 36 8 1
12 20 35 336 29 23 10
8 15 24 533 21 32 21
22 12 32 344 28 20 14
23 26 39 126 33 9 3
12 44 39 510 29 3 2
25 29 39 712 27 5 2
23 20 32 255 27 17 8
19 21 28 323 25 25 7
23 7 58 1215 43 9 3
17 26 36 216 30 11 10
30 22 32 166 26 10 6
9 37 21 333 18 19 14
19 28 24 294 20 17 12
15 22 45 185 40 13 5
25 17 38 206 32 18 2
16 15 20 494 16 27 22
12 29 39 208 31 17 3
QA8.2 D'après vous, la qualité des moyens de transport suivants (services, connexions, infrastructures, etc.) s'est-elle améliorée ou s'est-elle détériorée en (NOTRE PAYS) au cours des 5 dernières années ? Le transport ferroviaire
QA8.2 In your opinion, has the quality of the following means of transport (services, connections, infrastructures, etc.) improved or deteriorated in (OUR COUNTRY) in the last 5 years? Rail transport
T15
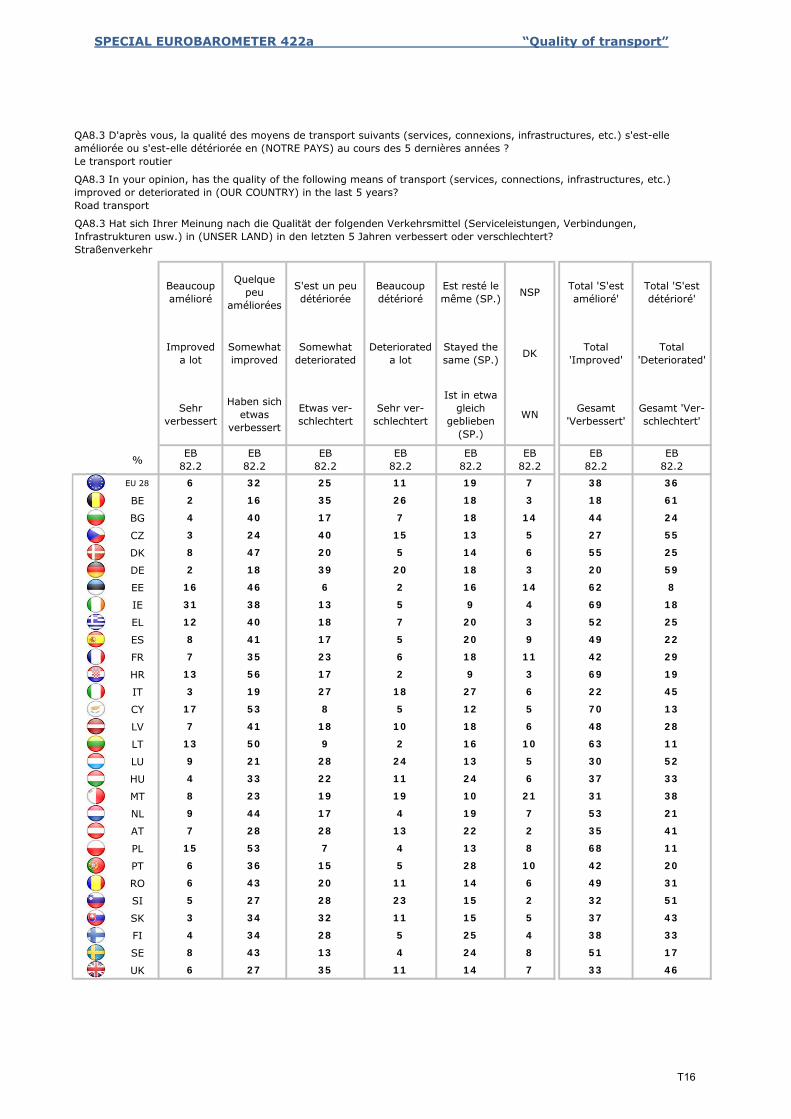
SPECIAL EUROBAROMETER 422a “Quality of transport”
%
EU 28
BE
BG
CZ
DK
DE
EE
IE
EL
ES
FR
HR
IT
CY
LV
LT
LU
HU
MT
NL
AT
PL
PT
RO
SI
SK
FI
SE
UK
Improved a lot
Sehr verbessert
Beaucoup détérioré
Deteriorated a lot
Sehr ver-schlechtert
QA8.3 Hat sich Ihrer Meinung nach die Qualität der folgenden Verkehrsmittel (Serviceleistungen, Verbindungen, Infrastrukturen usw.) in (UNSER LAND) in den letzten 5 Jahren verbessert oder verschlechtert? Straßenverkehr
EB82.2
Quelque peu
améliorées
Somewhat improved
Haben sich etwas
verbessert
EB82.2
Somewhat deteriorated
Etwas ver-schlechtert
EB82.2
Beaucoup amélioré
S'est un peu détériorée
EB82.2
Stayed the same (SP.)
Ist in etwa gleich
geblieben (SP.)
EB82.2
NSP
DK
WN
EB82.2
Est resté le même (SP.)
Total 'S'est détérioré'
Total 'Deteriorated'
Gesamt 'Ver-schlechtert'
EB82.2
Total 'S'est amélioré'
Total 'Improved'
Gesamt 'Verbessert'
EB82.2
19 7 38 366 32 25 11
18 3 18 612 16 35 26
18 14 44 244 40 17 7
13 5 27 553 24 40 15
14 6 55 258 47 20 5
18 3 20 592 18 39 20
16 14 62 816 46 6 2
9 4 69 1831 38 13 5
20 3 52 2512 40 18 7
20 9 49 228 41 17 5
18 11 42 297 35 23 6
9 3 69 1913 56 17 2
27 6 22 453 19 27 18
12 5 70 1317 53 8 5
18 6 48 287 41 18 10
16 10 63 1113 50 9 2
13 5 30 529 21 28 24
24 6 37 334 33 22 11
10 21 31 388 23 19 19
19 7 53 219 44 17 4
22 2 35 417 28 28 13
13 8 68 1115 53 7 4
28 10 42 206 36 15 5
14 6 49 316 43 20 11
15 2 32 515 27 28 23
15 5 37 433 34 32 11
25 4 38 334 34 28 5
24 8 51 178 43 13 4
14 7 33 466 27 35 11
QA8.3 D'après vous, la qualité des moyens de transport suivants (services, connexions, infrastructures, etc.) s'est-elle améliorée ou s'est-elle détériorée en (NOTRE PAYS) au cours des 5 dernières années ? Le transport routier
QA8.3 In your opinion, has the quality of the following means of transport (services, connections, infrastructures, etc.) improved or deteriorated in (OUR COUNTRY) in the last 5 years? Road transport
T16
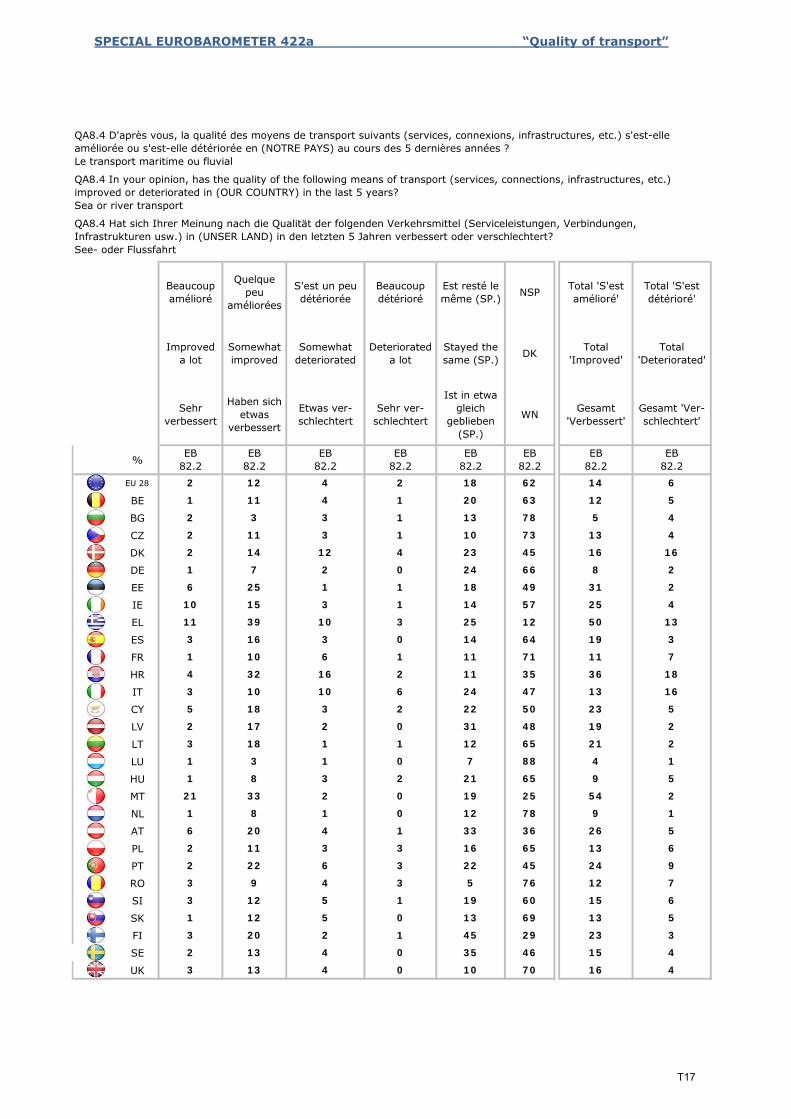
SPECIAL EUROBAROMETER 422a “Quality of transport”
%
EU 28
BE
BG
CZ
DK
DE
EE
IE
EL
ES
FR
HR
IT
CY
LV
LT
LU
HU
MT
NL
AT
PL
PT
RO
SI
SK
FI
SE
UK
Improved a lot
Sehr verbessert
Beaucoup détérioré
Deteriorated a lot
Sehr ver-schlechtert
QA8.4 Hat sich Ihrer Meinung nach die Qualität der folgenden Verkehrsmittel (Serviceleistungen, Verbindungen, Infrastrukturen usw.) in (UNSER LAND) in den letzten 5 Jahren verbessert oder verschlechtert? See- oder Flussfahrt
EB82.2
Quelque peu
améliorées
Somewhat improved
Haben sich etwas
verbessert
EB82.2
Somewhat deteriorated
Etwas ver-schlechtert
EB82.2
Beaucoup amélioré
S'est un peu détériorée
EB82.2
Stayed the same (SP.)
Ist in etwa gleich
geblieben (SP.)
EB82.2
NSP
DK
WN
EB82.2
Est resté le même (SP.)
Total 'S'est détérioré'
Total 'Deteriorated'
Gesamt 'Ver-schlechtert'
EB82.2
Total 'S'est amélioré'
Total 'Improved'
Gesamt 'Verbessert'
EB82.2
18 62 14 62 12 4 2
20 63 12 51 11 4 1
13 78 5 42 3 3 1
10 73 13 42 11 3 1
23 45 16 162 14 12 4
24 66 8 21 7 2 0
18 49 31 26 25 1 1
14 57 25 410 15 3 1
25 12 50 1311 39 10 3
14 64 19 33 16 3 0
11 71 11 71 10 6 1
11 35 36 184 32 16 2
24 47 13 163 10 10 6
22 50 23 55 18 3 2
31 48 19 22 17 2 0
12 65 21 23 18 1 1
7 88 4 11 3 1 0
21 65 9 51 8 3 2
19 25 54 221 33 2 0
12 78 9 11 8 1 0
33 36 26 56 20 4 1
16 65 13 62 11 3 3
22 45 24 92 22 6 3
5 76 12 73 9 4 3
19 60 15 63 12 5 1
13 69 13 51 12 5 0
45 29 23 33 20 2 1
35 46 15 42 13 4 0
10 70 16 43 13 4 0
QA8.4 D'après vous, la qualité des moyens de transport suivants (services, connexions, infrastructures, etc.) s'est-elle améliorée ou s'est-elle détériorée en (NOTRE PAYS) au cours des 5 dernières années ? Le transport maritime ou fluvial
QA8.4 In your opinion, has the quality of the following means of transport (services, connections, infrastructures, etc.) improved or deteriorated in (OUR COUNTRY) in the last 5 years? Sea or river transport
T17
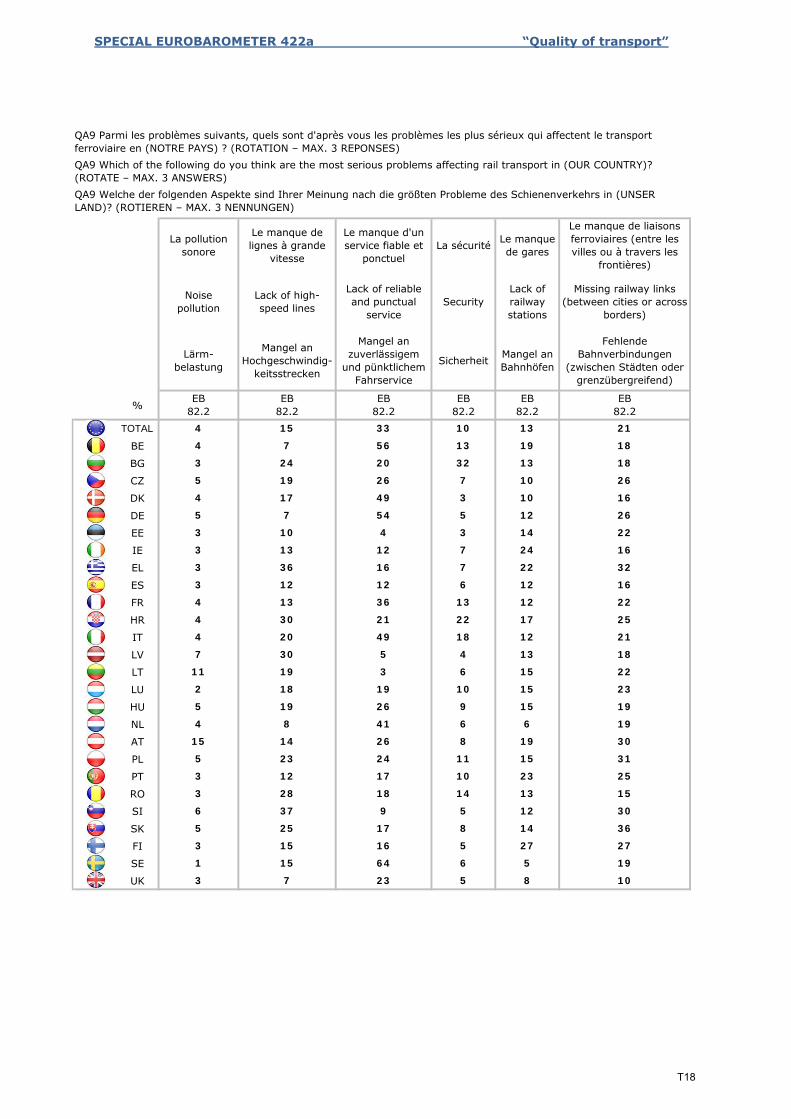
SPECIAL EUROBAROMETER 422a “Quality of transport”
%
TOTAL
BE
BG
CZ
DK
DE
EE
IE
EL
ES
FR
HR
IT
LV
LT
LU
HU
NL
AT
PL
PT
RO
SI
SK
FI
SE
UK
Mangel an Hochgeschwindig-
keitsstrecken
EB82.2
La pollution sonore
Noise pollution
Lärm-belastung
EB82.2
Le manque de lignes à grande
vitesse
Lack of high-speed lines
Sicherheit
EB82.2
Le manque d'un service fiable et
ponctuel
Lack of reliable and punctual
service
Mangel an zuverlässigem
und pünktlichem Fahrservice
EB82.2
La sécurité
Security
Fehlende Bahnverbindungen
(zwischen Städten oder grenzübergreifend)
EB82.2
Le manque de gares
Lack of railway stations
Mangel an Bahnhöfen
EB82.2
Le manque de liaisons ferroviaires (entre les villes ou à travers les
frontières)
Missing railway links (between cities or across
borders)
4 15 33 10 13 21
4 7 56 13 19 18
3 24 20 32 13 18
5 19 26 7 10 26
4 17 49 3 10 16
5 7 54 5 12 26
3 10 4 3 14 22
3 13 12 7 24 16
3 36 16 7 22 32
3 12 12 6 12 16
4 13 36 13 12 22
4 30 21 22 17 25
4 20 49 18 12 21
7 30 5 4 13 18
11 19 3 6 15 22
2 18 19 10 15 23
5 19 26 9 15 19
4 8 41 6 6 19
15 14 26 8 19 30
5 23 24 11 15 31
3 12 17 10 23 25
3 28 18 14 13 15
6 37 9 5 12 30
5 25 17 8 14 36
3 15 16 5 27 27
1 15 64 6 5 19
3 7 23 5 8 10
QA9 Parmi les problèmes suivants, quels sont d'après vous les problèmes les plus sérieux qui affectent le transport ferroviaire en (NOTRE PAYS) ? (ROTATION – MAX. 3 REPONSES)QA9 Which of the following do you think are the most serious problems affecting rail transport in (OUR COUNTRY)? (ROTATE – MAX. 3 ANSWERS)QA9 Welche der folgenden Aspekte sind Ihrer Meinung nach die größten Probleme des Schienenverkehrs in (UNSER LAND)? (ROTIEREN – MAX. 3 NENNUNGEN)
T18
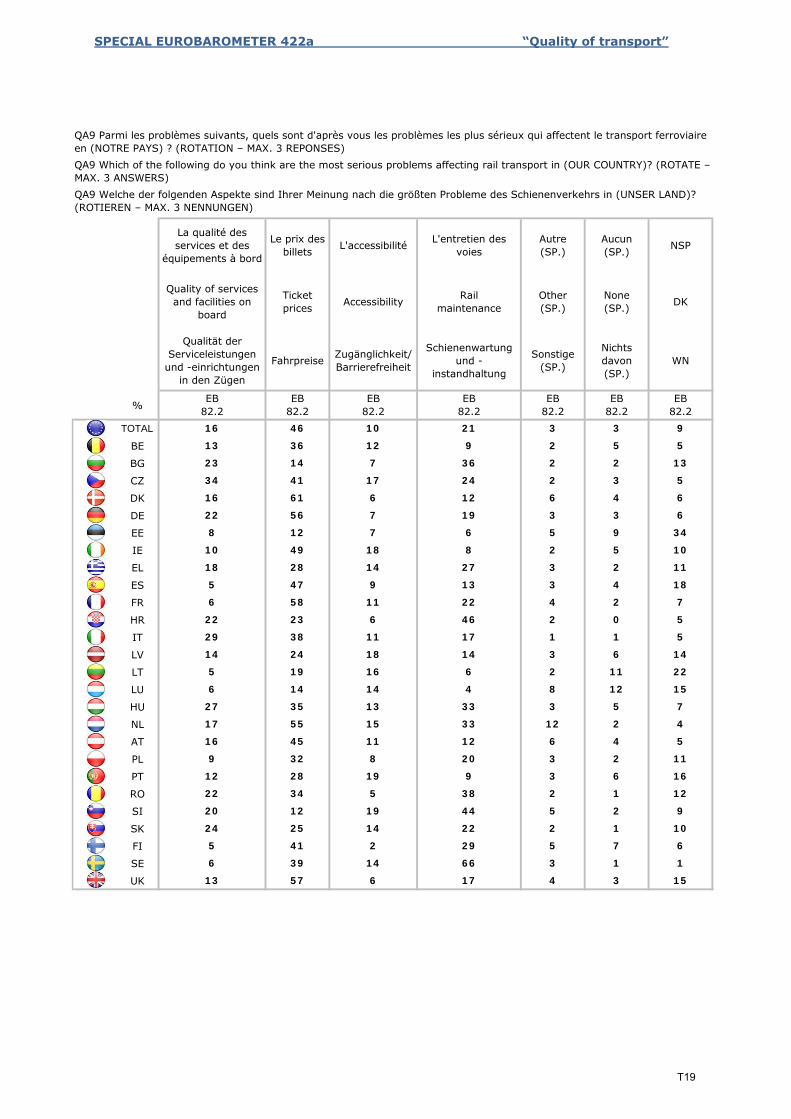
SPECIAL EUROBAROMETER 422a “Quality of transport”
%
TOTAL
BE
BG
CZ
DK
DE
EE
IE
EL
ES
FR
HR
IT
LV
LT
LU
HU
NL
AT
PL
PT
RO
SI
SK
FI
SE
UK 1513 57 6 17 4 3
66 3 1 1
6
6 39 14
5 41 2 29 5 7
22 2 1 10
9
24 25 14
20 12 19 44 5 2
38 2 1 12
16
22 34 5
12 28 19 9 3 6
20 3 2 11
5
9 32 8
16 45 11 12 6 4
33 12 2 4
7
17 55 15
27 35 13 33 3 5
4 8 12 15
22
6 14 14
5 19 16 6 2 11
14 3 6 14
5
14 24 18
29 38 11 17 1 1
46 2 0 5
7
22 23 6
6 58 11 22 4 2
13 3 4 18
11
5 47 9
18 28 14 27 3 2
8 2 5 10
34
10 49 18
8 12 7 6 5 9
19 3 3 6
6
22 56 7
16 61 6 12 6 4
24 2 3 5
13
34 41 17
23 14 7 36 2 2
9 2 5 5
9
13 36 12
16 46 10 21 3 3
EB82.2
EB82.2
EB82.2
EB82.2
WN
EB82.2
EB82.2
EB82.2
Qualität der Serviceleistungen
und -einrichtungen in den Zügen
Fahrpreise Zugänglichkeit/ Barrierefreiheit
Schienenwartung und -
instandhaltung
Sonstige (SP.)
Nichts davon (SP.)
Rail maintenance
Other (SP.)
None (SP.) DK
NSP
Quality of services and facilities on
board
Ticket prices Accessibility
La qualité des services et des
équipements à bord
Le prix des billets L'accessibilité L'entretien des
voiesAutre (SP.)
Aucun (SP.)
QA9 Parmi les problèmes suivants, quels sont d'après vous les problèmes les plus sérieux qui affectent le transport ferroviaire en (NOTRE PAYS) ? (ROTATION – MAX. 3 REPONSES)QA9 Which of the following do you think are the most serious problems affecting rail transport in (OUR COUNTRY)? (ROTATE – MAX. 3 ANSWERS)QA9 Welche der folgenden Aspekte sind Ihrer Meinung nach die größten Probleme des Schienenverkehrs in (UNSER LAND)? (ROTIEREN – MAX. 3 NENNUNGEN)
T19
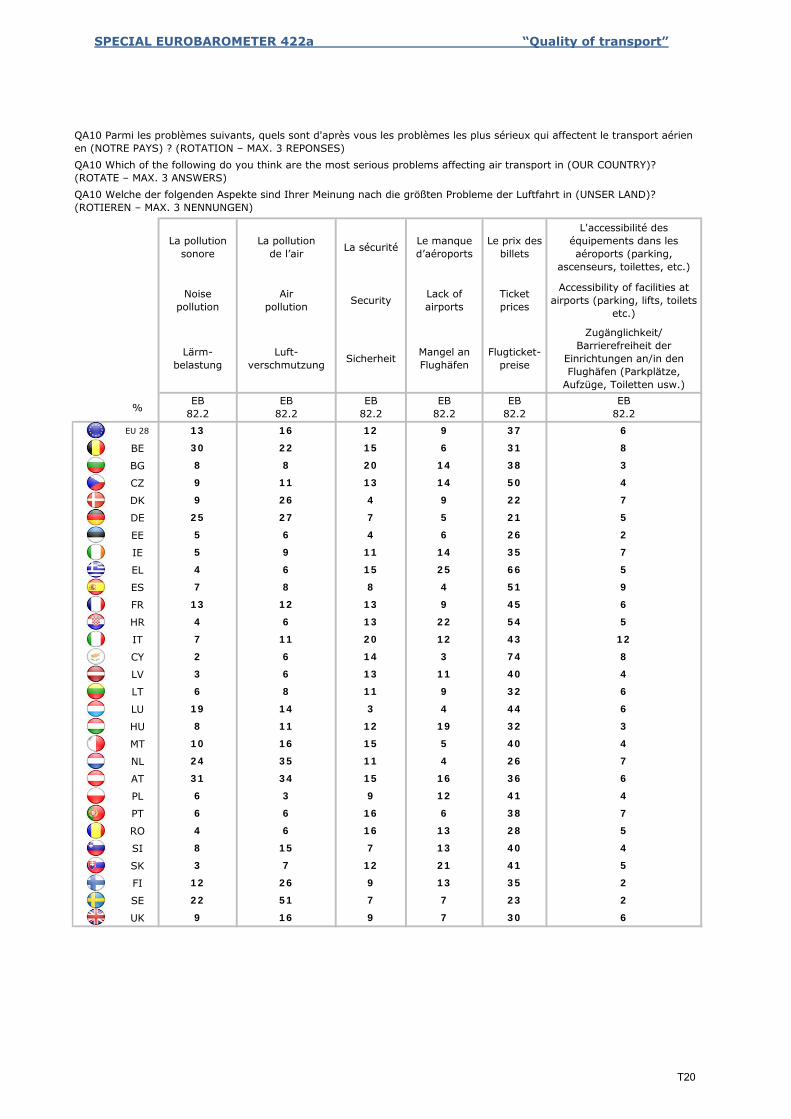
SPECIAL EUROBAROMETER 422a “Quality of transport”
%
EU 28
BE
BG
CZ
DK
DE
EE
IE
EL
ES
FR
HR
IT
CY
LV
LT
LU
HU
MT
NL
AT
PL
PT
RO
SI
SK
FI
SE
UK
La pollution sonore
Noise pollution
Lärm-belastung
EB82.2
La sécurité
Security
Sicherheit
EB82.2
La pollution de l’air
Air pollution
Luft-verschmutzung
EB82.2
Le prix des billets
Ticket prices
Flugticket-preise
EB82.2
Le manque d’aéroports
Lack of airports
Mangel an Flughäfen
EB82.2
L'accessibilité des équipements dans les aéroports (parking,
ascenseurs, toilettes, etc.)
Accessibility of facilities at airports (parking, lifts, toilets
etc.)
Zugänglichkeit/ Barrierefreiheit der
Einrichtungen an/in den Flughäfen (Parkplätze,
Aufzüge, Toiletten usw.)EB
82.213 16 12 9 37 6
31 8
8 8 20 14
30 22 15 6
38 3
50 4
9 26 4 9
9 11 13 14
22 7
21 5
5 6 4 6
25 27 7 5
26 2
35 7
4 6 15 25
5 9 11 14
66 5
51 9
13 12 13 9
7 8 8 4
45 6
54 5
7 11 20 12
4 6 13 22
43 12
74 8
3 6 13 11
2 6 14 3
40 4
32 6
19 14 3 4
6 8 11 9
44 6
32 3
10 16 15 5
8 11 12 19
40 4
26 7
31 34 15 16
24 35 11 4
36 6
41 4
6 6 16 6
6 3 9 12
38 7
28 5
8 15 7 13
4 6 16 13
40 4
41 5
12 26 9 13
3 7 12 21
35 2
23 2
9 16 9 7
22 51 7 7
30 6
QA10 Parmi les problèmes suivants, quels sont d'après vous les problèmes les plus sérieux qui affectent le transport aérien en (NOTRE PAYS) ? (ROTATION – MAX. 3 REPONSES)QA10 Which of the following do you think are the most serious problems affecting air transport in (OUR COUNTRY)? (ROTATE – MAX. 3 ANSWERS)QA10 Welche der folgenden Aspekte sind Ihrer Meinung nach die größten Probleme der Luftfahrt in (UNSER LAND)? (ROTIEREN – MAX. 3 NENNUNGEN)
T20
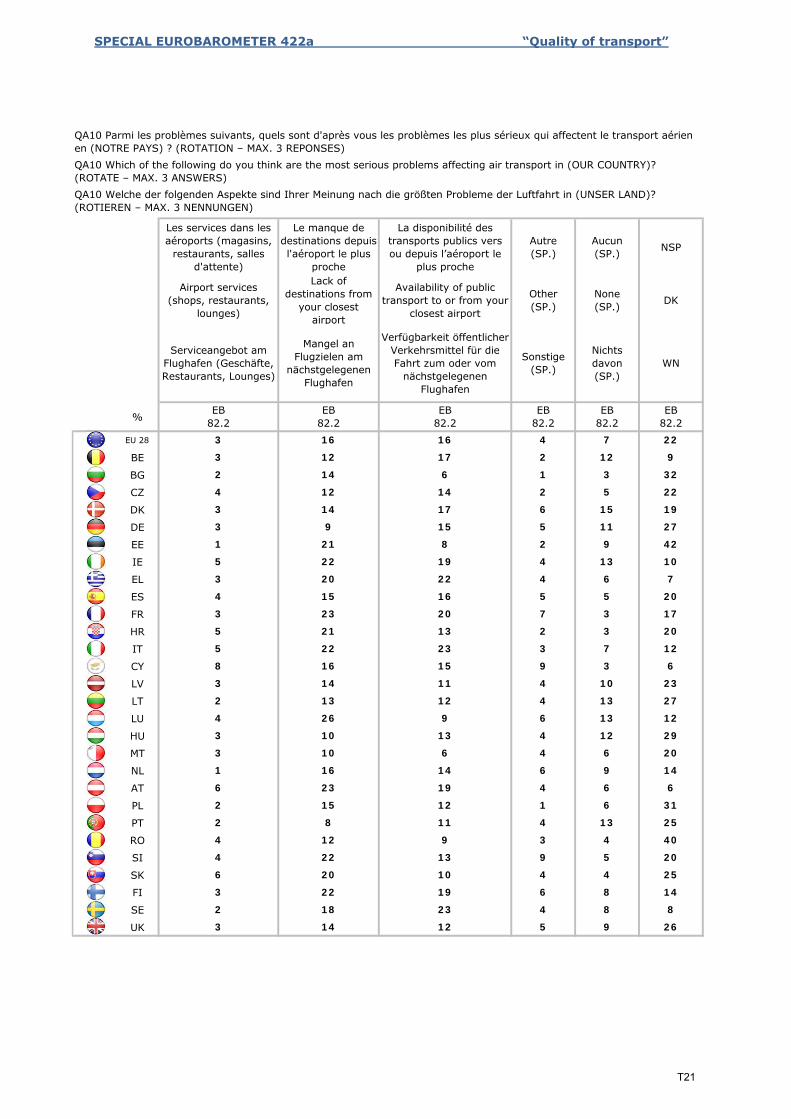
SPECIAL EUROBAROMETER 422a “Quality of transport”
%
EU 28
BE
BG
CZ
DK
DE
EE
IE
EL
ES
FR
HR
IT
CY
LV
LT
LU
HU
MT
NL
AT
PL
PT
RO
SI
SK
FI
SE
UK 3 14 12 5 9 26
2 18 23 4 8 8
3 22 19 6 8 14
6 20 10 4 4 25
4 22 13 9 5 20
4 12 9 3 4 40
2 8 11 4 13 25
2 15 12 1 6 31
6 23 19 4 6 6
1 16 14 6 9 14
3 10 6 4 6 20
3 10 13 4 12 29
4 26 9 6 13 12
2 13 12 4 13 27
3 14 11 4 10 23
8 16 15 9 3 6
5 22 23 3 7 12
5 21 13 2 3 20
3 23 20 7 3 17
4 15 16 5 5 20
3 20 22 4 6 7
5 22 19 4 13 10
1 21 8 2 9 42
3 9 15 5 11 27
3 14 17 6 15 19
4 12 14 2 5 22
2 14 6 1 3 32
3 12 17 2 12 9
3 16 16 4 7 22
EB82.2
EB82.2
EB82.2
EB82.2
EB82.2
EB82.2
Serviceangebot am Flughafen (Geschäfte, Restaurants, Lounges)
Mangel an Flugzielen am
nächstgelegenen Flughafen
Verfügbarkeit öffentlicher Verkehrsmittel für die Fahrt zum oder vom
nächstgelegenen Flughafen
Sonstige (SP.)
Nichts davon (SP.)
WN
Airport services (shops, restaurants,
lounges)
Lack of destinations from
your closest airport
Availability of public transport to or from your
closest airport
Other (SP.)
None (SP.) DK
Les services dans les aéroports (magasins,
restaurants, salles d'attente)
Le manque de destinations depuis l'aéroport le plus
proche
La disponibilité des transports publics vers ou depuis l’aéroport le
plus proche
Autre (SP.)
Aucun (SP.) NSP
QA10 Parmi les problèmes suivants, quels sont d'après vous les problèmes les plus sérieux qui affectent le transport aérien en (NOTRE PAYS) ? (ROTATION – MAX. 3 REPONSES)QA10 Which of the following do you think are the most serious problems affecting air transport in (OUR COUNTRY)? (ROTATE – MAX. 3 ANSWERS)QA10 Welche der folgenden Aspekte sind Ihrer Meinung nach die größten Probleme der Luftfahrt in (UNSER LAND)? (ROTIEREN – MAX. 3 NENNUNGEN)
T21
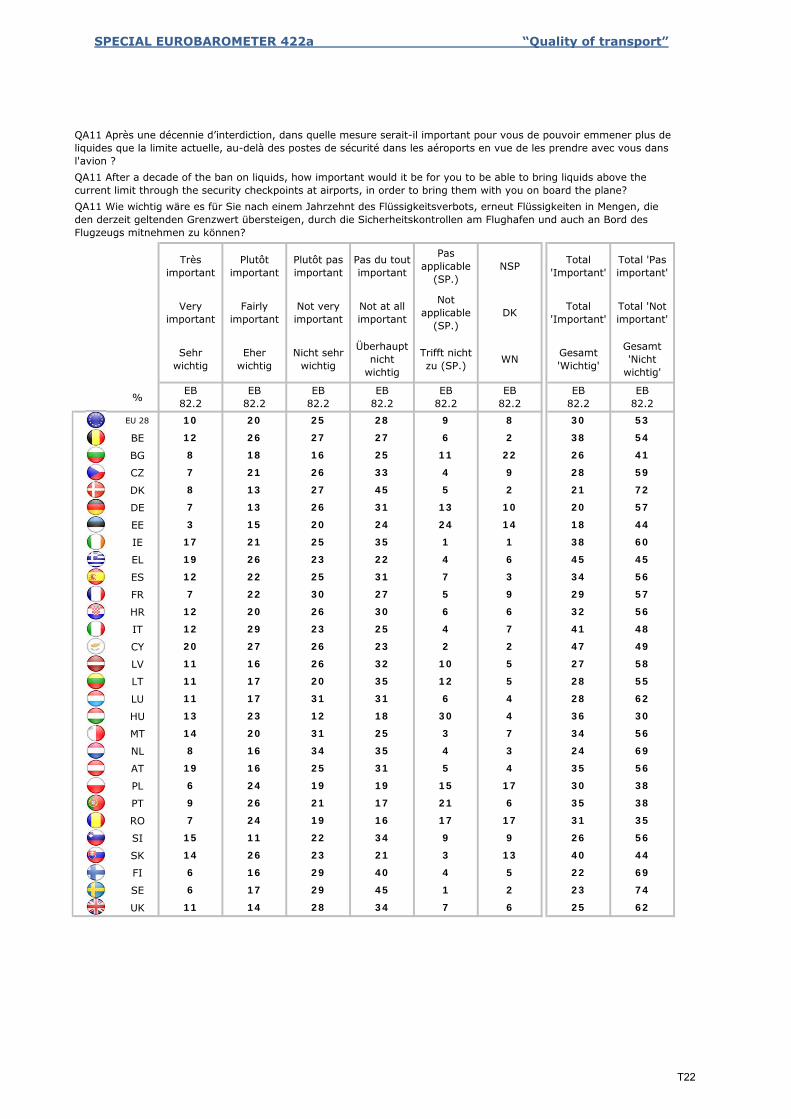
SPECIAL EUROBAROMETER 422a “Quality of transport”
%
EU 28
BE
BG
CZ
DK
DE
EE
IE
EL
ES
FR
HR
IT
CY
LV
LT
LU
HU
MT
NL
AT
PL
PT
RO
SI
SK
FI
SE
UK
Eher wichtig
EB82.2
Très important
Very important
Sehr wichtig
EB82.2
Plutôt important
Fairly important
Überhaupt nicht
wichtig
EB82.2
Plutôt pas important
Not very important
Nicht sehr wichtig
EB82.2
Pas du tout important
Not at all important
WN
EB82.2
Pas applicable
(SP.)
Not applicable
(SP.)
Trifft nicht zu (SP.)
EB82.2
NSP
DK
Total 'Pas important'
Total 'Not important'
Gesamt 'Nicht
wichtig'
EB82.2
Total 'Important'
Total 'Important'
Gesamt 'Wichtig'
EB82.2
9 8 30 5310 20 25 28
6 2 38 5412 26 27 27
11 22 26 418 18 16 25
4 9 28 597 21 26 33
5 2 21 728 13 27 45
13 10 20 577 13 26 31
24 14 18 443 15 20 24
1 1 38 6017 21 25 35
4 6 45 4519 26 23 22
7 3 34 5612 22 25 31
5 9 29 577 22 30 27
6 6 32 5612 20 26 30
4 7 41 4812 29 23 25
2 2 47 4920 27 26 23
10 5 27 5811 16 26 32
12 5 28 5511 17 20 35
6 4 28 6211 17 31 31
30 4 36 3013 23 12 18
3 7 34 5614 20 31 25
4 3 24 698 16 34 35
5 4 35 5619 16 25 31
15 17 30 386 24 19 19
21 6 35 389 26 21 17
17 17 31 357 24 19 16
9 9 26 5615 11 22 34
3 13 40 4414 26 23 21
4 5 22 696 16 29 40
1 2 23 746 17 29 45
7 6 25 6211 14 28 34
QA11 Après une décennie d’interdiction, dans quelle mesure serait-il important pour vous de pouvoir emmener plus de liquides que la limite actuelle, au-delà des postes de sécurité dans les aéroports en vue de les prendre avec vous dans l'avion ? QA11 After a decade of the ban on liquids, how important would it be for you to be able to bring liquids above the current limit through the security checkpoints at airports, in order to bring them with you on board the plane? QA11 Wie wichtig wäre es für Sie nach einem Jahrzehnt des Flüssigkeitsverbots, erneut Flüssigkeiten in Mengen, die den derzeit geltenden Grenzwert übersteigen, durch die Sicherheitskontrollen am Flughafen und auch an Bord des Flugzeugs mitnehmen zu können?
T22
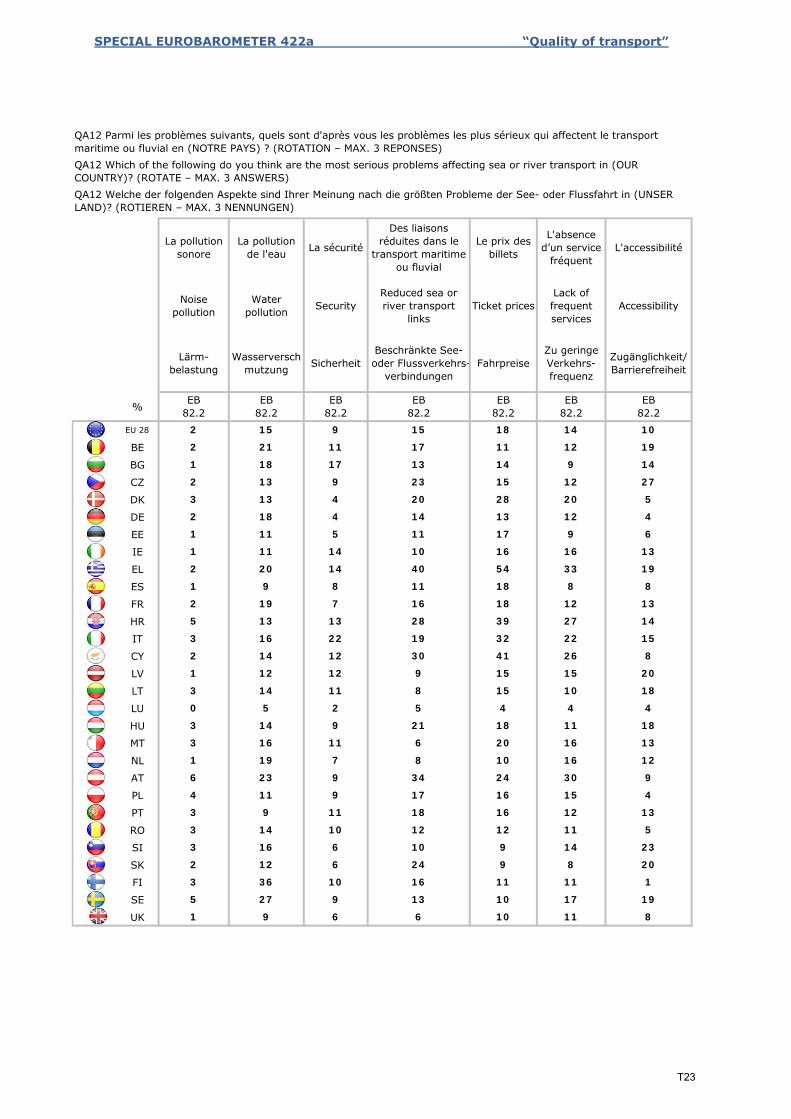
SPECIAL EUROBAROMETER 422a “Quality of transport”
%
EU 28
BE
BG
CZ
DK
DE
EE
IE
EL
ES
FR
HR
IT
CY
LV
LT
LU
HU
MT
NL
AT
PL
PT
RO
SI
SK
FI
SE
UK
La pollution sonore
Noise pollution
Lärm-belastung
EB82.2
La sécurité
Security
Sicherheit
EB82.2
La pollution de l'eau
Water pollution
Wasserverschmutzung
EB82.2
Le prix des billets
Ticket prices
Fahrpreise
EB82.2
Des liaisons réduites dans le
transport maritime ou fluvial
Reduced sea or river transport
links
Beschränkte See- oder Flussverkehrs-
verbindungen
EB82.2
L'accessibilité
Accessibility
Zugänglichkeit/ Barrierefreiheit
EB82.2
L'absence d’un service
fréquent
Lack of frequent services
Zu geringe Verkehrs-frequenz
EB82.2
2 15 9 15
19
18 14 10
14
2 21 11 17 11 12
27
1 18 17 13 14 9
5
2 13 9 23 15 12
3 13 4 20 28 20
2 18 4 14 13 12 4
13
1 11 5 11 17 9 6
19
1 11 14 10 16 16
8
2 20 14 40 54 33
13
1 9 8 11 18 8
14
2 19 7 16 18 12
15
5 13 13 28 39 27
8
3 16 22 19 32 22
20
2 14 12 30 41 26
18
1 12 12 9 15 15
4
3 14 11 8 15 10
18
0 5 2 5 4 4
13
3 14 9 21 18 11
12
3 16 11 6 20 16
9
1 19 7 8 10 16
4
6 23 9 34 24 30
13
4 11 9 17 16 15
5
3 9 11 18 16 12
23
3 14 10 12 12 11
20
3 16 6 10 9 14
1
2 12 6 24 9 8
19
3 36 10 16 11 11
8
5 27 9 13 10 17
1 9 6 6 10 11
QA12 Parmi les problèmes suivants, quels sont d'après vous les problèmes les plus sérieux qui affectent le transport maritime ou fluvial en (NOTRE PAYS) ? (ROTATION – MAX. 3 REPONSES)QA12 Which of the following do you think are the most serious problems affecting sea or river transport in (OUR COUNTRY)? (ROTATE – MAX. 3 ANSWERS)QA12 Welche der folgenden Aspekte sind Ihrer Meinung nach die größten Probleme der See- oder Flussfahrt in (UNSER LAND)? (ROTIEREN – MAX. 3 NENNUNGEN)
T23
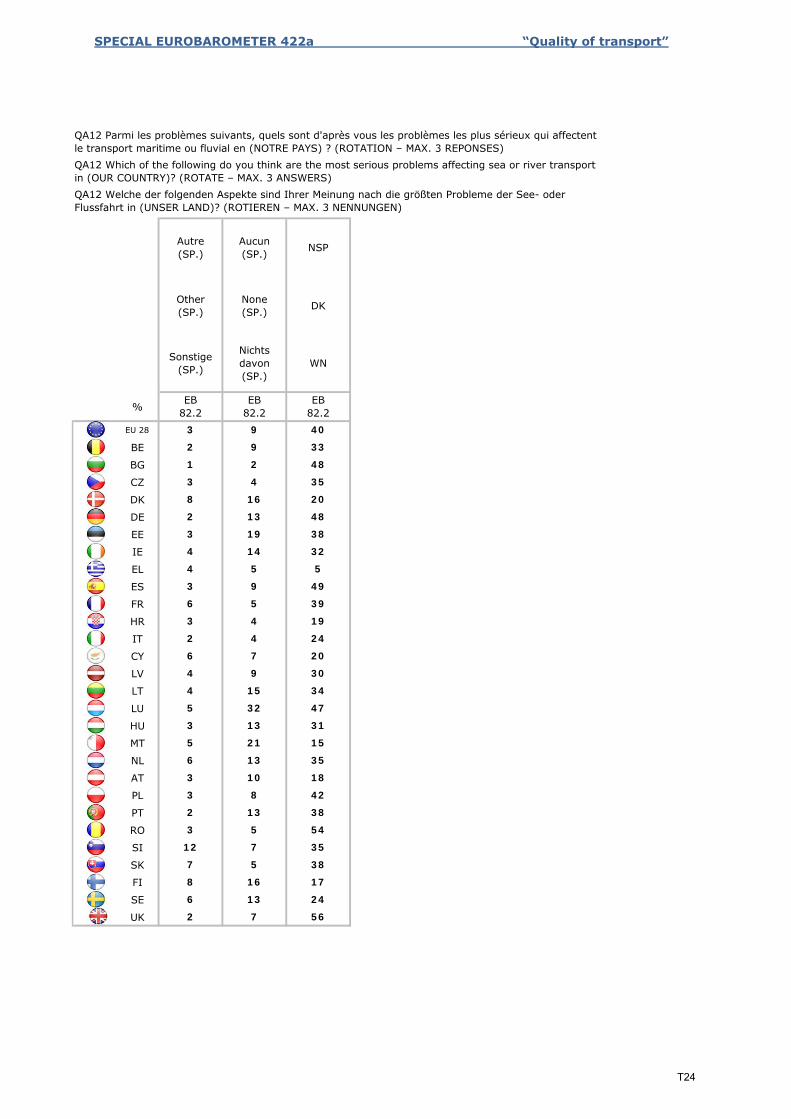
SPECIAL EUROBAROMETER 422a “Quality of transport”
%
EU 28
BE
BG
CZ
DK
DE
EE
IE
EL
ES
FR
HR
IT
CY
LV
LT
LU
HU
MT
NL
AT
PL
PT
RO
SI
SK
FI
SE
UK 2 7 56
QA12 Parmi les problèmes suivants, quels sont d'après vous les problèmes les plus sérieux qui affectent le transport maritime ou fluvial en (NOTRE PAYS) ? (ROTATION – MAX. 3 REPONSES)QA12 Which of the following do you think are the most serious problems affecting sea or river transport in (OUR COUNTRY)? (ROTATE – MAX. 3 ANSWERS)QA12 Welche der folgenden Aspekte sind Ihrer Meinung nach die größten Probleme der See- oder Flussfahrt in (UNSER LAND)? (ROTIEREN – MAX. 3 NENNUNGEN)
6 13 24
8 16 17
7 5 38
12 7 35
3 5 54
2 13 38
3 8 42
3 10 18
6 13 35
5 21 15
3 13 31
5 32 47
4 15 34
4 9 30
6 7 20
2 4 24
3 4 19
6 5 39
3 9 49
4 5 5
4 14 32
3 19 38
2 13 48
8 16 20
3 4 35
1 2 48
2 9 33
3 9 40
EB82.2
EB82.2
EB82.2
Sonstige (SP.)
Nichts davon (SP.)
WN
Other (SP.)
None (SP.) DK
Autre (SP.)
Aucun (SP.) NSP
T24
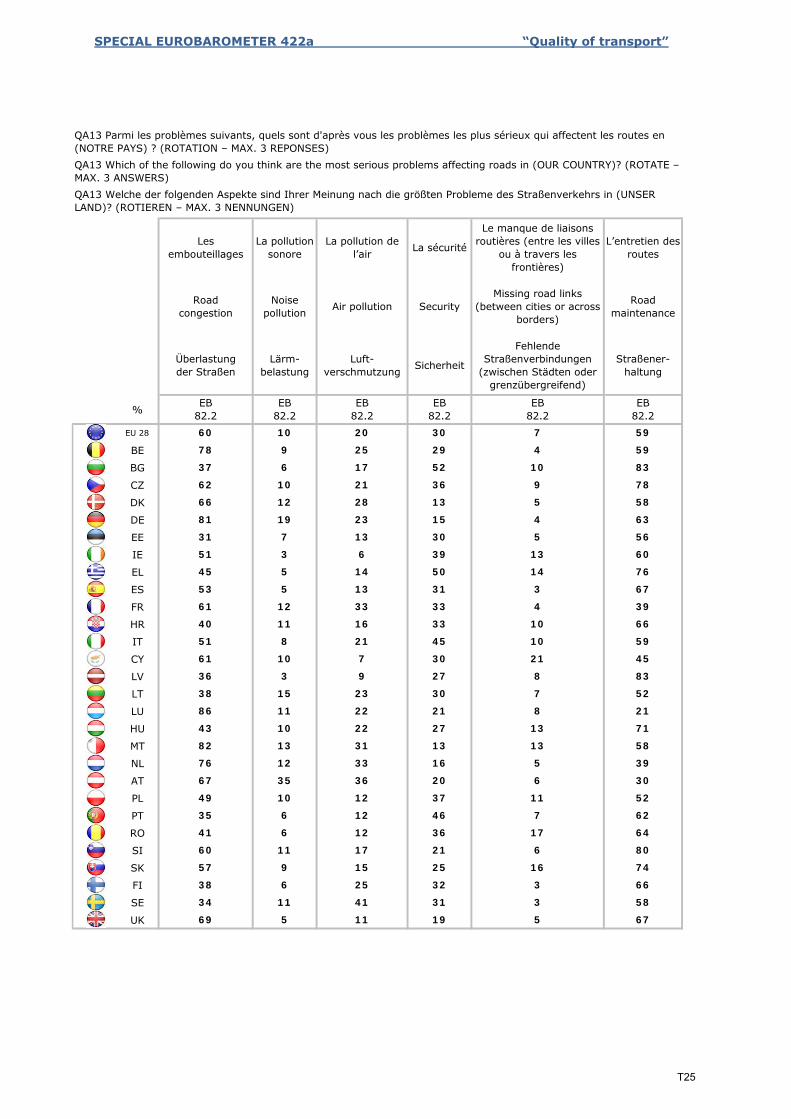
SPECIAL EUROBAROMETER 422a “Quality of transport”
%
EU 28
BE
BG
CZ
DK
DE
EE
IE
EL
ES
FR
HR
IT
CY
LV
LT
LU
HU
MT
NL
AT
PL
PT
RO
SI
SK
FI
SE
UK
Les embouteillages
Road congestion
Überlastung der Straßen
EB82.2
La pollution de l’air
Air pollution
Luft-verschmutzung
EB82.2
La pollution sonore
Noise pollution
Lärm-belastung
EB82.2
Le manque de liaisons routières (entre les villes
ou à travers les frontières)
Missing road links (between cities or across
borders)
Fehlende Straßenverbindungen
(zwischen Städten oder grenzübergreifend)
EB82.2
La sécurité
Security
Sicherheit
EB82.2
L’entretien des routes
Road maintenance
Straßener-haltung
EB82.2
60 10 20 30 7 59
78 9 25 29 4 59
37 6 17 52 10 83
62 10 21 36 9 78
66 12 28 13 5 58
81 19 23 15 4 63
31 7 13 30 5 56
51 3 6 39 13 60
45 5 14 50 14 76
53 5 13 31 3 67
61 12 33 33 4 39
40 11 16 33 10 66
51 8 21 45 10 59
61 10 7 30 21 45
36 3 9 27 8 83
38 15 23 30 7 52
86 11 22 21 8 21
43 10 22 27 13 71
82 13 31 13 13 58
76 12 33 16 5 39
67 35 36 20 6 30
49 10 12 37 11 52
35 6 12 46 7 62
41 6 12 36 17 64
60 11 17 21 6 80
57 9 15 25 16 74
38 6 25 32 3 66
34 11 41 31 3 58
69 5 11 19 5 67
QA13 Parmi les problèmes suivants, quels sont d'après vous les problèmes les plus sérieux qui affectent les routes en (NOTRE PAYS) ? (ROTATION – MAX. 3 REPONSES)QA13 Which of the following do you think are the most serious problems affecting roads in (OUR COUNTRY)? (ROTATE – MAX. 3 ANSWERS)QA13 Welche der folgenden Aspekte sind Ihrer Meinung nach die größten Probleme des Straßenverkehrs in (UNSER LAND)? (ROTIEREN – MAX. 3 NENNUNGEN)
T25
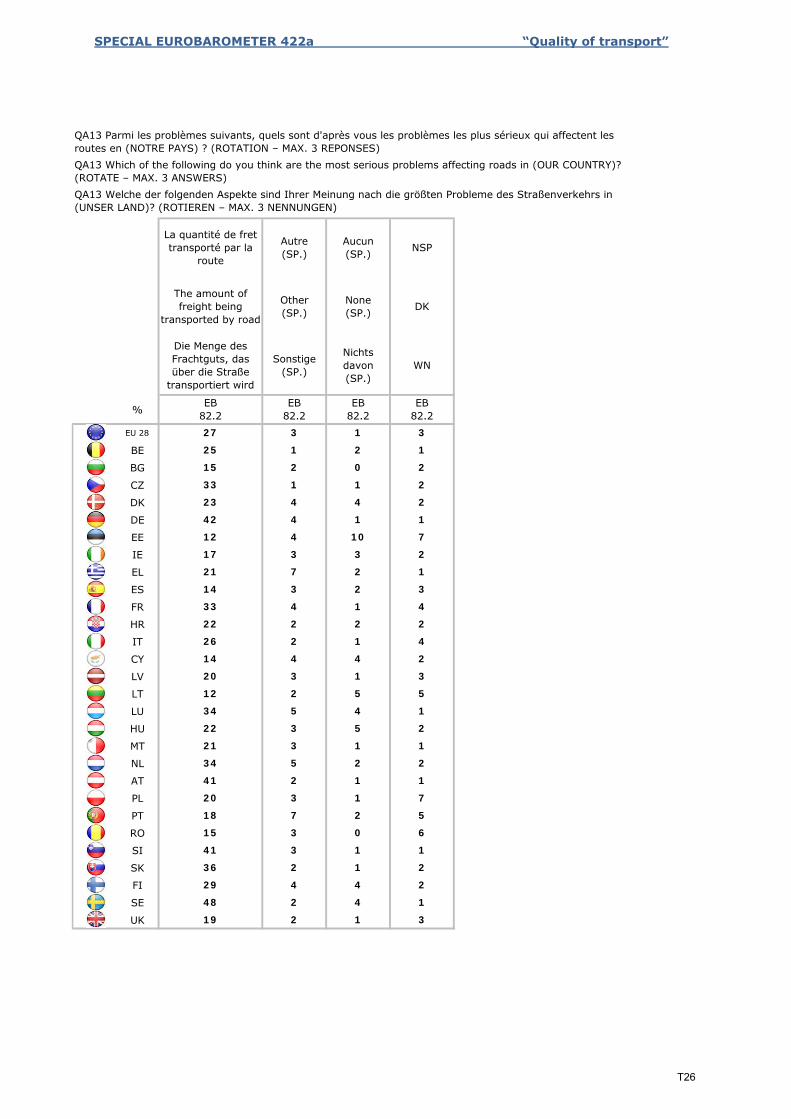
SPECIAL EUROBAROMETER 422a “Quality of transport”
%
EU 28
BE
BG
CZ
DK
DE
EE
IE
EL
ES
FR
HR
IT
CY
LV
LT
LU
HU
MT
NL
AT
PL
PT
RO
SI
SK
FI
SE
UK 19 2 1 3
QA13 Parmi les problèmes suivants, quels sont d'après vous les problèmes les plus sérieux qui affectent les routes en (NOTRE PAYS) ? (ROTATION – MAX. 3 REPONSES)QA13 Which of the following do you think are the most serious problems affecting roads in (OUR COUNTRY)? (ROTATE – MAX. 3 ANSWERS)QA13 Welche der folgenden Aspekte sind Ihrer Meinung nach die größten Probleme des Straßenverkehrs in (UNSER LAND)? (ROTIEREN – MAX. 3 NENNUNGEN)
48 2 4 1
29 4 4 2
36 2 1 2
41 3 1 1
15 3 0 6
18 7 2 5
20 3 1 7
41 2 1 1
34 5 2 2
21 3 1 1
22 3 5 2
34 5 4 1
12 2 5 5
20 3 1 3
14 4 4 2
26 2 1 4
22 2 2 2
33 4 1 4
14 3 2 3
21 7 2 1
17 3 3 2
12 4 10 7
42 4 1 1
23 4 4 2
33 1 1 2
15 2 0 2
25 1 2 1
27 3 1 3
EB82.2
EB82.2
EB82.2
EB82.2
Die Menge des Frachtguts, das über die Straße
transportiert wird
Sonstige (SP.)
Nichts davon (SP.)
WN
The amount of freight being
transported by road
Other (SP.)
None (SP.) DK
La quantité de fret transporté par la
route
Autre (SP.)
Aucun (SP.) NSP
T26
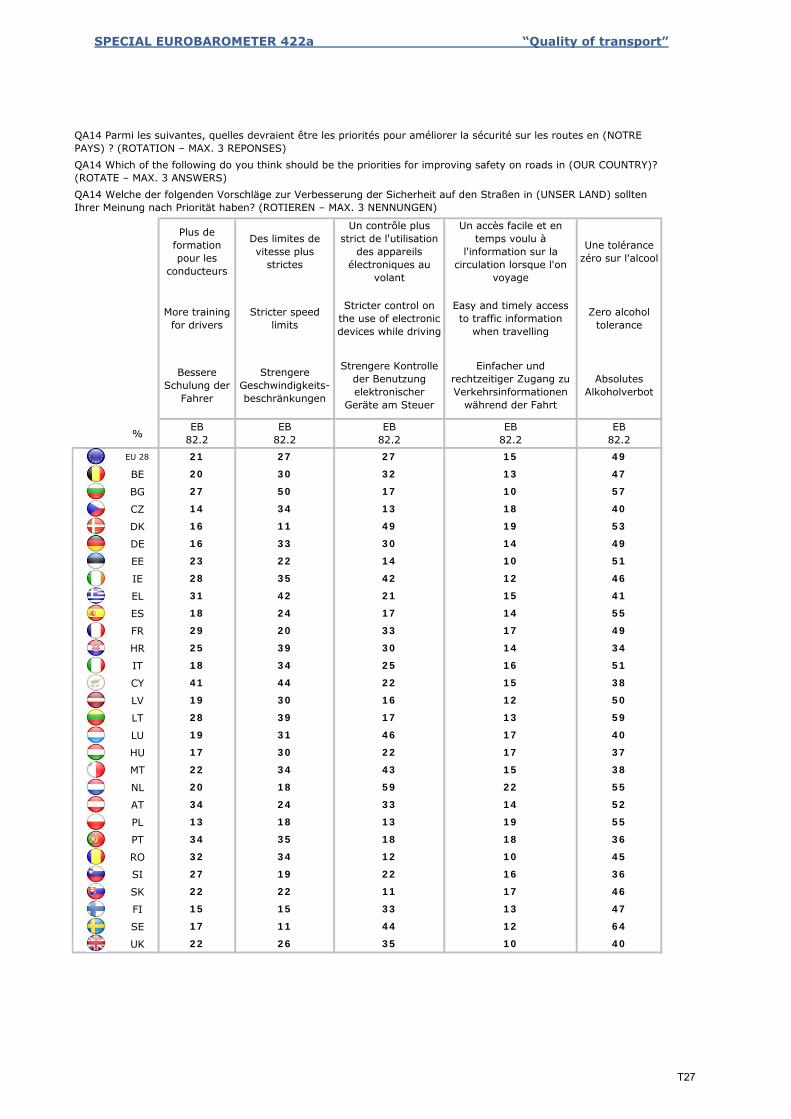
SPECIAL EUROBAROMETER 422a “Quality of transport”
%
EU 28
BE
BG
CZ
DK
DE
EE
IE
EL
ES
FR
HR
IT
CY
LV
LT
LU
HU
MT
NL
AT
PL
PT
RO
SI
SK
FI
SE
UK
Plus de formation pour les
conducteurs
More training for drivers
Bessere Schulung der
Fahrer
EB82.2
Un contrôle plus strict de l'utilisation
des appareils électroniques au
volant
Stricter control on the use of electronic devices while driving
Strengere Kontrolle der Benutzung elektronischer
Geräte am Steuer
EB82.2
Des limites de vitesse plus
strictes
Stricter speed limits
Strengere Geschwindigkeits-beschränkungen
EB82.2
Une tolérance zéro sur l'alcool
Zero alcohol tolerance
Absolutes Alkoholverbot
EB82.2
Un accès facile et en temps voulu à
l'information sur la circulation lorsque l'on
voyage
Easy and timely access to traffic information
when travelling
Einfacher und rechtzeitiger Zugang zu Verkehrsinformationen
während der Fahrt
EB82.2
21 27 27 15 49
20 30 32 13 47
27 50 17 10 57
14 34 13 18 40
16 11 49 19 53
16 33 30 14 49
23 22 14 10 51
28 35 42 12 46
31 42 21 15 41
18 24 17 14 55
29 20 33 17 49
25 39 30 14 34
18 34 25 16 51
41 44 22 15 38
19 30 16 12 50
28 39 17 13 59
19 31 46 17 40
17 30 22 17 37
22 34 43 15 38
20 18 59 22 55
34 24 33 14 52
13 18 13 19 55
34 35 18 18 36
32 34 12 10 45
27 19 22 16 36
22 22 11 17 46
15 15 33 13 47
17 11 44 12 64
22 26 35 10 40
QA14 Parmi les suivantes, quelles devraient être les priorités pour améliorer la sécurité sur les routes en (NOTRE PAYS) ? (ROTATION – MAX. 3 REPONSES)QA14 Which of the following do you think should be the priorities for improving safety on roads in (OUR COUNTRY)? (ROTATE – MAX. 3 ANSWERS)QA14 Welche der folgenden Vorschläge zur Verbesserung der Sicherheit auf den Straßen in (UNSER LAND) sollten Ihrer Meinung nach Priorität haben? (ROTIEREN – MAX. 3 NENNUNGEN)
T27
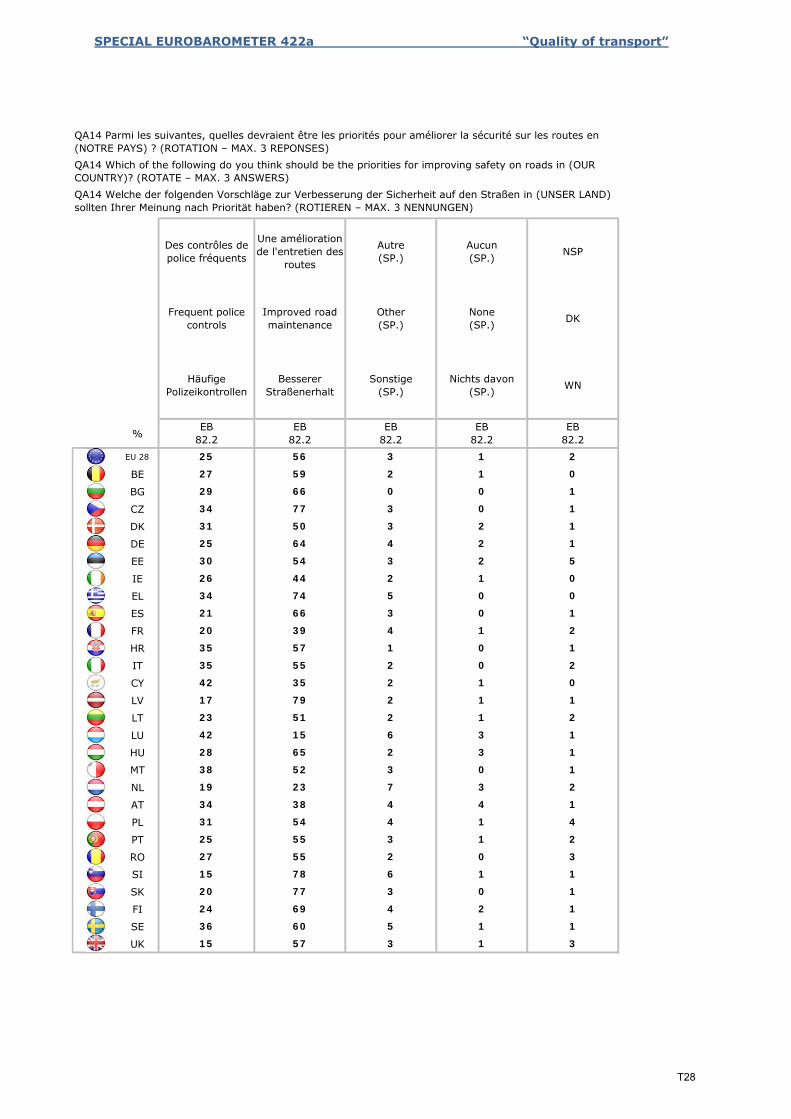
SPECIAL EUROBAROMETER 422a “Quality of transport”
%
EU 28
BE
BG
CZ
DK
DE
EE
IE
EL
ES
FR
HR
IT
CY
LV
LT
LU
HU
MT
NL
AT
PL
PT
RO
SI
SK
FI
SE
UK 57 3 1 3
60 5 1 1
15
69 4 2 1
36
77 3 0 1
24
78 6 1 1
20
55 2 0 3
15
55 3 1 2
27
54 4 1 4
25
38 4 4 1
31
23 7 3 2
34
52 3 0 1
19
65 2 3 1
38
15 6 3 1
28
51 2 1 2
42
79 2 1 1
23
35 2 1 0
17
55 2 0 2
42
57 1 0 1
35
39 4 1 2
35
66 3 0 1
20
74 5 0 0
21
44 2 1 0
34
54 3 2 5
26
64 4 2 1
30
50 3 2 1
25
77 3 0 1
31
66 0 0 1
34
59 2 1 0
29
56 3 1 2
27
EB82.2
EB82.2
EB82.2
EB82.2
25
Besserer Straßenerhalt
Sonstige (SP.)
Nichts davon (SP.) WN
EB82.2
Improved road maintenance
Other (SP.)
None (SP.) DK
Häufige Polizeikontrollen
Une amélioration de l'entretien des
routes
Autre (SP.)
Aucun (SP.) NSP
Frequent police controls
Des contrôles de police fréquents
QA14 Parmi les suivantes, quelles devraient être les priorités pour améliorer la sécurité sur les routes en (NOTRE PAYS) ? (ROTATION – MAX. 3 REPONSES)QA14 Which of the following do you think should be the priorities for improving safety on roads in (OUR COUNTRY)? (ROTATE – MAX. 3 ANSWERS)QA14 Welche der folgenden Vorschläge zur Verbesserung der Sicherheit auf den Straßen in (UNSER LAND) sollten Ihrer Meinung nach Priorität haben? (ROTIEREN – MAX. 3 NENNUNGEN)
T28
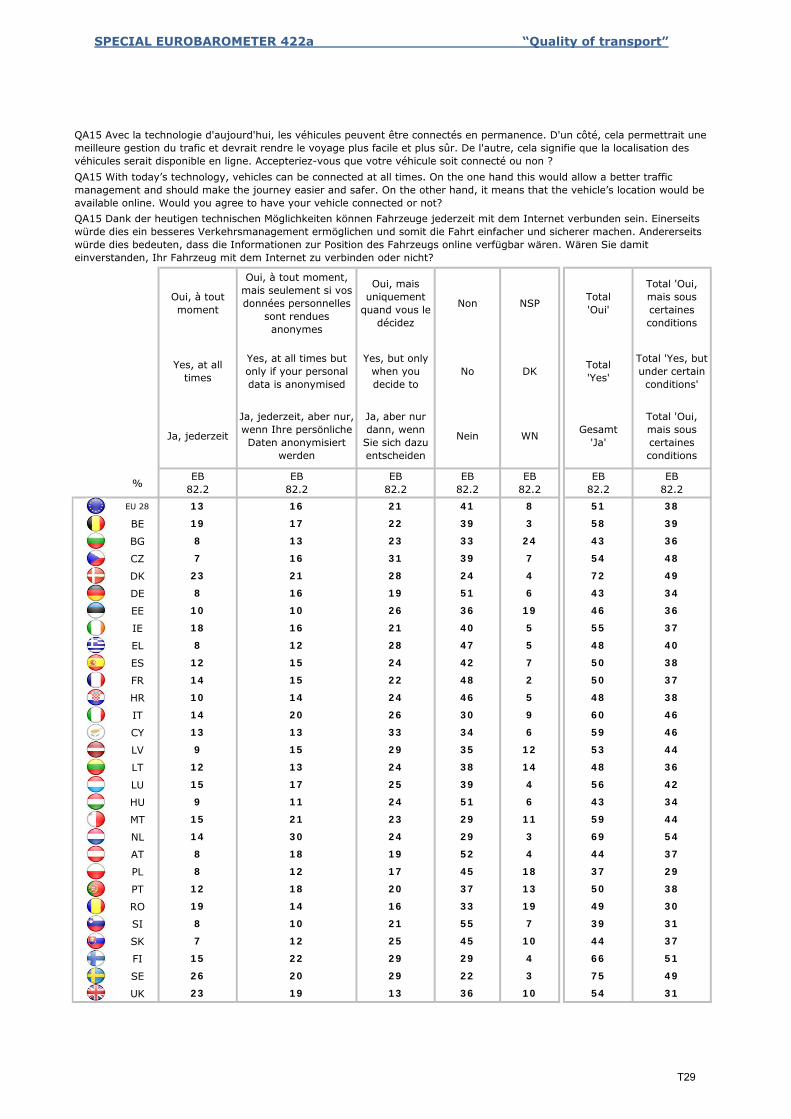
SPECIAL EUROBAROMETER 422a “Quality of transport”
%
EU 28
BE
BG
CZ
DK
DE
EE
IE
EL
ES
FR
HR
IT
CY
LV
LT
LU
HU
MT
NL
AT
PL
PT
RO
SI
SK
FI
SE
UK
QA15 Avec la technologie d'aujourd'hui, les véhicules peuvent être connectés en permanence. D'un côté, cela permettrait une meilleure gestion du trafic et devrait rendre le voyage plus facile et plus sûr. De l'autre, cela signifie que la localisation des véhicules serait disponible en ligne. Accepteriez-vous que votre véhicule soit connecté ou non ? QA15 With today’s technology, vehicles can be connected at all times. On the one hand this would allow a better traffic management and should make the journey easier and safer. On the other hand, it means that the vehicle’s location would be available online. Would you agree to have your vehicle connected or not? QA15 Dank der heutigen technischen Möglichkeiten können Fahrzeuge jederzeit mit dem Internet verbunden sein. Einerseits würde dies ein besseres Verkehrsmanagement ermöglichen und somit die Fahrt einfacher und sicherer machen. Andererseits würde dies bedeuten, dass die Informationen zur Position des Fahrzeugs online verfügbar wären. Wären Sie damit einverstanden, Ihr Fahrzeug mit dem Internet zu verbinden oder nicht?
Oui, à tout moment, mais seulement si vos données personnelles
sont rendues anonymes
Yes, at all times but only if your personal data is anonymised
Non
No
Ja, jederzeit, aber nur, wenn Ihre persönliche Daten anonymisiert
werden
EB82.2
Oui, à tout moment
Yes, at all times
Ja, jederzeit
EB82.2
Nein
EB82.2
Oui, mais uniquement
quand vous le décidez
Yes, but only when you decide to
Ja, aber nur dann, wenn Sie sich dazu entscheiden
EB82.2
Gesamt 'Ja'
EB82.2
NSP
DK
WN
EB82.2
13 16 21 41
Total 'Oui, mais sous certaines conditions
Total 'Yes, but under certain conditions'
Total 'Oui, mais sous certaines conditions
EB82.2
Total 'Oui'
Total 'Yes'
8 51 38
19 17 22 39 3 58 39
36
7 16 31 39 7 54 48
8 13 24 4323 33
4 72
348 16
4923 21 28 24
26 36
6 4319 51
19 46 36
18 16 21 40 5 55 37
10 10
40
12 15 24 42 7 50 38
8 12
22 48
5 4828 47
2 50 37
10 14 24 46 5 48 38
14 15
46
13 13 33 34 6 59 46
14 20
29 35
9 6026 30
12 53 44
12 13 24 38 14 48 36
9 15
42
9 11 24 51 6 43 34
15 17
23 29
4 5625 39
11 59 44
14 30 24 29 3 69 54
15 21
37
8 12 17 45 18 37 29
8 18
20 37
4 4419 52
13 50 38
19 14 16 33 19 49 30
12 18
31
7 12 25 45 10 44 37
8 10
22 29 29
7 3921 55
4 66
36
51
26 20 29 22 3 75 49
15
10 54 3123 19 13
T29
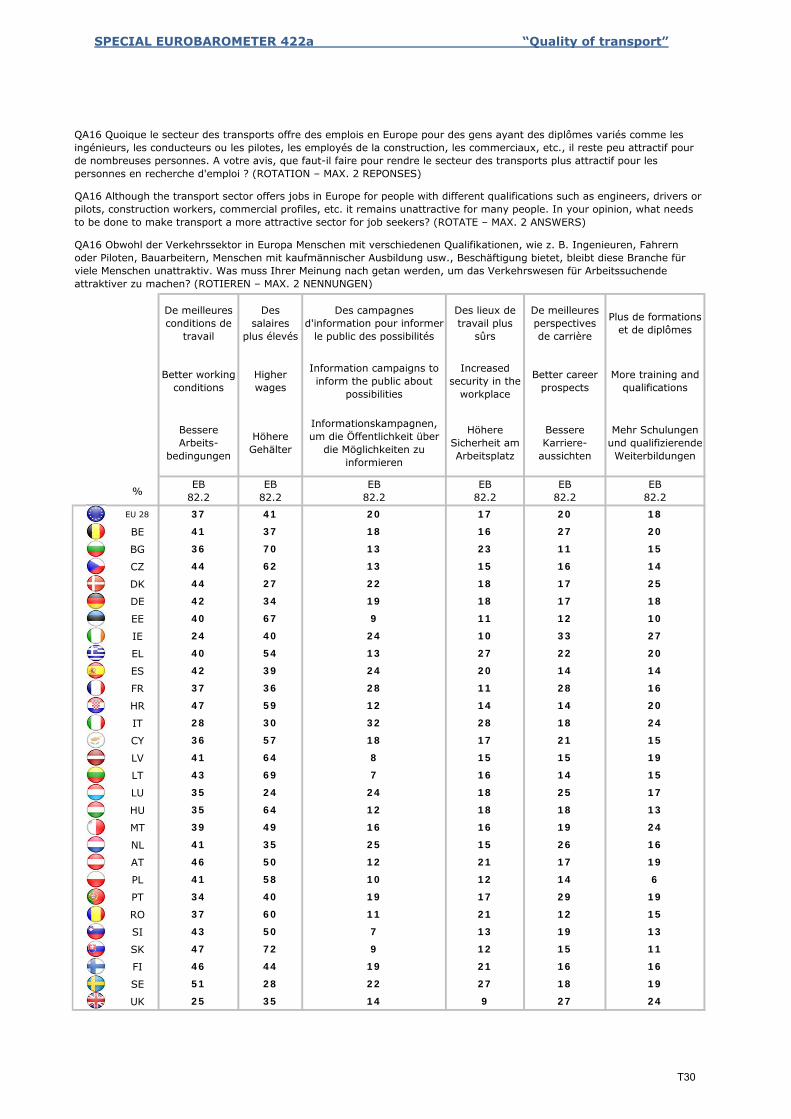
SPECIAL EUROBAROMETER 422a “Quality of transport”
%
EU 28
BE
BG
CZ
DK
DE
EE
IE
EL
ES
FR
HR
IT
CY
LV
LT
LU
HU
MT
NL
AT
PL
PT
RO
SI
SK
FI
SE
UK
De meilleures conditions de
travail
Better working conditions
Bessere Arbeits-
bedingungen
EB82.2
Des campagnes d'information pour informer
le public des possibilités
Information campaigns to inform the public about
possibilities
Informationskampagnen, um die Öffentlichkeit über
die Möglichkeiten zu informieren
EB82.2
Des salaires
plus élevés
Higher wages
Höhere Gehälter
EB82.2
De meilleures perspectives de carrière
Better career prospects
Bessere Karriere-
aussichten
EB82.2
Des lieux de travail plus
sûrs
Increased security in the
workplace
Höhere Sicherheit am Arbeitsplatz
EB82.2
Plus de formations et de diplômes
More training and qualifications
Mehr Schulungen und qualifizierende Weiterbildungen
EB82.2
20 1837 41 20 17
41 37 18 16 27 20
11 1536 70 13 23
44 62 13 15 16 14
17 2544 27 22 18
17 1842 34 19 18
12 1040 67 9 11
24 40 24 10 33 27
22 2040 54 13 27
42 39 24 20 14 14
28 1637 36 28 11
47 59 12 14 14 20
18 2428 30 32 28
36 57 18 17 21 15
15 1941 64 8 15
43 69 7 16 14 15
25 1735 24 24 18
35 64 12 18 18 13
19 2439 49 16 16
41 35 25 15 26 16
17 1946 50 12 21
41 58 10 12 14 6
29 1934 40 19 17
37 60 11 21 12 15
19 1343 50 7 13
47 72 9 12 15 11
16 1646 44 19 21
51 28 22 27 18 19
27 2425 35 14 9
QA16 Quoique le secteur des transports offre des emplois en Europe pour des gens ayant des diplômes variés comme les ingénieurs, les conducteurs ou les pilotes, les employés de la construction, les commerciaux, etc., il reste peu attractif pour de nombreuses personnes. A votre avis, que faut-il faire pour rendre le secteur des transports plus attractif pour les personnes en recherche d'emploi ? (ROTATION – MAX. 2 REPONSES)
QA16 Although the transport sector offers jobs in Europe for people with different qualifications such as engineers, drivers or pilots, construction workers, commercial profiles, etc. it remains unattractive for many people. In your opinion, what needs to be done to make transport a more attractive sector for job seekers? (ROTATE – MAX. 2 ANSWERS)
QA16 Obwohl der Verkehrssektor in Europa Menschen mit verschiedenen Qualifikationen, wie z. B. Ingenieuren, Fahrern oder Piloten, Bauarbeitern, Menschen mit kaufmännischer Ausbildung usw., Beschäftigung bietet, bleibt diese Branche für viele Menschen unattraktiv. Was muss Ihrer Meinung nach getan werden, um das Verkehrswesen für Arbeitssuchende attraktiver zu machen? (ROTIEREN – MAX. 2 NENNUNGEN)
T30
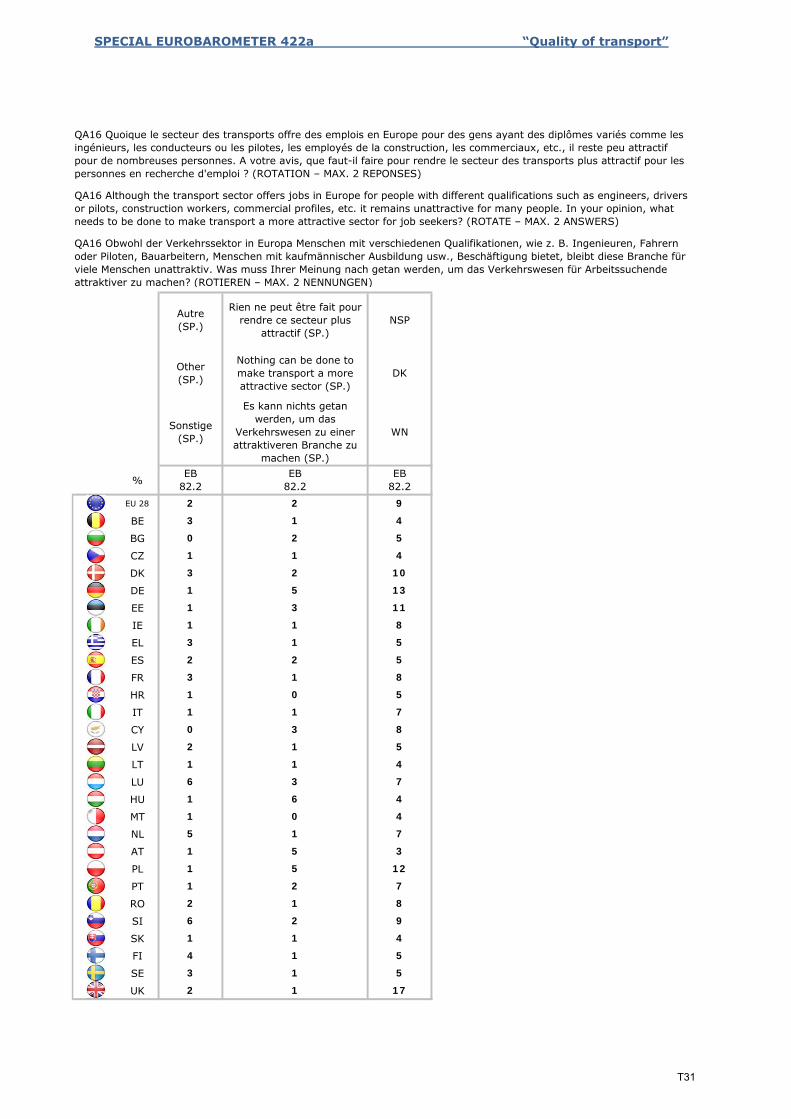
SPECIAL EUROBAROMETER 422a “Quality of transport”
%
EU 28
BE
BG
CZ
DK
DE
EE
IE
EL
ES
FR
HR
IT
CY
LV
LT
LU
HU
MT
NL
AT
PL
PT
RO
SI
SK
FI
SE
UK 2 1 17
QA16 Quoique le secteur des transports offre des emplois en Europe pour des gens ayant des diplômes variés comme les ingénieurs, les conducteurs ou les pilotes, les employés de la construction, les commerciaux, etc., il reste peu attractif pour de nombreuses personnes. A votre avis, que faut-il faire pour rendre le secteur des transports plus attractif pour les personnes en recherche d'emploi ? (ROTATION – MAX. 2 REPONSES)
QA16 Although the transport sector offers jobs in Europe for people with different qualifications such as engineers, drivers or pilots, construction workers, commercial profiles, etc. it remains unattractive for many people. In your opinion, what needs to be done to make transport a more attractive sector for job seekers? (ROTATE – MAX. 2 ANSWERS)
QA16 Obwohl der Verkehrssektor in Europa Menschen mit verschiedenen Qualifikationen, wie z. B. Ingenieuren, Fahrern oder Piloten, Bauarbeitern, Menschen mit kaufmännischer Ausbildung usw., Beschäftigung bietet, bleibt diese Branche für viele Menschen unattraktiv. Was muss Ihrer Meinung nach getan werden, um das Verkehrswesen für Arbeitssuchende attraktiver zu machen? (ROTIEREN – MAX. 2 NENNUNGEN)
5
3 1 5
1 4
4 1
6 2 9
1
7
2 1 8
5 12
1 2
1 5 3
1
4
5 1 7
6 4
1 0
6 3 7
1
5
1 1 4
3 8
2 1
1 1 7
0
8
1 0 5
2 5
3 1
3 1 5
2
11
1 1 8
5 13
1 3
3 2 10
1
5
1 1 4
1 4
0 2
2 2 9
3
WN
EB82.2
EB82.2
EB82.2
Nothing can be done to make transport a more attractive sector (SP.)
DK
Sonstige (SP.)
Es kann nichts getan werden, um das
Verkehrswesen zu einer attraktiveren Branche zu
machen (SP.)
Autre (SP.)
Rien ne peut être fait pour rendre ce secteur plus
attractif (SP.)NSP
Other (SP.)
T31