Embed Size (px)
Citation preview
This template is available at: http://www.ecmwf.int/en/computing/access-computing-facilities/forms
01/07/16
SPECIAL PROJECT FINAL REPORT All the following mandatory information needs to be provided.
Project Title: Sensitivity of decadal forecast to atmospheric resolution and physics
Computer Project Account: spfrguer
Start Year - End Year : 2013 - 2015
Principal Investigator(s) Jean-François Guérémy
Affiliation/Address: CNRM UMR 3589 Météo-France/CNRS 42, avenue G. Coriolis 31057 Toulouse, France
Other Researchers (Name/Affiliation):
Michel Déqué (CNRM)
The following should cover the entire project duration. Summary of project objectives (10 lines max) The main objective of the project is to investigate the sensitivity of decadal predictability to atmospheric resolution and physics. Two earlier projects dealing with decadal forecasts (i.e., CMIP5 and EPIDOM) made use of our present model CNRM-CM5 with different atmospheric spatial resolutions, Tl127l31 for the former and Tl63l62 together with Tl63l91 (including stratosphere for the latter). In the present project, we will use a more recent version of the CNRM-CM model including a new atmospheric physical package (non orographic gravity wave drag, turbulence, convection and microphysics). Moreover, different atmospheric spatial resolutions will be considered in the course of the project, all including the stratosphere to take advantage of our simulated QBO, starting from Tl159l91 and going to Tl255l91.
This template is available at: http://www.ecmwf.int/en/computing/access-computing-facilities/forms
01/07/16
Summary of problems encountered (If you encountered any problems of a more technical nature, please describe them here. ) Going from IBM to Cray HPC, we have experienced a drop of computing resources. Our coupled model is working with 3 components (atmosphere, ocean and coupler), each of them taking necessarily one node on the Cray HPC, which is not the case on the previous IBM and the MF Bull. Going from T159l91 to Tl255l91, in the course of the second year, represented a resource increase of 2.6; we decided to divide by 2 the number of years in the range of the hindcasts; but finally we carried out only 6 start years among the 11, with the available resources of that year. During the last year, we benefited from a fix provided by EC support, which enables ensembles of Tl255l91 10 members (5 year range) over 11 start years.
Experience with the Special Project framework (Please let us know about your experience with administrative aspects like the application procedure, progress reporting etc.)
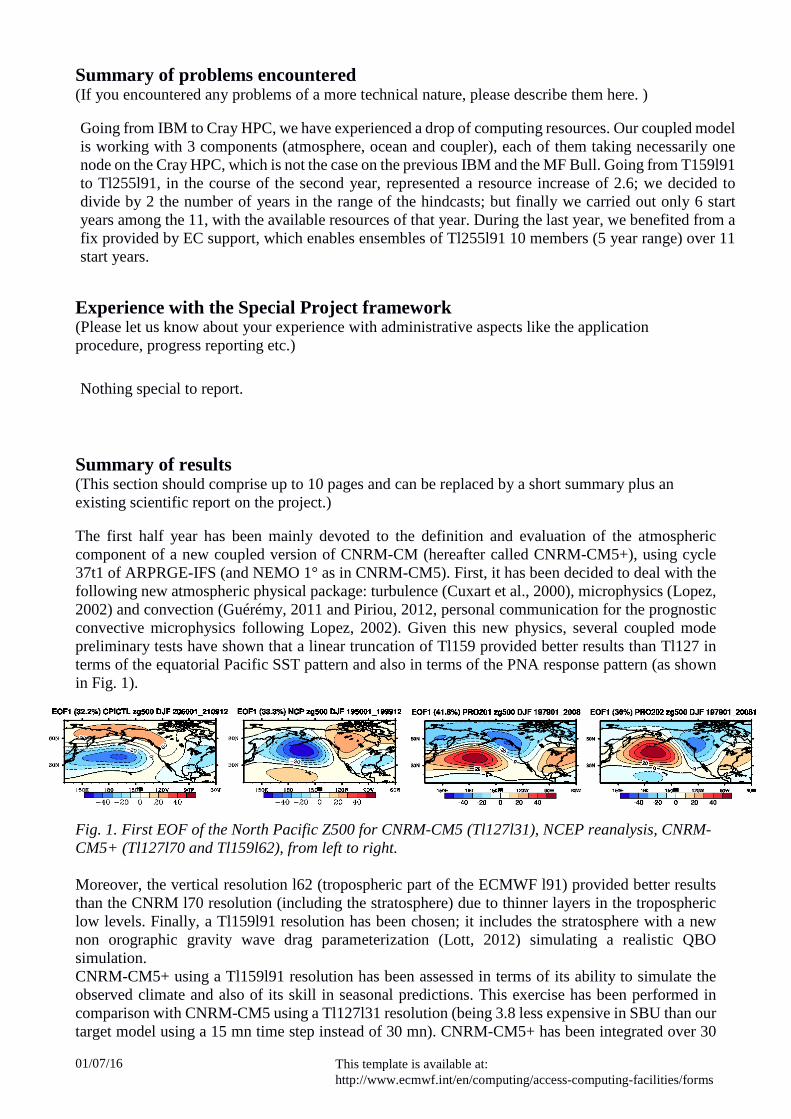
Nothing special to report. Summary of results (This section should comprise up to 10 pages and can be replaced by a short summary plus an existing scientific report on the project.) The first half year has been mainly devoted to the definition and evaluation of the atmospheric component of a new coupled version of CNRM-CM (hereafter called CNRM-CM5+), using cycle 37t1 of ARPRGE-IFS (and NEMO 1° as in CNRM-CM5). First, it has been decided to deal with the following new atmospheric physical package: turbulence (Cuxart et al., 2000), microphysics (Lopez, 2002) and convection (Guérémy, 2011 and Piriou, 2012, personal communication for the prognostic convective microphysics following Lopez, 2002). Given this new physics, several coupled mode preliminary tests have shown that a linear truncation of Tl159 provided better results than Tl127 in terms of the equatorial Pacific SST pattern and also in terms of the PNA response pattern (as shown in Fig. 1). Fig. 1. First EOF of the North Pacific Z500 for CNRM-CM5 (Tl127l31), NCEP reanalysis, CNRM-CM5+ (Tl127l70 and Tl159l62), from left to right. Moreover, the vertical resolution l62 (tropospheric part of the ECMWF l91) provided better results than the CNRM l70 resolution (including the stratosphere) due to thinner layers in the tropospheric low levels. Finally, a Tl159l91 resolution has been chosen; it includes the stratosphere with a new non orographic gravity wave drag parameterization (Lott, 2012) simulating a realistic QBO simulation. CNRM-CM5+ using a Tl159l91 resolution has been assessed in terms of its ability to simulate the observed climate and also of its skill in seasonal predictions. This exercise has been performed in comparison with CNRM-CM5 using a Tl127l31 resolution (being 3.8 less expensive in SBU than our target model using a 15 mn time step instead of 30 mn). CNRM-CM5+ has been integrated over 30
This template is available at: http://www.ecmwf.int/en/computing/access-computing-facilities/forms
01/07/16
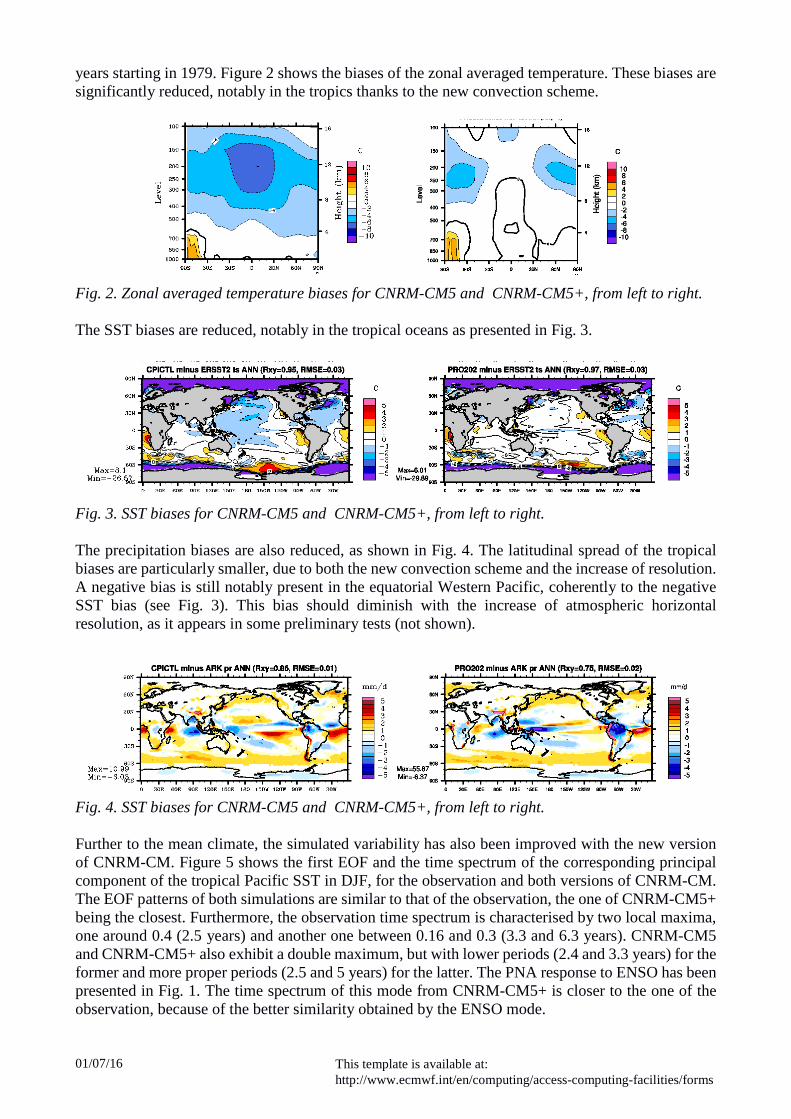
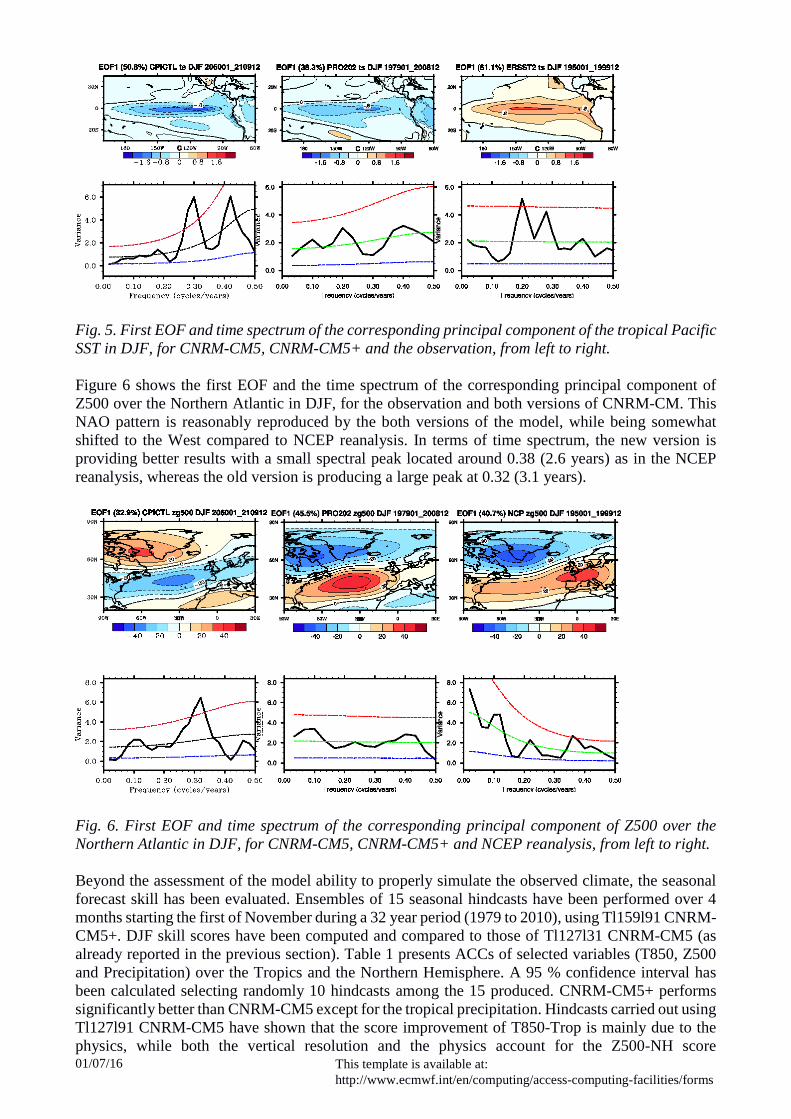
years starting in 1979. Figure 2 shows the biases of the zonal averaged temperature. These biases are significantly reduced, notably in the tropics thanks to the new convection scheme. Fig. 2. Zonal averaged temperature biases for CNRM-CM5 and CNRM-CM5+, from left to right. The SST biases are reduced, notably in the tropical oceans as presented in Fig. 3. Fig. 3. SST biases for CNRM-CM5 and CNRM-CM5+, from left to right. The precipitation biases are also reduced, as shown in Fig. 4. The latitudinal spread of the tropical biases are particularly smaller, due to both the new convection scheme and the increase of resolution. A negative bias is still notably present in the equatorial Western Pacific, coherently to the negative SST bias (see Fig. 3). This bias should diminish with the increase of atmospheric horizontal resolution, as it appears in some preliminary tests (not shown). Fig. 4. SST biases for CNRM-CM5 and CNRM-CM5+, from left to right. Further to the mean climate, the simulated variability has also been improved with the new version of CNRM-CM. Figure 5 shows the first EOF and the time spectrum of the corresponding principal component of the tropical Pacific SST in DJF, for the observation and both versions of CNRM-CM. The EOF patterns of both simulations are similar to that of the observation, the one of CNRM-CM5+ being the closest. Furthermore, the observation time spectrum is characterised by two local maxima, one around 0.4 (2.5 years) and another one between 0.16 and 0.3 (3.3 and 6.3 years). CNRM-CM5 and CNRM-CM5+ also exhibit a double maximum, but with lower periods (2.4 and 3.3 years) for the former and more proper periods (2.5 and 5 years) for the latter. The PNA response to ENSO has been presented in Fig. 1. The time spectrum of this mode from CNRM-CM5+ is closer to the one of the observation, because of the better similarity obtained by the ENSO mode.
This template is available at: http://www.ecmwf.int/en/computing/access-computing-facilities/forms
01/07/16
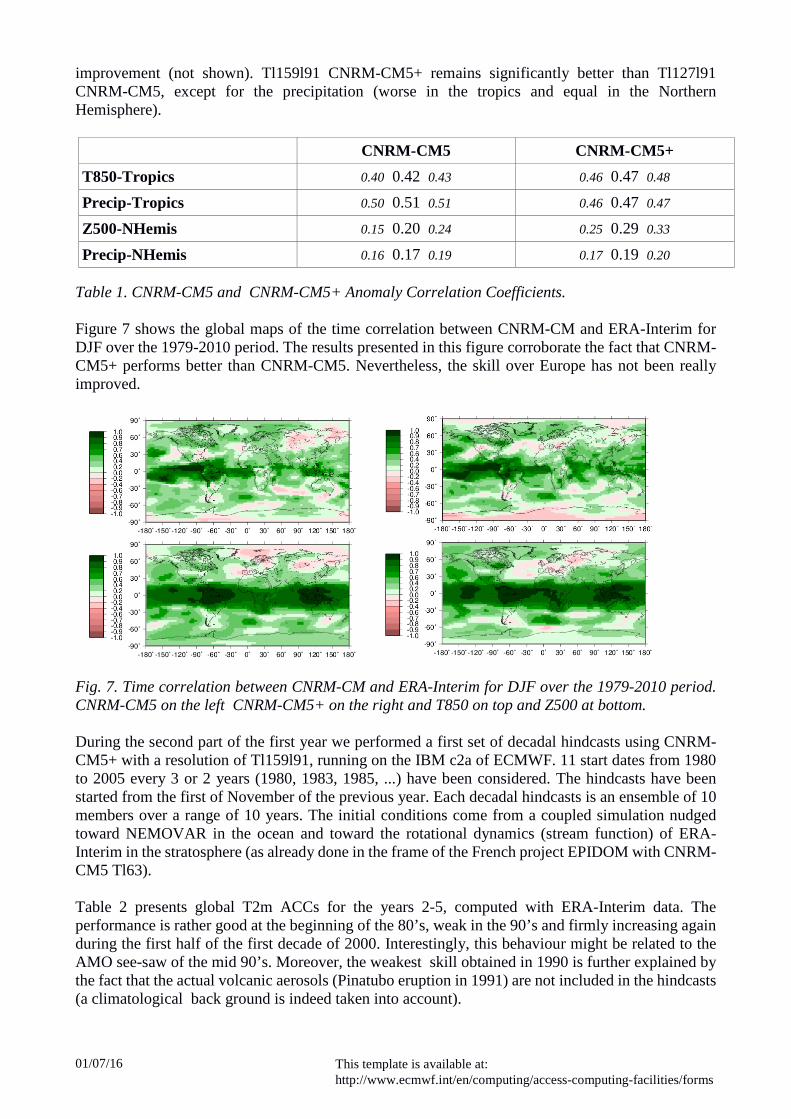
Fig. 5. First EOF and time spectrum of the corresponding principal component of the tropical Pacific SST in DJF, for CNRM-CM5, CNRM-CM5+ and the observation, from left to right. Figure 6 shows the first EOF and the time spectrum of the corresponding principal component of Z500 over the Northern Atlantic in DJF, for the observation and both versions of CNRM-CM. This NAO pattern is reasonably reproduced by the both versions of the model, while being somewhat shifted to the West compared to NCEP reanalysis. In terms of time spectrum, the new version is providing better results with a small spectral peak located around 0.38 (2.6 years) as in the NCEP reanalysis, whereas the old version is producing a large peak at 0.32 (3.1 years). Fig. 6. First EOF and time spectrum of the corresponding principal component of Z500 over the Northern Atlantic in DJF, for CNRM-CM5, CNRM-CM5+ and NCEP reanalysis, from left to right. Beyond the assessment of the model ability to properly simulate the observed climate, the seasonal forecast skill has been evaluated. Ensembles of 15 seasonal hindcasts have been performed over 4 months starting the first of November during a 32 year period (1979 to 2010), using Tl159l91 CNRM-CM5+. DJF skill scores have been computed and compared to those of Tl127l31 CNRM-CM5 (as already reported in the previous section). Table 1 presents ACCs of selected variables (T850, Z500 and Precipitation) over the Tropics and the Northern Hemisphere. A 95 % confidence interval has been calculated selecting randomly 10 hindcasts among the 15 produced. CNRM-CM5+ performs significantly better than CNRM-CM5 except for the tropical precipitation. Hindcasts carried out using Tl127l91 CNRM-CM5 have shown that the score improvement of T850-Trop is mainly due to the physics, while both the vertical resolution and the physics account for the Z500-NH score
This template is available at: http://www.ecmwf.int/en/computing/access-computing-facilities/forms
01/07/16
improvement (not shown). Tl159l91 CNRM-CM5+ remains significantly better than Tl127l91 CNRM-CM5, except for the precipitation (worse in the tropics and equal in the Northern Hemisphere). CNRM-CM5 CNRM-CM5+ T850-Tropics 0.40 0.42 0.43 0.46 0.47 0.48
Precip-Tropics 0.50 0.51 0.51 0.46 0.47 0.47
Z500-NHemis 0.15 0.20 0.24 0.25 0.29 0.33
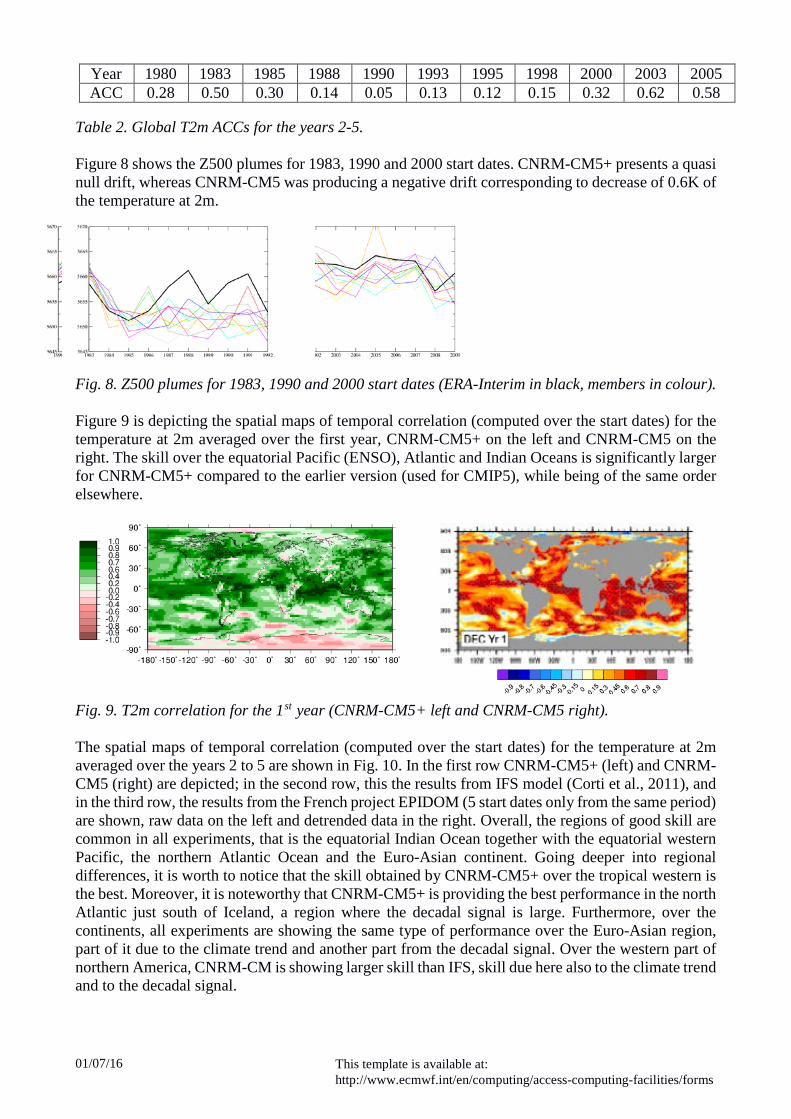
Precip-NHemis 0.16 0.17 0.19 0.17 0.19 0.20 Table 1. CNRM-CM5 and CNRM-CM5+ Anomaly Correlation Coefficients. Figure 7 shows the global maps of the time correlation between CNRM-CM and ERA-Interim for DJF over the 1979-2010 period. The results presented in this figure corroborate the fact that CNRM-CM5+ performs better than CNRM-CM5. Nevertheless, the skill over Europe has not been really improved.
Fig. 7. Time correlation between CNRM-CM and ERA-Interim for DJF over the 1979-2010 period. CNRM-CM5 on the left CNRM-CM5+ on the right and T850 on top and Z500 at bottom. During the second part of the first year we performed a first set of decadal hindcasts using CNRM-CM5+ with a resolution of Tl159l91, running on the IBM c2a of ECMWF. 11 start dates from 1980 to 2005 every 3 or 2 years (1980, 1983, 1985, ...) have been considered. The hindcasts have been started from the first of November of the previous year. Each decadal hindcasts is an ensemble of 10 members over a range of 10 years. The initial conditions come from a coupled simulation nudged toward NEMOVAR in the ocean and toward the rotational dynamics (stream function) of ERA-Interim in the stratosphere (as already done in the frame of the French project EPIDOM with CNRM-CM5 Tl63). Table 2 presents global T2m ACCs for the years 2-5, computed with ERA-Interim data. The performance is rather good at the beginning of the 80’s, weak in the 90’s and firmly increasing again during the first half of the first decade of 2000. Interestingly, this behaviour might be related to the AMO see-saw of the mid 90’s. Moreover, the weakest skill obtained in 1990 is further explained by the fact that the actual volcanic aerosols (Pinatubo eruption in 1991) are not included in the hindcasts (a climatological back ground is indeed taken into account).
This template is available at: http://www.ecmwf.int/en/computing/access-computing-facilities/forms
01/07/16
Year 1980 1983 1985 1988 1990 1993 1995 1998 2000 2003 2005 ACC 0.28 0.50 0.30 0.14 0.05 0.13 0.12 0.15 0.32 0.62 0.58
Table 2. Global T2m ACCs for the years 2-5. Figure 8 shows the Z500 plumes for 1983, 1990 and 2000 start dates. CNRM-CM5+ presents a quasi null drift, whereas CNRM-CM5 was producing a negative drift corresponding to decrease of 0.6K of the temperature at 2m.
Fig. 8. Z500 plumes for 1983, 1990 and 2000 start dates (ERA-Interim in black, members in colour). Figure 9 is depicting the spatial maps of temporal correlation (computed over the start dates) for the temperature at 2m averaged over the first year, CNRM-CM5+ on the left and CNRM-CM5 on the right. The skill over the equatorial Pacific (ENSO), Atlantic and Indian Oceans is significantly larger for CNRM-CM5+ compared to the earlier version (used for CMIP5), while being of the same order elsewhere.
Fig. 9. T2m correlation for the 1P
stP year (CNRM-CM5+ left and CNRM-CM5 right).
The spatial maps of temporal correlation (computed over the start dates) for the temperature at 2m averaged over the years 2 to 5 are shown in Fig. 10. In the first row CNRM-CM5+ (left) and CNRM-CM5 (right) are depicted; in the second row, this the results from IFS model (Corti et al., 2011), and in the third row, the results from the French project EPIDOM (5 start dates only from the same period) are shown, raw data on the left and detrended data in the right. Overall, the regions of good skill are common in all experiments, that is the equatorial Indian Ocean together with the equatorial western Pacific, the northern Atlantic Ocean and the Euro-Asian continent. Going deeper into regional differences, it is worth to notice that the skill obtained by CNRM-CM5+ over the tropical western is the best. Moreover, it is noteworthy that CNRM-CM5+ is providing the best performance in the north Atlantic just south of Iceland, a region where the decadal signal is large. Furthermore, over the continents, all experiments are showing the same type of performance over the Euro-Asian region, part of it due to the climate trend and another part from the decadal signal. Over the western part of northern America, CNRM-CM is showing larger skill than IFS, skill due here also to the climate trend and to the decadal signal.
This template is available at: http://www.ecmwf.int/en/computing/access-computing-facilities/forms
01/07/16
Fig. 10. T2m correlation for the years 2-5: 1P
stP row: CNRM-CM5+ left and CNRM-CM5 right, 2P
ndP
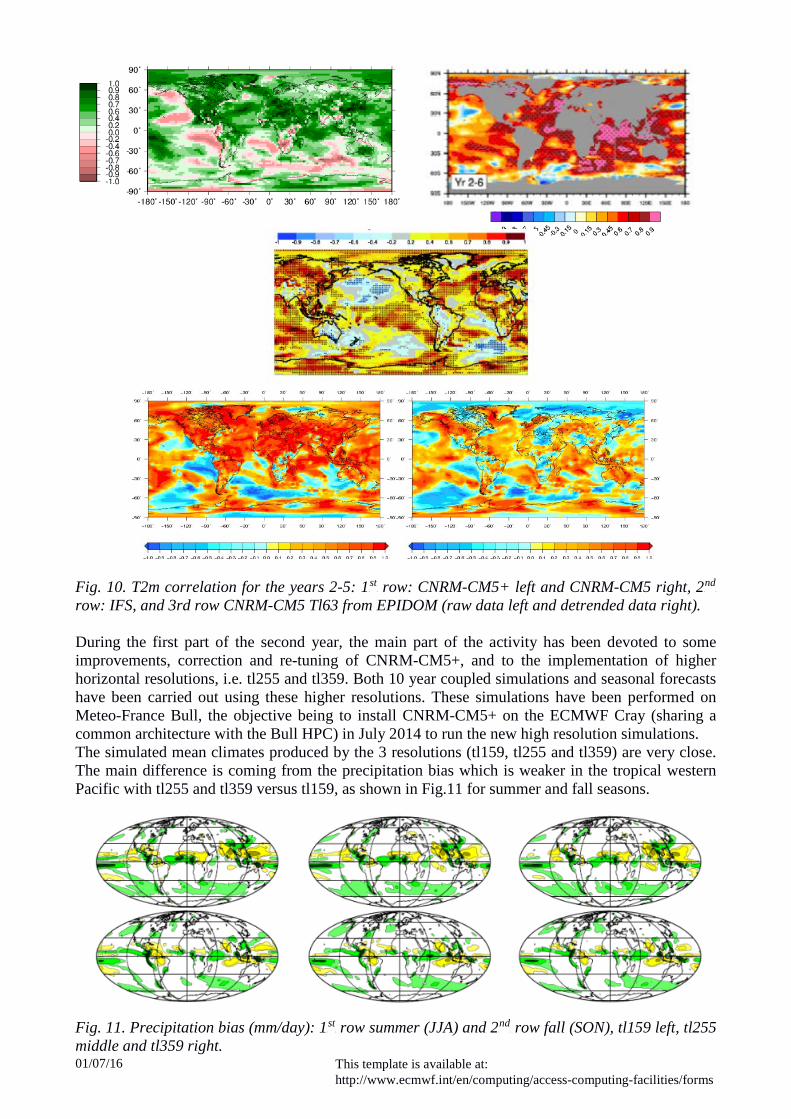
row: IFS, and 3rd row CNRM-CM5 Tl63 from EPIDOM (raw data left and detrended data right). During the first part of the second year, the main part of the activity has been devoted to some improvements, correction and re-tuning of CNRM-CM5+, and to the implementation of higher horizontal resolutions, i.e. tl255 and tl359. Both 10 year coupled simulations and seasonal forecasts have been carried out using these higher resolutions. These simulations have been performed on Meteo-France Bull, the objective being to install CNRM-CM5+ on the ECMWF Cray (sharing a common architecture with the Bull HPC) in July 2014 to run the new high resolution simulations. The simulated mean climates produced by the 3 resolutions (tl159, tl255 and tl359) are very close. The main difference is coming from the precipitation bias which is weaker in the tropical western Pacific with tl255 and tl359 versus tl159, as shown in Fig.11 for summer and fall seasons. Fig. 11. Precipitation bias (mm/day): 1P
stP row summer (JJA) and 2P
ndP row fall (SON), tl159 left, tl255
middle and tl359 right.
This template is available at: http://www.ecmwf.int/en/computing/access-computing-facilities/forms
01/07/16
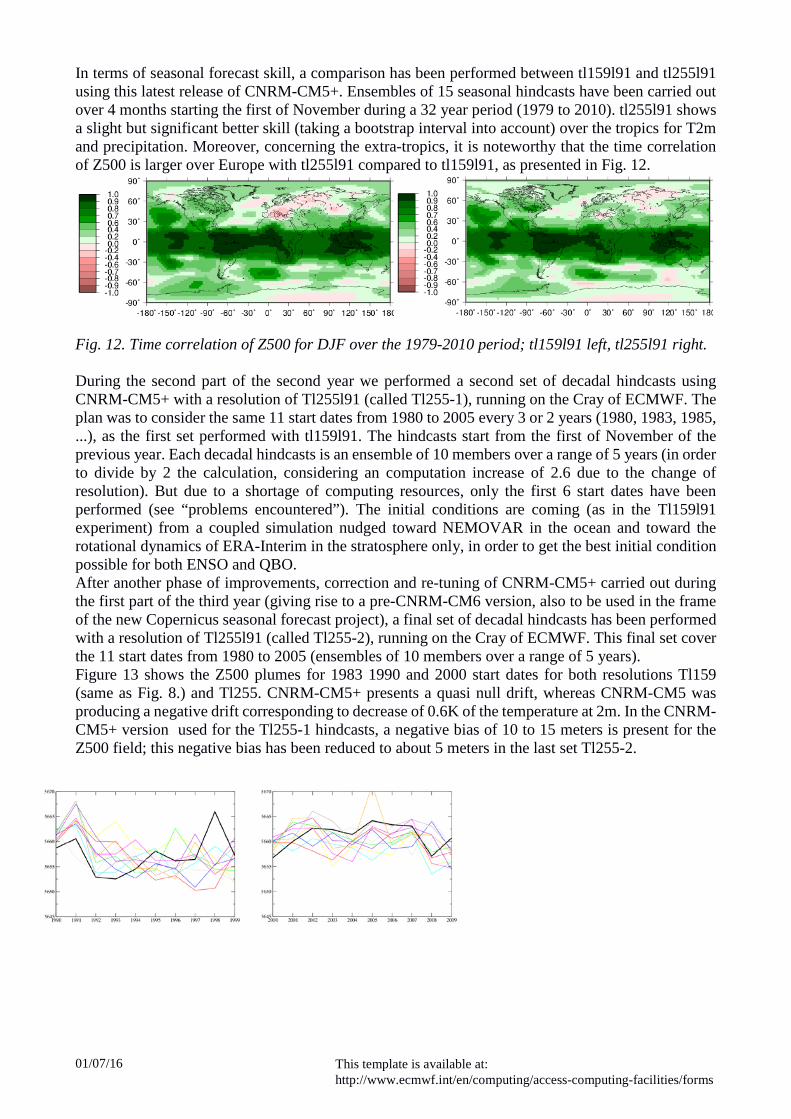
In terms of seasonal forecast skill, a comparison has been performed between tl159l91 and tl255l91 using this latest release of CNRM-CM5+. Ensembles of 15 seasonal hindcasts have been carried out over 4 months starting the first of November during a 32 year period (1979 to 2010). tl255l91 shows a slight but significant better skill (taking a bootstrap interval into account) over the tropics for T2m and precipitation. Moreover, concerning the extra-tropics, it is noteworthy that the time correlation of Z500 is larger over Europe with tl255l91 compared to tl159l91, as presented in Fig. 12.
Fig. 12. Time correlation of Z500 for DJF over the 1979-2010 period; tl159l91 left, tl255l91 right. During the second part of the second year we performed a second set of decadal hindcasts using CNRM-CM5+ with a resolution of Tl255l91 (called Tl255-1), running on the Cray of ECMWF. The plan was to consider the same 11 start dates from 1980 to 2005 every 3 or 2 years (1980, 1983, 1985, ...), as the first set performed with tl159l91. The hindcasts start from the first of November of the previous year. Each decadal hindcasts is an ensemble of 10 members over a range of 5 years (in order to divide by 2 the calculation, considering an computation increase of 2.6 due to the change of resolution). But due to a shortage of computing resources, only the first 6 start dates have been performed (see “problems encountered”). The initial conditions are coming (as in the Tl159l91 experiment) from a coupled simulation nudged toward NEMOVAR in the ocean and toward the rotational dynamics of ERA-Interim in the stratosphere only, in order to get the best initial condition possible for both ENSO and QBO. After another phase of improvements, correction and re-tuning of CNRM-CM5+ carried out during the first part of the third year (giving rise to a pre-CNRM-CM6 version, also to be used in the frame of the new Copernicus seasonal forecast project), a final set of decadal hindcasts has been performed with a resolution of Tl255l91 (called Tl255-2), running on the Cray of ECMWF. This final set cover the 11 start dates from 1980 to 2005 (ensembles of 10 members over a range of 5 years). Figure 13 shows the Z500 plumes for 1983 1990 and 2000 start dates for both resolutions Tl159 (same as Fig. 8.) and Tl255. CNRM-CM5+ presents a quasi null drift, whereas CNRM-CM5 was producing a negative drift corresponding to decrease of 0.6K of the temperature at 2m. In the CNRM-CM5+ version used for the Tl255-1 hindcasts, a negative bias of 10 to 15 meters is present for the Z500 field; this negative bias has been reduced to about 5 meters in the last set Tl255-2.
This template is available at: http://www.ecmwf.int/en/computing/access-computing-facilities/forms
01/07/16
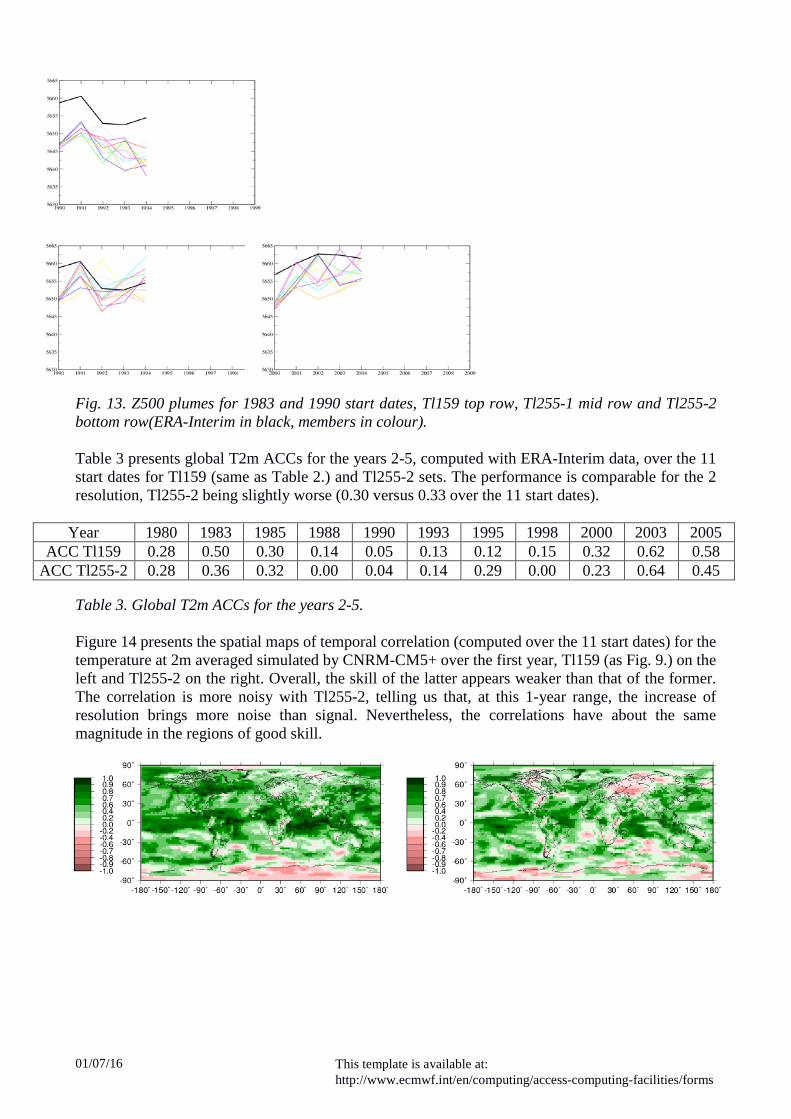
Fig. 13. Z500 plumes for 1983 and 1990 start dates, Tl159 top row, Tl255-1 mid row and Tl255-2 bottom row(ERA-Interim in black, members in colour). Table 3 presents global T2m ACCs for the years 2-5, computed with ERA-Interim data, over the 11 start dates for Tl159 (same as Table 2.) and Tl255-2 sets. The performance is comparable for the 2 resolution, Tl255-2 being slightly worse (0.30 versus 0.33 over the 11 start dates).
Year 1980 1983 1985 1988 1990 1993 1995 1998 2000 2003 2005 ACC Tl159 0.28 0.50 0.30 0.14 0.05 0.13 0.12 0.15 0.32 0.62 0.58
ACC Tl255-2 0.28 0.36 0.32 0.00 0.04 0.14 0.29 0.00 0.23 0.64 0.45 Table 3. Global T2m ACCs for the years 2-5. Figure 14 presents the spatial maps of temporal correlation (computed over the 11 start dates) for the temperature at 2m averaged simulated by CNRM-CM5+ over the first year, Tl159 (as Fig. 9.) on the left and Tl255-2 on the right. Overall, the skill of the latter appears weaker than that of the former. The correlation is more noisy with Tl255-2, telling us that, at this 1-year range, the increase of resolution brings more noise than signal. Nevertheless, the correlations have about the same magnitude in the regions of good skill.
This template is available at: http://www.ecmwf.int/en/computing/access-computing-facilities/forms
01/07/16
Fig. 14. T2m correlation for the 1P
stP year: Tl159 left and Tl255-2 right.
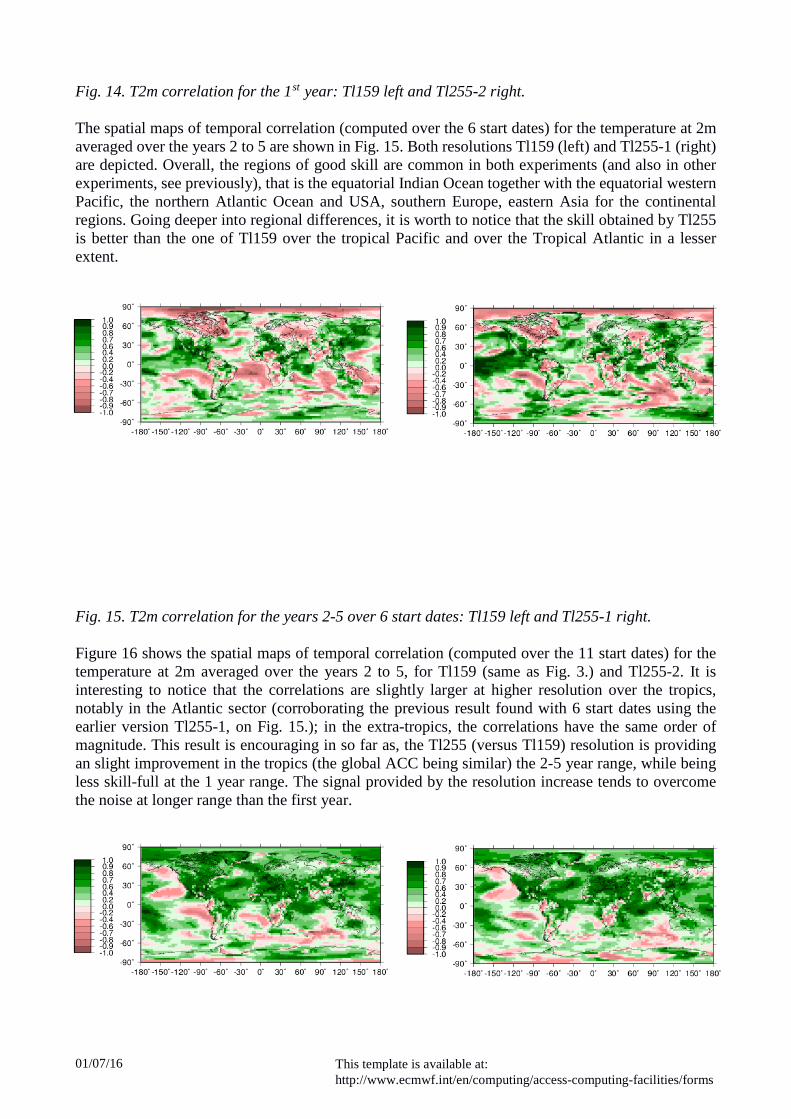
The spatial maps of temporal correlation (computed over the 6 start dates) for the temperature at 2m averaged over the years 2 to 5 are shown in Fig. 15. Both resolutions Tl159 (left) and Tl255-1 (right) are depicted. Overall, the regions of good skill are common in both experiments (and also in other experiments, see previously), that is the equatorial Indian Ocean together with the equatorial western Pacific, the northern Atlantic Ocean and USA, southern Europe, eastern Asia for the continental regions. Going deeper into regional differences, it is worth to notice that the skill obtained by Tl255 is better than the one of Tl159 over the tropical Pacific and over the Tropical Atlantic in a lesser extent.
Fig. 15. T2m correlation for the years 2-5 over 6 start dates: Tl159 left and Tl255-1 right. Figure 16 shows the spatial maps of temporal correlation (computed over the 11 start dates) for the temperature at 2m averaged over the years 2 to 5, for Tl159 (same as Fig. 3.) and Tl255-2. It is interesting to notice that the correlations are slightly larger at higher resolution over the tropics, notably in the Atlantic sector (corroborating the previous result found with 6 start dates using the earlier version Tl255-1, on Fig. 15.); in the extra-tropics, the correlations have the same order of magnitude. This result is encouraging in so far as, the Tl255 (versus Tl159) resolution is providing an slight improvement in the tropics (the global ACC being similar) the 2-5 year range, while being less skill-full at the 1 year range. The signal provided by the resolution increase tends to overcome the noise at longer range than the first year.

This template is available at: http://www.ecmwf.int/en/computing/access-computing-facilities/forms
01/07/16
Fig. 16. T2m correlation for the years 2-5 over 11 start dates: Tl159 left and Tl255-2 right. In order to benefit from a resolution increase in terms of forecast skill, there is a need to take into account a minimum resolution delta, so that the signal can overcome the noise. This result has been found also in seasonal forecasting mode, as shown in Table 4. This Table presents DJF ACC for T2m, precipitation (PREC) and Z500 over the Tropics (IT), Northern Hemisphere (NH) and Southern Hemisphere (SH) for Tl159, Tl255 and Tl359; these ACCs have been computed considering experiments of 30 members over 32 years (1979-2012). One clearly sees a slight drop a skill from Tl159 to Tl255 and the larger skill obtained with Tl359 (resolution chosen for the EU Copernicus seasonal project).
Tl159 Tl255 Tl359
T2m.IT 0.56 0.54 0.56
PREC.IT 0.51 0.51 0.53
Z500.IT 0.69 0.69 0.69
T2m.NH 0.31 0.31 0.32
Z500.NH 0.35 0.32 0.37
T2m.SH 0.33 0.32 0.33
Z500.SH 0.34 0.34 0.36 Table 4. CNRM-CM5+ Anomaly Correlation Coefficients in DJF; 30 members over 1979-2012. USummary: The goal of the special project was to investigate the sensitivity of decadal forecast to physics and atmospheric resolution. Considering the first item, it appears that the new prognostic physics implemented in CNRM-CM5+ (versus the diagnostic one implemented in CNRM-CM5) is providing significant better skill for the first year range, with only slight improvements at larger range. In terms of resolution (with the new physics), Tl255 (versus Tl159) is providing a larger performance over the tropics beyond the first year, while being less skill-full during that first year. It seems that there is a need to take into account a minimum resolution delta, so that the signal can overcome the noise, at short range. This result is illustrated by the skill increase obtained with a Tl359 in seasonal forecast mode.

This template is available at: http://www.ecmwf.int/en/computing/access-computing-facilities/forms
01/07/16
List of publications/reports from the project with complete references
Future plans (Please let us know of any imminent plans regarding a continuation of this research activity, in particular if they are linked to another/new Special Project.)