Embed Size (px)
Citation preview
Specialized Understanding of Mathematics: A Study of Prospective Elementary
Teachers
Meg Moss
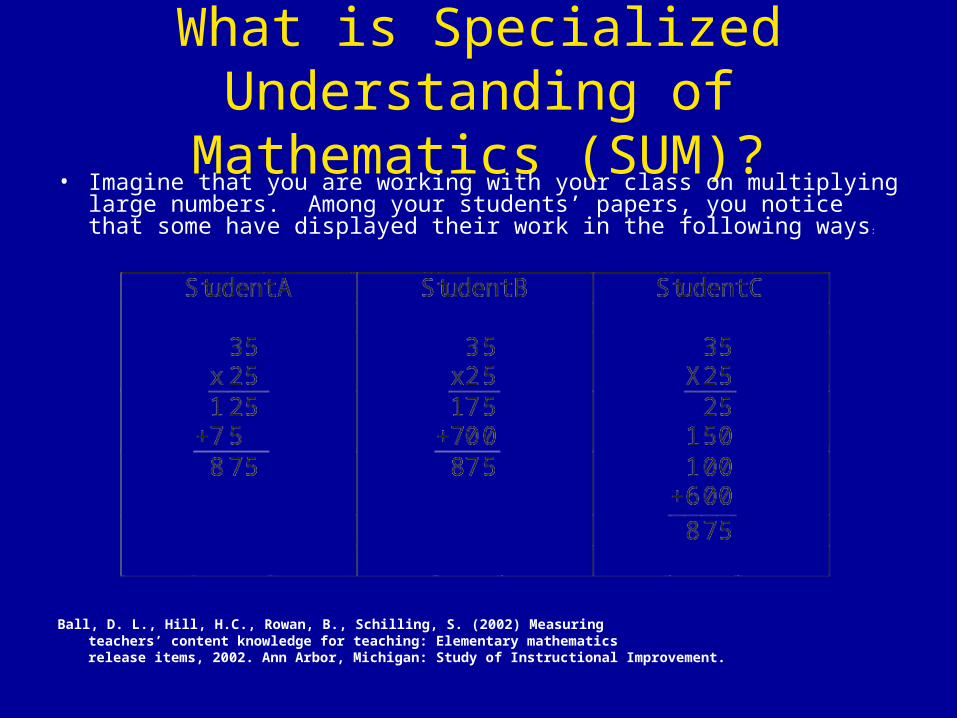
What is Specialized Understanding of Mathematics (SUM)?
• Imagine that you are working with your class on multiplying large numbers. Among your students’ papers, you notice that some have displayed their work in the following ways:
Ball, D. L., Hill, H.C., Rowan, B., Schilling, S. (2002) Measuringteachers’ content knowledge for teaching: Elementary mathematicsrelease items, 2002. Ann Arbor, Michigan: Study of Instructional Improvement.
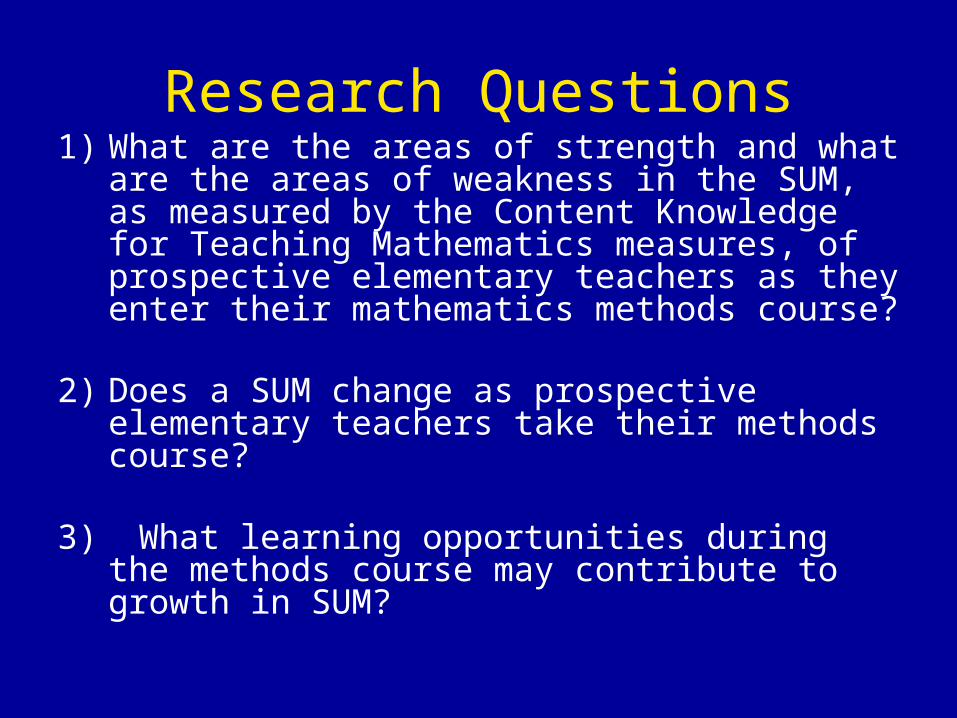
Research Questions1) What are the areas of strength and what are
the areas of weakness in the SUM, as measured by the Content Knowledge for Teaching Mathematics measures, of prospective elementary teachers as they enter their mathematics methods course?
2) Does a SUM change as prospective elementary teachers take their methods course?
3) What learning opportunities during the methods course may contribute to growth in SUM?
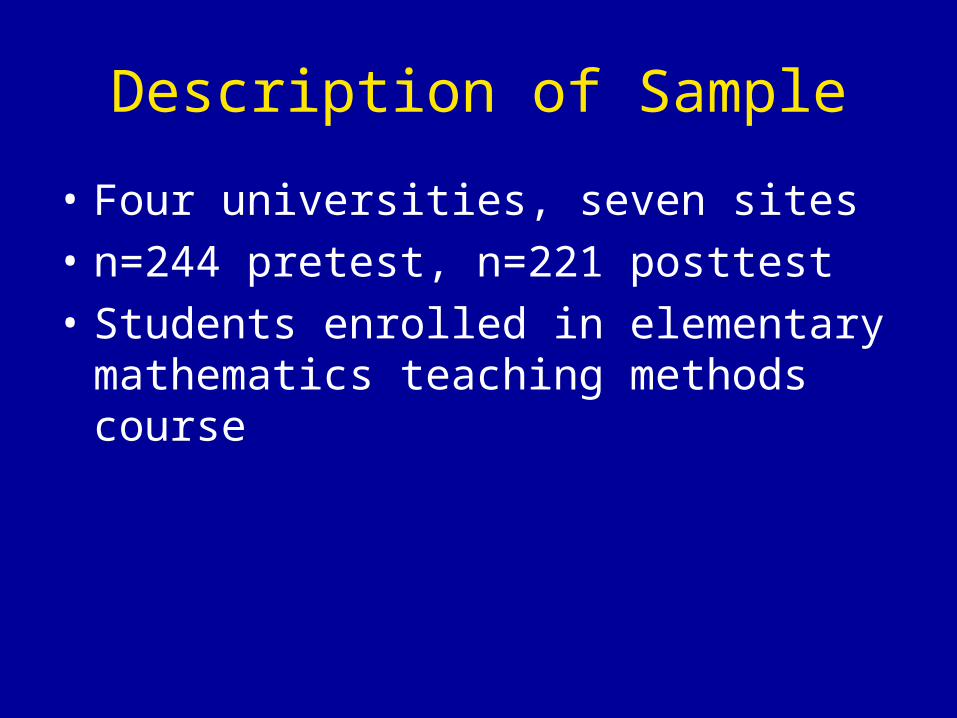
Description of Sample
• Four universities, seven sites
• n=244 pretest, n=221 posttest
• Students enrolled in elementary mathematics teaching methods course
Measures and Variables
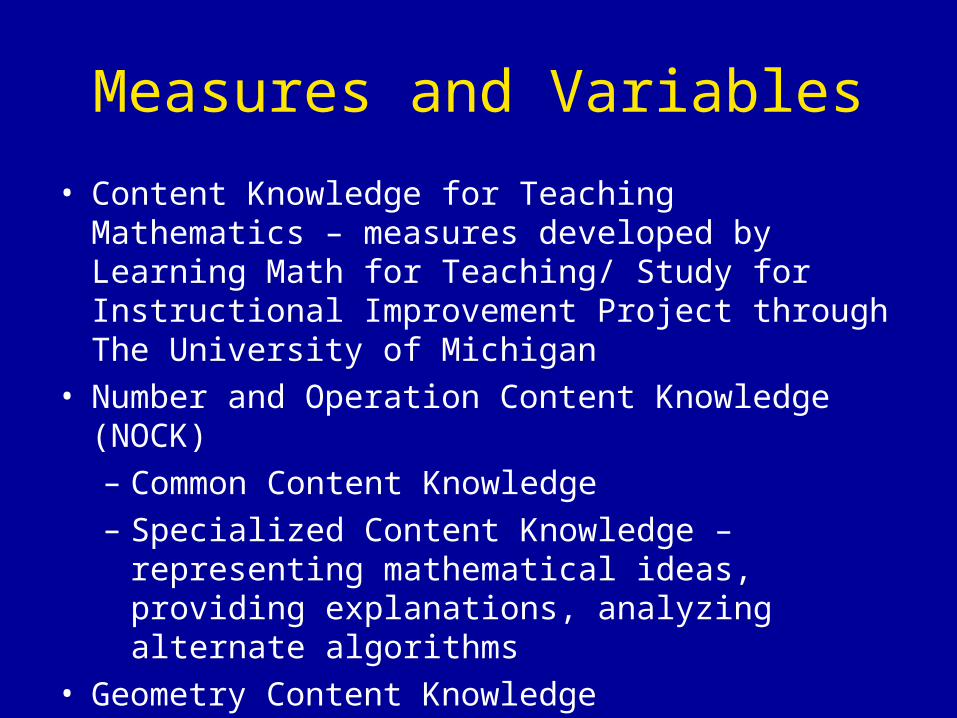
• Content Knowledge for Teaching Mathematics – measures developed by Learning Math for Teaching/ Study for Instructional Improvement Project through The University of Michigan
• Number and Operation Content Knowledge (NOCK)
– Common Content Knowledge
– Specialized Content Knowledge – representing mathematical ideas, providing explanations, analyzing alternate algorithms
• Geometry Content Knowledge
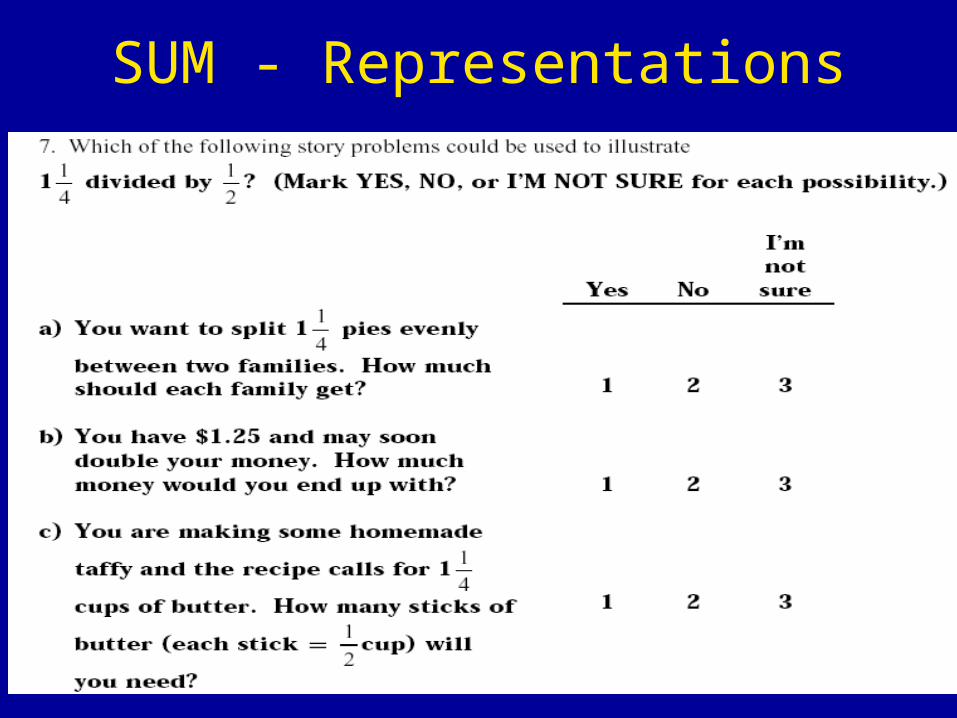
SUM - Representations
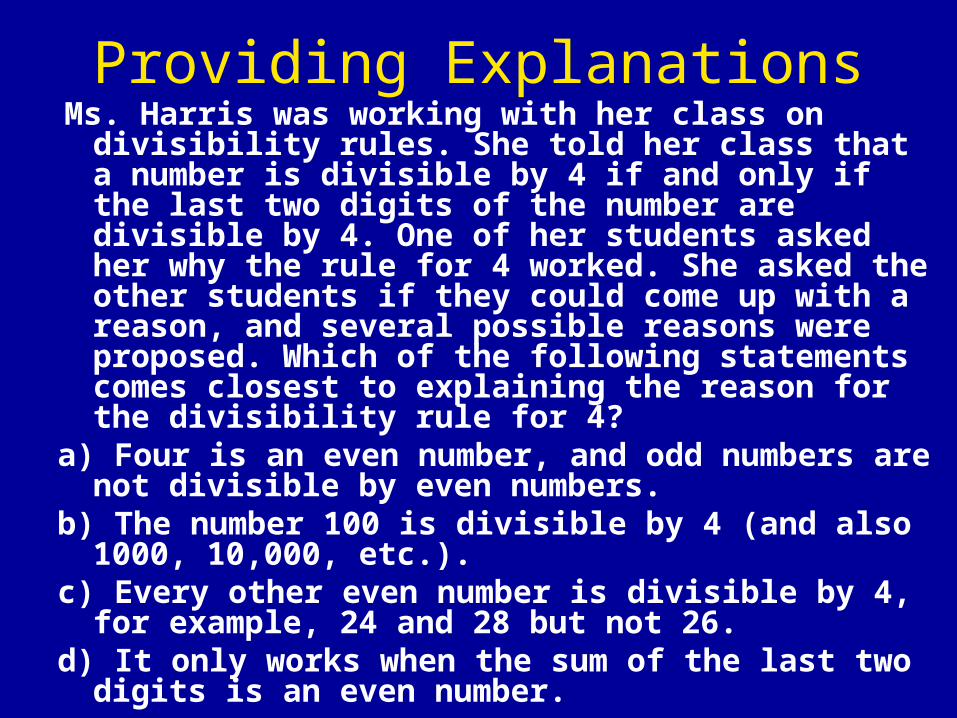
Providing Explanations Ms. Harris was working with her class on divisibility
rules. She told her class that a number is divisible by 4 if and only if the last two digits of the number are divisible by 4. One of her students asked her why the rule for 4 worked. She asked the other students if they could come up with a reason, and several possible reasons were proposed. Which of the following statements comes closest to explaining the reason for the divisibility rule for 4?
a) Four is an even number, and odd numbers are not divisible by even numbers.
b) The number 100 is divisible by 4 (and also 1000, 10,000, etc.).
c) Every other even number is divisible by 4, for example, 24 and 28 but not 26.
d) It only works when the sum of the last two digits is an even number.
Methodology
• Question 1: What are the areas of strength and what are the areas of weakness in the SUM as prospective elementary teachers enter their methods course?– Pretest item analysis– Analysis of relationship between content
courses and content understanding
Methodology
• Question 2: Growth during Methods Course?– Pretest during first two weeks of semester,
posttest during last two weeks of semester– Paired Samples t-test– Item analysis of items that saw growth
Methodology
• Question 3: What learning opportunities in a methods course may help SUM?– Conducted interviews with four methods
instructors who saw significant growth.– Asked about format and general philosophy of
course– Asked about learning opportunities that may
have helped increase mathematical understanding
Data Analysis and Findings
• Question 1: What are the areas of strength and what are the areas of weakness in SUM as prospective elementary teachers enter their methods course?Conducted an item analysis on 11 items with highest number of correct answers and 11 items with lowest number of correct answers
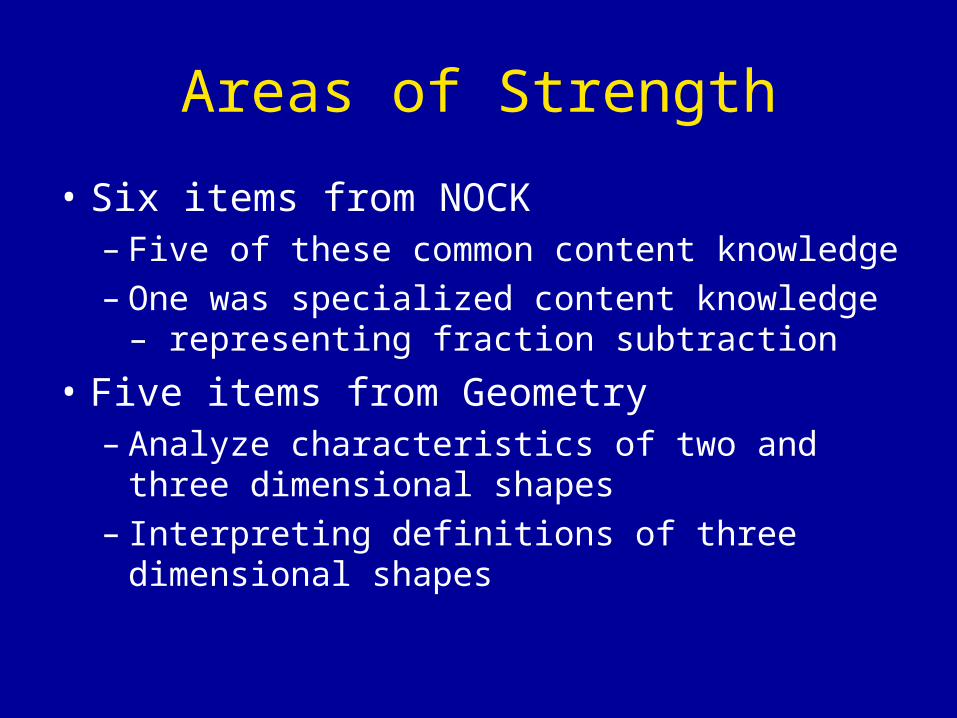
Areas of Strength
• Six items from NOCK– Five of these common content knowledge– One was specialized content knowledge –
representing fraction subtraction
• Five items from Geometry– Analyze characteristics of two and three
dimensional shapes– Interpreting definitions of three dimensional
shapes
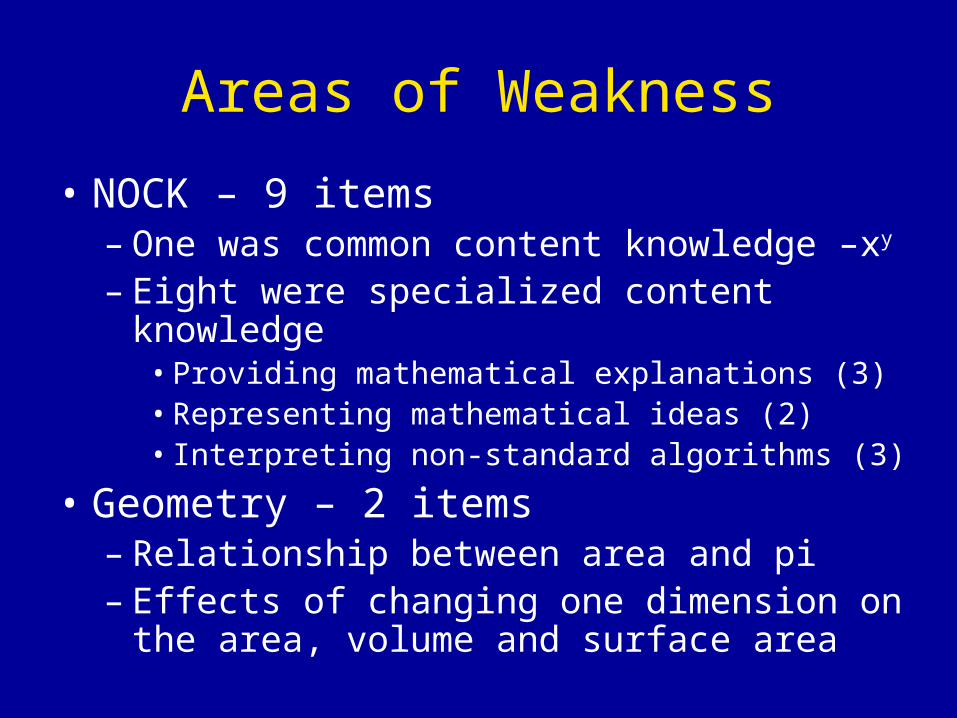
Areas of Weakness
• NOCK – 9 items– One was common content knowledge –xy
– Eight were specialized content knowledge• Providing mathematical explanations (3)• Representing mathematical ideas (2)• Interpreting non-standard algorithms (3)
• Geometry – 2 items– Relationship between area and pi– Effects of changing one dimension on the
area, volume and surface area
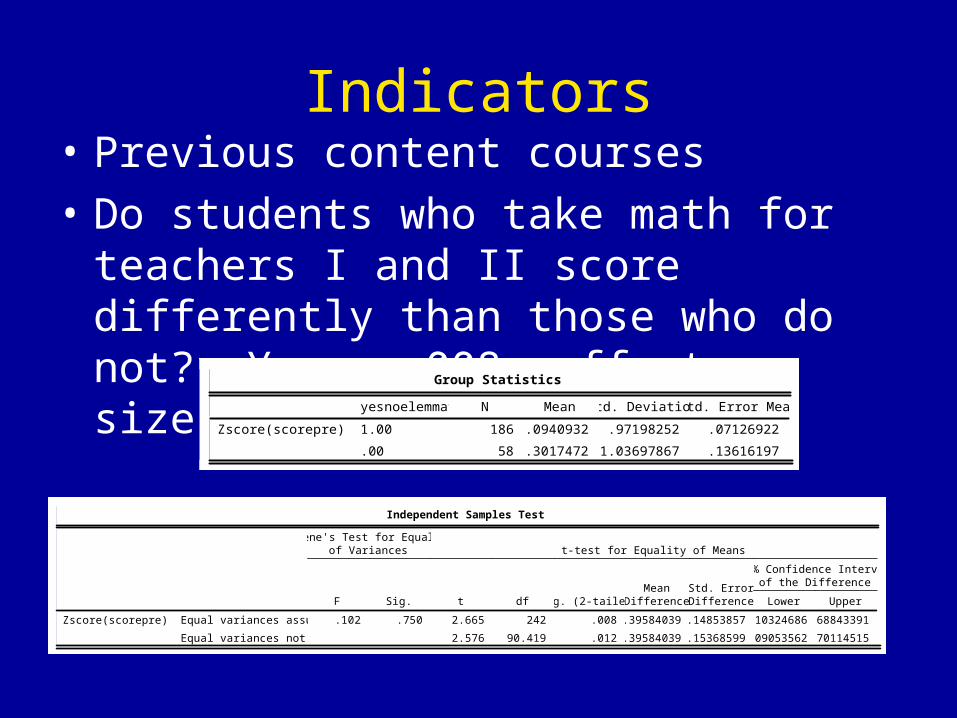
Indicators• Previous content courses
• Do students who take math for teachers I and II score differently than those who do not? Yes p=.008, effect size .40
Group Statistics
186 .0940932 .97198252 .07126922
58 -.3017472 1.03697867 .13616197
yesnoelemmath
1.00
.00
Zscore(scorepre) score1
N Mean Std. Deviation Std. Error Mean
Independent Samples Test
.102 .750 2.665 242 .008 .39584039 .14853857 .10324686 .68843391
2.576 90.419 .012 .39584039 .15368599 .09053562 .70114515
Equal variances assumed
Equal variances not assumed
Zscore(scorepre) score1
F Sig.
Levene's Test for Equalityof Variances
t df Sig. (2-tailed)Mean
DifferenceStd. ErrorDifference Lower Upper
95% Confidence Intervalof the Difference
t-test for Equality of Means
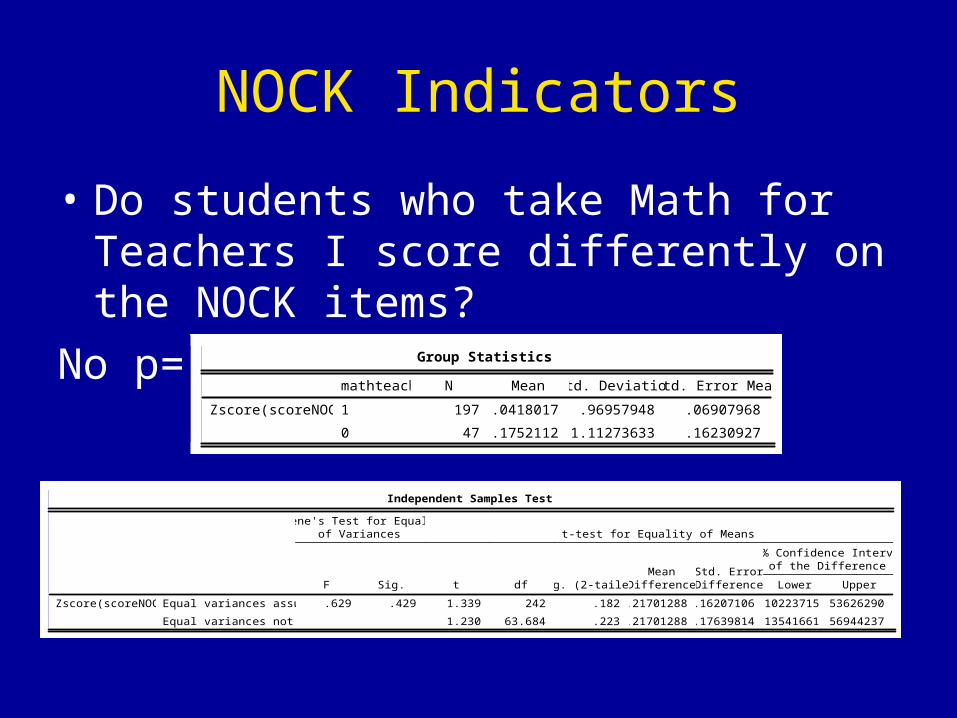
NOCK Indicators
• Do students who take Math for Teachers I score differently on the NOCK items?
No p=.182Group Statistics
197 .0418017 .96957948 .06907968
47 -.1752112 1.11273633 .16230927
mathteachI
1
0
Zscore(scoreNOCK)
N Mean Std. Deviation Std. Error Mean
Independent Samples Test
.629 .429 1.339 242 .182 .21701288 .16207106 -.10223715 .53626290
1.230 63.684 .223 .21701288 .17639814 -.13541661 .56944237
Equal variances assumed
Equal variances not assumed
Zscore(scoreNOCK)
F Sig.
Levene's Test for Equalityof Variances
t df Sig. (2-tailed)Mean
DifferenceStd. ErrorDifference Lower Upper
95% Confidence Intervalof the Difference
t-test for Equality of Means
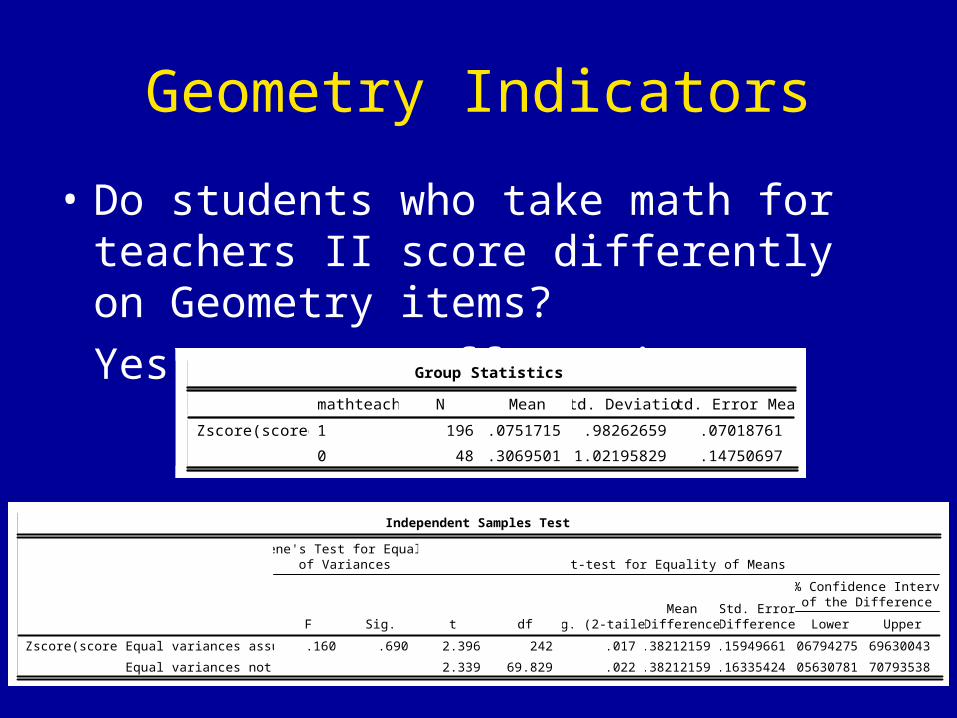
Geometry Indicators
• Do students who take math for teachers II score differently on Geometry items?
Yes, p=.017, effect size .38Group Statistics
196 .0751715 .98262659 .07018761
48 -.3069501 1.02195829 .14750697
mathteachII
1
0
Zscore(scoregeo)
N Mean Std. Deviation Std. Error Mean
Independent Samples Test
.160 .690 2.396 242 .017 .38212159 .15949661 .06794275 .69630043
2.339 69.829 .022 .38212159 .16335424 .05630781 .70793538
Equal variances assumed
Equal variances not assumed
Zscore(scoregeo)
F Sig.
Levene's Test for Equalityof Variances
t df Sig. (2-tailed)Mean
DifferenceStd. ErrorDifference Lower Upper
95% Confidence Intervalof the Difference
t-test for Equality of Means
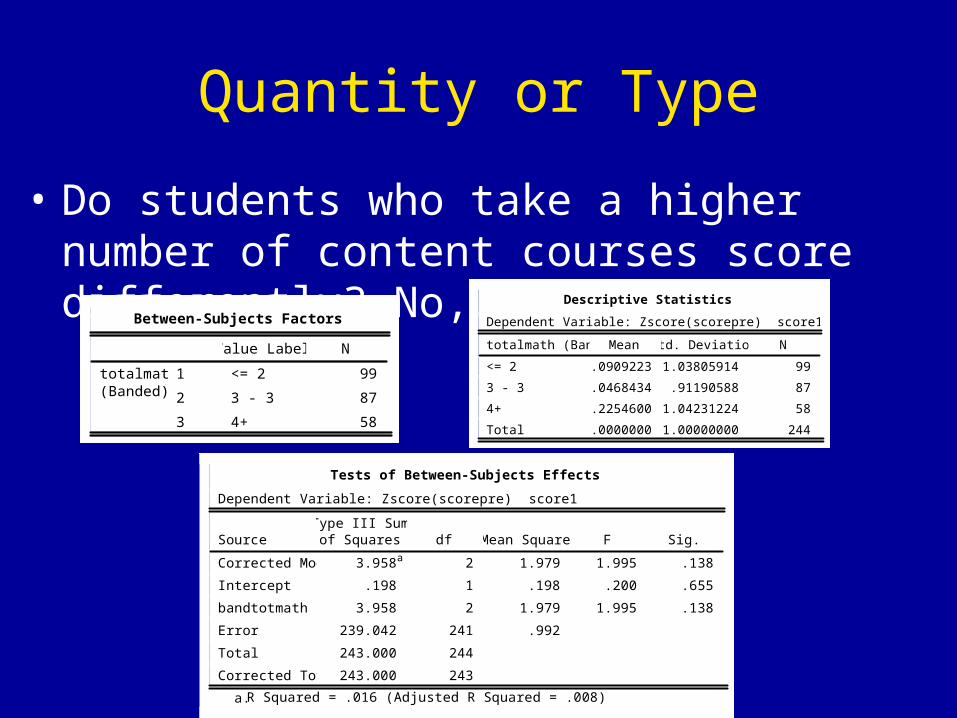
Quantity or Type
• Do students who take a higher number of content courses score differently? No, p=.138
Between-Subjects Factors
<= 2 99
3 - 3 87
4+ 58
1
2
3
totalmath(Banded)
Value Label N
Descriptive Statistics
Dependent Variable: Zscore(scorepre) score1
-.0909223 1.03805914 99
-.0468434 .91190588 87
.2254600 1.04231224 58
.0000000 1.00000000 244
totalmath (Banded)
<= 2
3 - 3
4+
Total
Mean Std. Deviation N
Tests of Between-Subjects Effects
Dependent Variable: Zscore(scorepre) score1
3.958a 2 1.979 1.995 .138
.198 1 .198 .200 .655
3.958 2 1.979 1.995 .138
239.042 241 .992
243.000 244
243.000 243
Source
Corrected Model
Intercept
bandtotmath
Error
Total
Corrected Total
Type III Sumof Squares df Mean Square F Sig.
R Squared = .016 (Adjusted R Squared = .008)a.
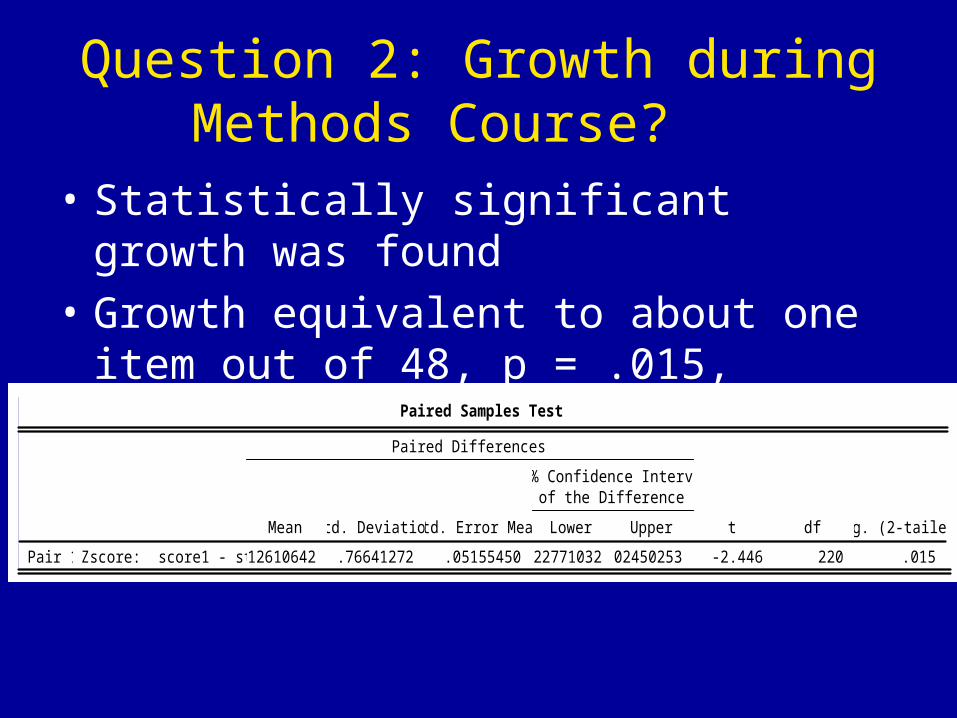
Question 2: Growth during Methods Course?
• Statistically significant growth was found
• Growth equivalent to about one item out of 48, p = .015, effect size = .123
Paired Samples Test
-.12610642 .76641272 .05155450 -.22771032 -.02450253 -2.446 220 .015Zscore: score1 - standzpostPair 1
Mean Std. Deviation Std. Error Mean Lower Upper
95% Confidence Intervalof the Difference
Paired Differences
t df Sig. (2-tailed)
Items with largest growth
• Four of the items that showed the most improvement were from the geometry content area
• Four were from the number and operation content area
• Of the four number and operation items that showed the most improvement, three of those were from the specialized content knowledge domain.
Question 3: What learning opportunities may help SUM?
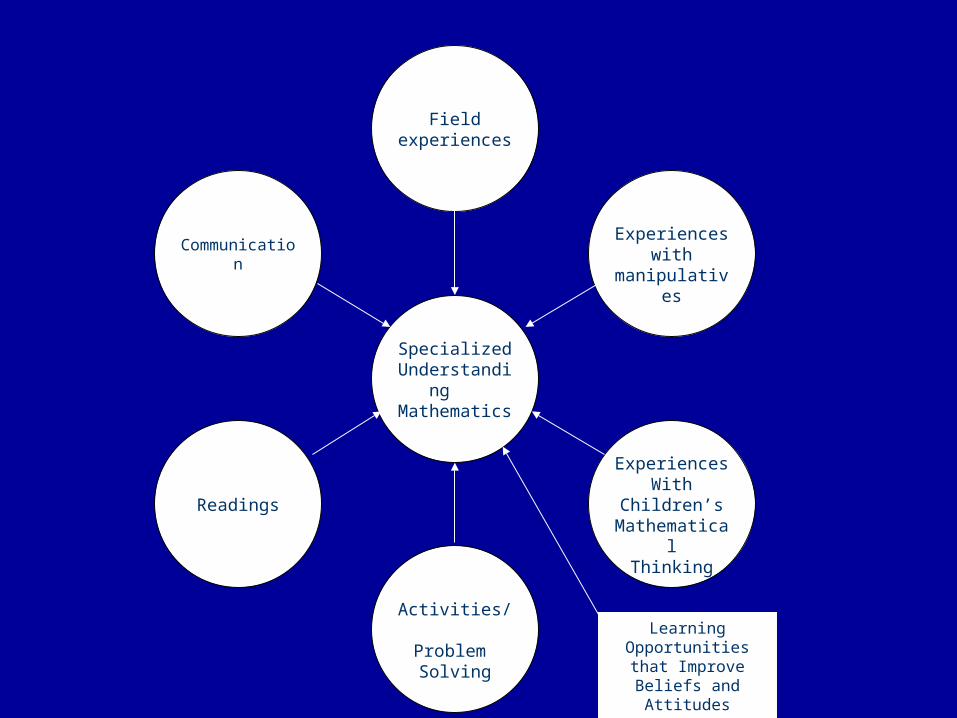
Communication
Readings
Activities/ Problem Solving
ExperiencesWith Children’sMathematical
Thinking
Experiences with
manipulatives
Field experiences
SpecializedUnderstanding Mathematics
Learning Opportunities that
Improve Beliefs and Attitudes
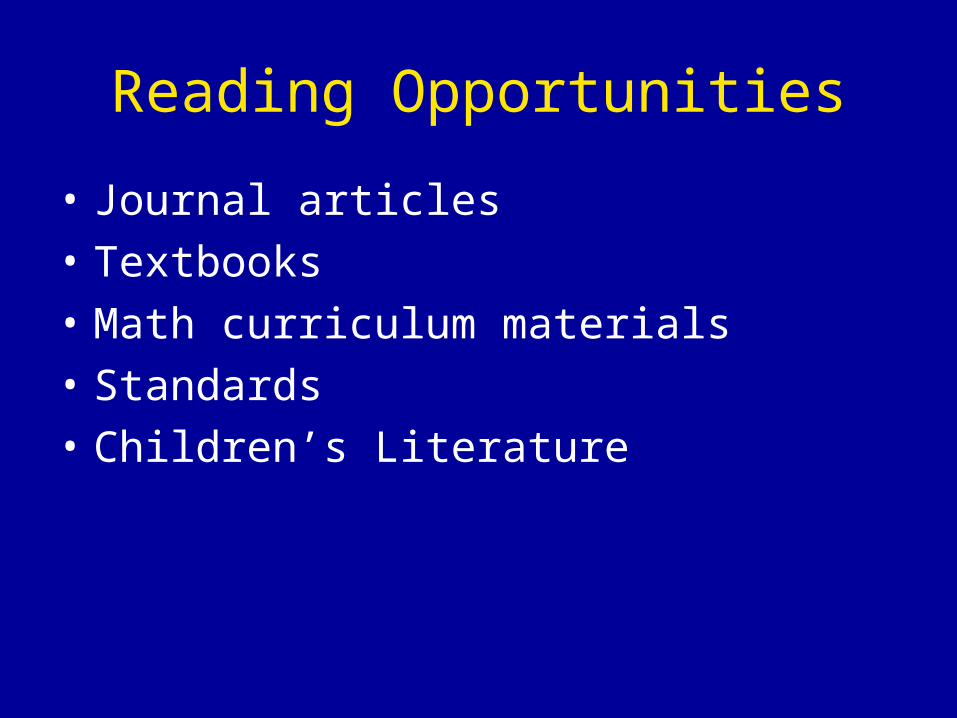
Reading Opportunities
• Journal articles
• Textbooks
• Math curriculum materials
• Standards
• Children’s Literature
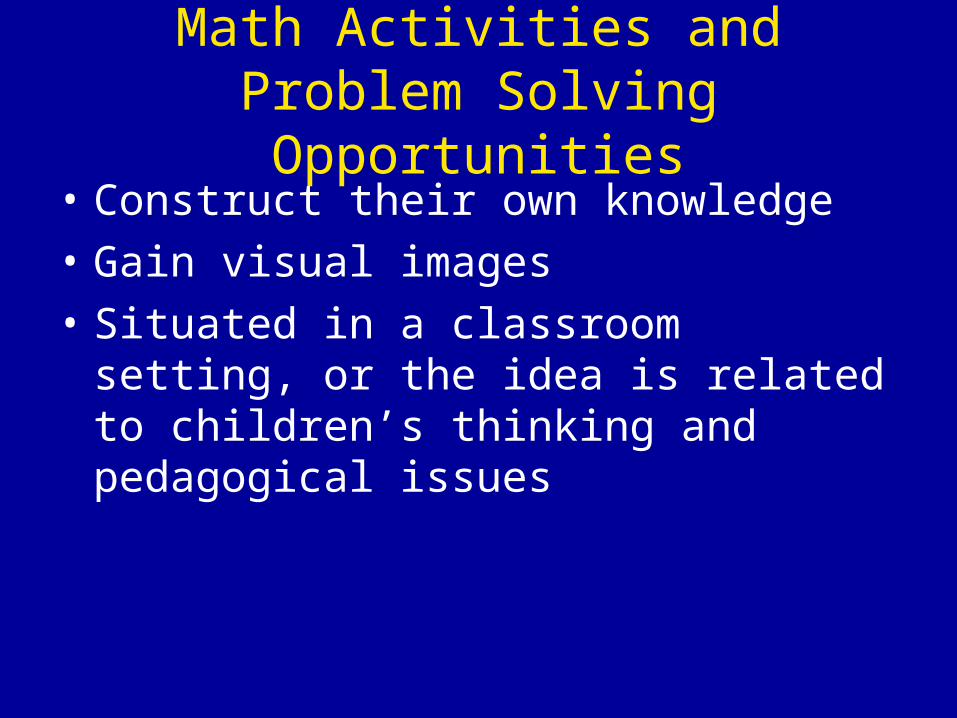
Math Activities and Problem Solving Opportunities
• Construct their own knowledge
• Gain visual images
• Situated in a classroom setting, or the idea is related to children’s thinking and pedagogical issues
Experiencing children’s mathematical thinking opportunities• Video clips of mathematics interviews with
children • Interviews with children
– opportunities to listen to children talk and think about mathematics
– experiences in forming good questions to encourage their thinking and to better understand their thinking
• Field experiences (well designed)• Student work samples analysis
Manipulative Opportunities
• Provide “visual images” of the mathematics• Help prospective teachers to make sense of the
mathematics • One instructor talked about how towards the end
of the semester, the students do not pull the manipulatives off the cart as often as they are able to visualize them. They are still thinking with the visual images of the manipulatives but no longer feel as much of a need to actually use them once they understand the mathematics in that way.
Field Experience Opportunities
• Opportunities to improve SUM along with beliefs and attitudes about mathematics.
• Seeing a topic being taught in elementary classroom can lead to discussions on that topic in methods course
• Opportunities to see the depth of the mathematical thinking that the children are capable of and therefore help the prospective teachers to understand the need to learn mathematics more deeply themselves.
Communication Opportunities
• Using precise language about mathematics.
• Asking appropriate questions
• Listening to mathematical communications
• Providing explanations
Beliefs and Attitudes
• Affective goals are intertwined with content goals in these methods courses
• Improving beliefs and attitudes helps content knowledge, improving content knowledge helps beliefs and attitudes.
• While this study makes no claims about what learning opportunities may improve beliefs and attitudes, this researcher suspects that the six opportunities in this model would be a good theory to be tested.
Special Thanks
• The Appalachian Math and Science Partnership• Dr. P. Mark Taylor, Committee Chair• The Professors and Students who participated in
study
Meg Moss