Embed Size (px)
Citation preview
Allg. Forst- u. J.-Ztg., 182. Jg., 7/8 115
Species Mingling and Diameter Differentiation as Second-Order Characteristics
(With 10 Figures)
ARNE POMMERENING1), ANA CRISTINA GONÇALVES2) and ROQUE RODRÍGUEZ-SOALLEIRO3)
(Received March 2011)
KEY WORDS – SCHLAGWÖRTER
Structural indices; spatial forest structure; expectedmingling; expected diameter differentiation; point processmodels; mark mingling function; mark differentiationfunction; mark variogram index.
Strukturindizes; räumliche Waldstruktur; erwarteteDurchmischung; erwartete Differenzierung; Punktpro-zess-Modelle; Markendurchmischungsfunktion; Marken-differenzierungsfunktion; Markenvariogrammindex.
1. INTRODUCTION
When GADOW (1993) made preliminary suggestions forimproving forest planning methods by including thenearest-neighbour indices mingling and diameter differ-entiation, he unintentionally founded a whole school offorest structure research at Göttingen University thatwould rapidly develop and flourish for more than 20years to come. Many PhD theses and publications docu-mented the milestones of this important and new direc-tion in the boundary region between forest biometrics,silviculture and quantitative ecology (see FÜLDNER, 1995;POMMERENING, 1997; ALBERT, 1999; GADOW et al., 1998;GADOW, 1999; AGUIRRE et al., 2003; HUI et al., 1998; HUI
and GADOW, 2002; POMMERENING, 2002; GADOW et al.,2003; HUI and ALBERT, 2004; STAUPENDAHL and ZUCCHI-NI, 2006).Interestingly, the original idea for both, mingling and
diameter differentiation, stemmed from metal physics,where alloys are apparently described by the spatialneighbourhoods of A and B atoms (GADOW, pers. comm.).This demonstrates the inter-disciplinary nature of foreststructure research which has been continued by many ofKLAUS VON GADOW’s students.
1.1 Species mingling and diameter differentiationand their role in point process statistics
18 years after the first publication it is very clear thatboth nearest-neighbour indices belong to the realm ofpoint process statistics. Usually it is assumed that the two-dimensional
arrangement of tree locations in a forest is a realisation
of a point process. In a point process, the location of eachindividual tree, i, can be understood as a point or event.The observation window, W, is usually a rectangular orcircular area in the forest that is selected to yield repre-sentative information on the forest as a whole.
In the statistical analysis of point patterns it is oftenassumed that the pattern under study belongs to anunderlying point process which is homogeneous (or sta-tionary) and isotropic, i.e. its probability distribution isinvariant to translations and rotations (DIGGLE, 2003;ILLIAN et al., 2008, p. 42 and p. 35ff.). In contrast, inho-mogeneous point processes can have point densities thatvary systematically. Usually patterns are preferred inthe analysis for which the stationarity and isotropyassumptions hold. These markedly simplify the method-ology and allow a focused analysis of interactionsbetween trees.
Based on information from neighbouring trees and thesubject tree itself, an index value is assigned to everytree. In point process statistics, such indices are referredto as marks and they can be qualitative or quantitative.In contrast to natural marks such as tree diameters, treeheights or tree species, which are usually gathered inthe field, species mingling and diameter differentiationare so-called constructed marks. Constructed marksalways require information in addition to that offered bythe subject or reference tree and are usually calculatedretrospectively in the office. The basic principles of con-structing the species mingling and diameter differentia-tion marks, Mi and Ti, respectively, are given in Equa-tions 1 and 2 (GADOW, 1993).
(1)
(2)
i denotes the reference tree and n(i) the nearest neigh-bour of tree i. 1 (A) = 1 if A, the statement in brackets, istrue, otherwise 1 (A) = 0. DBHi and DBHn(i) are thebreast height diameters of the reference tree and of itsnearest neighbour, respectively, and should always belarger than zero. In subsequent work, Mi and Ti wereapplied to varying numbers, k, of three and four neigh-bour trees, e.g.
(FÜLDNER, 1995; AGUIRRE et al., 2003; CRECENTE-CAMPO
et al., 2009). n(i, l) denotes the lth nearest neighbour of
1) Corresponding address: Bern University of Applied Sciences,Swiss College of Agriculture SHL, Länggasse 85, CH-3052 Zollikofen, Switzerland. E-Mail: [email protected].
2) ICAAM, Universidade de Évora, Departamento de EngenhariaRural, Apartado 94, 7002-554 Évora, Portugal. E-Mail:[email protected].
3) Unidade de Xestion Forestal Sostible, University of Santiago deCompostela, E-27002 Lugo, Spain. E-Mail: [email protected].
116 Allg. Forst- u. J.-Ztg., 182. Jg., 7/8
tree i. Naturally the choice of k nearest neighbours alsodepends on point density and is an adaptive process (seePOMMERENING, 2006).
Means, empirical distributions and histograms ofthese constructed marks offer valuable informationwhich can be interpreted ecologically and silviculturally(GADOW, 1999; AGUIRRE et al., 2003; BRZEZIECKI andBERNADZKI, 2008). They are often referred to as nearestneighbour summary statistics (NNSS).
NNSS are particularly useful in the context of forestinventory with comparatively small, replicated observa-tion windows (HUI and ALBERT, 2004; MOTZ et al., 2010),because they contain too few points to use other, morepowerful statistics. However, NNSS depend on pointdensity and on the point pattern structure. Thereforethe distances between nearest neighbours can vary con-siderably from reference tree to reference tree. Also,NNSS are short-sighted methods because they quantifyonly the relationship between a tree location and its knearest neighbours and ignore what is beyond the near-est neighbours.
1.2 Second-order characteristics
Because of the shortcomings of NNSS, so-called second-order characteristics are preferred when mappeddata from large observation windows are available,which should contain at least 100 points (POMMERENING
and STOYAN, 2006). This is often the case inecological/conservation research and in silviculturalmonitoring. In contrast to NNSS, second-order charac-teristics depend on a distance variable, r, and quantifycorrelations between all pairs of points with a distanceof approximately r between them. This allows them to berelated to specific ecological scales and also, to a certaindegree, to account for long-range point interactions. Atypical example is the pair correlation function, g(r), forpoint pattern data. Several summary characteristicsexist for qualitative marks such as tree species or crownclasses. We will use in this study for example the markconnection function, pij(r), i.e. the conditional probabilitythat two points at distance r have marks i and j providedthat these points represent tree locations in the givenpattern. If additionally information on quantitative treeattributes is available, the mark correlation function,kmm(r), and the mark variogram, �m(r) can be applied. Allthese functions are described in detail in ILLIAN et al.(2008). Second-order characteristics for marked pointpatterns such as kmm(r) and �m(r) use so-called test func-tions, t(m1, m2), to quantify the dissimilarity betweenthe marks, m1 and m2, of pairs of trees (see ILLIAN et al.,2008, p. 342f.). These test functions form indeed thebasis of second-order summary characteristics and arekey to their interpretation. For the mark correlationfunction, a test function often used is t1(m1, m2) = m1 m2,computing the mark product of pairs of points withinter-tree distance r. The mark variogram has the testfunction t2(m1, m2) = 1⁄2 (m1– m2)2.
1.3 Objectives
The objectives of this paper are (1) to show that theprinciples of mark construction and those used for test
functions of second-order characteristics are compatibleand interchangeable by defining mark mingling andmark differentiation as second-order characteristics.When new summary characteristics are introduced, it isgood practice to examine their behaviour by usingknown point processes and documented field data.Therefore we (2) apply the mark mingling and the markdifferentiation functions to Poisson point processes withindependent and dependent marking by species anddiameter marks. Then (3) marked point pattern datafrom two forests, which are well documented in the literature, are used to demonstrate what information thetwo new functions offer in addition to the traditionalmark distributions and to alternative second-order char-acteristics. Finally (4), we discuss the potential role ofthe mark mingling and the mark differentiation func-tions in the context of existing second-order characteris-tics.
2. MATERIALS AND METHODS
2.1 Mingling and differentiation as second-ordercharacteristics
Based on Equations (1) and (2), test functions can easi-ly be developed for a mark mingling, � (r), and a markdifferentiation function, � (r). For mark mingling, thecorresponding test function is simply t3(m1, m2) =1(m1� m2). The test function of the mark differentiationfunction can be written as t4(m1, m2) = 1 – min{m1, m2} /max{m1, m2} (POMMERENING et al., 2000).
The estimation of kmm(r) and �m(r) can include a nor-malisation term (see ILLIAN et al., 2008, p. 346). In thecase of the mark correlation function, the squared mean,µ2, is used for this purpose. The mark variance, �2
µ, isthe normalising factor for the mark variogram, but usu-ally �m(r) is not normalised. Normalisations assumingindependent marking (see section 2.2) are also possiblefor the new mark mingling and mark differentiationfunctions.
According to LEWANDOWSKI and POMMERENING (1997)expected mingling, EM, can be calculated as
(3)
with s, the number of species, p, the number of trees inthe observation window and pi, the number of trees ofspecies i.
Expected mark differentiation is not as straight -forward as expected mark mingling. Using tree diame-ters, DBH, as example marks POMMERENING (1997,p. 18ff.) proposed to sort DBH in ascending order, i.e. i < j fi DBHi ≤ DBHj. As a result we obtain the index setJ of a given forest. Then the auxiliary measure R isdefined as
(4)
Expected mark differentiation, ET, can now be calcu-lated as
Allg. Forst- u. J.-Ztg., 182. Jg., 7/8 117
(5)
Details about the derivation of Equations (3) and (5)can be found in POMMERENING (1997).
In analogy to the estimator of the mark correlationfunction in ILLIAN et al. (2008, p. 354f.) the estimators ofthe mark mingling and the mark differentiation func-tion, � (r) and � (r), are defined in Equations (6) and (7).
(6)
(7)
x1 and x2 are arbitrary points of the point pattern in theobservation window W. kh is the Epanechnikov kernelfunction, A (Wx1�Wx2) is the area of intersection of Wx1and Wx2, see ILLIAN et al. (2008, p. 481f. and p. 188),relating to the translation edge-correction (OHSER andSTO YAN, 1981). The mark mingling and mark differen -tiation functions can also be interpreted as mark corre -lation functions using the test functions t3 and t4 insteadof t1.
In most cases we use a bandwidth h = 4 m. Existingsecond-order characteristics most similar to the markmingling and the mark differentiation functions includethe mark connection function, pij(r), the mark correlationfunction, kmm(r), and the mark variogram, �m(r). Thesecharacteristics served as references in the results, par-ticularly in Figs. 3–6 and 8–9.
We used Monte Carlo simulations to test the spatialindependence of marks. The random superposition (orpopulation independence) test (DIGGLE, 2003, p. 48f.;GOREAUD and PÉLISSIER, 2003; Illian et al., 2008,p. 460ff.) was applied to tree species marks, because inall three example forests at least two tree species occurand it is very likely that there are intraspecific relation-ships. Spatial patterns involving different species are inmost cases the result of different species specific biologi-cal and ecological processes, which just happen to co-exist in the same forest, but otherwise may be more orless independent. To reflect this, in each simulation ran-dom shifts were used, i.e. the pattern of points of onespecies was fixed and the entire pattern of points ofanother species or of several species together was shiftedwithin W (ILLIAN et al., 2008, p. 462). For these partiallyshifted patterns, we calculated � (r) and pij(r) and esti-mated the envelopes marking the acceptance region ofthe independence hypothesis from the maxima and mini-ma of 1000 simulation values for � (r) and pij(r) followingILLIAN et al. (2008, p. 455ff.). Any empirical second-ordercharacteristic, which is not completely inside theseenvelopes, indicates a significant departure from inde-pendent marking. Since we have used probability densi-ty functions, the ranges of the inter-tree distance r,where function graphs happen to be outside the accep-tance region, therefore need to be considered as particu-larly interesting, special cases of tree interactions. In asimilar way we also tested the independence of quantita-tive marks, however, using the random labelling test as
suggested in ILLIAN et al. (2008, p. 467). This involvedreallocating tree diameters to fixed tree locations by ran-dom permutation. For these permutated patterns, wecalculated � (r), k^mm(r) and �m (r) and again estimatedthe envelopes marking the acceptance region of the inde-pendence hypothesis from the maxima and minima of1000 simulation values for these second-order character-istics.
The authors are aware of the fact that cumulativecharacteristics such as Ripley’s K(r) function (RIPLEY,1977) and Besag’s L(r) function (BESAG, 1977) shouldgenerally be preferred in tests and that envelope testsare not always satisfactory (LOOSMORE and FORD, 2006).However, since diagnostic properties were of greaterimportance in this study, we decided to use density dis-tributions and envelope tests. For the calculation of thesecond-order characteristics and the associated tests wewrote our own program code in Pascal. We also devel-oped specific R code (R DEVELOPMENT CORE TEAM, 2011)to calculate mingling and differentiation marks and thecorresponding mark distributions. We used k = 4 nearestneighbour trees for the calculation of species minglingand k = 1 for diameter differentiation. The NN1 edgecorrection (POMMERENING and STOYAN, 2006) was appliedfor estimating the corresponding mark distributions.Also for the NNSS we used the Epanechnikov kernel.Interested readers can obtain the program and scriptcodes from the corresponding author on request.
2.2 Poisson point processes, independent anddependent marking
We simulated homogeneous Poisson processes withintensity � = 0.02 points/m2 1000 times in an observa-tion window of 100 �100 m following the recommenda-tions in ILLIAN et al. (2008, p. 70f.). Dependent markingleads to a correlation between tree locations and speciesand diameter attributes, while independent markingexcludes such a correlation. For independent marking,two species marks, 1 and 2, were randomly assigned toall points in the observation window with equal proba-bility of 0.5. We applied two different methods of depen-dent marking: 1. Following POMMERENING and STOYAN(2006), within a circle of radius r0 = 6 m around eachtree, the number z of other trees was counted. If z > 1the tree was assigned species 2, otherwise it wasassigned species 1. This method leads to a pattern withclusters of similar species. 2. For each tree i, the nearesttree neighbour was assigned to a species different fromthat of tree i, either 1 or 2, depending on the species oftree i. As a result tree species were intimately mixed atshort inter-tree distances.
Marking by tree diameters followed from speciesmarking and we applied the method in POMMERENING
and STOYAN (2006): The diameters assigned to each pointwere sampled from species-specific Weibull functions byusing the inversion method. We took Weibull functionparameters from NAGEL and BIGING (1995) with species 1representing oak (Quercus robur L., Quercus petraea(MATT.) LIEBL.) and species 2 beech (Fagus sylvatica L.)in northwest Germany. The quadratic mean diameterswere 60 cm and 26 cm for species 1 and 2, respectively,
118 Allg. Forst- u. J.-Ztg., 182. Jg., 7/8
and these very different population diameters resultedin markedly different diameter distributions of the twospecies.
2.3 Mapped forest data
To illustrate the information gain provided by themark mingling and the mark differentiation functionswe deliberately used data from two forests, which havealready been published on various occasions. This allows
us to limit the description of the data to a minimum,because many of their characteristics are known fromother publications.
The Białowieza data are from the famous Białowiezaforest in eastern Poland in the border zone betweenPoland and Belorussia. The woodland consists of apedunculate oak (Quercus robur) overstorey interspersedwith Scots pine (Pinus sylvestris L.) and an understoreyof Norway spruce (Picea abies (L.) KARST.), hornbeam
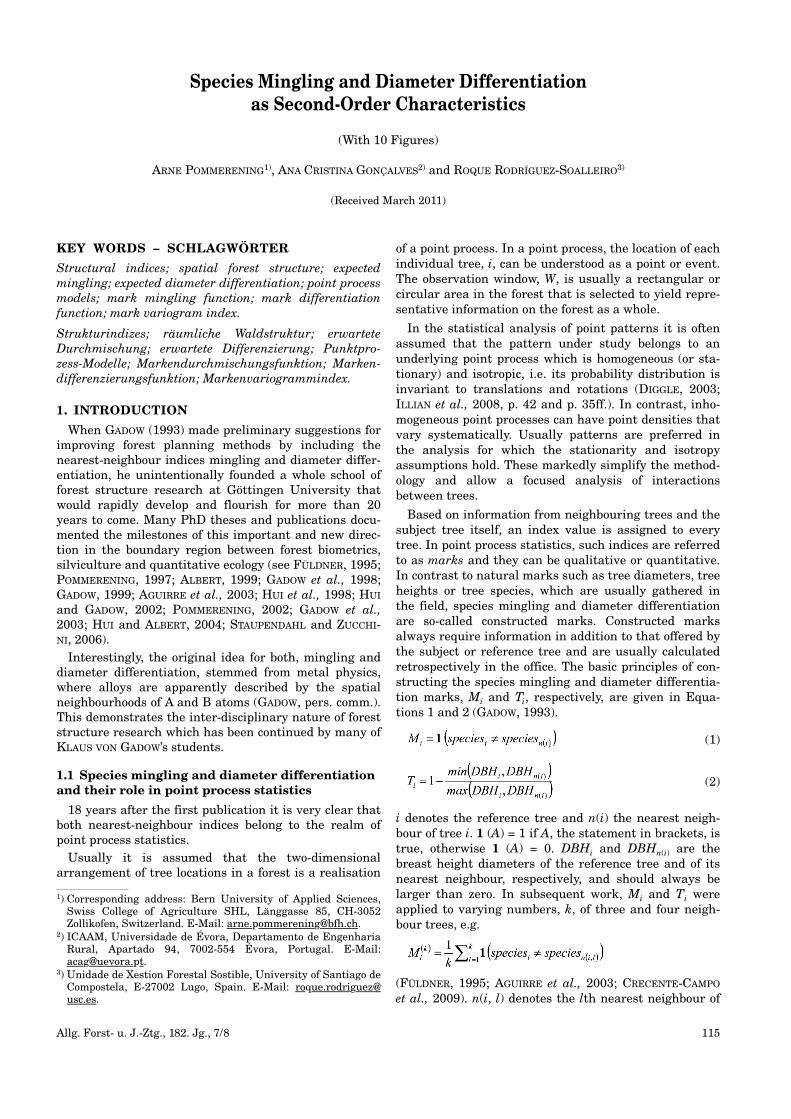
Fig. 1
Marked forest point patterns used in this study. Left: Białowieza with birch (darkgray), oak (gray), hornbeam (black), Scots pine (lightgray) and Norway spruce (white). Right: Manderscheid
(large observation window) with oak (black) and beech (white). Circles representing tree locations were scaled according to tree diameters.
Die in dieser Arbeit verwendeten markierten Wald-Punktmuster. Links: Białowieza mit Birke (dunkelgrau), Eiche (grau), Hainbuche (schwarz),
Waldkiefer (hellgrau) und Fichte (weiß). Rechts: Manderscheid (großes Beobachtungsfenster) mit Eiche (schwarz) und Buche (weiß). Die Kreise repräsen-tieren Baumstandorte und wurden entsprechend der Stammdurchmesser skaliert.
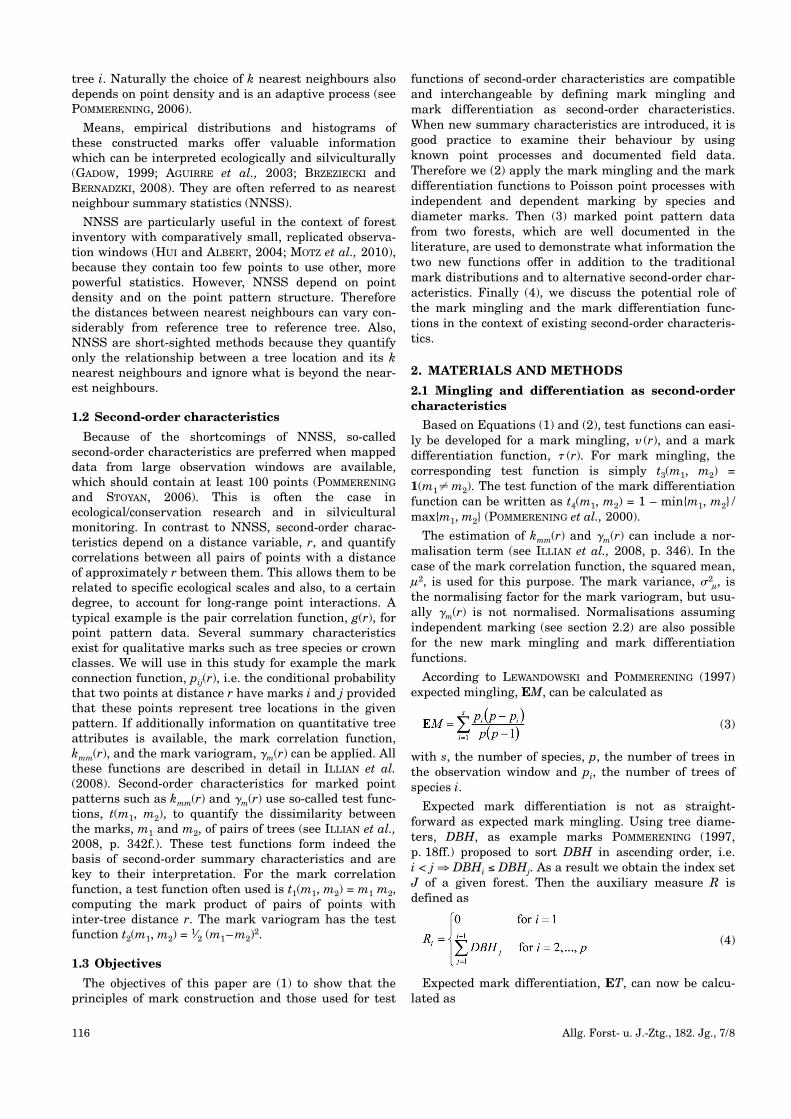
Fig. 2
Mean mark mingling, � (r), (left) and mark differentiation function, � (r),(right) as a result of 1000 simulations of Poisson point processes with indepen-dent (solid line) and dependent marking (dotted lines: aggregation of differenttree characteristics; dashed lines: aggregation of similar tree characteristics).
Mittlere Markendurchmischungs- � (r) (links) und Markendifferenzierungs-funktion � (r) (rechts) als Ergebnis von 1000 Simulationen von Poisson-Punkt-prozessen mit unabhängiger (durchgezogene) und abhängiger Markierung
(gepunktete Linien: Aggregation unterschiedlicher Baummerkmale; unterbrochene Linien: Aggregation ähnlicher Baummerkmale).
Allg. Forst- u. J.-Ztg., 182. Jg., 7/8 119
(Carpinus betulus L.) and silver birch (Betula pendulaROTH). Details on this research site can be found inBRZEZIECKI and DROZDOWSKI (2005), BRZEZIECKI andBERNADZKI (2008) and in POMMERENING and STOYAN(2008). The mapped data of the Białowieza site are illus-trated in Fig. 1 (left).
Additionally we will use two different observation win-dows from a silvicultural monitoring plot situated in theforest district of Manderscheid in the German federalstate Rhineland-Palatinate. The original 1.1 ha monitor-ing plot was surveyed in 1996 and consisted of a 118-year-old oak (Quercus petraea) stand intermingled withbeech (Fagus sylvatica). The Manderscheid data havebeen used before in a number of publications on pointprocess statistics including POMMERENING (2002), POM-MERENING and STOYAN (2006), MECKE and STOYAN (2005)
and ILLIAN et al. (2008, p. 315, 327f., 334, 465f.). Themapped data of the large Manderscheid subwindow areillustrated in Fig. 1 (right). Fig. 1 was prepared with theR spatstat package (BADDELEY and TURNER, 2005).
3. RESULTS
3.2 Poisson point process and independent marking
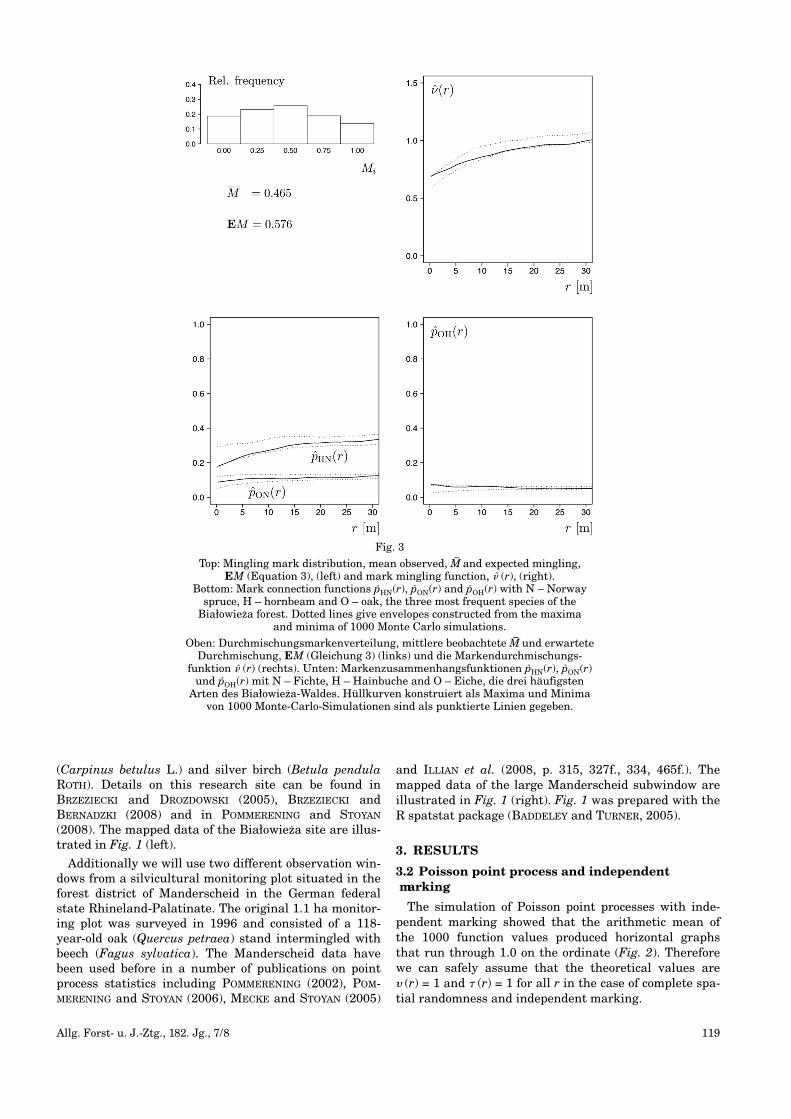
The simulation of Poisson point processes with inde-pendent marking showed that the arithmetic mean ofthe 1000 function values produced horizontal graphsthat run through 1.0 on the ordinate (Fig. 2). Thereforewe can safely assume that the theoretical values are� (r) = 1 and � (r) = 1 for all r in the case of complete spa-tial randomness and independent marking.
Fig. 3
Top: Mingling mark distribution, mean observed, M–and expected mingling,
EM (Equation 3), (left) and mark mingling function, � (r), (right). Bottom: Mark connection functions pHN(r), pON(r) and pOH(r) with N – Norwayspruce, H – hornbeam and O – oak, the three most frequent species of the Białowieza forest. Dotted lines give envelopes constructed from the maxima
and minima of 1000 Monte Carlo simulations.
Oben: Durchmischungsmarkenverteilung, mittlere beobachtete M–und erwartete
Durchmischung, EM (Gleichung 3) (links) und die Markendurchmischungs -funktion � (r) (rechts). Unten: Markenzusammenhangsfunktionen pHN(r), pON(r)und pOH(r) mit N – Fichte, H – Hainbuche and O – Eiche, die drei häufigsten
Arten des Białowieza-Waldes. Hüllkurven konstruiert als Maxima und Minimavon 1000 Monte-Carlo-Simulationen sind als punktierte Linien gegeben.
120 Allg. Forst- u. J.-Ztg., 182. Jg., 7/8
The first method of dependent marking involving clus-ters of trees with the same species and similar diameters(see section 2.2) indeed leads to an aggregation of simi-lar species and diameters (dashed lines in Fig. 2). Thesecond method, marking trees and their nearest neigh-bours with different marks, obviously results in anaggregation of different species and diameters (dottedlines in Fig. 2).
The dashed curves showing aggregation of similarspecies and tree diameters join the reference line ofindependent marking at r = 12 m which is the correla-tion range. This corresponds to 2r0 (see section 2.2). Thecorrelation range gives the maximum range of spatialcorrelations between tree locations and their associatedmarks. There are no correlations at larger distances.
3.3 Mapped forest data: Białowieza
3.3.1 Species mingling
Visual inspection of Fig. 1 (left) suggests that thespecies in this forest mostly occur in segregated clustersand that therefore mingling is fairly low. The traditionalmingling mark distribution for the Białowieza forest canbe described as a flat bell-shaped distribution (Fig. 3, topleft). The majority of trees have two nearest neighbourswith different species marks. Otherwise the five differ-ent mingling marks occur with comparatively even fre-quencies. The mean observed mingling mark is 0.465,i.e. lower than the expected value of 0.576 calculated byusing Equation (3). The ratio M–/EM is 0.807, i.e. thelowest of all three example data sets investigated in thisstudy.
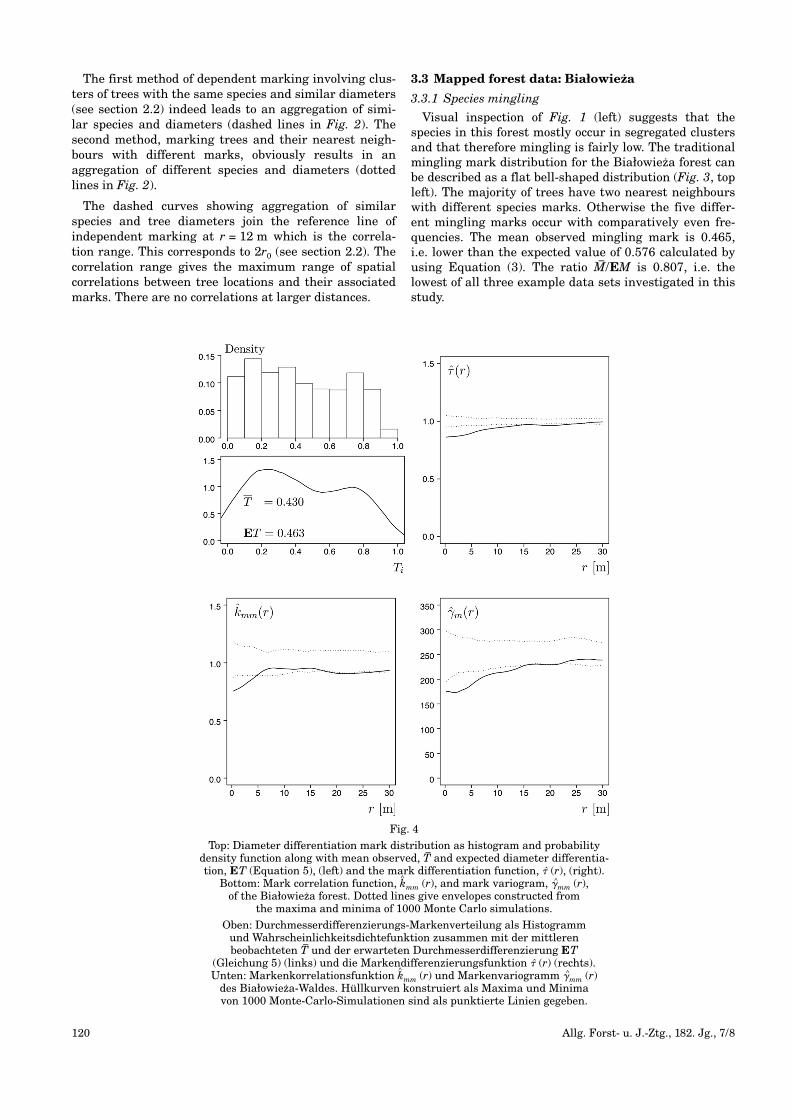
Fig. 4
Top: Diameter differentiation mark distribution as histogram and probabilitydensity function along with mean observed, T
–and expected diameter differentia-
tion, ET (Equation 5), (left) and the mark differentiation function, � (r), (right).Bottom: Mark correlation function, k
^mm (r), and mark variogram, �^mm (r),
of the Białowieza forest. Dotted lines give envelopes constructed from the maxima and minima of 1000 Monte Carlo simulations.
Oben: Durchmesserdifferenzierungs-Markenverteilung als Histogramm und Wahrscheinlichkeitsdichtefunktion zusammen mit der mittleren beobachteten T
–und der erwarteten Durchmesserdifferenzierung ET
(Gleichung 5) (links) und die Markendifferenzierungsfunktion � (r) (rechts).Unten: Markenkorrelationsfunktion k
^mm (r) und Markenvariogramm �^mm (r)
des Białowieza-Waldes. Hüllkurven konstruiert als Maxima und Minima von 1000 Monte-Carlo-Simulationen sind als punktierte Linien gegeben.
Allg. Forst- u. J.-Ztg., 182. Jg., 7/8 121
The shape of the mark mingling function, � (r), (Fig. 3,top right) reflects the ratio between mean mingling andexpected mingling: Particularly at small inter-tree dis-tances r there are less pairs of trees with differentspecies marks than are expected from patterns withindependent marking. This effect lasts for approximately18 m. The random superposition test confirms that thelow values of � (r) at short inter-tree distances r in theBiałowieza forest are indeed significant. This finding isalso supported by an experiment aiming at reconstruct-ing Białowieza forest (POMMERENING and STOYAN, 2008):Also in that study the mingling mark distributionturned out to be hard to reconstruct correctly. Thisimplies that the observed spatial distribution of ming -ling marks in this forest is somewhat special. Judging bythe mark connection function (Fig. 3, bottom left), pHN(r),the shape of mark mingling function is mainly influenced by the relationship between hornbeam andNorway spruce. Norway spruce is the most frequentspecies and hornbeam is the 2nd most frequent species inthe Białowieza forest. Apparently oak and Norwayspruce are not correlated, as pON(r) is completely insidethe acceptance region for population independence.Hornbeam and Norway spruce and oak and hornbeam,respectively, are, however, spatially correlated speciesgroups.
3.3.2 Diameter differentiation
A visual inspection of spatial diameter differences ofneighbouring trees (Fig. 1, left) seems to indicate thatthere are clusters of trees with similar stem diametersbut also neighbourhood relationships with fairly largediameter differences. Indeed, the mark distribution, giv-en both as histogram and probability density distribution(Fig. 4, top left), reveals local maxima at Ti=0.2 (low dif-ferentiation) and Ti=0.7 (large differentiation). The
majority of trees have neighbours with similar diame-ters. There are, however, a number of exceptions wherethe diameter differentiation between neighbouring treesis large. Like in the case of species mingling, the meanobserved differentiation value is smaller than the expect-ed diameter differentiation. Also similar to the case ofspecies mingling, the ratio T–/ET is 0.929, i.e. the lowestdifferentiation ratio value of all three example data sets.
The ratio of mean observed and expected differentia-tion mark has to some degree anticipated the shape ofthe mark differentiation function, � (r) (Fig. 4, top right):Up to an inter-tree distance of approximately 15 m pairsof trees have a mark differentiation which is significant-ly smaller than expected. Also the mark correlation func-tion (Fig. 4, bottom left), k^mm(r), is significant andimplies that pairs of trees at close proximity have smalldiameters. The mark variogram (Fig. 4, bottom right),�m (r), shows a significant trend of positive autocorrela-tion, i.e. pairs of trees at close proximity have similardiameters, and a correlation range approximately thesame as the mark differentiation function. All three sec-ond-order characteristics are in agreement, although thecorrelation range of the mark correlation function differsfrom that of the two other second-order functions.
3.4 Mapped forest data: Manderscheid (large observation window)
3.4.1 Species mingling
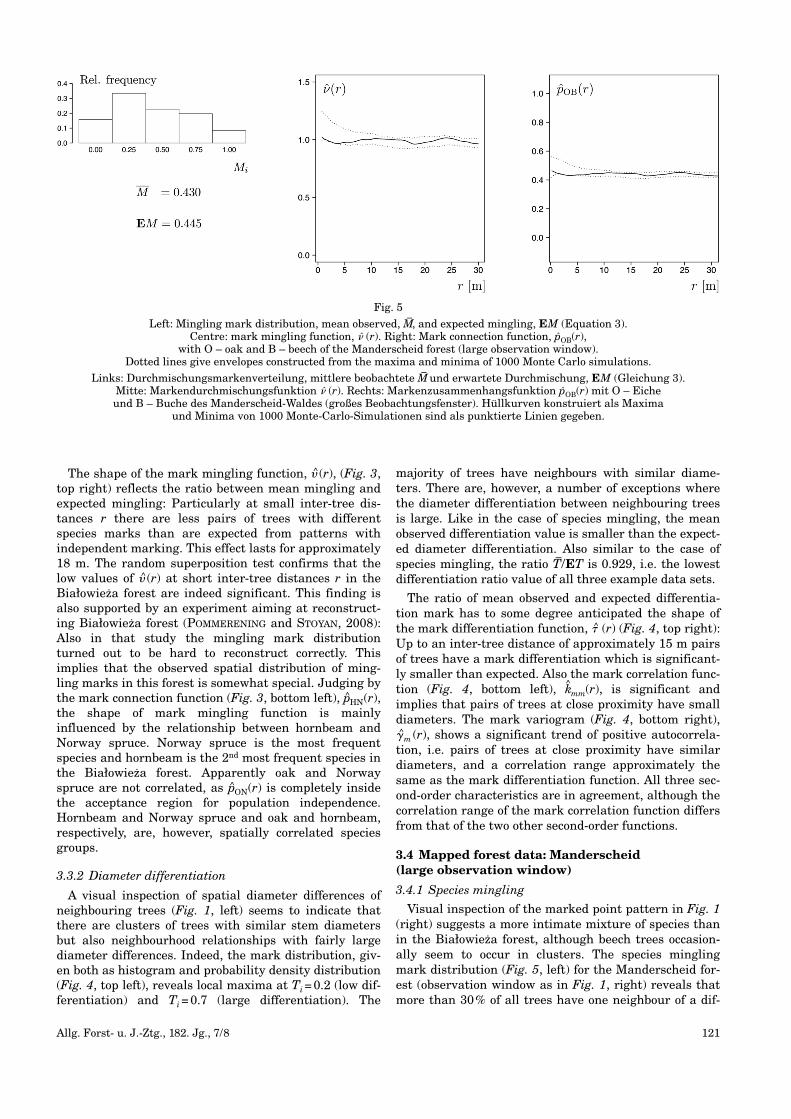
Visual inspection of the marked point pattern in Fig. 1(right) suggests a more intimate mixture of species thanin the Białowieza forest, although beech trees occasion-ally seem to occur in clusters. The species minglingmark distribution (Fig. 5, left) for the Manderscheid for-est (observation window as in Fig. 1, right) reveals thatmore than 30% of all trees have one neighbour of a dif-
Fig. 5
Left: Mingling mark distribution, mean observed, M–, and expected mingling, EM (Equation 3).
Centre: mark mingling function, � (r). Right: Mark connection function, pOB(r), with O – oak and B – beech of the Manderscheid forest (large observation window).
Dotted lines give envelopes constructed from the maxima and minima of 1000 Monte Carlo simulations.
Links: Durchmischungsmarkenverteilung, mittlere beobachtete M–und erwartete Durchmischung, EM (Gleichung 3).
Mitte: Markendurchmischungsfunktion � (r). Rechts: Markenzusammenhangsfunktion pOB(r) mit O – Eiche und B – Buche des Manderscheid-Waldes (großes Beobachtungsfenster). Hüllkurven konstruiert als Maxima
und Minima von 1000 Monte-Carlo-Simulationen sind als punktierte Linien gegeben.
122 Allg. Forst- u. J.-Ztg., 182. Jg., 7/8
ferent species. Approximately 40% have at least 2 neigh-bours with different species. Trees with either four con-specific neighbours or four neighbours with species dif-ferent from that of the subject tree amount to roughly25%. The mark distribution conveys the impression ofcomparatively low species mingling with a wide range ofmarks occurring in the forest. Mean observed minglingis smaller than expected mingling but both values arefairly close. The ratio M–/EM is 0.966 and therefore thereis indeed greater species mingling in this forest than inBiałowieza.The mark mingling function (see Fig. 5, centre), � (r),
of these data shows a shape which almost perfectly indi-
cates independent marking. However, the random super-position test clarifies that there is some weak correlationbetween oak and beech trees in this forest, i.e. there is asignificant departure from the population independencehypothesis. This has also been noted by ILLIAN et al.(2008, p. 315 and 466). A comparison between the markmingling function and the mark connection function(Fig. 5, right), pOB(r), demonstrates the similarity ofthese two characteristics in the case of bivariate pointpatterns. Although the ordinate scale is different, alsopOB(r) in conjunction with the random superposition testconfirms that oak and beech trees are spatially corre -lated.
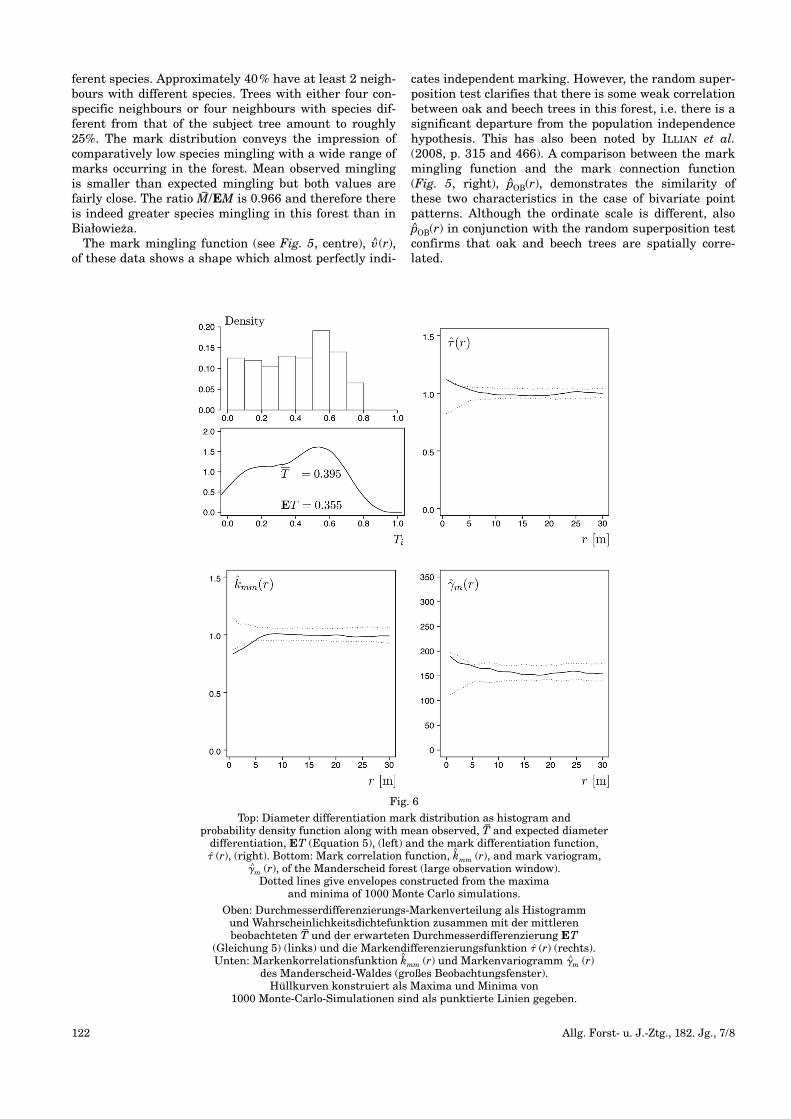
Fig. 6
Top: Diameter differentiation mark distribution as histogram and probability density function along with mean observed, T
–and expected diameter
differentiation, ET (Equation 5), (left) and the mark differentiation function, � (r), (right). Bottom: Mark correlation function, k
^mm (r), and mark variogram,
�^m (r), of the Manderscheid forest (large observation window). Dotted lines give envelopes constructed from the maxima
and minima of 1000 Monte Carlo simulations.
Oben: Durchmesserdifferenzierungs-Markenverteilung als Histogramm und Wahrscheinlichkeitsdichtefunktion zusammen mit der mittleren beobachteten T
–und der erwarteten Durchmesserdifferenzierung ET
(Gleichung 5) (links) und die Markendifferenzierungsfunktion � (r) (rechts).Unten: Markenkorrelationsfunktion k
^mm (r) und Markenvariogramm �^m (r)
des Manderscheid-Waldes (großes Beobachtungsfenster). Hüllkurven konstruiert als Maxima und Minima von
1000 Monte-Carlo-Simulationen sind als punktierte Linien gegeben.
Allg. Forst- u. J.-Ztg., 182. Jg., 7/8 123
3.4.2 Diameter differentiation
The map in Fig. 1 (right) conveys the impression ofpotentially larger diameter differentiation than in theBiałowieza forest, particularly between neighbouringoak and beech trees. The diameter differentiation markdistribution (Fig. 6, top left) shows a marked peak atabout Ti=0.5 in the range of medium to moderate differ-entiation. Otherwise the trees are comparatively evenlydistributed in the interval 0≤Ti≤0.8. The mean observed
differentiation mark is slightly larger than expected andthe ratio T–/ET of 1.113 confirms that diameter differen-tiation is indeed larger than in the Białowieza forest.
The mark differentiation function (Fig. 6, top right),� (r), indicates that diameter differentiation betweenpairs of trees at small distances is significantly largerthan expected, very much in contrast to Białowieza (Fig.4, top right). This effect lasts up to approximately 10 m.k^mm(r) (Fig. 6, bottom left), is also significant in this for-est and again implies that pairs of trees at close proximi-ty have small diameters. Mark variogram (Fig. 6, bottomright), �m (r), and mark differentiation function, howev-er, convey a different impression: They show a trend ofnegative autocorrelation, i.e. pairs of trees at close prox-imity have different diameters. The mark variogram is,how ever, not significant in this case.
3.5 Mapped forest data: Manderscheid (small observation window)
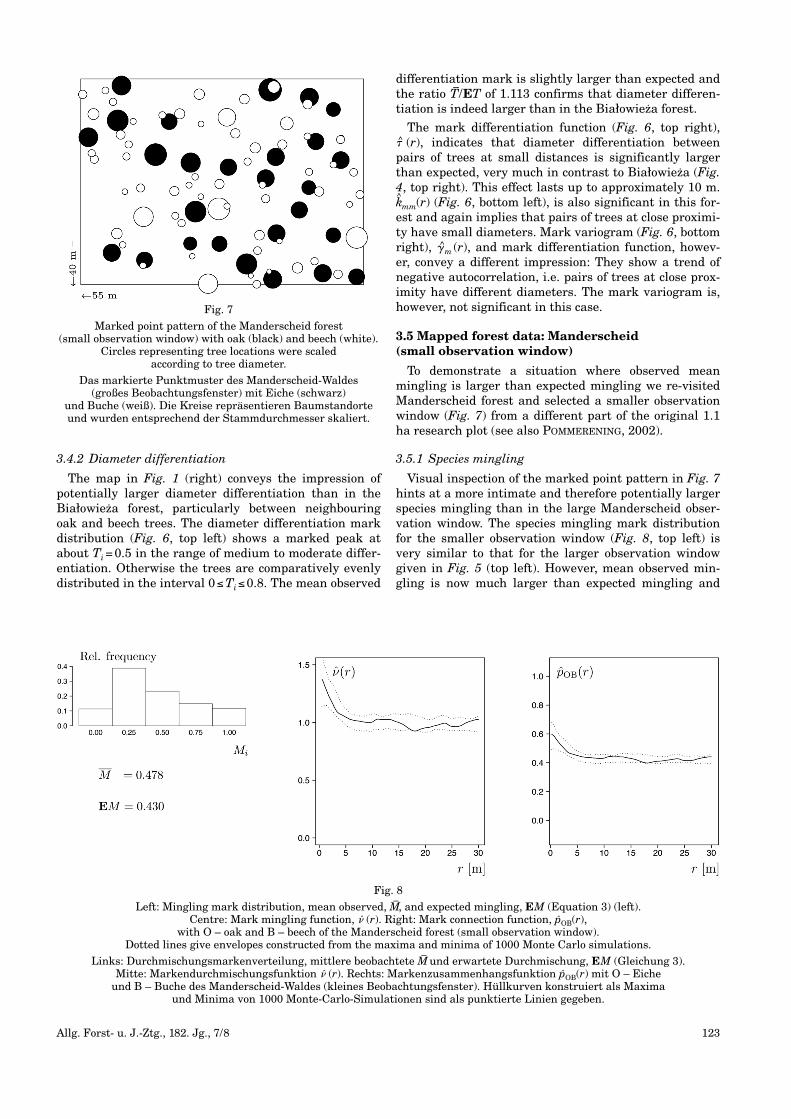
To demonstrate a situation where observed meanming ling is larger than expected mingling we re-visitedManderscheid forest and selected a smaller observationwindow (Fig. 7) from a different part of the original 1.1ha research plot (see also POMMERENING, 2002).
3.5.1 Species mingling
Visual inspection of the marked point pattern in Fig. 7hints at a more intimate and therefore potentially largerspecies mingling than in the large Manderscheid obser-vation window. The species mingling mark distributionfor the smaller observation window (Fig. 8, top left) isvery similar to that for the larger observation windowgiven in Fig. 5 (top left). However, mean observed min-gling is now much larger than expected mingling and
Fig. 7
Marked point pattern of the Manderscheid forest (small observation window) with oak (black) and beech (white).
Circles representing tree locations were scaled according to tree diameter.
Das markierte Punktmuster des Manderscheid-Waldes (großes Beobachtungsfenster) mit Eiche (schwarz)
und Buche (weiß). Die Kreise repräsentieren Baumstandorteund wurden entsprechend der Stammdurchmesser skaliert.
Fig. 8
Left: Mingling mark distribution, mean observed, M–, and expected mingling, EM (Equation 3) (left).
Centre: Mark mingling function, � (r). Right: Mark connection function, pOB(r), with O – oak and B – beech of the Manderscheid forest (small observation window).
Dotted lines give envelopes constructed from the maxima and minima of 1000 Monte Carlo simulations.
Links: Durchmischungsmarkenverteilung, mittlere beobachtete M–und erwartete Durchmischung, EM (Gleichung 3).
Mitte: Markendurchmischungsfunktion � (r). Rechts: Markenzusammenhangsfunktion pOB(r) mit O – Eiche und B – Buche des Manderscheid-Waldes (kleines Beobachtungsfenster). Hüllkurven konstruiert als Maxima
und Minima von 1000 Monte-Carlo-Simulationen sind als punktierte Linien gegeben.
124 Allg. Forst- u. J.-Ztg., 182. Jg., 7/8
the ratio M–/EM is the largest of all data used in thisstudy.
In contrast to the situation in the Białowieza forestand in the large Manderscheid observation window, themark mingling function, � (r), (Fig. 8, centre) for thesmaller observation window reveals that up to a dis-tance of approximately 10 m many more pairs of treeshave different species marks than is expected for thesedata. Again, this trend is significant, i.e. oak and beechtrees are spatially correlated. The shape of the markconnection function (Fig. 8, right), pOB(r), again demon-strates the similarity to the mark mingling function inthe bivariate case, i.e. in the case of only two treespecies, and the results of the random superposition testfor both characteristics are the same.
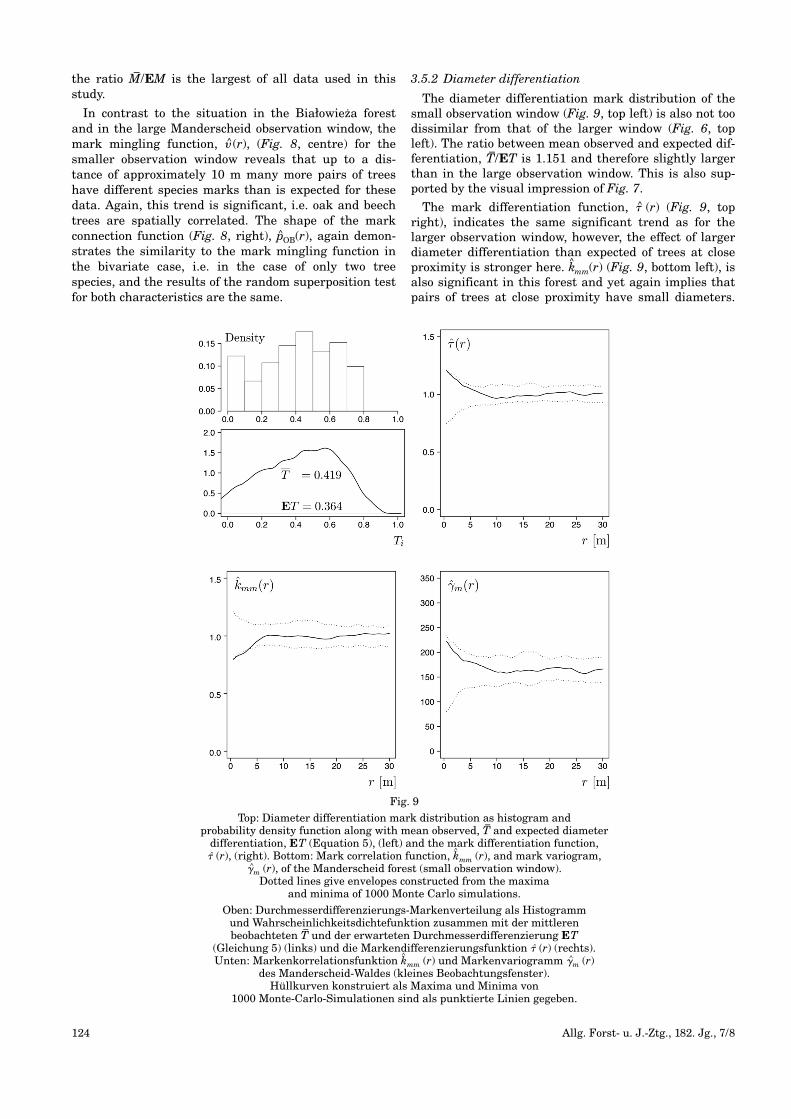
3.5.2 Diameter differentiation
The diameter differentiation mark distribution of thesmall observation window (Fig. 9, top left) is also not toodissimilar from that of the larger window (Fig. 6, topleft). The ratio between mean observed and expected dif-ferentiation, T–/ET is 1.151 and therefore slightly largerthan in the large observation window. This is also sup-ported by the visual impression of Fig. 7.
The mark differentiation function, � (r) (Fig. 9, topright), indicates the same significant trend as for thelarger observation window, however, the effect of largerdiameter differentiation than expected of trees at closeproximity is stronger here. k^mm(r) (Fig. 9, bottom left), isalso significant in this forest and yet again implies thatpairs of trees at close proximity have small diameters.
Fig. 9
Top: Diameter differentiation mark distribution as histogram and probability density function along with mean observed, T
–and expected diameter
differentiation, ET (Equation 5), (left) and the mark differentiation function, � (r), (right). Bottom: Mark correlation function, k
^mm (r), and mark variogram,
�^m (r), of the Manderscheid forest (small observation window). Dotted lines give envelopes constructed from the maxima
and minima of 1000 Monte Carlo simulations.
Oben: Durchmesserdifferenzierungs-Markenverteilung als Histogramm und Wahrscheinlichkeitsdichtefunktion zusammen mit der mittleren beobachteten T
–und der erwarteten Durchmesserdifferenzierung ET
(Gleichung 5) (links) und die Markendifferenzierungsfunktion � (r) (rechts).Unten: Markenkorrelationsfunktion k
^mm (r) und Markenvariogramm �^m (r)
des Manderscheid-Waldes (kleines Beobachtungsfenster). Hüllkurven konstruiert als Maxima und Minima von
1000 Monte-Carlo-Simulationen sind als punktierte Linien gegeben.
Allg. Forst- u. J.-Ztg., 182. Jg., 7/8 125
As with the large Manderscheid observation window,mark variogram (Fig. 9, bottom right), �m (r), and markdifferentiation disagree with this finding and exhibitnegative autocorrelation. In contrast to the mark differ-entiation function, the mark variogram is, however, notsignificant in this case.
4. DISCUSSION AND CONCLUSIONS
The mark mingling and the mark differentiation func-tions have successfully identified a segregation of speciesin the Białowieza forest up to a distance of approximate-ly 18 m and a similarity of tree diameters in roughly thesame range. In this forest, there is a comparatively highdegree of aggregation of similar marks, species anddiameters. This is typical of a forest where differentspecies regenerate and exist in conspecific groups thatreflect specific successional stages. The random superpo-sition and the random labelling tests confirm that thesefindings are significant, i.e. mingling and diameter dif-ferentiation are somewhat special in Białowieza forest.These spatial trends in Białowieza forest are largely theresult of natural processes with only few, moderateinterventions in the main canopy. This type of manage-ment could be termed low impact silviculture and ismainly characterised by natural processes of seed dis-persal and germination. As a result shade tolerantspecies such as hornbeam and Norway spruce haveincreased in recent years on the expense of lightdemanding species like birch, oak and Scots pine.BRZEZIECKI and DROZDOWSKI (2005) consider the current,comparatively high level of tree species diversity as diffi-cult to maintain without more intensive human distur-bances.
In the large Manderscheid observation window, themark mingling function indicates almost perfectly ran-dom distribution of tree species. However, the randomsuperposition test suggests that there is some spatialcorrelation between oak and beech trees. The diameterdifferentiation function conveys the impression of diame-ter differences larger than expected up to 10 m. In thesmall Manderscheid observation window there is astrong trend towards species differences between pairsof trees up to 10 m inter-tree distance. These outcomesemphasize once again that observation windows shouldbe selected with great care and should also be replicatedbecause the structural differences in one and the sameforest can vary considerably even at fairly short dis-tances (LEMAY et al., 2009). The results also illustratethe consequences of silvicultural management in mixedoak-beech forests: More or less single oak trees arenursed in clusters of smaller sized beech trees to preventepicormic growth on oak stems. Any beech treeapproaching the dimension of the nearest oak tree isremoved. This management creates marked point pat-terns with almost independent species marks, since themingling of oak is fairly high and that of beech is com-paratively low.
The three examples of marked point patterns clearlydemonstrate that applying principles of structural indexcalculation to test functions of second-order characteris-tics is possible and that, as a result, the mingling mark
and the mark differentiation functions provide muchmore detailed information than the traditional mark dis-tributions alone. In particular, the analyst learns moreabout the spatial scales and correlation ranges involved.In the case of the Manderscheid forest, where the simplemark distributions are very similar, only the second-order characteristics diagnose the differences in spatialforest structure. In addition the use of expected values(Equations 3 and 5) considerably helps comparingforests with different numbers of species. They also areuseful for normalising the new second-order functions.This facilitates the interpretation of the function graphs.The random superposition and the random labellingtests substantially add to the value of the new second-order characteristics and facilitate the interpretation. Ifaccording to these tests marks are not correlated, it suf-fices to study simply the traditional index distributions.Only if the null hypothesis of mark independence isrejected, it makes sense to employ more sophisticatedtools such as second-order characteristics for analysingmarked point patterns.
It would not be difficult to define cumulative equiva-lents of � (r) and � (r) that could be used more effectivelyin testing, e.g. the mark-weighted L functions L� (r) andL� (r), using the same test functions as for � (r) and � (r).Needless to say that both the mark mingling and themark differentiation function can be applied to any qual-itative and quantitative mark, respectively.
The idea to use concepts of structural indices for defin-ing test functions of second-order characteristics wasalso inspired by SHIMATANI (2001a, 2001b) and SHIMATANI
and KUBOTA (2004). These authors made several sugges-tions for marrying species diversity indices with theframework of second-order characteristics. However,there is still some need to investigate the relationshipbetween mark construction and test functions more sys-tematically.
In the bivariate case like in the Manderscheid forest,the mingling mark function shares obvious similaritieswith the mark connection function, pij(r), if i � j (Figs. 3,5 and 8; ILLIAN et al., 2008, p. 331f.), though the scale ofthe ordinate is different. For refined spatial correlationsbetween selected tree species, the mark connection func-tion should be preferred. Often, particularly in forestswith a great deal of species such as tropical forests, onlya general mingling trend is of interest. In tropicalforests, many tree species occur, but each of them is rep-resented by only a few individuals. This makes an appli-cation of pij(r) difficult, since the function requires a cer-tain amount of points, i.e. tree locations, for eachspecies. This is precisely the situation where the newmingling mark function, � (r), has an important role toplay. With s number of tree species, there are (s2) combi-nations of tree pairs with different species i � j. Two treespecies, as in the case of Manderscheid, lead to only(22)=1 and five tree species, as in the case of Białowieza,already to (52)=10 different mark connection functions.This stresses the advantage of � (r) as a summary char-acteristic in forests with high species diversity.
The mark differentiation function, � (r), was success-fully validated by the mark variogram. Both characteris-
126 Allg. Forst- u. J.-Ztg., 182. Jg., 7/8
tics revealed similar trends in this study. Interestinglythe use of � (r) in Figs. 6 and 9 led to significant resultswhilst the application of �m (r) did not. Clearly, both themark differentiation function and the mark variogramturned out to be superior to the mark correlation func-tion, kmm(r), given the forest data used in this study. Dueto its specific test function the latter was unable to dis-criminate between the different spatial diameter trendsin Białowieza and Manderscheid. For small values oft1(m1, m2) = m1 m2, the test function of the mark correla-tion function, both marks are similarly small whilstlarge values indicate pairs of large marks at distance r.The latter, however, is an almost impossible situationat short distances in forests when tree diameters areused as marks. In contrast to t1, small values oft2(m1, m2)= 1⁄2 (m1 – m2)2 and t4(m1, m2)=1– min{m1, m2} /max{m1, m2} are the result of similar sized m1 and m2,which can be either both small or both large. Large val-ues of t2 and t4 are only possible, if m1 and m2 are of dif-ferent sizes. Typical situations in forests, however,include either pairs of small diameters or pairs of smalland large diameters at close proximity. Competition forlight, water and nutrients, but also human manage-ment, almost entirely excludes situations of two largediameter trees at short distance. This is why the testfunctions t2 and t4 put the mark variogram and the markdifferentiation function at an advantage over the markcorrelation function if tree diameters are used as quanti-tative marks.
There is also another possibility for combining con-cepts of structural indices with second-order characteris-tics: It is possible to calculate for example the originaldifferentiation index for each tree of a given observationwindow. As a result every tree is assigned an individual,constructed mark. In another step, existing second-ordercharacteristics such as the mark correlation function,
kmm(r), and the mark variogram, �m (r), can be estimatedby using the constructed marks instead of originalmarks such as tree species and diameter. This would,indeed, be an interesting new direction in structuralresearch which so far has not been considered.
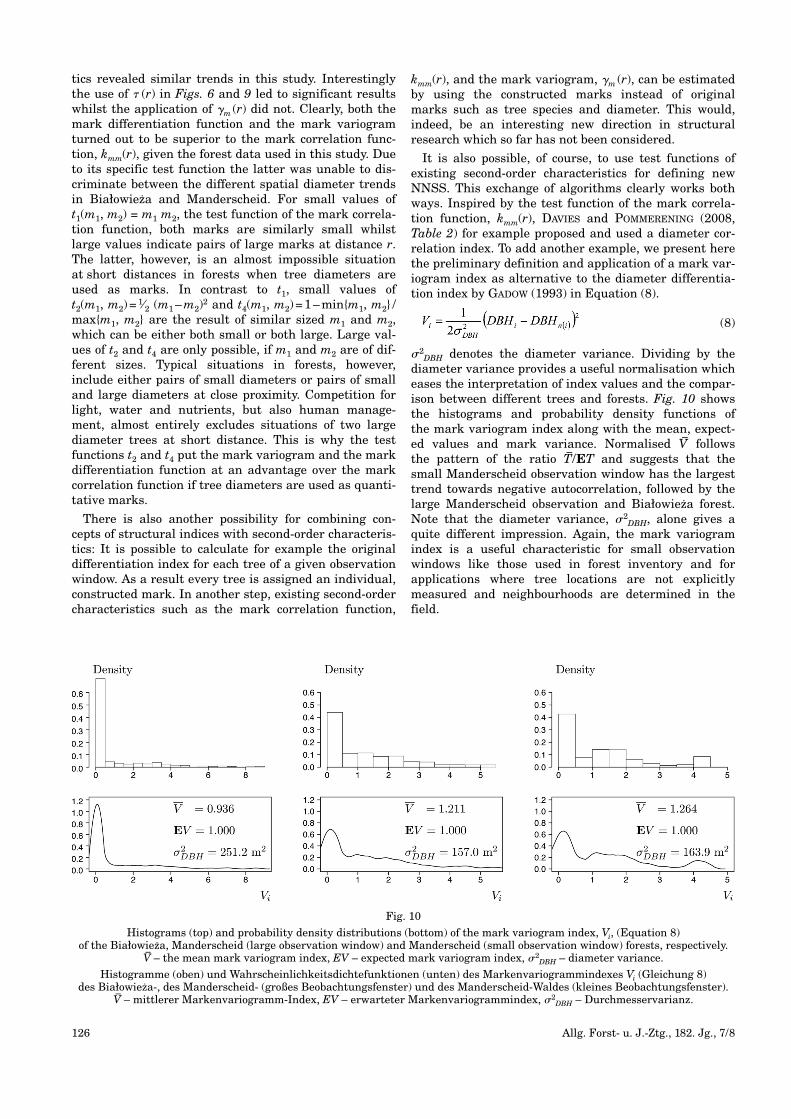
It is also possible, of course, to use test functions ofexisting second-order characteristics for defining newNNSS. This exchange of algorithms clearly works bothways. Inspired by the test function of the mark correla-tion function, kmm(r), DAVIES and POMMERENING (2008,Table 2) for example proposed and used a diameter cor-relation index. To add another example, we present herethe preliminary definition and application of a mark var-iogram index as alternative to the diameter differentia-tion index by GADOW (1993) in Equation (8).
(8)
�2DBH denotes the diameter variance. Dividing by the
diameter variance provides a useful normalisation whicheases the interpretation of index values and the compar-ison between different trees and forests. Fig. 10 showsthe histograms and probability density functions of the mark variogram index along with the mean, expect-ed values and mark variance. Normalised V– follows the pattern of the ratio T–/ET and suggests that thesmall Manderscheid observation window has the largesttrend towards negative autocorrelation, followed by thelarge Manderscheid observation and Białowieza forest.Note that the diameter variance, �2
DBH, alone gives aquite different impression. Again, the mark variogramindex is a useful characteristic for small observationwindows like those used in forest inventory and forapplications where tree locations are not explicitly measured and neighbourhoods are determined in thefield.
Fig. 10
Histograms (top) and probability density distributions (bottom) of the mark variogram index, Vi, (Equation 8) of the Białowieza, Manderscheid (large observation window) and Manderscheid (small observation window) forests, respectively.
V–– the mean mark variogram index, EV – expected mark variogram index, �2
DBH – diameter variance.
Histogramme (oben) und Wahrscheinlichkeitsdichtefunktionen (unten) des Markenvariogrammindexes Vi (Gleichung 8) des Białowieza-, des Manderscheid- (großes Beobachtungsfenster) und des Manderscheid-Waldes (kleines Beobachtungsfenster).
V–– mittlerer Markenvariogramm-Index, EV – erwarteter Markenvariogrammindex, �2
DBH – Durchmesservarianz.
Allg. Forst- u. J.-Ztg., 182. Jg., 7/8 127
5. ABSTRACT
Spatial forest structure research can be considered asa special branch or application of point process statisticsand therefore ties into general concepts and theories.According to them, species mingling and diameter differ-entiation indices, also referred to as nearest neighboursummary characteristics (NNSS), are based on con-structed marks. Interestingly the construction principlesof marks share similarities with the principles of theconstruction of test functions of second-order character-istics. By defining species mingling and diameter differ-entiation as second-order characteristics the authorsshowed that successful concepts of structural indices canindeed be transferred to other, more powerful statisticalconcepts. The new mark mingling and mark differentia-tion functions were then applied to Poisson pointprocesses with independent and dependent marking andalso to marked point pattern data from two forests. Theanalyses clearly highlighted that the new second-ordercharacteristics, which are based on the same principlesof comparing tree attributes as the traditional indices,significantly add to the value of the simple mark distrib-utions. This compatibility of mark and test function con-struction works both ways and the principles of the testfunctions of the mark correlation function and the markvariogram can for example be used to construct markcorrelation and mark variogram indices as NNSS. Thisprovides the analyst with the flexibility to use second-order characteristics if large observation windows withmore than 100 points are available and the correspond-ing mark or index distributions in the case of smallobservation windows with only few points, a common sit-uation in forest inventory. And yet, the algorithmic prin-ciples of comparing tree attributes are then the same.
6. ZUSAMMENFASSUNG
Titel des Beitrages: Arten-Durchmischung und Durch-messer-Differenzierung als Größen zweiter Ordnung.
Räumliche Waldstrukturforschung kann man als spe-ziellen Zweig oder Anwendung der Punktprozessstatis-tik verstehen und folgt daher allgemeinen Konzeptenund Theorien. Ihnen zufolge basieren die Arten-Durch-mischungs- und Durchmesserdifferenzierungsindizes,die man auch als Nachbarschaftsgrößen (NNSS)bezeichnet, auf konstruierten Marken. Interessanter-weise zeigen die Konstruktionsprinzipien für MarkenÄhnlichkeiten mit den Konstruktionsprinzipien für Test-funktionen von Größen zweiter Ordnung. Indem dieAutoren Arten-Durchmischung und Durchmesser-Diffe-renzierung als Größen zweiter Ordnung definieren, zei-gen sie, dass sich erfolgreiche Indexkonstruktionsprinzi-pien durchaus auf andere, wirkungsvollere statistischeKonzepte über tragen lassen. Die neuen Markendurchmi-schungs- und Markendifferenzierungsfunktionen wur-den dann auf Poisson-Punktprozesse mit unabhängigerund abhängiger Markierung sowie auf markierte Punkt-musterdaten zweier Wälder angewendet. Die Analysenzeigten deutlich, dass die neuen Größen zweiter Ord-nung, die auf denselben Prinzipien des Vergleichs vonBaumattributen beruhen wie die traditionellen Indizes,erheblich den Wert der einfachen Markenverteilungensteigern. Die Kompatibilität der Konstruktion von Mar-
ken und Testfunktionen hat Auswirkungen in beideRichtungen. Es ist zum Beispiel möglich, aus den Test-funktionen der Markenkorrelationsfunktion und desMarkenvariogramms den Markenkorrelations- und denMarken variogrammindex als NNSS zu konstruieren.Dies bietet die Flexibilität, beim Vorliegen großer Beob-achtungsfenster mit mehr als 100 Punkten Größen zwei-ter Ordnung und bei kleinen Beobachtungsfenstern mitnur wenigen Punkten, ein häufiger Fall in der Waldin-ventur, entsprechende Marken- oder Indexverteilungenanzuwenden. Trotz unterschiedlicher räumlicher Größensind dann die algorithmischen Prinzipien des Vergleichsvon Baumattributen gleich.
7. RÉSUMÉ
Titre de l’article: Mélanges d’espèces et différenciationdes diamètres en tant que grandeurs de deuxième ordre.
La recherche sur la structure forestière spatiale peutêtre comprise comme branche spéciale ou application desstatistiques de processus ponctuels et suit de ce fait desconcepts et théories généraux. Dans cette logique, lesindices de mélanges d’espèces et de différenciation desdiamètres, que l’on peut aussi décrire comme grandeursde voisinage (NNSS), sont basés sur des marques con-struites. De manière intéressante, les principes de con-struction pour les marques présentent des similitudesavec les principes de construction des fonctions-tests degrandeurs de deuxième ordre. En définissant lesmélanges d’espèces et la différenciation des diamètrescomme grandeurs de deuxième ordre, les auteurs mon-trent que les principes de construction d’indices se lais-sent tout-à-fait transposer avec succès sur d’autres con-cepts statistiques plus efficaces. Les nouvelles fonctionsde mélanges des marques et de différenciation des mar-ques furent appliquées ensuite à des processus ponctuelsde Poisson avec un marquage indépendant et dépendanttout comme sur les données d’un canevas de points dedeux forêts. Les analyses montrèrent clairement que lesnouvelles grandeurs de deuxième ordre qui reposent surles mêmes principes de comparaison d’attributs d’arbresque les indices traditionnels, augmentent considérable-ment la valeur des simples répartitions de marques. Lacompatibilité de la construction de marques et de fonc-tions test a des conséquences dans les deux directions. Ilest par exemple possible de construire l’index de corréla-tion de marques et l’index de variogramme de marquesen tant que NNSS, à partir des fonctions test de la fonc-tion de corrélation des marques et du variogramme desmarques. Ceci offre la souplesse d’appliquer les réparti-tions de marques ou d’index correspondantes dans le casde grandes fenêtres d’observation avec plus de 100points de grandeurs de deuxième ordre et dans le cas depetites fenêtres d’observation avec seulement peu depoints, cas fréquent dans l’inventaire forestier. Malgrédes grandeurs spatiales différentes, les principes algo-rithmiques de comparaison des attributs d’arbres sontalors identiques.
8. ACKNOWLEDGEMENTS
The authors are grateful for the invaluable advice andsuggestions received from Professor DIETRICH STOYAN
128 Allg. Forst- u. J.-Ztg., 182. Jg., 7/8
(TU Bergakademie Freiberg). Professor BOGDAN
BRZEZIECKI (Warsaw Agricultural University, Poland)has kindly provided the Białowieza data. Dr. PAVELGRABARNIK (Russian Academy of Sciences, Pushchino,Russia) sent helpful comments on an earlier draft of thispaper. Dr. Marie-Stella DUCHIRON kindly translated theabstract into French. The corresponding author wishesto acknowledge a Santander scholarship and a grantfrom the University of Santiago de Compostela for hisresearch stay in Spain in March/April 2010. Theresearch in this paper was also supported by the sabbat-ical fellowship awarded to ANA CRISTINA GONÇALVES bythe Fundação para a Ciência e Tecnologia (SFRH/BSAB/1047/2010) for a four-months stay at Bangor Universityin winter term 2010/11. We are particularly indebted toour mentor, colleague and friend, Professor KLAUS VON
GADOW for his inspiration, support and friendshipthroughout the past 18 years. This paper is dedicated tohim on the occasion of his 70th birthday.
9. REFERENCES
AGUIRRE, O., G. Y. HUI, K. GADOW and J. JIMÉNEZ (2003):An analysis of spatial forest structure using neighbour-hood-based variables. Forest Ecol. Manage. 183:137–145.
ALBERT, M. (1999): Analyse der eingriffsbedingten Struk-turveränderung und Durchforstungsmodellierung inMischbeständen. [Analysis of thinning-induced changesin stand structure and modelling of thinnings in mixed-species stands.] PhD dissertation, Faculty of Forestryand Forest Ecology, Göttingen University. Hainholz Ver-lag Göttingen, 195 pp.
BADDELEY, A and R. TURNER (2005): spatstat: An R pack-age for analyzing spatial point patterns. Journal of Sta-tistical Software 12: 1–42.
BESAG, J. (1977): Contribution to the discussion of Dr Rip-ley’s paper. J. Roy. Statist. Soc. Ser. B 39: 193–195.
BRZEZIECKI, B. and S. DROZDOWSKI (2005): Long-termexperiment on uneven-aged management in the Biało-wieza Forest, north-eastern Poland: implications fornatural regeneration. Annals of Warsaw AgriculturalUniversity – SGGW. For. Wood Technol. 56: 69–75.
BRZEZIECKI, B. and F. E. BERNADZKI (2008): LangfristigeEntwicklung von zwei Waldgesellschaften im Biało-wieza-Urwald. [Long-term dynamics of two forest com-munities in the Białowieza primeval forest.] Schweiz ZForstwes 159: 80–90.
CRECENTE-CAMPO, F., A. POMMERENING and R. RODRÍGUEZ-SOALLEIRO (2009): Impacts of thinning on structure,growth and risk of crown fire in a Pinus sylvestris L.plantation in northern Spain. For. Ecol. Manage. 257:1945–1954.
DAVIES, O. and A. POMMERENING (2008): The contributionof structural indices to the modelling of Sitka spruce(Picea sitchensis) and birch (Betula spp.) crowns. For.Ecol. Manage. 256: 68–77.
DIGGLE, P. J. (2003): Statistical analysis of spatial pointpatterns. 2nd edition. Arnold, London, 159 pp.
FÜLDNER, K. (1995): Strukturbeschreibung von Buchen-Edellaubholz-Mischwäldern. [Describing forest struc-tures in mixed beech-ash-maple-sycamore stands.] PhDdissertation Faculty of Forestry, University of Göttin-gen, Cuvillier Verlag Göttingen, 163 pp.
GADOW, K. V. (1993): Zur Bestandesbeschreibung in derForsteinrichtung. [New variables for describing standsof trees.] Forst und Holz 48: 602–606.
GADOW, K. V., G. Y. HUI and M. ALBERT (1998): DasWinkelmaß – ein Strukturparameter zur Beschreibungder Individualverteilung in Waldbeständen. [The neigh-bourhood pattern – a new parameter for describing for-est structures.] Centralblatt für das gesamte Forstwe-sen 115: 1–10.
GADOW, K. V., G. Y. HUI, B. W. CHEN and M. ALBERT (2003):Beziehungen zwischen Winkelmaß und Baumabstän-den. [Relationship between the uniform angle index andnearest neighbour distances.] Forstw. Cbl. 122:127–137.
GADOW, K., V. (1999): Waldstruktur und Diversität. [For-est structure and diversity.] Allg. Forst-u.J.-Ztg. 170:117–122.
GOREAUD, F. and R. PÉLISSIER (2003): Avoiding misinter-pretation of biotic interactions with the intertype K12-function: population independence vs. random labellinghypothesis. J. Veg. Sci. 14: 681–692.
HUI, G. Y. and K. V. GADOW (2002): Das Winkelmaß. Her-leitung des optimalen Standardwinkels. [The uniformangle index. Derivation of the optimal standard angle.]Allg. Forst- u. J.-Ztg. 173: 173–177.
HUI, G. Y., M. ALBERT and K. V. GADOW (1998): Das Umge-bungsmaß als Parameter zur Nachbildung vonBestandesstrukturen. [The diameter dominance as aparameter for simulating forest structure.] Forstw. Cbl.117: 258–266.
HUI, G. Y. and M. ALBERT (2004): Stichprobensimulationenzur Schätzung nachbarschaftsbezogener Strukturpara-meter in Waldbeständen. [Estimating neighbourhood-based stand structure parameters using sampling simu-lation.] Allg. Forst-u.J.-Ztg. 175: 199–209.
ILLIAN, J., A. PENTTINEN, H. STOYAN and D. STOYAN (2008):Statistical analysis and modelling of spatial point pat-terns. John Wiley & Sons, Chichester, 534 pp.
LEWANDOWSKI, A. and A. POMMERENING (1997): ZurBeschreibung der Waldstruktur – Erwartete undbeobachtete Arten-Durchmischung. [On the descriptionof forest structure – Expected and observed mingling ofspecies.] Forstw. Cbl. 116: 129–139.
LEMAY, V., A. POMMERENING and P. MARSHALL (2009): Spa-tio-temporal structure of multi-storied, uneven-agedinterior Douglas fir (Pseudotsuga menziesii var glauca(Mirb.) Franco) stands. J. Ecol. 97: 1062–1074.
LOOSMOORE, N. B. and E. D. FORD (2006): Statistical infer-ence using the G or K point pattern spatial statistics.Ecology 87: 1925–1931.
MECKE, K. R. and D. STOYAN (2005): Morphological charac-terisation of point patterns. Biometrical J. 47, 473–488.
MOTZ, K., H. STERBA and A. POMMERENING (2010): Sam-pling measures of tree diversity. Forest Ecol. Manage.260: 1985–1996.
NAGEL, J. and G. S. BIGING (1995): Schätzung der Para -meter der Weibullfunktion zur Generierung von Durch -messerverteilungen. [Estimation of the parameters ofthe Weibull function for generating diameter distribu-tions.] Allg. Forst-u.J.-Ztg. 166: 185–189.
OHSER, J. and D. STOYAN (1981): On the second-order andorientation analysis of planar stationary point process-es. Biometrical J. 23: 523–533.
POMMERENING, A. (1997): Eine Analyse neuer Ansätze zurBestandesinventur in strukturreichen Wäldern. [Ananalysis of new approaches towards stand inventory in
Allg. Forst- u. J.-Ztg., 182. Jg., 7/8 129
structure-rich forests.] PhD dissertation Faculty ofForestry and Forest Ecology, University of Göttingen,Cuvillier Verlag Göttingen, 187 pp.
POMMERENING, A., P. BIBER, D. STOYAN and H. PRETZSCH
(2000): Neue Methoden zur Analyse und Charakte -risierung von Bestandesstrukturen. [New methods forthe analysis and characterisation of forest stand struc-tures]. Forstw. Cbl. 119: 62–78.
POMMERENING, A. (2002): Approaches to quantifying foreststructures. Forestry 75: 305–324.
POMMERENING, A. (2006): Evaluating structural indices byreversing forest structural analysis. Forest Ecol. Man-age. 224: 266–277.
POMMERENING, A. and D. STOYAN (2006): Edge-correctionneeds in estimating indices of spatial forest structure.Can. J. For. Res. 36: 1723–1739.
POMMERENING, A. and D. STOYAN (2008): Reconstructingspatial tree point patterns from nearest neighbour sum-mary statistics measured in small subwindows. Can. J.For. Res. 38: 1110–1122.
R DEVELOPMENT CORE TEAM (2011): R: A language andenvironment for statistical computing. R Foundation forStatistical Computing. Vienna, Austria. http://www.R-project.org.
RIPLEY, B. D. (1977): Modelling spatial patterns (with dis-cussion). J. Roy. Statist. Soc. Ser. B 39: 172–212.
SHIMATANI, K. (2001a): Multivariate point processes andspatial variation of species diversity. Forest Ecol. Man-age. 142: 215–229.
SHIMATANI, K. (2001b): On the measurement of speciesdiversity incorporating species differences. Oikos 93:135–147.
SHIMATANI, K. and Y. KUBOTA (2004): Quantitative assess-ment of multispecies spatial pattern with high speciesdiversity. Ecological Research 19: 149–163.
STAUPENDAHL, K. and W. ZUCCHINI (2006): Estimating thespatial distribution in forest stands by counting smallangles between nearest neighbours. Allg. Forst- u. J.-Ztg. 177: 160–168.
Schätzung von Überlebensfunktionen der Hauptbaumarten auf der Basis von Zeitreihendaten der Rheinland-Pfälzischen Waldzustandserhebung
(Mit 6 Abbildungen und 6 Tabellen)
KAI STAUPENDAHL1) und WALTER ZUCCHINI2)
(Angenommen November 2010)
SCHLAGWÖRTER – KEY WORDS
Überlebensfunktion; Überlebenszeitanalyse; Risiko; Forst -planung; Waldzustandsinventuren.
Survival function; Survival analysis; Risk; Forest Mana-gement, Forest Condition Survey.
1. EINLEITUNG
Vor dem Hintergrund des Klimawandels und der mitihm erwarteten Zunahme von Kalamitäten (UMWELT-BUNDESAMT, 2008) erfährt die schon lange bestehendeForderung, naturale Risiken in der forstlichen Planungangemessen zu berücksichtigen, eine neue Aktualität.Die Forstwirtschaft ist in ganz besonderem Ausmaß vonden gegebenen standörtlichen Rahmenbedingungen
abhängig, ohne auf deren Veränderung, z.B. durch tech-nische Maßnahmen wie Bewässerung oder Düngung,kurzfristig reagieren zu können. Aufgrund der extremenLangfristigkeit der forstlichen Produktion und der dem-entsprechend lang andauernden Exposition der Wald -bestände können somit naturale Risiken insbesonderedurch Sturm, Schnee, Dürre und Insekten den (wirt-schaftlichen) Erfolg forstlichen Handelns maßgeblichbeeinflussen. Nach Recherchen von HAHN und KNOKE
(2010) beträgt z.B. der Anteil der kalamitätsbedingtenZwangsnutzungen, die mit entsprechenden Mehrkostenbei der Holzernte und Mindereinnahmen beim Holzver-kauf einhergehen, in den Bayerischen Staatsforsten imDurchschnitt der Jahre 1950 bis 2009 knapp 30%.
Somit kommt der Kenntnis der standortsabhängigenÜberlebenswahrscheinlichkeiten im Planungsprozesseine besondere Bedeutung zu, da nur auf ihrer Grund -lage eine adäquate Anpassung an die standörtlichenGegebenheiten möglich ist, z.B. durch die Auswahlgeeigneter Baumarten und Produktionszeiträume. Einzentraler Begriff ist in diesem Zusammenhang die Über-lebensfunktion, die die unbedingte Wahrscheinlichkeitangibt, dass ein neu begründeter Waldbestand auf gege-benem Standort mindestens ein bestimmtes Altererreicht.
1) Korrespondierender Autor: Abt. Forstökonomie und Forstein-richtung, Fakultät für Forstwissenschaften und Waldökologie,Georg-August-Universität Göttingen, Büsgenweg 3, D-37077Göttingen. Aktuelle Adresse: ARGUS Forstplanung, Büsgen-weg 5, D-37077 Göttingen.E-Mail: [email protected]
2) Institut für Statistik und Ökonometrie, Wirtschaftswissen-schaftliche Fakultät, Georg-August-Universität Göttingen,Platz der Göttinger Sieben 5, D-37073 Göttingen.E-Mail: [email protected]