Embed Size (px)
Citation preview
The Journal of Neuroscience, October 1990, lO(10): 33693369
Spectral Properties of V4 Neurons in the Macaque
Stanley J. Scheinl** and Robert Desimone3
INeuro-Ophthalmology Unit, Howe Laboratory, Massachusetts Eye and Ear Infirmary, Departments of Ophthalmology and Neuroscience, Harvard Medical School, Boston, Massachusetts 02114, *Section on Visual Processing, National Eye Institute, Bethesda, Maryland 20892, and 3Laboratory of Neuropsychology, National Institute of Mental Health, Bethesda, Maryland 20892
Spectral properties of 129 cells in the V4 area of 5 macaque monkeys were studied quantitatively with narrow-band and broad-band colored lights. The large majority of cells exhib- ited some degree of wavelength sensitivity within their re- ceptive fields. The half-bandwidth of the primary peak in the spectral-response curve was less than 50 nm for 72% of the cells; the mean half-bandwidth of these cells, 27 nm, is sim- ilar to that found for color-opponent ganglion cells and cells in the parvocellular dorsal lateral geniculate nucleus (dLGN). Contrast-response functions indicated that the narrow spec- tral tuning of these cells derived from cone opponent inter- actions. From comparison of receptive-field sizes, we sug- gest that a typical V4 neuron sums inputs that ultimately derive from several thousand ganglion or parvocellular dLGN cells.
In spite of their wavelength sensitivity, most V4 cells had properties that would not fit some simple criteria for clas- sification as “color selective.” First, few cells showed overt signs of color opponency, namely, on-inhibition or off-ex- citation to spectrally opponent wavelengths. Second, about 30% of the cells in V4 had spectral-response curves with 2 peaks. (The wavelength distribution of these second peaks was almost identical to that of primary peaks, and combi- nations of peak wavelengths were fairly random.) Third, most cells responded to white light; overall, the response to white light was about 60% of that to the best narrow-band or broad- band colored light. Similarly, most V4 cells gave at least a small response to all or nearly all of the different broad-band colored lights we presented. Therefore, a given V4 cell is very likely to respond to most of the colored or white sur- faces in natural scenes. These combinations of response properties probably explain the widely divergent percent- ages of “color” cells reported in previous studies of V4.
The most unusual spectral property we found in V4 was a large, spectrally sensitive surround outside the “classical receptive field” of most cells. Although stimulation of the surround by itself did not cause any response, surround
Received Mar. 12, 1990; revised June 12, 1990; accepted June 25, 1990. This work was partially supported by National Eye Institute Grant ROl EY
06096, by Research to Prevent Blindness, Inc., and by the Massachusetts Lions Research Fund (S.J.S.). We thank Mortimer Mishkin and Francisco de Monasterio for their encouragement and support of this work, Jeffrey Moran for programming assistance, E. P. McCrane for histological processing, and R. Eskew, C. Stromeyer, and A. Reeves for helpful comments on the manuscript.
Correspondence should be addressed to Stan Schein, Department of Psychology, UCLA, Los Angeles, CA 90024- 1563. Copyright 0 1990 Society for Neuroscience 0270-6474/90/103369-21$03.00/O
stimulation could completely suppress the response to even the optimally colored stimulus in the receptive field. In gen- eral, the optimal wavelengths for receptive-field excitation and surround suppression were the same or nearly so. Thus, “color contrast” may be computed in V4. In some cases, contrasting wavelengths in the surround caused moderate enhancement of response to a receptive-field stimulus. These interactions between the receptive field and surround may play a role in color constancy and possibly figure/ground separation as well.
Area V4 has been the subject of more interest-and more con- troversy-than probably any visual area in extrastriate cortex of the macaque. Zeki (1973) originally reported that all of the cells in V4 were specialized for color. This apparent speciali- zation for color in V4 (Zeki, 1973, 1977, 1978, 1980), in con- junction with Zeki’s (1974) finding of motion specialization in the middle temporal area (MT), was the primary support for a “division of labor” theory of extrastriate cortex, according to which each visual area analyzed a separate stimulus attribute in parallel with one another. Later, the notion that V4 was specialized for color was challenged by a number of studies that reported far lower values for the incidence of “color-selective” cells (Van Essen and Zeki, 1978; Gouras and Kruger, 1979; Fischer et al., 1981; Schein et al., 1982; Tanaka et al., 1986b), with some values as low as 20%.
The nature of V4 cell color-selective properties was also the focus of disagreement. Zeki (1980) suggested that V4 cells were more narrowly tuned to wavelength than cells at prior levels, and that wavelengths of peak sensitivity in V4 aggregated around the pure hues. From their own and Zeki’s data, de Monasterio and Schein (1982) concluded that the spectral bandwidths of V4 cells were similar to those at prior levels [color-opponent ganglion cells and cells in parvocellular layers of the dorsal LGN (dLGN), Vl, and V2]. Moreover, insofar as there was an ag- gregation of the wavelengths of peak sensitivity among V4 cells, that aggregation could best be explained as the consequence of the cone opponent mechanisms of ganglion cells.
Because of these unsettled controversies, and because most prior investigations of V4 concentrated on classifying V4 cells according to largely qualitative criteria, we sought to quantify the spatial and spectral properties of V4 neurons with automated presentations of standard sets of stimuli, similar to the approach that has been taken in other extrastriate visual areas (e.g., Baker et al., 1981; Maunsell and Van Essen, 1983; Albright, 1984; Burkhalter and Van Essen, 1986). In the first of this 2-part study, we found that the large majority of V4 neurons show selectivity
3370 Schein and Desimone * Spectral Properties in Area V4
for stimulus form that is comparable in many respects to that found in Vl and V2 (Desimone and Schein, 1987).
In the present study, we report that the large majority of V4 neurons also show evidence of wavelength selectivity that ap- pears to derive from color-opponent input. The sensitivity of V4 cells to colored and white lights is similar in some respects to that of color-opponent ganglion and parvocellular dLGN cells. However, overt evidence of color opponency, on-inhibi- tion and color-opponent off-excitation, is largely absent. These findings, along with a comparison of V4 and antecedent recep- tive-field sizes, lead us to suggest that a given V4 cell sums half- wave-rectified inputs ultimately deriving from a very large num- ber of color-opponent cells.
Although it was not our goal to place cells into “color” or “noncolor” classes, we show how many V4 cells could be clas- sified either way, depending on the classification criteria, a find- ing that we believe explains the widely divergent accounts of color selectivity in V4. Finally, in striking contrast to dLGN neurons, we found that many V4 neurons have a “silent,” sup- pressive surround whose wavelength sensitivity matches that of the excitatory, or classical, receptive field. Thus, it appears that color contrast is computed in V4. Such a “lightness” mechanism could be the mechanism behind reports of “color constancy” in V4 (Z&i, 1980, 1983b,c).
Some of these findings have been described in preliminary reports (Desimone and Schein, 1983; Schein et al., 1983; De- simone et al., 1985, 1986).
Materials and Methods Animal preparation and recording procedure. The data reported here were collected in conjunction with a companion study of the spatial moperties of V4 cells (Desimone and Schein. 1987). The animal orep- araiion was described-in detail in that and karlier’reports (Des&one and Gross, 1979; Schein et al., 1982) and will be summarized only briefly here.
In this study, 5 male cynomolgus monkeys (Macaca fascicularis), weighing 2.5-3.0 kg, were used. These 5 were among the 7 reported by Desimone and Schein (1987). In preparation for semichronic recording, a post for holding the head and a recording chamber were implanted using aseptic techniques while the animal was under deep surgical an- esthesia (intravenous sodium pentobarbital). At surgery, stereotaxic co- ordinates of the prelunate gyrus were taken after resection of a 2-cm disk of bone over the left (nonrecorded) hemisphere. The hole was then covered with a stainless-steel cap filled with tetracycline. The stereotaxic coordinates of the prelunate gyrus in the left hemisphere were used to guide the subsequent placement of penetrations within a recording chamber implanted over the right hemisphere.
The semichronic recording procedure is also described in detail in earlier reports (Desimone and Gross, 1979; Schein et al., 1982; Desi- mone and Schein, 1987). Briefly, the animal was anesthetized with halothane (2.5%) in a mixture of nitrous oxide and oxygen, intubated with an endotrachial tube covered with Xylocaine jelly, placed on a cushion and heating pad, and held by the implanted headpost. The animal was then paralyzed with pancuronium bromide. End-tidal CO, and body temperature were monitored and maintained within normal physiological limits. Cyclogyl (1%) was used to paralyze acommodation and dialate the pupil, and the cornea was kept moist by a contact lens chosen to focus the animal’s eye on a screen 57 cm distant. Only the eye contralateral to the recording electrode was used, the other eye was closed.
No surgical or other potentially painful procedures were conducted following paralysis. Moreover, the animals were held by the headpost, so ear bars were not used. To eliminate any potential stress or discomfort during the session, the animal was maintained on nitrous oxide and oxygen (70:30) anesthesia during paralysis with pancuronium bromide. (In our experience, V4 neurons are adequately responsive under nitrous oxide anesthesia, whereas they are so depressed under halothane or barbiturate anesthetics that recording is virtually impossible.) The elec-
trocardiogram and EEG were carefully monitored for changes that might indicate pain or distress (e.g., abnormal heart rate or desynchronized EEG), and sodium pentobarbital(l0 mg/kg, i.v.) was available, though never found to be necessary, for such a contingency. Most 8-12-hr recording sessions involved a single penetration within a small burr hole in the bone inside the recording chamber. The same burr hole was usually used for 3-4 closely spaced penetrations, and each monkey was used for l-20 sessions. A single major surgery for the chamber and headpost implantation followed by multiple recording sessions allowed us to use far fewer animals than would have otherwise been required. Furthermore, because the recording sessions were so short, the animal’s physiological state remained healthy, and its corneas remained clear throughout the session. All procedures were considered and approved by the Institutional Animal Care and Use Committee.
Because our electrode penetrations were typically very shallow and therefore hard to find in the subsequent histology, long electrode pen- etrations were made through the centers of the burr holes after the completion of all recordings. On the next day, following an overdose of sodium pentobarbital, the monkey was perfused intracardially with 3.7% formaldehyde in saline. Histological methods for localizing re- cording sites are described by Desimone and Schein (1987).
Stimuli. Two light sources with 250-W tungsten-halogen bulbs and 1 with a 150-W bulb were used. For the two 250-W liahts. outical benches directed the path of each through an adjustable re&ngular diaphragm or photographic slide (to establish stimulus shape), a computer-con- trolled shutter and mirrors, color filters, neural density filters, and lenses onto a back-projection screen (Polacoat). One light source was used for projecting stimuli inside a unit’s receptive field, 1 for projecting stimuli outside the field, and the third, 150-W source was used to provide a diffuse background. Spectral bandwidth and the wavelength of peak transmission of interference filters (Oriel, 10 nm half-bandwidth) were checked with a spectrophotometer. The 5 broad-band Wratten (Kodak) filters were red (26; dominant wavelength, 621 nm; excitation purity, lOO%), yellow (2 1; dominant wavelength, 594 nm; excitation purity, lOO%), green (74; dominant wavelength, 538 nm; excitation purity, 93.5%), blue (48; dominant wavelength, 471 nm; excitation purity, 96.5%) magenta (34A), and white (neutral density). The luminance of the stimuli after transmission through these broad-band filters and both the luminance and energy after transmission through the 12 interference (440-660 at 20-nm intervals) and neutral density filters were calibrated with a photometer/radiometer. The photometer’s luminance measure- ments were based on the 1931 CIE photopic luminosity function (Wy- szecki and Stiles, 1982). The spectral transmission of the filters was checked with a Beckman spectrophotometer.
The 2 most common methods for studying spectral preferences are (1) spectral sensitivity at threshold (or criterion) response, measured in quanta, and (2) suprathreshold responses for lights equated for lumi- nance. In our experience, variability of V4 responses makes threshold measurements particularly difficult and time consuming. In addition, it appeared possible that neurons might have quantitatively different spec- tral properties at threshold and suprathreshold contrast, and indeed, we found neurons of this type (see Results). Therefore, we chose to measure suprathreshold responses, with computer averaging. In some of the cells, we further tested for color-opponent input by measuring the response as a function of contrast at several wavelengths inside and outside of the spectral pass band (see Results).
Most spectral-response studies were performed with colored stimulus lights equated for luminance, which was 4 ft-L (528 photopic trolands) for the white and broad-band colored stimuli and 1.5 ft-L (198 photopic trolands) for the white and narrow-band (460-660 nm) colored stimuli. For more direct comparison with ganglion cells, a few studies used narrow-band (440-660 nm) colored stimuli of (nearly) equal quanta, 4 x lOI quanta/seccm2, with the screen at 57 cm from the eye. Not surprisingly, the bandwidth of spectral-response curves and their peaks (see Results) were similar when measured with lights equated for lu- minance or with lights equated for quanta. Color temperature of the white light was adjusted to 4500” K. The background luminance was 1.2 ft-L (158 photopic trolands) for the studies with broad-band lights and 0.5 ft-L (66 photopic trolands) for the studies with narrow-band lights.
Experimental design. A hand-held projector was used to map a cell’s minimum response field, or “classical receptive field.” The classical receptive field was defined as the region of the visual field in which a flashing or moving stimulus elicited a detectable change in firing rate. In general, we found that there was good agreement between our hand-
The Journal of Neuroscience, October 1990, IO(10) 3371
ii 6 75
- ON
w460 t 660
500 WAVELENGTH (NM)
VM
T
WHITE 460 480 500
L
560 560 600 620
mapped receptive fields and those obtained from computer-averaged stimulus presentations (Desimone and Schein, 1987). After mapping the field, the cell’s spatial specificities, including orientation, direction of motion, and the length or width of stimuli, were assessed qualitatively and/or quantitatively. In initial experiments, spectral properties were intensively studied first; when possible, spatial properties were studied next. In later experiments, this order was reversed.
Cells were tested with either narrow-band colored lights and white light equated for luminance, broad-band colored lights and white light equated for luminance, narrow-band colored lights equated for number of quanta, or 2 of the these 3 methods. Typically, a stimulus was pre- sented for 1.28 set, followed by an interstimulus interval of 5-7 sec. Spikes were collected with 1-msec accuracy, but were accumulated in IO-msec bins for illustration in histograms. Most V4 cells responded well to flashed, static stimuli. Due to response variability, the differently colored stimuli were randomly interleaved until 5-10 trials had been completed for each.
“Responses,” computed by subtraction of the average firing rate dur- ing the prestimulus interval from that during the stimulation interval, represented the average change in firing rate produced by the stimulus. Responses during stimulus presentation were defined as on-responses; responses within the following 0.64 set were defined as off-responses. The responses to the differently colored and white lights were normalized by dividing them by the on-response to the optimally colored stimulus. We computed the summed response over the entire stimulus period, the summed response over the first ‘/2 of the stimulus period, and the peak response among IO-msec intervals. Spectral-response curves were essentially identical with the 3 methods. All spectral-response curves shown in the figures are based on the summed response over the entire stimulus period (baseline and maximal firing rates are given in the legends).
The sets of spectral responses (before subtraction of the baseline firing rate) to stimulus onset and offset were statistically evaluated by analysis of variance (ANOVA), followed by a Dunnet test (using the residual SE from the ANOVA), comparing the response at each wavelength to both the baseline activity and the optimal stimulus (Keppel, 1973). Some spectral-response curves appeared to have 2 or more peaks separated by troughs. For a curve to be classified as multipeaked, it was necessary
P3-Z-5-3
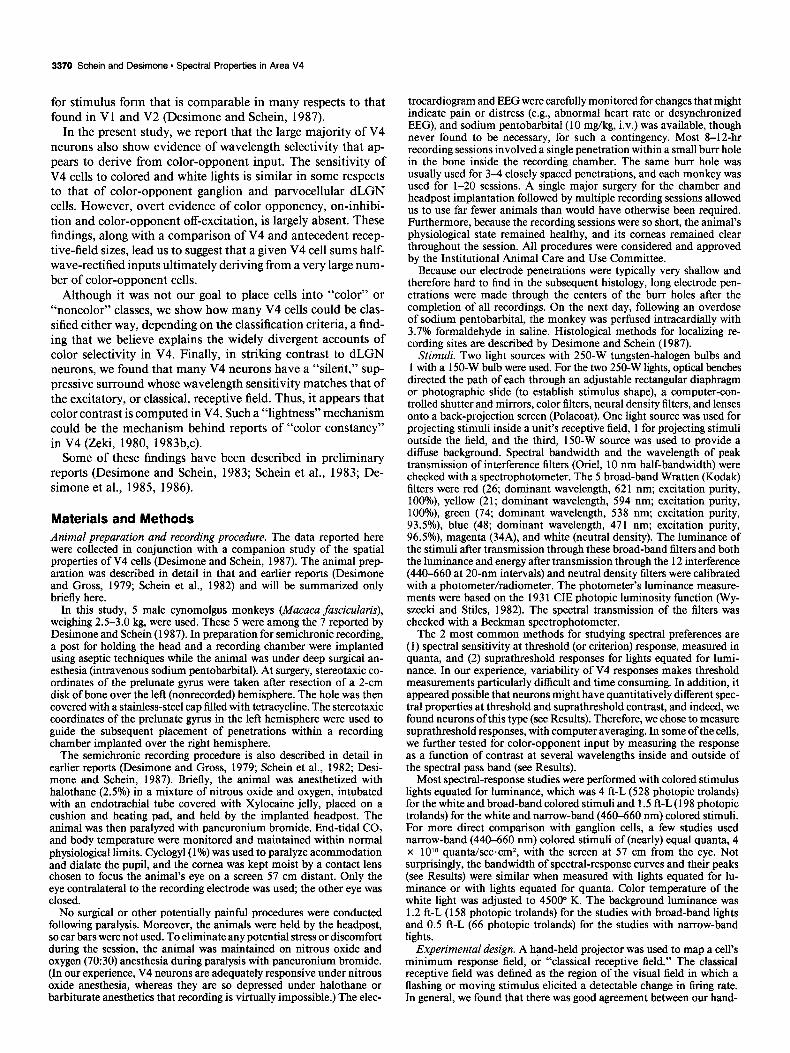
Figure 1. Responses of a typical V4 cell to narrow-band colored lights and white light of equal photopic luminance (1.5 ft-L) on a neutral background (0.5 ft-L). Upper lefi, In the spectral-re- sponse curve, the ordinate is the nor- malized response, the firing rate to the stimulus minus the background firing rate (1 .O spikes/set), divided by the re- sponse to the best narrow-band colored light (34.2 spikes/set). The shaded bar shows the response to white light. Up- per right, The receptive field is shown to the right of the vertical meridian, our convention for the hemifield contralat- era1 to the electrode. The stimulus is shown to scale. Bottom, Peristimulus- time histograms. The horizontalbar be- neath each histogram indicates the 1.2% set interval when the stimulus was on, and the bin width for illustration is 10 msec. This unit responded best to 500- nm light, and it gave a moderate re- sponse to white light.
that responses to the stimulus at the bottom of the trough be significantly different @ < 0.05, evaluated by t test) from the peak responses on either side of the trough. In Figure 2, which shows spectral-response curves with multiple peaks, the symbols are therefore of 3 kinds. Large solid symbols represent the peak response and responses that are not statistically different from the peak response. Small solid symbols rep- resent responses that are not statistically different from the baseline activity. Open squares represent intermediate responses that are statis- tically different from both the peak response and the baseline.
Results A total of 332 neurons were studied in 7 animals in this 2-part study. Spatial properties of these neurons were reported in the first paper of this series (Desimone and Schein, 1987). In this paper, we report on 129 of these cells whose spectral properties were thoroughly studied. These cells were recorded in 5 of the animals at recording sites located on the prelunate gyrus, as shown in hemispheres l-5 of the first figure of Desimone and Schein (1987). These sites were all within “area V4” as defined in Ungerleider et al. (1983) and Gattass et al. (1988), within “area VCAL” as defined in Maguire and Baizer (1984), and within the portion of the “VCcomplex” as defined in Z&i (1977) that excludes the transitional region between V4 and MT on the posterior bank of the superior temporal sulcus (Schein et al., 1982; Maguire and Baizer, 1984; Ungerleider and Desimone, 1986a,b). All receptive fields were centered within the repre- sentation of the central 5” in V4 (see Fig. 2 of Desimone and Schein, 1987).
Spectral properties of the classical receptive field Spectral-response curves with narrow-band lights We obtained spectral-response curves with equally luminant
3372 Schein and Desimone * Spectral Properties in Area V4
T P4-2-s-4 -On A .---4 Off
J , t
W 460 560 660
-. .’
P3-2-4-2
W 460 560 660
Wavelength (nm)
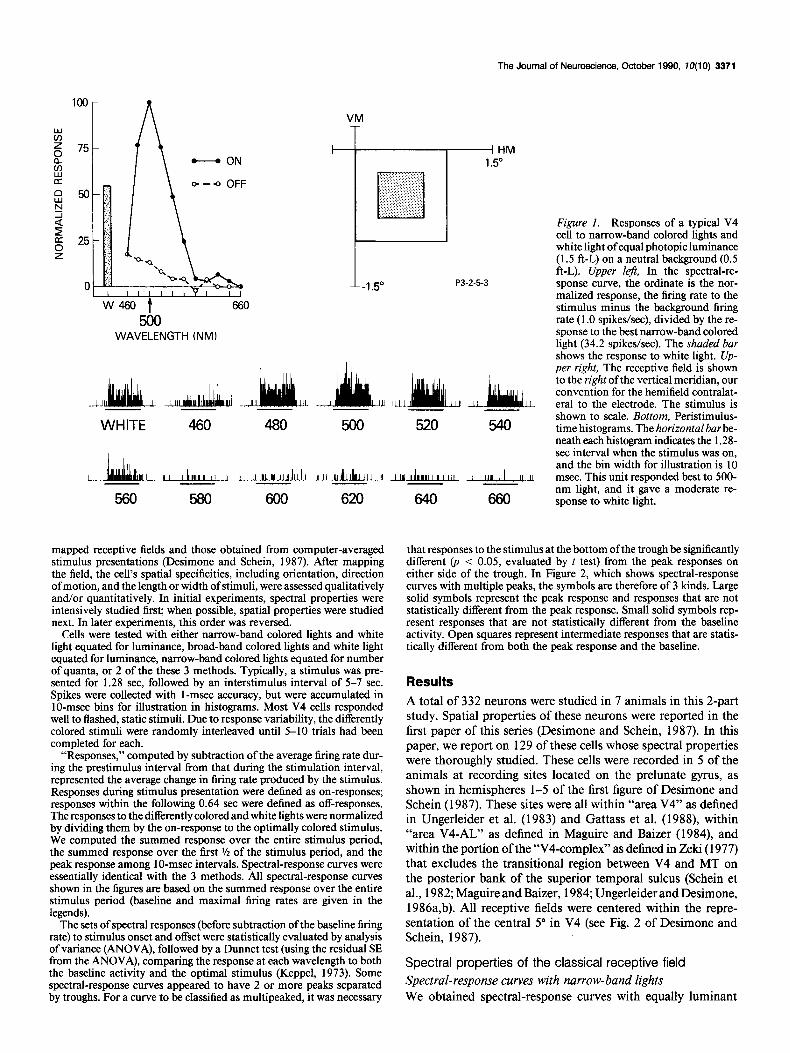
Figure 2. Examples from 3 V4 cells of spectral-response curves with 2 peaks. Cells were tested with narrow-band lights of equal photopic luminance, with stimulus conditions as described in Figure 1. Large solidsymbols represent normalized responses significantly different from the baseline activity but not significantly different from the peak re- sponse; small solid symbols represent normalized responses not signif- icantly different from the baseline; large open symbols represent nor- malized responses significantly different from both the peak and the baseline. A, This cell’s response peaked at short (blue) and at midspectral (green) wavelengths. The best response was 7.8 spikes/set, and the base- line was 0.8 spikes/set. B, This cell’s response peaked at blue and at yellow wavelengths. The best response was 73.6 spikes/set, and the baseline was 20.4 spikes/set. C, This cell’s response peaked at the blue and the red ends of the spectrum. The best response was 45.3 spikes/ set, and the baseline was 16.5 spikes/set.
B 660 - “a e 4 620 - g 2 580 - 5 540 -
s 460 500 540 580 620 660 Wavelength (nm) of primary peak
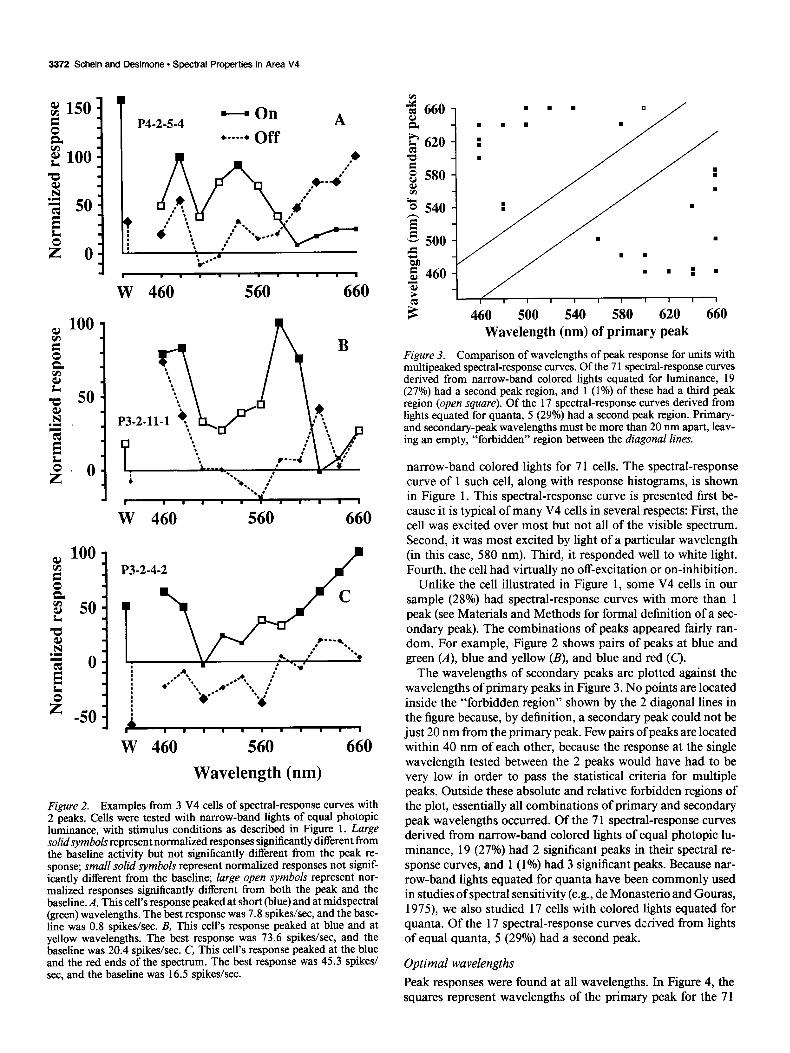
Figure 3. Comparison of wavelengths of peak response for units with multipeaked spectral-response curves. Of the 7 1 spectral-response curves derived from narrow-band colored lights equated for luminance, 19 (27%) had a second peak region, and 1 (1%) of these had a third peak region (open square). Of the 17 spectral-response curves derived from lights equated for quanta, 5 (29%) had a second peak region. Primary- and secondary-peak wavelengths must be more than 20 nm apart, leav- ing an empty, “forbidden” region between the diagonal lines.
narrow-band colored lights for 7 1 cells. The spectral-response curve of 1 such cell, along with response histograms, is shown in Figure 1. This spectral-response curve is presented first be- cause it is typical of many V4 cells in several respects: First, the cell was excited over most but not all of the visible spectrum. Second, it was most excited by light of a particular wavelength (in this case, 580 nm). Third, it responded well to white light. Fourth, the cell had virtually no off-excitation or on-inhibition.
Unlike the cell illustrated in Figure 1, some V4 cells in our sample (28%) had spectral-response curves with more than 1 peak (see Materials and Methods for formal definition of a sec- ondary peak). The combinations of peaks appeared fairly ran- dom. For example, Figure 2 shows pairs of peaks at blue and green (A), blue and yellow (B), and blue and red (C).
The wavelengths of secondary peaks are plotted against the wavelengths of primary peaks in Figure 3. No points are located inside the “forbidden region” shown by the 2 diagonal lines in the figure because, by definition, a secondary peak could not be just 20 nm from the primary peak. Few pairs of peaks are located within 40 nm of each other, because the response at the single wavelength tested between the 2 peaks would have had to be very low in order to pass the statistical criteria for multiple peaks. Outside these absolute and relative forbidden regions of the plot, essentially all combinations of primary and secondary peak wavelengths occurred. Of the 7 1 spectral-response curves derived from narrow-band colored lights of equal photopic lu- minance, 19 (27%) had 2 significant peaks in their spectral re- sponse curves, and 1 (1%) had 3 significant peaks. Because nar- row-band lights equated for quanta have been commonly used in studies of spectral sensitivity (e.g., de Monasterio and Gouras, 1975), we also studied 17 cells with colored lights equated for quanta. Of the 17 spectral-response curves dxived from lights of equal quanta, 5 (29%) had a second peak.
Optimal wavelengths
Peak responses were found at all wavelengths. In Figure 4, the squares represent wavelengths of the primary peak for the 71
The Journal of Neuroscience, October 1990, IO(10) 3373
4 Primary peak (Eq Lum; ~71)
0 Primary peak (Eq Quant; n=17)
A ..... .. All peaks/Z (~113)
0 460 500 540 580 620 660
Wavelength (nm) of peak
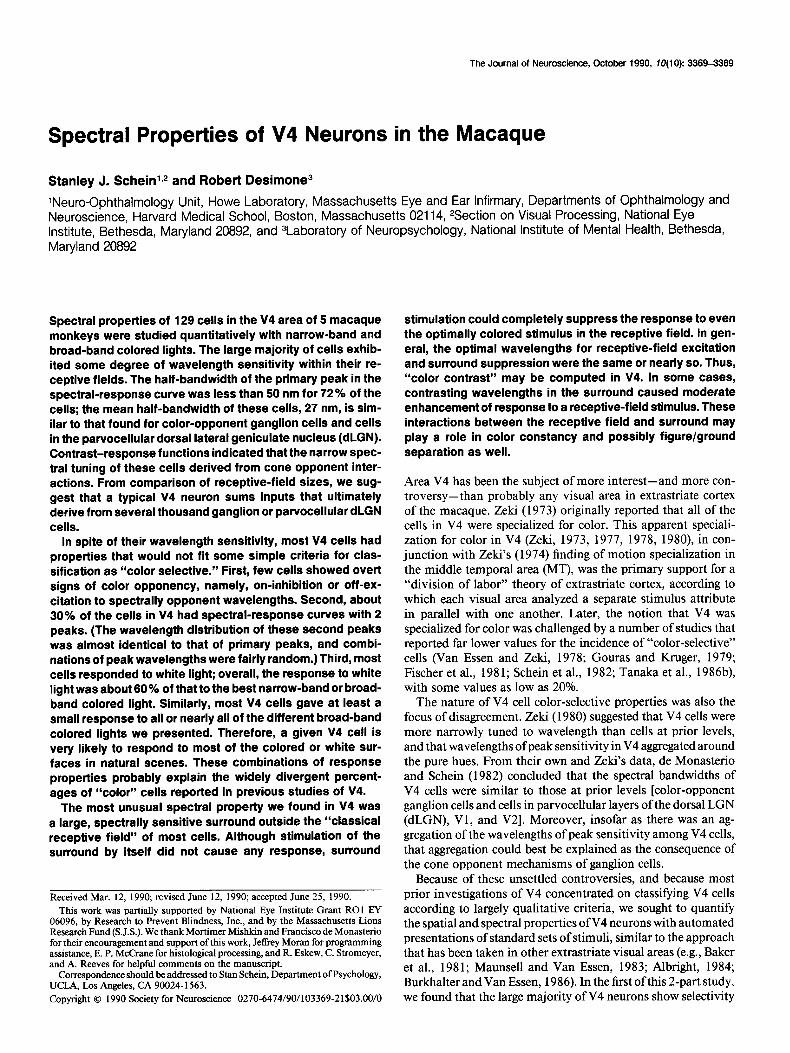
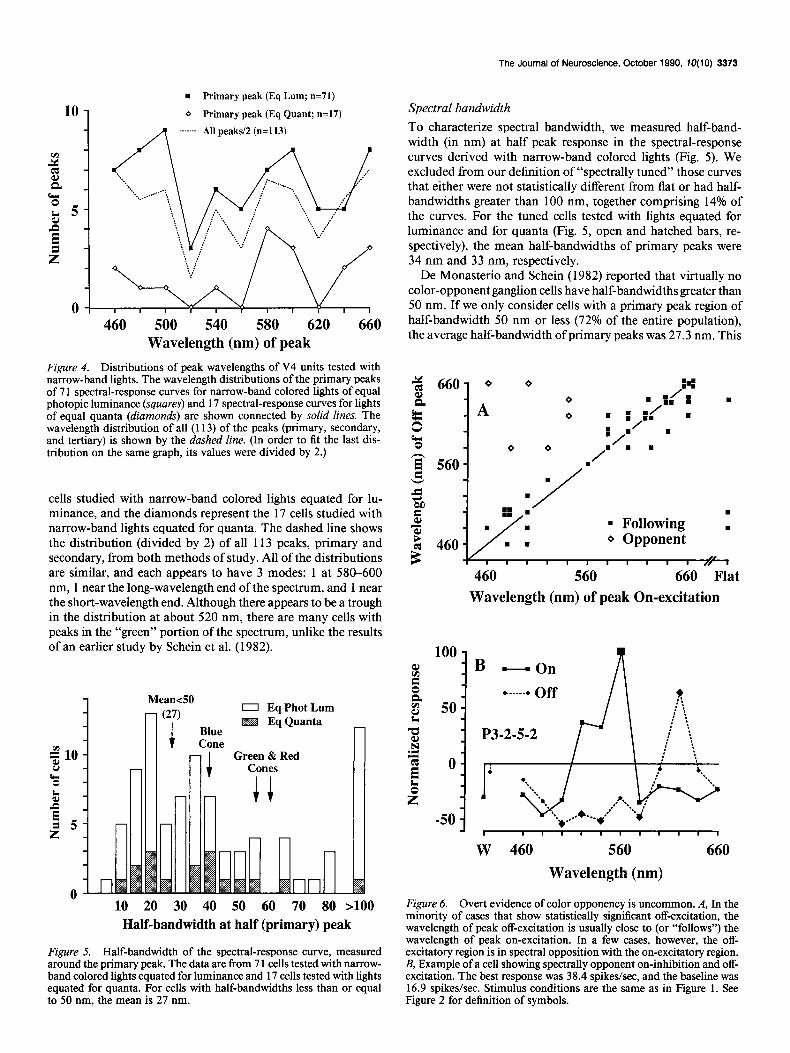
Figure 4. Distributions of peak wavelengths of V4 units tested with narrow-band lights. The wavelength distributions of the primary peaks of 7 1 spectral-response curves for narrow-band colored lights of equal photopic luminance (squares) and 17 spectral-response curves for lights of equal quanta (diamonds) are shown connected by solid lines. The wavelength distribution of all (113) of the peaks (primary, secondary, and tertiary) is shown by the dashed line. (In order to fit the last dis- tribution on the same graph, its values were divided by 2.)
cells studied with narrow-band colored lights equated for lu- minance, and the diamonds represent the 17 cells studied with narrow-band lights equated for quanta. The dashed line shows the distribution (divided by 2) of all 113 peaks, primary and secondary, from both methods of study. All of the distributions are similar, and each appears to have 3 modes: 1 at 580-600 nm, 1 near the long-wavelength end of the spectrum, and 1 near the short-wavelength end. Although there appears to be a trough in the distribution at about 520 nm, there are many cells with peaks in the “green” portion of the spectrum, unlike the results of an earlier study by Schein et al. (1982).
Mean40 0 Eq Phot Lum
Blue Eq Quanta
Cone 1 I Green & Red
20 30 40 50 60 70 80 ~100 Half-bandwidth at-half (primary) peak
Figure 5. Half-bandwidth of the spectral-response curve, measured around the primary peak. The data are from 7 1 cells tested with narrow- band colored lights equated for luminance and 17 cells tested with lights equated for quanta. For cells with half-bandwidths less than or equal to 50 nm, the mean is 27 nm.
Spectral bandwidth
To characterize spectral bandwidth, we measured half-band- width (in nm) at half peak response in the spectral-response curves derived with narrow-band colored lights (Fig. 5). We excluded from our definition of “spectrally tuned” those curves that either were not statistically different from flat or had half- bandwidths greater than 100 nm, together comprising 14% of the curves. For the tuned cells tested with lights equated for luminance and for quanta (Fig. 5, open and hatched bars, re- spectively), the mean half-bandwidths of primary peaks were 34 nm and 33 nm, respectively.
De Monasterio and Schein (1982) reported that virtually no color-opponent ganglion cells have half-bandwidths greater than 50 nm. If we only consider cells with a primary peak region of half-bandwidth 50 nm or less (72% of the entire population), the average half-bandwidth of primary peaks was 27.3 nm. This
3 660 &
8 cr 0
2 560 9
4 4
4 A 4
4 4
. .
:: . /
.
/
. . .
. Following 4 Opponent
.
.
.
B LGat 560
Wavelength (nm) of peak On-excitation
1001
I I I I I I I I
W 460 560 660
Wavelength (nm)
Figure 6. Overt evidence of color opponency is uncommon. A, In the minority of cases that show statistically significant off-excitation, the wavelength of peak off-excitation is usually close to (or “follows”) the wavelength of peak on-excitation. In a few cases, however, the off- excitatory region is in spectral opposition with the on-excitatory region. B, Example of a cell showing spectrally opponent on-inhibition and off- excitation. The best response was 38.4 spikes/set, and the baseline was 16.9 spikes/set. Stimulus conditions are the same as in Figure 1. See Figure 2 for definition of symbols.
3374 Schein and Desimone - Spectral Properties in Area V4
A 100 P3-Z-5-3
r
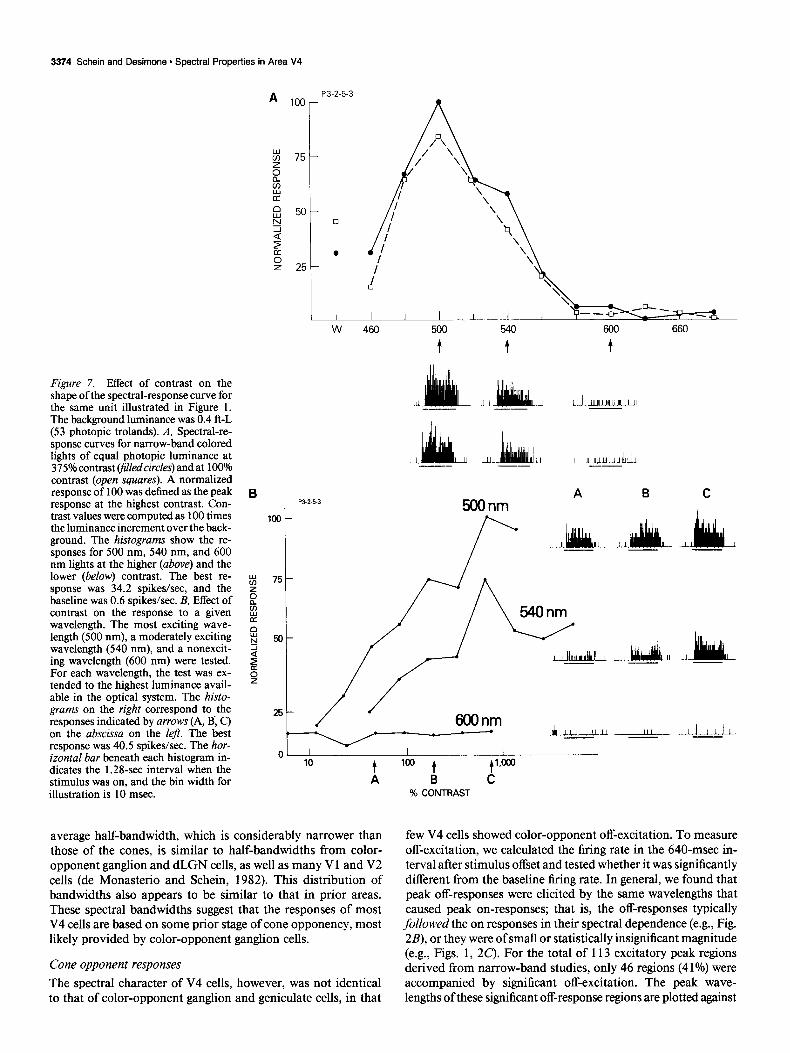
Figure 7. Effect of contrast on the shape of the spectral-response curve for the same unit illustrated in Figure 1. The background luminance was 0.4 ft-L (53 photopic trolands). A, Spectral-re- sponse curves for narrow-band colored lights of equal photopic luminance at 375% contrast (filled circles) and at 100% contrast (open squares). A normalized response of 100 was defined as the peak response at the highest contrast. Con- trast values were computed as 100 times the luminance increment over the back- ground. The histograms show the re- sponses for 500 nm, 540 nm, and 600 nm lights at the higher (above) and the lower (below) contrast. The best re- sponse was 34.2 spikes/set, and the baseline was 0.6 spikes/set. B, Effect of contrast on the response to a given wavelength. The most exciting wave- length (500 nm), a moderately exciting wavelength (540 nm), and a nonexcit- ing wavelength (600 nm) were tested. For each wavelength, the test was ex- tended to the highest luminance avail- able in the optical system. The histo- grams on the right correspond to the responses indicated by arrows (A, B; C) on the abscissa on the left. The best response was 40.5 spikes/set. The hor- izontal bar beneath each histogram in- dicates the 1.28-set interval when the stimulus was on, and the bin width for illustration is 10 msec.
I I I I I I I I --
W 460 500 540 600 660
f t t
% CONTRAST
average half-bandwidth, which is considerably narrower than those of the cones, is similar to half-bandwidths from color- opponent ganglion and dLGN cells, as well as many V 1 and V2 cells (de Monasterio and Schein, 1982). This distribution of bandwidths also appears to be similar to that in prior areas. These spectral bandwidths suggest that the responses of most V4 cells are based on some prior stage of cone opponency, most likely provided by color-opponent ganglion cells.
Cone opponent responses The spectral character of V4 cells, however, was not identical to that of color-opponent ganglion and geniculate cells, in that
few V4 cells showed color-opponent off-excitation. To measure off-excitation, we calculated the firing rate in the 640-msec in- terval after stimulus offset and tested whether it was significantly different from the baseline firing rate. In general, we found that peak off-responses were elicited by the same wavelengths that caused peak on-responses; that is, the off-responses typically followed the on responses in their spectral dependence (e.g., Fig. 2B), or they were of small or statistically insignificant magnitude (e.g., Figs. 1, 2C). For the total of 113 excitatory peak regions derived from narrow-band studies, only 46 regions (4 1%) were accompanied by significant off-excitation. The peak wave- lengths of these significant off-response regions are plotted against
The Journal of Neuroscience, October 1990, IO(10) 3375
Mean = 58.3%
” -40 0 40 80 120 160 200 Normalized response to white light
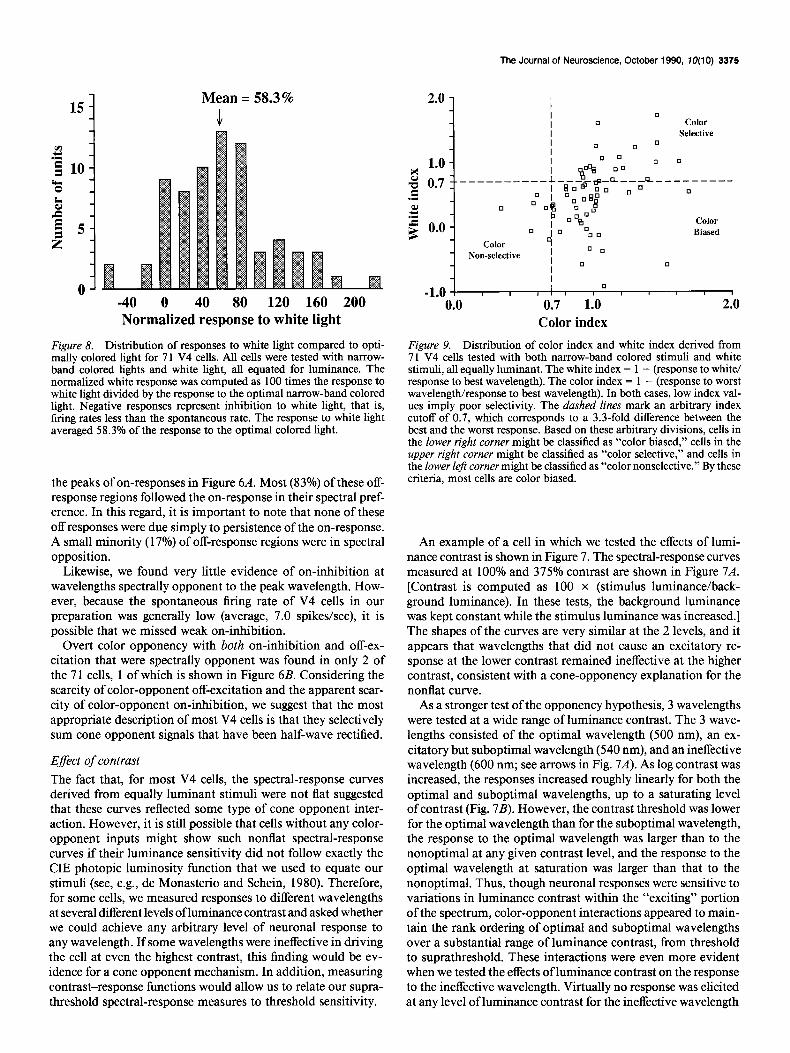
Figure 8. Distribution of responses to white light compared to opti- mally colored light for 71 V4 cells. All cells were tested with narrow- band colored lights and white light, all equated for luminance. The normalized white response was computed as 100 times the response to white light divided by the response to the optimal narrow-band colored light. Negative responses represent inhibition to white light, that is, firing rates less than the spontaneous rate. The response to white light averaged 58.3% of the response to the optimal colored light.
the peaks of on-responses in Figure 6A. Most (83%) of these off- response regions followed the on-response in their spectral pref- erence. In this regard, it is important to note that none of these off responses were due simply to persistence of the on-response. A small minority (17%) of off-response regions were in spectral opposition.
Likewise, we found very little evidence of on-inhibition at wavelengths spectrally opponent to the peak wavelength. How- ever, because the spontaneous firing rate of V4 cells in our preparation was generally low (average, 7.0 spikes/set), it is possible that we missed weak on-inhibition.
Overt color opponency with both on-inhibition and off-ex- citation that were spectrally opponent was found in only 2 of the 7 1 cells, 1 of which is shown in Figure 6B. Considering the scarcity of color-opponent off-excitation and the apparent scar- city of color-opponent on-inhibition, we suggest that the most appropriate description of most V4 cells is that they selectively sum cone opponent signals that have been half-wave rectified.
Effect of contrast The fact that, for most V4 cells, the spectral-response curves derived from equally luminant stimuli were not flat suggested that these curves reflected some type of cone opponent inter- action. However, it is still possible that cells without any color- opponent inputs might show such nonflat spectral-response curves if their luminance sensitivity did not follow exactly the CIE photopic luminosity function that we used to equate our stimuli (see, e.g., de Monasterio and Schein, 1980). Therefore, for some cells, we measured responses to different wavelengths at several different levels of luminance contrast and asked whether we could achieve any arbitrary level of neuronal response to any wavelength. If some wavelengths were ineffective in driving the cell at even the highest contrast, this finding would be ev- idence for a cone opponent mechanism. In addition, measuring contrast-response functions would allow us to relate our supra- threshold spectral-response measures to threshold sensitivity.
2.0 -
1.0 - 3 z 0.7 I- .- 3 f 0.0 -
-. --
0
C010r Biased
-1.0 I I I] I 8 I I I I f 0.0 0.7 1.0 2.0
Color index Figure 9. Distribution of color index and white index derived from 71 V4 cells tested with both narrow-band colored stimuli and white stimuli, all equally luminant. The white index = 1 - (response to white/ response to best wavelength). The color index = 1 - (response to worst wavelength/response to best wavelength). In both cases, low index val- ues imply poor selectivity. The dashed lines mark an arbitrary index cutoff of 0.7, which corresponds to a 3.3-fold difference between the best and the worst response. Based on these arbitrary divisions, cells in the lower right corner might be classified as “color biased,” cells in the upper right corner might be classified as “color selective,” and cells in the lower left corner might be classified as “color nonselective.” By these criteria, most cells are color biased.
An example of a cell in which we tested the effects of lumi- nance contrast is shown in Figure 7. The spectral-response curves measured at 100% and 375% contrast are shown in Figure 7A. [Contrast is computed as 100 x (stimulus luminance/back- ground luminance). In these tests, the background luminance was kept constant while the stimulus luminance was increased.] The shapes of the curves are very similar at the 2 levels, and it appears that wavelengths that did not cause an excitatory re- sponse at the lower contrast remained ineffective at the higher contrast, consistent with a cone-opponency explanation for the nonflat curve.
As a stronger test of the opponency hypothesis, 3 wavelengths were tested at a wide range of luminance contrast. The 3 wave- lengths consisted of the optimal wavelength (500 nm), an ex- citatory but suboptimal wavelength (540 nm), and an ineffective wavelength (600 nm; see arrows in Fig. 7A). As log contrast was increased, the responses increased roughly linearly for both the optimal and suboptimal wavelengths, up to a saturating level of contrast (Fig. 78). However, the contrast threshold was lower for the optimal wavelength than for the suboptimal wavelength, the response to the optimal wavelength was larger than to the nonoptimal at any given contrast level, and the response to the optimal wavelength at saturation was larger than that to the nonoptimal. Thus, though neuronal responses were sensitive to variations in luminance contrast within the “exciting” portion of the spectrum, color-opponent interactions appeared to main- tain the rank ordering of optimal and suboptimal wavelengths over a substantial range of luminance contrast, from threshold to suprathreshold. These interactions were even more evident when we tested the effects of luminance contrast on the response to the ineffective wavelength. Virtually no response was elicited at any level of luminance contrast for the ineffective wavelength
3376 Schein and Desimone * Spectral Properties in Area V4
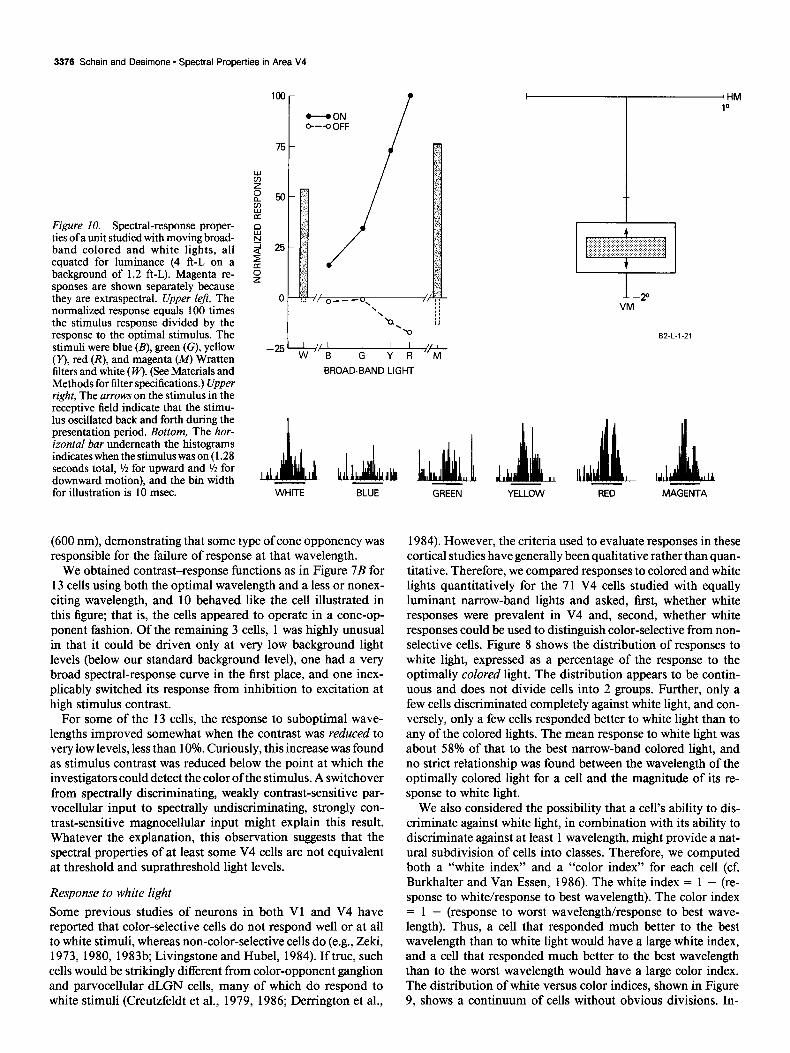
Figure IO. Spectral-response proper- ties of a unit studied with moving broad- band colored and white lights, all equated for luminance (4 ft-L on a background of 1.2 ft-L). Magenta re- sponses are shown separately because they are extraspectral. Upper left, The normalized response equals 100 times the stimulus response divided by the response to the optimal stimulus. The stimuli were blue (B), green (G), yellow (Y), red (R), and magenta (M) Wratten filters and white (FV). (See Materials and Methods for filter specifications.) Upper right, The arrows on the stimulus in the receptive field indicate that the stimu- lus oscillated back and forth during the presentation period. Bottom, The hor- izontal bar underneath the histograms indicates when the stimulus was on (1.28 seconds total, 1/2 for upward and r/z for downward motion), and the bin width for illustration is 10 msec.
I IHM 10
l-20 VM
EnL-1-21 I -25%+B I I I
G Y/ii-
BROAD-BAND LIGHT
WHITE BLUE
(600 nm), demonstrating that some type of cone opponency was responsible for the failure of response at that wavelength.
We obtained contrast-response functions as in Figure 7B for 13 cells using both the optimal wavelength and a less or nonex- citing wavelength, and 10 behaved like the cell illustrated in this figure; that is, the cells appeared to operate in a cone-op- ponent fashion. Of the remaining 3 cells, 1 was highly unusual in that it could be driven only at very low background light levels (below our standard background level), one had a very broad spectral-response curve in the first place, and one inex- plicably switched its response from inhibition to excitation at high stimulus contrast.
For some of the 13 cells, the response to suboptimal wave- lengths improved somewhat when the contrast was reduced to very low levels, less than 10%. Curiously, this increase was found as stimulus contrast was reduced below the point at which the investigators could detect the color ofthe stimulus. A switchover from spectrally discriminating, weakly contrast-sensitive par- vocellular input to spectrally undiscriminating, strongly con- trast-sensitive magnocellular input might explain this result. Whatever the explanation, this observation suggests that the spectral properties of at least some V4 cells are not equivalent at threshold and suprathreshold light levels.
Response to white light Some previous studies of neurons in both Vl and V4 have reported that color-selective cells do not respond well or at all to white stimuli, whereas non-color-selective cells do (e.g., Zeki, 1973, 1980, 1983b; Livingstone and Hubel, 1984). If true, such cells would be strikingly different from color-opponent ganglion and parvocellular dLGN cells, many of which do respond to white stimuli (Creutzfeldt et al., 1979, 1986; Derrington et al.,
GREEN YELLOW RED MAGENTA
1984). However, the criteria used to evaluate responses in these cortical studies have generally been qualitative rather than quan- titative. Therefore, we compared responses to colored and white lights quantitatively for the 71 V4 cells studied with equally luminant narrow-band lights and asked, first, whether white responses were prevalent in V4 and, second, whether white responses could be used to distinguish color-selective from non- selective cells. Figure 8 shows the distribution of responses to white light, expressed as a percentage of the response to the optimally colored light. The distribution appears to be contin- uous and does not divide cells into 2 groups. Further, only a few cells discriminated completely against white light, and con- versely, only a few cells responded better to white light than to any of the colored lights. The mean response to white light was about 58% of that to the best narrow-band colored light, and no strict relationship was found between the wavelength of the optimally colored light for a cell and the magnitude of its re- sponse to white light.
We also considered the possibility that a cell’s ability to dis- criminate against white light, in combination with its ability to discriminate against at least 1 wavelength, might provide a nat- ural subdivision of cells into classes. Therefore, we computed both a “white index” and a “color index” for each cell (cf. Burkhalter and Van Essen, 1986). The white index = 1 - (re- sponse to white/response to best wavelength). The color index = 1 - (response to worst wavelength/response to best wave- length). Thus, a cell that responded much better to the best wavelength than to white light would have a large white index, and a cell that responded much better to the best wavelength than to the worst wavelength would have a large color index. The distribution of white versus color indices, shown in Figure 9, shows a continuum of cells without obvious divisions. In-

terestingly, the distribution of values in V4 is very similar to that shown for cells in V2 and VP by Burkhalter and Van Essen (1986, their figure 12). Arbitrary criteria could be applied to the V4 distribution, such as dividing the distribution at an index of 0.7 along the white- and color-response axes, and then the population could be grouped into what has been called “color biased” (lower right region in Fig. 8; Zeki, 1977; Schein et al., 1982; Burkhalter and Van Essen, 1986), nonselective (lower left region), and (presumably) more color-selective classes (upper right region). By this analysis, the bulk of the cells were color biased.
Response to broad-band colored lights Cells are often surveyed for “color selectivity” by qualitative evaluation of responses to broad-band colored lights (including some of the previous studies that reported widely discrepant percentages of color-selective cells in V4). Therefore, as a com- parison with our narrow-band data, we obtained spectral-re- sponse curves for 64 V4 cells with broad-band colored lights equated for luminance. Consistent with our narrow-band re- sults, the results showed, first, that most V4 cells provide evi- dence of color-opponent interactions, and second, that the cells did not fall naturally into “color-selective” and “nonselective” classes. Many cells could be classified either way, depending on criteria.
The cell illustrated in Figure 10 is typical in that it was excited to some extent by the onset of all of the colored stimuli but responded better to some than to others. The response was best for red and poorest for blue, suggesting color-opponent inter- actions, but signs of overt color opponency, on-inhibition or off-excitation, were absent. The cell responded well to white light, though not as well as to the optimally colored light, also consistent with our narrow-band results.
Given typical spectral-response curves like that in Figure 10, we would expect to find that many V4 cells showed color se- lectivity in the sense of discriminating against some of the 6 broad-band lights. Whether this prediction is confirmed de- pends critically on the criterion chosen to decide whether or not a cell discriminates against a broad-band colored light. For ex- ample, if we defined discrimination against a stimulus as a re- sponse that was less than half the response to the best stimulus, then a very high percentage (92%) of the cells discriminated against at least 1 of the broad-band lights (Fig. 11A) and there- fore might be considered color selective by this criterion. How- ever, if we defined discrimination to mean a response that was less than 5: or % of the response to the best stimulus, then substantially fewer (73% or 5 l%, respectively) of the cells could be said to discriminate.
If we added selectivity against white light as a criterion for “color selectivity,” even fewer cells would meet the definition. Indeed, across all the cells, the response to white light averaged 60% of the response to the best broad-band colored light, vir- tually the same average we found in our narrow-band data.
In total, then, these results show how, on the basis of the same data, one could arrive at very different proportions of color- selective cells, depending on the criteria used to classify them. The problem is undoubtedly compounded when the responses to broad-band lights are evaluated subjectively or when cells are classified without explicit criteria.
Aside from the issue of classification, our incidence results also allow us to estimate, across the population of V4 cells, the probability that a V4 cell will respond to 1 of the broad-band
The Journal of Neuroscience, October 1990, fO(l0) 3377
Incidence of discrimination against at least 1 stimulus (“color-selective”)
100 1
0
Criterion for “poor” response
100
1 B
W B G
-
- - -
Y R M Broad band filter
Figure II. A, Percentages ofV4 units that discriminate against at least 1 broad-band colored stimulus. A total of 64 cells were tested with blue, green, yellow, red, and magenta broad-band lights equated for lumi- nance. (See Materials and Methods for filter specifications.) Responses to each stimulus (times 100) were divided by the response to the best stimulus. Bars indicate the percentage of cells that failed to give the criterion (20%, 331, or SOOh) response to at least 1 of the stimuli. As the criterion is changed, the percentage of “color-selective” cells changes accordingly. B, Incidence of cells that give the criterion response (?k , %, or % of the best) for each of the broad-band colored stimuli we used: blue (B), green (G), yellow (I’), red (R), and magenta (M), as well as white light (w).
filters (Fig. 11B). The results clearly show that most V4 cells give at least a small response to many broad-band chromatic and achromatic lights. Given the fact that natural surfaces also have a broad spectral composition, the results suggest that any given V4 cell is very likely to give at least a small response to many of the different chromatic and achromatic surfaces in a natural scene.
3378 Schein and Desimone - Spectral Properties in Area V4
Vary surround 600 nm tickler/ alone Varv surround
Vary receptive field alone
IHM -6 ’
Re0EdJve
P3-3-9-3 ’ 100 -
6’
A
HM 0
* 1111 II I I I Ii I Ill Ill1 I I1
W 460 660 W 460 660 W 460 640
Wavelength (nm) Wavelength (nm) Wavelength (nm)
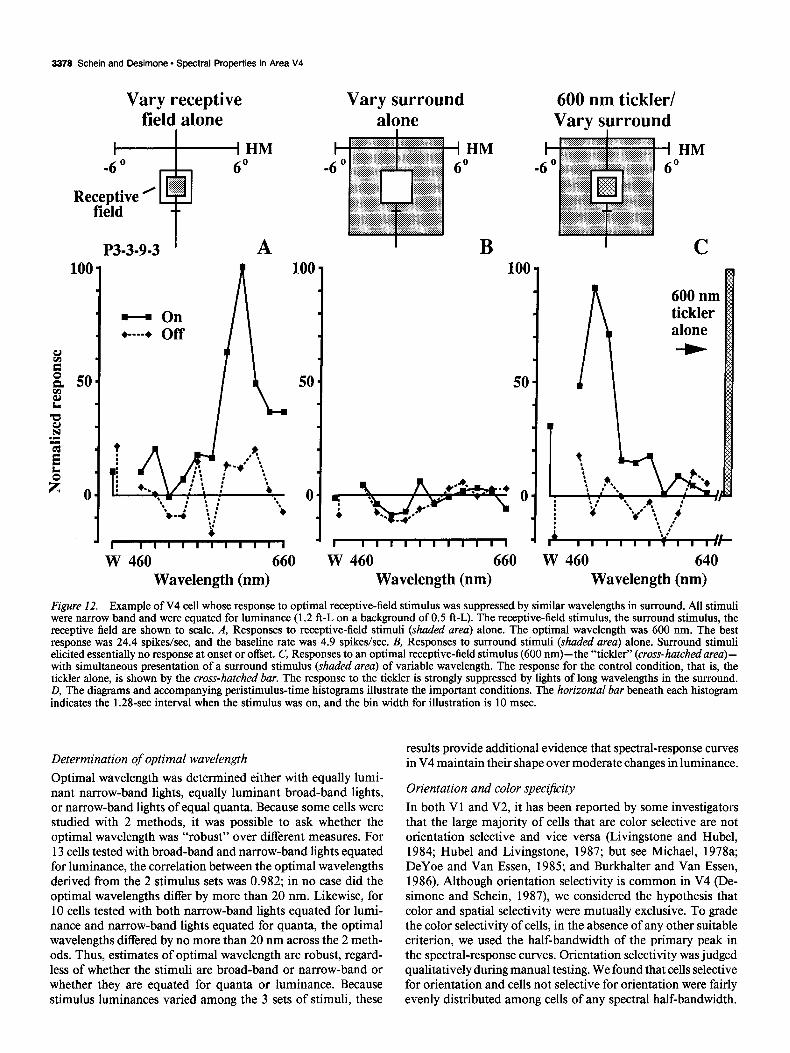
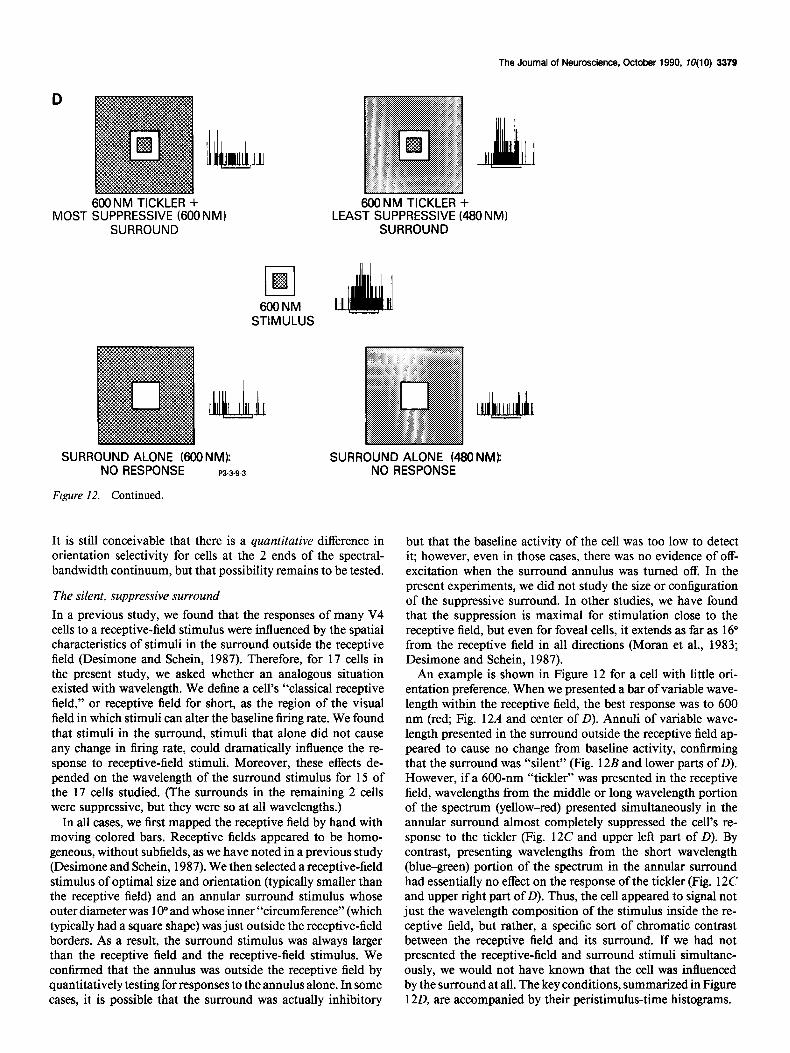
Figure 12. Example of V4 cell whose response to optimal receptive-field stimulus was suppressed by similar wavelengths in surround. AU stimuli were narrow band and were equated for luminance (1.2 f&L on a background of 0.5 ft-L). The receptive-field stimulus, the surround stimulus, the receptive field are shown to scale. A, Responses to receptive-field stimuli (shaded area) alone. The optimal wavelength was 600 nm. The best response was 24.4 spikes/set, and the baseline rate was 4.9 spikes/set. B, Responses to surround stimuli (shaded area) alone. Surround stimuli elicited essentially no response at onset or offset. C, Responses to an optimal receptive-field stimulus (600 nm)-the “tickler” (cross-hatchedarea)- with simultaneous presentation of a surround stimulus (shaded urea) of variable wavelength. The response for the control condition, that is, the tickler alone, is shown by the cross-hatched bar. The response to the tickler is strongly suppressed by lights of long wavelengths in the surround. D, The diagrams and accompanying peristimulus-time histograms illustrate the important conditions. The horizontal bar beneath each histogram indicates the 1.28-set interval when the stimulus was on. and the bin width for illustration is 10 msec.
Determination of optimal wavelength Optimal wavelength was determined either with equally lumi- nant narrow-band lights, equally luminant broad-band lights, or narrow-band lights of equal quanta. Because some cells were studied with 2 methods, it was possible to ask whether the optimal wavelength was “robust” over different measures. For 13 cells tested with broad-band and narrow-band lights equated for luminance, the correlation between the optimal wavelengths derived from the 2 stimulus sets was 0.982; in no case did the optimal wavelengths differ by more than 20 nm. Likewise, for 10 cells tested with both narrow-band lights equated for lumi- nance and narrow-band lights equated for quanta, the optimal wavelengths differed by no more than 20 nm across the 2 meth- ods. Thus, estimates of optimal wavelength are robust, regard- less of whether the stimuli are broad-band or narrow-band or whether they are equated for quanta or luminance. Because stimulus luminances varied among the 3 sets of stimuli, these
results provide additional evidence that spectral-response curves in V4 maintain their shape over moderate changes in luminance.
Orientation and color specijicity In both Vl and V2, it has been reported by some investigators that the large majority of cells that are color selective are not orientation selective and vice versa (Livingstone and Hubel, 1984; Hubel and Livingstone, 1987; but see Michael, 1978a; DeYoe and Van Essen, 1985; and Burkhalter and Van Essen, 1986). Although orientation selectivity is common in V4 (De- simone and Schein, 1987), we considered the hypothesis that color and spatial selectivity were mutually exclusive. To grade the color selectivity of cells, in the absence of any other suitable criterion, we used the half-bandwidth of the primary peak in the spectral-response curves. Orientation selectivity was judged qualitatively during manual testing. We found that cells selective for orientation and cells not selective for orientation were fairly evenly distributed among cells of any spectral half-bandwidth.
The Journal of Neuroscience, October 1990, fO(10) 3379
600 NM TICKLER + MOST SUPPRESSIVE (600 NM)
SURROUND
600NM TICKLER + LEAST SUPPRESSIVE (480 NM)
SURROUND
600 NM STIMULUS
SURROUND ALONE (600 NM): NO RESPONSE P3-3-S-3
Figure 12. Continued.
SURROUND ALONE (480 NM): NO RESPONSE
It is still conceivable that there is a quantitative difference in orientation selectivity for cells at the 2 ends of the spectral- bandwidth continuum, but that possibility remains to be tested.
The silent, suppressive surround In a previous study, we found that the responses of many V4 cells to a receptive-field stimulus were influenced by the spatial characteristics of stimuli in the surround outside the receptive field (Desimone and Schein, 1987). Therefore, for 17 cells in the present study, we asked whether an analogous situation existed with wavelength. We define a cell’s “classical receptive field,” or receptive field for short, as the region of the visual field in which stimuli can alter the baseline firing rate. We found that stimuli in the surround, stimuli that alone did not cause any change in firing rate, could dramatically influence the re- sponse to receptive-field stimuli. Moreover, these effects de- pended on the wavelength of the surround stimulus for 15 of the 17 cells studied. (The surrounds in the remaining 2 cells were suppressive, but they were so at all wavelengths.)
In all cases, we first mapped the receptive field by hand with moving colored bars. Receptive fields appeared to be homo- geneous, without subfields, as we have noted in a previous study (Desimone and Schein, 1987). We then selected a receptive-field stimulus of optimal size and orientation (typically smaller than the receptive field) and an annular surround stimulus whose outer diameter was 10” and whose inner “circumference” (which typically had a square shape) was just outside the receptive-field borders. As a result, the surround stimulus was always larger than the receptive field and the receptive-field stimulus. We confirmed that the annulus was outside the receptive field by quantitatively testing for responses to the annulus alone. In some cases, it is possible that the surround was actually inhibitory
but that the baseline activity of the cell was too low to detect it; however, even in those cases, there was no evidence of off- excitation when the surround annulus was turned off. In the present experiments, we did not study the size or configuration of the suppressive surround. In other studies, we have found that the suppression is maximal for stimulation close to the receptive field, but even for fovea1 cells, it extends as far as 16” from the receptive field in all directions (Moran et al., 1983; Desimone and Schein, 1987).
An example is shown in Figure 12 for a cell with little ori- entation preference. When we presented a bar of variable wave- length within the receptive field, the best response was to 600 nm (red, Fig. 12A and center of D). Annuli of variable wave- length presented in the surround outside the receptive field ap- peared to cause no change from baseline activity, confirming that the surround was “silent” (Fig. 12B and lower parts of D). However, if a 600-nm “tickler” was presented in the receptive field, wavelengths from the middle or long wavelength portion of the spectrum (yellow-red) presented simultaneously in the annular surround almost completely suppressed the cell’s re- sponse to the tickler (Fig. 12C and upper left part of D). By contrast, presenting wavelengths from the short wavelength (bluegreen) portion of the spectrum in the annular surround had essentially no effect on the response of the tickler (Fig. 12C and upper right part of D). Thus, the cell appeared to signal not just the wavelength composition of the stimulus inside the re- ceptive field, but rather, a specific sort of chromatic contrast between the receptive field and its surround. If we had not presented the receptive-field and surround stimuli simultane- ously, we would not have known that the cell was influenced by the surround at all. The key conditions, summarized in Figure 120, are accompanied by their peristimulus-time histograms.
3380 Schein and Desimone - Spectral Properties in Area V4
Vary receptive Vary surround field alone alone
t i HM 6'
100 - 100 - 100 - . - On . c-4 off
24
3 a E 50. I 50 SO-
640 nm tickler/ Vary surround
1 ; (JfT..~~**** ; *p& yl . . A.4 T l . -*.++’ *. .’
* -‘* *
“u -*.*--
I11111111111 I I I I I I I I I I I1
440 640 440 640 44dF
Wavelength (nm) Wavelength (nm) Wavelength (nm)
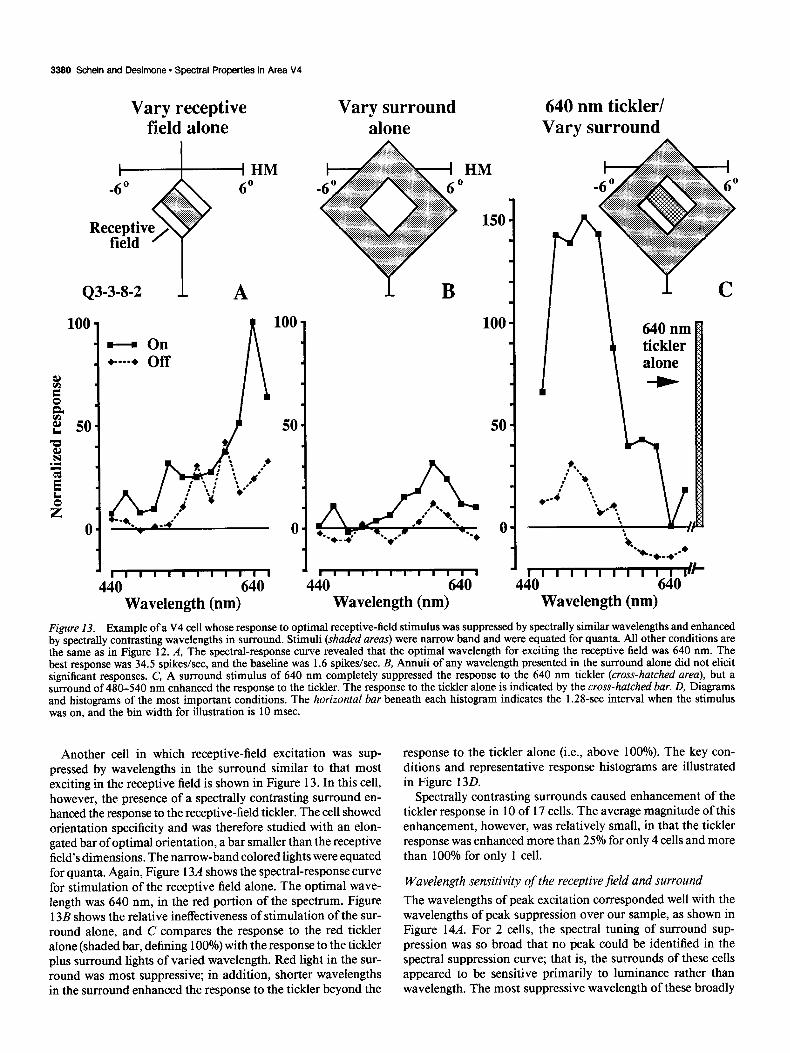
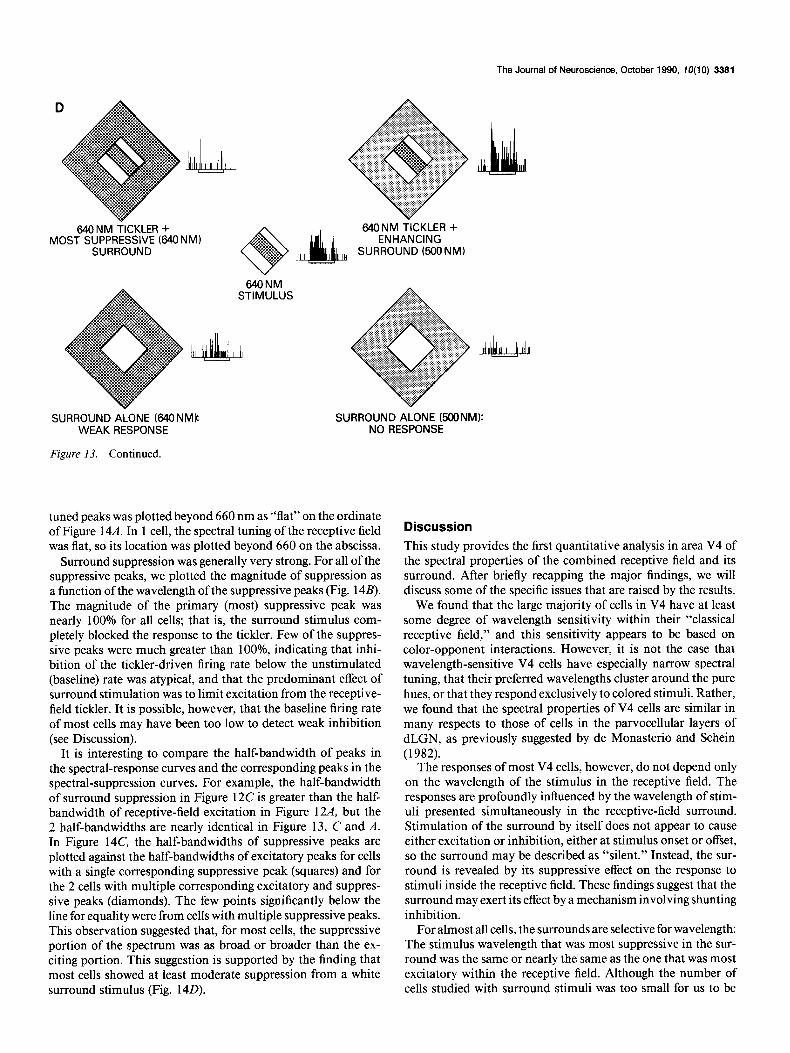
Figure 13. Example of a V4 cell whose response to optimal receptive-field stimulus was suppressed by spectrally similar wavelengths and enhanced by spectrally contrasting wavelengths in surround. Stimuli (shaded areas) were narrow band and were equated for quanta. All other conditions are the same as in Figure 12. A, The spectral-response curve revealed that the optimal wavelength for exciting the receptive field was 640 nm. The best response was 34.5 spikes/set, and the baseline was 1.6 spikes/set. B, Annuli of any wavelength presented in the surround alone did not elicit significant responses. C, A surround stimulus of 640 nm completely suppressed the response to the 640 nm tickler (cross-hatched area), but a surround of 480-540 nm enhanced the response to the tickler. The response to the tickler alone is indicated by the cross-hatched bar. D, Diagrams and histograms of the most important conditions. The horizontal bar beneath each histogram indicates the 1.2%set interval when the stimulus was on, and the bin width for illustration is 10 msec.
Another cell in which receptive-field excitation was sup- pressed by wavelengths in the surround similar to that most exciting in the receptive field is shown in Figure 13. In this cell, however, the presence of a spectrally contrasting surround en- hanced the response to the receptive-field tickler. The cell showed orientation specificity and was therefore studied with an elon- gated bar of optimal orientation, a bar smaller than the receptive field’s dimensions. The narrow-band colored lights were equated for quanta. Again, Figure 13A shows the spectral-response curve for stimulation of the receptive field alone. The optimal wave- length was 640 nm, in the red portion of the spectrum. Figure 13B shows the relative ineffectiveness of stimulation of the sur- round alone, and C compares the response to the red tickler alone (shaded bar, defining 100%) with the response to the tickler plus surround lights of varied wavelength. Red light in the sur- round was most suppressive; in addition, shorter wavelengths in the surround enhanced the response to the tickler beyond the
response to the tickler alone (i.e., above 100%). The key con- ditions and representative response histograms are illustrated in Figure 130.
Spectrally contrasting surrounds caused enhancement of the tickler response in 10 of 17 cells. The average magnitude of this enhancement, however, was relatively small, in that the tickler response was enhanced more than 25% for only 4 cells and more than 100% for only 1 cell.
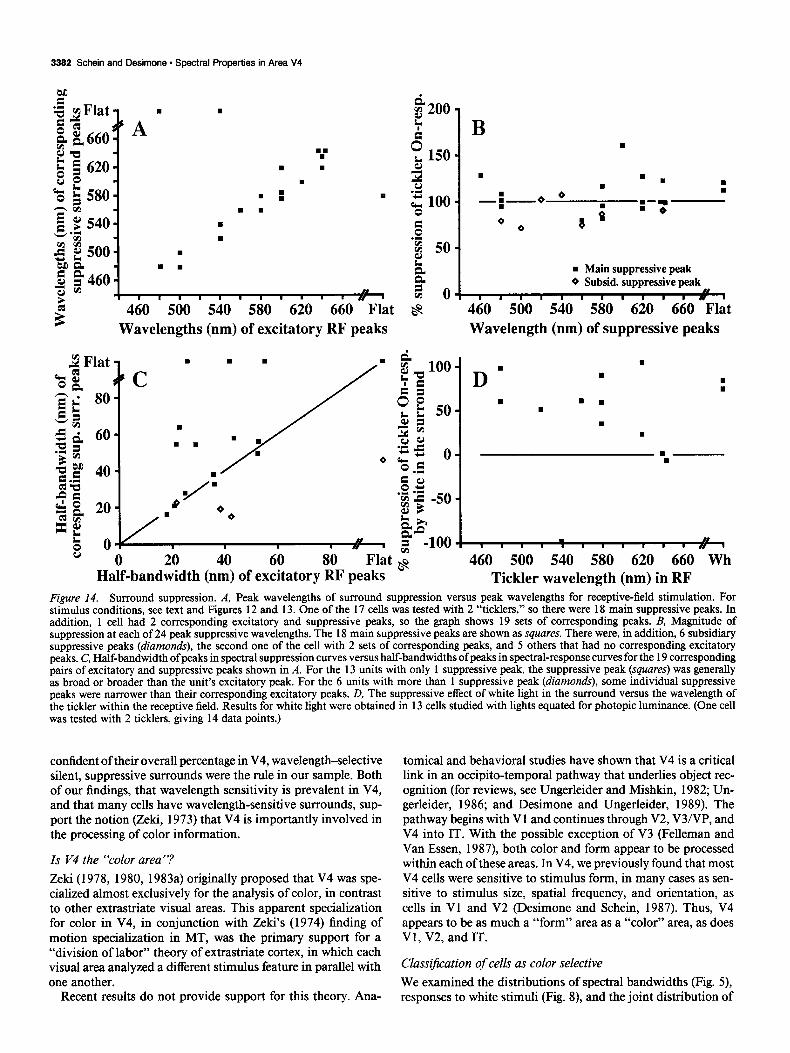
Wavelength sensitivity of the receptive$eld and surround The wavelengths of peak excitation corresponded well with the wavelengths of peak suppression over our sample, as shown in Figure 14A. For 2 cells, the spectral tuning of surround sup- pression was so broad that no peak could be identified in the spectral suppression curve; that is, the surrounds of these cells appeared to be sensitive primarily to luminance rather than wavelength. The most suppressive wavelength of these broadly
The Journal of Neuroscience, October 1990, 70(10) 3381
640 NM TICKLER + MOST SUPPRESSIVE (640 NM)
SURROUND
640NM STIMULUS
640 NM ~CKLER + ENHANCING
L SURROUND (5OONM)
SURROUND ALONE (640 NM): WEAK RESPONSE
Figure 13. Continued.
SURROUND ALONE 6OONM): NO RESPONSE
tuned peaks was plotted beyond 660 nm as “flat” on the ordinate of Figure 14A. In 1 cell, the spectral tuning of the receptive field was flat, so its location was plotted beyond 660 on the abscissa.
Surround suppression was generally very strong. For all of the suppressive peaks, we plotted the magnitude of suppression as a function of the wavelength of the suppressive peaks (Fig. 14B). The magnitude of the primary (most) suppressive peak was nearly 100% for all cells; that is, the surround stimulus com- pletely blocked the response to the tickler. Few of the suppres- sive peaks were much greater than lOO%, indicating that inhi- bition of the tickler-driven firing rate below the unstimulated (baseline) rate was atypical, and that the predominant effect of surround stimulation was to limit excitation from the receptive- field tickler. It is possible, however, that the baseline firing rate of most cells may have been too low to detect weak inhibition (see Discussion).
It is interesting to compare the half-bandwidth of peaks in the spectral-response curves and the corresponding peaks in the spectral-suppression curves. For example, the half-bandwidth of surround suppression in Figure 12C is greater than the half- bandwidth of receptive-field excitation in Figure 12A, but the 2 half-bandwidths are nearly identical in Figure 13, C and A. In Figure 14C, the half-bandwidths of suppressive peaks are plotted against the half-bandwidths of excitatory peaks for cells with a single corresponding suppressive peak (squares) and for the 2 cells with multiple corresponding excitatory and suppres- sive peaks (diamonds). The few points significantly below the line for equality were from cells with multiple suppressive peaks. This observation suggested that, for most cells, the suppressive portion of the spectrum was as broad or broader than the ex- citing portion. This suggestion is supported by the finding that most cells showed at least moderate suppression from a white surround stimulus (Fig. 140).
Discussion
This study provides the first quantitative analysis in area V4 of the spectral properties of the combined receptive field and its surround. After briefly recapping the major findings, we will discuss some of the specific issues that are raised by the results.
We found that the large majority of cells in V4 have at least some degree of wavelength sensitivity within their “classical receptive field,” and this sensitivity appears to be based on color-opponent interactions. However, it is not the case that wavelength-sensitive V4 cells have especially narrow spectral tuning, that their preferred wavelengths cluster around the pure hues, or that they respond exclusively to colored stimuli. Rather, we found that the spectral properties of V4 cells are similar in many respects to those of cells in the parvocellular layers of dLGN, as previously suggested by de Monasterio and Schein (1982).
The responses of most V4 cells, however, do not depend only on the wavelength of the stimulus in the receptive field. The responses are profoundly influenced by the wavelength of stim- uli presented simultaneously in the receptive-field surround. Stimulation of the surround by itself does not appear to cause either excitation or inhibition, either at stimulus onset or offset, so the surround may be described as “silent.” Instead, the sur- round is revealed by its suppressive effect on the response to stimuli inside the receptive field. These findings suggest that the surround may exert its effect by a mechanism involving shunting inhibition.
For almost all cells, the surrounds are selective for wavelength: The stimulus wavelength that was most suppressive in the sur- round was the same or nearly the same as the one that was most excitatory within the receptive field. Although the number of cells studied with surround stimuli was too small for us to be
3382 Schein and Desimone - Spectral Properties in Area V4
E E ‘+ mFlat - ‘+ ~Flat - E& E& 0: 0: aa aa
?“A’ ’ ?“A’ ’ Ma Ma g 5 620. g 5 620.
‘: . .
o;? o;? . "0 go- "0 3580- . : . . nm nm g $540. g $540.
. . .
V'G; V’G; . 3 E 500. 3 E 500. . . is% is% . . . . Q, 1460. Q, a 460. z* z* m m 2 2
I I I I I I I I I I I ,, 1 I I I I I I I I I I I ,, 1 460 460 500 500 540 540 580 580 620 620 660 660 Flat Flat
Wavelengths (nm) of excitatory RF peaks
.
. n .
. . q
/
n .
. 0
.
B .
.
-
8 460 500 540 580 620 660 Flat Wavelength (nm) of suppressive peaks
B 0 0 20 40 60 80 Flat
Half-bandwidth (nm) of excitatory RF peaks 8 I
. . .
.
.
1, 111.1111,,1”,
460 500 540 580 620 660 Wh Tickler wavelength (nm) in RF
Figure 14. Surround suppression. A, Peak wavelengths of surround suppression versus peak wavelengths for receptive-field stimulation. For stimulus conditions, see text and Figures 12 and 13. One of the 17 cells was tested with 2 “ticklers,” so there were 18 main suppressive peaks. In addition, 1 cell had 2 corresponding excitatory and suppressive peaks, so the graph shows 19 sets of corresponding peaks. B, Magnitude of suppression at each of 24 peak suppressive wavelengths. The 18 main suppressive peaks are shown as squares. There were, in addition, 6 subsidiary suppressive peaks (diamonds), the second one of the cell with 2 sets of corresponding peaks, and 5 others that had no corresponding excitatory peaks. C, Half-bandwidth of peaks in spectral suppression curves versus half-bandwidths of peaks in spectral-response curves for the 19 corresponding pairs of excitatory and suppressive peaks shown in A. For the 13 units with only 1 suppressive peak, the suppressive peak (squares) was generally as broad or broader than the unit’s excitatory peak. For the 6 units with more than 1 suppressive peak (diamonds), some individual suppressive peaks were narrower than their corresponding excitatory peaks. D, The suppressive effect of white light in the surround versus the wavelength of the tickler within the receptive field. Results for white light were obtained in 13 cells studied with lights equated for photopic luminance. (One cell was tested with 2 ticklers, giving 14 data points.)
confident of their overall percentage in V4, wavelength-selective silent, suppressive surrounds were the rule in our sample. Both of our findings, that wavelength sensitivity is prevalent in V4, and that many cells have wavelength-sensitive surrounds, sup- port the notion (Z&i, 1973) that V4 is importantly involved in the processing of color information.
Is V4 the “‘color area”?
Zeki (1978, 1980, 1983a) originally proposed that V4 was spe- cialized almost exclusively for the analysis of color, in contrast to other extrastriate visual areas. This apparent specialization for color in V4, in conjunction with Z&i’s (1974) finding of motion specialization in MT, was the primary support for a “division of labor” theory of extrastriate cortex, in which each visual area analyzed a different stimulus feature in parallel with one another.
Recent results do not provide support for this theory. Ana-
tomical and behavioral studies have shown that V4 is a critical link in an occipito-temporal pathway that underlies object rec- ognition (for reviews, see Ungerleider and Mishkin, 1982; Un- gerleider, 1986; and Desimone and Ungerleider, 1989). The pathway begins with Vl and continues through V2, VUVP, and V4 into IT. With the possible exception of V3 (Fellernan and Van Essen, 1987), both color and form appear to be processed within each of these areas. In V4, we previously found that most V4 cells were sensitive to stimulus form, in many cases as sen- sitive to stimulus size, spatial frequency, and orientation, as cells in Vl and V2 (Desimone and Schein, 1987). Thus, V4 appears to be as much a “form” area as a “color” area, as does V 1, V2, and IT.
Classification of cells as color selective
We examined the distributions of spectral bandwidths (Fig. 5), responses to white stimuli (Fig. S), and the joint distribution of
The Journal of Neuroscience, October 1990, 70(10) 3393
selectivity for wavelength versus selectivity against white light (Fig. 9) and none revealed any natural division of V4 cells into color-selective or nonselective categories. A similar conclusion was reached regarding cells in V2 and VP by Burkhalter and Van Essen (1986). Furthermore, very few cells in V4 showed “overt” evidence for color opponency, such as spectrally op- ponent on-inhibition or off-excitation. Given the use of quali- tative criteria for classifying cells, the absence of natural divi- sions, and the paucity of cells showing “classic” overt color opponency, it is not surprising that previous studies arrived at widely discrepant percentages of “color-selective” cells in V4.
On the one hand, based on the near absence of overt oppo- nency or the fact that most cells give a qualitatively “good” response both to white stimuli and to the majority of the broad- band colored stimuli, one could conclude that most V4 cells are not “color-selective.” On the other hand, based on the preva- lence of tuned (nonflat) spectral-response curves or the fact that most cells respond better to an optimally colored stimulus than to a white stimulus of equal luminance, one could conclude that the large majority are indeed “color selective.” In this regard, it should be noted that disagreement over the incidence and nature of color selectivity has not been restricted to area V4. In V 1, for example, values for the incidence of color-selective cells have varied from a few percent (Hubel and Wiesel, 1968) to over 90% (Thorell et al., 1984).
Our view is that classification of cells as either color-selective or nonselective is not very useful and may ultimately be mis- leading. Such a classification implies the existence of a theory that specifies the neuronal properties that are required for color vision. Moreover, “color vision” is important for more than just the appearance of object colors. Other functions, including figure/ground separation based on color differences and wave- length discrimination, depend on color vision as well. Until a general theory of color vision is developed, we believe it is more useful to describe the full range of spectral properties of cells, measured quantitatively, than to force cells into color-selective and nonselective classes.
The nature of the input to V4 cells Excluding very broadly tuned cells, the mean half-bandwidth of the primary peak in V4 spectral-response curves was 27 nm, a value similar to that of color-opponent ganglion and parvo- cellular dLGN cells. These results confirm the bandwidth dis- tributions of Zeki (1980) and Schein et al. (1982) for the portion of the V4 population they termed color selective. These narrow half-bandwidths, in conjuction with the color-opponent inter- actions we found in intensity-response studies, suggest that V4 cells sum inputs ultimately deriving from color-opponent cells in the parvocellular dLGN. Because few V4 cells show overt color-opponent responses such as spectrally opponent on-in- hibition or off-excitation, whatever overt color-opponent re- sponses exist in the dLGN must become half-wave rectified somewhere along the pathway to V4.
It is interesting to consider how many dLGN cells might contribute to a V4 receptive field. The line that best fit our receptive-field data for the representation of the central 5” in V4 is 0.42 x (eccentricity + 1.57”) (Desimone and Schein, 1987). This line gives a receptive field size of 0.66” on a side for a V4 receptive field centered at 0” eccentricity. By compar- ison, cone separation in the macaque fovea is about 0.01”. Be- cause the density ratio of fovea1 ganglion cells to cones is 2 or slightly more than 2, enough for a pair of on-center and off-
center ganglion cells to connect to each single cone (Schein, 1988; Schein and Klug, 1990), the visual field separation of fovea1 (on- or off-center) ganglion cells is also about 0.01”. Therefore, a V4 receptive field can pool from several thousands-662 in this example-of ganglion cells.
For slightly more than one-quarter of the V4 cells in our sample, the spectral-response curves had more than a single peak excitatory region, and combinations of peaks appeared fairly random (Figs. 2, 3). Whereas it is possible that some of the cells with optimal wavelengths in both the short and the long ends of the spectrum (e.g., Fig. 2A) received input derived from “magenta/green” ganglion cells (de Monasterio et al., 1975a,b; de Monasterio, 1979), the remainder of the cells with 2 or more optimal wavelengths cannot be explained so simply. Moreover, the bandwidths of the secondary response peaks were similar to that of color-opponent cells in the dLGN. Taken together, this evidence suggests that V4 cells ultimately sum signals not only from a fairly large number of color-opponent ganglion cells with the same spectral preference, but also in some cases from ganglion cells with different spectral preferences. This latter summation may originate in V 1, where many cells also have more than 1 preferred spectral region (Thorell et al., 1984; Lennie et al., 1990).
Although V4 cells receive little or no direct input from color- opponent dLGN cells, it is instructive to imagine how a V4 receptive field could be constructed from such input. We take, as an example, a V4 cell that responds best to long wavelengths. As a first step, we suppose that the output of the Type I R-on- center/G-off-surround (+R/-G) dLGN cells in a region could be pooled, as diagrammed in Figure 154. With the classical receptive fields of V4 cells so much larger than those of V 1 and dLGN cells, such a pooling over many dLGN cells must take place at somestage. The receptive field of the resulting cell would have a large center with spatially coextensive (+R-G) color opponency and would, in that respect, resemble Type II ganglion cells. A hypothetical cell with such pooled input would respond to achromatic stimuli confined to the receptive-field center to the extent that many dLGN cells do.
One set of cortical properties the model does not easily explain is the loss of color-opponent on-inhibition, the loss of color- opponent off-responses, and the presence of spectrally following off-responses, at least by the level of V4. A reduction in spon- taneous activity between the LGN and the cortex, or a variation in neutral point among +R/-G cells “feeding” cortical cells (De Valois et al., 1966; Wiesel and Hubel, 1966; de Monasterio and Gouras, 1975; de Monasterio et al., 1975a; De Valois and De Valois, 1975; Marrocco and De Valois, 1977; Creutzfeldt et al., 1979; Zrenner, 1983) might contribute to these differences between the cortex and the LGN, but the issue deserves further study. In any case, because inhibitory responses are largely lost at some point along the pathway to V4, we show a hypothetical spectral-response curve in Figure 15A with only excitatory re- sponses in the red portion of the spectrum.
The hypothetical cell in Figure 15A would also have a fairly narrow, pure -G surround. The -G surround would appear spectrally broad band, because the G-cone absorption spectrum is quite broad. The surround would also appear spatially narrow, because the aggregate center would dwarf the surround in size. This cell may not be entirely hypothetical, as Ts’o and his col- leagues (Ts’o et al., 1986; Ts’o and Gilbert, 1988) described cells in the cytochrome oxidase-rich blob regions of V 1 as “modified Type II” cells, with coextensive color opponency in the center
3384 Schein and Desimone l Spectral Properties in Area V4
A
0 0 +R
-G Type 1
Coextensive cone
opponency (Modified or ‘plain’ TYPe 11)
60 0 -G +R @jcO 0 +G
-R
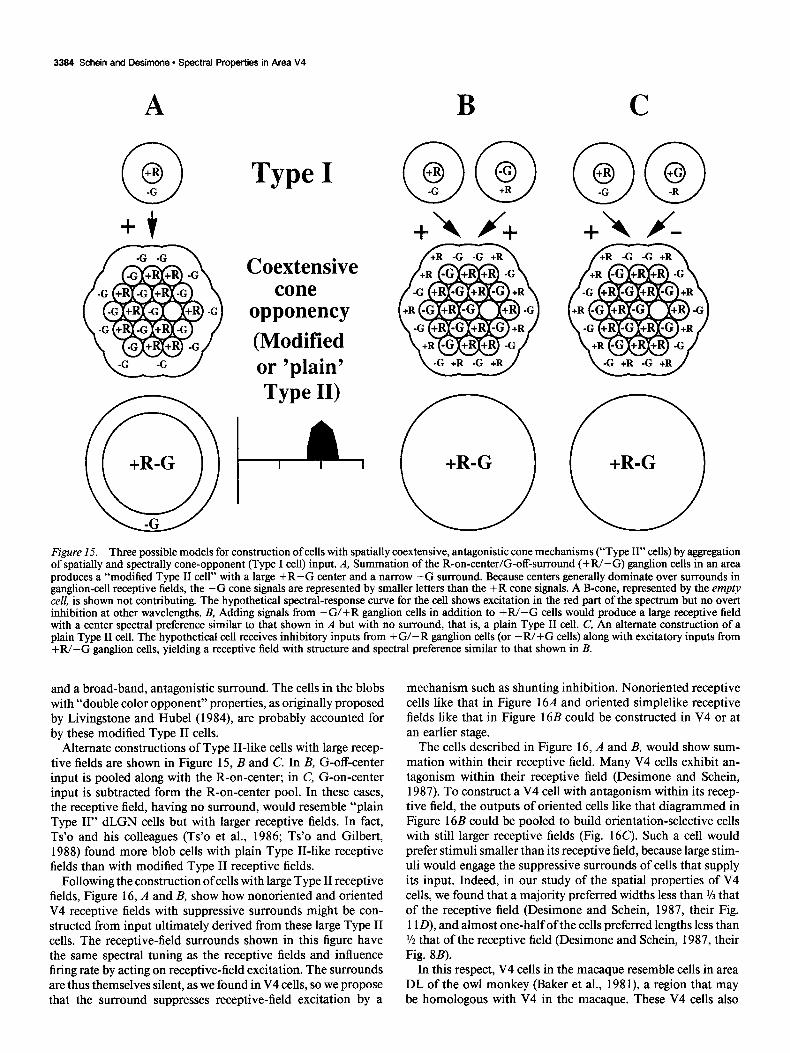
Figure 15. Three possible models for construction of cells with spatially coextensive, antagonistic cone mechanisms (“Type II” cells) by aggregation of spatially and spectrally cone-opponent (Type I cell) input. A, Summation of the R-on-center/G-off-surround (+R/-G) ganglion cells in an area produces a “modified Type II cell” with a large +R-G center and a narrow -G surround. Because centers generally dominate over surrounds in ganglion-cell receptive fields, the -G cone signals are represented by smaller letters than the +R cone signals. A B-cone, represented by the empty cell, is shown not contributing. The hypothetical spectral-response curve for the cell shows excitation in the red part of the spectrum but no overt inhibition at other wavelengths. B, Adding signals from -G/+R ganglion cells in addition to +W-G cells would produce a large receptive field with a center spectral preference similar to that shown in A but with no surround, that is, a plain Type II cell. C, An alternate construction of a plain Type II cell. The hypothetical cell receives inhibitory inputs from +G/-R ganglion cells (or -R/+G cells) along with excitatory inputs from +R/-G ganglion cells, yielding a receptive field with structure and spectral preference similar to that shown in B.
and a broad-band, antagonistic surround. The cells in the blobs with “double color opponent” properties, as originally proposed by Livingstone and Hubel (1984) are probably accounted for by these modified Type II cells.
Alternate constructions of Type II-like cells with large recep- tive fields are shown in Figure 15, B and C. In B, G-off-center input is pooled along with the R-on-center; in C, G-on-center input is subtracted form the R-on-center pool. In these cases, the receptive field, having no surround, would resemble “plain Type II” dLGN cells but with larger receptive fields. In fact, Ts’o and his colleagues (Ts’o et al., 1986; Ts’o and Gilbert, 1988) found more blob cells with plain Type II-like receptive fields than with modified Type II receptive fields.
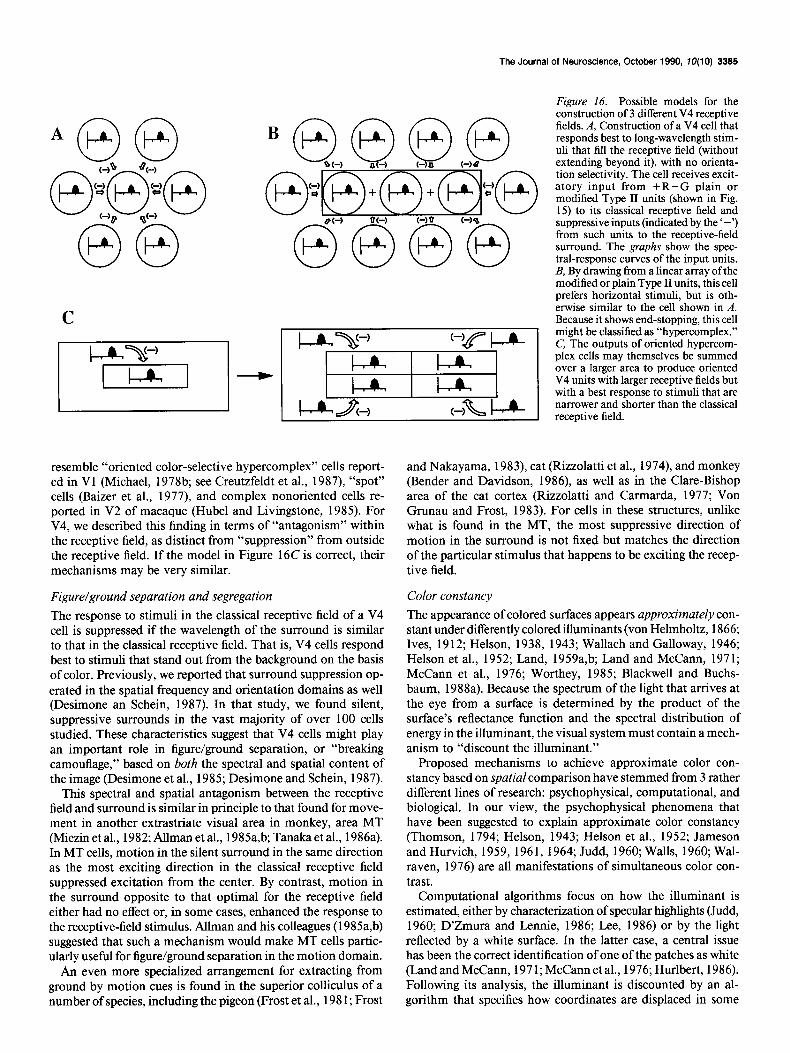
Following the construction of cells with large Type II receptive fields, Figure 16, A and B, show how nonoriented and oriented V4 receptive fields with suppressive surrounds might be con- structed from input ultimately derived from these large Type II cells. The receptive-field surrounds shown in this figure have the same spectral tuning as the receptive fields and influence firing rate by acting on receptive-field excitation. The surrounds are thus themselves silent, as we found in V4 cells, so we propose that the surround suppresses receptive-field excitation by a
mechanism such as shunting inhibition. Nonoriented receptive cells like that in Figure 16A and oriented simplelike receptive fields like that in Figure 16B could be constructed in V4 or at an earlier stage.
The cells described in Figure 16, A and B, would show sum- mation within their receptive field. Many V4 cells exhibit an- tagonism within their receptive field (Desimone and Schein, 1987). To construct a V4 cell with antagonism within its recep- tive field, the outputs of oriented cells like that diagrammed in Figure 16B could be pooled to build orientation-selective cells with still larger receptive fields (Fig. 16C). Such a cell would prefer stimuli smaller than its receptive field, because large stim- uli would engage the suppressive surrounds of cells that supply its input. Indeed, in our study of the spatial properties of V4 cells, we found that a majority preferred widths less than % that of the receptive field (Desimone and Schein, 1987, their Fig. 1 lD), and almost one-half of the cells preferred lengths less than % that of the receptive field (Desimone and Schein, 1987, their Fig. 8B).
In this respect, V4 cells in the macaque resemble cells in area DL of the owl monkey (Baker et al., 198 l), a region that may be homologous with V4 in the macaque. These V4 cells also
The Journal of Neuroscience, October 1990, IO(10) 3385
resemble “oriented color-selective hypercomplex” cells report- ed in Vl (Michael, 1978b; see Creutzfeldt et al., 1987), “spot” cells (Baizer et al., 1977), and complex nonoriented cells re- ported in V2 of macaque (Hubel and Livingstone, 1985). For V4, we described this finding in terms of “antagonism” within the receptive field, as distinct from “suppression” from outside the receptive field. If the model in Figure 16C is correct, their mechanisms may be very similar.
Figure/ground separation and segregation
The response to stimuli in the classical receptive field of a V4 cell is suppressed if the wavelength of the surround is similar to that in the classical receptive field. That is, V4 cells respond best to stimuli that stand out from the background on the basis of color. Previously, we reported that surround suppression op- erated in the spatial frequency and orientation domains as well (Desimone an Schein, 1987). In that study, we found silent, suppressive surrounds in the vast majority of over 100 cells studied. These characteristics suggest that V4 cells might play an important role in figure/ground separation, or “breaking camouflage,” based on both the spectral and spatial content of the image (Desimone et al., 1985; Desimone and Schein, 1987).
This spectral and spatial antagonism between the receptive field and surround is similar in principle to that found for move- ment in another extrastriate visual area in monkey, area MT (Miezin et al., 1982; Allman et al., 1985a,b, Tanaka et al., 1986a). In MT cells, motion in the silent surround in the same direction as the most exciting direction in the classical receptive field suppressed excitation from the center. By contrast, motion in the surround opposite to that optimal for the receptive field either had no effect or, in some cases, enhanced the response to the receptive-field stimulus. Allman and his colleagues (1985a,b) suggested that such a mechanism would make MT cells partic- ularly useful for figure/ground separation in the motion domain.
An even more specialized arrangement for extracting from ground by motion cues is found in the superior colliculus of a number of species, including the pigeon (Frost et al., 198 1; Frost
Figure 16. Possible models for the construction of 3 different V4 receptive fields. A, Construction of a V4 cell that responds best to long-wavelength stim- uli that fill the receptive field (without extending beyond it), with no orienta- tion selectivity. The cell receives excit- atory input from +R-G plain or modified Type II units (shown in Fig. 15) to its classical receptive field and suppressive inputs (indicated by the ‘-‘) from such units to the receptive-field surround. The graphs show the spec- tral-response curves of the input units. B, By drawing from a linear array of the modified or plain Type II units, this cell prefers horizontal stimuli, but is oth- erwise similar to the cell shown in A. Because it shows end-stopping, this cell might be classified as “hypercomplex.” C, The outputs of oriented hypercom- plex cells may themselves be summed over a larger area to produce oriented V4 units with larger receptive fields but with a best response to stimuli that are narrower and shorter than the classical receptive field.
and Nakayama, 1983) cat (Rizzolatti et al., 1974), and monkey (Bender and Davidson, 1986), as well as in the Clare-Bishop area of the cat cortex (Rizzolatti and Carmarda, 1977; Von Grunau and Frost, 1983). For cells in these structures, unlike what is found in the MT, the most suppressive direction of motion in the surround is not fixed but matches the direction of the particular stimulus that happens to be exciting the recep- tive field.
Color constancy
The appearance of colored surfaces appears approximately con- stant under differently colored illuminants (von Helmholtz, 1866; Ives, 19 12; Helson, 1938, 1943; Wallach and Galloway, 1946; Helson et al., 1952; Land, 1959a,b; Land and McCann, 1971; McCann et al., 1976; Worthey, 1985; Blackwell and Buchs- baum, 1988a). Because the spectrum of the light that arrives at the eye from a surface is determined by the product of the surface’s reflectance function and the spectral distribution of energy in the illuminant, the visual system must contain a mech- anism to “discount the illuminant.”
Proposed mechanisms to achieve approximate color con- stancy based on spatial comparison have stemmed from 3 rather different lines of research: psychophysical, computational, and biological. In our view, the psychophysical phenomena that have been suggested to explain approximate color constancy (Thomson, 1794; Helson, 1943; Helson et al., 1952; Jameson and Hurvich, 1959, 1961, 1964; Judd, 1960; Walls, 1960; Wal- raven, 1976) are all manifestations of simultaneous color con- trast.
Computational algorithms focus on how the illuminant is estimated, either by characterization of specular highlights (Judd, 1960; D’Zmura and Lennie, 1986; Lee, 1986) or by the light reflected by a white surface. In the latter case, a central issue has been the correct identification of one of the patches as white (LandandMcCann, 1971; McCannet al., 1976; Hurlbert, 1986). Following its analysis, the illuminant is discounted by an al- gorithm that specifies how coordinates are displaced in some
3366 Schein and Desimone * Spectral Properties in Area V4
color space (Helson, 1943; Judd, 1940, 1960; Jameson and Hurvich, 1959, 1961).
The biological structure that might support these psycho- physical and computational explanations have often been of secondary interest to their originators and may in some cases be difficult to imagine (e.g., Brainard and Wandell, 1986; Ma- loney, 1986; Maloney and Wandell, 1986). The particular virtue of some recent “biological” models (Horn, 1974; Land, 1986b; Hurlbert and Poggio, 1988) incorporating comparison between a receptive field and a large surrounding zone, is their biological realizability. Though the literature appears to emphasize dif- ferences and controversy, we find much that is in agreement between the different approaches. Specifically, the center/large surround models may be seen as providing the biological sub- strate for a Judd/Helson algorithm (Judd, 1960) based on si- multaneous color contrast (Jameson and Hurvich, 1959).
In Land’s color-lightness model, lights from a test patch and surrounding colored surfaces are viewed through 3 fixed color filters (e.g., red, green, and blue). For each of the 3 color filters, comparison of the amount of light from the test patch with the amount of light from the surrounding region provides 1 of the color-lightness values. The triplet of color-lightness values (e.g., red, green, and blue) determines the perceived color of the test patch. These models work best if the “averaged” reflectance function in the visual image is neutral (gray) so that the space- averaged color would approximate the illuminant (Hurlbert, 1986).
Whereas Land’s early models (1959b, 1977, 1983, 1986a) emphasized accumulation of lightness changes across bound- aries, his most recent model is closer to a center/surround re- ceptive-field organization (Land, 1986b), as noted above. This center/surround organization is also closer to psychophysical measurements of the effectiveness of surrounds with distance from the test patch (Jameson and Hurvich, 1959, 1961; Wal- raven, 1973; Blackwell and Buchsbaum, 1988b).
Is color constancy established in V4? Zeki (1980, 1983b,c) reported that V4 but not Vl cells dis- counted the illuminant; that is, a cell that preferred a red patch to a green one did so regardless of the color of the light illu- minating the patches, and therefore regardless of the actual spec- tral composition of light reaching the eye from the red patch. The receptive-field organization reported here may provide the mechanism that explains Zeki’s result. V4 surrounds are quite large. We reported suppressive effects of stimulation that ex- tended 16” beyond the classical receptive fields of fovea1 V4 cells (Moran et al., 1983; Desimone and Schein, 1987). The large red-biased surround of a red-biased V4 cell could be the mech- anism that determines the average amount of red over a large area of the visual image. Such a cell would compare the redness in its classical receptive field with the average redness of the image and, in so doing, discount an approximation of the red- ness of the illuminant. The cell could be regarded as a “red lightness meter.”
In Land’s description, the lightness meters are constructed by placing a color filter, a red one, for example, over the receptive field and the same (red) filter over the suppressive surround. A color filter is, of course, a fixed mechanism. If V4 cells partic- ipate in a Land-type mechanism for color constancy, we would therefore expect that the spectral tuning of surround suppression in V4 cells also would be fixed, rather than dependent on the wavelength of light that happens to excite the receptive field. This prediction remains to be tested.
It might be imagined that the most direct test of whether V4 plays a critical role in the computation of color constancy would be to remove V4 and test whether color constancy is lost in the absence of any impairment in hue discrimination. However, the fact that V4 is a critical relay in the occipito-temporal pathway that links VI with the IT cortex, in conjunction with the fact that this pathway is critically involved in object recognition, suggests that a lesion of V4 might have far more serious effects on color vision than a loss of color constancy alone. In fact, behavioral studies of animals with V4 lesions have reached differing conclusions. Removal of the part of V4 representing the lower visual field resulted in a transient impairment of color constancy but not hue discrimination or form discrimination in 2 animals tested with free gaze (Wild et al., 1985). With either more extensive lesions or with stimuli confined to the portion of the visual-field representation removed in V4, impairments were found in both hue and form discrimination (Heywood and Cowey, 1987; R. Desimone et al., 1990).
A more subtle way to test the importance of V4 for color constancy is suggested by the fact that the large suppressive surrounds of V4 cells generally extend in all directions from the classical receptive field, including across the vertical meridian into the ipsilateral visual hemifield (Moran et al., 1983; Desi- mone and Schein, 1987). Correspondingly, unlike the case for Vl or V2, V4 has widespread callosal inputs that are not con- fined to just the cortex in which receptive fields include the representation of the vertical meridian, (Van Essen and Zeki, 1978; Van Essen et al., 1982; Kennedy et al., 1986). We found that for V4 cells with receptive fields in the central 5” of the visual field, the surrounds often extended as far as 16” into the ipsilateral visual field, and the ipsilateral portions of these sur- rounds were eliminated following section of the corpus callosum (Moran et al., 1983). Because V4 but not IT is retinotopically organized, we believe that the ipsilateral part of the suppressive surround derives from V4 cortex in the opposite hemisphere. By extension, we suggest that the contralateral part of the sur- round derives from V4 cells in the same hemisphere.
If V4 suppressive surrounds were responsible for discounting the illuminant, then the above results and our primate model predict that individuals without a functioning corpus callosum would lose approximate color constancy across the midline. Precisely this result has been reported (Land et al., 1983). Chal- lenged with different illuminants, normal individuals correctly identified the color of a test patch on one side of the vertical meridian even if all of the usual complex mix of colored patches (a “Mondrian”) were on the other side. An individual with agenesis of the corpus callosum, however, failed to achieve ap- proximate color constancy of the test patch unless the Mondrian was in the same visual hemifield. Thus, anatomical, physiolog- ical, and neuropsychological evidence suggests that V4 is the site of the computation that discounts the illuminant. We can- not, however, rule out the possibility that color constancy may be established in several stages spanning Vl-V4, nor can we rule out contributions from areas that are as yet poorly under- stood, such as area TEO (Boussaoud et al., 1990).
Finally, the color of a surface is not provided by a single color- lightness value, but by at least a triplet of lightness values. We have no evidence bearing on the question of how and where integration of the data from several lightness meters takes place. Moreover, chromatic response functions (“redness,” “blue- ness,” etc., as a function of wavelength; Hurvich and Jameson, 195 5; Jameson and Hurvich, 195 5) do not match the spectral- sensitivity curves of color-opponent ganglion cells. For instance,
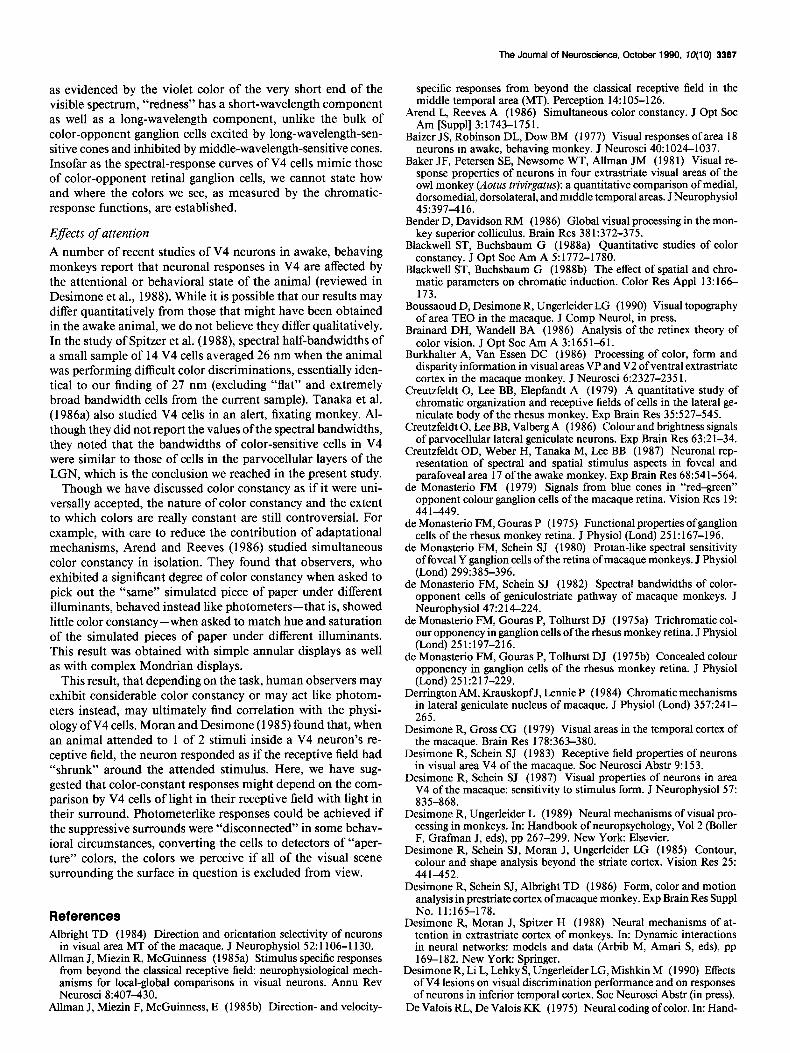
The Journal of Neuroscience, October 1990, 70(10) 3397
as evidenced by the violet color of the very short end of the visible spectrum, “redness” has a short-wavelength component as well as a long-wavelength component, unlike the bulk of color-opponent ganglion cells excited by long-wavelength-sen- sitive cones and inhibited by middle-wavelength-sensitive cones. Insofar as the spectral-response curves of V4 cells mimic those of color-opponent retinal ganglion cells, we cannot state how and where the colors we see, as measured by the chromatic- response functions, are established.
Eflects of attention
A number of recent studies of V4 neurons in awake, behaving monkeys report that neuronal responses in V4 are affected by the attentional or behavioral state of the animal (reviewed in Desimone et al., 1988). While it is possible that our results may differ quantitatively from those that might have been obtained in the awake animal, we do not believe they differ qualitatively. In the study of Spitzer et al. (1988), spectral half-bandwidths of a small sample of 14 V4 cells averaged 26 nm when the animal was performing difficult color discriminations, essentially iden- tical to our finding of 27 nm (excluding “flat” and extremely broad bandwidth cells from the current sample). Tanaka et al. (1986a) also studied V4 cells in an alert, fixating monkey. Al- though they did not report the values of the spectral bandwidths, they noted that the bandwidths of color-sensitive cells in V4 were similar to those of cells in the parvocellular layers of the LGN, which is the conclusion we reached in the present study.
Though we have discussed color constancy as if it were uni- versally accepted, the nature of color constancy and the extent to which colors are really constant are still controversial. For example, with care to reduce the contribution of adaptational mechanisms, Arend and Reeves (1986) studied simultaneous color constancy in isolation. They found that observers, who exhibited a significant degree of color constancy when asked to pick out the “same” simulated piece of paper under different illuminants, behaved instead like photometers-that is, showed little color constancy-when asked to match hue and saturation of the simulated pieces of paper under different illuminants. This result was obtained with simple annular displays as well as with complex Mondrian displays.
This result, that depending on the task, human observers may exhibit considerable color constancy or may act like photom- eters instead, may ultimately find correlation with the physi- ology of V4 cells. Moran and Desimone (1985) found that, when an animal attended to 1 of 2 stimuli inside a V4 neuron’s re- ceptive field, the neuron responded as if the receptive field had “shrunk” around the attended stimulus. Here, we have sug- gested that color-constant responses might depend on the com- parison by V4 cells of light in their receptive field with light in their surround. Photometerlike responses could be achieved if the suppressive surrounds were “disconnected” in some behav- ioral circumstances, converting the cells to detectors of “aper- ture” colors, the colors we perceive if all of the visual scene surrounding the surface in question is excluded from view.
References Albright TD (1984) Direction and orientation selectivity of neurons
in visual area MT of the macaque. J Neurophysiol 52: 1106-l 130. Allman J, Miezin R, McGuinness (1985a) Stimulus specific responses
from beyond the classical receptive field: neurophysiological mech- anisms for local-global comparisons in visual neurons. Annu Rev Neurosci 8:407-430.
Allman J, Miezin F, McGuinness, E (1985b) Direction- and velocity-
specific responses from beyond the classical receptive field in the middle temporal area (MT). Perception 14: 105-l 26.
Arend L, Reeves A (1986) Simultaneous color constancy. J Opt Sot Am [Suppl] 3:1743-1751.
Baizer JS, Robinson DL, Dow BM (1977) Visual responses of area 18 neurons in awake. behavina monkev. J Neurosci 40:1024-1037.
Baker JF, Petersen SE, New&me WT; Allman JM (198 1) Visual re- sponse properties of neurons in four extrastriate visual areas of the owl monkey (Lotus trivirgutus): a quantitative comparison of medial, dorsomedial, dorsolateral, and middle temporal areas. J Neurophysiol 45:397416.
Bender D, Davidson RM (1986) Global visual processing in the mon- key superior colliculus. Brain Res 38 1:372-375.
Blackwell ST, Buchsbaum G (1988a) Quantitative studies of color constancy. J Opt Sot Am A 5:1772-1780.
Blackwell ST, Buchsbaum G (1988b) The effect of spatial and chro- matic parameters on chromatic induction. Color Res Appl 13: 166- 173.
Boussaoud D, Desimone R, Ungerleider LG (1990) Visual topography of area TEO in the macaque. J Comp Neurol, in press.
Brainard DH, Wandell BA (1986) Analysis of the retinex theory of color vision. J Opt Sot Am A 3: 165 l-6 1.
Burkhalter A, Van Essen DC (1986) Processing of color, form and disparity information in visual areas VP and V2 of ventral extrastriate cortex in the macaque monkey. J Neurosci 6:2327-235 1.
Creutzfeldt 0, Lee BB, Elepfandt A (1979) A quantitative study of chromatic organization and receptive fields of cells in the lateral ge- niculate body of the rhesus monkey. Exp Brain Res 35:527-545.
Creutzfeldt 0, Lee BB, Valberg A (1986) Colour and brightness signals of parvocellular lateral geniculate neurons. Exp Brain Res 63:21-34.
Creutzfeldt OD, Weber H, Tanaka M, Lee BB (1987) Neuronal rep- resentation of spectral and spatial stimulus aspects in fovea1 and parafoveal area 17 of the awake monkey. Exp Brain Res 68:54 l-564.
de Monasterio FM (1979) Signals from blue cones in “red-green” opponent colour ganglion cells of the macaque retina. Vision Res 19: 441-449.
de Monasterio FM, Gouras P ( 1975) Functional properties of ganglion cells of the rhesus monkev retina. J Phvsiol (Land) 25 1: 167-l 96.
de Monasterio FM, Schein SJ (1980) Protan:like spectral sensitivity of fovea1 Y ganglion cells of the retina of macaque monkeys. J Physiol (Lond) 299:385-396.
de Monasterio FM, Schein SJ (1982) Spectral bandwidths of color- opponent cells of geniculostriate pathway of macaque monkeys. J Neurophysiol47:2 14-224.
de Monasterio FM, Gouras P, Tolhurst DJ (1975a) Trichromatic col- our opponency in ganglion cells ofthe rhesus monkey retina. J Physiol (Lond) 251:197-216.
de Monasterio FM, Gouras P, Tolhurst DJ (1975b) Concealed colour opponency in ganglion cells of the rhesus monkey retina. J Physiol (Lond) 251:217-229.
Derrington AM, Krauskopf J, Lennie P (1984) Chromatic mechanisms in lateral geniculate nucleus of macaque. J Physiol (Lond) 357:241- 265.
Desimone R, Gross CG ( 1979) Visual areas in the temporal cortex of the macaque. Brain Res 178:363-380.
Desimone R, Schein SJ (1983) Receptive field properties of neurons in visual area V4 of the macaque. Sot Neurosci Abstr 9: 153.
Desimone R, Schein SJ (1987) Visual properties of neurons in area V4 of the macaque: sensitivity to stimulus form. J Neurophysiol57: 835-868.
Desimone R, Ungerleider L (1989) Neural mechanisms of visual pro- cessing in monkeys. In: Handbook of neuropsychology, Vo12 (Boller F, Grafman J, eds), pp 267-299. New York: Elsevier.
Desimone R, Schein SJ, Moran J, Ungerleider LG (1985) Contour, colour and shape analysis beyond the striate cortex. Vision Res 25: 441-452.
Desimone R, Schein SJ, Albright TD (1986) Form, color and motion analysis in prestriate cortex of macaque monkey. Exp Brain Res Suppl No. 11:165-178.
Desimone R, Moran J, Spitzer H (1988) Neural mechanisms of at- tention in extrastriate cortex of monkeys. In: Dynamic interactions in neural networks: models and data (Arbib M, Amari S, eds), pp 169-182. New York: Springer.
Desimone R, Li L, Lehky S, Ungerleider LG, Mishkin M (1990) Effects of V4 lesions on visual discrimination performance and on responses of neurons in inferior temporal cortex. Sot Neurosci Abstr (in press).
De Valois RL, De Valois KK (1975) Neural coding of color. In: Hand-
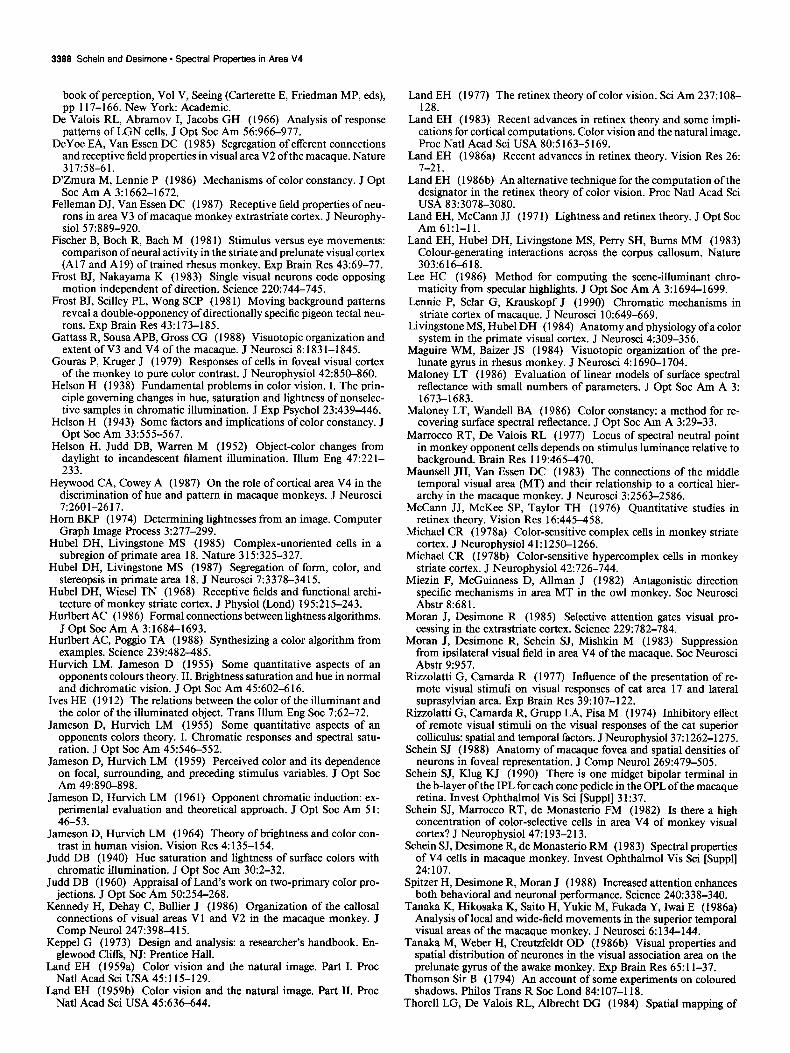
3388 Schein and Desimone - Spectral Properties in Area V4
book of perception, Vol V, Seeing (Carterette E, Friedman MP, eds), pp 117-166. New York: Academic.
De Valois RL, Abramov I, Jacobs GH (1966) Analysis of response patterns of LGN cells. J Opt Sot Am 56:966-977.
DeYoe EA, Van Essen DC (1985) Segregation of efferent connections and receptive field properties in visual area V2 ofthe macaque. Nature 317:58-61.
D’Zmura M, Lennie P (1986) Mechanisms of color constancy. J Opt Sot Am A 3:1662-1672.
Felleman DJ, Van Essen DC (1987) Receptive field properties of neu- rons in area V3 of macaque monkey extrastriate cortex. J Neurophy- siol 57~889-920.
Fischer B, Both R, Bach M (198 1) Stimulus versus eye movements: comparison of neural activity in the striate and prelunate visual cortex (Al7 and A19) of trained rhesus monkev. Exv Brain Res 43169-77.
Frost BJ, Nakayama K (1983) Single visual neurons code opposing motion independent of direction. Science 220~744-745.
Frost BJ, Scilley PL, Wong SCP (198 1) Moving background patterns reveal a double-opponency of directionally specific pigeon tectal neu- rons. Exp Brain Res 43:173-185.
Gattass R, Sousa APB, Gross CG (1988) Visuotopic organization and extent of V3 and V4 of the macaque. J Neurosci 8: 183 1-1845.
Gouras P, Kruger J (1979) Responses of cells in fovea1 visual cortex of the monkey to pure color contrast. J Neurophysiol42:850-860.
Helson H (1938) Fundamental problems in color vision. I. The prin- ciple governing changes in hue, saturation and lightness of nonselec- tive samples in chromatic illumination. J Exp Psycho1 23:439446.
Helson H (1943) Some factors and implications of color constancy. J Opt Sot Am 33:555-567.
Helson H, Judd DB, Warren M (1952) Object-color changes from daylight to incandescent filament illumination. Illum Eng 47:221- 233.
Heywood CA, Cowey A ( 1987) On the role of cortical area V4 in the discrimination of hue and pattern in macaque monkeys. J Neurosci 7:2601-2617.
Horn BKP (1974) Determining lightnesses from an image. Computer Graph Image Process 3:277-299.
Hubel DH, Livingstone MS (1985) Complex-unoriented cells in a subregion of primate area 18. Nature 3 15:325-327.
Hubel DH, Livingstone MS (1987) Segregation of form, color, and stereopsis in primate area 18. J Neurosci 7:3378-3415.
Hubel DH, Wiesel TN (1968) Receptive fields and functional archi- tecture of monkey striate cortex. J Physiol (Lond) 195:215-243.
Hurlbert AC (1986) Formal connections between lightness algorithms. J Opt Sot Am A 3:1684-1693.
Hurlbert AC, Poggio TA (1988) Synthesizing a color algorithm from examples. Science 239:482-485.
and dichromatic vision.. J Opt Sot Am 45:602-6 16. Ives HE (19 12) The relations between the color of the illuminant and
the color of the illuminated object. Trans Illum Eng Sot 7:62-72. Jameson D, Hurvich LM (1955) Some quantitative aspects of an
Hurvich LM, Jameson D (1955) Some quantitative aspects of an opponents colours theory. II. Brightness saturation and hue in normal
Land EH (1977) The retinex theory of color vision. Sci Am 237: 108- 128.
Land EH (1983) Recent advances in retinex theory and some impli- cations for cortical computations. Color vision and the natural image. Proc Nat1 Acad Sci USA 80:5 163-5 169.
Land EH (1986a) Recent advances in retinex theory. Vision Res 26: 7-21.
Land EH (1986b) An alternative technique for the computation of the designator in the retinex theory of color vision. Proc Nat1 Acad Sci USA 83:3078-3080.
Land EH, McCann JJ (197 1) Lightness and retinex theory. J Opt Sot Am 61:1-l 1.
Land EH, Hubel DH, Livingstone MS, Perry SH, Burns MM (1983) Colour-generating interactions across the corpus callosum. Nature 303:616-618.
Lee HC (1986) Method for computing the scene-illuminant chro- maticity from specular highlights. J Opt Sot Am A 3: 1694-l 699.
Lennie P, Sclar G, Krauskopf J (1990) Chromatic mechanisms in striate cortex of macaque. J Neurosci 10:649-669.
Livingstone MS, Hubel DH (1984) Anatomy and physiology of a color system in the primate visual cortex. J Neurosci 4:309-356.
Maguire WM, Baizer JS (1984) Visuotopic organization of the pre- lunate gyrus in rhesus monkey. J Neurosci 4: 1690-l 704.
Maloney LT (1986) Evaluation of linear models of surface spectral reflectance with small numbers of parameters. J Opt Sot Am A 3: 1673-1683.
Maloney LT, Wandell BA (1986) Color constancy: a method for re- covering surface spectral reflectance. J Opt Sot Am A 3:29-33.
Marrocco RT, De Valois RL (1977) Locus of spectral neutral point in monkey opponent cells depends on stimulus luminance relative to background. Brain Res 119:465470.
Maunsell JH, Van Essen DC (1983) The connections of the middle temporal visual area (MT) and their relationship to a cortical hier- archy in the macaque monkey. J Neurosci 3:2563-2586.
McCann JJ, McKee SP, Taylor TH (1976) Quantitative studies in retinex theory. Vision Res 16:445458.
Michael CR (1978a) Color-sensitive complex cells in monkey striate cortex. J Neurophysiol41:1250-1266.
Michael CR (1978b) Color-sensitive hypercomplex cells in monkey striate cortex. J Neurophysiol42:726-744.
Miezin F, McGuinness D, Allman J (1982) Antagonistic direction specific mechanisms in area MT in the owl monkey. Sot Neurosci Abstr 8:68 1.
Moran J, Desimone R (1985) Selective attention gates visual pro- cessing in the extrastriate cortex. Science 229~782-784.
Moran J, Desimone R, Schein SJ, Mishkin M (1983) Suppression from ipsilateral visual field in area V4 of the macaque. Sot Neurosci Abstr 91957.
mote visual stimuli on visual. responses of cat area 17 and lateral suprasylvian area. Exp Brain Res 39: 107-122.
Rizzolatti G, Camarda R, Grupp LA, Pisa M (1974) Inhibitory effect of remote visual stimuli on the visual responses of the cat superior
Rizzolatti G, Camarda R (1977) Influence of the presentation of re-
opponents colors theory. I. Chromatic responses and spectral satu- ration. J Ovt Sot Am 45:546-552.
colliculus: spatial and temporal factors. J Neurophysio137: 1262-1275. Schein SJ (1988) Anatomv of macaaue fovea and svatial densities of
Jameson D, Hurvich LM ( 1959) Perceived color and its dependence on focal, surrounding, and preceding stimulus variables. J Opt Sot Am 49:89C-898.
Jameson D, Hurvich LM (196 1) Opponent chromatic induction: ex- perimental evaluation and theoretical approach. J Opt Sot Am 5 1: 46-53.
Jameson D, Hurvich LM (1964) Theory of brightness and color con-
neurons in fovea1 representation. J Camp Neurol269:479-505. Schein SJ, Klug KJ (1990) There is one midget bipolar terminal in
the b-layer of the IPL for each cone pedicle in the OPL of the macaque retina. Invest Ophthalmol Vis Sci [Suppl] 31:37.
Schein SJ, Marrocco RT, de Monasterio FM (1982) Is there a high concentration of color-selective cells in area V4 of monkey visual cortex? J Neurophysiol47: 193-2 13.
trast in human vision. Vision Res 4: 135-l 54.- Judd DB (1940) Hue saturation and lightness of surface colors with
chromatic illumination. J Opt Sot Am 30:2-32. Judd DB (1960) Appraisal of Land’s work on two-primary color pro-
jections. J Opt Sot Am 50:254-268. Kennedy H, Dehay C, Bullier J (1986) Organization of the callosal
connections of visual areas Vl and V2 in the macaque monkey. J Comp Neurol247:398415.
Keppel G (1973) Design and analysis: a researcher’s handbook. En- g%wood Cliffs, ‘NJ: Prentice Hall. -
Land EH (1959a) Color vision and the natural image. Part I. Proc Nat1 Acad Sci USA 45:115-129.
Schein SJ, Desimone R, de Monasterio RM (1983) Spectral properties ;~~~7cells in macaque monkey. Invest Ophthalmol Vis Sci [Suppl]
: . Spitzer H, Desimone R, Moran J (1988) Increased attention enhances
both behavioral and neuronal performance. Science 240:338-340. Tanaka K, Hikosaka K, Saito H, Yukie M, Fukada Y, Iwai E (1986a)
Analysis of local and wide-field movements in the superior temporal visual areas of the macaque monkey. J Neurosci 6: 134-144.
Tanaka M, Weber H, Creutzfeldt OD (1986b) Visual properties and spatial distribution of neurones in the visual association area on the prelunate gyrus of the awake monkey. Exp Brain Res 65: 1 l-37.
Thomson Sir B (1794) An account of some exveriments on coloured Land EH (1959b) Color vision and the natural image. Part II. Proc
Nat1 Acad Sci USA 45:636-644. shadows. Philos Trans R Sot Lond 84:107-l i8.
Thorell LG, De Valois RL, Albrecht DG (1984) Spatial mapping of
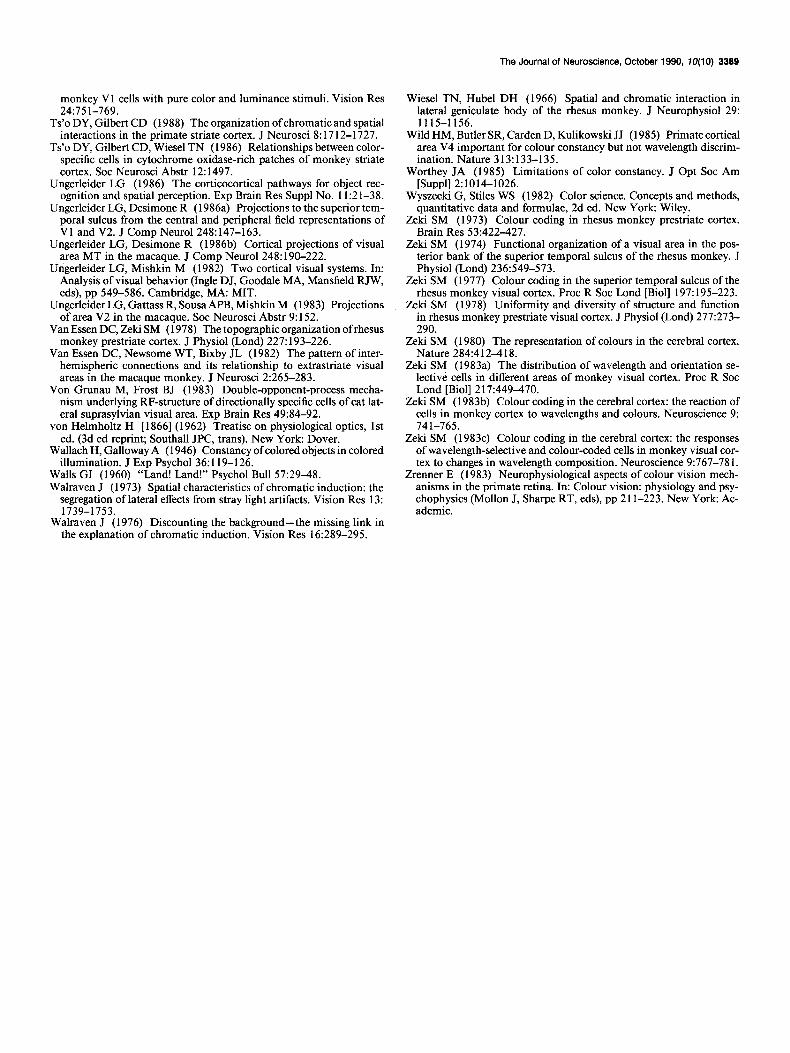
The Journal of Neuroscience, October 1990, IO(10) 3389
monkey Vl cells with pure color and luminance stimuli. Vision Res 24175 l-769.
Ts’o DY, Gilbert CD (1988) The organization of chromatic and spatial interactions in the primate striate cortex. J Neurosci 8: 17 12-l 727.
Ts’o DY, Gilbert CD, Wiesel TN (1986) Relationships between color- specific cells in cytochrome oxidase-rich patches of monkey striate cortex. Sot Neurosci Abstr 12: 1497.
Wiesel TN, Hubel DH (1966) Spatial and chromatic interaction in lateral geniculate body of the rhesus monkey. J Neurophysiol 29: 1115-1156.
Wild HM, Butler SR, Carden D, Kulikowski JJ (1985) Primate cortical area V4 important for colour constancy but not wavelength discrim- ination. Nature 313:133-135.
Worthey JA (1985) Limitations of color constancy. J Opt Sot Am Ungerleider LG (1986) The corticocortical pathways for object rec-
oanition and snatial nerception. Exp Brain Res Suuul No. 11:2 l-38. Ungerleider LG, -Des&one R (1986aj Projections to the superior tem-
monkey prestriate cortex. J Physiol (Lond) 227: 193-226.
poral sulcus from the central and peripheral field representations of
Van Essen DC. Newsome WT. Bixbv JL ( 1982) The oattem of inter-
Vl and V2. J Comp Neurol248:147-163. Ungerleider LG, Desimone R (1986b) Cortical projections of visual
area MT in the macaque. J Comp Neurol248: 190-222. Ungerleider LG, Mishkin M (1982) Two cortical visual systems. In:
Analysis of visual behavior (Ingle DJ, Goodale MA, Mansfield RJW, eds), pp 549-586. Cambridge, MA: MIT.
Ungerleider LG, Gattass R, Sousa APB, Mishkin M (1983) Projections of area V2 in the macaque. Sot Neurosci Abstr 9: 152.
Van Essen DC, Z&i SM (1978) The topographic organization of rhesus
hemispheric’ connections and its relationship to extrastriate visual areas in the macaque monkey. J Neurosci 2:265-283.
Von Grunau M, Frost BJ (1983) Double-opponent-process mecha- nism underlying RF-structure of directionally specific cells of cat lat- eral suprasylvian visual area. Exp Brain Res 49:84-92.
von Helmholtz H [ 18661 (1962) Treatise on physiological optics, 1 st ed. (3d ed reprint; Southall JPC, trans). New York: Dover.
Wallach H, Galloway A (1946) Constancy of colored objects in colored illumination. J Exp Psycho1 36: 119-l 26.
Walls GI (1960) “Land! Land!” Psycho1 Bull 57:29-48. Walraven J (1973) Spatial characteristics of chromatic induction: the
segregation of lateral effects from stray light artifacts. Vision Res 13: 1739-1753.
Walraven J (1976) Discounting the background- the missing link in the explanation of chromatic induction. Vision Res 16:289-295.
[Suppl] 2:1Oi4-1026. Wyszecki G, Stiles WS (1982) Color science. Concepts and methods,
quantitative data and formulae, 2d ed. New York: Wiley. Zeki SM (1973) Colour coding in rhesus monkey prestriate cortex.
Brain Res 531422-427. Z&i SM (1974) Functional organization of a visual area in the pos-
terior bank of the superior temporal sulcus of the rhesus monkey. J Physiol (Lond) 236:549-573.
Zeki SM (1980) The representation of colours in the cerebral cortex. Nature 284:412418.
Zeki SM (1977) Colour coding in the superior temporal sulcus of the rhesus monkey visual cortex. Proc R Sot Lond [Biol] 197:195-223.
Zeki SM (1978) Uniformity and diversity of structure and function in rhesus monkey prestriate visual cortex. J Physiol (Lond) 277:273- 290.
Z&i SM (1983a) The distribution of wavelength and orientation se- lective cells in different areas of monkey visual cortex. Proc R Sot Lond [Biol] 217:449470.
Zeki SM (1983b) Colour coding in the cerebral cortex: the reaction of cells in monkey cortex to wavelengths and colours. Neuroscience 9: 741-765.
Zeki SM (1983c) Colour coding in the cerebral cortex: the responses of wavelength-selective and colour-coded cells in monkey visual cor- tex to changes in wavelength composition. Neuroscience 9:767-78 1.
Zrenner E (1983) Neurophysiological aspects of colour vision mech- anisms in the primate retina. In: Colour vision: physiology and psy- chophysics (Mollon J, Sharpe RT, eds), pp 2 1 l-223. New York: Ac- ademic.