Embed Size (px)
Citation preview
Spectral synthesis codes and methodsof analysis :
what do we have on the market
Spring school of spectroscopic data analysis8-12 April, Wroclaw, Poland
Tatiana RyabchikovaInstitute of Astronomy RAS
Outline of the talk
• The codes for spectral synthesis• Comparison between the calculations with different codes• SME – spectral package for automatic determination of model atmopshere parameters
Spring school of spectroscopic data analysis
8-12 April, Wroclaw, Poland
http://wwwuser.oat.ts.astro.it/castelli/sources/synthe/examples/synthenop.html
http://wwwuser.oat.ts.astro.it/castelli/sources/plotsynthe.html
SYNTHESYNTHE
by Robert Kurucz 1970, 1993 (CDROM 13)
http://www.as.utexas.edu/~chris/moog.html
MOOGMOOG An LTE Stellar Line Analysis Program An LTE Stellar Line Analysis Program
by Chris Sneden 1973
MOOG MOOG is a Fortran code designed for LTE line analysis (integrated by wavelength line intensity -equivalent width, spectral line profiles) in plane-parallel 1-D stellar atmosphere. It calculates disk-integrated flux or central intensity.
The typical task is determination of the chemical composition of a star. In many ways MOOGMOOG follows the formalism developed in WIDTHWIDTH and SYNTHESYNTHE codes by R. L. Kurucz.
MOOGMOOG has 2 main options: abfind – fits previously measured observed equivalent widths to the calculated ones
to derive atmospheric parameters and chemical abundances synth – computes a set of trial synthetic spectra. The user may plot observed and
synthetic spectra and derive abundance either by visual inspection or by minimization of O-C diagram.
For on-line graphics MOOG MOOG uses SuperMongo plotting package implemented in FORTRAN codes, although it may work without graphical output.
MOOG MOOG supports supports different model atmosphere formats (ATLAS9, MARCS) with 'rhox' and 'tau' depth scales
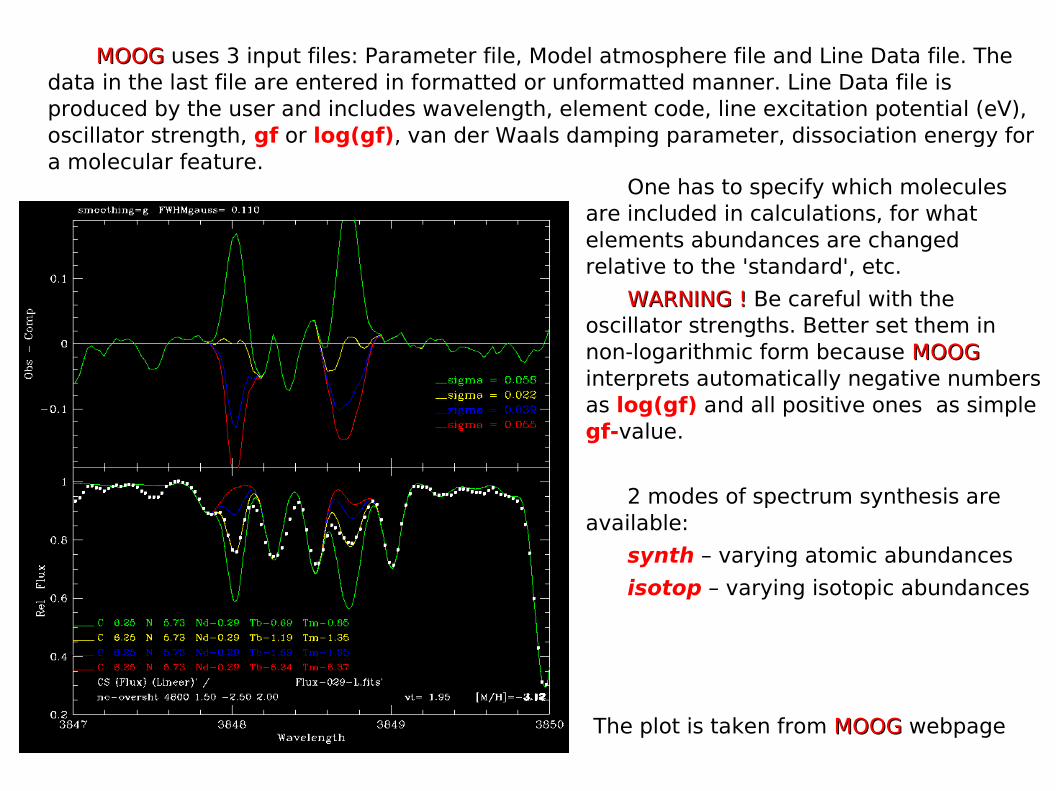
MOOGMOOG uses 3 input files: Parameter file, Model atmosphere file and Line Data file. The data in the last file are entered in formatted or unformatted manner. Line Data file is produced by the user and includes wavelength, element code, line excitation potential (eV), oscillator strength, gf or log(gf), van der Waals damping parameter, dissociation energy for a molecular feature.
The plot is taken from MOOG MOOG webpage
One has to specify which molecules are included in calculations, for what elements abundances are changed relative to the 'standard', etc.
WARNING ! WARNING ! Be careful with the oscillator strengths. Better set them in non-logarithmic form because MOOGMOOG interprets automatically negative numbers as log(gf) and all positive ones as simple gf-value.
2 modes of spectrum synthesis are available:
synth – varying atomic abundances
isotop – varying isotopic abundances
Spectrum Investigation Utility – SIUSpectrum Investigation Utility – SIU Reetz, J.K. 1991, Diploma Thesis, München University
SIU SIU is a Fortran code built into IDL environment. Unlike MOOG MOOG and other codes that will be discussed later, it does not work without IDL. SIU SIU calculates the emergent specific intensity or disk-integrated flux from plane-parallel 1-D stellar atmosphere both in LTE and NLTE approximations. Include continuous opacities due to bound-free transitions of H I, H2+, H-, He I, He II, metals up to Fe, Rayleigh and Thompson scattering.
SIU SIU is working with a grid of MAFAGS atmospheric models built into IDL shell as well as with individual models from other codes converted into special binary format which includes partial pressures for all elements in first 3 ionization stages.
All parameters (wavelength region, atmospheric parameters, spectral resolution, microturbulence, macroturbulence and rotational velocities) are specified inside IDL environment. The total line list consists of 1900 blocks by 200 lines each and is kept separately as external file in binary format. Adaptive wavelength grid is used.
The hydrogen lines calculations are performed with VCS Stark broadening tables (Vidal et al. 1973) limited to the temperatures T≈20000 K and to electron number densities 1010 cm-3. Hydrogen Stark profiles are convolved with radiative and Doppler broadening profiles and the resultant profile is further convolved with the resonance broadening profile (H+H interaction). Because of the cutted tables, SIU SIU is working successfully for spectrum calculations in the atmospheres of FGKFGK stars of III – V III – V
luminosity classes only.
Abundance determinations in SIU SIU are made either by visual estimates of the quality of profile fits or by visual estimates of the O-C diagram produced by code on user's request.
More details about SIUSIU will be given on Thursday.
SYNTH3SYNTH3 is is designed to calculate spectra emerging from the static, 1-D model atmosphere, under the assumption of LTE. These approximations are adequate for a wide range of Main Sequence objects. In practice, the code is successfully used to model stars of spectral classes from early B to late M.
In the standard mode, SYNTH3SYNTH3 computes intensity by solving numerically the scalar radiative transfer equation for a set of (typically) 7 limb angles.
On the next step, an external routine s3divs3div is used to produce disk-integrated flux spectrum from SYNTH3SYNTH3 intensity spectra for a specified radial-tangential macroturbulent and projected rotational velocities. By default, this procedures assumes spherically symmetric star.
SYNTH3SYNTH3 is independent of the latter assumptions of disk integration and can supply intensity spectra for a more sophisticated disk integration procedure (e.g., modelling of spectroscopic binaries, rotationally distorted stars, stars covered by temperature/abundance spots, etc.)
SYNTH3SYNTH3 is able to compute spectra emergent from stellar atmospheres with a depth-dependent abundances
The format of the input file for SYNTH3SYNTH3 is that of the output returned by the VALD 'Extract Stellar'VALD 'Extract Stellar' request. The input file contains the name of the model atmosphere file in special 'krz''krz' format. This file is obtained by transformation of the ATLAS9 'mod'ATLAS9 'mod' format with a program KURKOLKURKOL
Synth3Synth3Oleg Kochukhov,'Spectrum synthesis for magnetic, chemically stratified stellar atmospheres' 2007, in Physics of magnetic stars, eds. I.I.Romanyuk and D.O.Kudryavtsev, Nizhnij Arkhyz 2007, p.109
SYNTH3SYNTH3 program is written in Fortran 77, which ensures portability to all major computer platforms and straightforward interfacing with alternative software modules. The code does the following set of operations:
Reading input model atmosphere (krz format) and atomic/molecular line list (VALDVALD format). Depth-independent abundances and microturbulence are read from the line list (default) or from the model atmosphere header. Depth-dependent chemical abundance can be specified in the input model atmosphere file.
Computation of the concentration of different ions and molecules based on the advanced equation of state solver (Valenti et al. 1998, ApJ 498, 851) which includes the treatment of ≈200 diatomic and polyatomic molecules. Calculation of continuous opacities (as in ATLAS9ATLAS9, Kurucz 1993, CD-ROM 13), line center opacities, Voigt function parameters. Refinement of the depth grid (adaptive grid).
Intensity at several limb angles is computed with the help of the quadratic DELODELO radiative transfer algorithm (Piskunov & Kochukhov 2002, A&A 381, 736), using precomputed metallic line opacity and hydrogen line opacity evaluated according to Barklem et al. (2000, A&A 363, 1091). Refinement of the line profiles is carried out by adding frequency points, until description of the spectral line shapes is deemed sufficiently precise (adaptive grid).
The codes (executables for Linux and Intel Mac computers) are available on
http://www.astro.uu.se/~oleg/download.html
synthV_NLTEsynthV_NLTEThe author is Vadim Tsymbal.
Source files, executable for Linux, and example files are located in:
Similar to SYNTH3 SYNTH3 synthV_NLTEsynthV_NLTE calculates spectra emerging from the static, 1-D model atmosphere under both LTELTE and NLTENLTE assumptions, and used to model stars of spectral classes from early B to late M. The format of the input linelist is the same as in SYNTH3. SYNTH3. synthV_NLTEsynthV_NLTE is also able to compute spectra for chemically stratified stellar atmospheres.
Main differences: synthV_NLTEsynthV_NLTE is running with 'krz' , 'mod', and MARCS model atmosphere formats Constant wavelength step 0.01 Å is used in spectrum calculations Calculation of continuous opacities and radiative transfer algorithm is the same as
in Kurucz' codes, ( Kurucz 1993, CD-ROM 13). Hydrogen lines and 20 He I lines are calculated with VCS (Vidal, Cooper, Smith,
1971, JQSRT 11, 263) Stark broadening treatment. 2 types of output file are possible depending on the filename extention:
a. if extention is '.out''.out' then the code produce the output file similar to SYNTH3 SYNTH3 (specific intensity for 7 limb angles)
b. if extention is '.prf''.prf' then the code produce normalized disk-integrated flux spectrum
http://vald.inasan.ru/~vadim/downloads/
synthV_NLTEsynthV_NLTE requires an external file SynthV.configSynthV.config, where you put filenames with the precalculated b-factorsb-factors (a result of DETAILDETAIL code). synthV_NLTE synthV_NLTE compares species names and wavelengths in the input linelist with the corresponding data in DETAIL DETAIL *.pop file and calculates NLTE synthetic profiles for the lines found in *.pop file. For all other lines LTE calculations are carried out. If *.pop filenames are commented synthV_NLTE synthV_NLTE is working in LTE regime.
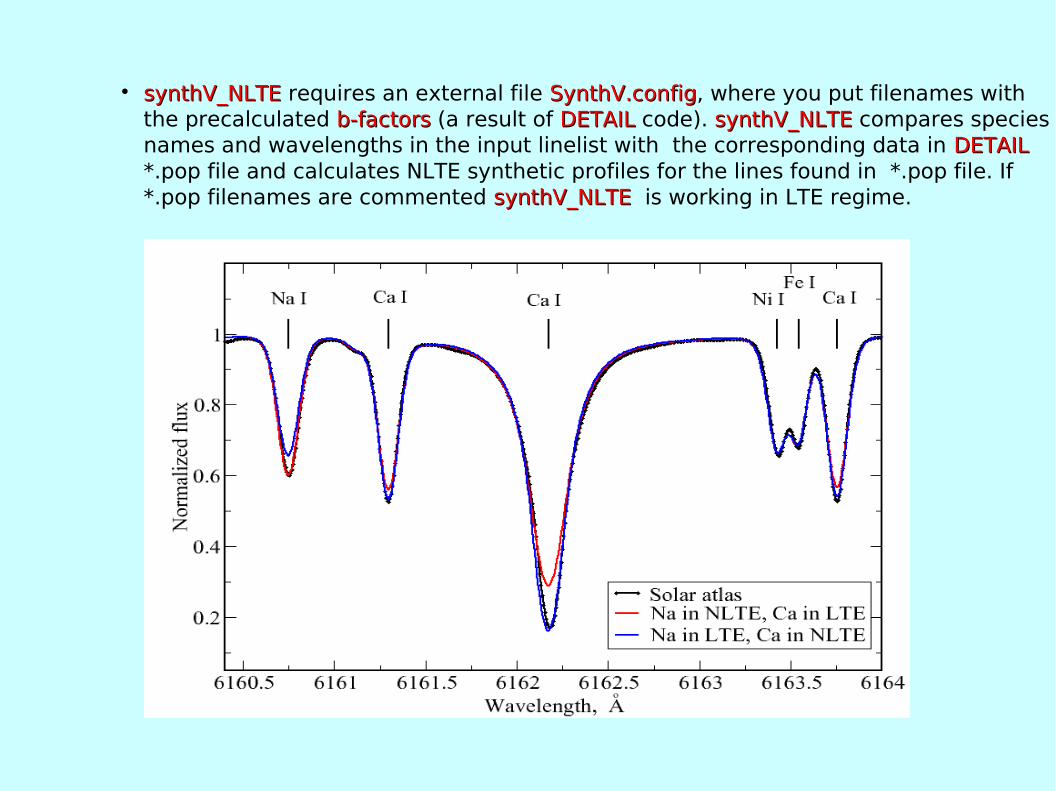
synthV_NLTEsynthV_NLTE requires an external file SynthV.configSynthV.config, where you put filenames with the precalculated b-factorsb-factors (a result of DETAILDETAIL code). synthV_NLTE synthV_NLTE compares species names and wavelengths in the input linelist with the corresponding data in DETAIL DETAIL *.pop file and calculates NLTE synthetic profiles for the lines found in *.pop file. If *.pop filenames are commented synthV_NLTE synthV_NLTE is working in LTE regime.
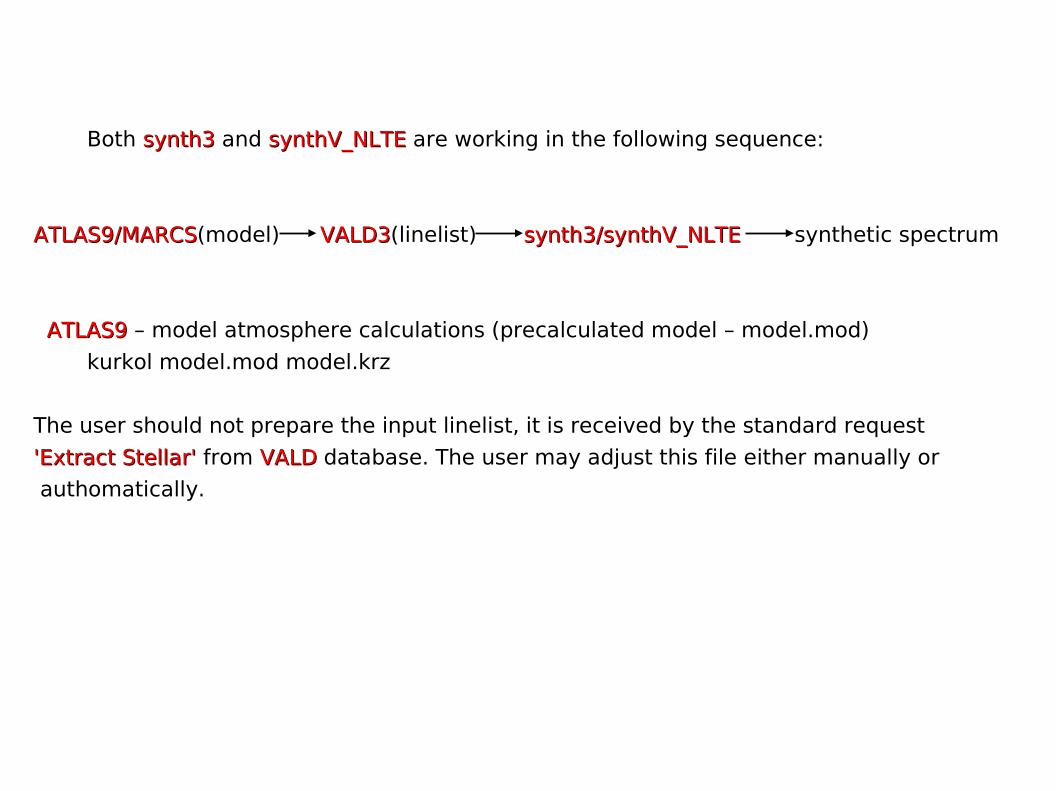
Both synth3 synth3 and synthV_NLTE synthV_NLTE are working in the following sequence:
ATLAS9/MARCSATLAS9/MARCS(model) VALD3VALD3(linelist) synth3/synthV_NLTEsynth3/synthV_NLTE synthetic spectrum
ATLAS9ATLAS9 – model atmosphere calculations (precalculated model – model.mod)
kurkol model.mod model.krz
The user should not prepare the input linelist, it is received by the standard request
'Extract Stellar''Extract Stellar' from VALDVALD database. The user may adjust this file either manually or
authomatically.
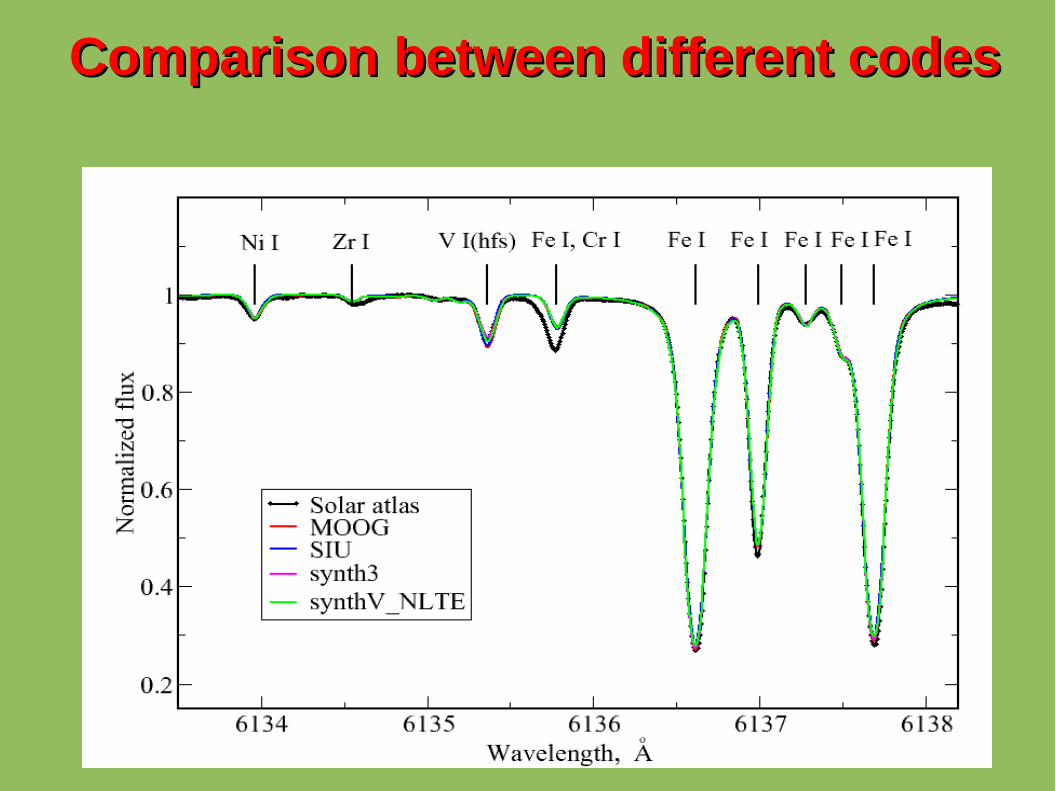
Comparison between different codesComparison between different codes
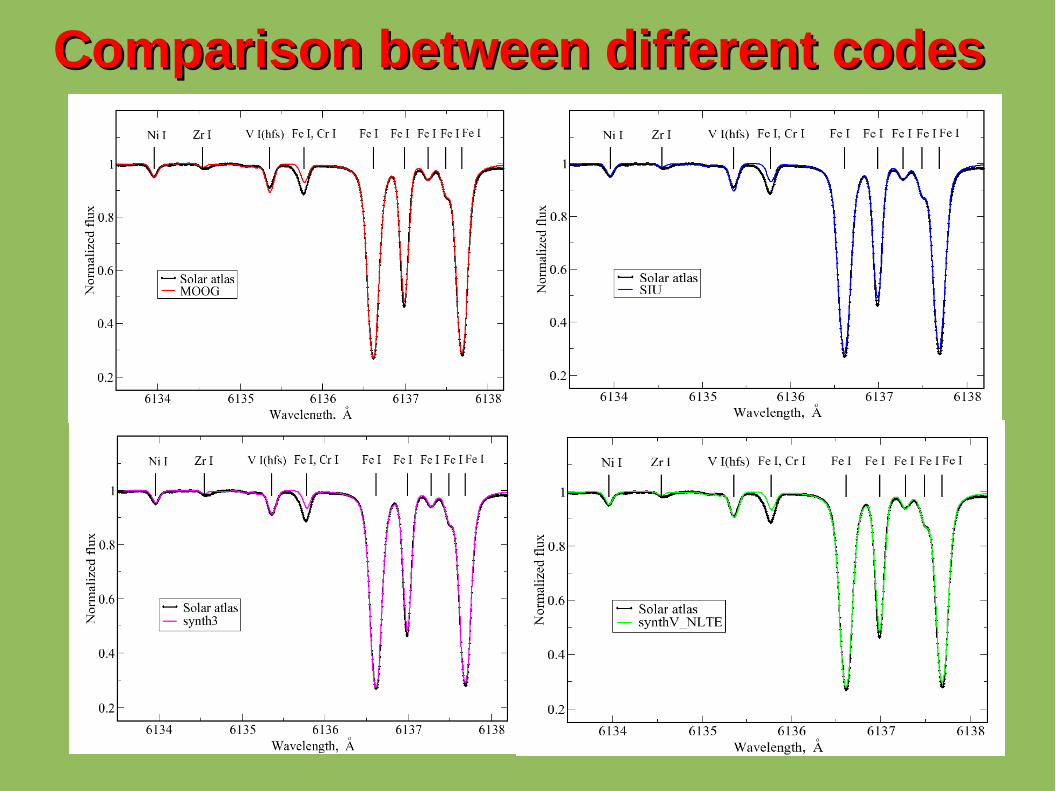
Comparison between different codesComparison between different codes
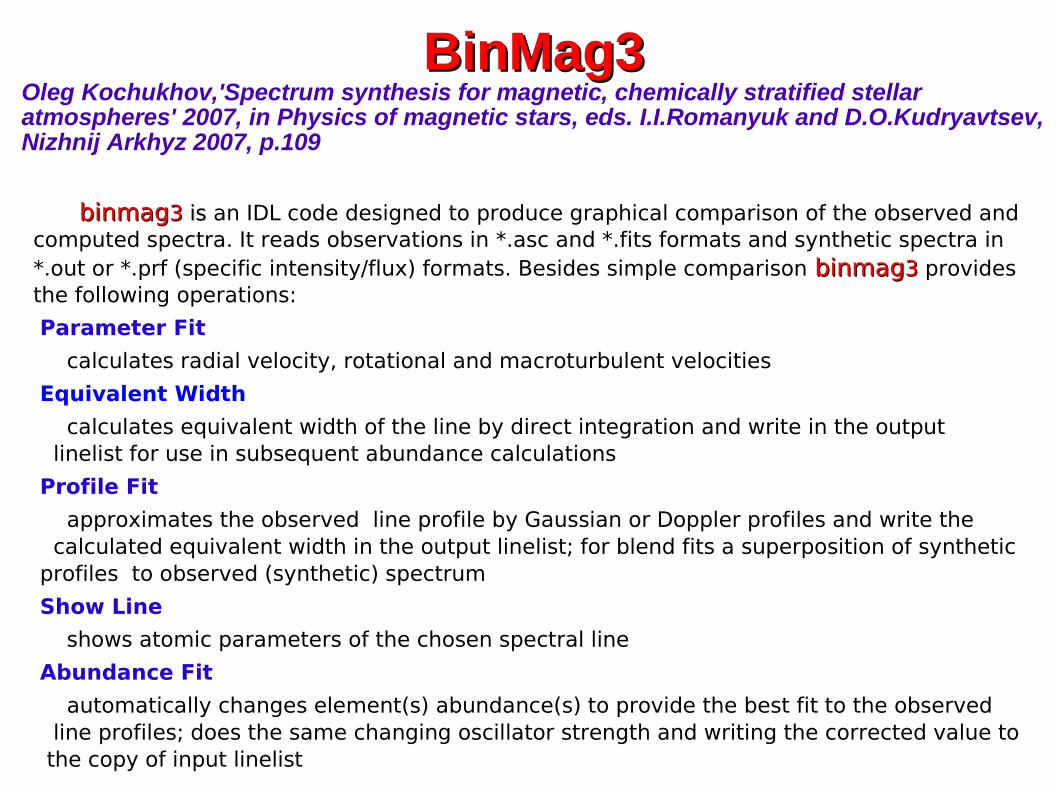
BinMag3BinMag3Oleg Kochukhov,'Spectrum synthesis for magnetic, chemically stratified stellar atmospheres' 2007, in Physics of magnetic stars, eds. I.I.Romanyuk and D.O.Kudryavtsev, Nizhnij Arkhyz 2007, p.109
binmagbinmag33 is is an IDL code designed to produce graphical comparison of the observed and computed spectra. It reads observations in *.asc and *.fits formats and synthetic spectra in *.out or *.prf (specific intensity/flux) formats. Besides simple comparison binmagbinmag33 provides the following operations:
Parameter Fit
calculates radial velocity, rotational and macroturbulent velocities
Equivalent Width
calculates equivalent width of the line by direct integration and write in the output linelist for use in subsequent abundance calculations
Profile Fit
approximates the observed line profile by Gaussian or Doppler profiles and write the calculated equivalent width in the output linelist; for blend fits a superposition of synthetic profiles to observed (synthetic) spectrum
Show Line
shows atomic parameters of the chosen spectral line
Abundance Fit
automatically changes element(s) abundance(s) to provide the best fit to the observed line profiles; does the same changing oscillator strength and writing the corrected value to the copy of input linelist
For Abundance Fit operation binmag3 requires Unix-like environment and synth3synth3 or synthV_NLTEsynthV_NLTE executables in the default search path. As a result the user automatically gets the abundance from the individual spectral line/blend of lines for precalculated model atmosphere. It is possible to extract an average abundance from several spectral lines. Having precalculated b-factors the user automatically receives NLTE abundance.
Up to 6 observations and 6 synthetic spectra may be loaded simultaneously.
binmag3binmag3 provides graphical (PS) and text (asc) outputs.
SMESME(Spectroscopy Made Easy) (Spectroscopy Made Easy)
J. Valenti & N. Piskunov. 1996, A&AS 118, 595
SME SME computes synthetic spectra and adjusts free parameters (TTeff eff , logg, , logg,
metallicity, Vsini, Vmetallicity, Vsini, Vmicromicro, V, V
macromacro) based on comparison with observations.
SME SME solver consists of the IDL routines for preparing spectral synthesis consists of the IDL routines for preparing spectral synthesis and performing optimization, and external library for synthetic spectrum and performing optimization, and external library for synthetic spectrum calculations. The external library (synth code) is written in C++ and calculations. The external library (synth code) is written in C++ and FortranFortran
SMESME spectral synthesis consists of molecular and ionization equilibrium spectral synthesis consists of molecular and ionization equilibrium solver solver EOSEOS, continuous opacity package , continuous opacity package CONTOPCONTOP, line opacity package , line opacity package LINEOPLINEOP and RT solver and RT solver RTINTRTINT
Another part of SME SME is Graphical User Interface (is Graphical User Interface (GUIGUI), written in IDL ), written in IDL (sme.pro). The (sme.pro). The GUIGUI is used to read line data and observations, set model is used to read line data and observations, set model parameters, define fitting masks, create parameters, define fitting masks, create SMESME input and output files input and output files when the job is done. when the job is done. SMESME output files are standard IDL save files output files are standard IDL save files containing an containing an SMESME output structure. output structure.
SMESME output structure is the output structure is the SMESME input structure, with additional fields input structure, with additional fields containing the results of job execution. containing the results of job execution.
Additional IDL codes (for example, port_mask.pro) allows to copy line Additional IDL codes (for example, port_mask.pro) allows to copy line mask from one star to another for stars with the similar atmospheric mask from one star to another for stars with the similar atmospheric parameters.parameters.
SMESME is working with the observstions in (asc) or (fits) formats is working with the observstions in (asc) or (fits) formatsThe format of input linelist is the output format of VALD 'Extract Stellar' The format of input linelist is the output format of VALD 'Extract Stellar' request.request.SMESME has model libraries of Kurucz' (1993) models and latest version of has model libraries of Kurucz' (1993) models and latest version of MARCS models.MARCS models.
Ionization equilibrium solver EOS EOSEOS has partition functions for up to 6 ionization stages of the first 99 atoms in the periodic table and for 257 molecules (up to four atoms) fitted over the range from 10K to 8000KInput consists of T, P and abundances. Pe can be also imposed
EOSEOS is using rather unique solving strategy
CONTOPContinuous opacities are from ATLAS12Modifications: partial pressures of absorbers and their partition functions are taken from EOSEOSList of absorbers: H, H2+, H-, He, He+, He-, Si, Si+, Mg, Mg+, Al, C, Fe, Ca+, N, O, Ne, S,List of scatterers: H, H2, He, e-
RTINTSingle pass short-characteristics algorithm developed for 3D radiative transfer code: fast and robust even on a sparse grid.Attenuation operator with quadratic Bezier spline approximation to the source functionBezier spline prevents overshooting
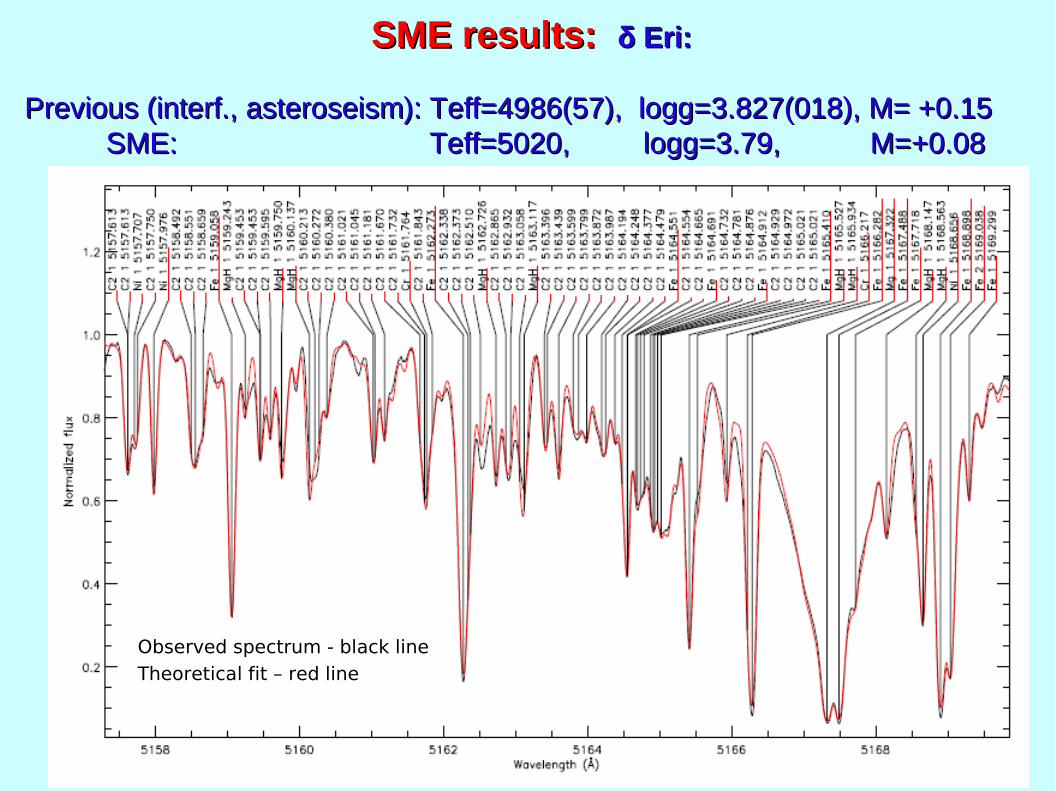
SME results: SME results: δ Eri:δ Eri:
Previous (interf., asteroseism): Teff=4986(57), logg=3.827(018), M= +0.15Previous (interf., asteroseism): Teff=4986(57), logg=3.827(018), M= +0.15 SME: Teff=5020, logg=3.79, M=+0.08SME: Teff=5020, logg=3.79, M=+0.08
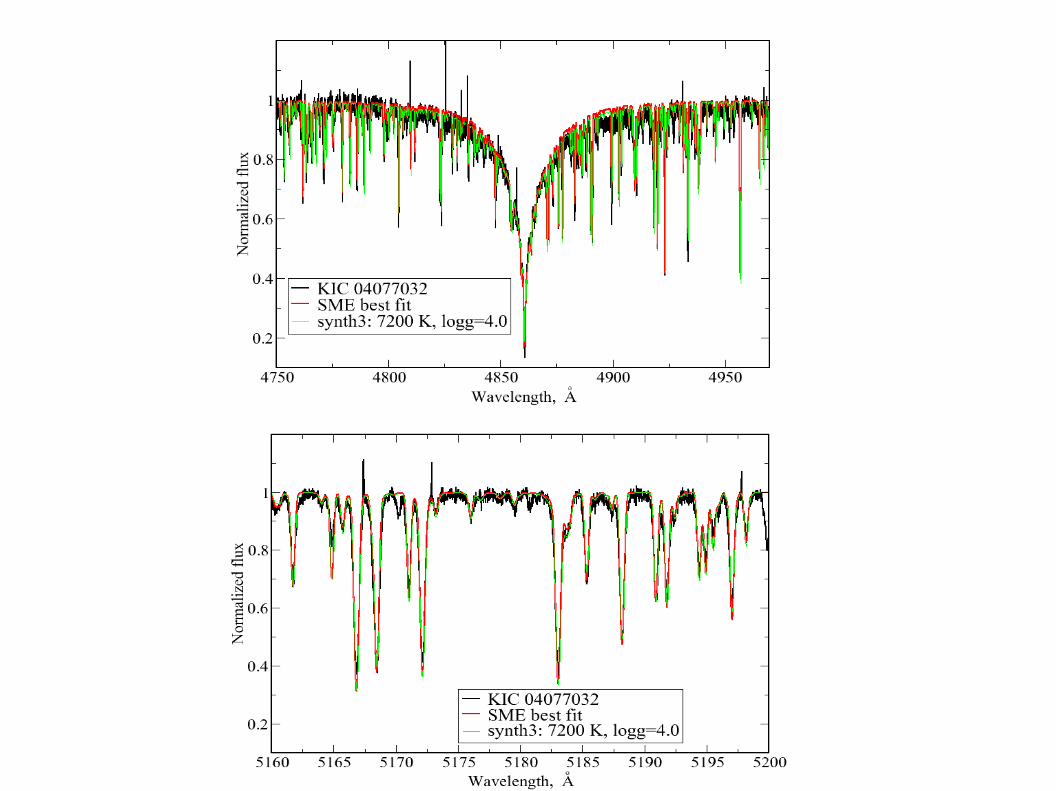
Observed spectrum - black lineTheoretical fit – red line
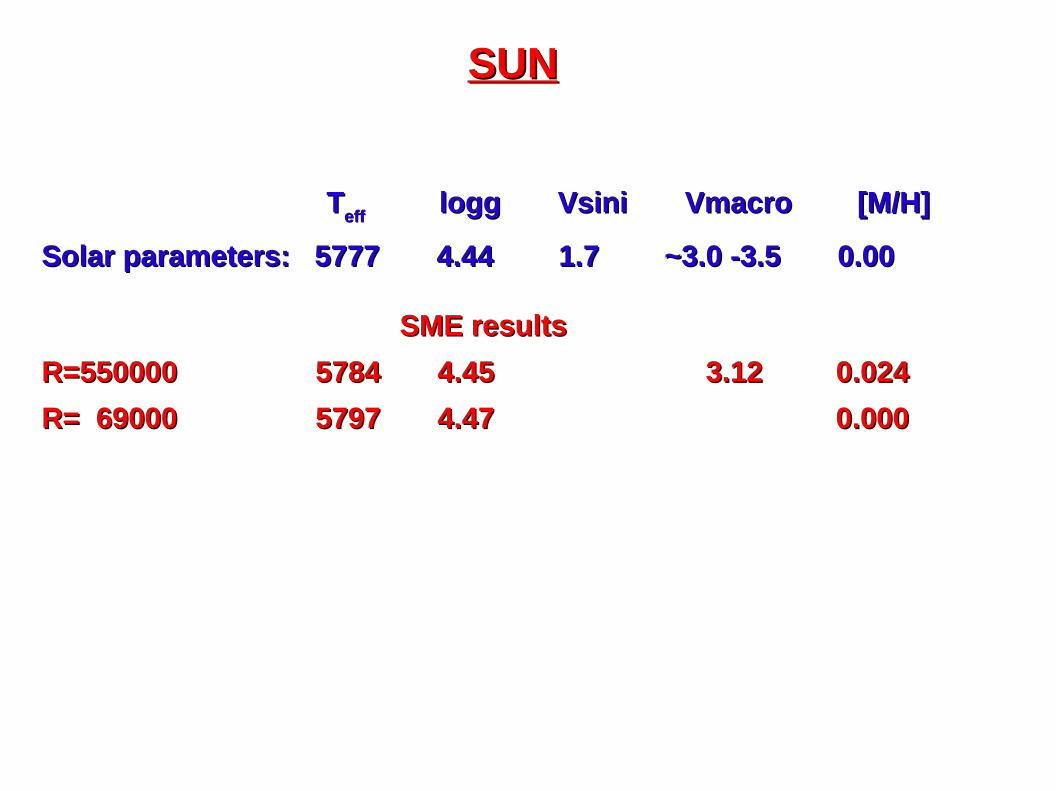
SUNSUN
TTeff eff logg Vsini logg Vsini Vmacro Vmacro [M/H] [M/H]
Solar parameters: Solar parameters: 5777 4.44 1.7 ~3.0 -3.5 0.005777 4.44 1.7 ~3.0 -3.5 0.00
SME resultsSME results
R=550000 5784 4.45 3.12 0.024 R=550000 5784 4.45 3.12 0.024
R= 69000 5797 4.47 0.000R= 69000 5797 4.47 0.000
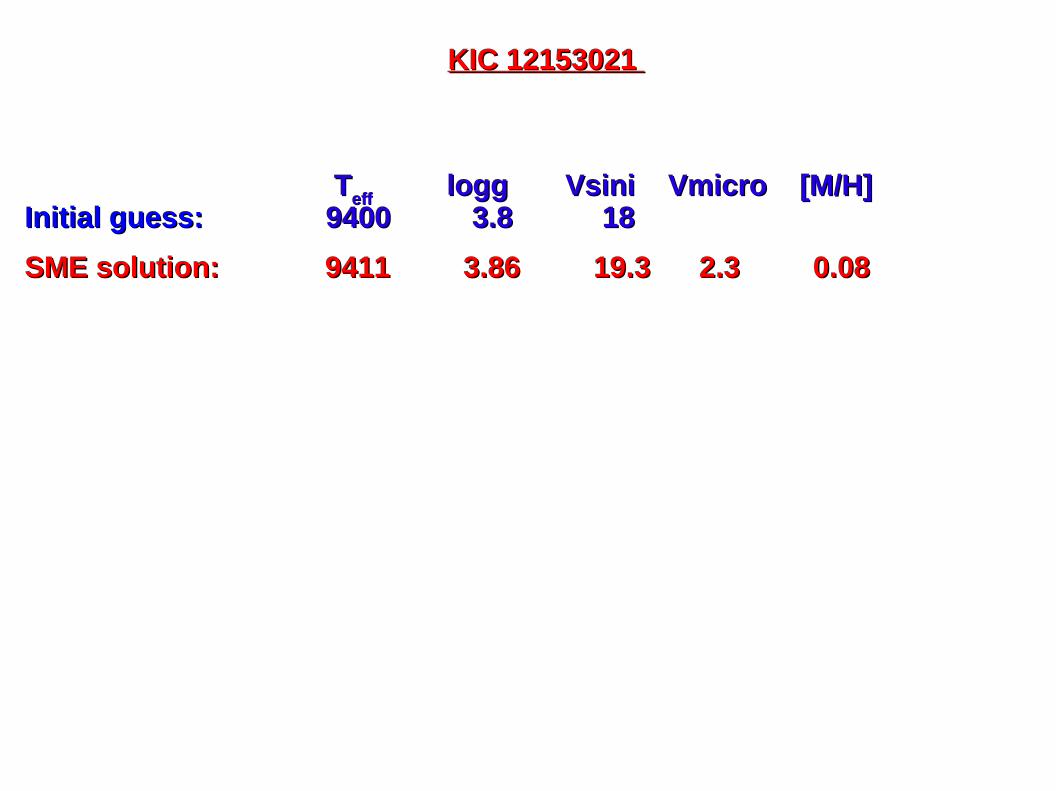
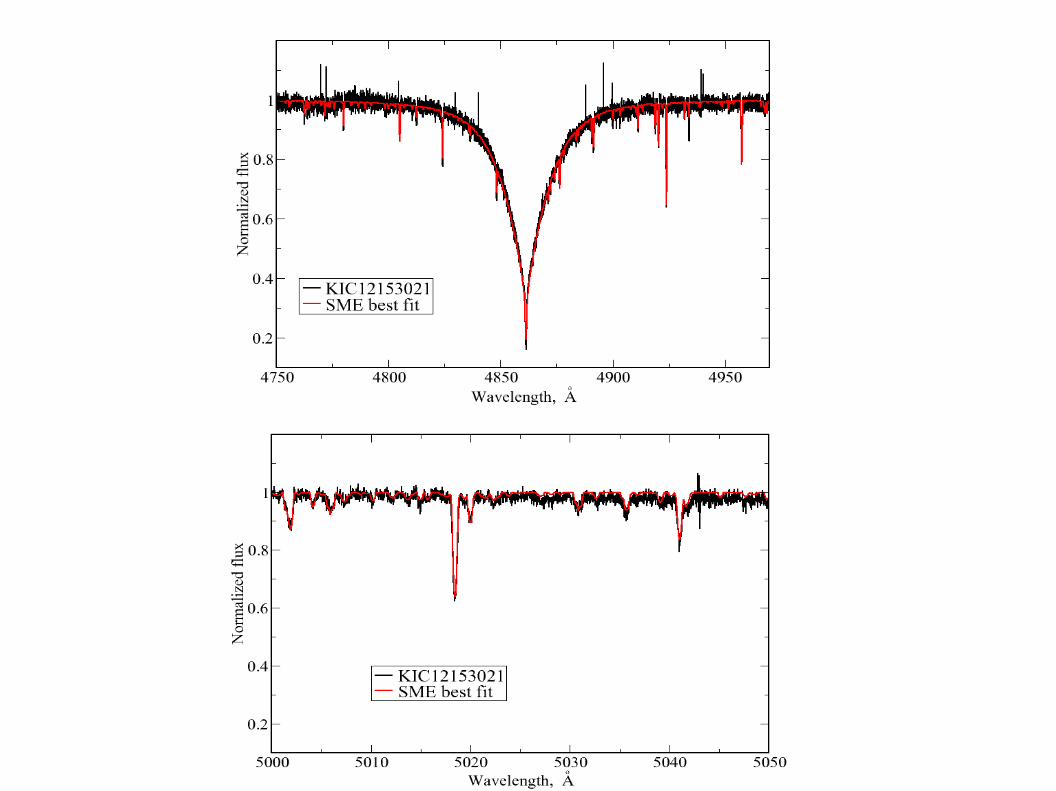
TTeff eff logg Vsini logg Vsini Vmicro [M/H]Vmicro [M/H]Initial guess:Initial guess: 9400 3.8 18 9400 3.8 18
SME solution: 9411 3.86 19.3 2.3 0.08SME solution: 9411 3.86 19.3 2.3 0.08
KIC 12153021 KIC 12153021
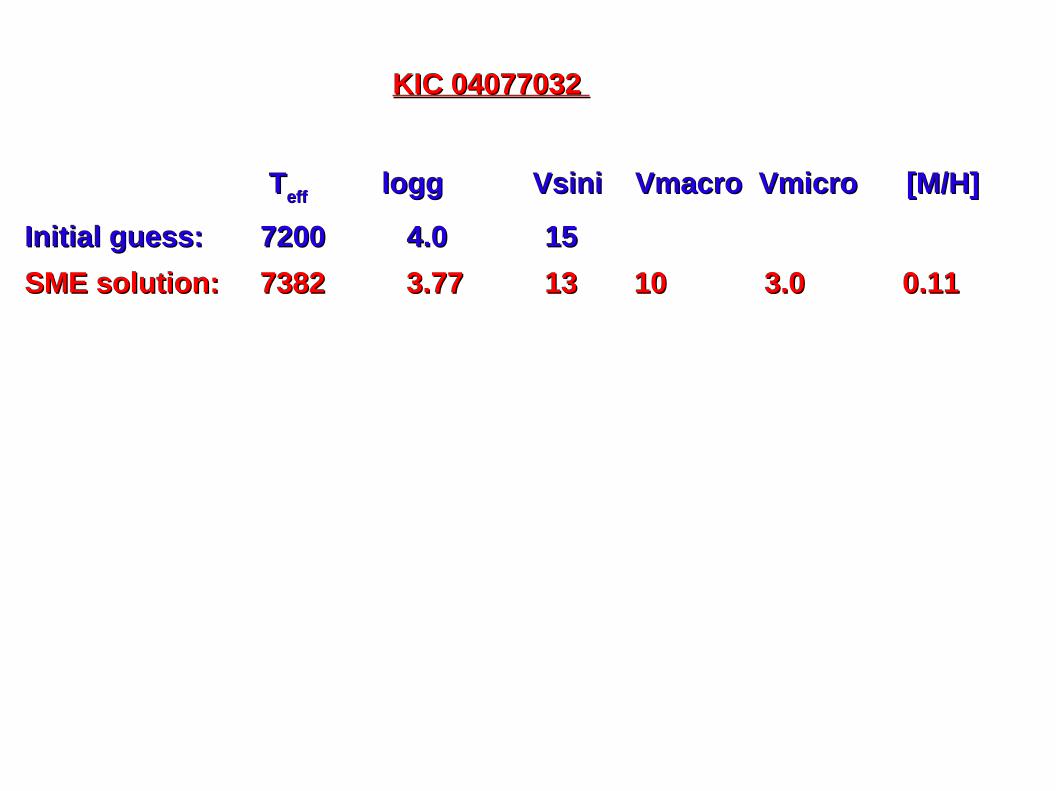
TTeff eff logg Vsini Vmacro Vmicro [M/H] logg Vsini Vmacro Vmicro [M/H]
Initial guess: 7200 4.0 15 Initial guess: 7200 4.0 15
SME solution: 7382 3.77 13 10 3.0 0.11SME solution: 7382 3.77 13 10 3.0 0.11
KIC 04077032 KIC 04077032