Embed Size (px)
Citation preview
Spin Dependence in
Proton-Proton Elastic Scattering at RHIC
S. Bultmann, I. H. Chiang, R. E. Chrien, A. Drees, R. L. Gill, W. Guryn*,J. Landgraf, T. A. Ljubicic, D. Lynn, C. Pearson, P. Pile, A. Rusek,
M. Sakitt, B. Surrow, S. TepikianBrookhaven National Laboratory, USA
J. Chwastowski, B. PawlikInstitute of Nuclear Physics, Poland
M. HaguenauerEcole Polytechnique, Palaiseau, France
A. A. Bogdanov, S. B. Nurushev, M. F. Runtzo, M. N. StrikhanovMoscow Engineering Physics Institute, Russia
I. G. Alekseev, V. P. Kanavets, L. I. Koroleva, B. V. Morozov, D. N. SviridaInstitute for Theoretical and Experimental Physics, Russia
A. Khodinov, M. Rijssenbeek, L. WhiteheadStony Brook University, USA
K. De, N. OzturkUniversity of Texas at Arlington, USA
A. SandaczInstitute for Nuclear Studies, Poland
∗Spokesperson: BNL Physics Department, Upton, NY 11973-5000, USAPhone: 1-631-344-3878, E-mail: [email protected]
Statement of basic requirementsProton beams with transverse polarization at RHIC are required for this experiment,
which is already installed at the 2 O’clock IP at RHIC. The existing and commissionedRoman Pot systems shall be used. Our computing and network is already in place, and theneeds in this area are minimal. Three phases of the experiment and their needs are describedin the Executive Summary on the following page.
August 2003
Executive SummaryWe are proposing a comprehensive experiment to measure spin dependence of proton-
proton elastic scattering at RHIC in the totally unexplored region of center of mass energy√s and four momentum transferred |t|. Our proposal is to run at the two energies, which
are part of the running of RHIC Spin:√
s = 200 GeV and√
s = 500 GeV. Taking advantageof already existing and debugged equipment of the pp2pp experiment we are proposing toaccomplish the goals of the experiment in three phases, starting with the Phase 1, for whichonly miscellaneous costs of $ 25k are needed.
Phase 1: Running with the current setup we will measure and study the spin de-pendence of elastic scattering at
√s = 200 GeV with β∗ = 20 m and
√s = 500 GeV with
β∗ = 10 m. The AN , ANN , dσ/dt, and σtot will be measured at both energies and ρ at√s = 200GeV. The suitable |t| interval at
√s = 200GeV is 0.003 < |t| < 0.02 (GeV/c)2.
The error of ∆AN = 0.004 for each of the six data points in the above |t| interval can beobtained. The expected error on the slope parameter ∆b = 0.3 (GeV/c)−2 and on the ratioof real to imaginary part of the scattering amplitude ∆ρ = 0.01.
At√
s = 500 GeV AN can be measured with the same errors. However, since the usefulabsolute |t| interval is 0.025 < |t| < 0.12 (GeV/c)2, which is far from the CNI region, onecan measure b with ∆b ≈ 0.3. The cost of miscellaneous items for this phase is about $ 25k.Our request is for three days of data taking at each of the two energies of
√s = 200 GeV
and√
s = 500 GeV.
Phase 2: Running with Roman Pots in the DX-D0 region, we will extend the |t| rangeat
√s = 200 GeV to 0.2 (GeV/c)2 and to study the diffractive minimum region and its spin
dependence at√
s = 500 GeV to 1.3 (GeV/c)2. The additional cost for the modification ofDX-D0 region and new Roman Pot stations, while using the existing detectors, is estimatedto be $ 452k. No dedicated running time is required for this phase, because no specialconditions are required.
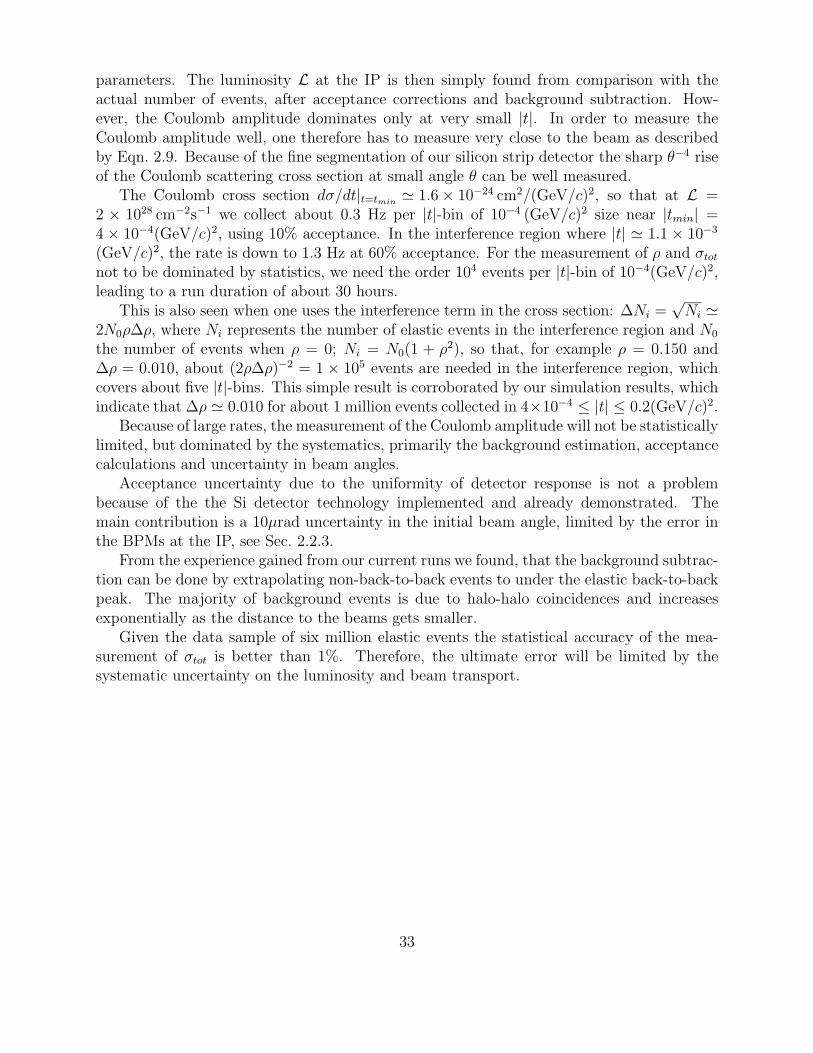
Phase 3: Extend the |t| range into the Coulomb region of elastic scattering to makeprecision measurements, as outlined in the original proposal, of ρ, σtot, and the spin depen-dence of ∆σtot. With that setup detailed information of helicity amplitudes at small |t| willshed light on σtot. Given the data sample of six million elastic events the statistical accuracyof the measurement of σtot is better than 1%. Therefore, the ultimate error will be limitedby the systematic uncertainty on the luminosity and beam transport. Cost of the powersupplies for this phase is $ 362k. We expect two days of time for data taking at each energyplus setup time of the beam optics.
1
Contents
1 Introduction 11.1 Physics Overview . . . . . . . . . . . . . . . . . . . . . . . . . . . . . . . . . 11.2 Spin Dependence of Elastic Scattering . . . . . . . . . . . . . . . . . . . . . 21.3 Unpolarized Elastic Scattering at Small |t| . . . . . . . . . . . . . . . . . . . 91.4 Scattering at Medium Momentum Transfer . . . . . . . . . . . . . . . . . . . 11
2 Accomplishments to Date of pp2pp 162.1 Existing pp2pp Equipment . . . . . . . . . . . . . . . . . . . . . . . . . . . . 162.2 Overview of the Experimental Technique . . . . . . . . . . . . . . . . . . . . 17
2.2.1 Transport Theory . . . . . . . . . . . . . . . . . . . . . . . . . . . . . 172.2.2 Actual Beam Transport . . . . . . . . . . . . . . . . . . . . . . . . . 192.2.3 Measurement of the Beam Angle and Position at the IP . . . . . . . . 202.2.4 Silicon Strip Detector . . . . . . . . . . . . . . . . . . . . . . . . . . . 21
2.3 The Engineering Run in 2002 . . . . . . . . . . . . . . . . . . . . . . . . . . 222.4 The Data Taking Run in 2003 . . . . . . . . . . . . . . . . . . . . . . . . . . 23
3 Proposed Plan for the Experiment 263.1 Phase 1: Running with the current setup . . . . . . . . . . . . . . . . . . . . 263.2 Phase 2: Medium |t| Region . . . . . . . . . . . . . . . . . . . . . . . . . . . 293.3 Phase 3: CNI Region . . . . . . . . . . . . . . . . . . . . . . . . . . . . . . . 32
4 Cost and Proposed Run Plan 34
A pp2pp Paper 36
B Bibliography 42
2
Chapter 1
Introduction
In this new proposal, we are asking for continuation of data taking with the existing anddebugged equipment of the pp2pp experiment, which already has had two very productivedata taking periods: An engineering run in 2002 and a data taking run in 2003. In Chapter2 we will describe the accomplishments of the two running periods that we had at RHIC. Weoutline the physics measurements that can be made with our setup and the physics motiva-tion for making them. We also outline what additional resources are needed to accomplishmost of the goals of the pp2pp experiment as described in the original proposal [1] and pre-sented to the Physics Advisory Committee (PAC) in 1994 and also in 1995. Our projectionsare based on our actual experience of running at RHIC.
The pp2pp experiment was approved by the management of the Brookhaven NationalLaboratory after the recommendation of the PAC in 1994. The approval was re-confirmedin 1995 following an update review of the experiment in that year. In his letter to the pp2ppCollaboration of June 10, 2003 the experiment was declared completed by Dr. T. Kirk“...purpose of this letter is to formally declare that Experiment R7 is complete at this pointin time and will not be scheduled for further data taking at RHIC.”
Our request for continuation has a significant merit. RHIC provides a unique opportunityto study spin dependence of elastic and diffractive collisions of polarized protons at center-of-mass energies up to 500 GeV. A sizable investment, that has been already made, will allowus to achieve many physics goals with only relatively short running periods. Those can beallocated, for example, at the end of the commissioning runs of RHIC Spin. In Chapter 3we outline how staging of the experiment with and/or without additional capital investmentwill result in achieving the remaining physics goals outlined in the original proposal: Themeasurement of the differential cross section for different spin states in a wide range of
√s
and |t|. In Chapter 4 we will summarize cost and schedule.
1.1 Physics Overview
RHIC with its capability of colliding polarized proton beams is a unique place to study elas-tic scattering and its spin dependence, allowing to investigate the accepted theory of stronginteractions, Quantum Chromo Dynamics (QCD), in the nonpertubative regime. QCD has
1
been very successful in describing hadronic interactions at large four-momentum-transfersquared |t|. For small |t| values of elastic scattering however, the theory has not been assuccessful. This is the regime of soft hadronic interactions where phenomenological mod-els, constrained by asymptotic theorems, are used to explain the nature of the hadronicinteraction.
The highest√
s energy at which these experimental studies were performed in proton-proton collisions was 62.8 GeV at the CERN ISR using unpolarized beams, and 20 GeVwith polarized beams. The pp2pp experiment extends these measurements over a widerange of energy and four-momentum transfer up to
√s = 500 GeV. In this ”data-driven”
field, having more experimental results is important. The existing data on pp and pp arenot sufficient to understand the exchange process at high energies in detail. For example,the direct measurement which avoids all uncontrollable uncertainties can test the postulatethat at high energies the difference between pp and pp cross section is negligible. Moreover,polarization studies in the RHIC energy range will be of utmost interest in order to explorethe emerging new picture of diffraction and its spin dependence. The strength of what wepropose is that many aspects of spin dependence in proton-proton elastic scattering is relatedto what is measured with unpolarized beams.
The insights gained in this experiment will have consequences for many other experiments,for example HERA, Tevatron and LHC where in wide rapidity gap events one or both verticesof the interaction, namely proton-Pomeron vertex, are the same as in proton-proton elasticscattering.
In general, the physics of our experiment is naturaly divided into two |t| regions:
1. In the small |t|, CNI region, 0.0005 < |t| < 0.12 (GeV/c)2, we will measure andstudy the differential cross section as a function of
√s and initial transverse spin state,
which yields the analyzing power AN , the double spin correlation parameter ANN , thedifference of the spin dependent total cross sections ∆σT , the total and elastic crosssections σtot and σel, the ratio of the real to the imaginary part of the forward elasticscattering amplitude ρ, and the nuclear slope parameter of pp elastic scattering b.
2. In the intermediate |t| region, |t| ≤ 1.3 (GeV/c)2, we plan to study the evolution ofthe dip structure with
√s, as observed at ISR in the differential elastic cross section,
dσel/dt, and the s and |t| dependence of b. One of the interesting features observedexperimentally is a correlation between the position of the dip and the single spinasymmetry AN crossing zero at the same |t| value.
By measuring spin asymmetries in the |t| range of this experiment, we will be able toconstrain the helicity amplitudes φi, which describe elastic scattering. Those amplitudes arenot very well known at this time. In the following sections we elaborate on these topics.
1.2 Spin Dependence of Elastic Scattering
RHIC has the unique capability of accelerating polarized protons, which will enable us tomeasure the spin dependent parameters of elastic pp scattering at much higher cms energies
2
compared to the highest energy data to date at√
s = 24 GeV. Those measurements wereperformed using a polarized target with unpolarized incident protons. There has been arecent revival of interest in the elastic pp scattering with polarized protons which coversa large spectrum of interesting physics. For instance, the intimate relationship between asharp zero-crossing of the analyzing power and the dip region in the elastic differential crosssection has continued to be the focus of a number of studies.
The main polarization measurements to be performed with polarized protons in elasticinteractions are listed below. We assume here that only transverse proton polarization isavailable at the IP of the proposed experiment:
1. the analyzing power AN ;
2. the difference in the total cross section as a function of initial transverse spin states∆σT = σ↑↓
tot − σ↑↑tot;
3. the transverse double spin correlation parameter ANN .
The kinematical region covers 4× 10⁻⁴ ≤ |t| ≤ 1.3 (GeV/c)2. There is a pronounced lackof data in the region from 0.05 (GeV/c)2 to 0.15 (GeV/c)2 as can be seen in Figure 1.1.
In the 1970’s the failure of simple Regge models to explain polarization data resulted inthe introduction of absorption corrections, but at the same time this inevitable approachreduced the interest in these models. At present, however, the framework is quite differ-ent, since much theoretical work has been done in connecting the Regge phenomenology toQCD concepts [2] by associating Pomeron (P ) exchange with the exchange of n ≥ 2 (non-perturbative) gluons [3, 4, 5]. For the case n = 2 (C = +1), this mechanism generates a barehard Pomeron, while for n = 3, containing both C = ±1, the C = −1 amplitude leads to thebare Odderon (O), corresponding to an odd-signature partner of P [6, 7, 8, 9, 10, 11, 12].
In discussing the polarization data, the s-channel helicity amplitudes [13] for pp elasticscattering φi (i = 1 − 5) are used. It is somewhat more convenient to express these incombinations that explicitly exhibit the t-channel exchange characteristics at high energy:
φ1(s, t) = 〈+ + |M | + +〉,φ2(s, t) = 〈+ + |M | − −〉,φ3(s, t) = 〈+ − |M | + −〉,φ4(s, t) = 〈+ − |M | − +〉,φ5(s, t) = 〈+ + |M | + −〉. (1.1)
The analyzing power AN can be expressed in terms of these amplitudes as:
ANdσ
dt= −4π
s2Im[φ∗
5(φ1 + φ2 + φ3 − φ4)] (1.2)
where the spin-averaged differential cross section is:
3
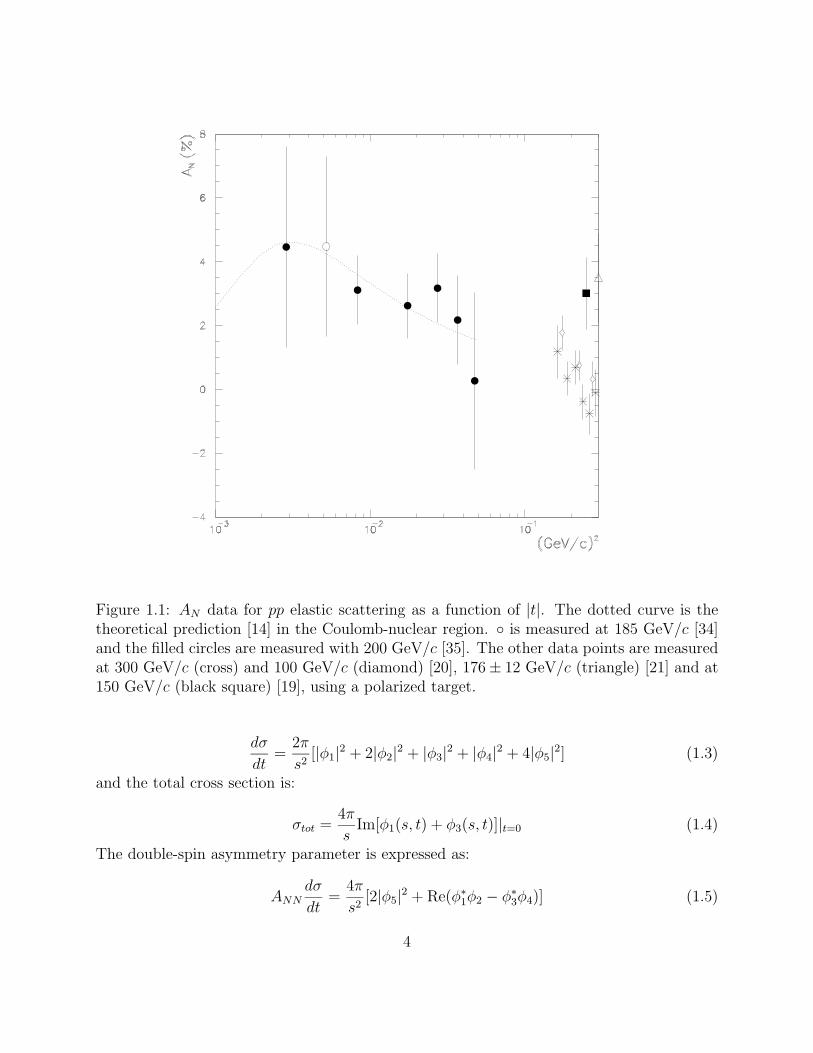
Figure 1.1: AN data for pp elastic scattering as a function of |t|. The dotted curve is thetheoretical prediction [14] in the Coulomb-nuclear region. is measured at 185 GeV/c [34]and the filled circles are measured with 200 GeV/c [35]. The other data points are measuredat 300 GeV/c (cross) and 100 GeV/c (diamond) [20], 176 ± 12 GeV/c (triangle) [21] and at150 GeV/c (black square) [19], using a polarized target.
dσ
dt=
2π
s2[|φ1|2 + 2|φ2|2 + |φ3|2 + |φ4|2 + 4|φ5|2] (1.3)
and the total cross section is:
σtot =4π
sIm[φ1(s, t) + φ3(s, t)]|t=0 (1.4)
The double-spin asymmetry parameter is expressed as:
ANNdσ
dt=
4π
s2[2|φ5|2 + Re(φ∗
1φ2 − φ∗3φ4)] (1.5)
4
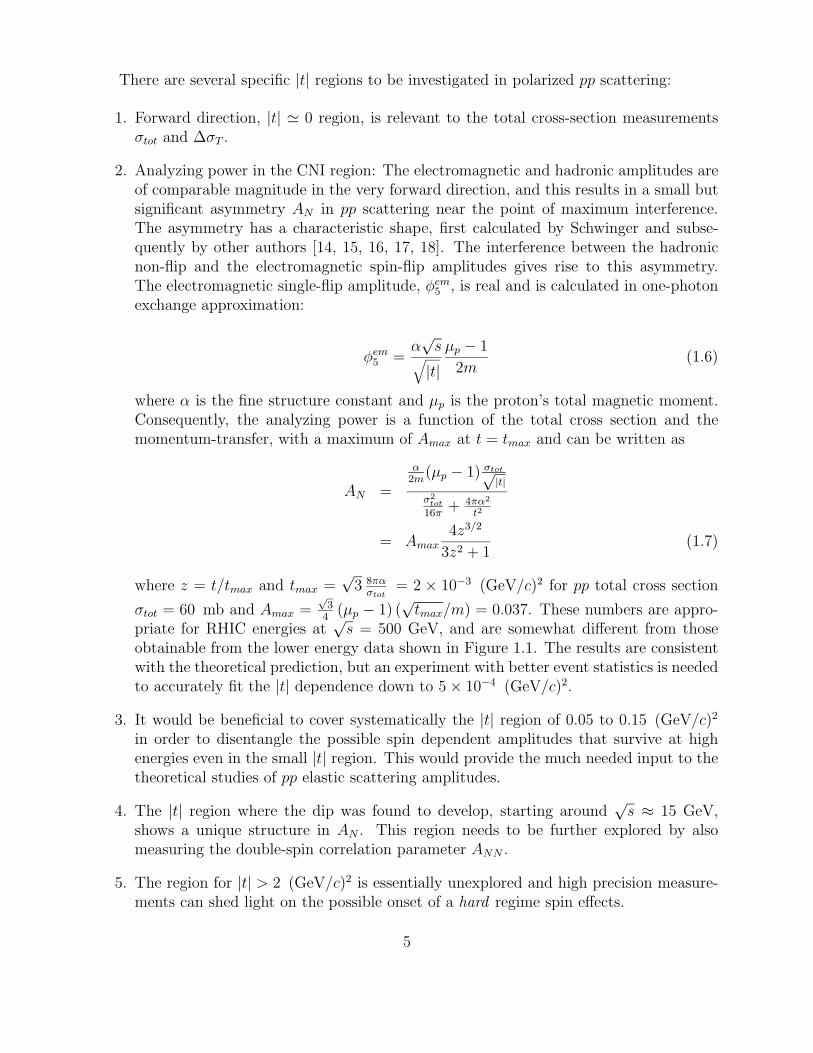
There are several specific |t| regions to be investigated in polarized pp scattering:
1. Forward direction, |t| 0 region, is relevant to the total cross-section measurementsσtot and ∆σT .
2. Analyzing power in the CNI region: The electromagnetic and hadronic amplitudes areof comparable magnitude in the very forward direction, and this results in a small butsignificant asymmetry AN in pp scattering near the point of maximum interference.The asymmetry has a characteristic shape, first calculated by Schwinger and subse-quently by other authors [14, 15, 16, 17, 18]. The interference between the hadronicnon-flip and the electromagnetic spin-flip amplitudes gives rise to this asymmetry.The electromagnetic single-flip amplitude, φem
5 , is real and is calculated in one-photonexchange approximation:
φem5 =
α√
s√|t|
µp − 1
2m(1.6)
where α is the fine structure constant and µp is the proton’s total magnetic moment.Consequently, the analyzing power is a function of the total cross section and themomentum-transfer, with a maximum of Amax at t = tmax and can be written as
AN =
α2m
(µp − 1) σtot√|t|
σ2tot
16π+ 4πα2
t2
= Amax4z3/2
3z2 + 1(1.7)
where z = t/tmax and tmax =√
3 8πασtot
= 2 × 10⁻³ (GeV/c)2 for pp total cross section
σtot = 60 mb and Amax =√
34
(µp − 1) (√
tmax/m) = 0.037. These numbers are appro-priate for RHIC energies at
√s = 500 GeV, and are somewhat different from those
obtainable from the lower energy data shown in Figure 1.1. The results are consistentwith the theoretical prediction, but an experiment with better event statistics is neededto accurately fit the |t| dependence down to 5 × 10⁻⁴ (GeV/c)2.
3. It would be beneficial to cover systematically the |t| region of 0.05 to 0.15 (GeV/c)2
in order to disentangle the possible spin dependent amplitudes that survive at highenergies even in the small |t| region. This would provide the much needed input to thetheoretical studies of pp elastic scattering amplitudes.
4. The |t| region where the dip was found to develop, starting around√
s ≈ 15 GeV,shows a unique structure in AN . This region needs to be further explored by alsomeasuring the double-spin correlation parameter ANN .
5. The region for |t| > 2 (GeV/c)2 is essentially unexplored and high precision measure-ments can shed light on the possible onset of a hard regime spin effects.
5
As noted earlier, polarization measurements in elastic scattering have only been per-formed with a fixed target up to 300 GeV/c (
√s = 24 GeV). When the polarization asym-
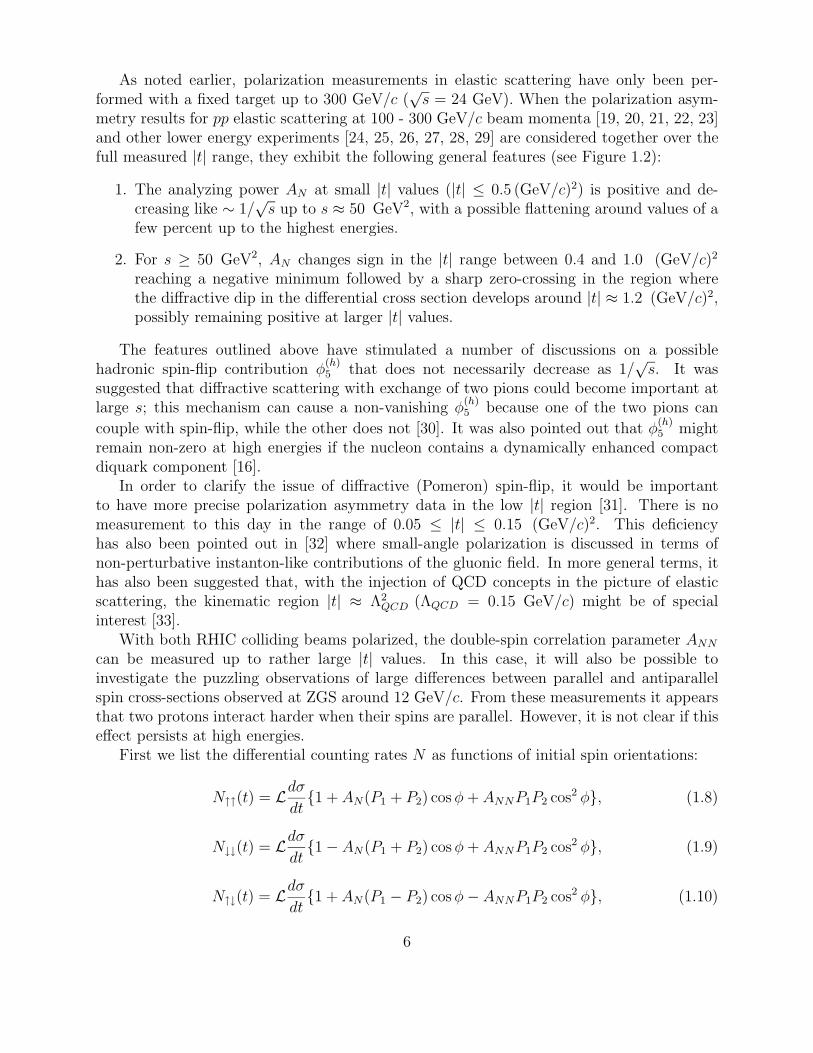
metry results for pp elastic scattering at 100 - 300 GeV/c beam momenta [19, 20, 21, 22, 23]and other lower energy experiments [24, 25, 26, 27, 28, 29] are considered together over thefull measured |t| range, they exhibit the following general features (see Figure 1.2):
1. The analyzing power AN at small |t| values (|t| ≤ 0.5 (GeV/c)2) is positive and de-creasing like ∼ 1/
√s up to s ≈ 50 GeV2, with a possible flattening around values of a
few percent up to the highest energies.
2. For s ≥ 50 GeV2, AN changes sign in the |t| range between 0.4 and 1.0 (GeV/c)2
reaching a negative minimum followed by a sharp zero-crossing in the region wherethe diffractive dip in the differential cross section develops around |t| ≈ 1.2 (GeV/c)2,possibly remaining positive at larger |t| values.
The features outlined above have stimulated a number of discussions on a possiblehadronic spin-flip contribution φ
(h)5 that does not necessarily decrease as 1/
√s. It was
suggested that diffractive scattering with exchange of two pions could become important atlarge s; this mechanism can cause a non-vanishing φ
(h)5 because one of the two pions can
couple with spin-flip, while the other does not [30]. It was also pointed out that φ(h)5 might
remain non-zero at high energies if the nucleon contains a dynamically enhanced compactdiquark component [16].
In order to clarify the issue of diffractive (Pomeron) spin-flip, it would be importantto have more precise polarization asymmetry data in the low |t| region [31]. There is nomeasurement to this day in the range of 0.05 ≤ |t| ≤ 0.15 (GeV/c)2. This deficiencyhas also been pointed out in [32] where small-angle polarization is discussed in terms ofnon-perturbative instanton-like contributions of the gluonic field. In more general terms, ithas also been suggested that, with the injection of QCD concepts in the picture of elasticscattering, the kinematic region |t| ≈ Λ2
QCD (ΛQCD = 0.15 GeV/c) might be of specialinterest [33].
With both RHIC colliding beams polarized, the double-spin correlation parameter ANN
can be measured up to rather large |t| values. In this case, it will also be possible toinvestigate the puzzling observations of large differences between parallel and antiparallelspin cross-sections observed at ZGS around 12 GeV/c. From these measurements it appearsthat two protons interact harder when their spins are parallel. However, it is not clear if thiseffect persists at high energies.
First we list the differential counting rates N as functions of initial spin orientations:
N↑↑(t) = Ldσ
dt1 + AN(P1 + P2) cos φ + ANNP1P2 cos2 φ, (1.8)
N↓↓(t) = Ldσ
dt1 − AN(P1 + P2) cos φ + ANNP1P2 cos2 φ, (1.9)
N↑↓(t) = Ldσ
dt1 + AN(P1 − P2) cos φ − ANNP1P2 cos2 φ, (1.10)
6
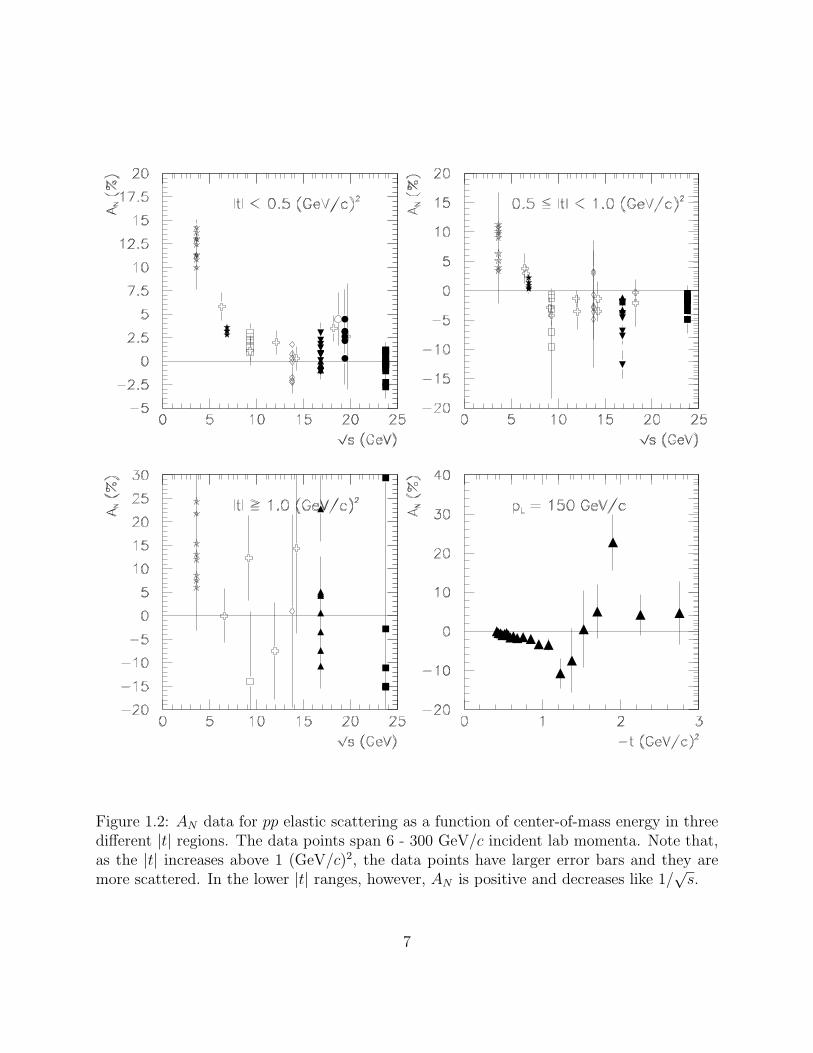
Figure 1.2: AN data for pp elastic scattering as a function of center-of-mass energy in threedifferent |t| regions. The data points span 6 - 300 GeV/c incident lab momenta. Note that,as the |t| increases above 1 (GeV/c)2, the data points have larger error bars and they aremore scattered. In the lower |t| ranges, however, AN is positive and decreases like 1/
√s.
7
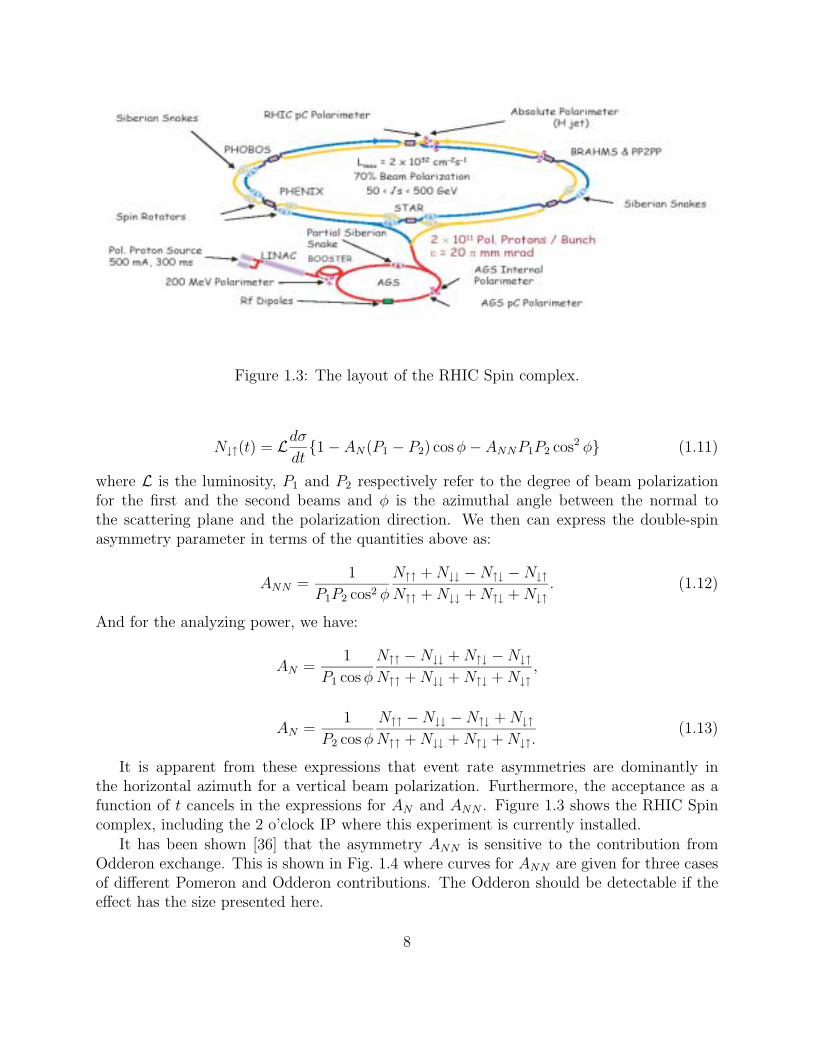
Figure 1.3: The layout of the RHIC Spin complex.
N↓↑(t) = Ldσ
dt1 − AN(P1 − P2) cos φ − ANNP1P2 cos2 φ (1.11)
where L is the luminosity, P1 and P2 respectively refer to the degree of beam polarizationfor the first and the second beams and φ is the azimuthal angle between the normal tothe scattering plane and the polarization direction. We then can express the double-spinasymmetry parameter in terms of the quantities above as:
ANN =1
P1P2 cos2 φ
N↑↑ + N↓↓ − N↑↓ − N↓↑N↑↑ + N↓↓ + N↑↓ + N↓↑
. (1.12)
And for the analyzing power, we have:
AN =1
P1 cos φ
N↑↑ − N↓↓ + N↑↓ − N↓↑N↑↑ + N↓↓ + N↑↓ + N↓↑
,
AN =1
P2 cos φ
N↑↑ − N↓↓ − N↑↓ + N↓↑N↑↑ + N↓↓ + N↑↓ + N↓↑.
(1.13)
It is apparent from these expressions that event rate asymmetries are dominantly inthe horizontal azimuth for a vertical beam polarization. Furthermore, the acceptance as afunction of t cancels in the expressions for AN and ANN . Figure 1.3 shows the RHIC Spincomplex, including the 2 o’clock IP where this experiment is currently installed.
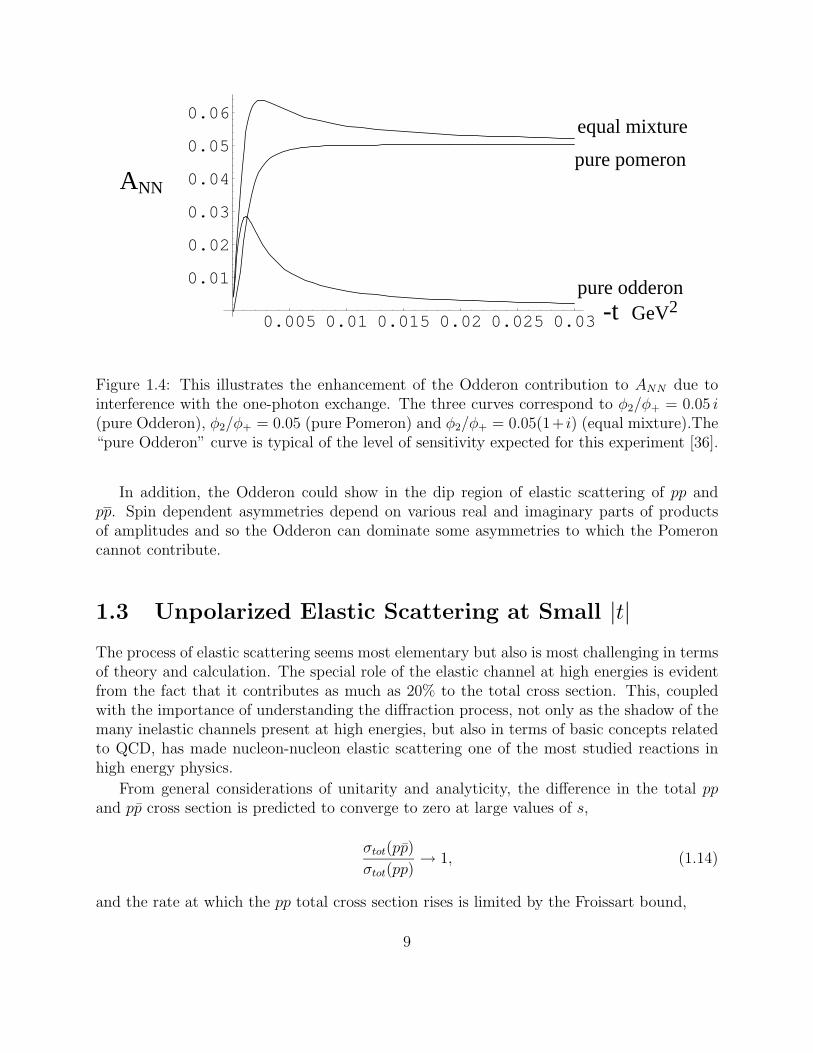
It has been shown [36] that the asymmetry ANN is sensitive to the contribution fromOdderon exchange. This is shown in Fig. 1.4 where curves for ANN are given for three casesof different Pomeron and Odderon contributions. The Odderon should be detectable if theeffect has the size presented here.
8
0.005 0.01 0.015 0.02 0.025 0.03
0.01
0.02
0.03
0.04
0.05
0.06
ANN
-t GeV2
equal mixture
pure pomeron
pure odderon
Figure 1.4: This illustrates the enhancement of the Odderon contribution to ANN due tointerference with the one-photon exchange. The three curves correspond to φ2/φ+ = 0.05 i(pure Odderon), φ2/φ+ = 0.05 (pure Pomeron) and φ2/φ+ = 0.05(1+ i) (equal mixture).The“pure Odderon” curve is typical of the level of sensitivity expected for this experiment [36].
In addition, the Odderon could show in the dip region of elastic scattering of pp andpp. Spin dependent asymmetries depend on various real and imaginary parts of productsof amplitudes and so the Odderon can dominate some asymmetries to which the Pomeroncannot contribute.
1.3 Unpolarized Elastic Scattering at Small |t|The process of elastic scattering seems most elementary but also is most challenging in termsof theory and calculation. The special role of the elastic channel at high energies is evidentfrom the fact that it contributes as much as 20% to the total cross section. This, coupledwith the importance of understanding the diffraction process, not only as the shadow of themany inelastic channels present at high energies, but also in terms of basic concepts relatedto QCD, has made nucleon-nucleon elastic scattering one of the most studied reactions inhigh energy physics.
From general considerations of unitarity and analyticity, the difference in the total ppand pp cross section is predicted to converge to zero at large values of s,
σtot(pp)
σtot(pp)→ 1, (1.14)
and the rate at which the pp total cross section rises is limited by the Froissart bound,
9
σtot(s) <1
m2π
log2 s. (1.15)
The most clear-cut implication of the existence of the Odderon is that it would lead toasymptotically different amplitudes for the scattering of a particle and its anti-particle offthe same target. This means that the total cross sections and the differential cross sectionsfor, say, pp and pp scattering at high energy will remain different as
√s, the total center-of
mass energy, increases; while in the absence of an Odderon they would become the same,roughly as 1/
√s. With pp2pp, a decisive test of this feature becomes possible because of
the existence of data at the same energy in pp scattering. There are suggestions that theOdderon might be important because the difference between the pp and pp differential crosssections in the dip region appears to persist as the energy grows. At the same time fits toσtot and ρ, the ratio of real to imaginary parts of the forward, helicity-diagonal amplitudes,over a wide energy range for both pp and pp leave little room for the Odderon at t = 0[37, 38].
As the summary of elastic scattering measurements and phenomenological models is givenin [39], we shall mention only a few open questions here.
By using a perturbative approach, the accepted theory of strong interactions, Quan-tum Chromo Dynamics (QCD), has been very successful in describing hadronic interactionsat large four-momentum-transfer squared |t|. For small |t| values of elastic scattering, thetheory has not been as successful. This is the regime of soft hadronic interactions where phe-nomenological models, constrained by asymptotic theorems, are used to explain the natureof the hadronic interaction.
The elastic scattering of protons is described by a scattering amplitude which has twocomponents: the electromagnetic part, described by the well-known Coulomb amplitudefc, and the hadronic part, described by the hadronic amplitude fh. The amplitudes are afunction of cms energy
√s and four-momentum-transfer squared |t|. The differential elastic
pp cross section can be expressed as a square of the scattering amplitude:
dσel
dt= π|fc + fh|2. (1.16)
The spin independent hadronic amplitude fh is usually parameterized as:
fh =(
σtot
4π
)(ρ + i) exp
(−1
2b|t|
). (1.17)
The quantity ρ is the ratio of the real to imaginary part of the nuclear amplitude at |t| = 0and is related to the high-energy behavior of the total cross section via dispersion relations.This means that ρ is related to the behavior of the total cross section σtot at higher energies.The Coulomb amplitude fc is given by:
fc = −2αG2(t)
|t| exp(iαφ), (1.18)
where α is the fine structure constant, G(t), is the proton electromagnetic form factor, andφ is the Coulomb phase, which is:
10
φ = ln
(0.08
|t|)− 0.577. (1.19)
The total cross section is related to the differential elastic cross section by the opticaltheorem:
σ2tot =
(16π (hc)2
1 + ρ2
)dσel
dt|t=0. (1.20)
The dependence of the differential elastic cross section dσ/dt on |t| can be divided intothree regions: the Coulomb region, the CNI region, and the hadronic region. At small |t|,the Coulomb term dominates, and dσ/dt has a (1/t2) dependence. As |t| increases, theinterference between the Coulomb and hadronic contributions becomes maximal. Finally,the hadronic contribution dominates, and dσ/dt falls off exponentially. The present sta-tus of σtot, ρ, b measurements in pp and pp collisions is shown in figures 1.5, 1.6, and 1.7,respectively [40].
In order to determine ρ, one needs to be able to make measurements in the small |t|region. The scale is set by the |t| value where Coulomb and hadronic amplitudes are equal.At
√s = 200 GeV, this occurs at |t| 3 × 10⁻³(GeV/c)2, and corresponds to a scattering
angle of 0.54 mrad.Since the Coulomb amplitude is known absolutely, the measurement at very small |t|
gives a direct determination of the machine’s luminosity and, consequently, the absolutenormalization of the hadronic amplitude. As a result, the parameters of the elastic crosssection can be determined without requiring an independent measurement of the luminosityor the total cross section.
The pp total cross sections measured at Serpukhov and the Intersecting Storage Rings(ISR) at CERN in the 1970s were found to rise with energy. Before this discovery, it wasgenerally accepted that the total cross sections for both pp and pp would decrease as afunction of cms energy and converge to a common constant value. The ln2 s behavior versusln s behavior of the rise of σtot is still an important topic for investigation.
Among other questions to be explained are the rise of σel/σtot for pp between ISR andSppS energies, and the existence of a dip in dσel/dt at low energies, which is more pronouncedin pp than in pp interactions, and its plateau-like shape at the SppS energies.
We intend to make a precision measurement of the energy dependence of the pp totalcross section, σtot, in an uncovered domain of energy, 60 ≤ √
s ≤ 500 GeV, to be able tomake a quantitative comparison with σtot(pp). In such a way one obtains knowledge aboutthe very important difference ∆σ = σtot(pp) − σtot(pp), which is critical in distinguishingtheoretical models. In the classical Pomeron model, it must go to zero with increasing
√s,
while other models do not exclude a plateau, or its growth with√
s.
1.4 Scattering at Medium Momentum Transfer
Elastic scattering away from the very forward region provides important information onthe dynamics of high-energy collisions. The most complete set of proton-proton scattering
11
pp2pp range
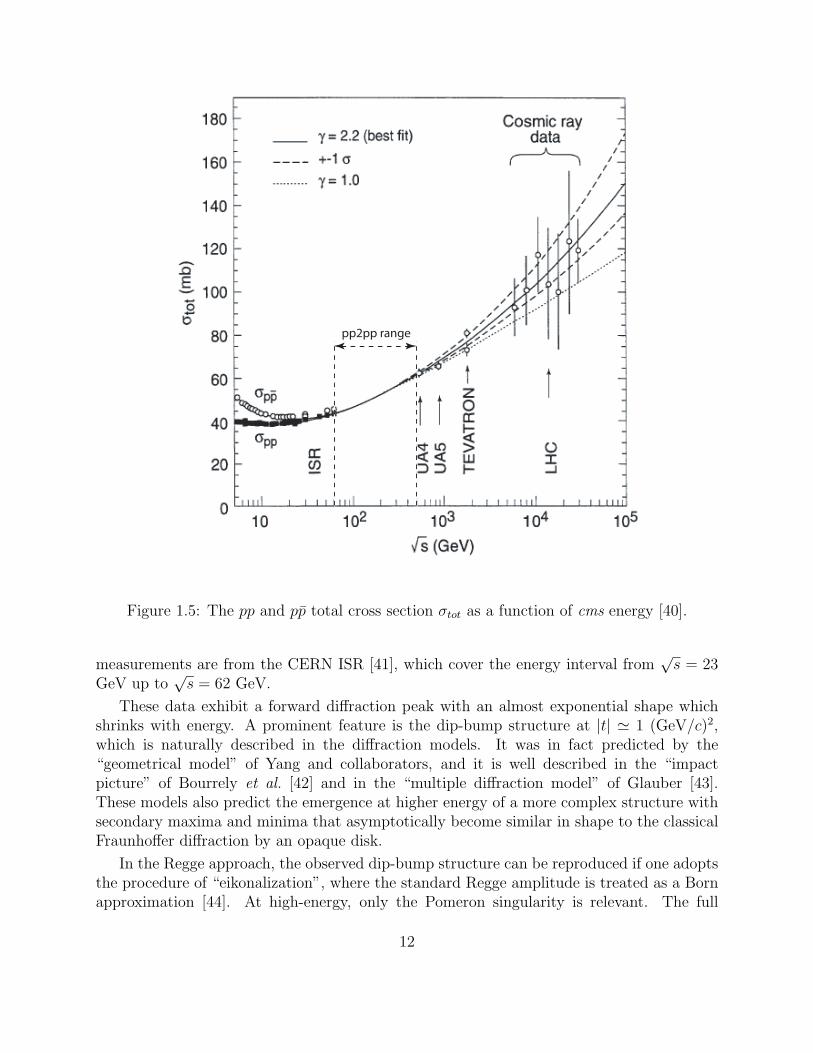
Figure 1.5: The pp and pp total cross section σtot as a function of cms energy [40].
measurements are from the CERN ISR [41], which cover the energy interval from√
s = 23GeV up to
√s = 62 GeV.
These data exhibit a forward diffraction peak with an almost exponential shape whichshrinks with energy. A prominent feature is the dip-bump structure at |t| 1 (GeV/c)2,which is naturally described in the diffraction models. It was in fact predicted by the“geometrical model” of Yang and collaborators, and it is well described in the “impactpicture” of Bourrely et al. [42] and in the “multiple diffraction model” of Glauber [43].These models also predict the emergence at higher energy of a more complex structure withsecondary maxima and minima that asymptotically become similar in shape to the classicalFraunhoffer diffraction by an opaque disk.
In the Regge approach, the observed dip-bump structure can be reproduced if one adoptsthe procedure of “eikonalization”, where the standard Regge amplitude is treated as a Bornapproximation [44]. At high-energy, only the Pomeron singularity is relevant. The full
12
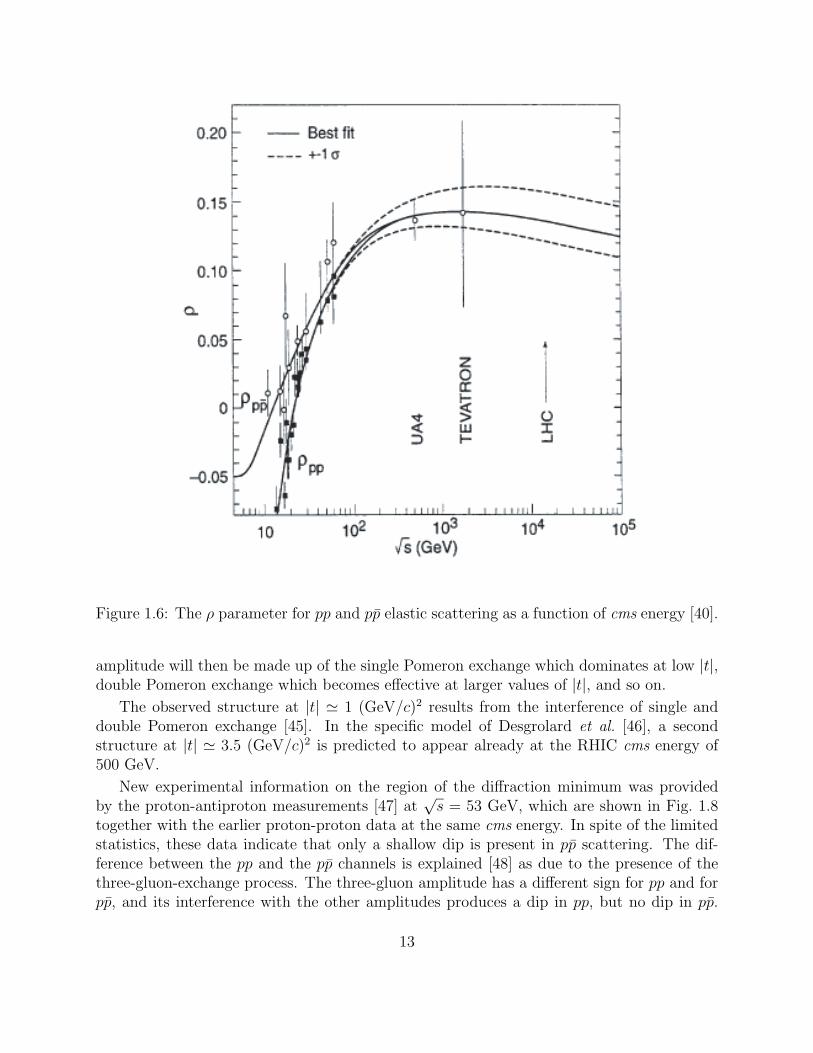
Figure 1.6: The ρ parameter for pp and pp elastic scattering as a function of cms energy [40].
amplitude will then be made up of the single Pomeron exchange which dominates at low |t|,double Pomeron exchange which becomes effective at larger values of |t|, and so on.
The observed structure at |t| 1 (GeV/c)2 results from the interference of single anddouble Pomeron exchange [45]. In the specific model of Desgrolard et al. [46], a secondstructure at |t| 3.5 (GeV/c)2 is predicted to appear already at the RHIC cms energy of500 GeV.
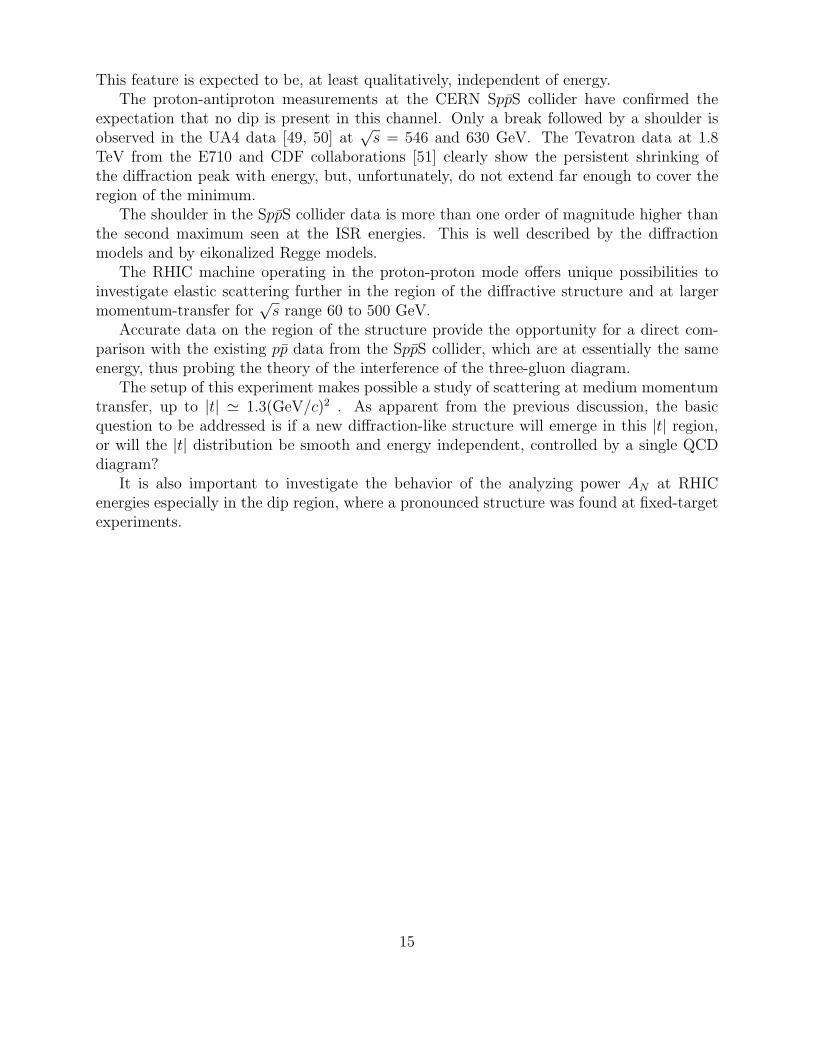
New experimental information on the region of the diffraction minimum was providedby the proton-antiproton measurements [47] at
√s = 53 GeV, which are shown in Fig. 1.8
together with the earlier proton-proton data at the same cms energy. In spite of the limitedstatistics, these data indicate that only a shallow dip is present in pp scattering. The dif-ference between the pp and the pp channels is explained [48] as due to the presence of thethree-gluon-exchange process. The three-gluon amplitude has a different sign for pp and forpp, and its interference with the other amplitudes produces a dip in pp, but no dip in pp.
13
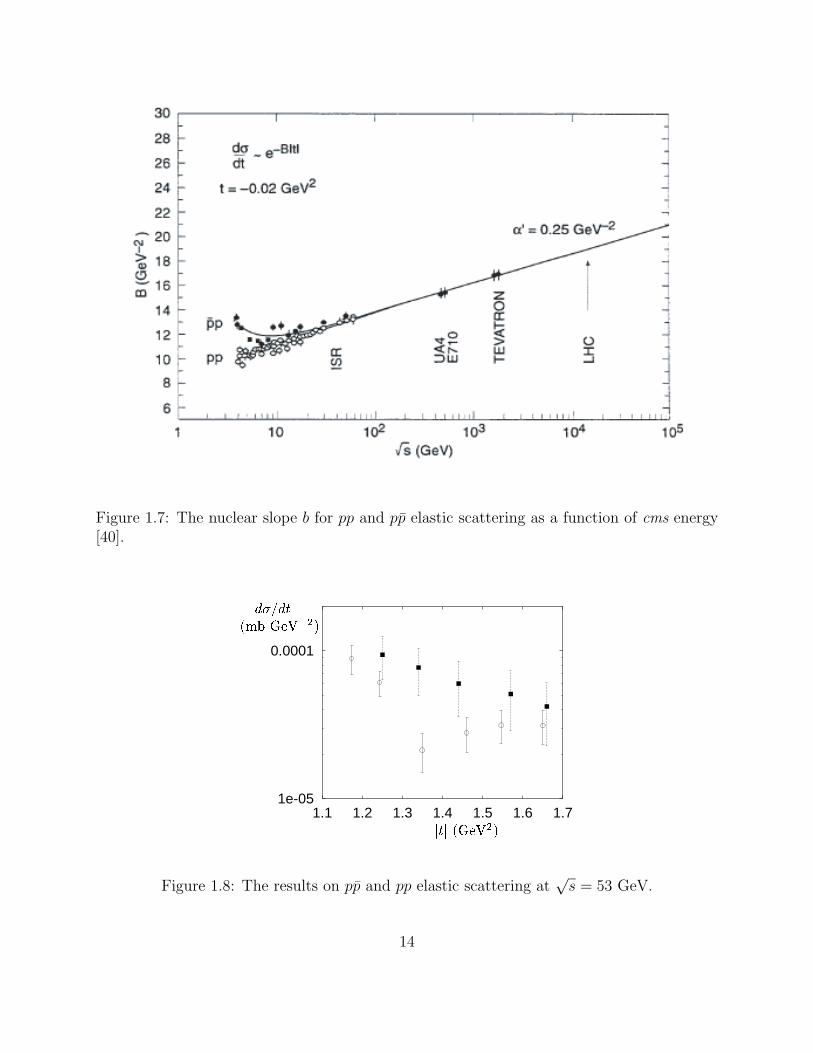
Figure 1.7: The nuclear slope b for pp and pp elastic scattering as a function of cms energy[40].
1e-05
0.0001
1.1 1.2 1.3 1.4 1.5 1.6 1.7
Figure 1.8: The results on pp and pp elastic scattering at√
s = 53 GeV.
14
This feature is expected to be, at least qualitatively, independent of energy.The proton-antiproton measurements at the CERN SppS collider have confirmed the
expectation that no dip is present in this channel. Only a break followed by a shoulder isobserved in the UA4 data [49, 50] at
√s = 546 and 630 GeV. The Tevatron data at 1.8
TeV from the E710 and CDF collaborations [51] clearly show the persistent shrinking ofthe diffraction peak with energy, but, unfortunately, do not extend far enough to cover theregion of the minimum.
The shoulder in the SppS collider data is more than one order of magnitude higher thanthe second maximum seen at the ISR energies. This is well described by the diffractionmodels and by eikonalized Regge models.
The RHIC machine operating in the proton-proton mode offers unique possibilities toinvestigate elastic scattering further in the region of the diffractive structure and at largermomentum-transfer for
√s range 60 to 500 GeV.
Accurate data on the region of the structure provide the opportunity for a direct com-parison with the existing pp data from the SppS collider, which are at essentially the sameenergy, thus probing the theory of the interference of the three-gluon diagram.
The setup of this experiment makes possible a study of scattering at medium momentumtransfer, up to |t| 1.3(GeV/c)2 . As apparent from the previous discussion, the basicquestion to be addressed is if a new diffraction-like structure will emerge in this |t| region,or will the |t| distribution be smooth and energy independent, controlled by a single QCDdiagram?
It is also important to investigate the behavior of the analyzing power AN at RHICenergies especially in the dip region, where a pronounced structure was found at fixed-targetexperiments.
15
Chapter 2
Accomplishments to Date of pp2pp
We review here the equipment that has been built, installed, commissioned and used duringtwo short data taking runs. Later we will review the experimental technique that used thisequipment and then describe the results of the 30 hours engineering run in 2002, which hasbeen submitted for publication and the projected results from our short two day data takingrun in 2003.
2.1 Existing pp2pp Equipment
Two sets of Roman Pot (RP) stations have been built and installed at the 57 m and 60 mdistance, on both sides, relative to the interaction point (IP), shown in Fig. 2.1. We installedthe experiment in the 2 o’clock area, and, since our detectors were placed away from theinteraction point, they do not interfere with the BRAHMS experiment at the same IP. Afterscraping of the beam, to reduce the emittance, we were able to approach to within 14 mmof the beam.
The RP stations have been fully instrumented with the silicon strip detectors and atrigger scintillator counter. There were two x and two y planes of detectors for each RP. Thesilicon strip detector had a strip pitch of 0.1 mm. More details concerning the strip detectorsare described in the next section. Behind the strip detectors were the scintillation counterswhich were 8 mm thick and 80x50 mm2 in area and were viewed by two photomultipliertubes (PMT). The two PMT signals were in a logical OR in the trigger to produce a counterefficiency of greater than 99% and independent of position of the hit.
The trigger system was designed, installed and fully commissioned in the 2002 engineeringrun along with the data acquisition system. The logic used was an OR of the two PMTsin any pot and then a coincidence with an appropriate pot on both sides of the intersectionregion. That signal was put into coincidence with a beam crossing signal. It yielded a cleansignal of elastic events. In addition, a set of scintillation counters was installed in the IPregion to measure a fraction of inelastic scattering events. They were used for luminositymonitoring.
16
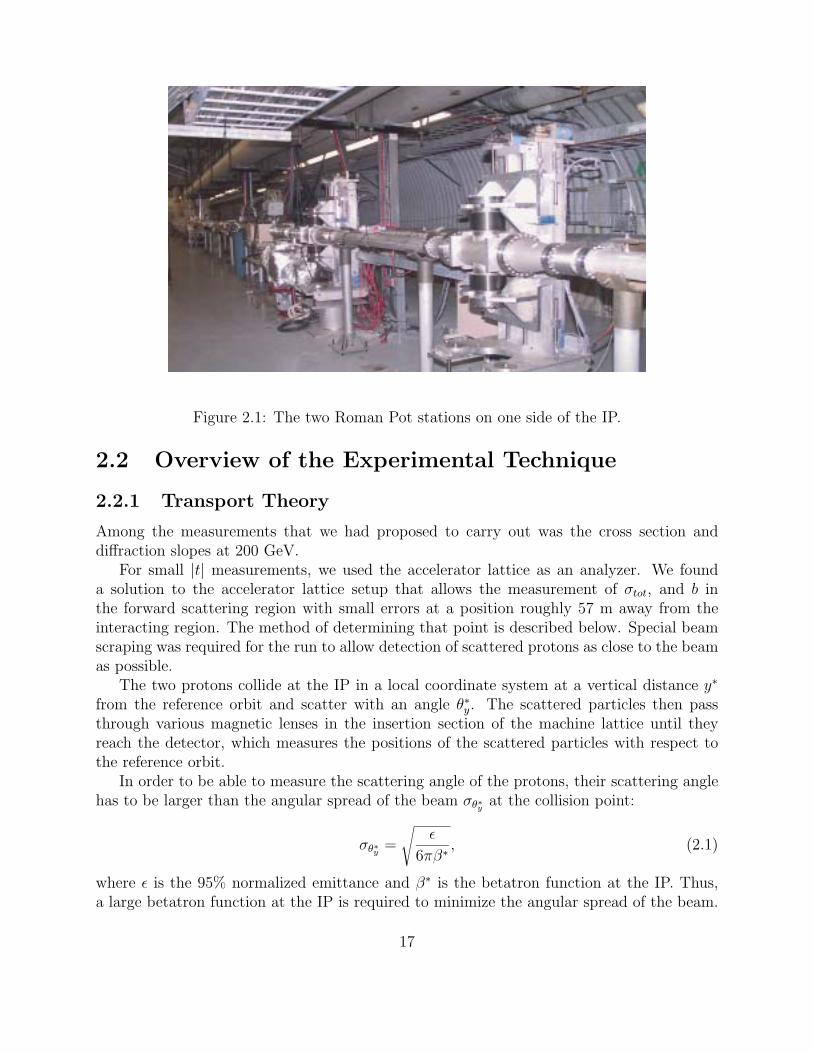
Figure 2.1: The two Roman Pot stations on one side of the IP.
2.2 Overview of the Experimental Technique
2.2.1 Transport Theory
Among the measurements that we had proposed to carry out was the cross section anddiffraction slopes at 200 GeV.
For small |t| measurements, we used the accelerator lattice as an analyzer. We founda solution to the accelerator lattice setup that allows the measurement of σtot, and b inthe forward scattering region with small errors at a position roughly 57 m away from theinteracting region. The method of determining that point is described below. Special beamscraping was required for the run to allow detection of scattered protons as close to the beamas possible.
The two protons collide at the IP in a local coordinate system at a vertical distance y∗
from the reference orbit and scatter with an angle θ∗y. The scattered particles then passthrough various magnetic lenses in the insertion section of the machine lattice until theyreach the detector, which measures the positions of the scattered particles with respect tothe reference orbit.
In order to be able to measure the scattering angle of the protons, their scattering anglehas to be larger than the angular spread of the beam σθ∗y at the collision point:
σθ∗y =
√ε
6πβ∗ , (2.1)
where ε is the 95% normalized emittance and β∗ is the betatron function at the IP. Thus,a large betatron function at the IP is required to minimize the angular spread of the beam.
17
The magnitude of the betatron function β∗ determines also the size of the beam spot σ∗y ,
which is given by:
σ∗y =
√εβ∗
6π. (2.2)
Since the scattered protons follow trajectories determined by the lattice of the accelerator,the known parameters of the accelerator lattice can be used to calculate the deflection y∗
and the scattering angle θ∗y at the interaction point, knowing the deflection y and the angleθy at the detector. At a point where the phase advance from the interaction point is Ψ andthe betatron function is β, y is given by [52]:
y =
√β
β∗ [cos Ψ + α∗ sin Ψ]y∗ +√
(ββ∗) sin Ψθ∗y (2.3)
where α∗ is the derivative of the betatron function β∗ at the interaction point. We haveconsidered a lattice configuration such that α∗ is very close to zero.
Equation 2.3 can be rewritten as:
y = a11y∗ + Leffθ
∗y (2.4)
where
a11 =
√√√√(β
β∗
)[cos Ψ + α∗ sin Ψ] , Leff =
√β∗β sin Ψ. (2.5)
The optimum condition for the experiment is to have a11 = 0 and Leff as large aspossible, since the answer is then independent of the coordinate at the IP in the transverseplane of the accelerator and “large displacements” at the detection point are obtained forsmall scattering angles. This is achieved when Ψ is an odd multiple of π/2. The expressionfor the y coordinate at the detection point then simplifies to:
y = Leffθ∗y. (2.6)
Therefore, if the detector is located at a point where the phase advance is an odd multipleof π/2, then the scattering angle is determined just from the measurement of the displace-ment alone. With the above condition satisfied, rays that are parallel to each other at theinteraction point are focused onto a single point at the detector, commonly called “parallelto point focusing.”
Another question, related to the optimization of the accelerator setup, is the smallestmeasurable four-momentum-transfer squared tmin. The goal is to achieve tmin as small aspossible. The tmin is determined by the smallest scattering angle measured θmin, which,using Eqn. 2.6, is given by:
θ∗min =dmin
Leff
, (2.7)
18
The minimum distance of the approach to the beam, dmin, can be expressed in terms of thebeam size at the detector position and the “dead space of the detector” d0:
dmin = kσy + d0, (2.8)
where k is a machine dependent constant, which is optimized by beam scraping, and σy isthe beam size at the detection point. Assuming d0 is small, the tmin is then:
|tmin| ≈ k2εp2
β∗ . (2.9)
We can see that the smallest tmin is reached by having β∗ as large as possible and byreducing the k-factor and the emittance, in other words by optimizing the beam scraping.
2.2.2 Actual Beam Transport
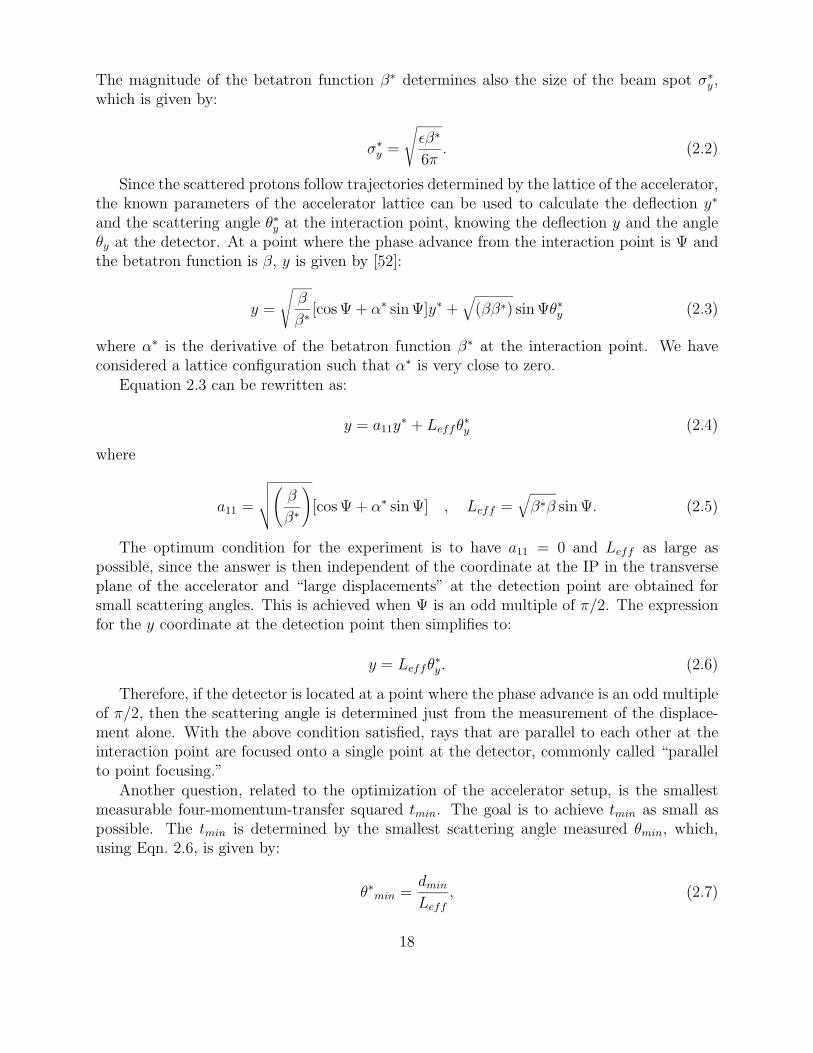
The geometry of the outgoing beam transport at the IP2 is displayed in Fig. 2.2. Protonbeams travel from left to right in this lattice along a central design trajectory. The RomanPot stations (RP) in the Q3–4 warm straight detect protons that have elastically scatteredat IP2, limited by the Q1–3 quadrupole apertures and detector acceptance. It is importantto know the beam transport of these scattered protons between IP2 and the detectors tounderstand systematics in the reconstruction of scattering data.
DX D0Q2 Q3 Q4
IP2
driftdrift driftM123 drift
RP RP
Q1
Figure 2.2: pp2pp IP2 lattice layout. Drift transport is trivial when the geometry is known.Knowledge of the off-axis triplet transport M123 and DX/D0 multipole fields is then requiredto obtain scattered proton transport to the few percent level.
Primary beam measurements cannot be used to directly measure the off-axis near-aperture quadrupole fields and scattered beam transport, due to the likelihood of a supercon-ducting magnet quench. Primary beam transport is instead measured on the design orbit,confirming magnet settings and knowledge of local imperfections such as triplet quadrupoleroll angles. This measurement is performed by exciting the beam with tunemeter kickers oran AC dipole, and using local dual-plane BPMs (shown as double-headed arrows in Fig. 2.2),and confirms local phase advances and beta functions with systematics of a few percent andrandoms of less than a percent. This measurement is not sensitive to systematics in BPMgains or offsets.
19
Another beta function measurement is performed at each IP quadrupole, varying itsindividual focusing strength over several points by a few percent and measuring the cor-responding tune change with the PLL tunemeter: 〈β(s)〉 = −4π ∆ν/∆KL(s). This isa dedicated measurement because such tune changes can lead to depolarization and evenbeam loss. It is sensitive to systematic errors in the PLL system, but during the FY03 runthis measurement was consistent with the excited beam measurements to a few percent.
These phase and beta function measurements are then compared to a model basedon measured magnet currents, using measured transfer functions from the RHIC magnetdatabase, measured RHIC survey offsets, and measured triplet roll angles. Agreement isconfirmation that base optics are correct. These base optics are then extrapolated to off-axis field maps using triplet field components up to decapole as measured for the specificRHIC triplet quadrupoles of IP2. These extrapolations are conservatively good to 1% at aposition as close as 1 mm to the coil aperture [53]. They are expected to provide systematictrajectory-dependent corrections to pp2pp beam transport at the level of a few percent.
2.2.3 Measurement of the Beam Angle and Position at the IP
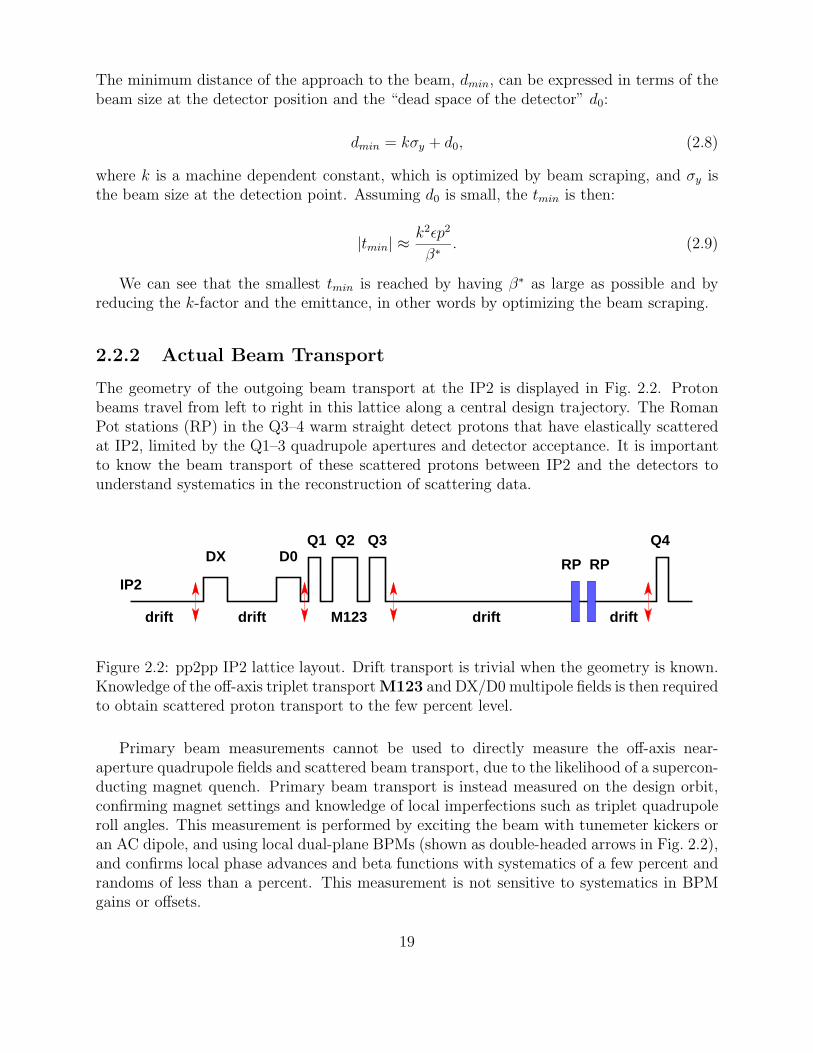
The geometry of the IP2 between the DX separation magnets is shown in Fig. 2.3. Beamtrajectories through this straight section are measured with two DX BPMs, each attachedto the IP-side of the corresponding DX magnet cryostat. The beam collision point is wherethese two trajectories cross. The vertex can be compared to the elastic scattering vertexdistribution, and vertex corrections can be applied to further eliminate beam transportsystematics.
DX DX
DX BPM DX BPM
16.65 m
IP2yellow beam
blue beam yellow beam
blue beam
Figure 2.3: Overhead view of IP2 between the DX magnets (not to scale), showing beamtrajectories and locations of the DX BPMs g1-bx and g2-bx. A small symmetric crossingangle has been added for clarity.
For proper vertex corrections, the measured vertex must be in the same reference frame asthe roman pot survey. Calculation of the vertex from measured DX beam centroid positionshave several systematics that must be removed:
• Survey offset: The DX BPMs are attached directly to the flanges of the DX magnetcryostat, and were surveyed on January 10, 2001. These offsets are the same for bothrings since the DX BPMs see both beams.
20
• Electronics gain: DX BPM electronics are calibrated with onboard pulsers several timesper run, but have channel-specific gain and offset calibration errors that range up toseveral mm. These errors are gain-setting dependent. These offsets can be measuredby comparing position calculated from raw BPM signals to position calculated by theacquisition electronics.
Some systematics can be constrained with the knowledge that the beams are colliding atthe time of measurement. Work is underway to improve the DX BPM system timing, anddirectly measure raw signals and electronics gain offsets before and during the next run.
2.2.4 Silicon Strip Detector
Thirty two silicon strip detectors, with associated front end electronics, were used in pp2ppand had greater than 99.5% of working channels. Five spares with similar performance exist.Additionally, three spares are under repair and can be expected to achieve the same level ofperformance.
The silicon detectors are 400 µm thick, AC-coupled, single-sided strip detectors with anapproximate pitch of 100 µm. They feature p+ strips on n-type silicon bulk. Each p+ stripis terminated with a 2 MΩ polysilicon bias resistor. The detectors feature a double-metalfan-in from the 100 µm strip pitch to a 48 µm pitch at the detector edge. This permitsconnection to readout chips that are designed for the more commonly used 50 µm pitchdetectors. There are two types of the detectors, an x-view detector with vertical strips anda y-view detector with horizontal strips. Each type is approximately 7.5 × 4.7 cm2 in size.The detectors were manufactured by Hamamatsu Photonics.
The detectors are read by the SVXIIE [54] readout chip that was originally designed forthe D0 experiment at Fermilab. The SVXIIE is designed in a 0.1µm CMOS process and has128 input channels. Each channel features a charge integrator followed by an analog pipelinecapable of storing signals from the previous 32 bunch crossings. The SVXIIE features aWilkenson-type ADC for simultaneous digitization of all channels upon receipt of a trigger.Upon readout the SVXIIE outputs first a programmable chip id number followed by alter-nating 8-bit digitized data and channel number for all 128 channels. An option known as”sparsification” or ”zero suppression” exists for the SVXIIE to output only those channelswhose data exceed a preset threshold.
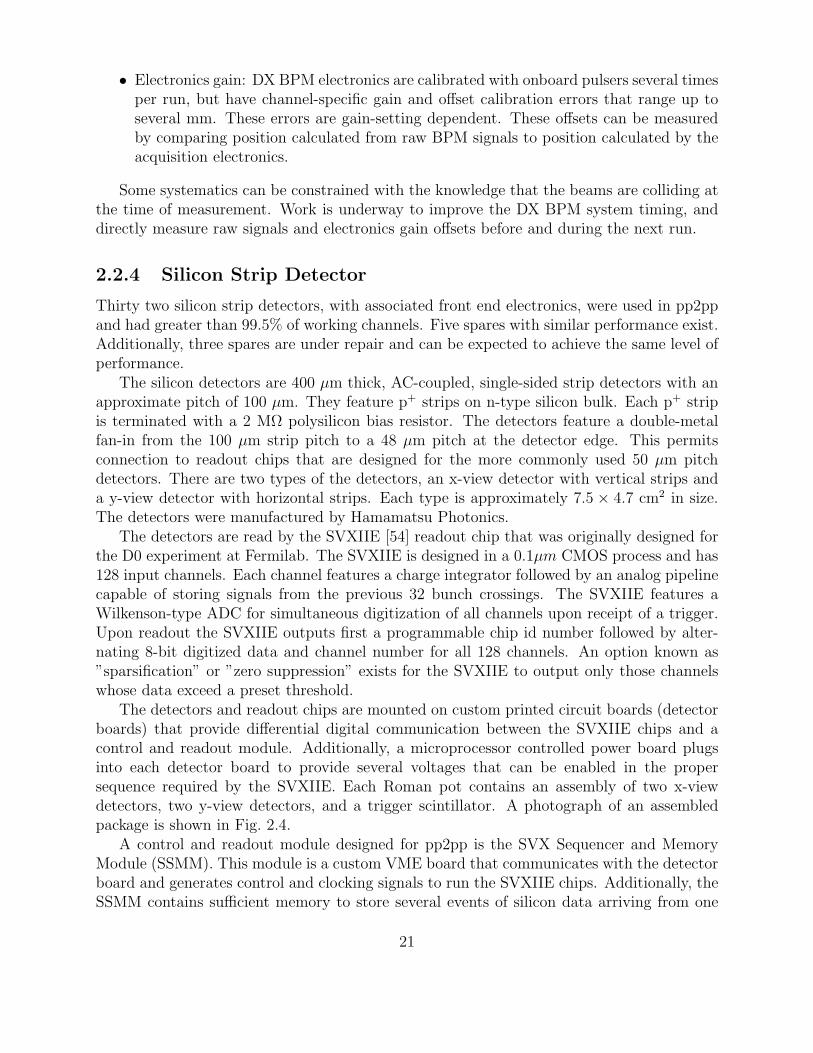
The detectors and readout chips are mounted on custom printed circuit boards (detectorboards) that provide differential digital communication between the SVXIIE chips and acontrol and readout module. Additionally, a microprocessor controlled power board plugsinto each detector board to provide several voltages that can be enabled in the propersequence required by the SVXIIE. Each Roman pot contains an assembly of two x-viewdetectors, two y-view detectors, and a trigger scintillator. A photograph of an assembledpackage is shown in Fig. 2.4.
A control and readout module designed for pp2pp is the SVX Sequencer and MemoryModule (SSMM). This module is a custom VME board that communicates with the detectorboard and generates control and clocking signals to run the SVXIIE chips. Additionally, theSSMM contains sufficient memory to store several events of silicon data arriving from one
21
Roman Pot. It has the additional feature that it can simultaneously read data from thedetector boards while writing out data over the VME backplane to maximize event rate. Inthe configuration used in pp2pp this resulted in a maximum data rate of about 400 Hz.
Figure 2.4: Assembled detector package on survey bench without trigger scintillator.
2.3 The Engineering Run in 2002
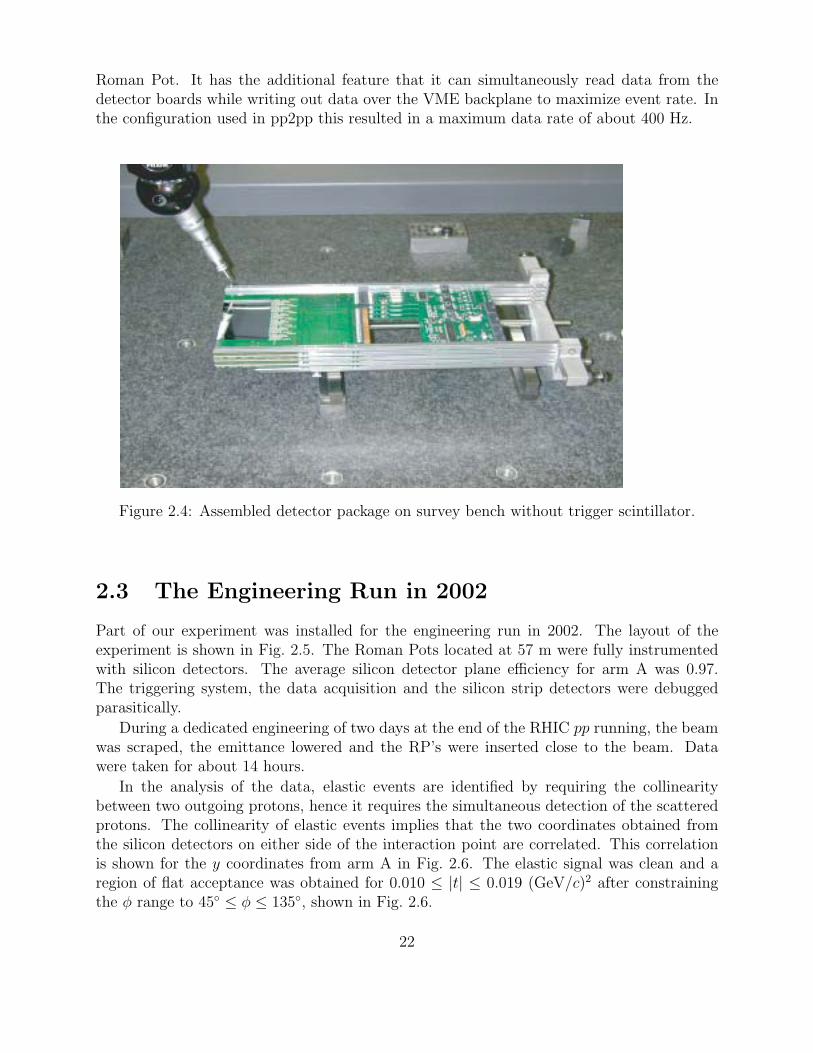
Part of our experiment was installed for the engineering run in 2002. The layout of theexperiment is shown in Fig. 2.5. The Roman Pots located at 57 m were fully instrumentedwith silicon detectors. The average silicon detector plane efficiency for arm A was 0.97.The triggering system, the data acquisition and the silicon strip detectors were debuggedparasitically.
During a dedicated engineering of two days at the end of the RHIC pp running, the beamwas scraped, the emittance lowered and the RP’s were inserted close to the beam. Datawere taken for about 14 hours.
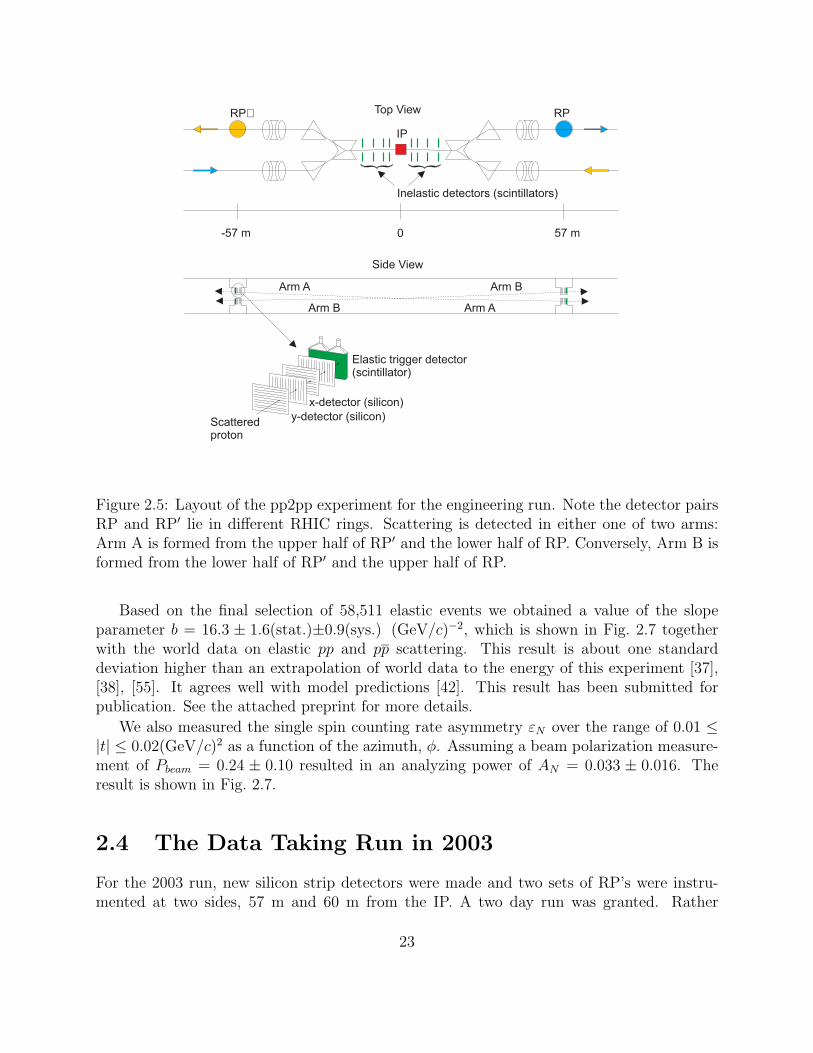
In the analysis of the data, elastic events are identified by requiring the collinearitybetween two outgoing protons, hence it requires the simultaneous detection of the scatteredprotons. The collinearity of elastic events implies that the two coordinates obtained fromthe silicon detectors on either side of the interaction point are correlated. This correlationis shown for the y coordinates from arm A in Fig. 2.6. The elastic signal was clean and aregion of flat acceptance was obtained for 0.010 ≤ |t| ≤ 0.019 (GeV/c)2 after constrainingthe φ range to 45 ≤ φ ≤ 135, shown in Fig. 2.6.
22
-57 m 0 57 m
IP
RPRP
y-detector (silicon)
x-detector (silicon)
Elastic trigger detector(scintillator)
*
*
*
*
*
Scatteredproton
Arm A
Arm AArm B
Arm B
Side View
Top View
Inelastic detectors (scintillators)
Figure 2.5: Layout of the pp2pp experiment for the engineering run. Note the detector pairsRP and RP′ lie in different RHIC rings. Scattering is detected in either one of two arms:Arm A is formed from the upper half of RP′ and the lower half of RP. Conversely, Arm B isformed from the lower half of RP′ and the upper half of RP.
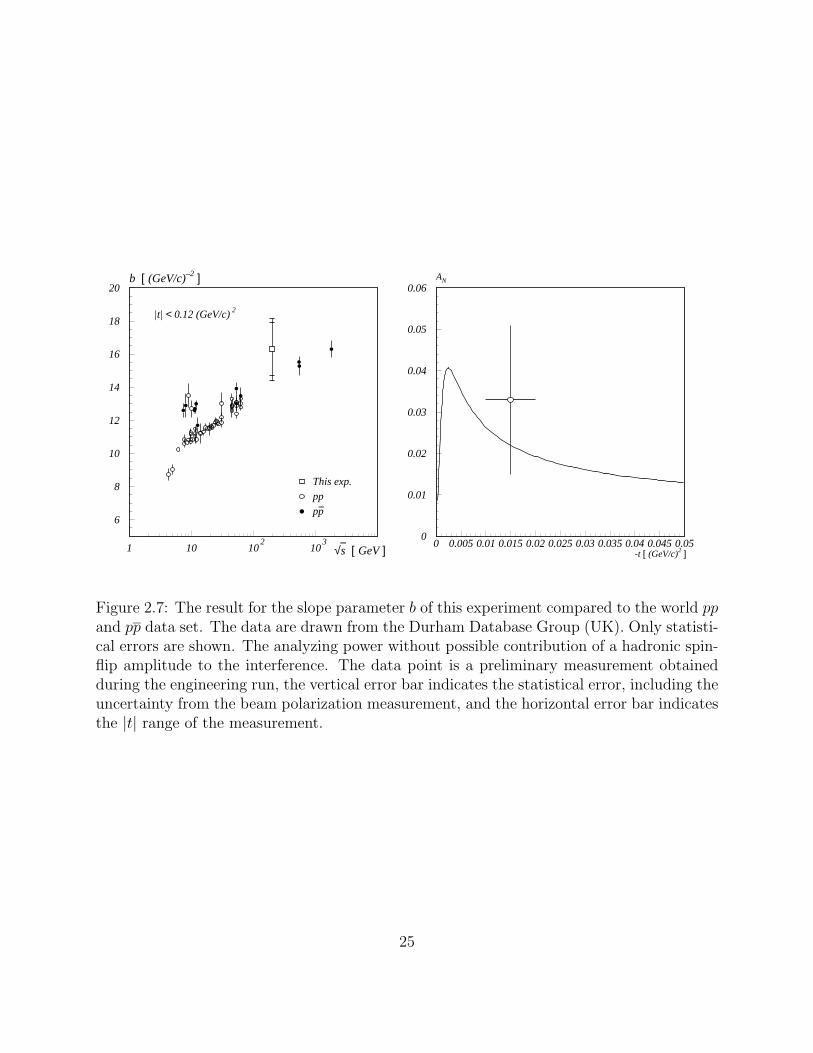
Based on the final selection of 58,511 elastic events we obtained a value of the slopeparameter b = 16.3 ± 1.6(stat.)±0.9(sys.) (GeV/c)−2, which is shown in Fig. 2.7 togetherwith the world data on elastic pp and pp scattering. This result is about one standarddeviation higher than an extrapolation of world data to the energy of this experiment [37],[38], [55]. It agrees well with model predictions [42]. This result has been submitted forpublication. See the attached preprint for more details.
We also measured the single spin counting rate asymmetry εN over the range of 0.01 ≤|t| ≤ 0.02(GeV/c)2 as a function of the azimuth, φ. Assuming a beam polarization measure-ment of Pbeam = 0.24 ± 0.10 resulted in an analyzing power of AN = 0.033 ± 0.016. Theresult is shown in Fig. 2.7.
2.4 The Data Taking Run in 2003
For the 2003 run, new silicon strip detectors were made and two sets of RP’s were instru-mented at two sides, 57 m and 60 m from the IP. A two day run was granted. Rather
23
-40
-35
-30
-25
-20
-15
15 20 25 30 35 40
yRP [ mm ]
yRP‘ [ mm ]0
0.005
0.01
0.015
0.02
0.025
0.03
0.035
0.04
20 40 60 80 100 120 140 160φ [ degree ]
-t [ (GeV/c)2 ]
Figure 2.6: Correlation between the y coordinates as measured by the two detectors of armA for elastic events before cuts being applied. Correlation between t and φ for reconstructedevents.
than doing extensive scraping to reduce the emittance of the beam, as was done in 2002, weinjected a low intensity, low emittance beam from the AGS. The polarization for this runwas estimated to be 0.37, in comparison to the previous run, at which the polarization wasestimated to be 0.24.
We obtained an order of magnitude more data than in the engineering run. We also hadbeen able to carry out a Van der Meer scan at the end of the run to enable us to make ameasurement of the total cross section. During the Van der Meer scan we calculated datarelated to the signals used in the scan. Using our offline analysis we can make correctionfor background separately for each of the points in the scan. We estimate to have an erroron the luminosity measurement of less than 5%. We also made a series of beam transportmeasurements during this run and with the second set of RPs we can make a measurementof the local angle. This will enable us to understand the beam transport better and thereforereduce our systematic errors.
From this run we expect to be able to measure the slope parameter to ±0.35, the totalcross section to about 5% and the raw asymmetry εN to 0.001 for a single data point.
24
6
8
10
12
14
16
18
20
1 10 102
103
This exp.
pp
pp−
b [ (GeV/c)–2 ]
√s [ GeV ]−
|t| < 0.12 (GeV/c) 2
0
0.01
0.02
0.03
0.04
0.05
0.06
0 0.005 0.01 0.015 0.02 0.025 0.03 0.035 0.04 0.045 0.05
AN
-t [ (GeV/c)2 ]
Figure 2.7: The result for the slope parameter b of this experiment compared to the world ppand pp data set. The data are drawn from the Durham Database Group (UK). Only statisti-cal errors are shown. The analyzing power without possible contribution of a hadronic spin-flip amplitude to the interference. The data point is a preliminary measurement obtainedduring the engineering run, the vertical error bar indicates the statistical error, including theuncertainty from the beam polarization measurement, and the horizontal error bar indicatesthe |t| range of the measurement.
25
Chapter 3
Proposed Plan for the Experiment
In this chapter we describe what physics can be achieved in three phases of the experiment:
1. Phase 1: Running with the current setup to measure and study the spin dependenceof elastic scattering at
√s = 200 GeV with β∗ = 20 m and
√s = 500 GeV with β∗
= 10 m. Cost of miscellaneous items for this phase is about $ 25k. Our request is forthree days of data taking at each of the two energies of
√s = 200 GeV and
√s = 500
GeV;
2. Phase 2: Running with Roman Pots in the DX-D0 region, we will extend the |t| rangeat
√s = 200 GeV to 0.2 (GeV/c)2 and to study the diffractive minimum region and its
spin dependence at√
s = 500 GeV to 1.3 (GeV/c)2. The additional cost of modificationof DX-D0 region and new Roman Pot stations, while using the existing detectors, isabout $ 452k. No dedicated running time is required for this phase, because no specialconditions are required;
3. Phase 3: Extend the |t| range into the Coulomb region of elastic scattering to makeprecision measurements, as outlined in the original proposal, of ρ, σtot, and the spindependence of ∆σtot. With that setup detailed information of helicity amplitudes atsmall |t| will shed light on σtot. Cost of the power supplies for this phase is $ 362k. Weexpect two days of time for data taking at each energy plus setup time of the beamoptics.
3.1 Phase 1: Running with the current setup
The present experimental setup is suitable for additional measurements in an extended |t|and φ range. At
√s = 200 GeV one can use the capacity of the existing power supplies to
run with the accelerator optics of β∗ = 20 m. This tune at√
s = 200 GeV makes it possibleto extend the kinematic coverage to a lower |t| of 0.003 ≤ |t| ≤ 0.020 (GeV/c)2. The β∗ =20 m solution, as shown in Table 3.1, also allows the measurement in the horizontal planeand hence makes the φ region of maximum analyzing power accessible by rotating one of the
26
RP stations into the horizontal position. At√
s = 500 GeV the optics with β∗ = 10 m willbe used, allowing measurements up to |t| ≈ 0.12 (GeV/c)2.
The analyzing power has a maximum value of Amax = 0.04 (√
s = 200 GeV) at |t| =0.0024 (GeV/c)2 and its |t| dependence towards larger values of |t| is sensitive to a possiblecontribution to the single spin-flip amplitude, φ5, from the interference between the hadronicspin-flip amplitude with the electromagnetic non-flip amplitude. The calculation, taking onlythe interference between hadronic non-flip amplitude and electromagnetic spin-flip amplitudeinto account, leads to a slow decrease with |t|, as shown in Fig. 2.7. A fast decrease of AN
with |t| reaching or crossing zero in the same |t| range will be indicative of a large imaginarypart of φ5, while a shift to higher or lower values of AN at |t| above 0.005 (GeV/c)2 will reveala contribution of the real part of φ5. The position and value of the maximum AN is predictedto be not sensitive to the different contributions to φ5 [18]. A precise measurement of the|t| dependence of AN in the above given |t| range is necessary to disentangle the differentcontributions to φ5.
An additional contribution of the hypothetical Odderon to the pp scattering amplitudecan be probed by measuring the double spin-flip asymmetry, ANN [36]. As shown in Fig. 1.4,ANN is sensitive to contributions of the real and imaginary parts to the double spin-flipamplitude, φ2, in the range 0.003 < |t| < 0.010 (GeV/c)2. At a higher value of |t| thedifference between a pure Pomeron contribution and an equal mixture of Pomeron andOdderon at the five percent level are hard to distinguish, while a pure Odderon contributionwould lead to a very small double spin-flip asymmetry.
The measurement of the differential pp cross section over the extended |t| range willinclude the region at the lower |t| that is particularly sensitive to ρ. This will make theextraction of ρ and b in a combined fit to the differential cross section possible. No measure-ment of ρ has been made thus far and the uncertainty in its values is contributing at presenta correlation uncertainty to the measurement of b.
Table 3.1: Transport matrix elements in x and y coordinates.
Transport matrix element Value at 57 m Value at 60 ma11 in y 0.156 0.044Leff in y 27.509 m 26.232 ma11 in x 0.051 -0.041Leff in x 30.613 m 31.306 m
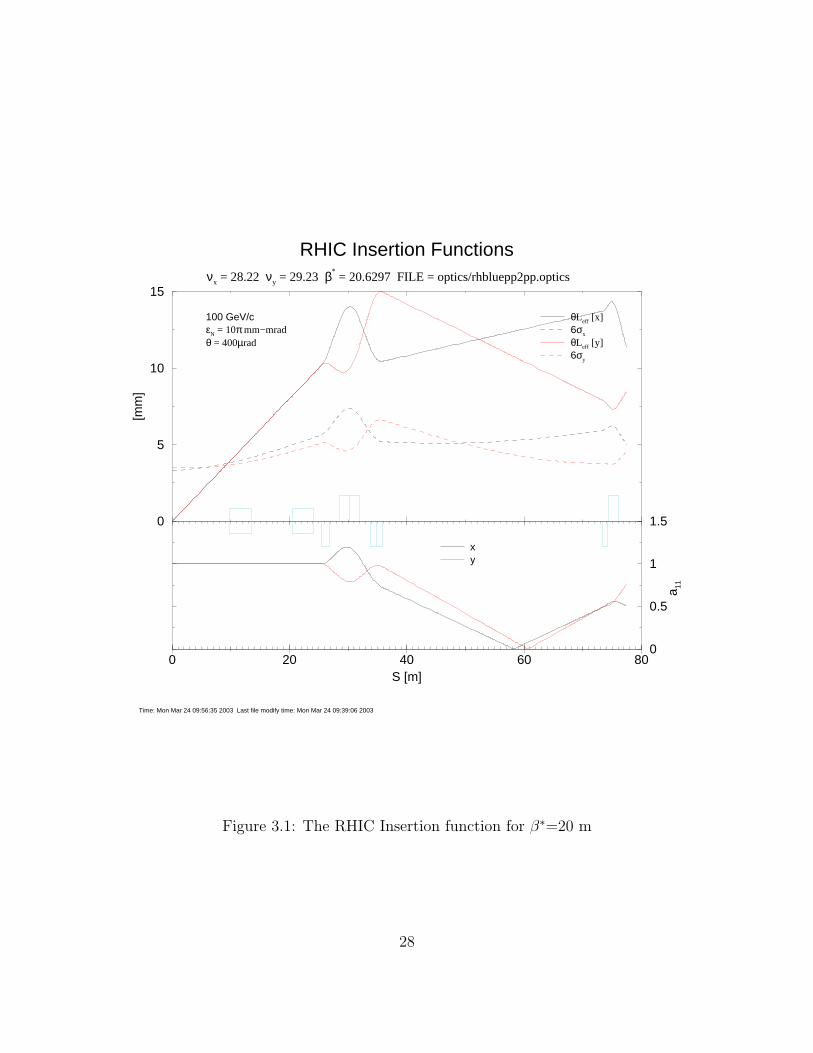
For the accelerator tune with β∗ = 20 m the transport of scattered protons to the RomanPot stations, located at the 57 m positions, was simulated. The parameters used in theMonte Carlo simulation are listed in Table 3.1. A typical trajectory of a proton scattered atθx = θy = 400 µrad scattering angle, |t| = 0.003 (GeV/c)2, is shown in Fig. 3.1, where onecan see a clear separation of that trajectory from the beam envelope.
The setup time of the β∗ to 20 m is estimated by the C-A department to be 12 hours.
27
0
5
10
15
[mm
]
RHIC Insertion Functionsνx = 28.22 νy = 29.23 β*
= 20.6297 FILE = optics/rhbluepp2pp.optics
θLeff [x]6σx
θLeff [y]6σy
0 20 40 60 80S [m]
0
0.5
1
1.5
a 11
xy
Time: Mon Mar 24 09:56:35 2003 Last file modify time: Mon Mar 24 09:39:06 2003
100 GeV/cεN = 10π mm−mradθ = 400µrad
Figure 3.1: The RHIC Insertion function for β∗=20 m
28
With 20 hours of data taking during one long store six million elastic events can be recorded.With this data sample a statistical error of ∆εN = 0.0017 for each of the six points of theraw counting rate asymmetry in the interval 0.003 < |t| < 0.020 (GeV/c)2 can be obtained.The analyzing power is related to the raw asymmetry by AN = εN
Pyellow+Pblue. Assuming a
beam polarization of Pyellow = Pblue = 0.4 ± 0.1 for each of the two beams would lead to astatistical error of ∆AN = 0.004 for each of the six data points.
The measurement of the double-spin asymmetry, ANN , depends on the measurement ofthe relative luminosities, needed for normalization of the four spin-dependent counting ratesinvolved. In addition, the statistical error depends on the square of the beam polarization.With the above assumptions for beam polarization and error, a value of 0.01 for ANN , and sixmillion elastically scattered protons, the error on the double-spin asymmetry was estimatedto be ∆ANN = 0.03 for a single data point over the entire |t| range. The expected higher beampolarization and smaller error on the polarization measurement will substantially reduceour conservative estimate of the error on ANN . This would improve the constraint thisexperiment can place on the Odderon contribution to this asymmetry.
We conclude from our simulations that the suitable |t| interval to fit ρ and b is 0.003 <|t| < 0.02 (GeV/c)2. For this amount of data the above described simulation with inputparameters of σtot = 51.5 mb, emittance ε = 15π·10−6m, gave an error on the slope parameter∆b = 0.3 (GeV/c)−2 and on the ratio of real to imaginary part of the scattering amplitude∆ρ = 0.01, which is comparable to the existing measurements of ρ from the pp and pp data.
At√
s = 500 GeV AN and ANN can be measured with the same errors. However, sincethe useful absolute |t| interval is 0.025 < |t| < 0.12 (GeV/c)2, which is far from the CNIregion, one can measure b with ∆b ≈ 0.3.
Our request is for three days of data taking at each of the two energies of√
s = 200 GeVand
√s = 500 GeV.
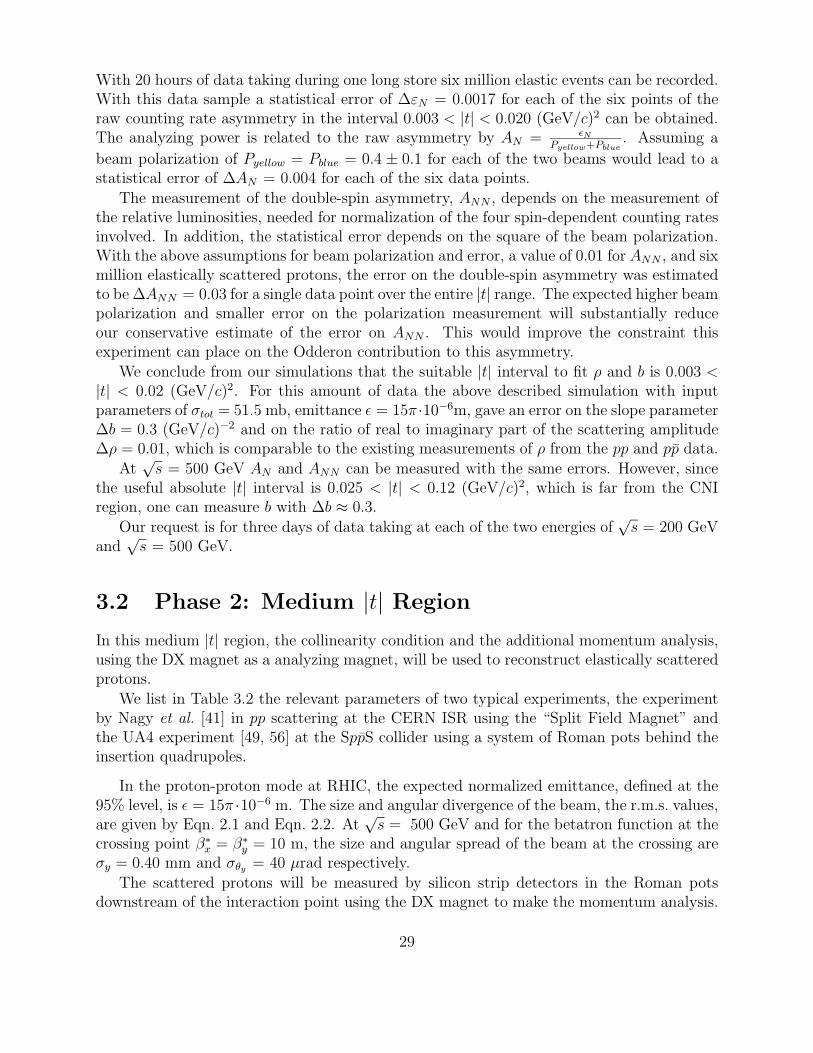
3.2 Phase 2: Medium |t| Region
In this medium |t| region, the collinearity condition and the additional momentum analysis,using the DX magnet as a analyzing magnet, will be used to reconstruct elastically scatteredprotons.
We list in Table 3.2 the relevant parameters of two typical experiments, the experimentby Nagy et al. [41] in pp scattering at the CERN ISR using the “Split Field Magnet” andthe UA4 experiment [49, 56] at the SppS collider using a system of Roman pots behind theinsertion quadrupoles.
In the proton-proton mode at RHIC, the expected normalized emittance, defined at the95% level, is ε = 15π ·10−6 m. The size and angular divergence of the beam, the r.m.s. values,are given by Eqn. 2.1 and Eqn. 2.2. At
√s = 500 GeV and for the betatron function at the
crossing point β∗x = β∗
y = 10 m, the size and angular spread of the beam at the crossing areσy = 0.40 mm and σθy = 40 µrad respectively.
The scattered protons will be measured by silicon strip detectors in the Roman potsdownstream of the interaction point using the DX magnet to make the momentum analysis.
29
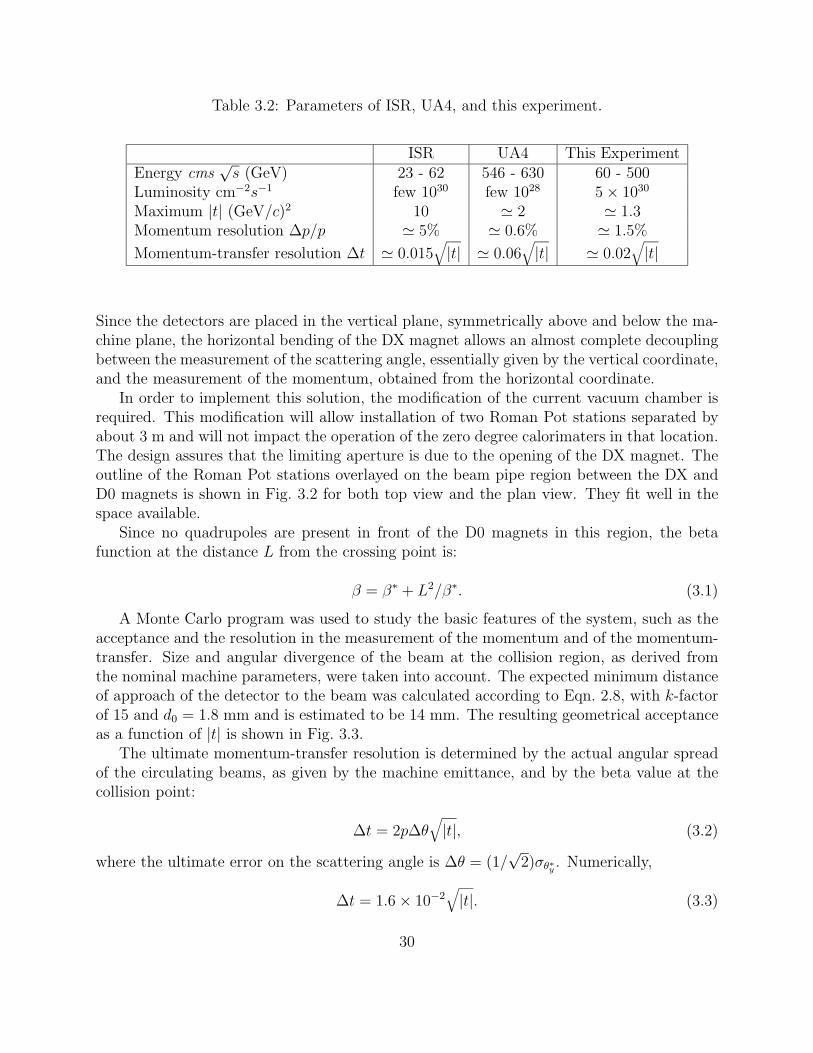
Table 3.2: Parameters of ISR, UA4, and this experiment.
ISR UA4 This ExperimentEnergy cms
√s (GeV) 23 - 62 546 - 630 60 - 500
Luminosity cm−2s−1 few 1030 few 1028 5 × 1030
Maximum |t| (GeV/c)2 10 2 1.3Momentum resolution ∆p/p 5% 0.6% 1.5%
Momentum-transfer resolution ∆t 0.015√|t| 0.06
√|t| 0.02
√|t|
Since the detectors are placed in the vertical plane, symmetrically above and below the ma-chine plane, the horizontal bending of the DX magnet allows an almost complete decouplingbetween the measurement of the scattering angle, essentially given by the vertical coordinate,and the measurement of the momentum, obtained from the horizontal coordinate.
In order to implement this solution, the modification of the current vacuum chamber isrequired. This modification will allow installation of two Roman Pot stations separated byabout 3 m and will not impact the operation of the zero degree calorimaters in that location.The design assures that the limiting aperture is due to the opening of the DX magnet. Theoutline of the Roman Pot stations overlayed on the beam pipe region between the DX andD0 magnets is shown in Fig. 3.2 for both top view and the plan view. They fit well in thespace available.
Since no quadrupoles are present in front of the D0 magnets in this region, the betafunction at the distance L from the crossing point is:
β = β∗ + L2/β∗. (3.1)
A Monte Carlo program was used to study the basic features of the system, such as theacceptance and the resolution in the measurement of the momentum and of the momentum-transfer. Size and angular divergence of the beam at the collision region, as derived fromthe nominal machine parameters, were taken into account. The expected minimum distanceof approach of the detector to the beam was calculated according to Eqn. 2.8, with k-factorof 15 and d0 = 1.8 mm and is estimated to be 14 mm. The resulting geometrical acceptanceas a function of |t| is shown in Fig. 3.3.
The ultimate momentum-transfer resolution is determined by the actual angular spreadof the circulating beams, as given by the machine emittance, and by the beta value at thecollision point:
∆t = 2p∆θ√|t|, (3.2)
where the ultimate error on the scattering angle is ∆θ = (1/√
2)σθ∗y . Numerically,
∆t = 1.6 × 10⁻²√|t|. (3.3)
30
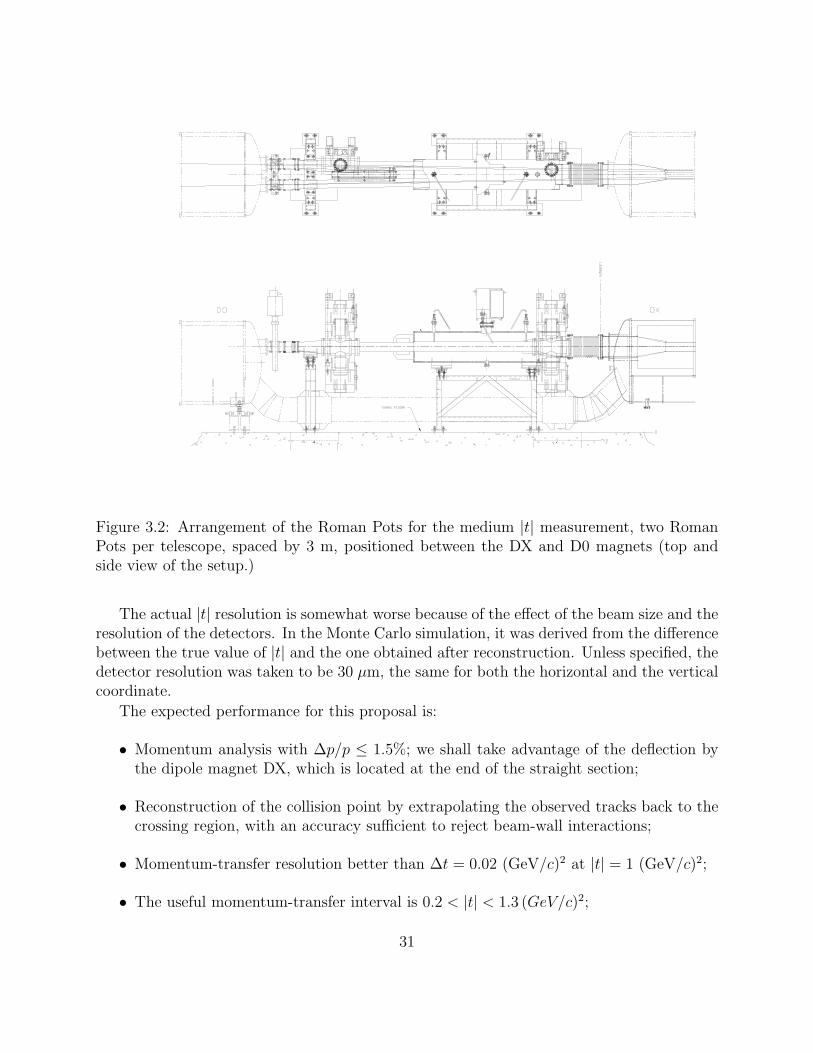
Figure 3.2: Arrangement of the Roman Pots for the medium |t| measurement, two RomanPots per telescope, spaced by 3 m, positioned between the DX and D0 magnets (top andside view of the setup.)
The actual |t| resolution is somewhat worse because of the effect of the beam size and theresolution of the detectors. In the Monte Carlo simulation, it was derived from the differencebetween the true value of |t| and the one obtained after reconstruction. Unless specified, thedetector resolution was taken to be 30 µm, the same for both the horizontal and the verticalcoordinate.
The expected performance for this proposal is:
• Momentum analysis with ∆p/p ≤ 1.5%; we shall take advantage of the deflection bythe dipole magnet DX, which is located at the end of the straight section;
• Reconstruction of the collision point by extrapolating the observed tracks back to thecrossing region, with an accuracy sufficient to reject beam-wall interactions;
• Momentum-transfer resolution better than ∆t = 0.02 (GeV/c)2 at |t| = 1 (GeV/c)2;
• The useful momentum-transfer interval is 0.2 < |t| < 1.3 (GeV/c)2;
31
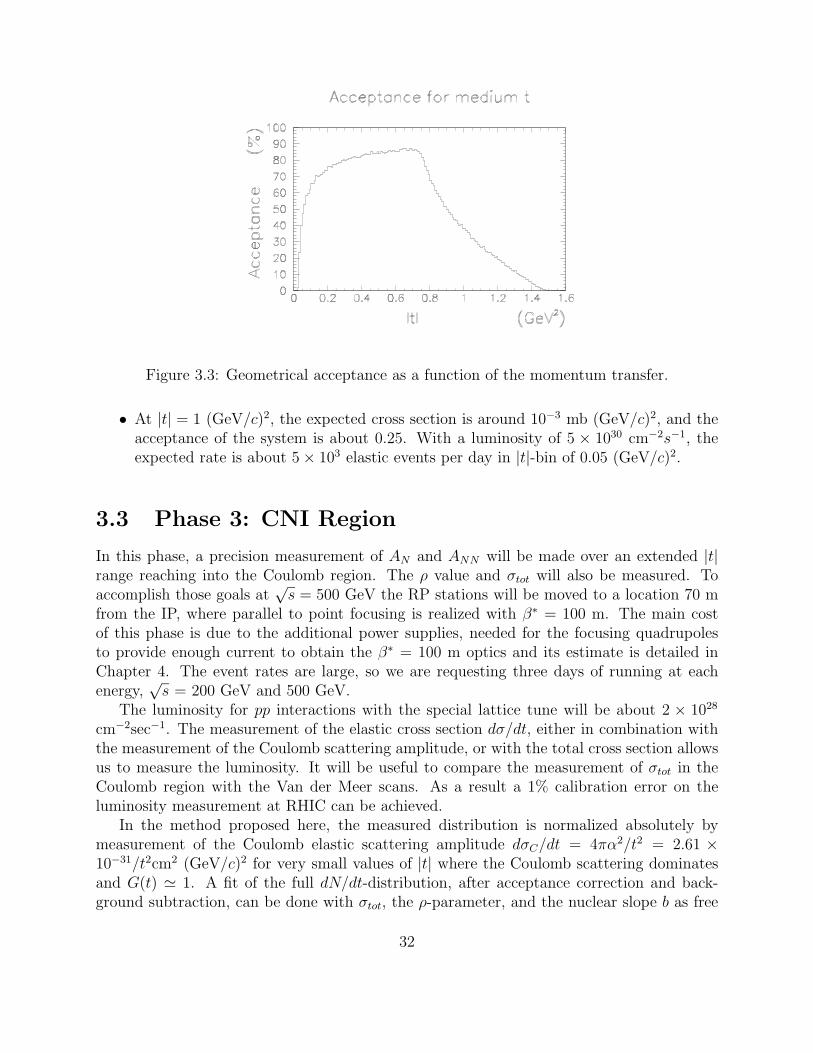
Figure 3.3: Geometrical acceptance as a function of the momentum transfer.
• At |t| = 1 (GeV/c)2, the expected cross section is around 10−3 mb (GeV/c)2, and theacceptance of the system is about 0.25. With a luminosity of 5 × 1030 cm−2s−1, theexpected rate is about 5 × 10³ elastic events per day in |t|-bin of 0.05 (GeV/c)2.
3.3 Phase 3: CNI Region
In this phase, a precision measurement of AN and ANN will be made over an extended |t|range reaching into the Coulomb region. The ρ value and σtot will also be measured. Toaccomplish those goals at
√s = 500 GeV the RP stations will be moved to a location 70 m
from the IP, where parallel to point focusing is realized with β∗ = 100 m. The main costof this phase is due to the additional power supplies, needed for the focusing quadrupolesto provide enough current to obtain the β∗ = 100 m optics and its estimate is detailed inChapter 4. The event rates are large, so we are requesting three days of running at eachenergy,
√s = 200 GeV and 500 GeV.
The luminosity for pp interactions with the special lattice tune will be about 2 × 1028
cm−2sec−1. The measurement of the elastic cross section dσ/dt, either in combination withthe measurement of the Coulomb scattering amplitude, or with the total cross section allowsus to measure the luminosity. It will be useful to compare the measurement of σtot in theCoulomb region with the Van der Meer scans. As a result a 1% calibration error on theluminosity measurement at RHIC can be achieved.
In the method proposed here, the measured distribution is normalized absolutely bymeasurement of the Coulomb elastic scattering amplitude dσC/dt = 4πα2/t2 = 2.61 ×10⁻³¹/t2cm2 (GeV/c)2 for very small values of |t| where the Coulomb scattering dominatesand G(t) 1. A fit of the full dN/dt-distribution, after acceptance correction and back-ground subtraction, can be done with σtot, the ρ-parameter, and the nuclear slope b as free
32
parameters. The luminosity L at the IP is then simply found from comparison with theactual number of events, after acceptance corrections and background subtraction. How-ever, the Coulomb amplitude dominates only at very small |t|. In order to measure theCoulomb amplitude well, one therefore has to measure very close to the beam as describedby Eqn. 2.9. Because of the fine segmentation of our silicon strip detector the sharp θ−4 riseof the Coulomb scattering cross section at small angle θ can be well measured.
The Coulomb cross section dσ/dt|t=tmin 1.6 × 10⁻²⁴ cm2/(GeV/c)2, so that at L =
2 × 1028 cm−2s−1 we collect about 0.3 Hz per |t|-bin of 10−4 (GeV/c)2 size near |tmin| =4 × 10⁻⁴(GeV/c)2, using 10% acceptance. In the interference region where |t| 1.1 × 10⁻³
(GeV/c)2, the rate is down to 1.3 Hz at 60% acceptance. For the measurement of ρ and σtot
not to be dominated by statistics, we need the order 104 events per |t|-bin of 10−4(GeV/c)2,leading to a run duration of about 30 hours.
This is also seen when one uses the interference term in the cross section: ∆Ni =√
Ni 2N0ρ∆ρ, where Ni represents the number of elastic events in the interference region and N0
the number of events when ρ = 0; Ni = N0(1 + ρ2), so that, for example ρ = 0.150 and∆ρ = 0.010, about (2ρ∆ρ)−2 = 1 × 10⁵ events are needed in the interference region, whichcovers about five |t|-bins. This simple result is corroborated by our simulation results, whichindicate that ∆ρ 0.010 for about 1 million events collected in 4×10⁻⁴ ≤ |t| ≤ 0.2(GeV/c)2.
Because of large rates, the measurement of the Coulomb amplitude will not be statisticallylimited, but dominated by the systematics, primarily the background estimation, acceptancecalculations and uncertainty in beam angles.
Acceptance uncertainty due to the uniformity of detector response is not a problembecause of the the Si detector technology implemented and already demonstrated. Themain contribution is a 10µrad uncertainty in the initial beam angle, limited by the error inthe BPMs at the IP, see Sec. 2.2.3.
From the experience gained from our current runs we found, that the background subtrac-tion can be done by extrapolating non-back-to-back events to under the elastic back-to-backpeak. The majority of background events is due to halo-halo coincidences and increasesexponentially as the distance to the beams gets smaller.
Given the data sample of six million elastic events the statistical accuracy of the mea-surement of σtot is better than 1%. Therefore, the ultimate error will be limited by thesystematic uncertainty on the luminosity and beam transport.
33
Chapter 4
Cost and Proposed Run Plan
A significant capital investment has already been made for this experiment. Four RomanPot stations are installed and the equipment is fully debugged, including trigger and DAQ.All the accelerator controls and interfaces are in place. The collaboration is well organized.
The experiment has also obtained a three year NSF grant $165k for support of graduateand undergraduate students and a $40k grant to support foreign visitors from Poland. Wealso obtained $98k of matching funds from the State University of New York at Stony Brook.
Given the investment already made, additional running of the experiment is very costeffective and it certainly enlarges physics output of RHIC Spin. All the costs are listed inTable 4.1. Our previous runs have shown that the experiment does not have a large impacton the accelerator itself and only short running periods are needed to accomplish our goals.
We are seeking approval of our full physics program with the understanding, that thephase two and three can be realized as additional funding becomes available. The approvalof the full program will certainly allow us to seek funding for the experiment outside of theDOE, namely the NSF and participating institutions.
The experiment outlined in this proposal has three phases. The proposed timing can bearranged so that it fits the commissioning and running of RHIC with minimum impact. Thecost of each phase is shown in Table 4.1.
1. In the first phase, we propose to continue measuring the elastic scattering at the currentlocation. We propose to run at
√s = 200 GeV first and 500 GeV when it becomes
available.
2. In the second phase we propose to move the detectors to the location between DX andD0 magnets. A modification of the vacuum chamber in that region is required and theconstruction of new Roman Pot stations.
3. In the third phase, we request the run with the special high β∗ optics to take data inthe CNI region. The only additional cost for that phase is purchase and installationof the power supplies needed to generate the β∗ = 100 m optics. It should be notedthat the leads to the quadrupoles are capable to bring the higher current needed forthis application as they were modified during the construction of RHIC already.
34
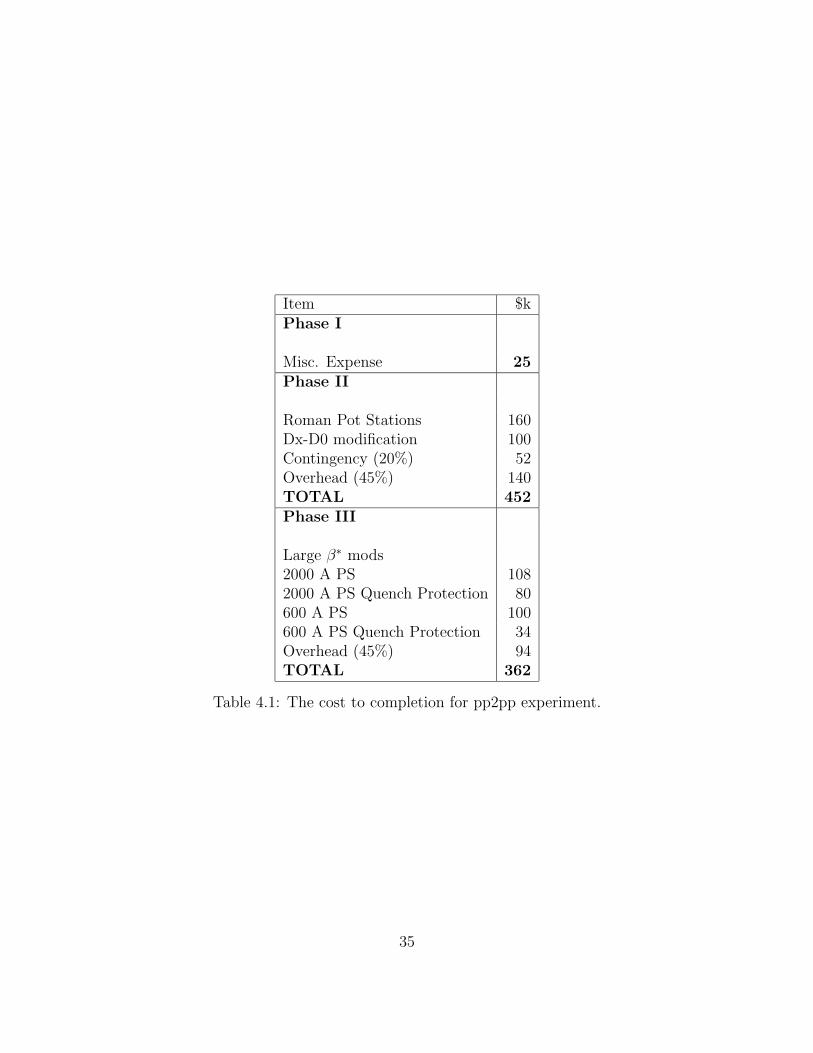
Item $kPhase I
Misc. Expense 25Phase II
Roman Pot Stations 160Dx-D0 modification 100Contingency (20%) 52Overhead (45%) 140TOTAL 452Phase III
Large β∗ mods2000 A PS 1082000 A PS Quench Protection 80600 A PS 100600 A PS Quench Protection 34Overhead (45%) 94TOTAL 362
Table 4.1: The cost to completion for pp2pp experiment.
35

Appendix A
pp2pp Paper
36
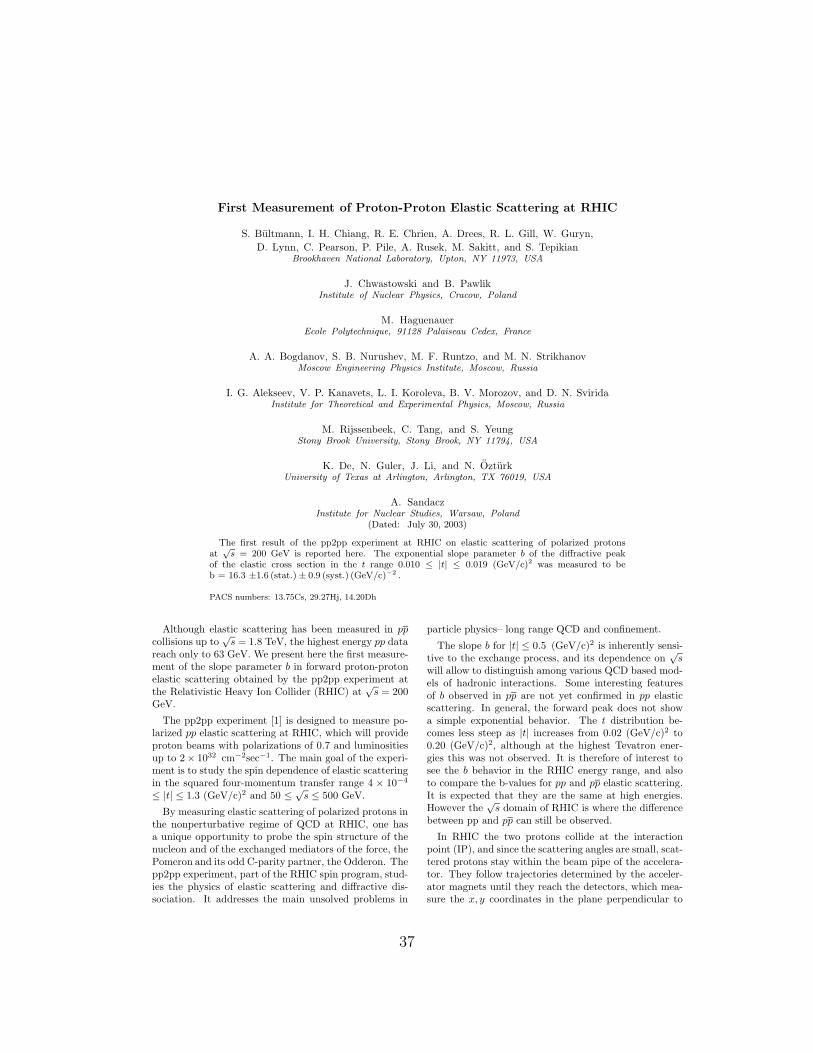
First Measurement of Proton-Proton Elastic Scattering at RHIC
S. Bultmann, I. H. Chiang, R. E. Chrien, A. Drees, R. L. Gill, W. Guryn,D. Lynn, C. Pearson, P. Pile, A. Rusek, M. Sakitt, and S. Tepikian
Brookhaven National Laboratory, Upton, NY 11973, USA
J. Chwastowski and B. PawlikInstitute of Nuclear Physics, Cracow, Poland
M. HaguenauerEcole Polytechnique, 91128 Palaiseau Cedex, France
A. A. Bogdanov, S. B. Nurushev, M. F. Runtzo, and M. N. StrikhanovMoscow Engineering Physics Institute, Moscow, Russia
I. G. Alekseev, V. P. Kanavets, L. I. Koroleva, B. V. Morozov, and D. N. SviridaInstitute for Theoretical and Experimental Physics, Moscow, Russia
M. Rijssenbeek, C. Tang, and S. YeungStony Brook University, Stony Brook, NY 11794, USA
K. De, N. Guler, J. Li, and N. OzturkUniversity of Texas at Arlington, Arlington, TX 76019, USA
A. SandaczInstitute for Nuclear Studies, Warsaw, Poland
(Dated: July 30, 2003)
The first result of the pp2pp experiment at RHIC on elastic scattering of polarized protonsat
√s = 200 GeV is reported here. The exponential slope parameter b of the diffractive peak
of the elastic cross section in the t range 0.010 ≤ |t| ≤ 0.019 (GeV/c)2 was measured to beb = 16.3 ±1.6 (stat.) ± 0.9 (syst.) (GeV/c)−2 .
PACS numbers: 13.75Cs, 29.27Hj, 14.20Dh
Although elastic scattering has been measured in ppcollisions up to
√s = 1.8 TeV, the highest energy pp data
reach only to 63 GeV. We present here the first measure-ment of the slope parameter b in forward proton-protonelastic scattering obtained by the pp2pp experiment atthe Relativistic Heavy Ion Collider (RHIC) at
√s = 200
GeV.
The pp2pp experiment [1] is designed to measure po-larized pp elastic scattering at RHIC, which will provideproton beams with polarizations of 0.7 and luminositiesup to 2 × 1032 cm−2sec−1. The main goal of the experi-ment is to study the spin dependence of elastic scatteringin the squared four-momentum transfer range 4 × 10⁻⁴
≤ |t| ≤ 1.3 (GeV/c)2 and 50 ≤ √s ≤ 500 GeV.
By measuring elastic scattering of polarized protons inthe nonperturbative regime of QCD at RHIC, one hasa unique opportunity to probe the spin structure of thenucleon and of the exchanged mediators of the force, thePomeron and its odd C-parity partner, the Odderon. Thepp2pp experiment, part of the RHIC spin program, stud-ies the physics of elastic scattering and diffractive dis-sociation. It addresses the main unsolved problems in
particle physics– long range QCD and confinement.
The slope b for |t| ≤ 0.5 (GeV/c)2 is inherently sensi-tive to the exchange process, and its dependence on
√s
will allow to distinguish among various QCD based mod-els of hadronic interactions. Some interesting featuresof b observed in pp are not yet confirmed in pp elasticscattering. In general, the forward peak does not showa simple exponential behavior. The t distribution be-comes less steep as |t| increases from 0.02 (GeV/c)2 to0.20 (GeV/c)2, although at the highest Tevatron ener-gies this was not observed. It is therefore of interest tosee the b behavior in the RHIC energy range, and alsoto compare the b-values for pp and pp elastic scattering.It is expected that they are the same at high energies.However the
√s domain of RHIC is where the difference
between pp and pp can still be observed.
In RHIC the two protons collide at the interactionpoint (IP), and since the scattering angles are small, scat-tered protons stay within the beam pipe of the accelera-tor. They follow trajectories determined by the acceler-ator magnets until they reach the detectors, which mea-sure the x, y coordinates in the plane perpendicular to
37
2
-57 m 0 57 m
IP
RPRP
y-detector (silicon)
x-detector (silicon)
Elastic trigger detector(scintillator)
*
*
*
*
*
Scatteredproton
Arm A
Arm AArm B
Arm B
Side View
Top View
Inelastic detectors (scintillators)
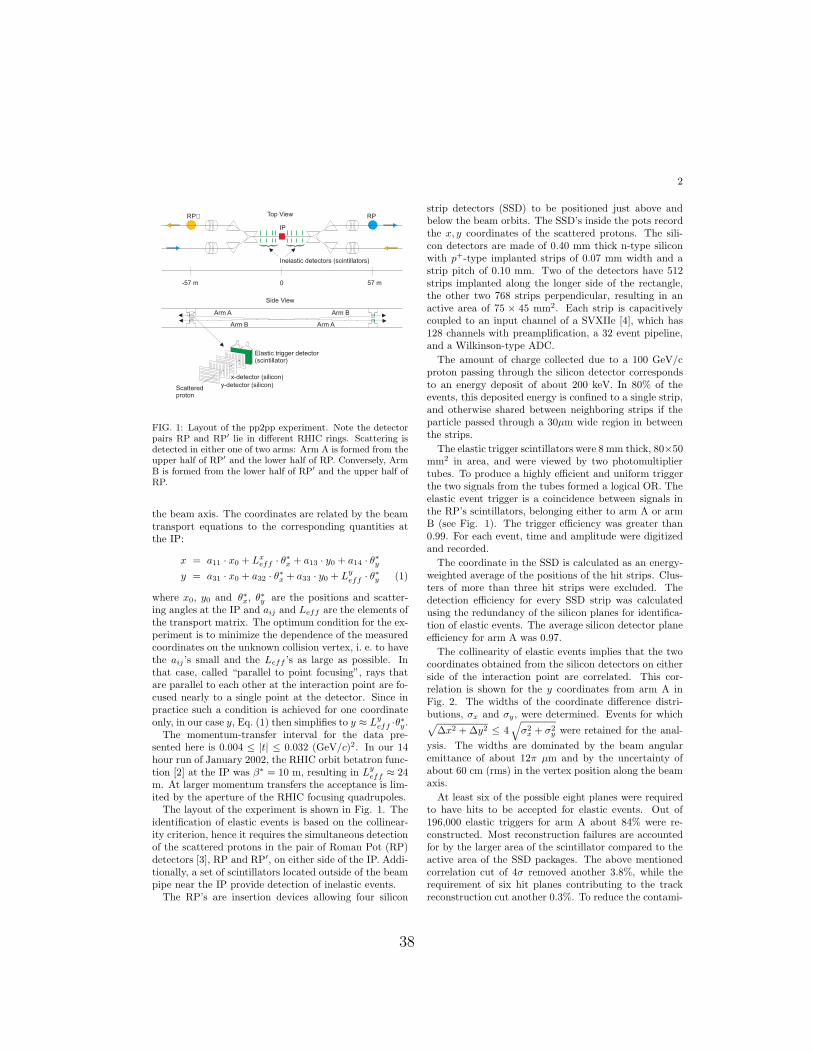
FIG. 1: Layout of the pp2pp experiment. Note the detectorpairs RP and RP′ lie in different RHIC rings. Scattering isdetected in either one of two arms: Arm A is formed from theupper half of RP′ and the lower half of RP. Conversely, ArmB is formed from the lower half of RP′ and the upper half ofRP.
the beam axis. The coordinates are related by the beamtransport equations to the corresponding quantities atthe IP:
x = a11 · x0 + Lxeff · θ∗x + a13 · y0 + a14 · θ∗y
y = a31 · x0 + a32 · θ∗x + a33 · y0 + Lyeff · θ∗y (1)
where x0, y0 and θ∗x, θ∗y are the positions and scatter-ing angles at the IP and aij and Leff are the elements ofthe transport matrix. The optimum condition for the ex-periment is to minimize the dependence of the measuredcoordinates on the unknown collision vertex, i. e. to havethe aij ’s small and the Leff ’s as large as possible. Inthat case, called “parallel to point focusing”, rays thatare parallel to each other at the interaction point are fo-cused nearly to a single point at the detector. Since inpractice such a condition is achieved for one coordinateonly, in our case y, Eq. (1) then simplifies to y ≈ Ly
eff ·θ∗y.The momentum-transfer interval for the data pre-
sented here is 0.004 ≤ |t| ≤ 0.032 (GeV/c)2. In our 14hour run of January 2002, the RHIC orbit betatron func-tion [2] at the IP was β∗ = 10 m, resulting in Ly
eff ≈ 24m. At larger momentum transfers the acceptance is lim-ited by the aperture of the RHIC focusing quadrupoles.
The layout of the experiment is shown in Fig. 1. Theidentification of elastic events is based on the collinear-ity criterion, hence it requires the simultaneous detectionof the scattered protons in the pair of Roman Pot (RP)detectors [3], RP and RP′, on either side of the IP. Addi-tionally, a set of scintillators located outside of the beampipe near the IP provide detection of inelastic events.
The RP’s are insertion devices allowing four silicon
strip detectors (SSD) to be positioned just above andbelow the beam orbits. The SSD’s inside the pots recordthe x, y coordinates of the scattered protons. The sili-con detectors are made of 0.40 mm thick n-type siliconwith p+-type implanted strips of 0.07 mm width and astrip pitch of 0.10 mm. Two of the detectors have 512strips implanted along the longer side of the rectangle,the other two 768 strips perpendicular, resulting in anactive area of 75 × 45 mm2. Each strip is capacitivelycoupled to an input channel of a SVXIIe [4], which has128 channels with preamplification, a 32 event pipeline,and a Wilkinson-type ADC.
The amount of charge collected due to a 100 GeV/cproton passing through the silicon detector correspondsto an energy deposit of about 200 keV. In 80% of theevents, this deposited energy is confined to a single strip,and otherwise shared between neighboring strips if theparticle passed through a 30µm wide region in betweenthe strips.
The elastic trigger scintillators were 8 mm thick, 80×50mm2 in area, and were viewed by two photomultipliertubes. To produce a highly efficient and uniform triggerthe two signals from the tubes formed a logical OR. Theelastic event trigger is a coincidence between signals inthe RP’s scintillators, belonging either to arm A or armB (see Fig. 1). The trigger efficiency was greater than0.99. For each event, time and amplitude were digitizedand recorded.
The coordinate in the SSD is calculated as an energy-weighted average of the positions of the hit strips. Clus-ters of more than three hit strips were excluded. Thedetection efficiency for every SSD strip was calculatedusing the redundancy of the silicon planes for identifica-tion of elastic events. The average silicon detector planeefficiency for arm A was 0.97.
The collinearity of elastic events implies that the twocoordinates obtained from the silicon detectors on eitherside of the interaction point are correlated. This cor-relation is shown for the y coordinates from arm A inFig. 2. The widths of the coordinate difference distri-butions, σx and σy, were determined. Events for which√
∆x2 + ∆y2 ≤ 4√
σ2x + σ2
y were retained for the anal-ysis. The widths are dominated by the beam angularemittance of about 12π µm and by the uncertainty ofabout 60 cm (rms) in the vertex position along the beamaxis.
At least six of the possible eight planes were requiredto have hits to be accepted for elastic events. Out of196,000 elastic triggers for arm A about 84% were re-constructed. Most reconstruction failures are accountedfor by the larger area of the scintillator compared to theactive area of the SSD packages. The above mentionedcorrelation cut of 4σ removed another 3.8%, while therequirement of six hit planes contributing to the trackreconstruction cut another 0.3%. To reduce the contami-
38
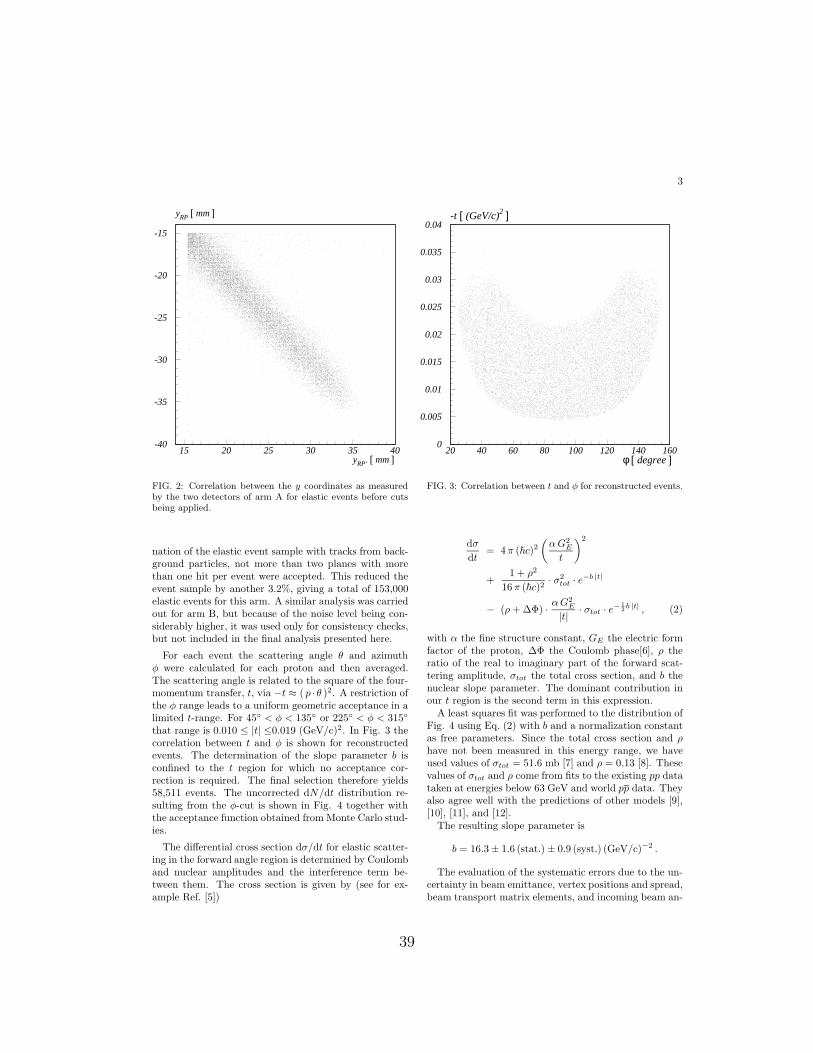
3
-40
-35
-30
-25
-20
-15
15 20 25 30 35 40
yRP [ mm ]
yRP‘ [ mm ]
FIG. 2: Correlation between the y coordinates as measuredby the two detectors of arm A for elastic events before cutsbeing applied.
nation of the elastic event sample with tracks from back-ground particles, not more than two planes with morethan one hit per event were accepted. This reduced theevent sample by another 3.2%, giving a total of 153,000elastic events for this arm. A similar analysis was carriedout for arm B, but because of the noise level being con-siderably higher, it was used only for consistency checks,but not included in the final analysis presented here.
For each event the scattering angle θ and azimuthφ were calculated for each proton and then averaged.The scattering angle is related to the square of the four-momentum transfer, t, via −t ≈ ( p · θ )2. A restriction ofthe φ range leads to a uniform geometric acceptance in alimited t-range. For 45 < φ < 135 or 225 < φ < 315
that range is 0.010 ≤ |t| ≤0.019 (GeV/c)2. In Fig. 3 thecorrelation between t and φ is shown for reconstructedevents. The determination of the slope parameter b isconfined to the t region for which no acceptance cor-rection is required. The final selection therefore yields58,511 events. The uncorrected dN/dt distribution re-sulting from the φ-cut is shown in Fig. 4 together withthe acceptance function obtained from Monte Carlo stud-ies.
The differential cross section dσ/dt for elastic scatter-ing in the forward angle region is determined by Coulomband nuclear amplitudes and the interference term be-tween them. The cross section is given by (see for ex-ample Ref. [5])
0
0.005
0.01
0.015
0.02
0.025
0.03
0.035
0.04
20 40 60 80 100 120 140 160φ [ degree ]
-t [ (GeV/c)2 ]
FIG. 3: Correlation between t and φ for reconstructed events.
dσ
dt= 4 π (c)2
(α G2
E
t
)2
+1 + ρ2
16 π (c)2· σ2
tot · e−b |t|
− (ρ + ∆Φ) · α G2E
|t| · σtot · e− 12 b |t| , (2)
with α the fine structure constant, GE the electric formfactor of the proton, ∆Φ the Coulomb phase[6], ρ theratio of the real to imaginary part of the forward scat-tering amplitude, σtot the total cross section, and b thenuclear slope parameter. The dominant contribution inour t region is the second term in this expression.
A least squares fit was performed to the distribution ofFig. 4 using Eq. (2) with b and a normalization constantas free parameters. Since the total cross section and ρhave not been measured in this energy range, we haveused values of σtot = 51.6 mb [7] and ρ = 0.13 [8]. Thesevalues of σtot and ρ come from fits to the existing pp datataken at energies below 63 GeV and world pp data. Theyalso agree well with the predictions of other models [9],[10], [11], and [12].
The resulting slope parameter is
b = 16.3 ± 1.6 (stat.) ± 0.9 (syst.) (GeV/c)−2 .
The evaluation of the systematic errors due to the un-certainty in beam emittance, vertex positions and spread,beam transport matrix elements, and incoming beam an-
39
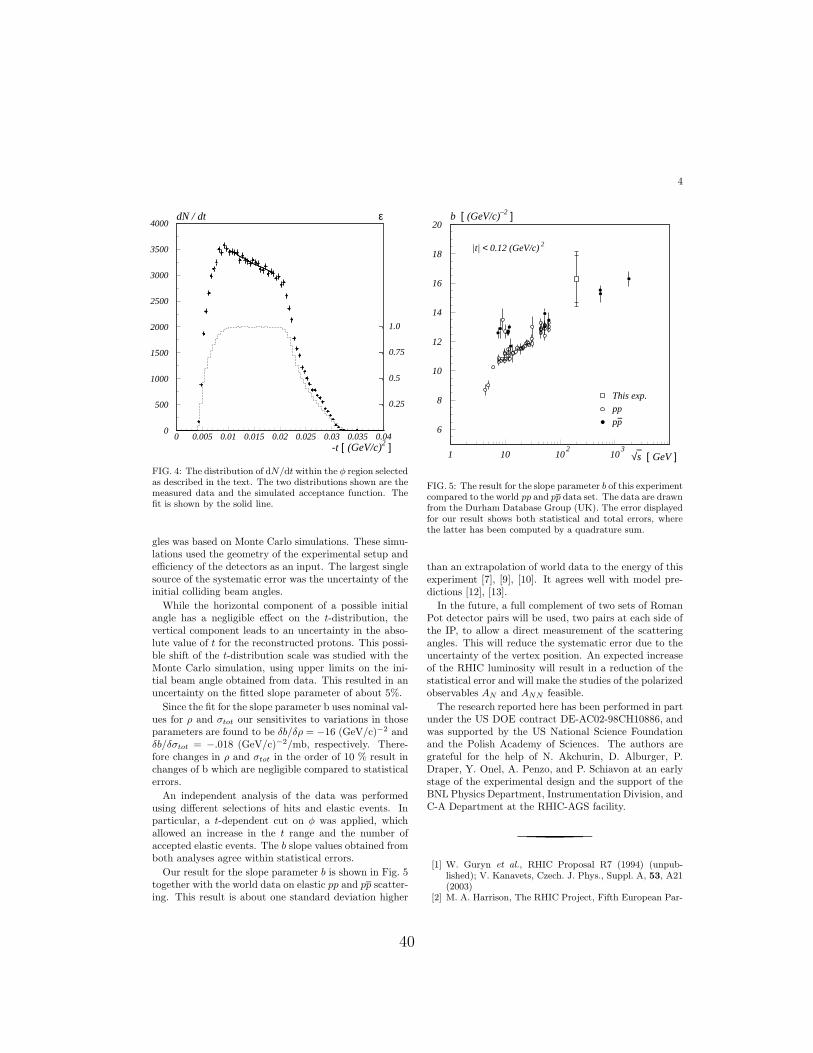
4
0
500
1000
1500
2000
2500
3000
3500
4000
0 0.005 0.01 0.015 0.02 0.025 0.03 0.035 0.04
¬
¬
¬
¬
1.0
0.75
0.5
0.25
-t [ (GeV/c)2 ]
dN / dt ε
FIG. 4: The distribution of dN/dt within the φ region selectedas described in the text. The two distributions shown are themeasured data and the simulated acceptance function. Thefit is shown by the solid line.
gles was based on Monte Carlo simulations. These simu-lations used the geometry of the experimental setup andefficiency of the detectors as an input. The largest singlesource of the systematic error was the uncertainty of theinitial colliding beam angles.
While the horizontal component of a possible initialangle has a negligible effect on the t-distribution, thevertical component leads to an uncertainty in the abso-lute value of t for the reconstructed protons. This possi-ble shift of the t-distribution scale was studied with theMonte Carlo simulation, using upper limits on the ini-tial beam angle obtained from data. This resulted in anuncertainty on the fitted slope parameter of about 5%.
Since the fit for the slope parameter b uses nominal val-ues for ρ and σtot our sensitivites to variations in thoseparameters are found to be δb/δρ = −16 (GeV/c)−2 andδb/δσtot = −.018 (GeV/c)−2/mb, respectively. There-fore changes in ρ and σtot in the order of 10 % result inchanges of b which are negligible compared to statisticalerrors.
An independent analysis of the data was performedusing different selections of hits and elastic events. Inparticular, a t-dependent cut on φ was applied, whichallowed an increase in the t range and the number ofaccepted elastic events. The b slope values obtained fromboth analyses agree within statistical errors.
Our result for the slope parameter b is shown in Fig. 5together with the world data on elastic pp and pp scatter-ing. This result is about one standard deviation higher
6
8
10
12
14
16
18
20
1 10 102
103
This exp.
pp
pp−
b [ (GeV/c)–2 ]
√s [ GeV ]−
|t| < 0.12 (GeV/c) 2
FIG. 5: The result for the slope parameter b of this experimentcompared to the world pp and pp data set. The data are drawnfrom the Durham Database Group (UK). The error displayedfor our result shows both statistical and total errors, wherethe latter has been computed by a quadrature sum.
than an extrapolation of world data to the energy of thisexperiment [7], [9], [10]. It agrees well with model pre-dictions [12], [13].
In the future, a full complement of two sets of RomanPot detector pairs will be used, two pairs at each side ofthe IP, to allow a direct measurement of the scatteringangles. This will reduce the systematic error due to theuncertainty of the vertex position. An expected increaseof the RHIC luminosity will result in a reduction of thestatistical error and will make the studies of the polarizedobservables AN and ANN feasible.
The research reported here has been performed in partunder the US DOE contract DE-AC02-98CH10886, andwas supported by the US National Science Foundationand the Polish Academy of Sciences. The authors aregrateful for the help of N. Akchurin, D. Alburger, P.Draper, Y. Onel, A. Penzo, and P. Schiavon at an earlystage of the experimental design and the support of theBNL Physics Department, Instrumentation Division, andC-A Department at the RHIC-AGS facility.
[1] W. Guryn et al., RHIC Proposal R7 (1994) (unpub-lished); V. Kanavets, Czech. J. Phys., Suppl. A, 53, A21(2003)
[2] M. A. Harrison, The RHIC Project, Fifth European Par-
40
5
ticle Accelerator Conference, Geneva (1996)[3] R. Battiston et al., Nucl. Instr. Meth. A238, 35 (1985)[4] R. Lipton, Nucl. Instr. Meth. A418, 85 (1998)[5] U. Amaldi et al., Phys. Lett. B43, 231 (1973)[6] B. Z. Kopeliovich and A. V. Tarasov, Phys. Lett. B 497,
44 (2001).[7] A. Donnachie and P. V. Landshoff, Phys. Lett. B296,
227 (1992)[8] C. Augier et al. (UA4/2 collab.), Phys. Lett. B316, 503
(1993)
[9] Martin M. Block, Nuc. Phys B (Proc. Suppl.) 71, 378(1999)
[10] B. Z. Kopeliovich, I. K. Potashnikova, B. Povh, and E.Predazzi, Phys. Rev. D63 054001 (2001)
[11] V. V. Ezhela et al. (COMPETE collab), Phys. Rev. D65074024, (2002)
[12] C. Bourrely and J. Soffer, Euro. Jour. Phys. C28, 97,(2003)
[13] J. Soffer, private communication (2003)
41

Appendix B
Bibliography
42
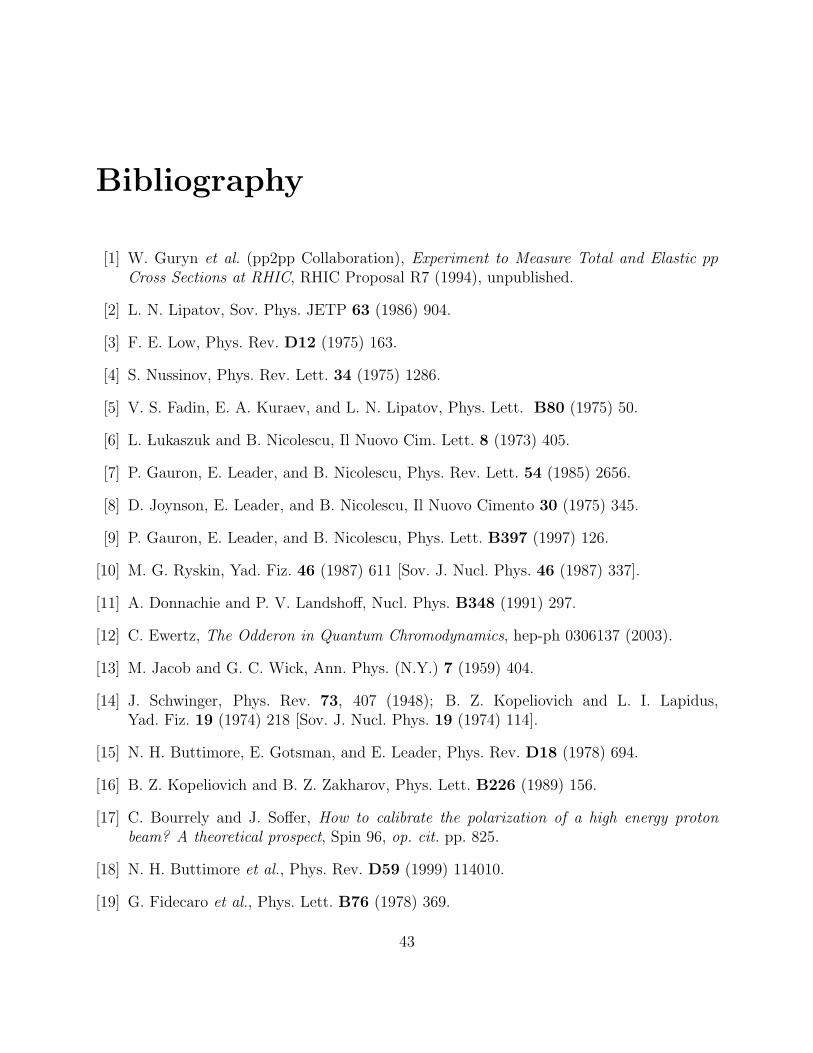
Bibliography
[1] W. Guryn et al. (pp2pp Collaboration), Experiment to Measure Total and Elastic ppCross Sections at RHIC, RHIC Proposal R7 (1994), unpublished.
[2] L. N. Lipatov, Sov. Phys. JETP 63 (1986) 904.
[3] F. E. Low, Phys. Rev. D12 (1975) 163.
[4] S. Nussinov, Phys. Rev. Lett. 34 (1975) 1286.
[5] V. S. Fadin, E. A. Kuraev, and L. N. Lipatov, Phys. Lett. B80 (1975) 50.
[6] L. Lukaszuk and B. Nicolescu, Il Nuovo Cim. Lett. 8 (1973) 405.
[7] P. Gauron, E. Leader, and B. Nicolescu, Phys. Rev. Lett. 54 (1985) 2656.
[8] D. Joynson, E. Leader, and B. Nicolescu, Il Nuovo Cimento 30 (1975) 345.
[9] P. Gauron, E. Leader, and B. Nicolescu, Phys. Lett. B397 (1997) 126.
[10] M. G. Ryskin, Yad. Fiz. 46 (1987) 611 [Sov. J. Nucl. Phys. 46 (1987) 337].
[11] A. Donnachie and P. V. Landshoff, Nucl. Phys. B348 (1991) 297.
[12] C. Ewertz, The Odderon in Quantum Chromodynamics, hep-ph 0306137 (2003).
[13] M. Jacob and G. C. Wick, Ann. Phys. (N.Y.) 7 (1959) 404.
[14] J. Schwinger, Phys. Rev. 73, 407 (1948); B. Z. Kopeliovich and L. I. Lapidus,Yad. Fiz. 19 (1974) 218 [Sov. J. Nucl. Phys. 19 (1974) 114].
[15] N. H. Buttimore, E. Gotsman, and E. Leader, Phys. Rev. D18 (1978) 694.
[16] B. Z. Kopeliovich and B. Z. Zakharov, Phys. Lett. B226 (1989) 156.
[17] C. Bourrely and J. Soffer, How to calibrate the polarization of a high energy protonbeam? A theoretical prospect, Spin 96, op. cit. pp. 825.
[18] N. H. Buttimore et al., Phys. Rev. D59 (1999) 114010.
[19] G. Fidecaro et al., Phys. Lett. B76 (1978) 369.
43
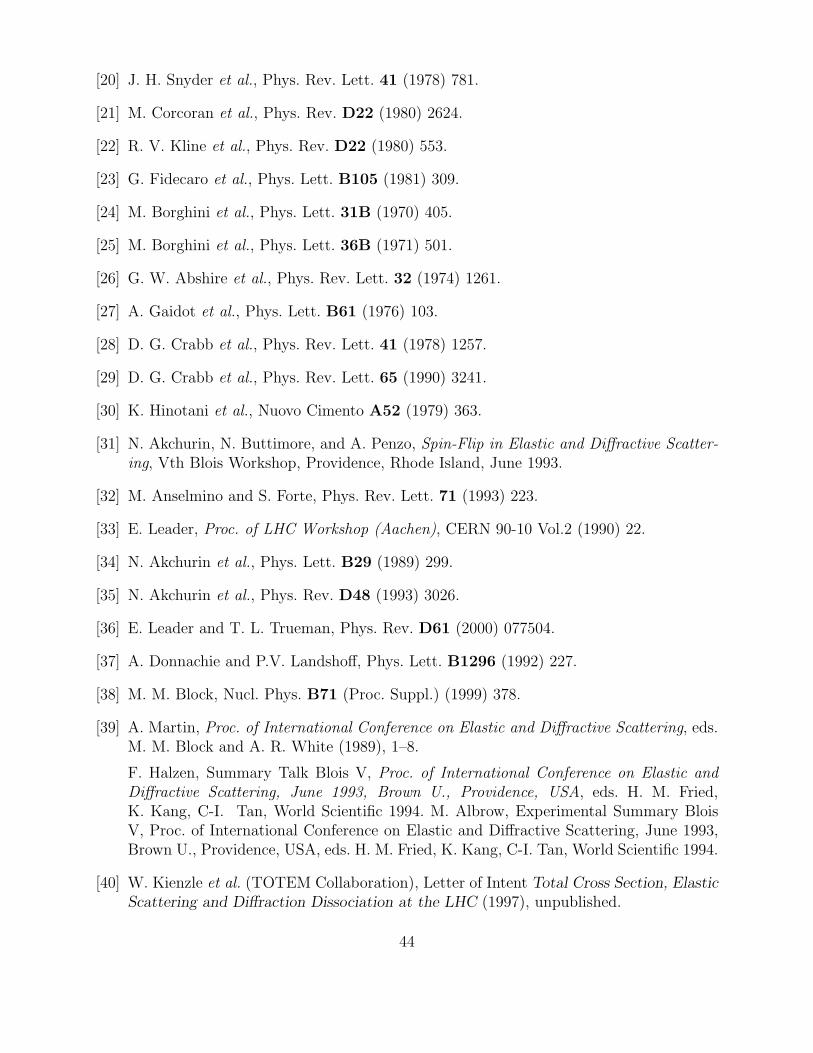
[20] J. H. Snyder et al., Phys. Rev. Lett. 41 (1978) 781.
[21] M. Corcoran et al., Phys. Rev. D22 (1980) 2624.
[22] R. V. Kline et al., Phys. Rev. D22 (1980) 553.
[23] G. Fidecaro et al., Phys. Lett. B105 (1981) 309.
[24] M. Borghini et al., Phys. Lett. 31B (1970) 405.
[25] M. Borghini et al., Phys. Lett. 36B (1971) 501.
[26] G. W. Abshire et al., Phys. Rev. Lett. 32 (1974) 1261.
[27] A. Gaidot et al., Phys. Lett. B61 (1976) 103.
[28] D. G. Crabb et al., Phys. Rev. Lett. 41 (1978) 1257.
[29] D. G. Crabb et al., Phys. Rev. Lett. 65 (1990) 3241.
[30] K. Hinotani et al., Nuovo Cimento A52 (1979) 363.
[31] N. Akchurin, N. Buttimore, and A. Penzo, Spin-Flip in Elastic and Diffractive Scatter-ing, Vth Blois Workshop, Providence, Rhode Island, June 1993.
[32] M. Anselmino and S. Forte, Phys. Rev. Lett. 71 (1993) 223.
[33] E. Leader, Proc. of LHC Workshop (Aachen), CERN 90-10 Vol.2 (1990) 22.
[34] N. Akchurin et al., Phys. Lett. B29 (1989) 299.
[35] N. Akchurin et al., Phys. Rev. D48 (1993) 3026.
[36] E. Leader and T. L. Trueman, Phys. Rev. D61 (2000) 077504.
[37] A. Donnachie and P.V. Landshoff, Phys. Lett. B1296 (1992) 227.
[38] M. M. Block, Nucl. Phys. B71 (Proc. Suppl.) (1999) 378.
[39] A. Martin, Proc. of International Conference on Elastic and Diffractive Scattering, eds.M. M. Block and A. R. White (1989), 1–8.
F. Halzen, Summary Talk Blois V, Proc. of International Conference on Elastic andDiffractive Scattering, June 1993, Brown U., Providence, USA, eds. H. M. Fried,K. Kang, C-I. Tan, World Scientific 1994. M. Albrow, Experimental Summary BloisV, Proc. of International Conference on Elastic and Diffractive Scattering, June 1993,Brown U., Providence, USA, eds. H. M. Fried, K. Kang, C-I. Tan, World Scientific 1994.
[40] W. Kienzle et al. (TOTEM Collaboration), Letter of Intent Total Cross Section, ElasticScattering and Diffraction Dissociation at the LHC (1997), unpublished.
44
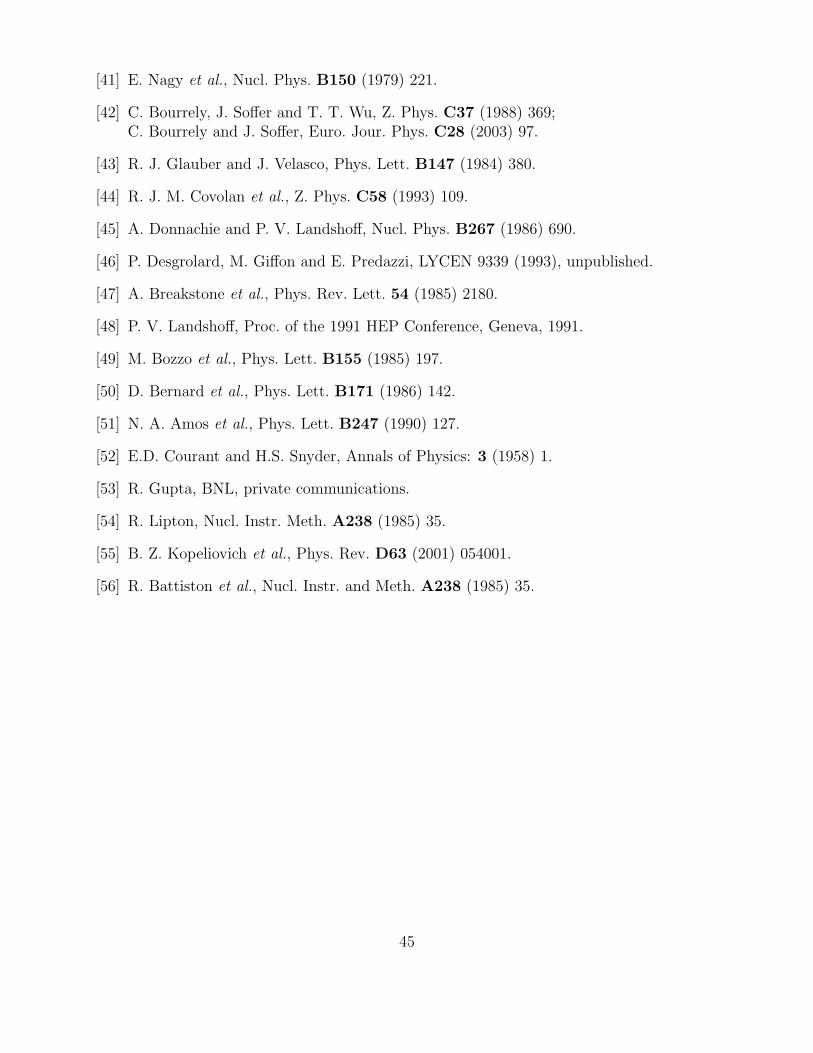
[41] E. Nagy et al., Nucl. Phys. B150 (1979) 221.
[42] C. Bourrely, J. Soffer and T. T. Wu, Z. Phys. C37 (1988) 369;C. Bourrely and J. Soffer, Euro. Jour. Phys. C28 (2003) 97.
[43] R. J. Glauber and J. Velasco, Phys. Lett. B147 (1984) 380.
[44] R. J. M. Covolan et al., Z. Phys. C58 (1993) 109.
[45] A. Donnachie and P. V. Landshoff, Nucl. Phys. B267 (1986) 690.
[46] P. Desgrolard, M. Giffon and E. Predazzi, LYCEN 9339 (1993), unpublished.
[47] A. Breakstone et al., Phys. Rev. Lett. 54 (1985) 2180.
[48] P. V. Landshoff, Proc. of the 1991 HEP Conference, Geneva, 1991.
[49] M. Bozzo et al., Phys. Lett. B155 (1985) 197.
[50] D. Bernard et al., Phys. Lett. B171 (1986) 142.
[51] N. A. Amos et al., Phys. Lett. B247 (1990) 127.
[52] E.D. Courant and H.S. Snyder, Annals of Physics: 3 (1958) 1.
[53] R. Gupta, BNL, private communications.
[54] R. Lipton, Nucl. Instr. Meth. A238 (1985) 35.
[55] B. Z. Kopeliovich et al., Phys. Rev. D63 (2001) 054001.
[56] R. Battiston et al., Nucl. Instr. and Meth. A238 (1985) 35.
45


![Configuration Manual Polarized Proton Collider at RHIC · colliding nuclei. RHIC will also collide intense beams of polarized protons[2], reaching transverse energies where the protons](https://img.pdfslide.net/doc/110x75/5e6bfa7f4a9ff14e3c4630d1/configuration-manual-polarized-proton-collider-at-rhic-colliding-nuclei-rhic-will.jpg)