Embed Size (px)
Citation preview

SPINOCEREBELLAR ATAXIA TYPE 2:
ATAXIN-2 MECHANISMS AND BLOOD BIOMARKERS
by
Nesli Ece Şen
B.S., Molecular Biology and Genetics, Bilkent University, 2012
Submitted to the Institute for Graduate Studies in
Science and Engineering in partial fulfillment of
the requirements for the degree of
Master of Science
Graduate Program in Molecular Biology and Genetics
Boğaziçi University
2015

ii
SPINOCEREBELLAR ATAXIA TYPE 2:
ATAXIN-2 MECHANISMS AND BLOOD BIOMARKERS
APPROVED BY:
Prof. Ayşe Nazlı Başak .....................................
(Thesis Supervisor)
Prof. Georg Auburger .....................................
(Thesis Co-advisor)
Prof. Esra Battaloğlu .....................................
Prof. Sibel Ertan .....................................
Assist. Prof. İbrahim Yaman .....................................
DATE OF APPROVAL: 10.07.2015

iii
To my grandparents Gülşen and Mahmut Bekler;
my first teachers who inspired me to explore.

iv
ACKNOWLEDGEMENTS
I would like to express my sincere gratitude to my thesis supervisor Prof. A. Nazlı
Başak for her endless support, encouragement and invaluable guidance, both scientifically
and personally, throughout this work. I am also deeply thankful to my co-advisor Prof.
Georg Auburger and also Suzana Gispert for providing me the opportunity of an excellent
academic and experimental training at Goethe University.
I would like to extend my thanks to Prof. Esra Battaloğlu, Prof. Sibel Ertan and
Assist. Prof. İbrahim Yaman for their precious contributions to this thesis.
The presence of all NDAL members has brought nothing but happiness, strength
and improvement to my life, I am more than grateful to every single one of them. I am also
thankful for the hospitality and friendship provided by all Auburger Lab members.
I respectfully acknowledge the Suna and İnan Kıraç Foundation, Boğaziçi
University Research Funds and Goethe University Research Funds for their generous
financial support that renders our research possible.
I cordially thank the patients and family members from the large SCA2 pedigree for
their hospitality during the sample collection in Balıkesir, and their overall cooperation.
Last but not least, I am eternally grateful to my beloved family, especially my
mother Sibel Bekler Keçeci and grandparents Gülşen and Mahmut Bekler; my role-model,
and the first teachers I had. They have not only taught me how to read and write, but also
to be determined for what I really desire and to never give up.
v
ABSTRACT
SPINOCEREBELLAR ATAXIA TYPE 2:
ATAXIN-2 MECHANISMS AND BLOOD BIOMARKERS
Spinocerebellar Ataxia Type 2 is an autosomal dominant movement disorder
caused by trinucleotide expansions in the ATXN2 gene (>34 CAG repeats). Intermediate
expansions of 26-39 repeats are considered as risk factors for several other
neurodegenerative disorders, such as ALS, PD and HSP. Ataxin-2 localizes to the rough-
ER, binds to the 3’-UTRs of mRNA molecules together with PABPC1 and modulates
ribosomal translation. Under stress conditions, ataxin-2 controls the assembly of stress
granules, where it sequesters mRNAs and vital proteins that regulate cellular growth and
proliferation. Although ataxin-2 is known to contribute to many cellular processes, its
exact function is not entirely understood. In order to elucidate ataxin-2 function and the
expansion-related pathogenesis and to identify blood biomarkers of SCA2, the
transcriptome profiles of Atxn2 knock-out mice and SCA2 patients from a large pedigree
were examined. A cluster of genes, whose products are normally secreted to the
extracellular fluids, emerged among the 100 most significantly downregulated genes in the
mouse transcriptome data. Significant upregulations of Apo-AI, Hemopexin and
SERPINA1 proteins were found in Atxn2-KO mouse liver. Candidate blood RNA
biomarkers were inferred from the whole blood transcriptome data of SCA2 patients via
either direct unbiased filtration or by focusing on neurodegeneration-associated genes.
Independent validations of the candidate genes revealed significant upregulations in ETV7,
SERINC2, and ATXN1, along with downregulations in DACT1, MATR3, and PHTF2 in
patient blood. Gene Set Enrichment Analysis of the patient transcriptome data presented an
enrichment in the Parkinson’s disease pathway, key components of which were further
analyzed in the context of ATXN2 knock-down neuroblastoma cells. This thesis exhibits
insights into the native function and expansion-induced pathogenesis of ataxin-2 by
investigating the downstream effects of ATXN2 deficiency and expansions on global and
gene-specific transcription profiles.
vi
ÖZET
SPİNOSEREBELLAR ATAKSİ TİP 2:
ATAKSİN-2 MEKANİZMASI VE KAN BİYO-BELİRTEÇLERİ
Spinoserebellar ataksi tip 2, ATXN2 genindeki trinükleotid artışı (>34 tekrar)
sonucu görülen otozomal dominant geçişli bir hareket bozukluğudur. Tekrar sayısının 26-
39 arasında olması ALS, PH, HSP gibi bir takım başka nörodejeneratif hastalıklar için de
risk oluşturur. Ataksin-2 proteini granüllü ER’da bulunur, mRNA moleküllerinin 3’-UTR
uçlarına PABPC1 ile bağlanarak ribozomal translasyonu kontrol eder ve stres koşulları
altında translasyonu baskılanmış mRNAların ve hücre büyüme/bölünmesini kontrol eden
proteinlerin hapsedildiği stres granüllerinin oluşumunu düzenler. Ataksin-2’nin birçok
mekanizmada etkin olduğu bilinse de, kesin görevi henüz tam olarak anlaşılamamıştır. Bu
tez çerçevesinde Ataksin-2’nin işlevini ve tekrar-artışının neden olduğu patogenezi
anlamak ve SCA2 hastalığı için kan biyo-belirteçleri bulmak amacıyla, Atxn2 knock-out
farelerde ve geniş bir SCA2 ailesinden alınan hasta örneklerinde transkriptom analizi
yapıldı. Fare transkriptom verisinde en fazla azalma gösteren faktörler arasında normal
şartlarda hücre dışı-sıvılara salgılanan bir grup protein gözlemlendi. Bu proteinlerden Apo-
AI, Hemopexin ve SERPINA1 Atxn2-KO fare karaciğerinde anlamlı artışlar gösterdi. Kan
biyo-belirteci olmaya aday genler SCA2 hastalarının transkriptom verilerinden ya tarafsız
filtreleme ya da nörodejenerasyonla ilgili genlere odaklanma yaklaşımlarıyla elde edildi.
Bu aday genlerin bağımsız yöntemlerle doğrulanması sonucu, ETV7, SERINC2 ve ATXN1
genlerinde anlamlı artışlar ve DACT1, MATR3 ve PHTF2 genlerinde anlamlı azalmalar
görüldü. Hastaların transkriptom verileri kullanılarak yapılan Gen Seti Zenginleştirme
Analizi Parkinson hastalığı yolağında toplu bir artış ortaya koydu. Bir sonraki aşamada bu
yolağa dahil olan başlıca genler ATXN2 knock-down nöroblastoma hücrelerinde incelendi.
Tezde, yabanıl ataksin-2 ile mutasyona uğramış ataksin-2’nin hücre düzeyindeki etkileri
gözlemlenerek, farklı mekanizmalarda etkin olduğu bilinen ataksin-2 proteininin normal
işlevi ve tekrar-artışına bağlı patogenezine ışık tutulmaktadır.
vii
TABLE OF CONTENTS
ACKNOWLEDGEMENTS ......................................................................................... iv
ABSTRACT ................................................................................................................. v
ÖZET ........................................................................................................................... vi
LIST OF FIGURES ..................................................................................................... x
LIST OF TABLES ....................................................................................................... xii
LIST OF SYMBOLS ................................................................................................... xiv
LIST OF ACRONYMS/ABBREVIATIONS .............................................................. xvi
1. INTRODUCTION ................................................................................................ 1
1.1. Classification of Neurodegenerative Disorders ............................................. 1
1.2. Spinocerebellar Ataxias and Common Mechanisms ..................................... 5
1.3. Clinical Features of SCA2 ............................................................................. 9
1.4. SCA2 Genetics and Ataxin-2 Mechanism ..................................................... 13
1.4.1. Ataxin-2 Function and Mechanisms of Pathogenicity ....................... 17
1.4.2. Implication of ATXN2 in Other Neurodegenerative Disorders .......... 22
1.5. Biomarkers of SCA2 ...................................................................................... 26
2. PURPOSE ............................................................................................................. 28
3. SUBJECTS AND MATERIALS .......................................................................... 29
3.1. SCA2 Patients and Healthy Controls from a Large Turkish Pedigree .......... 29
3.1.1. Equipment and Solutions for DNA Isolation
and PCR Amplification ...................................................................... 31
3.1.2. Equipment and Solutions for Agarose Gel Electrophoresis
and Gel Extraction ............................................................................. 31
3.2. Atxn2 Knock-Out Mouse Line ....................................................................... 32
3.3. Atxn2 Knock-Down SH-SY5Y Line and Cell Culture Equipment ................ 33
3.4. Equipment and Solutions for RNA Isolation, DNaseI Treatment
and cDNA Synthesis ...................................................................................... 34
3.5. qRT-PCR Equipment and Taqman Assays .................................................... 35
3.6. Equipment and Solutions for Protein Isolation, Quantitation
and SDS-PAGE ............................................................................................. 37
viii
3.7. Quantitative Immunoblotting Equipment, Solutions and Antibodies ............ 38
3.8. Software, Online Tools and Databases .......................................................... 40
3.9. General Laboratory Equipment, Chemicals and Kits .................................... 41
4. METHODS ........................................................................................................... 46
4.1. SCA2 Patient Peripheral Blood Samples ....................................................... 47
4.1.1. Blood Collection, Transport and Storage .......................................... 47
4.1.2. DNA Isolation and ATXN2 Poly-Q Repeat Size Determination ........ 47
4.2. Atxn2 Knock-Out Mouse Tissue Samples ..................................................... 49
4.3. ATXN2 Knock-Down SH-SY5Y Cell Culture ............................................... 49
4.3.1. Generation of ATXN2 Knock-Down Cell Line .................................. 49
4.3.2. General Culture Conditions, Freezing and Thawing ......................... 49
4.3.3. Time-Course Starvation Experiments ................................................ 51
4.4. RNA Isolation ................................................................................................ 53
4.5. DNaseI Treatment and cDNA Synthesis ....................................................... 54
4.6. Expression Analyses with Quantitative Real Time-PCR .............................. 55
4.7. Protein Isolation and Quantitation ................................................................. 56
4.8. SDS-PAGE and Quantitative Immunoblot Analyses .................................... 57
4.9. High-Throughput Transcriptome Analyses ................................................... 59
4.9.1. Microarray Analysis of Atxn2-KO Mice ........................................... 59
4.9.2. Deep RNA-Sequencing Analysis of SCA2 Patients .......................... 60
4.10. Gene Set Enrichment Analysis .................................................................... 60
4.11. Statistical Analyses ...................................................................................... 61
5. RESULTS ............................................................................................................. 62
5.1. Identification of Cerebellum and Liver Biomarkers in Atxn2-KO Mice ....... 63
5.1.1. High-Throughput Expression Analysis Results ................................. 63
5.1.1.1. Network of Secreted Factors Among Differentially
Downregulated Genes .......................................................... 63
5.1.2. Secretion Network Protein Levels in Atxn2-KO Mice ...................... 64
5.1.3. Expression Analysis of ER-Associated Genes in Atxn2-KO Mice .... 68
5.1.4. Expression Analysis of Secretion Network Genes in
Atxn2-KO Mice .................................................................................. 69
5.2. Identification of Blood Biomarkers in SCA2 Patients................................... 72
5.2.1. Genotypes of the SCA2 Pedigree ...................................................... 72
ix
5.2.2. High-Throughput Deep RNA-Sequencing Analysis Results ............. 73
5.2.2.1. Candidate Genes Acquired by Unbiased Filtering .............. 74
5.2.2.2. Neurodegeneration-Associated Genes as Candidates .......... 78
5.3. Characterization of the Interplay between Ataxin-2 and Mitochondrial
Factors ........................................................................................................... 82
5.3.1. Enrichment of the Parkinson’s Disease Pathway Genes in SCA2
Patients ............................................................................................... 82
5.3.2. Expression Analysis of the Mitochondrial Genes in Atxn2-KO
Mice ................................................................................................... 84
5.3.3. Expression Analysis of the Mitochondria- and Ataxin-2-Associated
Genes in ATXN2-KD SH-SY5Y Cells ............................................... 86
6. DISCUSSION ....................................................................................................... 90
6.1. Cerebellum and Liver Biomarkers in Atxn2-KO Mice .................................. 92
6.1.1. Potential Dysregulation of the ER-Golgi Secretory Pathway ............ 93
6.2. Blood Biomarkers in SCA2 Patients ............................................................. 95
6.3. Gene Set Enrichment Analysis ...................................................................... 98
6.4. The Relationship between Ataxin-2 and the Mitochondrial Factors ............. 99
7. CONCLUSION ..................................................................................................... 103
APPENDIX A: SUPPLEMENTARY TABLES ......................................................... 105
APPENDIX B: PUBLICATIONS ............................................................................... 113
REFERENCES ............................................................................................................ 114
x
LIST OF FIGURES
Figure 1.1. Classification of the CNS disorders based on the most distinctive
clinical phenotype and the anatomical location of the lesion. .................. 2
Figure 1.2. Currently known repeat expansion units. ................................................. 4
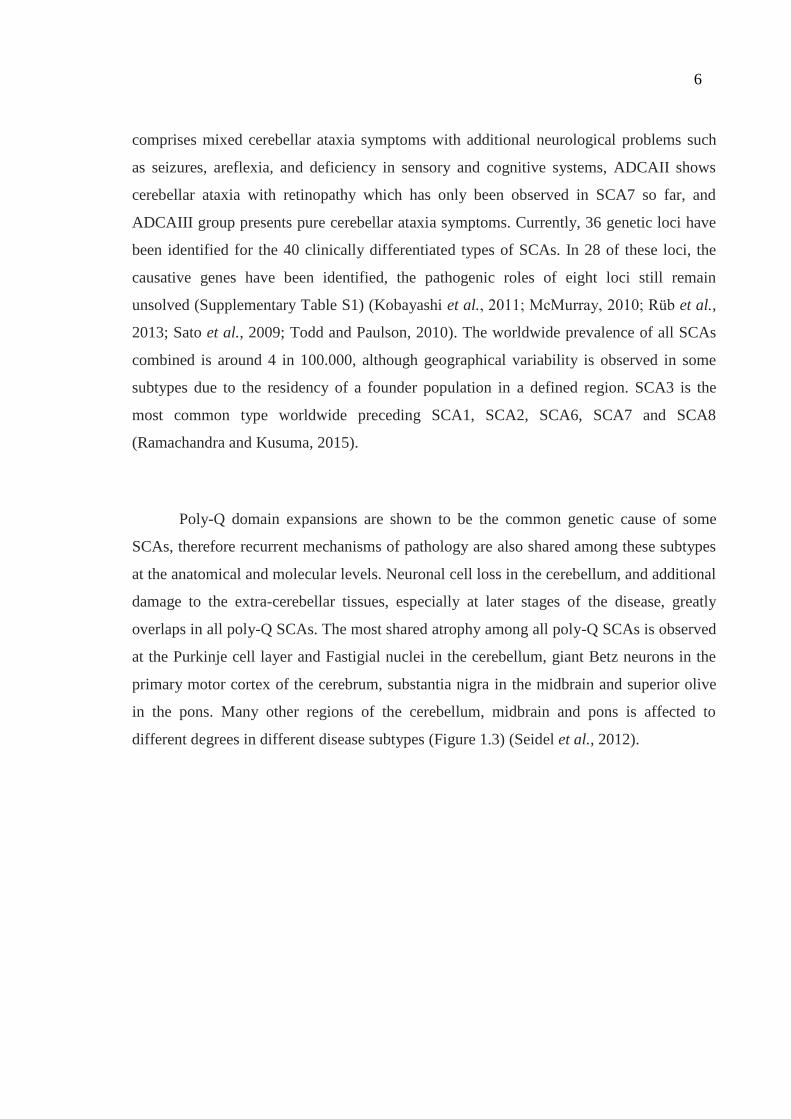
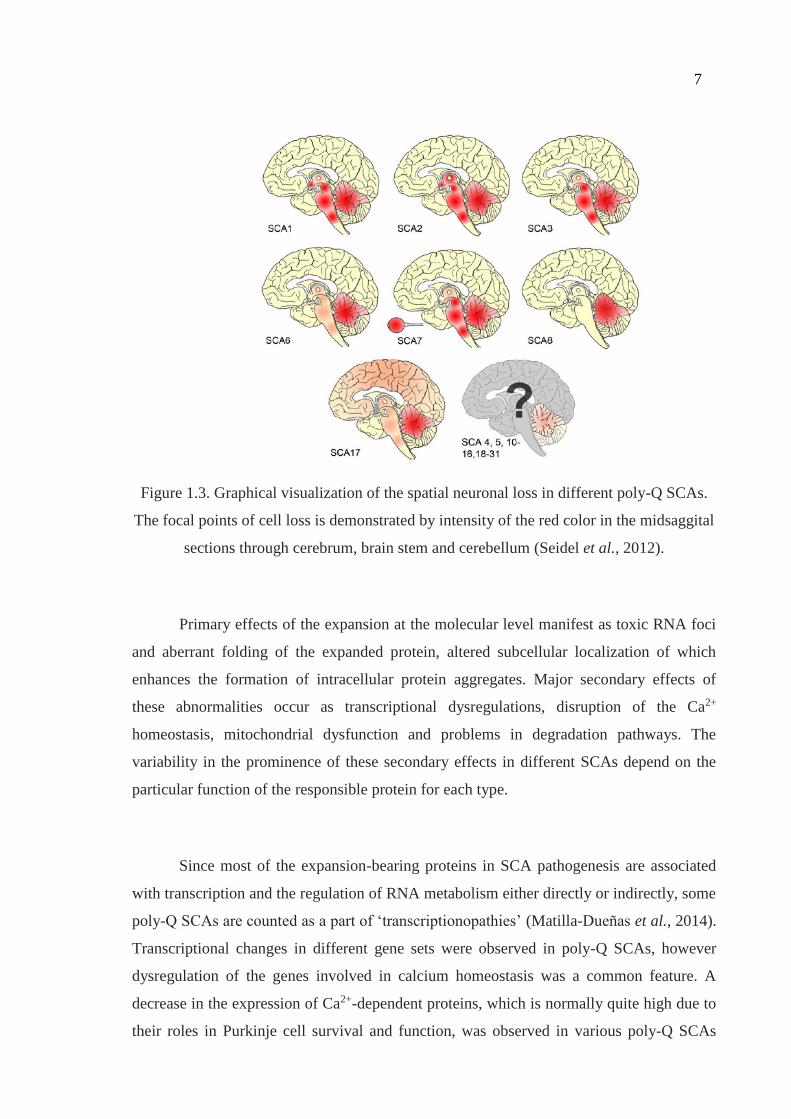
Figure 1.3. Graphical visualization of the spatial neuronal loss in different
poly-Q SCAs. ........................................................................................... 7
Figure 1.4. The anatomical structure of the cerebellar cortex. ................................... 10
Figure 1.5. MRI scan of a SCA2 patient showing cerebellar atrophy in the
midsaggital section. .................................................................................. 11
Figure 1.6. The correlation of AO with CAG repeat expansion size in ATXN2. ........ 15
Figure 1.7. Known functional domains of ataxin-2 protein. ....................................... 18
Figure 1.8. Recruitment of microRNAs to the 3’-UTRs of target mRNAs mediated
by the interaction between ataxin-2 and PABP. ....................................... 19
Figure 1.9. ATXN2-associated disease mechanisms. .................................................. 20
Figure 1.10. Signaling cascade leading to the sequesteration of TORC1 into stress
granules by the yeast ortholog of ataxin-2, Pbp1. .................................... 21
Figure 1.11. Association of the intermediate-length poly-Q expansions in ATXN2
with distinct neurodegenerative disorders. ............................................... 23
Figure 3.1. The large SCA2 pedigree from Balıkesir, Turkey. ................................... 30
Figure 4.1. Flow charts summarizing the methods performed with Atxn2-KO
mouse tissues, SCA2 patient blood samples and ATXN2-KD
SH-SY5Y cells. ........................................................................................ 46
Figure 4.2. A schematic view of the counting chamber. ............................................. 52
Figure 4.3. Layout of the 6-well plates designed for the time-course starvation
experiments of NT and ATXN2-KD SH-SY5Y cells. .............................. 53
Figure 5.1. Summary of the results obtained throughout this thesis. .......................... 62
xi
Figure 5.2. The interaction network among the 100 most downregulated genes
in Atxn2-KO mice cerebellum. ................................................................. 64
Figure 5.3. Fold-change differences of the biomarker candidates at the protein
level in Atxn2-KO mice cerebellum. ........................................................ 66
Figure 5.4. Fold-change differences of the biomarker candidates at the protein
level in Atxn2-KO mice liver. ................................................................... 67
Figure 5.5. Expression levels of the ER-associated factors, Syvn1 and Sel1l,
in Atxn2-KO mice cerebellum. ................................................................. 69
Figure 5.6. Expression levels of the ER-associated factors, Syvn1 and Sel1l,
in Atxn2-KO mice liver. ............................................................................ 69
Figure 5.7. Expression levels of the candidate biomarker genes in Atxn2-KO mice
cerebellum. ............................................................................................... 71
Figure 5.8. Expression levels of the candidate biomarker genes in Atxn2-KO mice
liver. .......................................................................................................... 71
Figure 5.9. Expression levels of the candidate biomarker genes in SCA2 patients
showing no statistical significance. .......................................................... 76
Figure 5.10. Expression levels of the candidate biomarker genes in SCA2 patients
showing a trend towards significance. ...................................................... 77
Figure 5.11. Expression levels of the candidate biomarker genes in SCA2 patients
showing statistically significant dysregulations. ...................................... 78
Figure 5.12. The interaction network of the significantly dysregulated ALS- and
ataxia-associated genes in SCA2 patients. ............................................... 79
Figure 5.13. Expression levels of the ALS- and ataxia-associated genes in SCA2
patients showing no statistical significance. ............................................. 81
Figure 5.14. Expression levels of the MATR3 and ATXN1 genes in SCA2
patients showing significant dysregulations. ............................................ 82
Figure 5.15. Highly significant enrichment in the Parkinson’s disease pathway. ........ 84
Figure 5.16. Significant downregulations of the mitochondrial genes in Atxn2-KO
mice cerebellum and liver. ........................................................................ 85
Figure 5.17. Expression analysis results of the mitochondria- and ataxin-2-associated
genes after time-course starvation of NT- and ATXN2-KD
SH-SY5Y cells. ........................................................................................ 89
xii
LIST OF TABLES
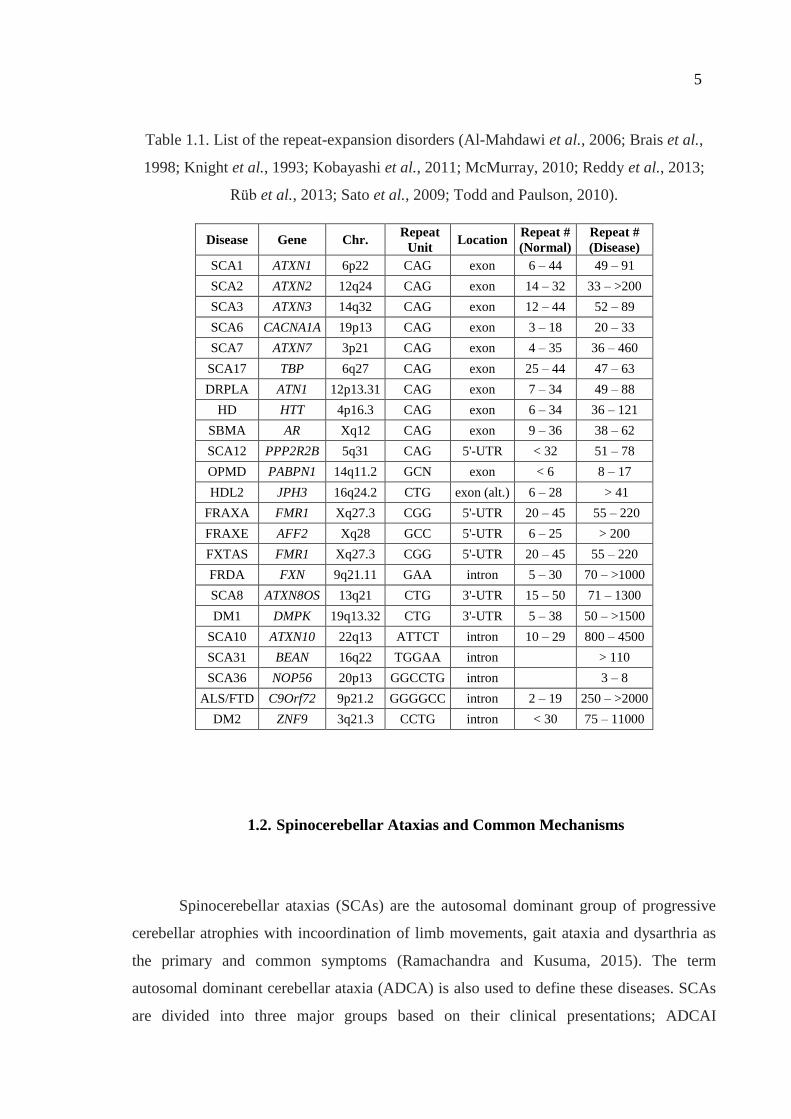
Table 1.1. List of the repeat-expansion disorders. ..................................................... 5
Table 3.1. Blood donors from the large SCA2 pedigree. .......................................... 29
Table 3.2. Solutions and chemicals used in the amplification of ATXN2 CAG
repeat tract. ............................................................................................... 31
Table 3.3. Primers used in the amplification of ATXN2 CAG repeat tract. ............... 31
Table 3.4. Materials used in agarose gel electrophoresis. ......................................... 32
Table 3.5. General information regarding Atxn2-KO mouse line. ............................ 32
Table 3.6. General information regarding naïve SH-SY5Y cell line. ....................... 33
Table 3.7. Target and control shRNA constructs used in the knock-down
protocol. .................................................................................................... 33
Table 3.8. Materials used in the cell culture experiments. ........................................ 34
Table 3.9. Reagents and kits used for total RNA isolation from different
sample types. ............................................................................................ 34
Table 3.10. Contents of the kits used in DNaseI treatment and reverse
transcription of the isolated total RNA. .................................................... 35
Table 3.11. Materials used in Taqman gene expression assays. .................................. 35
Table 3.12. Human Taqman assays. ............................................................................ 36
Table 3.13. Murine Taqman assays. ............................................................................ 37
Table 3.14. Materials used in protein isolation, quantitation and SDS-PAGE. .......... 37
Table 3.15. Contents of the lysis buffers used in protein isolation. ............................. 38
Table 3.16. Contents of the stock solutions used in SDS-PAGE. ............................... 38
Table 3.17. Materials used in quantitative immunoblots. ............................................ 38
Table 3.18. Primary antibodies used in quantitative immunoblots. ............................ 39
xiii
Table 3.19. Secondary antibodies used in quantitative immunoblots. ........................ 39
Table 3.20. Software, tools and databases utilized. ..................................................... 40
Table 3.21. General laboratory equipment. ................................................................. 41
Table 3.22. General chemicals used in various experiments. ...................................... 44
Table 3.23. Commercially available kits used in various experiments. ...................... 45
Table 4.1. Content of the ATXN2 CAG repeat amplification PCR mix. ................... 48
Table 4.2. PCR conditions for ATXN2 CAG repeat amplification. ........................... 48
Table 4.3. Contents of the different media used in ATXN2-KD SH-SY5Y
culture experiments. .................................................................................. 50
Table 4.4. Content of the reaction mix for qRT-PCR with Taqman probes. ............. 55
Table 4.5. Cycling conditions of the qRT-PCR with Taqman probes. ...................... 55
Table 4.6. Contents of the resolving and stacking gels casted in SDS-PAGE. ......... 58
Table 5.1. Summary of the quantitative immunoblot analyses in Atxn2-KO mice
cerebellum and liver. ................................................................................ 65
Table 5.2. Genotype information of the blood donors from the Turkish SCA2
pedigree. ................................................................................................... 73
Table 5.3. List of the differentially expressed candidate biomarker genes
in SCA2 patients. ...................................................................................... 74
Table 5.4. List of the differentially expressed ALS and ataxia-associated genes
in SCA2 patients. ...................................................................................... 80
Table A1. List of all known spinocerebellar ataxias. ................................................ 105
Table A2. Significantly upregulated pathways in the blood RNA-sequencing
data of SCA2 patients. .............................................................................. 107
Table A3. Significantly downregulated pathways in the blood RNA-sequencing
data of SCA2 patients. .............................................................................. 112

xiv
LIST OF SYMBOLS
* Asterix
# Number
% Percent
^ Power
< Less than
> Greater than
bp Basepairs
cm Centimeter
g Gram
g Gravitational force
h Hour
kb Kilobase
kDa Kilo Dalton
M Molar
mg Milligram
min Minute
ml Milliliter
mm Millimeter
mM Millimolar
ng Nanogram
oC Celsius degree
pH Power of Hydrogen
pmol Picomole
rpm Revolution per minute
sec Seconds
T Trend
U Unit
V Volt

xv
α Alpha
β Beta
∆ Delta
µg Microgram
µl Microliter
µm Micrometer
µM Micromolar
xvi
LIST OF ACRONYMS/ABBREVIATIONS
3' Three prime end
3-D Three dimensional
5' Five prime end
A Adenine
A2BP1 Ataxin-2 binding protein 1
AA/BA Acrylamide/Bisacrylamide mix
AD Alzheimer’s disease
ADCA Autosomal dominant cerebellar ataxia
AFF2 AF4/FMR2 family, member 2
AFG3L2 AFG3 ATPase family member 3-like 2
Ala Alanine
ALS Amyotrophic lateral sclerosis
ALS2 Alsin
ALSoD Amyotrophic Lateral Sclerosis Online Database
alt. Alternatively spliced exon
AMPA α-amino-3-hydroxy-5-methyl-4-isoxazolepropionate
ANG Angiogenin
ANOVA Analysis of variance
AO Age of onset
Apo Apolipoprotein
APS Ammonium persulfate
AR Androgen receptor
ARCA Autosomal recessive cerebellar ataxia
Asp Aspartate
AT Ataxia telangiectasia
ATM Ataxia telangiectasia mutated
ATN1 Atrophin-1
ATP Adenosine-tris-phosphate
xvii
ATXN Ataxin
b-actin Beta Actin
BEAN1 Brain expressed, associated with NEDD4, 1 , SCA31
BPB Bromophenol blue
BPES Blepharophimosis, ptosis and epicanthus inversus
BSA Bovine serum albumin
C Cytosine
C9orf72 Chromosome 9 open reading frame 72
Ca2+ Calcium Ion
CACNA1A Calcium channel, voltage-dependent, alpha 1A subunit
CBD Corticobasal degeneration
CCD Cleidocranial dysplasia
CCDC88C Coiled-coil domain containing 88C
CCHS Congenital central hypoventilation syndrome
cDNA Complementary DNA
CHMP2B Charged multivesicular body protein 2B
Chr. Chromosomal locus
CJD Creutzfeldt-Jakob disease
CNS Central nervous system
CNT Control
CO2 Carbondioxide
CpG C-phosphate-G
Ct Cycle threshold
Cu Copper
D Aspartate
DACT1 Dishevelled-binding antagonist of beta-catenin 1
DCP2 Decapping protein 2
DCTN1 Dynactin 1
DDX6 DEAD/H-box helicase 6
DEAD Asp-Glu-Ala-Asp
DM Myotonic dystrophy
DMPK Dystrophia myotonica-protein kinase
DMSO Dimethyl sulfoxide
xviii
DNA Deoxyribonucleic acid
DNase I Deoxyribonuclease I
dNTP Deoxyribonucleotide triphosphate
DRPLA Dentatorubral pallidoluysian atrophy
DTT Dithiothreitol
E Glutamate
ECL Enhanced chemiluminescence
EDTA Ethylenglycoltetraacetic acid
EEF2 Eukaryotic translation elongation factor 2
EGF Epidermal growth factor
EGFR Epidermal growth factor receptor
EIF Eukaryotic initiation factor
ELOVL Elongation of very long chain fatty acids protein
EPM1 Progressive myoclonic epilepsy 1
ER Endoplasmic reticulum
ES Enrichment score
EtOH Ethanol
ETS1 E-twenty-six family 1
ETV7 ETS family variant 7
FAM 6-Carboxyfluorescein
FCS Fetal calf serum
FBXW8 F-box and WD repeat domain containing 8
FDR False discovery rate
FGF14 Fibroblast growth factor 14
FIG4 Polyphosphoinositide phosphatase
FMR1 Fragile X mental retardation 1
FRAXA Fragile X syndrome
FRAXE Fragile site, folic acid type, rare, fra(X)(q28) E
FRDA Friedreich ataxia
FTD Frontotemporal dementia
FTDP-17 FTD and parkinsonism linked to chr. 17
FUS Fused in sarcoma
Fwd Forward primer
xix
FWER Family-wise error rate
FXN Frataxin
FXTAS Fragile X-associated tremor/ataxia syndrome
G Guanine
GABA Gamma-aminobutyric acid
GAPDH Glyceraldehyde 3-phosphate dehydrogenase
GHITM Growth hormone inducible transmembrane protein
Gln Glutamine
Glu Glutamate
GSS Gerstmann–Sträussler–Scheinker syndrome
GWAS Genome wide association study
GSEA Gene Set Enrichment Analysis
H Histidine
H2O Water
dH2O Distilled water
HBSS Hank's Balanced Salt Solution
HCl Hydrochloric acid
HD Huntington's disease
HDAC1 Histone deacetylase 1
HDL2 Huntington’s-disease-like 2
HEK293 Human embryonic kidney 293
HeLa Cervical cancer cells derived from Henrietta Lacks
HEPES 4-(2-hydroxyethyl)-1-piperazineethanesulfonic acid
HFG Hand–foot–genital syndrome
hnRNP Heterogeneous nuclear ribonucleoproteins
HPE5 Holoprosencephaly 5
HPRT1 Hypoxanthine-guanine phosphoribosyltransferase 1
Hpx Hemopexin
HRP Horseradish peroxidase
HSP Hereditary Spastic Paraplegia
HTT Huntingtin
ISSX X-linked infantile spasm syndrome
ITPR1/InsP3R1 Inositol trisphosphate receptor 1
xx
JPH3 Junctophilin 3
KCNC3 Voltage-gated potassium channel subunit Kv3.3
KCND3 Voltage-gated potassium channel subunit Kv4.3
KD Knock-down
KO Knock-out
KRAB Krueppel-associated box
LBD Lewy body dementia
LC Liquid chromatography
LRRK2 Leucine-rich repeat kinase 2
Lsm Like Sm
LsmAD Like Sm-associated domain
MATR3 Matrin 3
ME31B Maternal expression at 31B
MEM Modified eagle medium
MgCl2 Magnesium Chloride
miRNA Micro RNA
MJD Majado-Joseph disease
MRGH Mental retardation with growth hormone deficiency
MRI Magnetic resonance imaging
mRNA Messenger RNA
MS Mass spectrometry
mTOR Mammalian target of rapamycin
Mttp Microsomal triglyceride transfer protein
NaCl Sodium chloride
ND Neurodegenerative disorder
NEAA Non-essential amino acids
NES Normalized enrichment score
NMDA N-Methyl-D-aspartate
No. Number
NOM Nominal
NOP56 Nucleolar protein 5A, 56 kDa
NT Non-target
OD Optical density
xxi
OPA1 Optic atrophy 1
OPMD Oculopharyngeal muscular dystrophy
OPTN Optineurin
p62/SQSTM1 Sequestosome 1
PABPC1 Poly(A)-binding protein, cytoplasmic 1
PABPN1 Poly(A)-binding protein, nuclear 1
PAGE Polyacrylamide gel electrophoresis
PAIP Poly(A)-binding protein interacting protein
PAM2 Poly(A)-binding protein interacting motif 2
PARK2 Parkin
PARK7 Parkinson disease protein 7, DJ-1
P-bodies Processing body
PBP1 Pab binding protein 1
PBS Phosphate buffered saline
PCR Polymerase chain reaction
PD Parkinson's disease
PDYN Prodynorphin
PFN1 Profilin 1
PHTF2 Putative homeodomain transcription factor 2
PiD Pick's disease
PINK1 PTEN-induced putative kinase 1
PMSF Phenylmethylsulfonyl fluoride
Plin3 Perilipin 3
Poly(A) Polyadenine
Poly-Q Polyglutamine
PPP2R2B Protein phosphatase 2, regulatory subunit B, beta
PRKCG Protein kinase C, gamma
PSP Progressive supranuclear palsy
PVDF Polyvinylidene fluoride
Q Glutamine
qRT-PCR Quantitative real time-PCR
PAS Per-Arnt-Sim kinase
R Arginine
xxii
RAI1 Retinoic acid induced 1
RBFOX1 RNA-binding protein Fox-1
RBP4 Retinol binding protein 4
rER Rough endoplasmic reticulum
Rev Reverse primer
RIPA Radioimmunoprecipitation assay
RISC RNA-induced silencing complex
RNA Ribonucleic acid
RNP Ribonucleoprotein
RPMI Roswell park memorial institute
RPKM Reads per kilobase mapped reads
rRNA Ribosomal RNA
S Serine
SBMA Spinal bulbar muscle atrophy
SC Sample collection
SCA Spinocerebellar ataxia
SDS Sodium dodecyl sulfate
SEL1L Sel-1 suppressor of lin-12-like
SEM Standard error of the mean
SETX Senataxin
SERINC2 Serine incorporator 2
SERPINA1 Serpin peptidase inhibitor, clade A, member 1
SG Stress granule
shRNA Small hairpin RNA
SH-SY5Y Neuroblastoma cells subcloned from SK-N-SH cells
SMA Spinal muscular atrophy
Snf1 Sucrose non-fermenting 1
SNP Single nucleotide polymorphism
SOD1 Superoxide dismutase 1
SPAST Spastin
SPD Synpolydactyly
SPG11 Spatacsin
SPTBN2 Spectrin, beta, non-erythrocytic 2
xxiii
SRP Signal regocnition particle
SYVN1 Synovial apoptosis inhibitor 1
T Thymidine
TARDBP/TDP43 Transactive response DNA binding protein 43 kDa
TBC1 Tre-2/USP6, BUB2, cdc16
TBE Tris/Borate/EDTA
TBP TATA box binding protein
TBS Tris buffered saline
TBS-T Tris buffered saline-Tween
TGM6 Transglutaminase 6
TMEM240 Transmembrane protein 240
TNR Trinucleotide repeat
TORC1 Target of rapamycin complex 1
Tris Tris(hydroxymethyl)-aminomethane
TTBK2 Tau tubulin kinase 2
TTR Transthyretin
U Uracil
UBE3A Ubiquitin protein ligase E3A
UBQLN2 Ubiquilin 2
UPR Unfolded protein response
UPS Ubiquitin-proteasome system
UTR Untranslated region
UV Ultraviolet
VABP VAMP-associated protein B
VCP Valosin containing protein
VDBP Vitamin D binding protein
VDCC Voltage-dependent Calcium channel
WT Wild type
Y Tyrosine
ZBRK1 BRCA1-interacting KRAB zinc finger protein 1
Zn Zinc
ZNF9 Zinc finger domain 9
1
1. INTRODUCTION
Neurodegenerative disorders (NDs) are a large group of neurological diseases
caused by the loss or malfunctioning of the neurons. Progressive and asynchronous
degeneration of the neurons highly affects the daily life quality of the patients, and may
eventually be fatal if cognition or the execution of the vital functions, such as respiration
and heart rate, is impaired. It has been reported that neurodegenerative and
neuropsychiatric disorders can be responsible for 3.3% of the deaths due to
noncommunicable conditions worldwide, following cardiovascular and respiratory
problems (61.1%), and cancer (21.7%) (Statistical Annex, World Health Report 2004 by
World Health Organization). Along with the improvements in cardiovascular disease and
cancer therapeutics, the population size of individuals above 65 years-old in developed
countries is growing faster than that of the whole population. Thus, it is anticipated that the
ratio of elderly to the whole population will double in the up-coming generations, raising
the percentage of neurodegenerative and neuropsychiatric disorder-associated deaths, as
aging is the main risk factor for the development of most NDs (Przedborski et al., 2003).
Advancements in the medical science over the past century and the consequent increase in
the average life expectancy of mankind renders this group of disorders a pivotal
phenomenon to be dealt with.
1.1. Classification of Neurodegenerative Disorders
There are a few hundred NDs defined so far, presenting with a variety of clinical
features depending on the specific subset of affected neurons, mechanism of pathology and
environmental factors. Clinical and pathological overlaps of different features are quite
common and further complicate the classification of these disorders. One way of
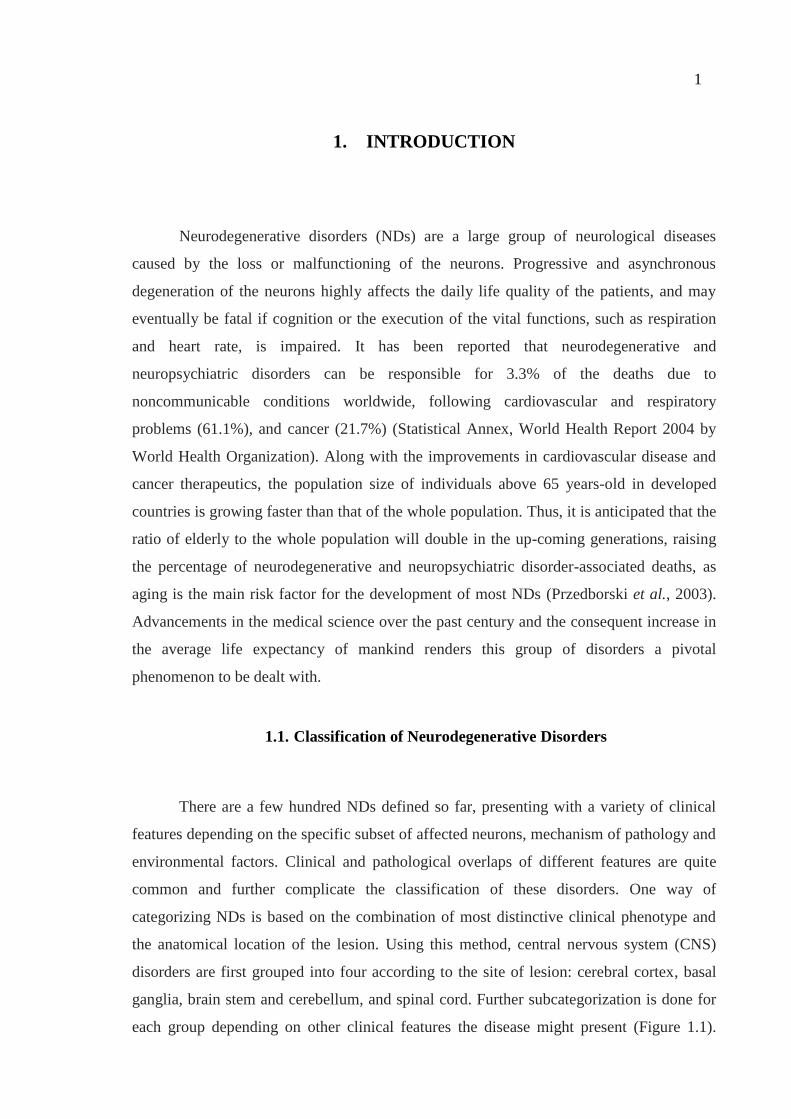
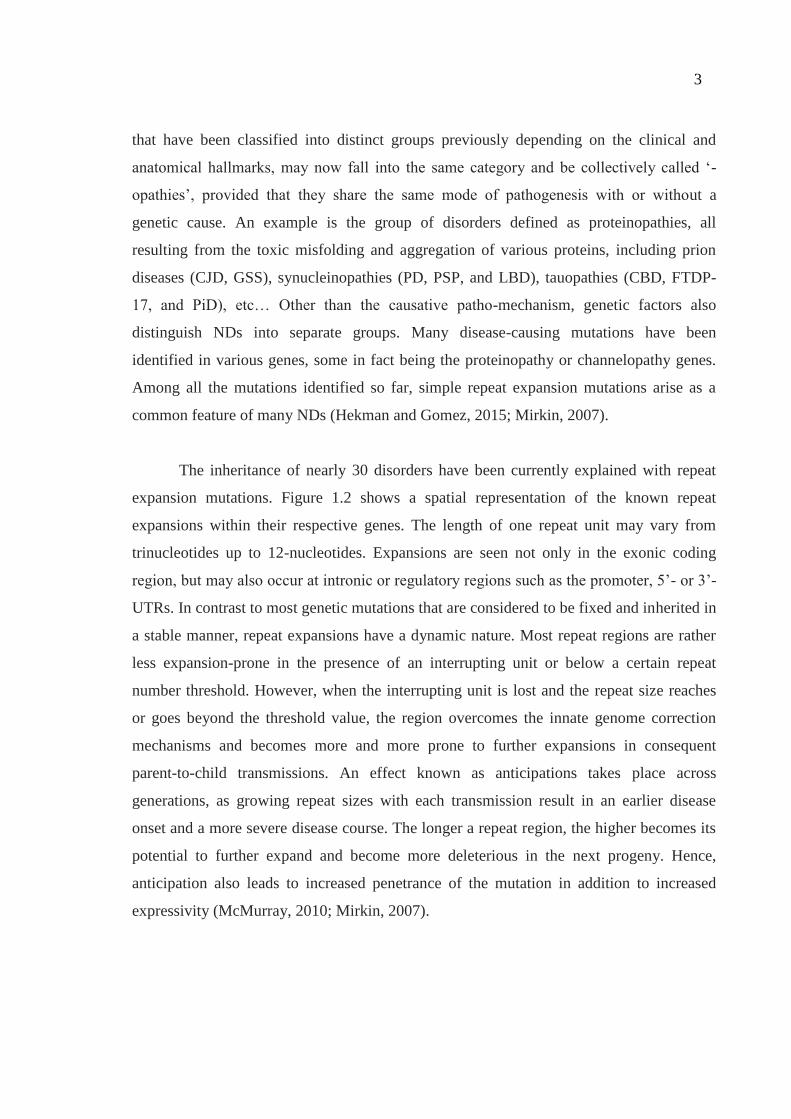
categorizing NDs is based on the combination of most distinctive clinical phenotype and
the anatomical location of the lesion. Using this method, central nervous system (CNS)
disorders are first grouped into four according to the site of lesion: cerebral cortex, basal
ganglia, brain stem and cerebellum, and spinal cord. Further subcategorization is done for
each group depending on other clinical features the disease might present (Figure 1.1).
2
Cerebral cortex diseases may be dementing or non-dementing. Basal ganglia diseases are
either hypokinetic or hyperkinetic. Brain stem and cerebellum diseases are well classified
into cerebellar cortical atrophy and olivopontocerebellar atrophy, although there are some
cerebellar disorders that do not fit to any of these subcategories. Spinal cord diseases are
amyotrophic lateral sclerosis, spinal muscular atrophy and Friedreich’s ataxia. In some
cases, functional and anatomical connection of distant cell populations in the nervous
system may lead to multiple lesions in separated regions, as closer parts remain intact. The
disease, in such a case, would be classified in both corresponding categories. On the
contrary, there exists a group of disorders that are considered to be neurodegenerative only
due to their course, with no known causative pathogenesis whatsoever, thus cannot be
placed in any of these categories (Przedborski et al., 2003).
Figure 1.1. Classification of CNS disorders based on the most distinctive clinical
phenotype and the anatomical location of the lesion (Przedborski et al., 2003).
A different and rather recently adopted way to classify NDs is based on their
molecular characteristics. Such a categorization has been made possible by the leap in the
research on molecular and genetic basis of diseases over the past few decades. Disorders
3
that have been classified into distinct groups previously depending on the clinical and
anatomical hallmarks, may now fall into the same category and be collectively called ‘-
opathies’, provided that they share the same mode of pathogenesis with or without a
genetic cause. An example is the group of disorders defined as proteinopathies, all
resulting from the toxic misfolding and aggregation of various proteins, including prion
diseases (CJD, GSS), synucleinopathies (PD, PSP, and LBD), tauopathies (CBD, FTDP-
17, and PiD), etc… Other than the causative patho-mechanism, genetic factors also
distinguish NDs into separate groups. Many disease-causing mutations have been
identified in various genes, some in fact being the proteinopathy or channelopathy genes.
Among all the mutations identified so far, simple repeat expansion mutations arise as a
common feature of many NDs (Hekman and Gomez, 2015; Mirkin, 2007).
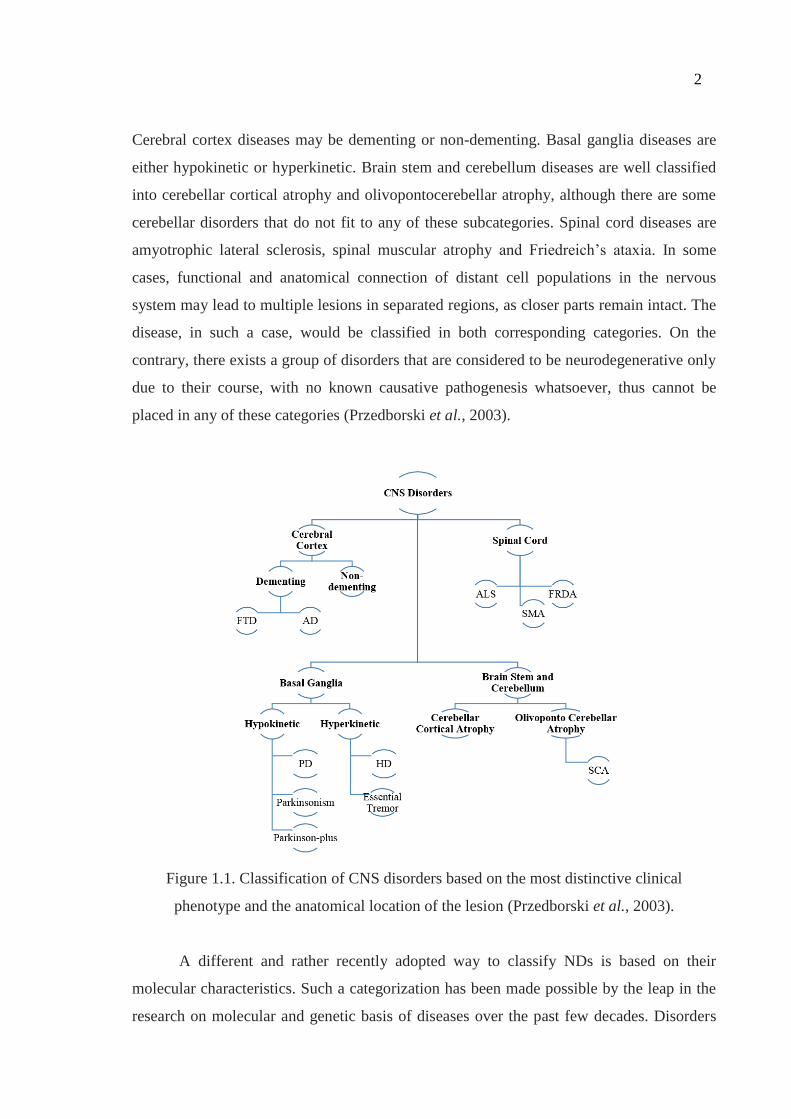
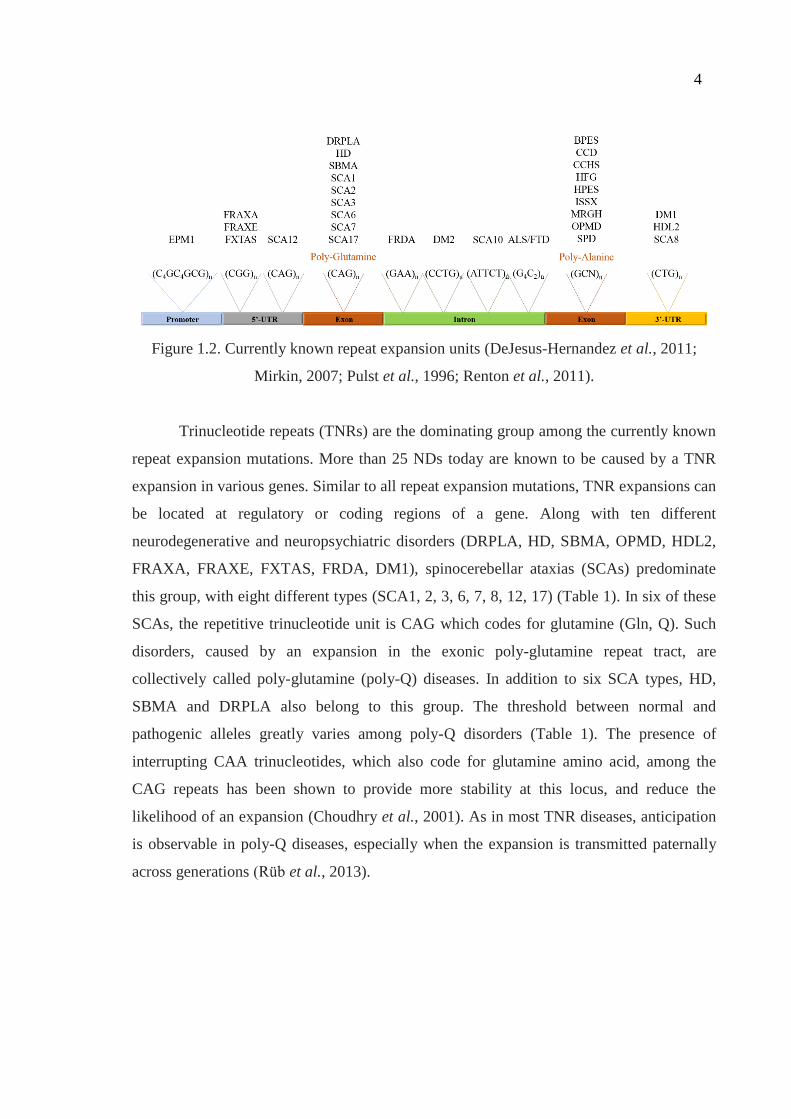
The inheritance of nearly 30 disorders have been currently explained with repeat
expansion mutations. Figure 1.2 shows a spatial representation of the known repeat
expansions within their respective genes. The length of one repeat unit may vary from
trinucleotides up to 12-nucleotides. Expansions are seen not only in the exonic coding
region, but may also occur at intronic or regulatory regions such as the promoter, 5’- or 3’-
UTRs. In contrast to most genetic mutations that are considered to be fixed and inherited in
a stable manner, repeat expansions have a dynamic nature. Most repeat regions are rather
less expansion-prone in the presence of an interrupting unit or below a certain repeat
number threshold. However, when the interrupting unit is lost and the repeat size reaches
or goes beyond the threshold value, the region overcomes the innate genome correction
mechanisms and becomes more and more prone to further expansions in consequent
parent-to-child transmissions. An effect known as anticipations takes place across
generations, as growing repeat sizes with each transmission result in an earlier disease
onset and a more severe disease course. The longer a repeat region, the higher becomes its
potential to further expand and become more deleterious in the next progeny. Hence,
anticipation also leads to increased penetrance of the mutation in addition to increased
expressivity (McMurray, 2010; Mirkin, 2007).
4
Figure 1.2. Currently known repeat expansion units (DeJesus-Hernandez et al., 2011;
Mirkin, 2007; Pulst et al., 1996; Renton et al., 2011).
Trinucleotide repeats (TNRs) are the dominating group among the currently known
repeat expansion mutations. More than 25 NDs today are known to be caused by a TNR
expansion in various genes. Similar to all repeat expansion mutations, TNR expansions can
be located at regulatory or coding regions of a gene. Along with ten different
neurodegenerative and neuropsychiatric disorders (DRPLA, HD, SBMA, OPMD, HDL2,
FRAXA, FRAXE, FXTAS, FRDA, DM1), spinocerebellar ataxias (SCAs) predominate
this group, with eight different types (SCA1, 2, 3, 6, 7, 8, 12, 17) (Table 1). In six of these
SCAs, the repetitive trinucleotide unit is CAG which codes for glutamine (Gln, Q). Such
disorders, caused by an expansion in the exonic poly-glutamine repeat tract, are
collectively called poly-glutamine (poly-Q) diseases. In addition to six SCA types, HD,
SBMA and DRPLA also belong to this group. The threshold between normal and
pathogenic alleles greatly varies among poly-Q disorders (Table 1). The presence of
interrupting CAA trinucleotides, which also code for glutamine amino acid, among the
CAG repeats has been shown to provide more stability at this locus, and reduce the
likelihood of an expansion (Choudhry et al., 2001). As in most TNR diseases, anticipation
is observable in poly-Q diseases, especially when the expansion is transmitted paternally
across generations (Rüb et al., 2013).
5
Table 1.1. List of the repeat-expansion disorders (Al-Mahdawi et al., 2006; Brais et al.,
1998; Knight et al., 1993; Kobayashi et al., 2011; McMurray, 2010; Reddy et al., 2013;
Rüb et al., 2013; Sato et al., 2009; Todd and Paulson, 2010).
Disease Gene Chr. Repeat
Unit Location
Repeat #
(Normal)
Repeat #
(Disease)
SCA1 ATXN1 6p22 CAG exon 6 – 44 49 – 91
SCA2 ATXN2 12q24 CAG exon 14 – 32 33 – >200
SCA3 ATXN3 14q32 CAG exon 12 – 44 52 – 89
SCA6 CACNA1A 19p13 CAG exon 3 – 18 20 – 33
SCA7 ATXN7 3p21 CAG exon 4 – 35 36 – 460
SCA17 TBP 6q27 CAG exon 25 – 44 47 – 63
DRPLA ATN1 12p13.31 CAG exon 7 – 34 49 – 88
HD HTT 4p16.3 CAG exon 6 – 34 36 – 121
SBMA AR Xq12 CAG exon 9 – 36 38 – 62
SCA12 PPP2R2B 5q31 CAG 5'-UTR < 32 51 – 78
OPMD PABPN1 14q11.2 GCN exon < 6 8 – 17
HDL2 JPH3 16q24.2 CTG exon (alt.) 6 – 28 > 41
FRAXA FMR1 Xq27.3 CGG 5'-UTR 20 – 45 55 – 220
FRAXE AFF2 Xq28 GCC 5'-UTR 6 – 25 > 200
FXTAS FMR1 Xq27.3 CGG 5'-UTR 20 – 45 55 – 220
FRDA FXN 9q21.11 GAA intron 5 – 30 70 – >1000
SCA8 ATXN8OS 13q21 CTG 3'-UTR 15 – 50 71 – 1300
DM1 DMPK 19q13.32 CTG 3'-UTR 5 – 38 50 – >1500
SCA10 ATXN10 22q13 ATTCT intron 10 – 29 800 – 4500
SCA31 BEAN 16q22 TGGAA intron > 110
SCA36 NOP56 20p13 GGCCTG intron 3 – 8
ALS/FTD C9Orf72 9p21.2 GGGGCC intron 2 – 19 250 – >2000
DM2 ZNF9 3q21.3 CCTG intron < 30 75 – 11000
1.2. Spinocerebellar Ataxias and Common Mechanisms
Spinocerebellar ataxias (SCAs) are the autosomal dominant group of progressive
cerebellar atrophies with incoordination of limb movements, gait ataxia and dysarthria as
the primary and common symptoms (Ramachandra and Kusuma, 2015). The term
autosomal dominant cerebellar ataxia (ADCA) is also used to define these diseases. SCAs
are divided into three major groups based on their clinical presentations; ADCAI
6
comprises mixed cerebellar ataxia symptoms with additional neurological problems such
as seizures, areflexia, and deficiency in sensory and cognitive systems, ADCAII shows
cerebellar ataxia with retinopathy which has only been observed in SCA7 so far, and
ADCAIII group presents pure cerebellar ataxia symptoms. Currently, 36 genetic loci have
been identified for the 40 clinically differentiated types of SCAs. In 28 of these loci, the
causative genes have been identified, the pathogenic roles of eight loci still remain
unsolved (Supplementary Table S1) (Kobayashi et al., 2011; McMurray, 2010; Rüb et al.,
2013; Sato et al., 2009; Todd and Paulson, 2010). The worldwide prevalence of all SCAs
combined is around 4 in 100.000, although geographical variability is observed in some
subtypes due to the residency of a founder population in a defined region. SCA3 is the
most common type worldwide preceding SCA1, SCA2, SCA6, SCA7 and SCA8
(Ramachandra and Kusuma, 2015).
Poly-Q domain expansions are shown to be the common genetic cause of some
SCAs, therefore recurrent mechanisms of pathology are also shared among these subtypes
at the anatomical and molecular levels. Neuronal cell loss in the cerebellum, and additional
damage to the extra-cerebellar tissues, especially at later stages of the disease, greatly
overlaps in all poly-Q SCAs. The most shared atrophy among all poly-Q SCAs is observed
at the Purkinje cell layer and Fastigial nuclei in the cerebellum, giant Betz neurons in the
primary motor cortex of the cerebrum, substantia nigra in the midbrain and superior olive
in the pons. Many other regions of the cerebellum, midbrain and pons is affected to
different degrees in different disease subtypes (Figure 1.3) (Seidel et al., 2012).
7
Figure 1.3. Graphical visualization of the spatial neuronal loss in different poly-Q SCAs.
The focal points of cell loss is demonstrated by intensity of the red color in the midsaggital
sections through cerebrum, brain stem and cerebellum (Seidel et al., 2012).
Primary effects of the expansion at the molecular level manifest as toxic RNA foci
and aberrant folding of the expanded protein, altered subcellular localization of which
enhances the formation of intracellular protein aggregates. Major secondary effects of
these abnormalities occur as transcriptional dysregulations, disruption of the Ca2+
homeostasis, mitochondrial dysfunction and problems in degradation pathways. The
variability in the prominence of these secondary effects in different SCAs depend on the
particular function of the responsible protein for each type.
Since most of the expansion-bearing proteins in SCA pathogenesis are associated
with transcription and the regulation of RNA metabolism either directly or indirectly, some
poly-Q SCAs are counted as a part of ‘transcriptionopathies’ (Matilla-Dueñas et al., 2014).
Transcriptional changes in different gene sets were observed in poly-Q SCAs, however
dysregulation of the genes involved in calcium homeostasis was a common feature. A
decrease in the expression of Ca2+-dependent proteins, which is normally quite high due to
their roles in Purkinje cell survival and function, was observed in various poly-Q SCAs
8
and also in other poly-Q diseases (Czeredys et al., 2013; Egorova et al., 2015; Hansen et
al., 2013; Lin et al., 2000; Saegusa et al., 2007; Tian et al., 2015). Deletions and missense
mutations in ITPR1 Ca2+ receptor have been found as the genetic cause of two SCA types
(SCA15 and SCA16), which are classified as ‘channelopathies’, together with several other
ion channel dysfunction-mediated disorders.
Mitochondrial dysfunction is also a common pathogenic mechanism in poly-Q
SCAs. Aside from its well-established role in calcium homeostasis, enhanced fission of the
mitochondria, accumulated reactive oxygen species in the cytoplasm, subsequent
activation of the stress response and the increase in caspase pathways all contribute to the
pathology (Wang et al., 2011). Several mitochondrial mutations have also been directly
linked to a number of ataxia cases (Gorman et al., 2015; Jobling et al., 2015; Park et al.,
2014).
Yet another common impairment leading to poly-Q SCAs occur in the degradation
pathways due to intracellular aggregations formed by expanded proteins. Although these
aggregates intend to be protective by eliminating the toxic component from the
environment, an overload of work arises for the proteosomal degradation machinery. The
densely packed stress granules induced by oxidative stress or altered homeostasis are
hallmarks of not only poly-Q SCAs, but also of the majority of NDs. They generate large
chunks of material that is problematic for the conventional degradation pathways of the
cell: ubiquitin-proteosome system (UPS) and autophagy. UPS is responsible for the
degradation of most proteins, while autophagy is employed in the degradation of
terminally aggregated proteins and cellular organelles. Targeting of the substrate proteins
to both systems depends on the ubiquitin tags. Proteins targeted to UPS undergo ATP-
dependent degradation by the proteasome machinery, and if not, they are covered with
autophagosomes, double-membrane-coated vesicles, and subjected to lysosomal digestion
(Lilienbaum, 2013). Ubiquitin is often found to be part of the intracellular aggregates in a
number of NDs (Goldbaum and Richter-Landsberg, 2004). SQSTM1, also known as p62,
is an autophagy receptor identifying targets to degrade in the cytoplasm, and is a
component of the stress granules, besides the fact that it has an established role in the
9
pathogenesis of various NDs (Fecto et al., 2011; Gal et al., 2007; Hiji et al., 2008; Homma
et al., 2014; Lim et al., 2015).
Lastly, irregularities in neuronal excitability and excitotoxicity are also shared
among different types of SCAs; glutamate toxicity caused by the instability of the
glutamate transport (spectrin mutations), altered regulation of cellular excitability (FGF14
mutations) and activation of unfolded protein response (UPR) via increased frameshifting
mistake during translation (eEF mutations) have all been shown as direct causes of distinct
SCA types (Hekman and Gomez, 2015).
1.3. Clinical Features of SCA2
Spinocerebellar Ataxia Type 2 (SCA2) is an autosomal dominant
neurodegenerative disorder and is a rather frequent type among ADCAs; it accounts for
13% of all ADCAs, while SCA1 counts for 6% and SCA3 for 23% (Geschwind et al.,
1997). SCA2 is somewhat more frequent in Cuba, Spain, Italy and Turkey, and less in
Brazil, Finland and Japan (Cellini et al., 2001; Juvonen et al., 2005; Lopes-Cendes et al.,
1997; Matsumura et al., 2003; Pujana et al., 1999). A small town in Cuba, called Holguin,
is where SCA2 is the most common worldwide. A founder haplotype with approximately
1000 individuals descendent from the same ancestor is resident in this town inducing a
prevalence of 500/100.000 and an incidence of 18 per year (Lastres-Becker et al., 2008b).
The mean age of onset (AO) of the disease is in the third decade, however there are cases
that manifest as early as <10 years, or late as >60 years of age. Anticipation is an observed
phenomenon of SCA2; the repeat length further expands especially during paternal
transmission, which results in an earlier disease onset and a more severe disease course
with a rapid progression in the progeny (Rüb et al., 2013). Average disease duration is
around 10 years, although some extreme cases have been reported ranging from six to 50
years of survival in Cuba and North America. Currently, there is no cure for this disease
directly targeting the causality. A variety of treatments are utilized to alleviate the
symptoms. Levodopa, a dopamine precursor mainly used in PD treatment, is given to the
patients to cure the parkinsonism symptoms, such as rigidity, bradykinesia and tremor.
10
Magnesium supplement is applied for muscle cramps. Deep brain stimulation has been
reported to improve early onset postural tremor (Lastres-Becker et al., 2008b). The latest
stem cell technologies are also under intense utilization to regenerate Purkinje neurons
from the patient induced-pluripotent stem cells or to employ mesenchymal stem cells in the
innate regeneration machinery, although further improvements in this field are still needed
for an effective treatment to be made public (Nakamura et al., 2014; Wang et al., 2015).
The initial symptoms of SCA2 are incoordination of gait and limbs, postural
rigidity, dysarthria, loss of velocity saccades, tremor, myoclonus and hyperreflexia, which
turns into hyporeflexia in a short time. As the disease progresses, challenges in vital
autonomic tasks present as dysphagia and dysfunction of the cardiac, gastrointestinal and
exocrine systems. These systematic symptoms are accompanied by distal amyotrophy, and
cognitive deficiencies such as short-term memory loss, frontal executive dysfunctions,
emotional instability and attention loss (Lastres-Becker et al., 2008b). The severity of these
symptoms increase as the disease progresses, rendering the patient bed-ridden and in need
of special care. The eventual decease of the patients is mostly due to problems in crucial
autonomic functions, such as respiration.
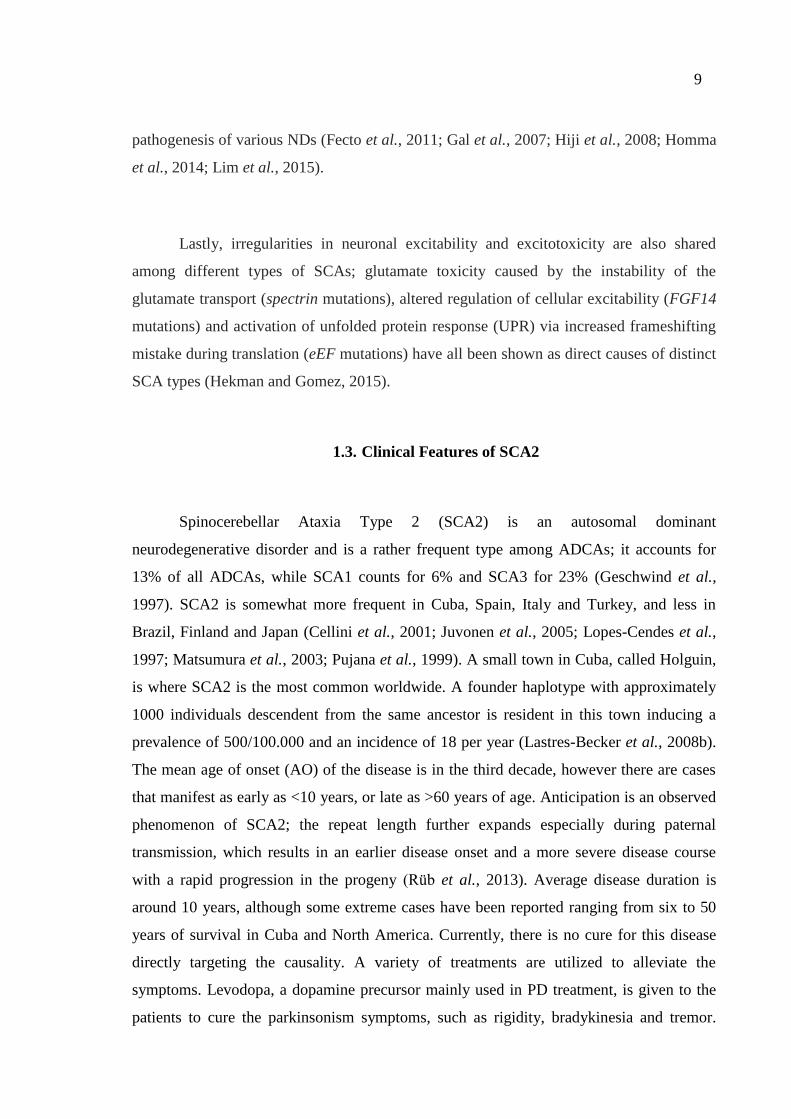
Figure 1.4. The anatomical structure of the cerebellar cortex (Apps and Garwicz,
2005).
11
Early saccade slowing is a differentiating symptom of SCA2 that separates it from
other cerebellar ataxias (Wadia and Swami, 1971), and is explained by the early
degeneration of the pontine and brainstem in addition to Purkinje cell loss at the
cerebellum (Scherzed et al., 2012). The cerebellum is divided into three cortical layers:
molecular, Purkinje and granular (Figure 1.4). Purkinje cells are located in the middle layer
and extend their dendrites towards the uppermost molecular layer where they receive input
from the climbing fibers. With the extensively large axonal projections, Purkinje cells are
the only output neurons of the cerebellar cortex and a crucial component of cerebellar
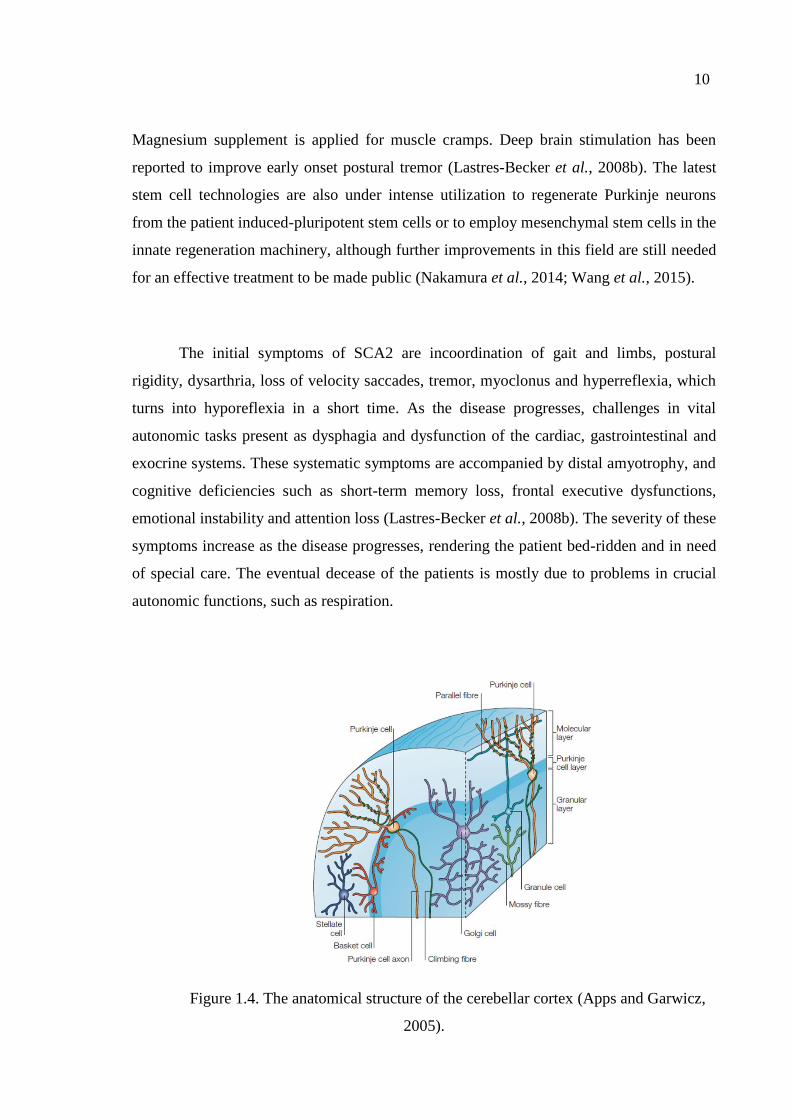
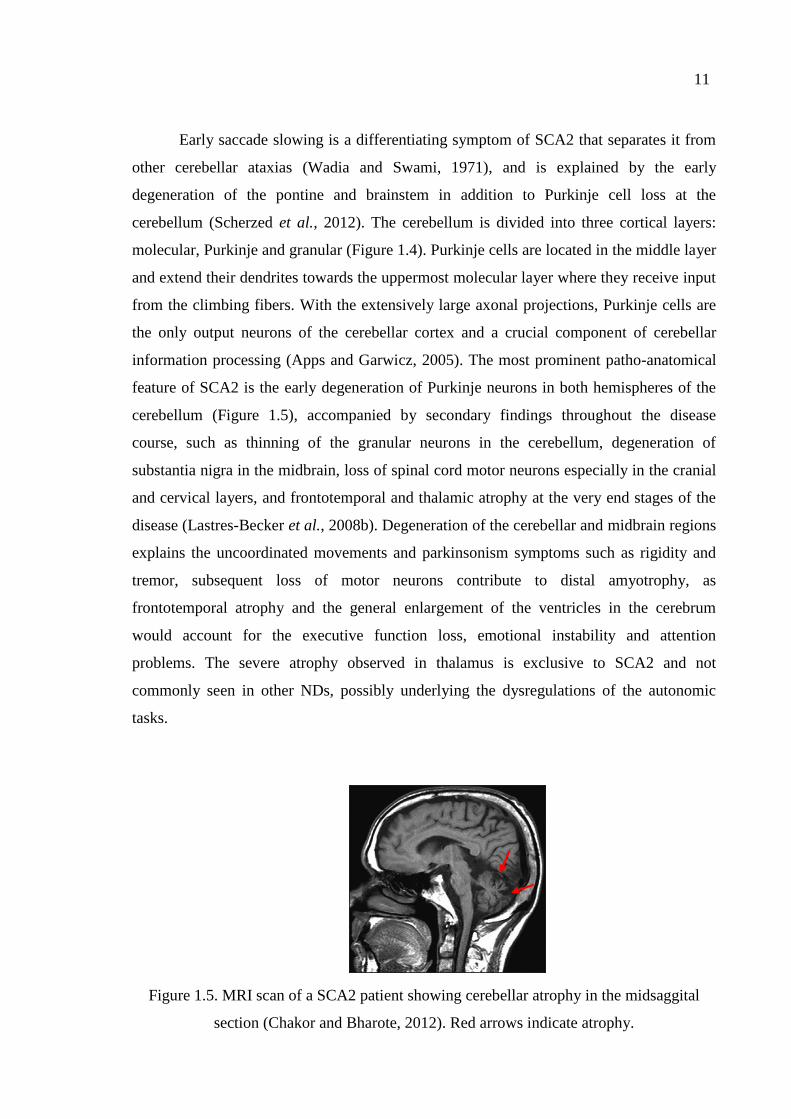
information processing (Apps and Garwicz, 2005). The most prominent patho-anatomical
feature of SCA2 is the early degeneration of Purkinje neurons in both hemispheres of the
cerebellum (Figure 1.5), accompanied by secondary findings throughout the disease
course, such as thinning of the granular neurons in the cerebellum, degeneration of
substantia nigra in the midbrain, loss of spinal cord motor neurons especially in the cranial
and cervical layers, and frontotemporal and thalamic atrophy at the very end stages of the
disease (Lastres-Becker et al., 2008b). Degeneration of the cerebellar and midbrain regions
explains the uncoordinated movements and parkinsonism symptoms such as rigidity and
tremor, subsequent loss of motor neurons contribute to distal amyotrophy, as
frontotemporal atrophy and the general enlargement of the ventricles in the cerebrum
would account for the executive function loss, emotional instability and attention
problems. The severe atrophy observed in thalamus is exclusive to SCA2 and not
commonly seen in other NDs, possibly underlying the dysregulations of the autonomic
tasks.
Figure 1.5. MRI scan of a SCA2 patient showing cerebellar atrophy in the midsaggital
section (Chakor and Bharote, 2012). Red arrows indicate atrophy.
12
Alongside the severe degeneration in the cerebellum, the remaining Purkinje cells
also show an abnormal phenotype with reduced dendritic spines and a peripheral dying-
back, also called axonopathy, can be observed in the granular layer of the cerebellum.
SCA2 also differs from other SCAs in terms of the lack or scarcity of inclusion bodies in
the nucleus. Intranuclear inclusion bodies are completely absent in the Purkinje neurons,
however cytoplasmic aggregates are seen not only in the Purkinje cells, but throughout the
brain (Lastres-Becker et al., 2008b).
Purkinje cells are especially susceptible to death, as they are among the largest, so-
called ‘magnocellular’ neurons, dealing with a high metabolic activity, bearing a massive
dendritic spine network receiving abundant excitatory input at every instant. Magnocellular
neurons are known to contain large amounts of intracellular membranes in the form of
rough-ER (rER), called Nissl bodies, in order to cope with extensive protein synthesis,
folding, and quality control. Therefore, impaired homeostasis of the protein synthesis and
degradation affects these magnocellular neurons to a greater extend, such as Purkinje cells
and motor neurons, prior to other neuronal subtypes. Purkinje cells, with their enlarged
dendritic arborizations and fairly long axonal extensions, suffer greatly from the
subcellular imbalance in the degradation of proteins. Protein synthesis is known to occur at
the farthest points of the neurons, even as far as synaptic buttons. However, the turn-over
of these proteins mainly occurs in the cell soma. Especially in the case of distal protein
aggregates, autophagic degradation via lysosomal fusion is crucial for the elimination of
inclusions and is only achieved in the cell body. Thus, larger neurons with more distal
projections suffer more from the toxic protein aggregates located far away from the cell
soma, even though the retrograde transportation mechanisms are not necessarily damaged.
Still, problems in the retrograde transport of intracellular protein aggregates or the
damaged organelles is known to be a common pathological mechanism shared among
many NDs, either due to a genetic mutation or as a sporadic case (Wong and Holzbaur,
2015).
Similar to altered proteostasis, magnocellular neurons are also more susceptible to
problems in Ca2+ homeostasis than other types of neurons. Purkinje cells express a lot of
13
Ca2+ dependent proteins and enzymes taking roles in Ca2+ intake, processing and secondary
signaling. Ca2+ channels are also significantly important in the foundation and maintenance
of the neural connections in the cerebellum between Purkinje cells and climbing fibers
during development. One of the two possible ways of Ca2+ intake for a Purkinje cell is the
activation of InsP3R1 (a.k.a. ITPR1) channel on the ER and release of intracellular Ca2+
(Egorova et al., 2015). Since ER is the major source of intracellular Ca2+ stores, and
Purkinje cells are known to contain excess amount of rER structures, any alteration in the
Ca2+ metabolism instantly affects the stability of Purkinje neurons.
1.4. SCA2 Genetics and Ataxin-2 Mechanism
The responsible genetic locus for SCA2 co-segregating with the disease phenotype
was identified as Chr.12q23-24.1 in Cuban ADCA pedigrees, and the particular disease
phenotype has been referred to as SCA2, since it is the second example of a locus
association to an ADCA, after SCA1 (Gispert et al., 1993; Orr et al., 1993). The causative
gene in this region, later named to be ATXN2, was then identified by three groups
independently utilizing positional cloning, CAG expansion-specific probes and poly-Q-
specific antibodies (Imbert et al., 1996; Pulst et al., 1996; Sanpei et al., 1996). The
ubiquitous expression of ATXN2 was detected in brain, heart, muscle and placenta, also
high levels in pancreas and liver (Imbert et al., 1996; Sanpei et al., 1996). At the cellular
level, ATXN2 is expressed highly in the Purkinje cells and large neurons in substantia
nigra, moderately expressed in globus pallidus and amygdaloid neurons of the basal
ganglia and pyramidal neurons of the hippocampus (Nechiporuk et al., 1998).
ATXN2 gene spans ~130 kb of genomic DNA and has 25 exons. An alternative start
codon is found 120 codons downstream of the conventional start site (Sanpei et al., 1996).
Exons 10 and 21 are subject to alternative splicing, both of which are located distant from
the domains with a known function (Sahba et al., 1998). A trinucleotide CAG expansion
was found in the 5’-end of the ATXN2 coding region which was later determined to be
located at exon 1 (Sahba et al., 1998). Two novel SNPs, that established two haplotypes,
were identified in exon 1, lying 106 and 117bp upstream of the CAG repeat tract: CC and
14
GT, respectively. All expanded alleles segregated with the CC haplotype, which was also
seen in 30% of the normal alleles. Majority of the normal alleles segregating with the CC
haplotype either have a pure CAG tract, or the CAA interruption closer to the 5’-end of the
repeat tract is lacking. Thus, the dynamic expansion shows an occurrence tendency
towards the 5’-end of the repeat region (Choudhry et al., 2001).
ATXN2 gene shows no sequence similarity, except for the CAG repeats, with a
known gene other than the ATXN2-related protein (A2RP) (Pulst et al., 1996). ATXN2 is
conserved among five mammalian species and chicken (Imbert et al., 1996). The
nucleotide sequence similarity is quite high between human and mouse homologs (89%).
However the mouse homolog contains only one CAG triplet at the corresponding locus to
human poly-Q tract, which suggests that the main function of ATXN2 is not exclusive to
this region (Nechiporuk et al., 1998).
In humans, the trinucleotide repeat tract is most frequently composed of 22 repeats
interrupted by CAA triplets in such a pattern: (CAG)8-CAA-(CAG)4-CAA-(CAG)8. Loss
of the two CAA units in between promotes instability, rendering it more prone to
expansions. More than 34 CAG repeats in this domain is considered pathogenic for SCA2,
while intermediate-length repeats between 26-39 have been associated with increased risk
for other NDs, such as ALS and PD, a subject to be discussed in the following sections.
The most commonly seen pathogenic alleles for SCA2 are around 37-39 repeats, while
some extreme cases with >200 repeats have been reported (Babovic-Vuksanovic et al.,
1998; Mao et al., 2002). Although loss of CAA interruptions enhances expansion via
meiotic instability, pathogenic alleles may also contain CAA interruptions, transmitting
stably to the next generation (Charles et al., 2007). Presence of a CAA interruption is
argued to have no alteration on the molecular pathogenicity, as it also codes for glutamine
amino acid and does not alter protein structure (Costanzi-Porrini et al., 2000). However,
conversion of a CAG unit to CAA reduces RNA-mediated toxicity without an effect on the
protein in ATXN3, another SCA gene containing a poly-Q domain (Todd and Paulson,
2010).
An obvious effect of the repeat size exists on the age of onset (AO) and severity of
the symptoms. AO is inversely correlated with the repeat size; the longer the CAG repeat
15
tract, the earlier becomes the manifestation with stronger symptoms and a rapid
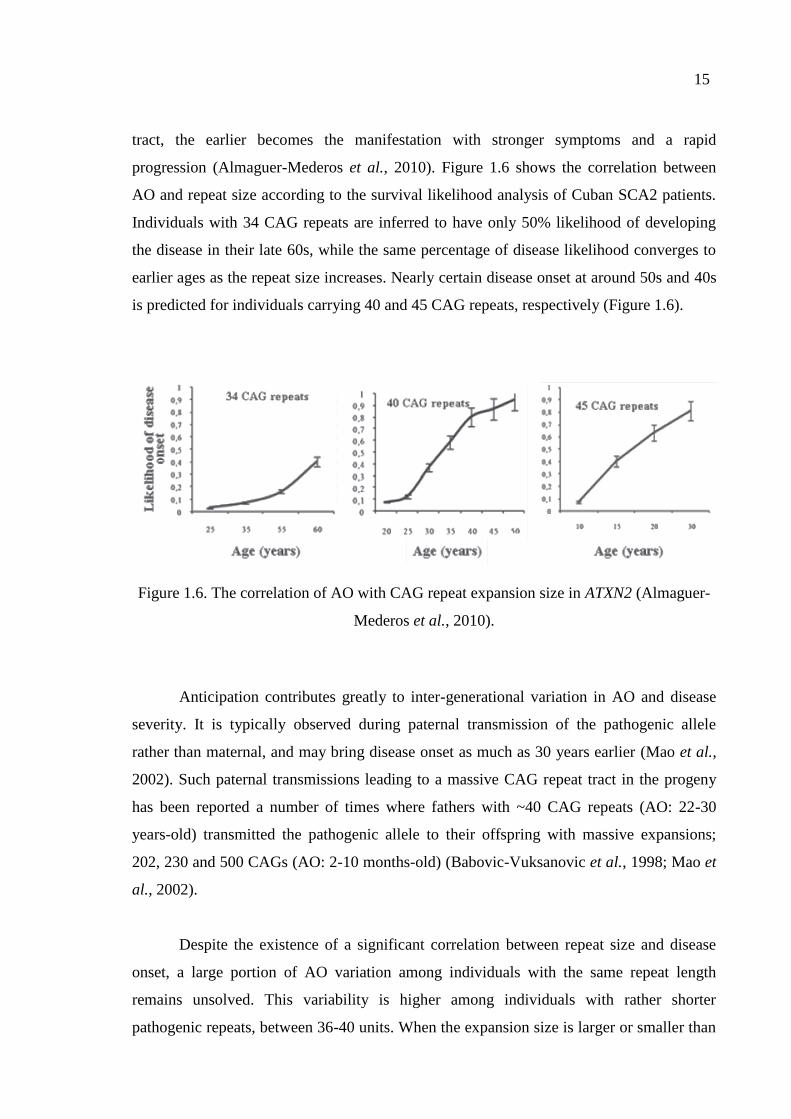
progression (Almaguer-Mederos et al., 2010). Figure 1.6 shows the correlation between
AO and repeat size according to the survival likelihood analysis of Cuban SCA2 patients.
Individuals with 34 CAG repeats are inferred to have only 50% likelihood of developing
the disease in their late 60s, while the same percentage of disease likelihood converges to
earlier ages as the repeat size increases. Nearly certain disease onset at around 50s and 40s
is predicted for individuals carrying 40 and 45 CAG repeats, respectively (Figure 1.6).
Figure 1.6. The correlation of AO with CAG repeat expansion size in ATXN2 (Almaguer-
Mederos et al., 2010).
Anticipation contributes greatly to inter-generational variation in AO and disease
severity. It is typically observed during paternal transmission of the pathogenic allele
rather than maternal, and may bring disease onset as much as 30 years earlier (Mao et al.,
2002). Such paternal transmissions leading to a massive CAG repeat tract in the progeny
has been reported a number of times where fathers with ~40 CAG repeats (AO: 22-30
years-old) transmitted the pathogenic allele to their offspring with massive expansions;
202, 230 and 500 CAGs (AO: 2-10 months-old) (Babovic-Vuksanovic et al., 1998; Mao et
al., 2002).
Despite the existence of a significant correlation between repeat size and disease
onset, a large portion of AO variation among individuals with the same repeat length
remains unsolved. This variability is higher among individuals with rather shorter
pathogenic repeats, between 36-40 units. When the expansion size is larger or smaller than
16
this interval, the variation among individuals decreases, and the disease shows similar
manifestations by means of AO and symptoms. Repeat sizes of 33 and 34 consistently
result in manifestation at >60 years of age, and 45 repeats almost always show an AO of
<20 years-old, whereas, in the case of 37 repeats, distinct ages of onset as different as 20
and 60 years-old is observed (Cancel et al., 1997; Geschwind et al., 1997; Moretti et al.,
2004; Pulst et al., 1996; Riess et al., 1997).
The correlation between AO and the repeat size of an individual is a complex issue,
and is under the influence of other modifying genetic, epigenetic and environmental
factors. The first line of evidence regarding AO variability was that homozygosity for the
CAG repeat in ATXN2 gene is not a modifier of AO (Sanpei et al., 1996). Conversely,
another study reported a severe disease with an earlier AO in homozygous SCA2 patients
(Ragothaman and Muthane, 2008; Spadafora et al., 2007). The potential modifying effect
of a genetic polymorphism in other poly-Q domain carrying genes was investigated with
the initial hypothesis that poly-Q proteins are known to interact with each other and co-
localize at the intracellular inclusion bodies. A correlation between the AO variation and
the presence of a large (CAG)n allele of RAI1 (retinoic-acid induced 1), which functions in
neuronal differentiation during early development, was demonstrated in 4.1% of the
previously unexplained AO variation cases (Hayes et al., 2000). Similarly, the presence of
long normal alleles of the CACNA1A gene, also a CAG repeat containing gene, the full
expansion of which is known to cause the SCA6 phenotype, is proposed to decrease AO of
SCA2 patients and explain 5.8% of the AO variation. CACNA1A is argued to be a good
candidate modifier of AO in SCA2, since it is localized in the cytoplasm where ataxin-2 is
present, unlike other poly-Q proteins that are mostly found in the nucleus, and is not only
highly expressed in the Purkinje cells, but also is an important factor for their firing
activity (Pulst et al., 1996).
In addition to genetic modifiers, epigenetic modifications around the ATXN2 locus
are also implicated in ataxin-2 toxicity and AO variation in SCA2 patients. The promoter
of the ATXN2 gene is located in exon 1 and contains a CpG rich segment without a TATA
box (Aguiar et al., 1999). Both hyper- and hypomethylation states were observed in the
promoter of ATXN2 gene in SCA2 patients, and none of the patients showed a full-
methylation pattern at all CpG sites. The hypermethylation state in ATXN2 promoter is
17
associated with the expanded pathogenic allele, which may be an outcome of the cells’
effort to reduce ATXN2 expression and expansion-mediated toxicity (Laffita-Mesa et al.,
2012). Allele specific de novo hypermethylation of the ATXN2 promoter is reported to
result in a delayed AO and a milder disease phenotype (Bauer et al., 2004).
Hypomethylation of this locus, on the other hand, contributed to intrafamilial anticipation
of the disease, without a variation in CAG repeat number between two generations
(Laffita-Mesa et al., 2012).
1.4.1. Ataxin-2 Function and Mechanisms of Pathogenicity
Ataxin-2 is a ~140 kDa cytoplasmic protein composed of 1312 amino acids when
carrying a normal poly-Q allele with 22 CAG repeats (Imbert et al., 1996). High levels of
ataxin-2 protein in Purkinje cells and substantia nigra was observed by immunostaining
studies. The intensity of the staining showed an increase with age in expansion-free
individuals, whilst SCA2 patients exhibited an already higher intensity initially, compared
to healthy individuals (Huynh et al., 1999). Ataxin-2 expression has also been observed in
other regions of the brain, such as pyramidal neurons of the hippocampus and amygdaloid
neurons of the basal ganglia, where ATXN2 mRNA was also detected via qPCR analyses
(Nechiporuk et al., 1998). Even though cytoplasmic micro-aggregates were present in
patient cerebella, no inclusion bodies were evident in the nucleus, in contrast to other poly-
Q disorders. Within the cell, ataxin-2 shows a rather diffuse distribution in the cytoplasm
with a tendency to co-localize with the intracellular membranes, such as Golgi apparatus
and ER (Lastres-Becker et al., 2008b).
Except for its poly-Q domain, ataxin-2 shows no major homology with other
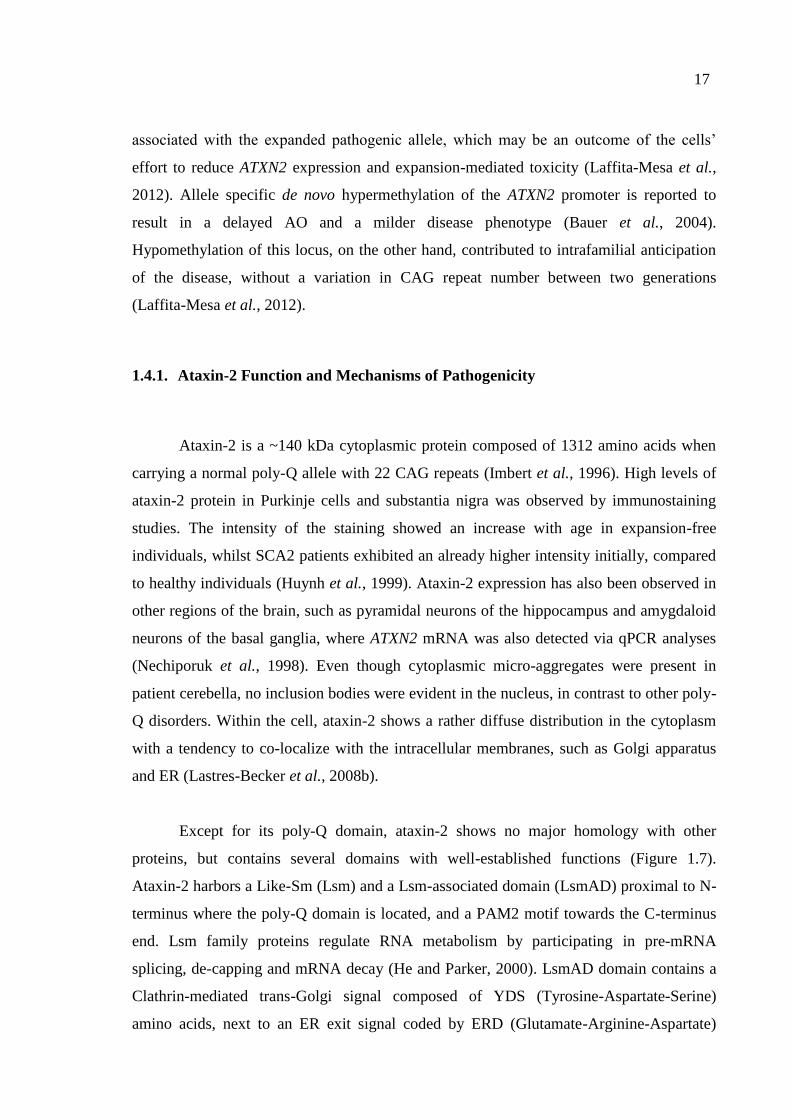
proteins, but contains several domains with well-established functions (Figure 1.7).
Ataxin-2 harbors a Like-Sm (Lsm) and a Lsm-associated domain (LsmAD) proximal to N-
terminus where the poly-Q domain is located, and a PAM2 motif towards the C-terminus
end. Lsm family proteins regulate RNA metabolism by participating in pre-mRNA
splicing, de-capping and mRNA decay (He and Parker, 2000). LsmAD domain contains a
Clathrin-mediated trans-Golgi signal composed of YDS (Tyrosine-Aspartate-Serine)
amino acids, next to an ER exit signal coded by ERD (Glutamate-Arginine-Aspartate)
18
amino acids (Albrecht et al., 2004). These two signals are important for the co-localization
of ataxin-2 to the Golgi apparatus, and their deletion results in altered subcellular
localization. Expansions in the poly-Q domain also lead to impaired ataxin-2 localization
in vitro, disrupting the morphology of the Golgi complex (Huynh et al., 2003). PAM2
motif covers a segment of 18 amino acids and is shared among various proteins, most of
which are involved in RNA metabolism ranging from synthesis to degradation. PAM2 is
one of the two known Poly(A)-Binding Protein (PABP)-interacting motifs and recognizes
the C-terminal PABC domain of PABP (Albrecht and Lengauer, 2004).
Figure 1.7. Known functional domains of ataxin-2 protein (Albrecht et al., 2004).
Ataxin-2 has direct and indirect mRNA binding features, both of which lead to its
association with the poly-ribosome complex (a.k.a. polysome). The direct interaction
occurs through the Lsm/LsmAD domain, whereas the interaction of PAM2 motif with
PABP, docked onto the poly(A)-tails of mRNAs, is the basis of indirect binding. Deletion
of one domain, or the other, does not lead to complete dissociation ataxin-2 from polysome
complex, suggesting that these two domains mediate polysome assembly independent from
each other (Satterfield and Pallanck, 2006). With the establishment of polysome assembly,
ataxin-2 stabilizes the target mRNAs and regulates their translation. Interaction of ataxin-2
with poly(A) nuclease enzyme in the presence of PABP is necessary to prevent over-
trimming of the poly(A) tail and maintain the stability of the translation complex (Mangus
et al., 2004). Ataxin-2 is also indirectly involved in tissue specific alternative splicing via
its interaction with ataxin-2-binding-protein 1 (A2BP1 or RBFOX1), whose Fox-1 domain
recognizes a six nucleotide long segment in the alternatively spliced exons (Shibata et al.,
2000).
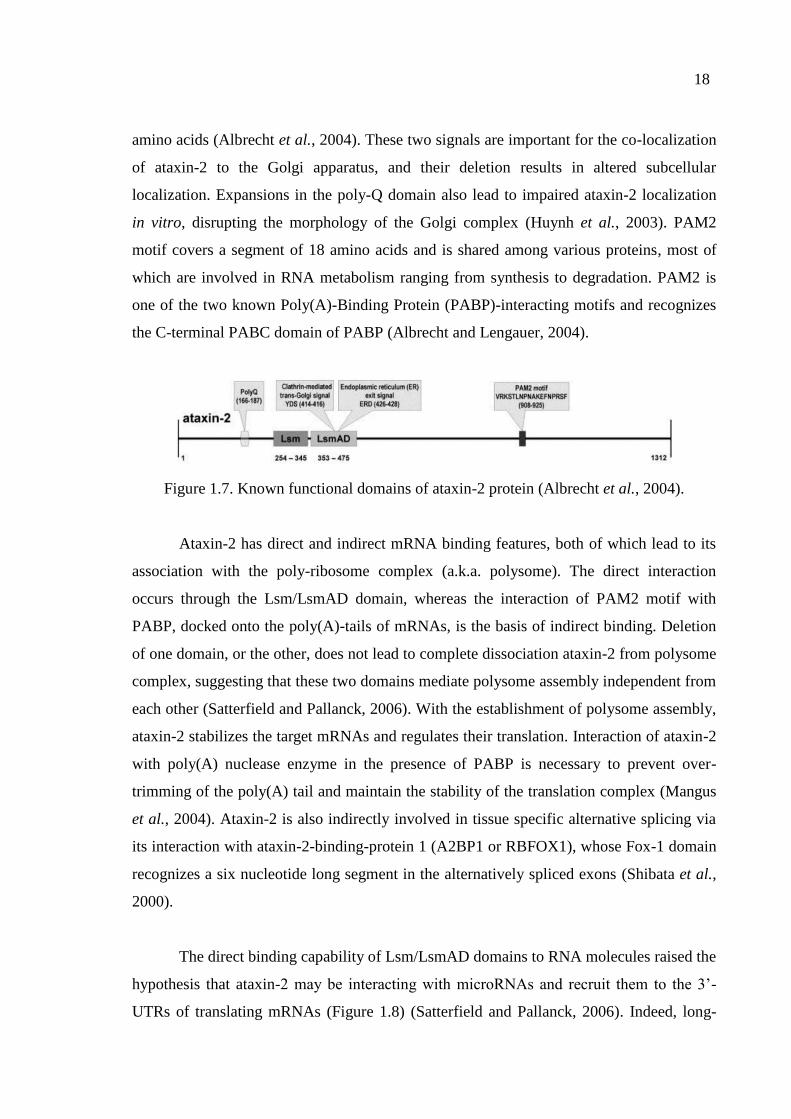
The direct binding capability of Lsm/LsmAD domains to RNA molecules raised the
hypothesis that ataxin-2 may be interacting with microRNAs and recruit them to the 3’-
UTRs of translating mRNAs (Figure 1.8) (Satterfield and Pallanck, 2006). Indeed, long-
19
term olfactory habituation in Drosophila was later proven to be regulated by Atx2-
microRNA complex-mediated translational regulation of certain targets. The previously
reported interaction of Atx2 with Me31B family of DEAD box helicases, which are linked
to the RISC complex subunit Argonaute, is suggested to be the mode of Atx2 involvement
in microRNA-mediated translational regulation. Moreover, Atx2 is shown to co-localize
with the translational repressor complex Me31B/RCK/Dhh1p at the stress granules, further
strengthening this hypothesis (McCann et al., 2011).
Figure 1.8. Recruitment of microRNAs to the 3’-UTRs of target mRNAs mediated by the
interaction between ataxin-2 and PABP (Satterfield and Pallanck, 2006).
Ataxin-2 not only controls their assembly, but also is an important component of
the stress granules, which are cytoplasmic clusters of translationally repressed mRNAs and
their accompanying RNA-binding proteins (RNPs), densely packed until stress conditions
disappear. Through its localization at the stress granules, ataxin-2 interacts with many
other RNA stabilizing or destabilizing proteins, such as TDP-43, FUS and Profilin-1,
mutations in which are mainly associated with ALS (Elden et al., 2010; Farg et al., 2013;
Figley et al., 2014). Such interactions have a modifying impact on disease pathogenesis,
since the dissociation of stress granules becomes troublesome when one of these proteins
bear a mutation and many other essential proteins and mRNAs remain sequestered in the
insoluble aggregates (Figure 1.9) (explained in Section 1.4.2).
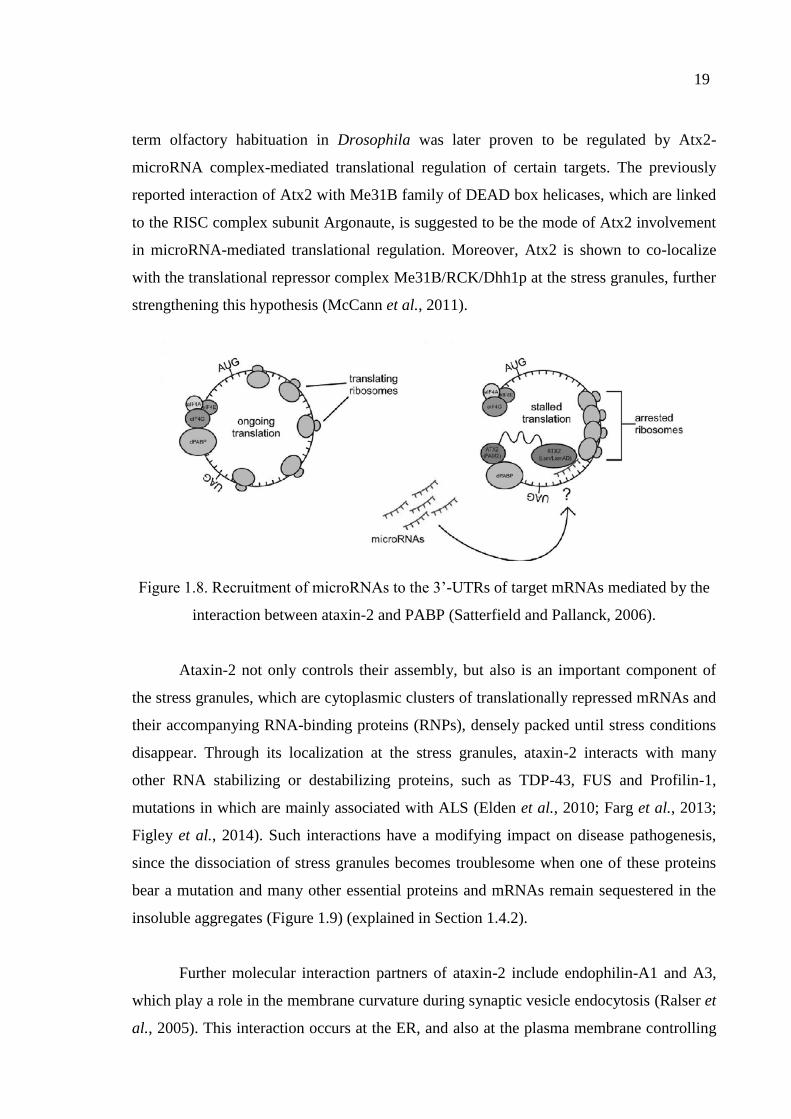
Further molecular interaction partners of ataxin-2 include endophilin-A1 and A3,
which play a role in the membrane curvature during synaptic vesicle endocytosis (Ralser et
al., 2005). This interaction occurs at the ER, and also at the plasma membrane controlling
20
the endocytic cycling of the epidermal-growth factor receptor (Figure 1.9) (Nonis et al.,
2008). Only the expanded form of ataxin-2 interacts with the C-terminus of InsP3R1 on the
ER membrane, sensitizing it for activation and causing an over-release of intracellular Ca2+
stores (Figure 1.9) (Liu et al., 2009). Only the normal form of ataxin-2, on the other hand,
regulates the susceptibility of neuroblastoma cells to apoptotic signals, hence take on a
tumor suppressor activity (Wiedemeyer et al., 2003). An indirect interaction of ataxin-2
with the actin filaments through intermediate factors have been shown to regulate filament
formation and stability in a dosage-sensitive manner depending on ataxin-2 concentration
(Satterfield et al., 2002).
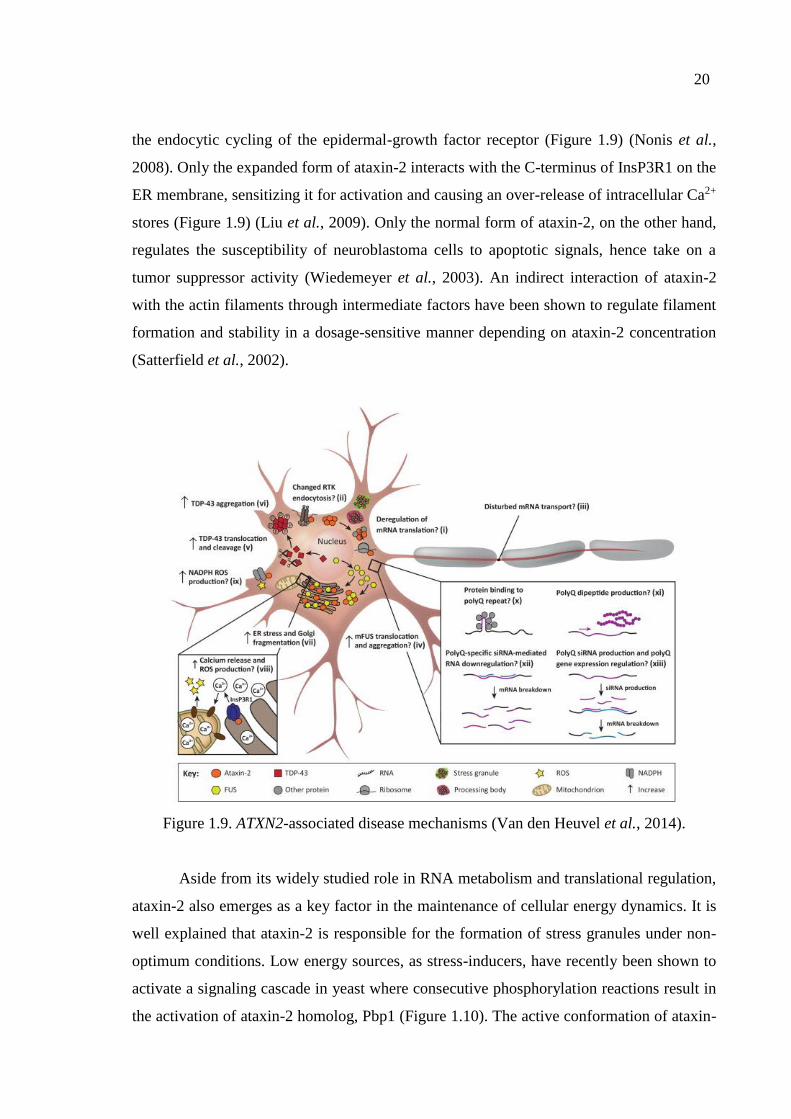
Figure 1.9. ATXN2-associated disease mechanisms (Van den Heuvel et al., 2014).
Aside from its widely studied role in RNA metabolism and translational regulation,
ataxin-2 also emerges as a key factor in the maintenance of cellular energy dynamics. It is
well explained that ataxin-2 is responsible for the formation of stress granules under non-
optimum conditions. Low energy sources, as stress-inducers, have recently been shown to
activate a signaling cascade in yeast where consecutive phosphorylation reactions result in
the activation of ataxin-2 homolog, Pbp1 (Figure 1.10). The active conformation of ataxin-
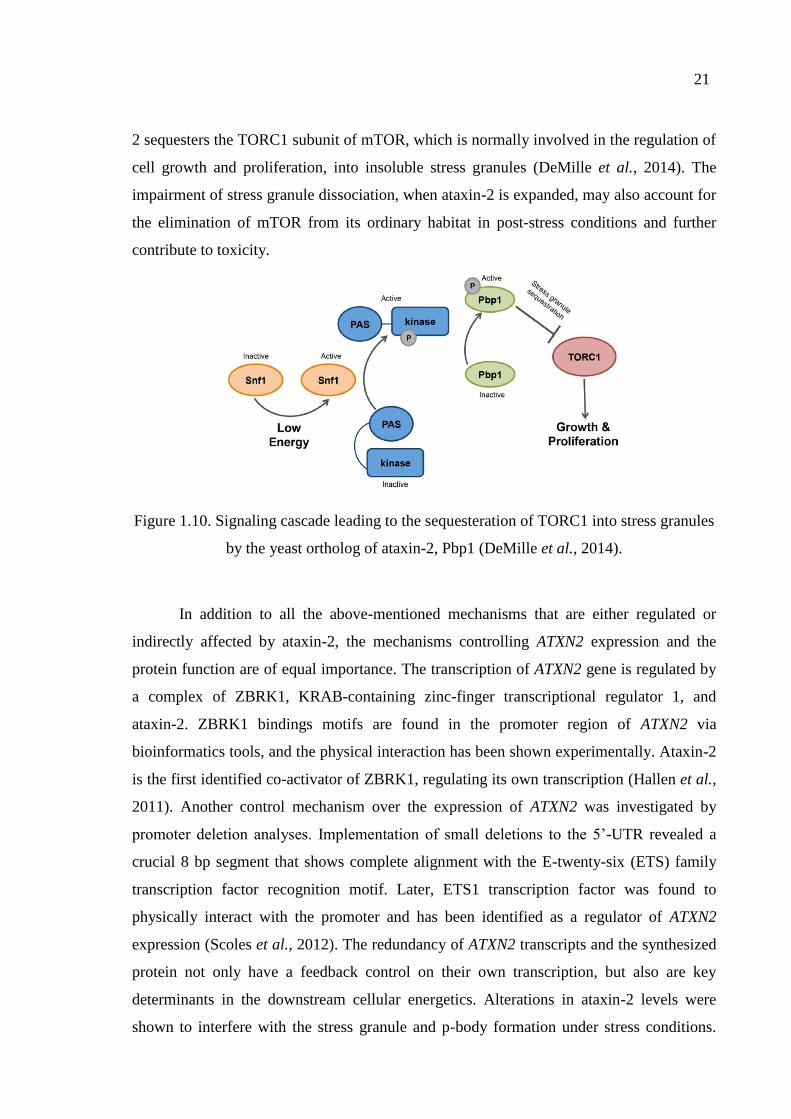
21
2 sequesters the TORC1 subunit of mTOR, which is normally involved in the regulation of
cell growth and proliferation, into insoluble stress granules (DeMille et al., 2014). The
impairment of stress granule dissociation, when ataxin-2 is expanded, may also account for
the elimination of mTOR from its ordinary habitat in post-stress conditions and further
contribute to toxicity.
Figure 1.10. Signaling cascade leading to the sequesteration of TORC1 into stress granules
by the yeast ortholog of ataxin-2, Pbp1 (DeMille et al., 2014).
In addition to all the above-mentioned mechanisms that are either regulated or
indirectly affected by ataxin-2, the mechanisms controlling ATXN2 expression and the
protein function are of equal importance. The transcription of ATXN2 gene is regulated by
a complex of ZBRK1, KRAB-containing zinc-finger transcriptional regulator 1, and
ataxin-2. ZBRK1 bindings motifs are found in the promoter region of ATXN2 via
bioinformatics tools, and the physical interaction has been shown experimentally. Ataxin-2
is the first identified co-activator of ZBRK1, regulating its own transcription (Hallen et al.,
2011). Another control mechanism over the expression of ATXN2 was investigated by
promoter deletion analyses. Implementation of small deletions to the 5’-UTR revealed a
crucial 8 bp segment that shows complete alignment with the E-twenty-six (ETS) family
transcription factor recognition motif. Later, ETS1 transcription factor was found to
physically interact with the promoter and has been identified as a regulator of ATXN2
expression (Scoles et al., 2012). The redundancy of ATXN2 transcripts and the synthesized
protein not only have a feedback control on their own transcription, but also are key
determinants in the downstream cellular energetics. Alterations in ataxin-2 levels were
shown to interfere with the stress granule and p-body formation under stress conditions.
22
Moreover, the concentration of PABP is also linked to ataxin-2 levels, further explaining
the impact of unsteady ataxin-2 concentrations on the assembly of stress granules and
translational control (Nonhoff et al., 2007).
The turnover of the long-lived or expanded ataxin-2 is primarily mediated by UPS,
as long as the insoluble aggregates do not require elimination by autophagosomes. Two
ubiquitin ligases up to now have been identified to interact with ataxin-2: parkin and
FBXW8. Parkin, product of the PARK2 gene, is an E3 ubiquitin ligase, mutations in which
are known to cause autosomal recessive juvenile Parkinson’s disease (Kitada et al., 1998).
Parkin was shown to interact with the N-terminus of both normal and expanded ataxin-2
and mediate its ubiquitination. However, the finding of altered expression levels of
FBXW8, another E3 ubiquitin ligase, in the cerebellum transcriptome analysis of SCA2
mouse model, led to further in vivo and in vitro characterization studies of this association.
FBXW8 was shown to co-localize with ataxin-2 and parkin, but only FBXW8 expression
levels were affected by expanded ataxin-2 in patient fibroblasts and blood samples,
although both E3 ligases were sequestered into cytoplasmic aggregates. This exclusive
effect of expanded ataxin-2 on only FBXW8 levels suggest parkin to be a secondary player
in the degradation process of ataxin-2 (Halbach et al., 2015).
1.4.2. Implication of ATXN2 in Other Neurodegenerative Disorders
An interaction network for the 54 human proteins involved in 23 inherited ataxias
was generated making use of the yeast 2-hybrid system. Eighteen of the 23 ataxia genes
showed interaction either directly or indirectly. In this network, ataxin-2 was shown to
have a direct and strong interaction with ataxin-1, the causative protein for SCA1 (Lim et
al., 2006). Further studies investigated the relationship between these two proteins and
revealed that ataxin-2 could physically interact with ataxin-1 and was a contributor to
expanded ataxin-1 toxicity, which was mediated by sequestration of ataxin-2 into
intranuclear aggregates (Al-Ramahi et al., 2007). Dysregulations in ATXN2 level also acted
as a modifier of disease onset and severity in SCA3 (Lessing and Bonini, 2008).
Furthermore, hypermethylation of the ATXN2 promoter contributed to an earlier AO by up
to eight years, and also to increased severity in SCA3 patients (Laffita-Mesa et al., 2012).
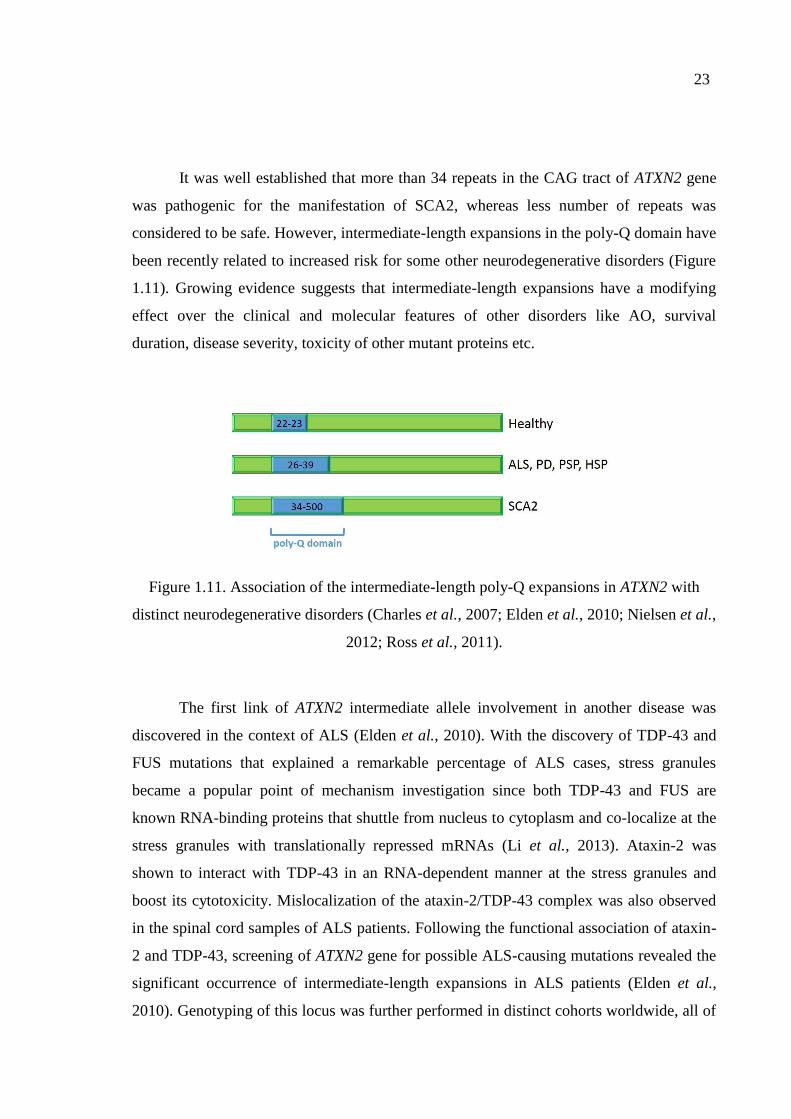
23
It was well established that more than 34 repeats in the CAG tract of ATXN2 gene
was pathogenic for the manifestation of SCA2, whereas less number of repeats was
considered to be safe. However, intermediate-length expansions in the poly-Q domain have
been recently related to increased risk for some other neurodegenerative disorders (Figure
1.11). Growing evidence suggests that intermediate-length expansions have a modifying
effect over the clinical and molecular features of other disorders like AO, survival
duration, disease severity, toxicity of other mutant proteins etc.
Figure 1.11. Association of the intermediate-length poly-Q expansions in ATXN2 with
distinct neurodegenerative disorders (Charles et al., 2007; Elden et al., 2010; Nielsen et al.,
2012; Ross et al., 2011).
The first link of ATXN2 intermediate allele involvement in another disease was
discovered in the context of ALS (Elden et al., 2010). With the discovery of TDP-43 and
FUS mutations that explained a remarkable percentage of ALS cases, stress granules
became a popular point of mechanism investigation since both TDP-43 and FUS are
known RNA-binding proteins that shuttle from nucleus to cytoplasm and co-localize at the
stress granules with translationally repressed mRNAs (Li et al., 2013). Ataxin-2 was
shown to interact with TDP-43 in an RNA-dependent manner at the stress granules and
boost its cytotoxicity. Mislocalization of the ataxin-2/TDP-43 complex was also observed
in the spinal cord samples of ALS patients. Following the functional association of ataxin-
2 and TDP-43, screening of ATXN2 gene for possible ALS-causing mutations revealed the
significant occurrence of intermediate-length expansions in ALS patients (Elden et al.,
2010). Genotyping of this locus was further performed in distinct cohorts worldwide, all of
24
which confirmed ATXN2 intermediate allele as a risk factor for ALS, as well as exposing a
modifier effect on survival (Chiò et al., 2015; Elden et al., 2010; Lahut et al., 2012; Lee et
al., 2011; Liu et al., 2013). The cut-off values defining the “intermediate-length” interval,
however, showed variation among different cohorts. In depth sequence analysis of ATXN2
showed that intermediate alleles contributing to ALS pathogenesis are mostly interrupted
by CAA repeats, and the number of interrupting units has an impact on AO (Yu et al.,
2011). The intermediate-length expansions in the ATXN2 gene are found to be significantly
enriched in C9orf72 GGGGCC hexanucleotide repeat expansion, currently the most
frequent genetic cause of both familial and sporadic forms of ALS, carriers (Renton et al.,
2014; van Blitterswijk et al., 2014).
A similar scenario as TDP-43 also applies to FUS; ataxin-2 is shown to modify
FUS toxicity and they are found to co-localize in the motor neuron samples of ALS
patients (Farg et al., 2013). An interaction between ataxin-2 and yet another stress granule
component Profilin-1, which is also an ALS-causing gene, was again displayed in various
disease models (Figley et al., 2014). Mutations in all above-mentioned ALS genes have
been shown to alter stress granule dynamics and mediate cell death, and the toxicity they
provoke is shown to be modified by ataxin-2 owing to their co-localization. Ataxin-2 is
believed to exhibit its modifier effect through (i) rendering the dissociation of stress
granules impossible in post-stress conditions, (ii) activating stress-induced caspases, and
(iii) enhancing modifications over other stress granule components.
Stress granules are formed under stringent conditions to pause the dispensable
metabolic activities and relieve the burden of the cells. Ataxin-2, as previously explained,
is involved in the assembly of stress granules, as well as their disassembly when stress
disappears. Intermediate-length expansions in ataxin-2 destroys the dissolving ability of
stress granules, capturing TDP-43 and FUS in the cytoplasmic aggregates preventing their
translocation back to the nucleus. Accumulation mediated by intermediate-length ataxin-2
was observed to enhance the activation of stress-induced caspases, which lead to
pathological TDP-43 modifications such as hyper-phosphorylation and cleavage (Hart and
Gitler, 2012). Golgi fragmentation induced by ataxin-2/FUS double mutation also leads to
the activation of the caspase pathway (Figure 1.9) (Farg et al., 2013). Lastly, components
of the stress granules are exposed to many enzymes capable of performing post-
25
translational modifications, such as proteases, kinases and ubiquitin-modifying enzymes.
This increases the chance of a stress granule component of being subjected to a
pathological modification that would further lead to alterations in cellular dynamics (Li et
al., 2013).
ATXN2 expansions are also pronounced in levodopa-responsive parkinsonism
syndromes (Furtado et al., 2002). Observation of anticipation phenomenon in some
pedigrees with familial parkinsonism raised the possibility of a repeat expansion
involvement in the pathogenesis. Segregation of the expanded allele with the neurological
signs in a family suggested that ATXN2 expansions could be the cause of at least a set of
familial parkinsonisms (Payami et al., 2003). A subsequent study further confirmed the
presence of CAA-interrupted ATXN2 expansions in autosomal dominant levodopa-
responsive parkinsonism patients, although the associated repeat range was detected to be
slightly higher than that of ALS, between 37-39. Two of the patients investigated in this
study, also bearing a mutation in the known parkinsonism gene LRRK2, interestingly
showed an earlier disease onset (Charles et al., 2007). Modifier effect of ATXN2
intermediate-expansions on the onset of different NDs is also evidenced in a Danish
hereditary spastic paraplegia (HSP) cohort. Although the frequency of intermediate ATXN2
expansions did not differ between patients and controls, this expansion significantly
lowered the AO among HSP patients (Nielsen et al., 2012). On the other hand, a strong
risk association was established between the ATXN2 expansion and progressive
supranuclear palsy (PSP). Repeat lengths of 30 or more were significantly enriched in PSP
patients and hypothesized to contribute to disease development. Even though expansions
were detected in FTD, AD and PD patients, no significant frequency difference was found
compared to controls (Ross et al., 2011).
Some interesting clinical cases with the manifestation of psychiatric symptoms
alongside SCA2 also exist. It is a common feature of ND patients to develop psychotic
behavior during the disease course, both due to the degeneration of the respective brain
regions and the general depression of the patient. An interesting case with the onset of
paranoid type schizophrenia at the age of 22 is reported to manifest SCA2 nearly ten years
afterwards (Rottnek et al., 2008). SNP association analyses were performed in an
26
independent study to assess the risk of ATXN2 variations on schizophrenia susceptibility. A
non-synonymous SNP, that is predicted to increase the stability of the ataxin-2 protein, was
found to be significantly associated with schizophrenia (Zhang et al., 2014).
1.5. Biomarkers of SCA2
SCA2 is a monogenic disease, and there exists a definite way of assessing the
disease risk for an individual by simply genotyping the CAG tract of the ATXN2 gene.
Hence, biomarker studies regarding SCA2 are more targeted to clinical signs and mostly
inspects the progression of the disease from a neuro-physiological approach. The status of
nerve conduction abnormalities in the sensory and motor system are proposed to be
progression markers of SCA2. Reduction of sensory amplitudes is the earliest observation,
even present in pre-symptomatic individuals. Subsequent increase in sensory latency
followed by motor nerve involvement divides the clinical progression into three phases
(Velázquez-Perez et al., 2010). Metabolite concentration screening in the cerebellum and
pons of SCA2 patients may also be utilized as a marker of cellular dynamics. Low levels of
neurometabolites N-acetylaspartate and glutamate, and high levels of glial markers and
energetic metabolites myoinositol and creatine, are correlated with disease severity,
suggesting an effort employed by the cells to compensate damage. Neuro- and energetic
metabolite imaging therefore may be a way to monitor neural metabolism at the affected
regions and are argued to be good candidates for the evaluation of applied treatments
(Adanyeguh et al., 2015).
The only molecular biomarker study for SCA2 so far examines the plasma
proteome of ten SCA2 patients compared to age- and sex-matched controls. Authors
performed 2D-difference in-gel electrophoresis to detect differentially expressed spots by
1.5-fold, following which LC-MS/MS and Western blot analysis revealed the identity of
these proteins and validated the expression change. Nine differentially expressed proteins
associated with cognitive impairment (RBP4, TTR), oxidative stress (albumin), calcium-
dependent apoptosis (VDCC gamma-3 subunit) and neuropathy (Apo-AI, Apo-E) were

27
acquired consistent with the previously explained potential mechanisms of pathology
contributing to the disease (Swarup et al., 2013).
28
2. PURPOSE
Due to its autosomal dominant nature, SCA2 generally affects multiple individuals
per family, and it may show anticipation between generations with earlier disease onset
and faster progression. Although levodopa replacement or deep brain stimulation may
alleviate the symptoms in a subset of patients, there is no treatment directly targeting the
cause of the disease yet.
The development of effective therapies is only possible with the complete
understanding of the causative factor and the precise dissection of the different pathogenic
stages. Although ataxin-2 is known to be involved in several different mechanisms, such as
transcriptional control, ribosomal translation and stress granule formation, its exact role in
the complex network of cellular pathways is yet to be discovered. Identification of a
therapeutic target and development of a potent treatment for SCA2, therefore, would only
be possible upon complete exploration of both native ataxin-2 function and the basis of
expansion-induced pathogenesis. Accordingly, the major aims of this thesis are:
Examining the downstream effects of ATXN2 deficiency in order to elucidate the
native function of the protein
Examining the downstream effects of ATXN2 expansions in order to understand the
expansion-induced pathogenesis
Identifying biomarker candidates for both loss- and gain-of ataxin-2 function
Developing blood biomarkers of SCA2 that would demonstrate the molecular
pathology related to a specific stage of the disease
We believe that unravelling the native ataxin-2 function and the expansion-induced
pathogenesis at different stages of the disease would eventually lead to the identification of
suitable molecular targets for cause-targeted therapies.
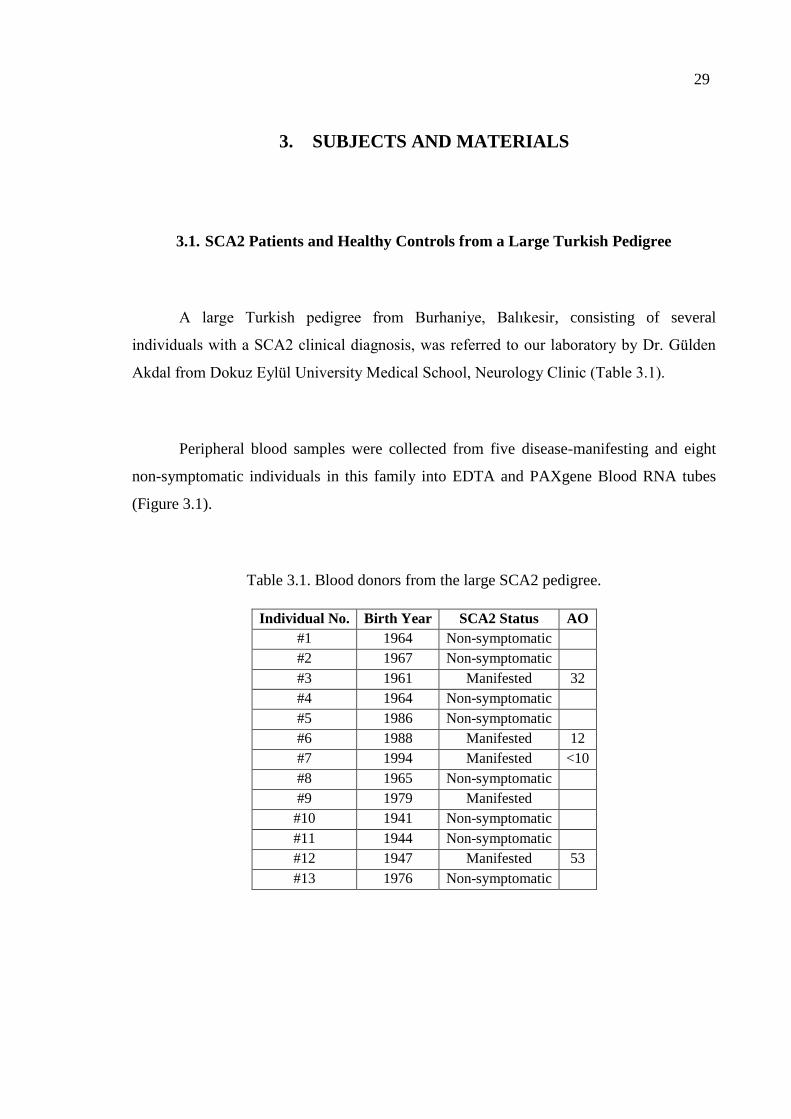
29
3. SUBJECTS AND MATERIALS
3.1. SCA2 Patients and Healthy Controls from a Large Turkish Pedigree
A large Turkish pedigree from Burhaniye, Balıkesir, consisting of several
individuals with a SCA2 clinical diagnosis, was referred to our laboratory by Dr. Gülden
Akdal from Dokuz Eylül University Medical School, Neurology Clinic (Table 3.1).
Peripheral blood samples were collected from five disease-manifesting and eight
non-symptomatic individuals in this family into EDTA and PAXgene Blood RNA tubes
(Figure 3.1).
Table 3.1. Blood donors from the large SCA2 pedigree.
Individual No. Birth Year SCA2 Status AO
#1 1964 Non-symptomatic
#2 1967 Non-symptomatic
#3 1961 Manifested 32
#4 1964 Non-symptomatic
#5 1986 Non-symptomatic
#6 1988 Manifested 12
#7 1994 Manifested <10
#8 1965 Non-symptomatic
#9 1979 Manifested
#10 1941 Non-symptomatic
#11 1944 Non-symptomatic
#12 1947 Manifested 53
#13 1976 Non-symptomatic
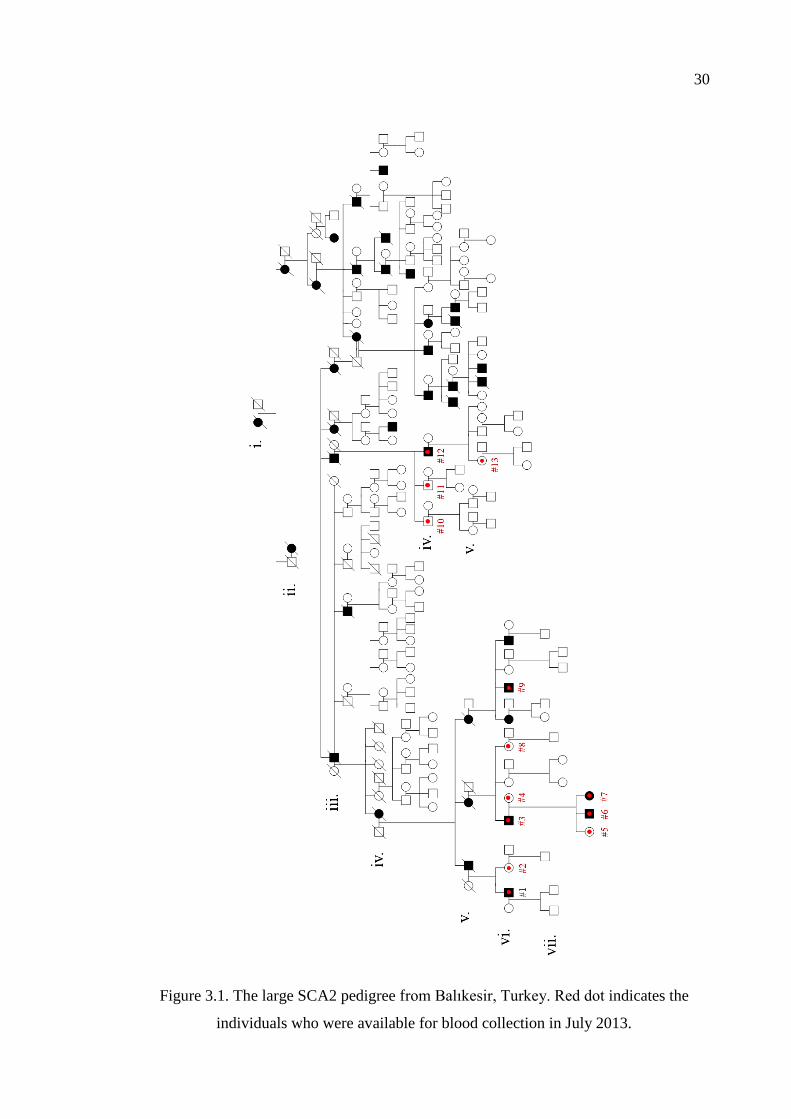
30
Figure 3.1. The large SCA2 pedigree from Balıkesir, Turkey. Red dot indicates the
individuals who were available for blood collection in July 2013.
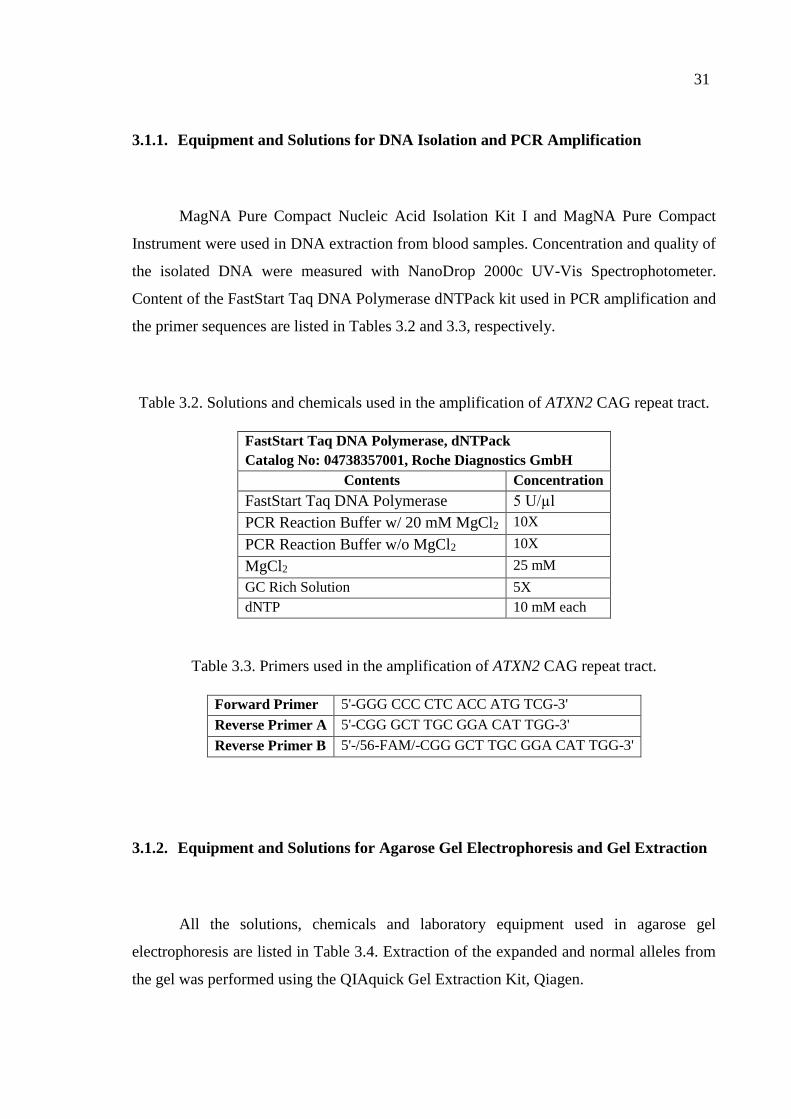
31
3.1.1. Equipment and Solutions for DNA Isolation and PCR Amplification
MagNA Pure Compact Nucleic Acid Isolation Kit I and MagNA Pure Compact
Instrument were used in DNA extraction from blood samples. Concentration and quality of
the isolated DNA were measured with NanoDrop 2000c UV-Vis Spectrophotometer.
Content of the FastStart Taq DNA Polymerase dNTPack kit used in PCR amplification and
the primer sequences are listed in Tables 3.2 and 3.3, respectively.
Table 3.2. Solutions and chemicals used in the amplification of ATXN2 CAG repeat tract.
FastStart Taq DNA Polymerase, dNTPack
Catalog No: 04738357001, Roche Diagnostics GmbH
Contents Concentration
FastStart Taq DNA Polymerase 5 U/µl
PCR Reaction Buffer w/ 20 mM MgCl2 10X
PCR Reaction Buffer w/o MgCl2 10X
MgCl2 25 mM
GC Rich Solution 5X
dNTP 10 mM each
Table 3.3. Primers used in the amplification of ATXN2 CAG repeat tract.
Forward Primer 5'-GGG CCC CTC ACC ATG TCG-3'
Reverse Primer A 5'-CGG GCT TGC GGA CAT TGG-3'
Reverse Primer B 5'-/56-FAM/-CGG GCT TGC GGA CAT TGG-3'
3.1.2. Equipment and Solutions for Agarose Gel Electrophoresis and Gel Extraction
All the solutions, chemicals and laboratory equipment used in agarose gel
electrophoresis are listed in Table 3.4. Extraction of the expanded and normal alleles from
the gel was performed using the QIAquick Gel Extraction Kit, Qiagen.
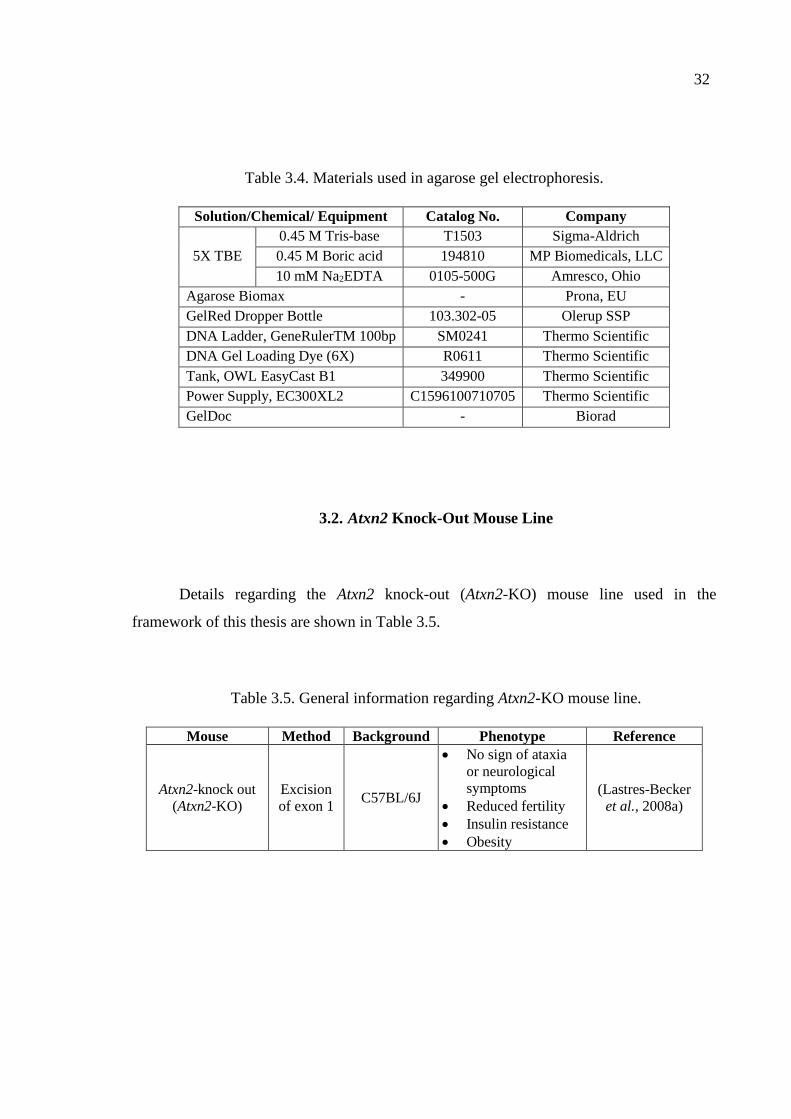
32
Table 3.4. Materials used in agarose gel electrophoresis.
Solution/Chemical/ Equipment Catalog No. Company
5X TBE
0.45 M Tris-base T1503 Sigma-Aldrich
0.45 M Boric acid 194810 MP Biomedicals, LLC
10 mM Na2EDTA 0105-500G Amresco, Ohio
Agarose Biomax - Prona, EU
GelRed Dropper Bottle 103.302-05 Olerup SSP
DNA Ladder, GeneRulerTM 100bp SM0241 Thermo Scientific
DNA Gel Loading Dye (6X) R0611 Thermo Scientific
Tank, OWL EasyCast B1 349900 Thermo Scientific
Power Supply, EC300XL2 C1596100710705 Thermo Scientific
GelDoc - Biorad
3.2. Atxn2 Knock-Out Mouse Line
Details regarding the Atxn2 knock-out (Atxn2-KO) mouse line used in the
framework of this thesis are shown in Table 3.5.
Table 3.5. General information regarding Atxn2-KO mouse line.
Mouse Method Background Phenotype Reference
Atxn2-knock out
(Atxn2-KO)
Excision
of exon 1 C57BL/6J
No sign of ataxia
or neurological
symptoms
Reduced fertility
Insulin resistance
Obesity
(Lastres-Becker
et al., 2008a)
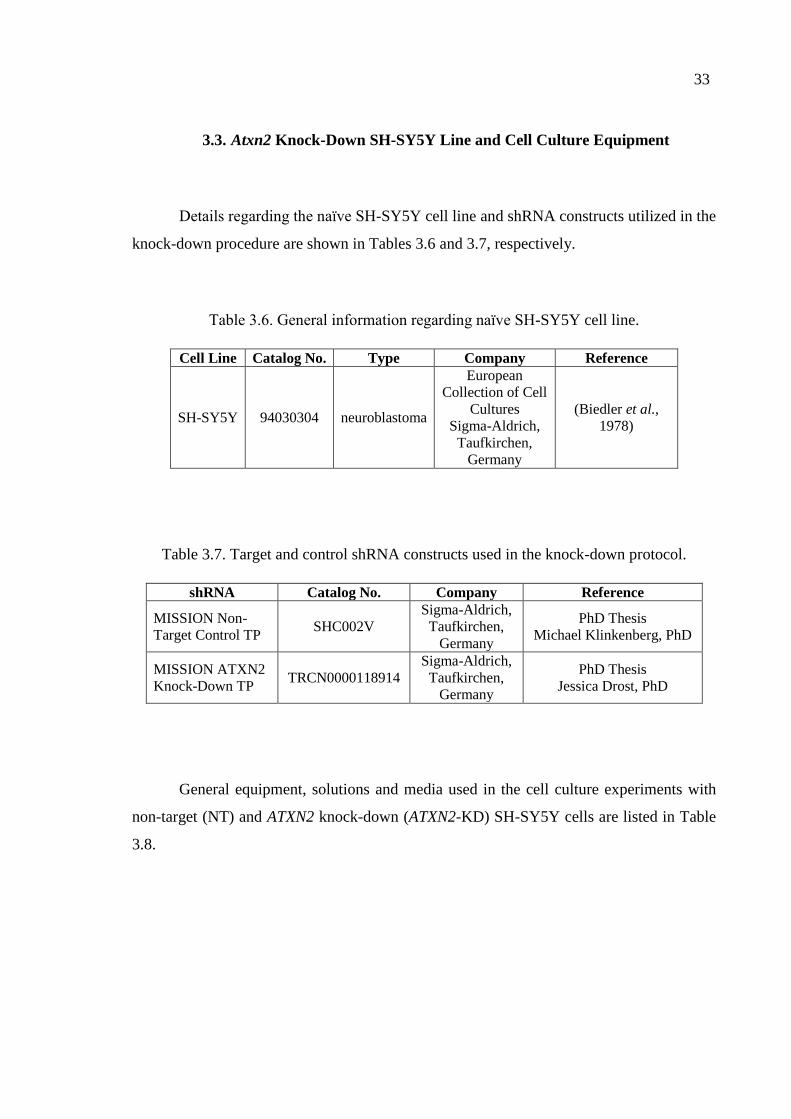
33
3.3. Atxn2 Knock-Down SH-SY5Y Line and Cell Culture Equipment
Details regarding the naïve SH-SY5Y cell line and shRNA constructs utilized in the
knock-down procedure are shown in Tables 3.6 and 3.7, respectively.
Table 3.6. General information regarding naïve SH-SY5Y cell line.
Cell Line Catalog No. Type Company Reference
SH-SY5Y 94030304 neuroblastoma
European
Collection of Cell
Cultures
Sigma-Aldrich,
Taufkirchen,
Germany
(Biedler et al.,
1978)
Table 3.7. Target and control shRNA constructs used in the knock-down protocol.
shRNA Catalog No. Company Reference
MISSION Non-
Target Control TP SHC002V
Sigma-Aldrich,
Taufkirchen,
Germany
PhD Thesis
Michael Klinkenberg, PhD
MISSION ATXN2
Knock-Down TP TRCN0000118914
Sigma-Aldrich,
Taufkirchen,
Germany
PhD Thesis
Jessica Drost, PhD
General equipment, solutions and media used in the cell culture experiments with
non-target (NT) and ATXN2 knock-down (ATXN2-KD) SH-SY5Y cells are listed in Table
3.8.
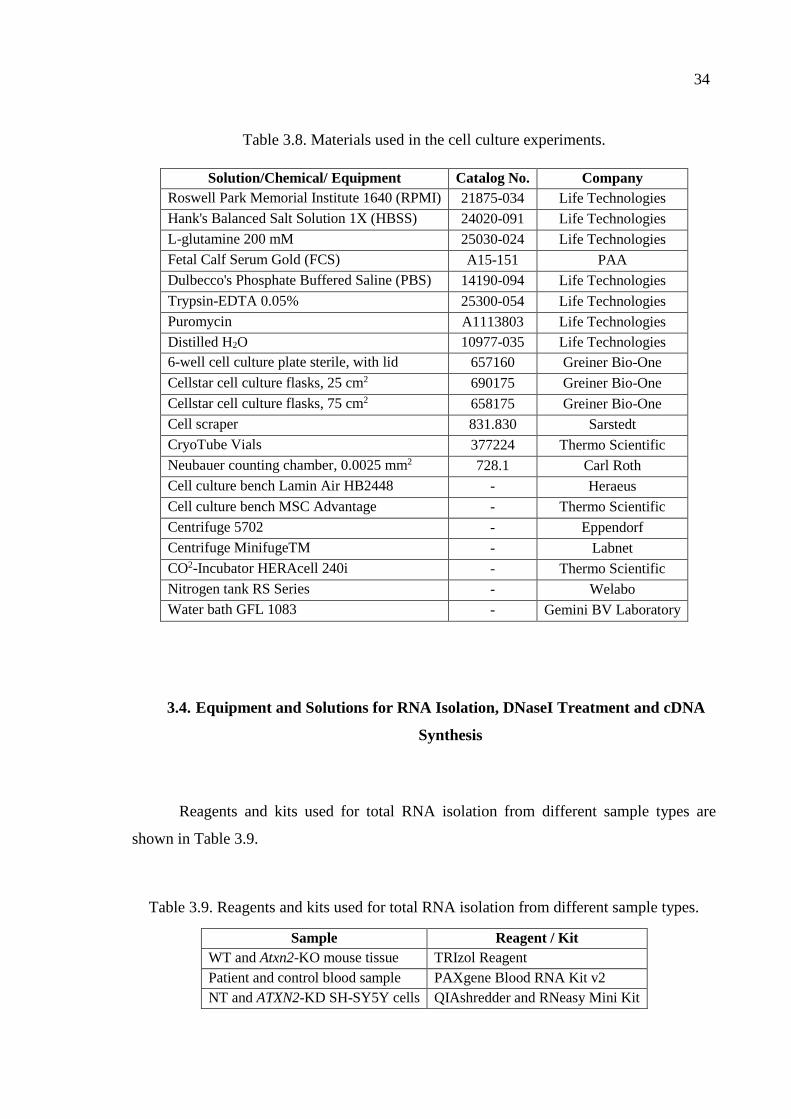
34
Table 3.8. Materials used in the cell culture experiments.
Solution/Chemical/ Equipment Catalog No. Company
Roswell Park Memorial Institute 1640 (RPMI) 21875-034 Life Technologies
Hank's Balanced Salt Solution 1X (HBSS) 24020-091 Life Technologies
L-glutamine 200 mM 25030-024 Life Technologies
Fetal Calf Serum Gold (FCS) A15-151 PAA
Dulbecco's Phosphate Buffered Saline (PBS) 14190-094 Life Technologies
Trypsin-EDTA 0.05% 25300-054 Life Technologies
Puromycin A1113803 Life Technologies
Distilled H2O 10977-035 Life Technologies
6-well cell culture plate sterile, with lid 657160 Greiner Bio-One
Cellstar cell culture flasks, 25 cm2 690175 Greiner Bio-One
Cellstar cell culture flasks, 75 cm2 658175 Greiner Bio-One
Cell scraper 831.830 Sarstedt
CryoTube Vials 377224 Thermo Scientific
Neubauer counting chamber, 0.0025 mm2 728.1 Carl Roth
Cell culture bench Lamin Air HB2448 - Heraeus
Cell culture bench MSC Advantage - Thermo Scientific
Centrifuge 5702 - Eppendorf
Centrifuge MinifugeTM - Labnet
CO2-Incubator HERAcell 240i - Thermo Scientific
Nitrogen tank RS Series - Welabo
Water bath GFL 1083 - Gemini BV Laboratory
3.4. Equipment and Solutions for RNA Isolation, DNaseI Treatment and cDNA
Synthesis
Reagents and kits used for total RNA isolation from different sample types are
shown in Table 3.9.
Table 3.9. Reagents and kits used for total RNA isolation from different sample types.
Sample Reagent / Kit
WT and Atxn2-KO mouse tissue TRIzol Reagent
Patient and control blood sample PAXgene Blood RNA Kit v2
NT and ATXN2-KD SH-SY5Y cells QIAshredder and RNeasy Mini Kit

35
Solutions and enzymes used in DNaseI treatment of the isolated total RNA and
reverse transcription into cDNA are listed in Table 3.10.
Table 3.10. Contents of the kits used in DNaseI treatment and reverse transcription of
the isolated total RNA.
DNaseI Amplification Grade, Catalog No: 18068-015, Invitrogen
DNaseI Reaction Buffer 10X
DNaseI Amplification Grade 100 U
EDTA 25 mM
Oligo(dT)20 Primer, Catalog No: 18418-020, Invitrogen
Oligo(dT)20 Primer 50 µM
dNTP 10 mM each
Random Primers, Catalog No: 48190-011, Invitrogen
Random Primer 300 µg
SuperScript III Reverse Transcriptase, Catalog No: 18080-044, Invitrogen
SuperScript III Reverse Transcriptase 200 U/µl
First Strand Buffer 5X
DTT 0.1 M
3.5. qRT-PCR Equipment and Taqman Assays
General laboratory equipment and solutions used in gene expression analysis via
qRT-PCR are listed in Table 3.11.
Table 3.11. Materials used in Taqman gene expression assays.
Solution/Chemical/ Equipment Catalog No. Company
Taqman Probes - Applied Biosystems
FastStart Universal Probe Master 4914058001 Roche Diagnostics GmbH
MicroAmp Fast Optical
96-well Reaction Plate 4346906 Applied Biosystems
MicroAmp Optical Adhesive Film 4311971 Applied Biosystems
StepOnePlus Real-Time PCR System
Thermal Cycling Block 272006429 Applied Biosystems
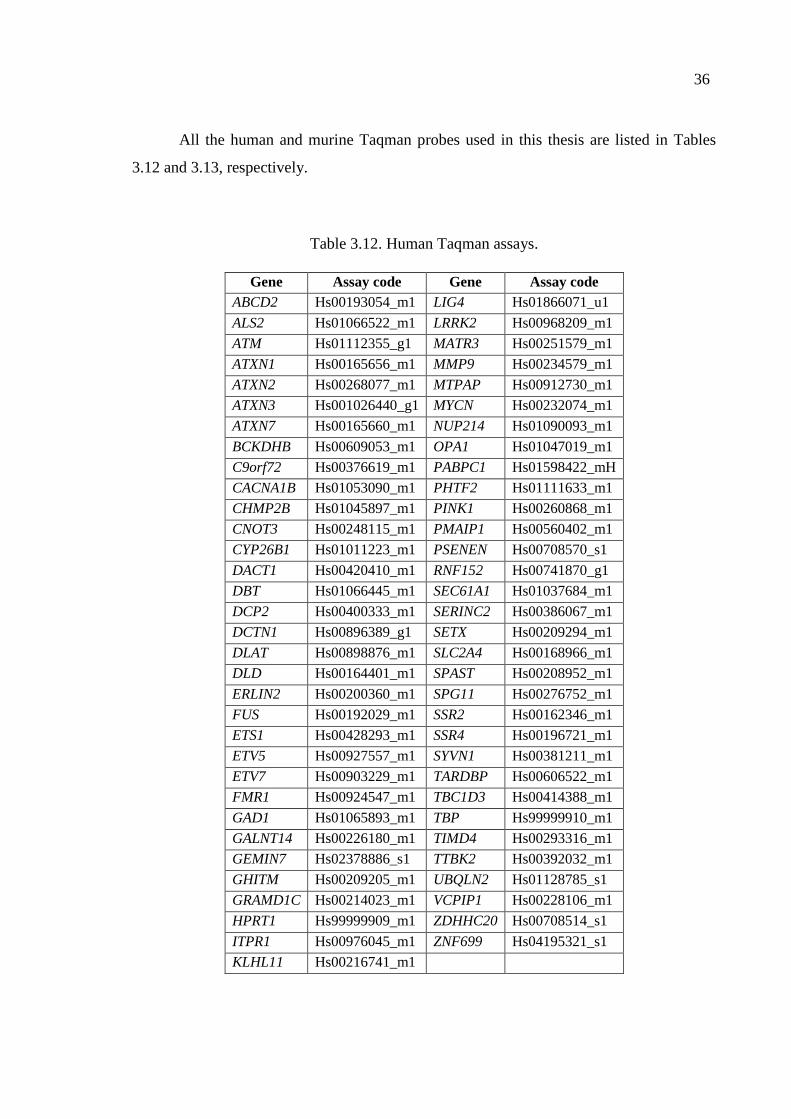
36
All the human and murine Taqman probes used in this thesis are listed in Tables
3.12 and 3.13, respectively.
Table 3.12. Human Taqman assays.
Gene Assay code Gene Assay code
ABCD2 Hs00193054_m1 LIG4 Hs01866071_u1
ALS2 Hs01066522_m1 LRRK2 Hs00968209_m1
ATM Hs01112355_g1 MATR3 Hs00251579_m1
ATXN1 Hs00165656_m1 MMP9 Hs00234579_m1
ATXN2 Hs00268077_m1 MTPAP Hs00912730_m1
ATXN3 Hs001026440_g1 MYCN Hs00232074_m1
ATXN7 Hs00165660_m1 NUP214 Hs01090093_m1
BCKDHB Hs00609053_m1 OPA1 Hs01047019_m1
C9orf72 Hs00376619_m1 PABPC1 Hs01598422_mH
CACNA1B Hs01053090_m1 PHTF2 Hs01111633_m1
CHMP2B Hs01045897_m1 PINK1 Hs00260868_m1
CNOT3 Hs00248115_m1 PMAIP1 Hs00560402_m1
CYP26B1 Hs01011223_m1 PSENEN Hs00708570_s1
DACT1 Hs00420410_m1 RNF152 Hs00741870_g1
DBT Hs01066445_m1 SEC61A1 Hs01037684_m1
DCP2 Hs00400333_m1 SERINC2 Hs00386067_m1
DCTN1 Hs00896389_g1 SETX Hs00209294_m1
DLAT Hs00898876_m1 SLC2A4 Hs00168966_m1
DLD Hs00164401_m1 SPAST Hs00208952_m1
ERLIN2 Hs00200360_m1 SPG11 Hs00276752_m1
FUS Hs00192029_m1 SSR2 Hs00162346_m1
ETS1 Hs00428293_m1 SSR4 Hs00196721_m1
ETV5 Hs00927557_m1 SYVN1 Hs00381211_m1
ETV7 Hs00903229_m1 TARDBP Hs00606522_m1
FMR1 Hs00924547_m1 TBC1D3 Hs00414388_m1
GAD1 Hs01065893_m1 TBP Hs99999910_m1
GALNT14 Hs00226180_m1 TIMD4 Hs00293316_m1
GEMIN7 Hs02378886_s1 TTBK2 Hs00392032_m1
GHITM Hs00209205_m1 UBQLN2 Hs01128785_s1
GRAMD1C Hs00214023_m1 VCPIP1 Hs00228106_m1
HPRT1 Hs99999909_m1 ZDHHC20 Hs00708514_s1
ITPR1 Hs00976045_m1 ZNF699 Hs04195321_s1
KLHL11 Hs00216741_m1
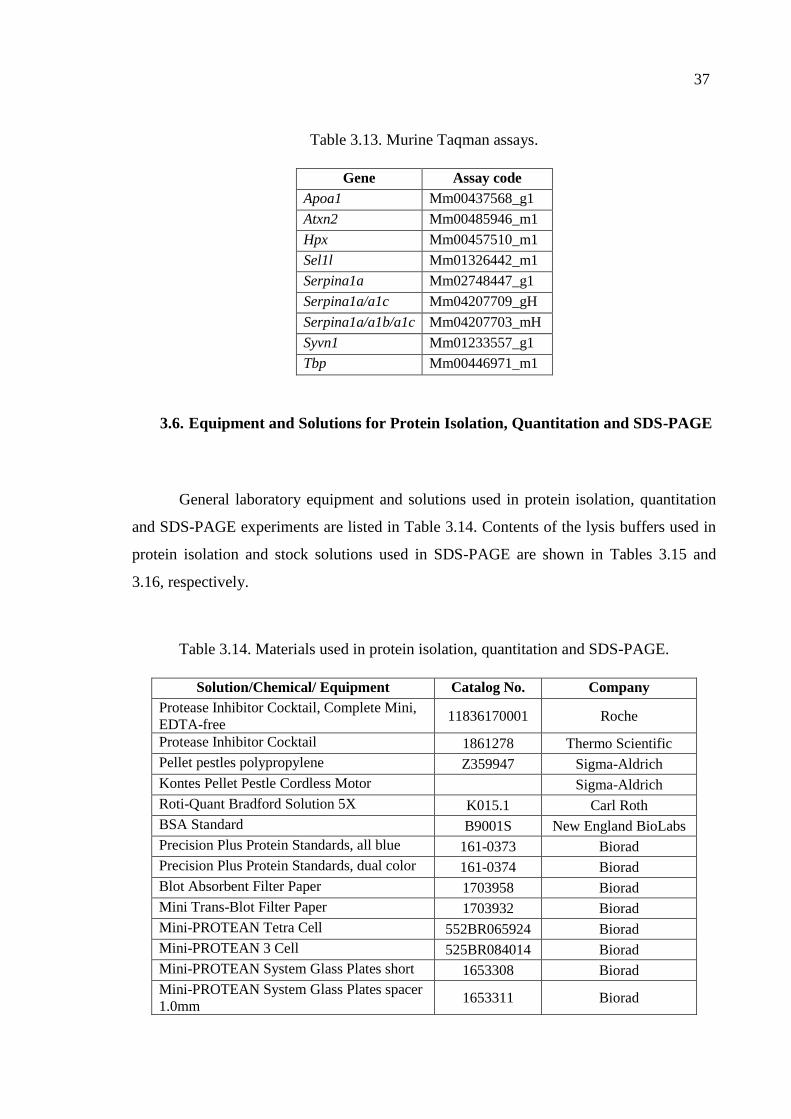
37
Table 3.13. Murine Taqman assays.
Gene Assay code
Apoa1 Mm00437568_g1
Atxn2 Mm00485946_m1
Hpx Mm00457510_m1
Sel1l Mm01326442_m1
Serpina1a Mm02748447_g1
Serpina1a/a1c Mm04207709_gH
Serpina1a/a1b/a1c Mm04207703_mH
Syvn1 Mm01233557_g1
Tbp Mm00446971_m1
3.6. Equipment and Solutions for Protein Isolation, Quantitation and SDS-PAGE
General laboratory equipment and solutions used in protein isolation, quantitation
and SDS-PAGE experiments are listed in Table 3.14. Contents of the lysis buffers used in
protein isolation and stock solutions used in SDS-PAGE are shown in Tables 3.15 and
3.16, respectively.
Table 3.14. Materials used in protein isolation, quantitation and SDS-PAGE.
Solution/Chemical/ Equipment Catalog No. Company
Protease Inhibitor Cocktail, Complete Mini,
EDTA-free 11836170001 Roche
Protease Inhibitor Cocktail 1861278 Thermo Scientific
Pellet pestles polypropylene Z359947 Sigma-Aldrich
Kontes Pellet Pestle Cordless Motor Sigma-Aldrich
Roti-Quant Bradford Solution 5X K015.1 Carl Roth
BSA Standard B9001S New England BioLabs
Precision Plus Protein Standards, all blue 161-0373 Biorad
Precision Plus Protein Standards, dual color 161-0374 Biorad
Blot Absorbent Filter Paper 1703958 Biorad
Mini Trans-Blot Filter Paper 1703932 Biorad
Mini-PROTEAN Tetra Cell 552BR065924 Biorad
Mini-PROTEAN 3 Cell 525BR084014 Biorad
Mini-PROTEAN System Glass Plates short 1653308 Biorad
Mini-PROTEAN System Glass Plates spacer
1.0mm 1653311 Biorad
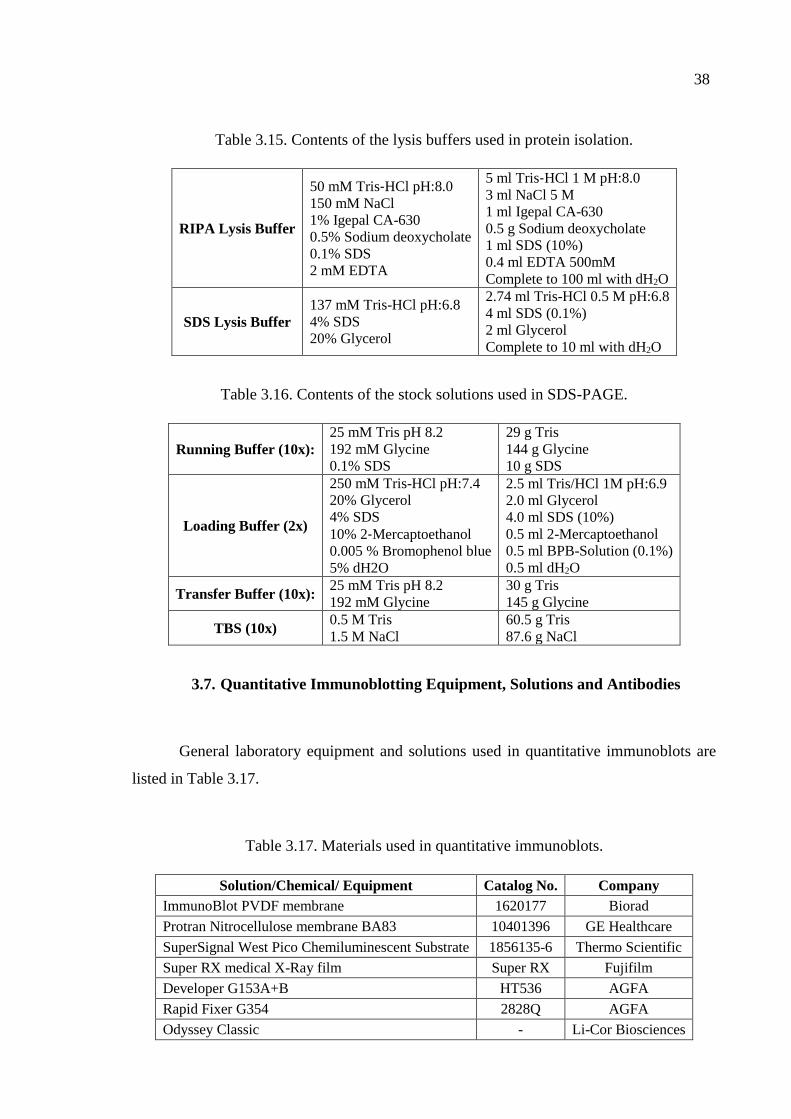
38
Table 3.15. Contents of the lysis buffers used in protein isolation.
RIPA Lysis Buffer
50 mM Tris‐HCl pH:8.0
150 mM NaCl
1% Igepal CA-630
0.5% Sodium deoxycholate
0.1% SDS
2 mM EDTA
5 ml Tris‐HCl 1 M pH:8.0
3 ml NaCl 5 M
1 ml Igepal CA-630
0.5 g Sodium deoxycholate
1 ml SDS (10%)
0.4 ml EDTA 500mM
Complete to 100 ml with dH2O
SDS Lysis Buffer
137 mM Tris-HCl pH:6.8
4% SDS
20% Glycerol
2.74 ml Tris-HCl 0.5 M pH:6.8
4 ml SDS (0.1%)
2 ml Glycerol
Complete to 10 ml with dH2O
Table 3.16. Contents of the stock solutions used in SDS-PAGE.
Running Buffer (10x):
25 mM Tris pH 8.2
192 mM Glycine
0.1% SDS
29 g Tris
144 g Glycine
10 g SDS
Loading Buffer (2x)
250 mM Tris-HCl pH:7.4
20% Glycerol
4% SDS
10% 2‐Mercaptoethanol
0.005 % Bromophenol blue
5% dH2O
2.5 ml Tris/HCl 1M pH:6.9
2.0 ml Glycerol
4.0 ml SDS (10%)
0.5 ml 2-Mercaptoethanol
0.5 ml BPB-Solution (0.1%)
0.5 ml dH2O
Transfer Buffer (10x): 25 mM Tris pH 8.2
192 mM Glycine
30 g Tris
145 g Glycine
TBS (10x) 0.5 M Tris
1.5 M NaCl
60.5 g Tris
87.6 g NaCl
3.7. Quantitative Immunoblotting Equipment, Solutions and Antibodies
General laboratory equipment and solutions used in quantitative immunoblots are
listed in Table 3.17.
Table 3.17. Materials used in quantitative immunoblots.
Solution/Chemical/ Equipment Catalog No. Company
ImmunoBlot PVDF membrane 1620177 Biorad
Protran Nitrocellulose membrane BA83 10401396 GE Healthcare
SuperSignal West Pico Chemiluminescent Substrate 1856135-6 Thermo Scientific
Super RX medical X-Ray film Super RX Fujifilm
Developer G153A+B HT536 AGFA
Rapid Fixer G354 2828Q AGFA
Odyssey Classic - Li-Cor Biosciences
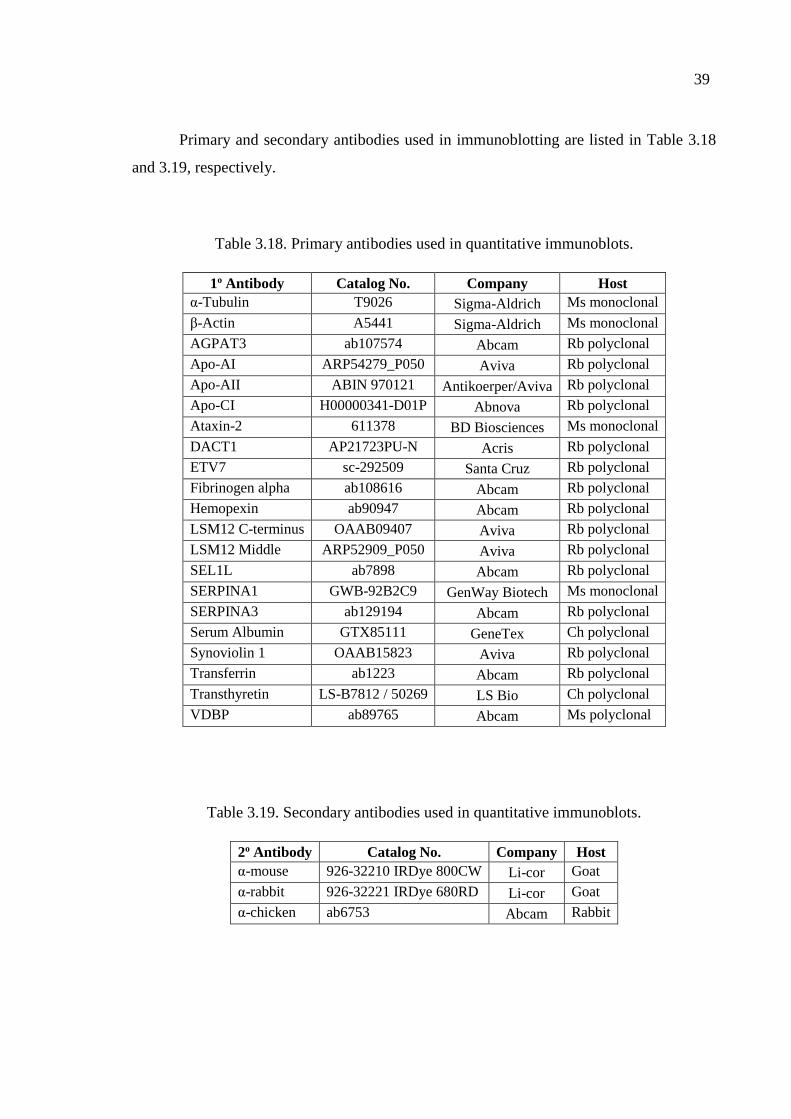
39
Primary and secondary antibodies used in immunoblotting are listed in Table 3.18
and 3.19, respectively.
Table 3.18. Primary antibodies used in quantitative immunoblots.
1o Antibody Catalog No. Company Host
α-Tubulin T9026 Sigma-Aldrich Ms monoclonal
β-Actin A5441 Sigma-Aldrich Ms monoclonal
AGPAT3 ab107574 Abcam Rb polyclonal
Apo-AI ARP54279_P050 Aviva Rb polyclonal
Apo-AII ABIN 970121 Antikoerper/Aviva Rb polyclonal
Apo-CI H00000341-D01P Abnova Rb polyclonal
Ataxin-2 611378 BD Biosciences Ms monoclonal
DACT1 AP21723PU-N Acris Rb polyclonal
ETV7 sc-292509 Santa Cruz Rb polyclonal
Fibrinogen alpha ab108616 Abcam Rb polyclonal
Hemopexin ab90947 Abcam Rb polyclonal
LSM12 C-terminus OAAB09407 Aviva Rb polyclonal
LSM12 Middle ARP52909_P050 Aviva Rb polyclonal
SEL1L ab7898 Abcam Rb polyclonal
SERPINA1 GWB-92B2C9 GenWay Biotech Ms monoclonal
SERPINA3 ab129194 Abcam Rb polyclonal
Serum Albumin GTX85111 GeneTex Ch polyclonal
Synoviolin 1 OAAB15823 Aviva Rb polyclonal
Transferrin ab1223 Abcam Rb polyclonal
Transthyretin LS-B7812 / 50269 LS Bio Ch polyclonal
VDBP ab89765 Abcam Ms polyclonal
Table 3.19. Secondary antibodies used in quantitative immunoblots.
2o Antibody Catalog No. Company Host
α-mouse 926-32210 IRDye 800CW Li-cor Goat
α-rabbit 926-32221 IRDye 680RD Li-cor Goat
α-chicken ab6753 Abcam Rabbit
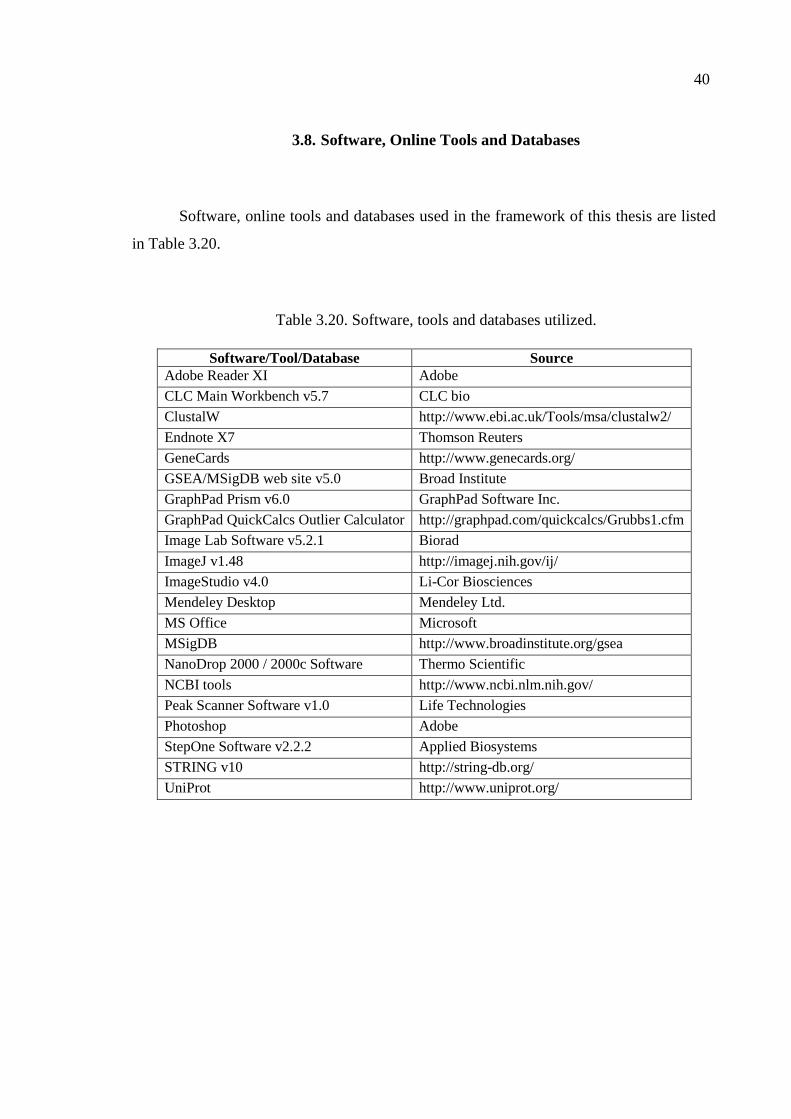
40
3.8. Software, Online Tools and Databases
Software, online tools and databases used in the framework of this thesis are listed
in Table 3.20.
Table 3.20. Software, tools and databases utilized.
Software/Tool/Database Source
Adobe Reader XI Adobe
CLC Main Workbench v5.7 CLC bio
ClustalW http://www.ebi.ac.uk/Tools/msa/clustalw2/
Endnote X7 Thomson Reuters
GeneCards http://www.genecards.org/
GSEA/MSigDB web site v5.0 Broad Institute
GraphPad Prism v6.0 GraphPad Software Inc.
GraphPad QuickCalcs Outlier Calculator http://graphpad.com/quickcalcs/Grubbs1.cfm
Image Lab Software v5.2.1 Biorad
ImageJ v1.48 http://imagej.nih.gov/ij/
ImageStudio v4.0 Li-Cor Biosciences
Mendeley Desktop Mendeley Ltd.
MS Office Microsoft
MSigDB http://www.broadinstitute.org/gsea
NanoDrop 2000 / 2000c Software Thermo Scientific
NCBI tools http://www.ncbi.nlm.nih.gov/
Peak Scanner Software v1.0 Life Technologies
Photoshop Adobe
StepOne Software v2.2.2 Applied Biosystems
STRING v10 http://string-db.org/
UniProt http://www.uniprot.org/
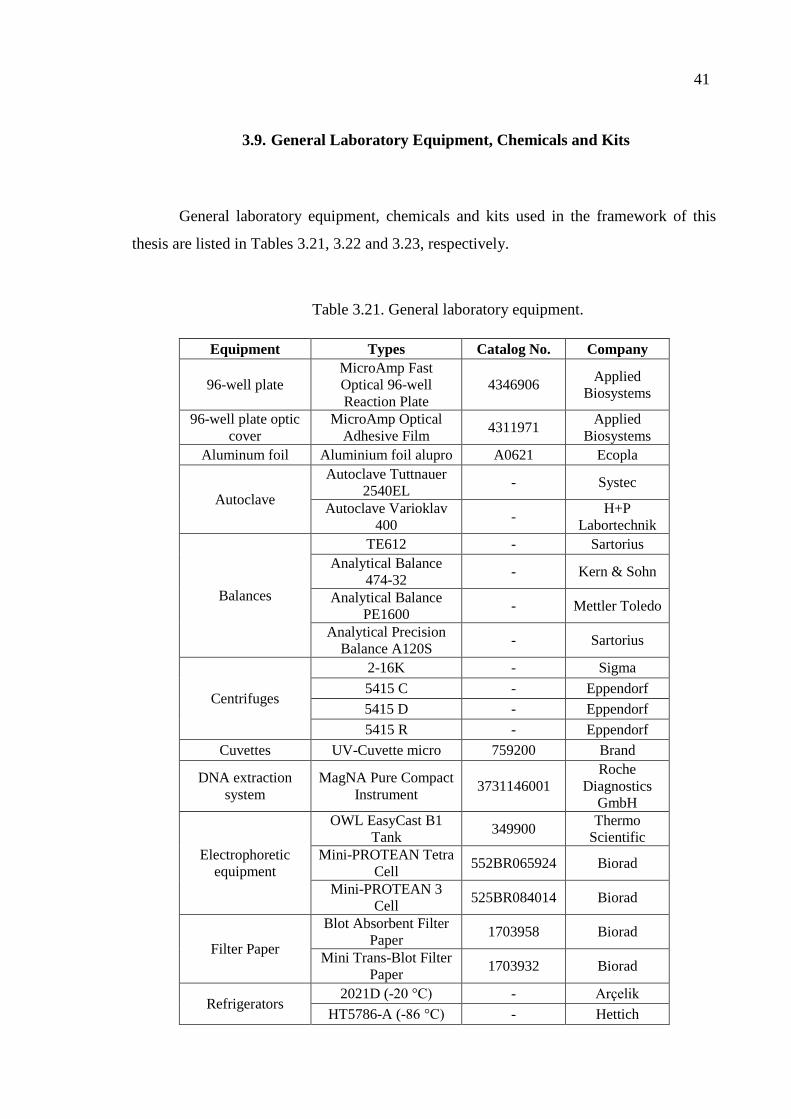
41
3.9. General Laboratory Equipment, Chemicals and Kits
General laboratory equipment, chemicals and kits used in the framework of this
thesis are listed in Tables 3.21, 3.22 and 3.23, respectively.
Table 3.21. General laboratory equipment.
Equipment Types Catalog No. Company
96-well plate
MicroAmp Fast
Optical 96-well
Reaction Plate
4346906 Applied
Biosystems
96-well plate optic
cover
MicroAmp Optical
Adhesive Film 4311971
Applied
Biosystems
Aluminum foil Aluminium foil alupro A0621 Ecopla
Autoclave
Autoclave Tuttnauer
2540EL - Systec
Autoclave Varioklav
400 -
H+P
Labortechnik
Balances
TE612 - Sartorius
Analytical Balance
474-32 - Kern & Sohn
Analytical Balance
PE1600 - Mettler Toledo
Analytical Precision
Balance A120S - Sartorius
Centrifuges
2-16K - Sigma
5415 C - Eppendorf
5415 D - Eppendorf
5415 R - Eppendorf
Cuvettes UV-Cuvette micro 759200 Brand
DNA extraction
system
MagNA Pure Compact
Instrument 3731146001
Roche
Diagnostics
GmbH
Electrophoretic
equipment
OWL EasyCast B1
Tank 349900
Thermo
Scientific
Mini-PROTEAN Tetra
Cell 552BR065924 Biorad
Mini-PROTEAN 3
Cell 525BR084014 Biorad
Filter Paper
Blot Absorbent Filter
Paper 1703958 Biorad
Mini Trans-Blot Filter
Paper 1703932 Biorad
Refrigerators 2021D (-20 °C) - Arçelik
HT5786-A (-86 °C) - Hettich
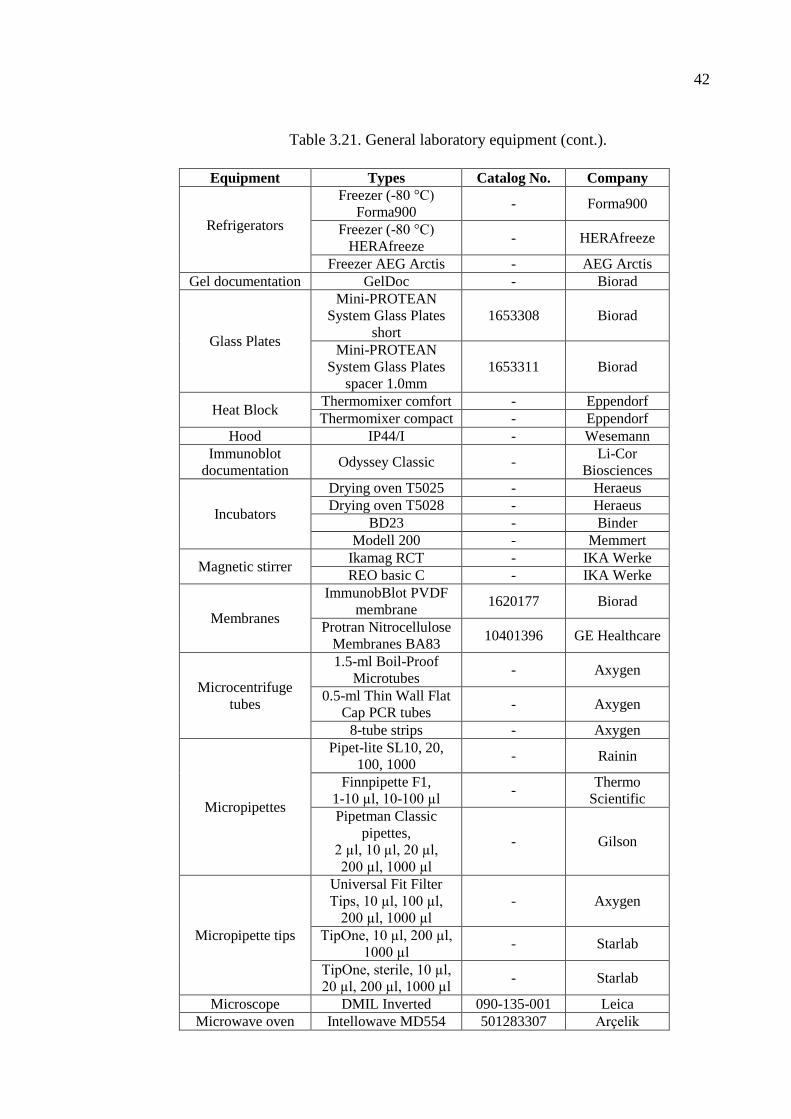
42
Table 3.21. General laboratory equipment (cont.).
Equipment Types Catalog No. Company
Refrigerators
Freezer (-80 °C)
Forma900 - Forma900
Freezer (-80 °C)
HERAfreeze - HERAfreeze
Freezer AEG Arctis - AEG Arctis
Gel documentation GelDoc - Biorad
Glass Plates
Mini-PROTEAN
System Glass Plates
short
1653308 Biorad
Mini-PROTEAN
System Glass Plates
spacer 1.0mm
1653311 Biorad
Heat Block Thermomixer comfort - Eppendorf
Thermomixer compact - Eppendorf
Hood IP44/I - Wesemann
Immunoblot
documentation Odyssey Classic -
Li-Cor
Biosciences
Incubators
Drying oven T5025 - Heraeus
Drying oven T5028 - Heraeus
BD23 - Binder
Modell 200 - Memmert
Magnetic stirrer Ikamag RCT - IKA Werke
REO basic C - IKA Werke
Membranes
ImmunobBlot PVDF
membrane 1620177 Biorad
Protran Nitrocellulose
Membranes BA83 10401396 GE Healthcare
Microcentrifuge
tubes
1.5-ml Boil-Proof
Microtubes - Axygen
0.5-ml Thin Wall Flat
Cap PCR tubes - Axygen
8-tube strips - Axygen
Micropipettes
Pipet-lite SL10, 20,
100, 1000 - Rainin
Finnpipette F1,
1-10 µl, 10-100 µl -
Thermo
Scientific
Pipetman Classic
pipettes,
2 µl, 10 µl, 20 µl,
200 µl, 1000 µl
- Gilson
Micropipette tips
Universal Fit Filter
Tips, 10 µl, 100 µl,
200 µl, 1000 µl
- Axygen
TipOne, 10 µl, 200 µl,
1000 µl - Starlab
TipOne, sterile, 10 µl,
20 µl, 200 µl, 1000 µl - Starlab
Microscope DMIL Inverted 090-135-001 Leica
Microwave oven Intellowave MD554 501283307 Arçelik
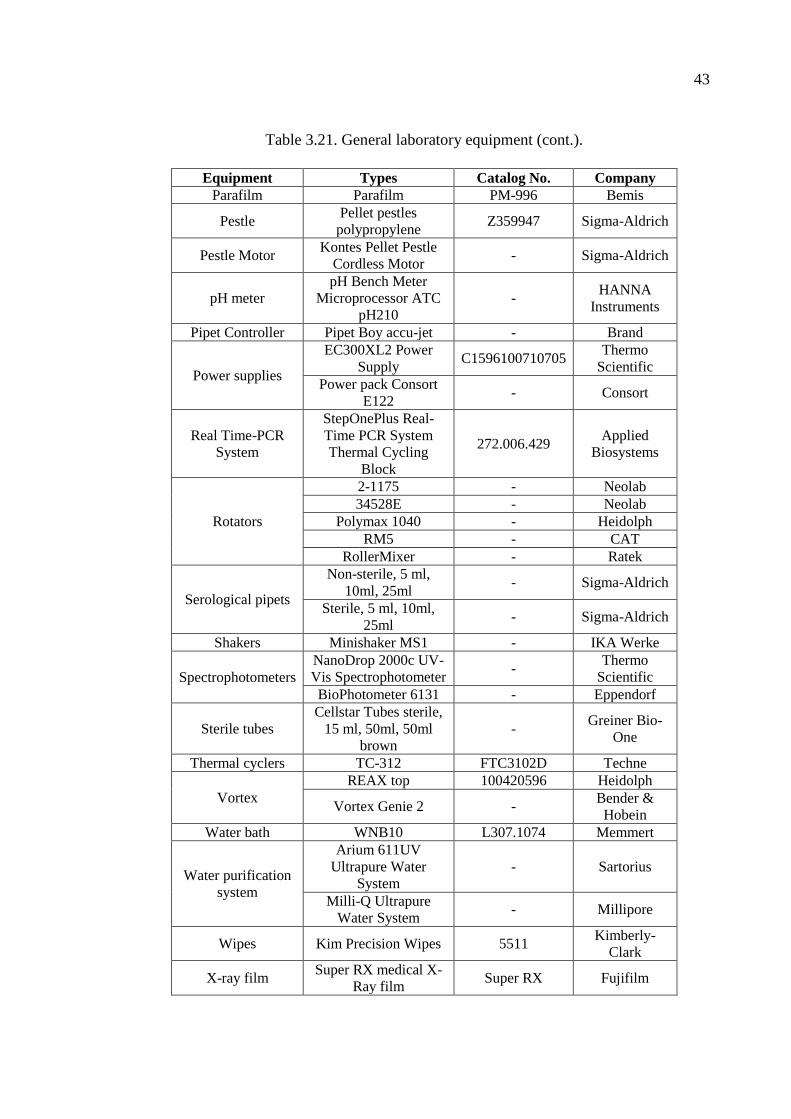
43
Table 3.21. General laboratory equipment (cont.).
Equipment Types Catalog No. Company
Parafilm Parafilm PM-996 Bemis
Pestle Pellet pestles
polypropylene Z359947 Sigma-Aldrich
Pestle Motor Kontes Pellet Pestle
Cordless Motor - Sigma-Aldrich
pH meter
pH Bench Meter
Microprocessor ATC
pH210
- HANNA
Instruments
Pipet Controller Pipet Boy accu-jet - Brand
Power supplies
EC300XL2 Power
Supply C1596100710705
Thermo
Scientific
Power pack Consort
E122 - Consort
Real Time-PCR
System
StepOnePlus Real-
Time PCR System
Thermal Cycling
Block
272.006.429 Applied
Biosystems
Rotators
2-1175 - Neolab
34528E - Neolab
Polymax 1040 - Heidolph
RM5 - CAT
RollerMixer - Ratek
Serological pipets
Non-sterile, 5 ml,
10ml, 25ml - Sigma-Aldrich
Sterile, 5 ml, 10ml,
25ml - Sigma-Aldrich
Shakers Minishaker MS1 - IKA Werke
Spectrophotometers
NanoDrop 2000c UV-
Vis Spectrophotometer -
Thermo
Scientific
BioPhotometer 6131 - Eppendorf
Sterile tubes
Cellstar Tubes sterile,
15 ml, 50ml, 50ml
brown
- Greiner Bio-
One
Thermal cyclers TC-312 FTC3102D Techne
Vortex
REAX top 100420596 Heidolph
Vortex Genie 2 - Bender &
Hobein
Water bath WNB10 L307.1074 Memmert
Water purification
system
Arium 611UV
Ultrapure Water
System
- Sartorius
Milli-Q Ultrapure
Water System - Millipore
Wipes Kim Precision Wipes 5511 Kimberly-
Clark
X-ray film Super RX medical X-
Ray film Super RX Fujifilm
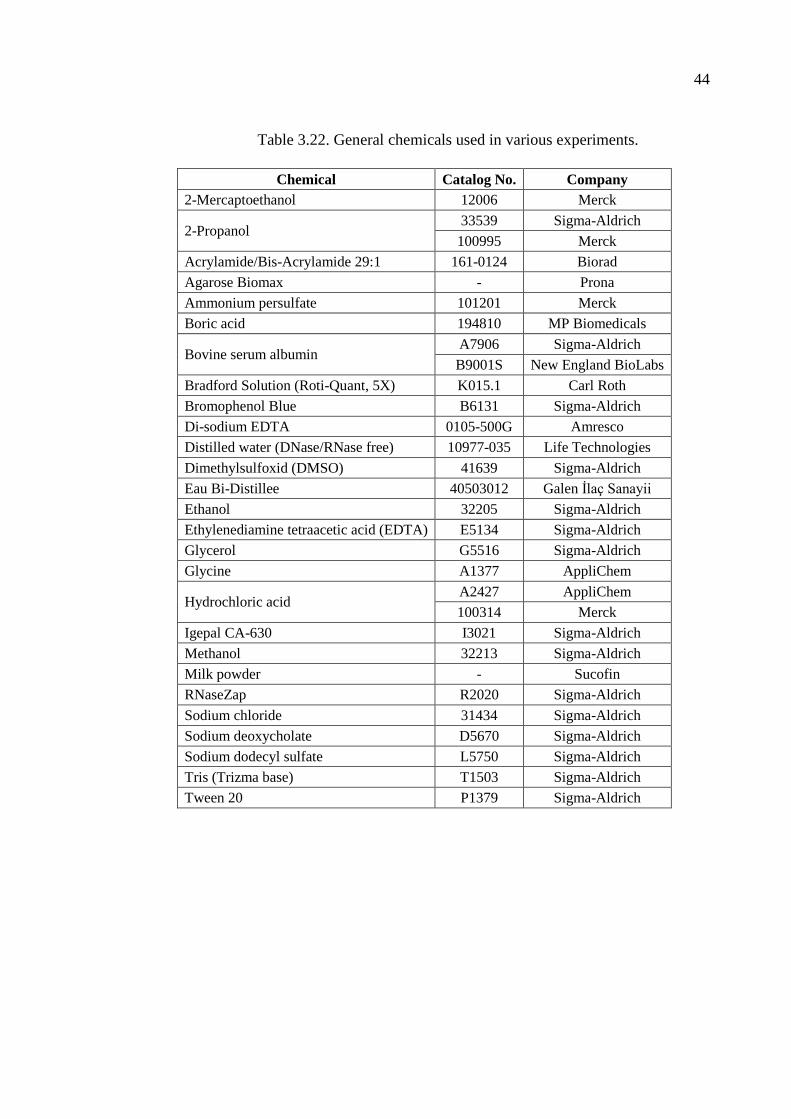
44
Table 3.22. General chemicals used in various experiments.
Chemical Catalog No. Company
2-Mercaptoethanol 12006 Merck
2-Propanol 33539 Sigma-Aldrich
100995 Merck
Acrylamide/Bis-Acrylamide 29:1 161-0124 Biorad
Agarose Biomax - Prona
Ammonium persulfate 101201 Merck
Boric acid 194810 MP Biomedicals
Bovine serum albumin A7906 Sigma-Aldrich
B9001S New England BioLabs
Bradford Solution (Roti-Quant, 5X) K015.1 Carl Roth
Bromophenol Blue B6131 Sigma-Aldrich
Di-sodium EDTA 0105-500G Amresco
Distilled water (DNase/RNase free) 10977-035 Life Technologies
Dimethylsulfoxid (DMSO) 41639 Sigma-Aldrich
Eau Bi-Distillee 40503012 Galen İlaç Sanayii
Ethanol 32205 Sigma-Aldrich
Ethylenediamine tetraacetic acid (EDTA) E5134 Sigma-Aldrich
Glycerol G5516 Sigma-Aldrich
Glycine A1377 AppliChem
Hydrochloric acid A2427 AppliChem
100314 Merck
Igepal CA-630 I3021 Sigma-Aldrich
Methanol 32213 Sigma-Aldrich
Milk powder - Sucofin
RNaseZap R2020 Sigma-Aldrich
Sodium chloride 31434 Sigma-Aldrich
Sodium deoxycholate D5670 Sigma-Aldrich
Sodium dodecyl sulfate L5750 Sigma-Aldrich
Tris (Trizma base) T1503 Sigma-Aldrich
Tween 20 P1379 Sigma-Aldrich
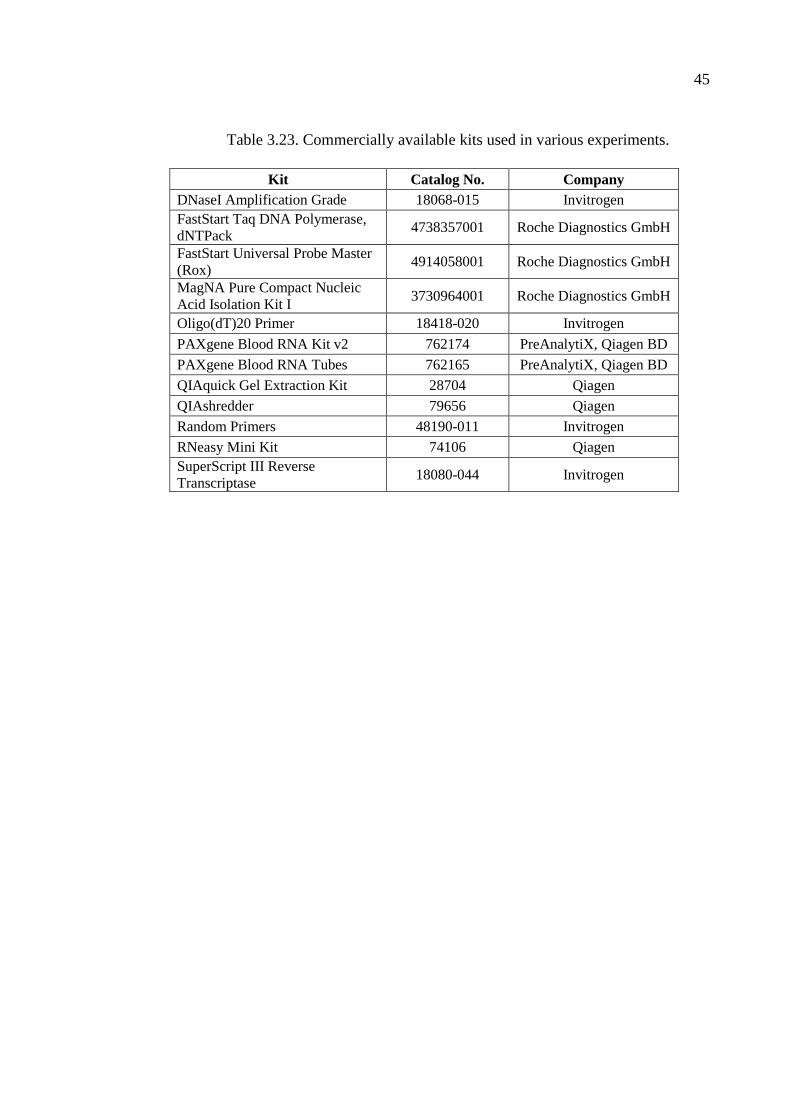
45
Table 3.23. Commercially available kits used in various experiments.
Kit Catalog No. Company
DNaseI Amplification Grade 18068-015 Invitrogen
FastStart Taq DNA Polymerase,
dNTPack 4738357001 Roche Diagnostics GmbH
FastStart Universal Probe Master
(Rox) 4914058001 Roche Diagnostics GmbH
MagNA Pure Compact Nucleic
Acid Isolation Kit I 3730964001 Roche Diagnostics GmbH
Oligo(dT)20 Primer 18418-020 Invitrogen
PAXgene Blood RNA Kit v2 762174 PreAnalytiX, Qiagen BD
PAXgene Blood RNA Tubes 762165 PreAnalytiX, Qiagen BD
QIAquick Gel Extraction Kit 28704 Qiagen
QIAshredder 79656 Qiagen
Random Primers 48190-011 Invitrogen
RNeasy Mini Kit 74106 Qiagen
SuperScript III Reverse
Transcriptase 18080-044 Invitrogen
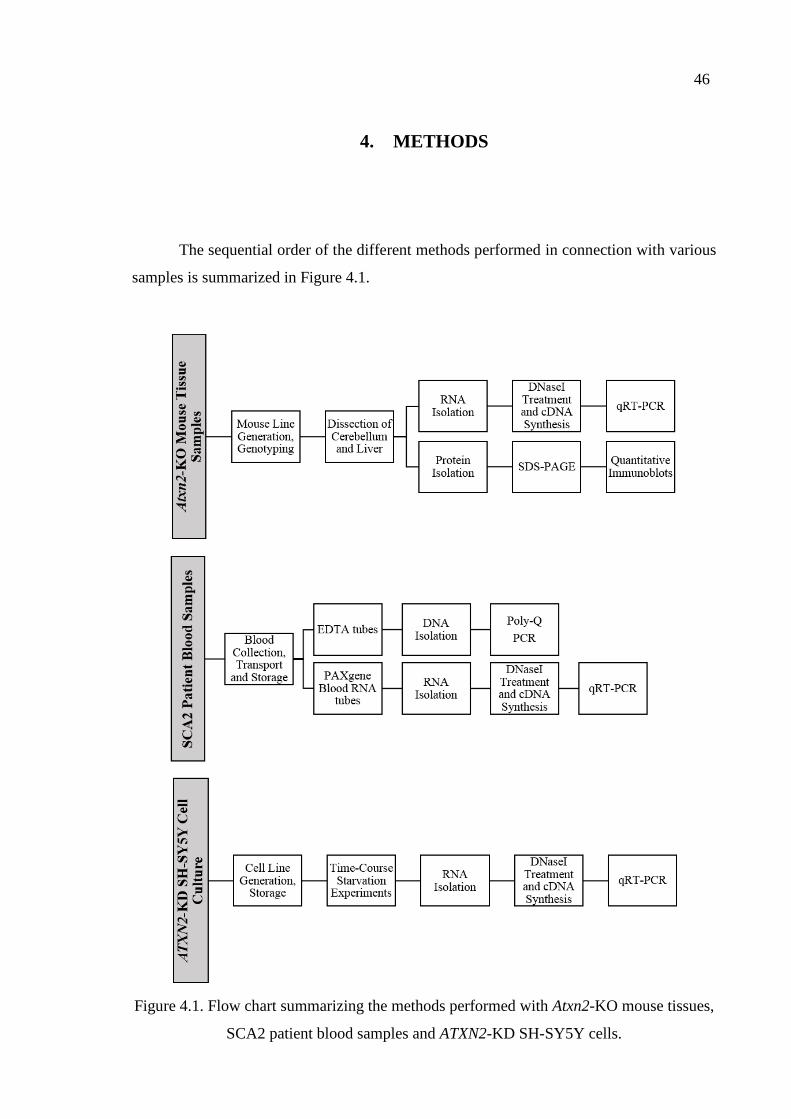
46
4. METHODS
The sequential order of the different methods performed in connection with various
samples is summarized in Figure 4.1.
Figure 4.1. Flow chart summarizing the methods performed with Atxn2-KO mouse tissues,
SCA2 patient blood samples and ATXN2-KD SH-SY5Y cells.
47
4.1. SCA2 Patient Peripheral Blood Samples
Several SCA2 patients from a large Turkish pedigree living in Burhaniye, Balıkesir
were referred to NDAL for routine diagnostics. With the intention of further investigating
ataxin-2 mechanism and pathology, we contacted the family for a planned sample
collection.
4.1.1. Blood Collection, Transport and Storage
Peripheral blood samples were collected from five disease-manifesting and eight
non-symptomatic family members in the same day, with informed written consent and
approval of the Ethics Commission of Boğaziçi University. At the time of sample
collection, all the individuals had fasted overnight. Blood samples into three EDTA and
three PAXgene Blood RNA tubes were taken from every individual. PAXgene Blood RNA
tubes were kept at room temperature for three hours as stated in the manufacturer’s guide.
Then, they were frozen in styrofoam boxes filled with dry ice. EDTA tubes were also
placed in styrofoam boxes without dry ice. On the same day, all tubes were transported to
Istanbul via air way, and PAXgene Blood RNA tubes were stored in -80 oC deep freezer
immediately. EDTA tubes were stored at 4 oC refrigerator.
4.1.2. DNA Isolation and ATXN2 Poly-Q Repeat Size Determination
Genomic DNA was extracted from 1000 µl of the peripheral blood samples
collected into EDTA tubes via MagNA Pure Compact Instrument, according to the
instructions stated in the MagNA Pure Compact Nucleic Acid Isolation Kit I manual.
Amount and quality of the extracted DNA were measured with NanoDrop 2000c UV-Vis
Spectrophotometer. 30-40 ng of genomic DNA was further used in the amplification of
ATXN2 CAG repeat tract with conventional PCR method. Content of the PCR mix for one
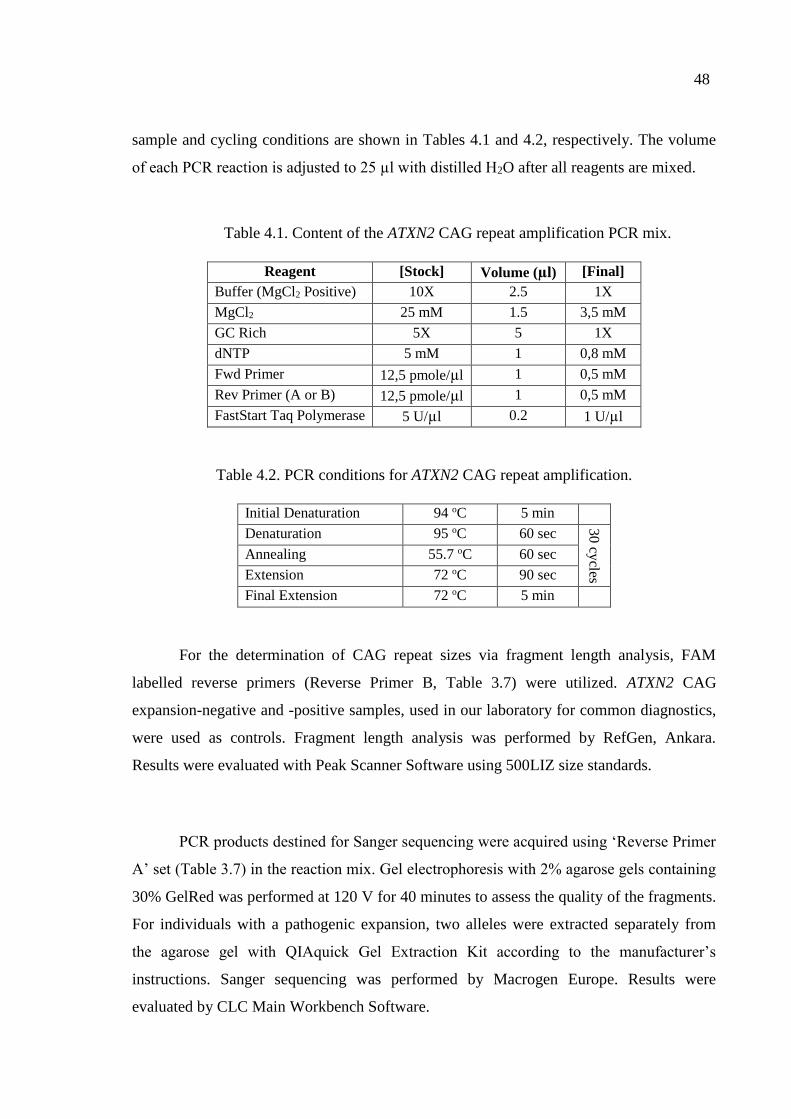
48
sample and cycling conditions are shown in Tables 4.1 and 4.2, respectively. The volume
of each PCR reaction is adjusted to 25 µl with distilled H2O after all reagents are mixed.
Table 4.1. Content of the ATXN2 CAG repeat amplification PCR mix.
Reagent [Stock] Volume (µl) [Final]
Buffer (MgCl2 Positive) 10X 2.5 1X
MgCl2 25 mM 1.5 3,5 mM
GC Rich 5X 5 1X
dNTP 5 mM 1 0,8 mM
Fwd Primer 12,5 pmole/µl 1 0,5 mM
Rev Primer (A or B) 12,5 pmole/µl 1 0,5 mM
FastStart Taq Polymerase 5 U/µl 0.2 1 U/µl
Table 4.2. PCR conditions for ATXN2 CAG repeat amplification.
Initial Denaturation 94 oC 5 min
Denaturation 95 oC 60 sec
30 cy
cles
Annealing 55.7 oC 60 sec
Extension 72 oC 90 sec
Final Extension 72 oC 5 min
For the determination of CAG repeat sizes via fragment length analysis, FAM
labelled reverse primers (Reverse Primer B, Table 3.7) were utilized. ATXN2 CAG
expansion-negative and -positive samples, used in our laboratory for common diagnostics,
were used as controls. Fragment length analysis was performed by RefGen, Ankara.
Results were evaluated with Peak Scanner Software using 500LIZ size standards.
PCR products destined for Sanger sequencing were acquired using ‘Reverse Primer
A’ set (Table 3.7) in the reaction mix. Gel electrophoresis with 2% agarose gels containing
30% GelRed was performed at 120 V for 40 minutes to assess the quality of the fragments.
For individuals with a pathogenic expansion, two alleles were extracted separately from
the agarose gel with QIAquick Gel Extraction Kit according to the manufacturer’s
instructions. Sanger sequencing was performed by Macrogen Europe. Results were
evaluated by CLC Main Workbench Software.
49
4.2. Atxn2 Knock-Out Mouse Tissue Samples
Generation of Atxn2-KO mouse line and genotyping were performed by the current
and former members of Prof. Georg Auburger’s laboratory at Goethe University Hospital,
Experimental Neurology Department (Lastres-Becker et al., 2008a). Cerebellum and liver
samples that were previously dissected, frozen in liquid N2 and kept at -80 oC were kindly
provided by Dr. Suzana Gispert for this study in January 2013.
4.3. ATXN2 Knock-Down SH-SY5Y Cell Culture
Methodology regarding the generation of non-target (NT) and ATXN2-KD SH-
SY5Y cell line, standard culturing conditions and time-course starvation experiments are
explained in the following sections.
4.3.1. Generation of ATXN2 Knock-Down Cell Line
Stable knock-down of the naïve SH-SY5Y cells with lentiviral delivery of non-
target (NT) and ATXN2 shRNAs, both of which contain a puromycin resistance cassette,
and frequent testing of the knock-down status were performed in the context of the PhD
theses of Michael Klinkenberg and Jessica Drost in Prof. Georg Auburger’s laboratory at
Goethe University Hospital, Experimental Neurology Department.
4.3.2. General Culture Conditions, Freezing and Thawing
Contents of the different media utilized in the culturing of ATXN2-KD SH-SY5Y
cells are shown in Table 4.3. All the media and other solutions used in cell culture are pre-
warmed at 37 oC water bath before use.
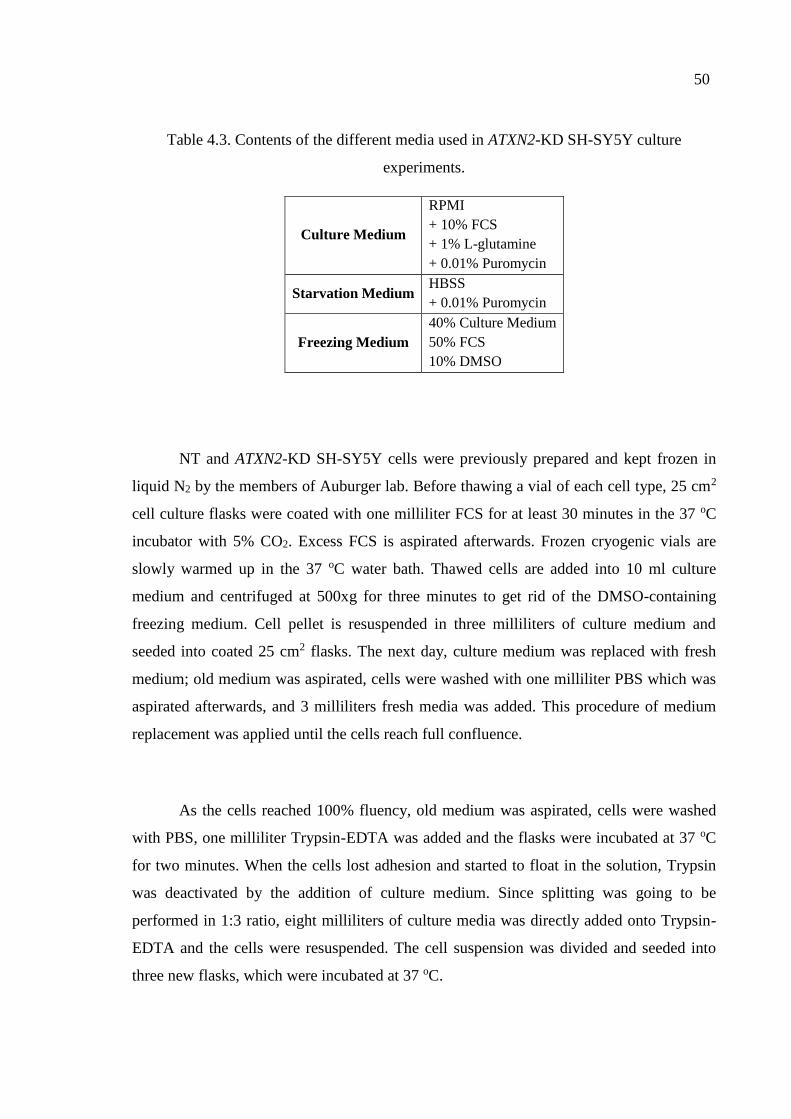
50
Table 4.3. Contents of the different media used in ATXN2-KD SH-SY5Y culture
experiments.
Culture Medium
RPMI
+ 10% FCS
+ 1% L-glutamine
+ 0.01% Puromycin
Starvation Medium HBSS
+ 0.01% Puromycin
Freezing Medium
40% Culture Medium
50% FCS
10% DMSO
NT and ATXN2-KD SH-SY5Y cells were previously prepared and kept frozen in
liquid N2 by the members of Auburger lab. Before thawing a vial of each cell type, 25 cm2
cell culture flasks were coated with one milliliter FCS for at least 30 minutes in the 37 oC
incubator with 5% CO2. Excess FCS is aspirated afterwards. Frozen cryogenic vials are
slowly warmed up in the 37 oC water bath. Thawed cells are added into 10 ml culture
medium and centrifuged at 500xg for three minutes to get rid of the DMSO-containing
freezing medium. Cell pellet is resuspended in three milliliters of culture medium and
seeded into coated 25 cm2 flasks. The next day, culture medium was replaced with fresh
medium; old medium was aspirated, cells were washed with one milliliter PBS which was
aspirated afterwards, and 3 milliliters fresh media was added. This procedure of medium
replacement was applied until the cells reach full confluence.
As the cells reached 100% fluency, old medium was aspirated, cells were washed
with PBS, one milliliter Trypsin-EDTA was added and the flasks were incubated at 37 oC
for two minutes. When the cells lost adhesion and started to float in the solution, Trypsin
was deactivated by the addition of culture medium. Since splitting was going to be
performed in 1:3 ratio, eight milliliters of culture media was directly added onto Trypsin-
EDTA and the cells were resuspended. The cell suspension was divided and seeded into
three new flasks, which were incubated at 37 oC.
51
In order to replace the used stock, one vial of each cell type was frozen and stored
in the liquid N2 tank. Fully confluent cells in a 25 cm2 flask were washed with PBS (1 ml)
and trypsinized (1 ml, 2 min at 37 oC). Culture medium was added to deactivate Trypsin
and the solution was centrifuged at 500xg for three minutes. The cell pellet was dissolved
in freezing medium (1 ml) and was immediately taken into cryogenic vials that are stored
first at -80 oC fridge and then at liquid N2.
To reach a larger amount of cells for the future experiments, cells grown in two 25
cm2 flasks were washed with PBS (1 ml), trypsinized (1 ml, 2 min at 37 oC) and seeded
into a 75 cm2 flask. The general culturing conditions and 1:3 splitting protocol were
applied in the same way as 25 cm2 flasks (using 15 ml of final culture medium volume and
5 ml Trypsin-EDTA).
4.3.3. Time-Course Starvation Experiments
Twenty four hours before the start of the time-course starvations, NT and ATXN2-
KD SH-SY5Y cells grown in 75 cm2 flasks were trypsinized (5 ml, 2 min at 37 oC) and
diluted in fresh culture medium (10 ml). 10 µl of the cell suspension was loaded into the
counting chamber and the average of cell count in four corner squares was taken (Figure
4.2). If the average number of cells in A, B, C and D was N; then it was assumed that the
cellular concentration of the suspension was N x 104 cell / ml.
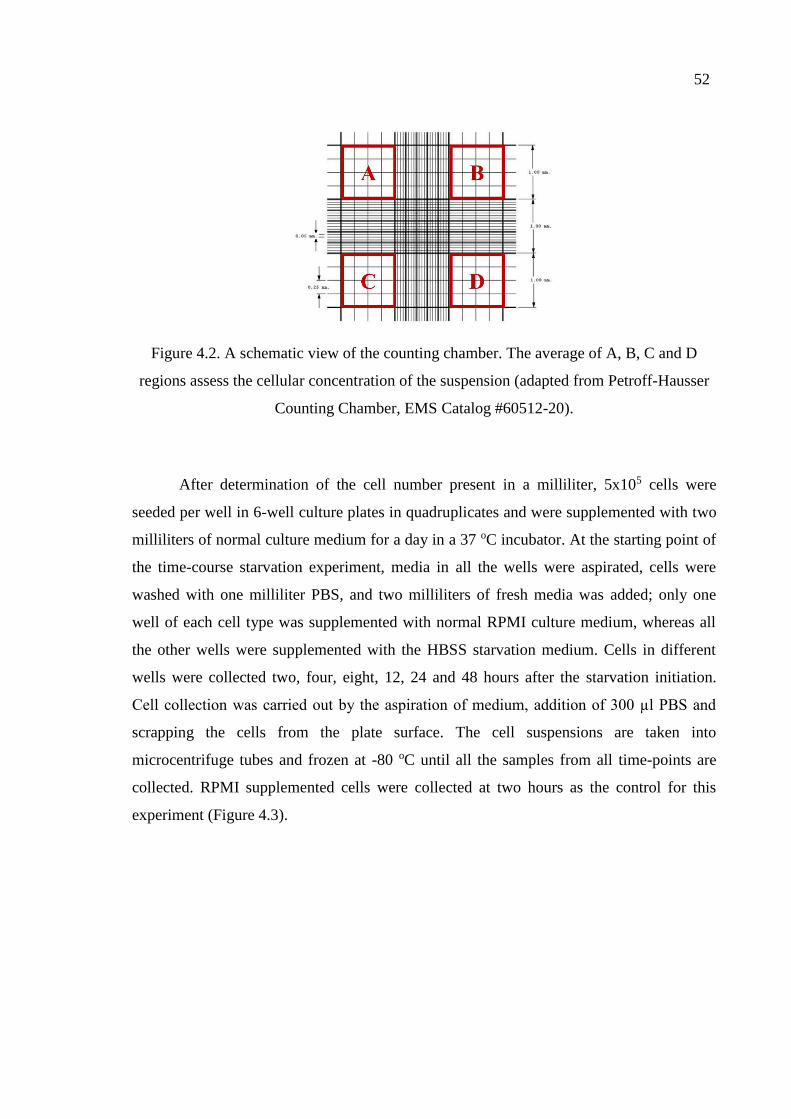
52
Figure 4.2. A schematic view of the counting chamber. The average of A, B, C and D
regions assess the cellular concentration of the suspension (adapted from Petroff-Hausser
Counting Chamber, EMS Catalog #60512-20).
After determination of the cell number present in a milliliter, 5x10⁵ cells were
seeded per well in 6-well culture plates in quadruplicates and were supplemented with two
milliliters of normal culture medium for a day in a 37 oC incubator. At the starting point of
the time-course starvation experiment, media in all the wells were aspirated, cells were
washed with one milliliter PBS, and two milliliters of fresh media was added; only one
well of each cell type was supplemented with normal RPMI culture medium, whereas all
the other wells were supplemented with the HBSS starvation medium. Cells in different
wells were collected two, four, eight, 12, 24 and 48 hours after the starvation initiation.
Cell collection was carried out by the aspiration of medium, addition of 300 µl PBS and
scrapping the cells from the plate surface. The cell suspensions are taken into
microcentrifuge tubes and frozen at -80 oC until all the samples from all time-points are
collected. RPMI supplemented cells were collected at two hours as the control for this
experiment (Figure 4.3).
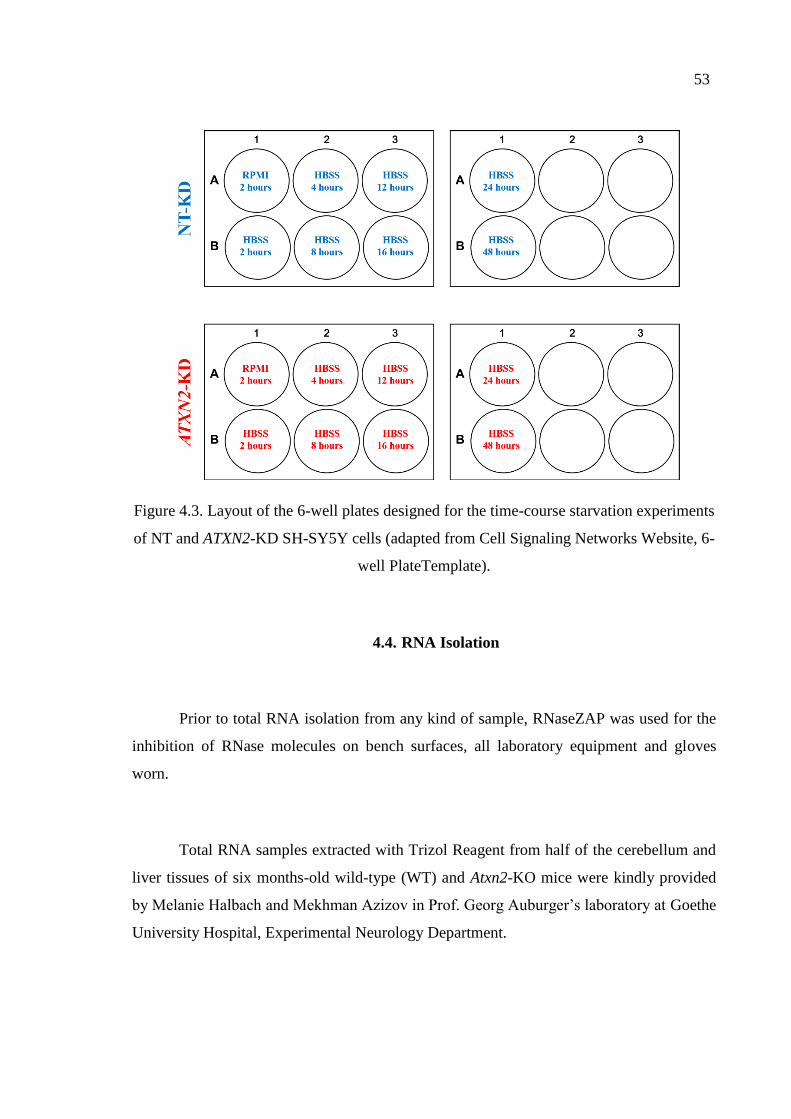
53
Figure 4.3. Layout of the 6-well plates designed for the time-course starvation experiments
of NT and ATXN2-KD SH-SY5Y cells (adapted from Cell Signaling Networks Website, 6-
well PlateTemplate).
4.4. RNA Isolation
Prior to total RNA isolation from any kind of sample, RNaseZAP was used for the
inhibition of RNase molecules on bench surfaces, all laboratory equipment and gloves
worn.
Total RNA samples extracted with Trizol Reagent from half of the cerebellum and
liver tissues of six months-old wild-type (WT) and Atxn2-KO mice were kindly provided
by Melanie Halbach and Mekhman Azizov in Prof. Georg Auburger’s laboratory at Goethe
University Hospital, Experimental Neurology Department.
54
For the isolation of total RNA from peripheral blood samples of SCA2 patients and
controls, frozen PAXgene Blood RNA tubes were taken out from the -80 oC deep freezer a
day before and were incubated at room temperature overnight. Total RNA was isolated
with PAXgene Blood RNA Kit v2 according to the manufacturer’s instructions with one
exception: the captured RNA within the column was eluted with 30 µl (15 µl + 15 µl) pre-
warmed BR5 buffer instead of 80 µl (40 µl + 40 µl) as stated in the user’s guide. Quality
and the concentration of the isolated RNA from blood samples were measured with
NanoDrop 2000c UV-Vis Spectrophotometer. Isolated RNA samples were stored at -80
oC.
Isolation of total RNA from NT and ATXN2-KD SH-SY5Y cells was performed for
each set separately. A set contains the cells from each type collected at all time-points
between 2-48 hours (layout depicted in Figure 4.3). QIAshredder and RNeasy Mini Kits
were used for total RNA isolation from cultured NT and ATXN2-KD SH-SY5Y cells
according to the manufacturer’s instructions. Elution of the captured RNA within the
column was done with 30 µl pre-warmed RNase-free H2O. The optional 2-
mercaptoethanol addition to the RLT lysis buffer was performed immediately before cell
lysis. Quantification and quality control of the isolated RNA from cultured cells were done
using BioPhotometer device evaluating the absorbance value at 260 nm, OD260/280 and
OD260/230. Isolated RNA samples were stored at -80 oC.
4.5. DNaseI Treatment and cDNA Synthesis
One microgram of the total RNA isolated from mouse tissues, peripheral blood
samples or cultured cells was treated with DNaseI prior to cDNA synthesis to digest DNA
molecules that may not have been eliminated in the previous steps. One microliter DNase
Amplification Grade and one microliter DNaseI Reaction Buffer were mixed with one
microgram of total RNA, and the total volume was adjusted to 10 µl with RNase-free H2O.
After the 15 minute incubation at room temperature, one microliter EDTA was added and
the samples were incubated at 65 oC for 10 minutes to inactivate DNaseI. One microliter of
each oligo(dT)20 primer, random primer and dNTP solution were added and the samples
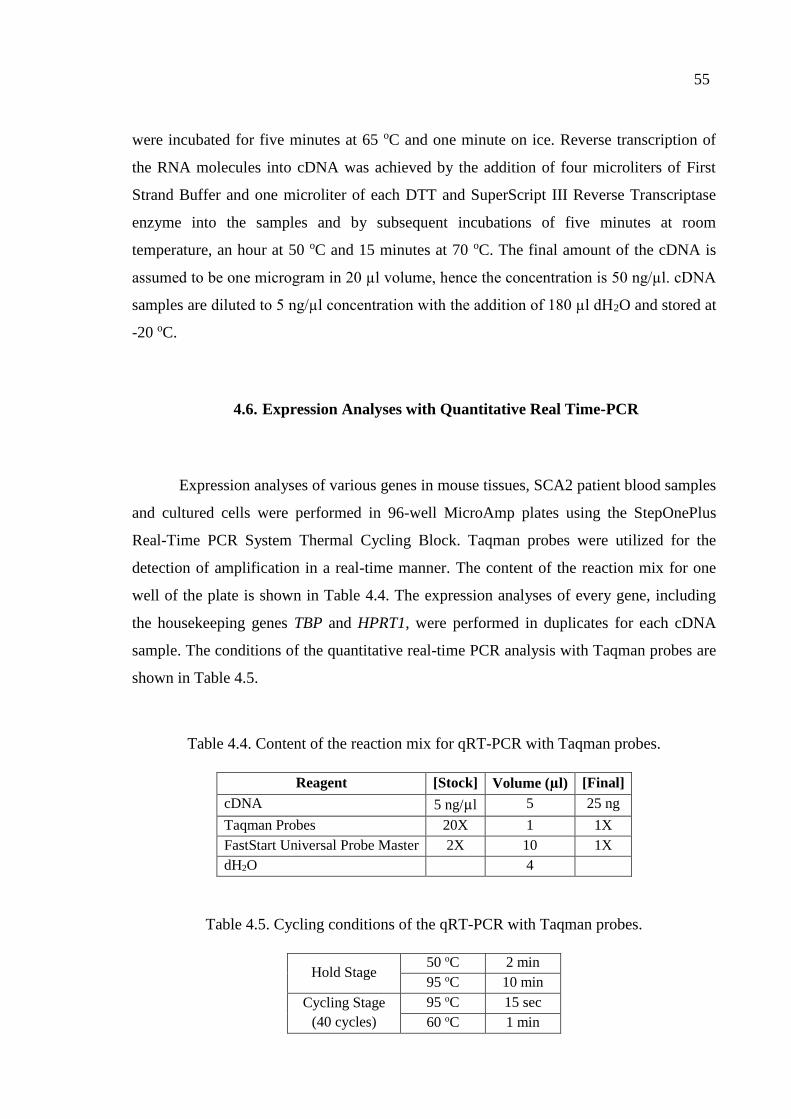
55
were incubated for five minutes at 65 oC and one minute on ice. Reverse transcription of
the RNA molecules into cDNA was achieved by the addition of four microliters of First
Strand Buffer and one microliter of each DTT and SuperScript III Reverse Transcriptase
enzyme into the samples and by subsequent incubations of five minutes at room
temperature, an hour at 50 oC and 15 minutes at 70 oC. The final amount of the cDNA is
assumed to be one microgram in 20 µl volume, hence the concentration is 50 ng/µl. cDNA
samples are diluted to 5 ng/µl concentration with the addition of 180 µl dH2O and stored at
-20 oC.
4.6. Expression Analyses with Quantitative Real Time-PCR
Expression analyses of various genes in mouse tissues, SCA2 patient blood samples
and cultured cells were performed in 96-well MicroAmp plates using the StepOnePlus
Real-Time PCR System Thermal Cycling Block. Taqman probes were utilized for the
detection of amplification in a real-time manner. The content of the reaction mix for one
well of the plate is shown in Table 4.4. The expression analyses of every gene, including
the housekeeping genes TBP and HPRT1, were performed in duplicates for each cDNA
sample. The conditions of the quantitative real-time PCR analysis with Taqman probes are
shown in Table 4.5.
Table 4.4. Content of the reaction mix for qRT-PCR with Taqman probes.
Reagent [Stock] Volume (µl) [Final]
cDNA 5 ng/µl 5 25 ng
Taqman Probes 20X 1 1X
FastStart Universal Probe Master 2X 10 1X
dH2O 4
Table 4.5. Cycling conditions of the qRT-PCR with Taqman probes.
Hold Stage 50 oC 2 min
95 oC 10 min
Cycling Stage
(40 cycles)
95 oC 15 sec
60 oC 1 min
56
The expression data produced by the real-time detection of cDNA amplification via
Taqman probes was analyzed using 2^-∆∆Ct method (Livak and Schmittgen, 2001). The
‘cycle threshold’ (Ct) values obtained from the qRT-PCR analysis express the number of
cycles every sample went through in reaching to a threshold signal produced by the
Taqman probes as amplification occurs. In the 2^-∆∆Ct method, the Ct value of the
housekeeping gene (TBP or HPRT1) was subtracted from the Ct value of the target gene
for every sample. The result of this calculation is termed ∆Ct. Then, the average ∆Ct value
of controls (WT mice, healthy controls and RPMI supplemented cells collected at 2 hours)
was subtracted from the ∆Ct values of all samples, conceiving ∆∆Ct values. 2^-∆∆Ct
values were calculated for every sample and used in the assessment of expression
differences between cases and controls. Further normalization was performed in mouse and
patient data via dividing all 2^-∆∆Ct values by the average 2^-∆∆Ct of controls (WT mice
and healthy individuals). Hence, the average of the normalized data from controls were
adjusted to one, and the fold-change difference of expression in the case group (Atxn2-KO
mice and SCA2 patients) could be assessed with respect to the controls.
4.7. Protein Isolation and Quantitation
Protein isolation from half of the mouse cerebellum and liver tissues was carried
out in two steps; isolation of the soluble proteins (RIPA fraction) and isolation of the
insoluble proteins (SDS fraction). Frozen WT and Atxn2-KO mice cerebella and livers
were first weighed with an analytical balance. One hundred microliters of RIPA lysis
buffer containing protease inhibitor cocktail was used per milligram of tissue sample.
Murine tissues were homogenized with polypropylene pestles and pestle motor, then were
rotated for 30 minutes at 4 oC. Lysates were sonicated due to high viscosity caused by
DNA emergence and centrifuged at 14.000xg for 15 minutes at 4 oC. The supernatant,
which is comprised of the soluble proteins, was taken into a fresh microcentrifuge tube
(RIPA fraction). SDS lysis buffer in half the volume of previously added RIPA lysis buffer
was applied to the pellet. The pellet was resuspended by pipetting and vortexing. The
suspension was sonicated with three cycles of 10x1 second bursts. The lysate was
57
centrifuged at 16.000xg for 10 minutes at 4 oC. The supernatant, which contains the
insoluble proteins, was taken into a fresh tube (SDS fraction).
Quantitation of the isolated proteins was performed with the Bradford assay and the
BSA standard curve. In order to generate a standard curve, BSA dilutions ranging between
10-50 µg/µl for RIPA lysates and between 5-25 µg/µl for SDS lysates were prepared. Two
microliters of the BSA standard dilutions or unknown mouse samples were mixed with 100
µl dH2O and five milliliters of 1X Bradford solution. One milliliter of this solution for
every standard and unknown sample were transferred into cuvettes and measured with
BioPhotometer using readily defined Bradford Assay settings of the device. The BSA
standard curve was plotted, and the protein concentrations of the unknown samples were
assessed by incorporating their OD values into the best line equation of the standard curve.
4.8. SDS-PAGE and Quantitative Immunoblot Analyses
Sodium dodecyl sulfate-polyacrylamide gel electrophoresis (SDS-PAGE) was
performed to separate the isolated proteins according to their molecular weight. Twenty
microgram total protein was mixed with the adequate amount of dH2O and 2X loading dye
in the final volume of 10 µl. then, the samples were heated to 95 °C for five minutes to
dissociate protein complexes and denature the proteins into primary structure.
Discontinuous acrylamide gels were utilized in the electrophoresis; they consisted of an
upper stacking part and lower resolving or separating part. The concentration of the
stacking gel was the same for all runs, while the concentration of the resolving gel was
determined according to the molecular weight of the target protein to be detected. Contents
of the stacking and resolving gels and concentrations that were utilized for different
molecular weight intervals are shown in Table 4.6. Electrophoresis was performed at 100V
for 20 minutes while the proteins were in the stacking gel and at 120V for three to four
hours as proteins get separated in the resolving gel. As the samples were loaded into the
acrylamide gel and the electrophoresis was initiated, 1X transfer buffer was freshly
prepared for every run as follows: 70% dH2O, 20% methanol, and 10% 10X transfer buffer
stock.
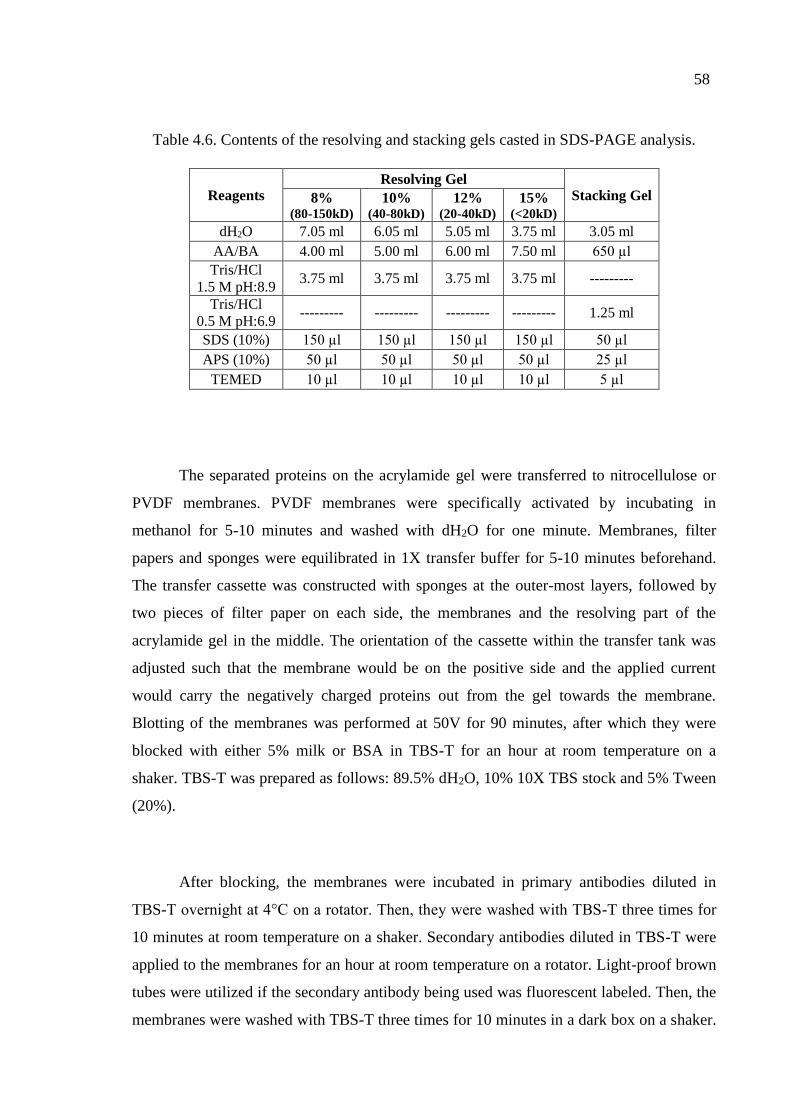
58
Table 4.6. Contents of the resolving and stacking gels casted in SDS-PAGE analysis.
Reagents Resolving Gel
Stacking Gel 8% (80-150kD)
10% (40-80kD)
12% (20-40kD)
15% (<20kD)
dH2O 7.05 ml 6.05 ml 5.05 ml 3.75 ml 3.05 ml
AA/BA 4.00 ml 5.00 ml 6.00 ml 7.50 ml 650 µl
Tris/HCl
1.5 M pH:8.9 3.75 ml 3.75 ml 3.75 ml 3.75 ml ---------
Tris/HCl
0.5 M pH:6.9 --------- --------- --------- --------- 1.25 ml
SDS (10%) 150 µl 150 µl 150 µl 150 µl 50 µl
APS (10%) 50 µl 50 µl 50 µl 50 µl 25 µl
TEMED 10 µl 10 µl 10 µl 10 µl 5 µl
The separated proteins on the acrylamide gel were transferred to nitrocellulose or
PVDF membranes. PVDF membranes were specifically activated by incubating in
methanol for 5-10 minutes and washed with dH2O for one minute. Membranes, filter
papers and sponges were equilibrated in 1X transfer buffer for 5-10 minutes beforehand.
The transfer cassette was constructed with sponges at the outer-most layers, followed by
two pieces of filter paper on each side, the membranes and the resolving part of the
acrylamide gel in the middle. The orientation of the cassette within the transfer tank was
adjusted such that the membrane would be on the positive side and the applied current
would carry the negatively charged proteins out from the gel towards the membrane.
Blotting of the membranes was performed at 50V for 90 minutes, after which they were
blocked with either 5% milk or BSA in TBS-T for an hour at room temperature on a
shaker. TBS-T was prepared as follows: 89.5% dH2O, 10% 10X TBS stock and 5% Tween
(20%).
After blocking, the membranes were incubated in primary antibodies diluted in
TBS-T overnight at 4°C on a rotator. Then, they were washed with TBS-T three times for
10 minutes at room temperature on a shaker. Secondary antibodies diluted in TBS-T were
applied to the membranes for an hour at room temperature on a rotator. Light-proof brown
tubes were utilized if the secondary antibody being used was fluorescent labeled. Then, the
membranes were washed with TBS-T three times for 10 minutes in a dark box on a shaker.
59
Signal detection was done immediately with Li-Cor Odyssey Classic instrument if the
secondary antibody was fluorescently labeled. Quantification was performed by image
analysis using ImageStudio software provided by Li-Cor instrument. In the case of HRP-
conjugated secondary antibodies, SuperSignal West Pico Chemiluminescent Substrates
were used. Blotted membranes were incubated for five minutes in four milliliters of the 1:1
mixture of Lumino/Enhancer and Stable Peroxidase solutions. Excess ECL solution
remaining on the blots was soaked by a tissue paper and the blots were placed in an
exposure cassette with X-ray films in the dark room. Exposure was performed in variable
time intervals for each antibody utilized. The X-ray films were soaked into developer and
fixer solutions after which they were washed and dried. Quantification of the signals was
done by scanning the films and analyzing the image with ImageJ software.
The signal values of the target proteins obtained from ImageStudio or ImageJ
software were first normalized to the signal of the housekeeping gene for every sample.
Then, the ratios of all samples were further normalized to the average signal of WT
samples. Therefore, the average of WT samples was adjusted to one, and the exact fold
change difference of the target protein in Atxn2-KO mice could be assessed compared to
the WT mice.
4.9. High-Throughput Transcriptome Analyses
High-throughput transcriptome analyses performed with the WT and Atxn2-KO
mice and with SCA2 patients and matching healthy controls are explained in the following
sections.
4.9.1. Microarray Analysis of Atxn2-KO Mice
Transcriptome analysis using Affymetrix GeneChip HT Mouse Genome 430 2.0
Array Plates was performed with the RNA samples obtained from the cerebella and livers
60
of four WT and four Atxn2-KO mice (six, 12 and 24 weeks-old) at Microarray GeneChip
Facility in Tübingen, Germany. Further information regarding hybridization,
bioinformatics methodology and public access number to the raw data is published
(Fittschen et al., 2015).
4.9.2. Deep RNA-Sequencing Analysis of SCA2 Patients
Whole transcriptome analysis with the global blood RNA samples from three SCA2
patients and three age- and sex-matched healthy controls from the same family was
performed at Alacris Theranostics GmbH, Berlin, Germany. After library preparation from
500 ng total RNA and mRNA selection, sequencing of the 2x50 bp paired-ends was
performed with Illumina HiSeq2500 system. Processing of the raw data and all other
bioinformatic analyses were performed by Alacris Theranostics; sequencing reads were
mapped to GRCh37/hg19 human genome reference, hemoglobin gene reads were
eliminated prior to the calculation of the expression values which was performed with
‘reads per kilobase per million mapped reads’ (RPKM) normalization. Differential
expression between patients and controls was calculated with edgeR package in R
Bioconductor and corrected for multiple testing. Significance of the differences were
assessed using an exact test for overdispersed data.
4.10. Gene Set Enrichment Analysis
Gene Set Enrichment Analysis (GSEA) was performed with the deep RNA-
sequencing results of three SCA2 patients and three controls from the same family utilizing
the Java-based version GSEA-P of the software at the Broad Institute server. The ranked
gene list contained all genes examined by the transcriptome analysis and was sorted out
with respect to the base two logarithm of the fold change for every particular gene. During
the enrichment analysis, c2, c5 and cc gene sets of the MSigDB v4.0 were used.
61
4.11. Statistical Analyses
Statistical tests to assess the significance of the observed effects were performed
with the GraphPad Prism Software. Unpaired student’s t-test was performed in comparing
two groups of samples, and paired t-test was performed to compare specific age- and sex-
matched patient-control combinations. Two-way ANOVA was used in cell culture
experiments when comparing multiple groups of samples, and at the same time variation
within a sample group. Results were displayed as bar graphs, showing mean values of each
sample group and standard error of the mean (SEM). Significant differences were
identified with asterisks (* p < 0.05; ** p < 0.01; *** p < 0.001, **** p < 0.0001).
Samples showing a trend toward significance (0.05 < p < 0.1), were highlighted with T.
Outliers within each sample group were identified using the online GraphPad
QuickCals Outlier Calculator tool which utilizes Grubbs’ test.
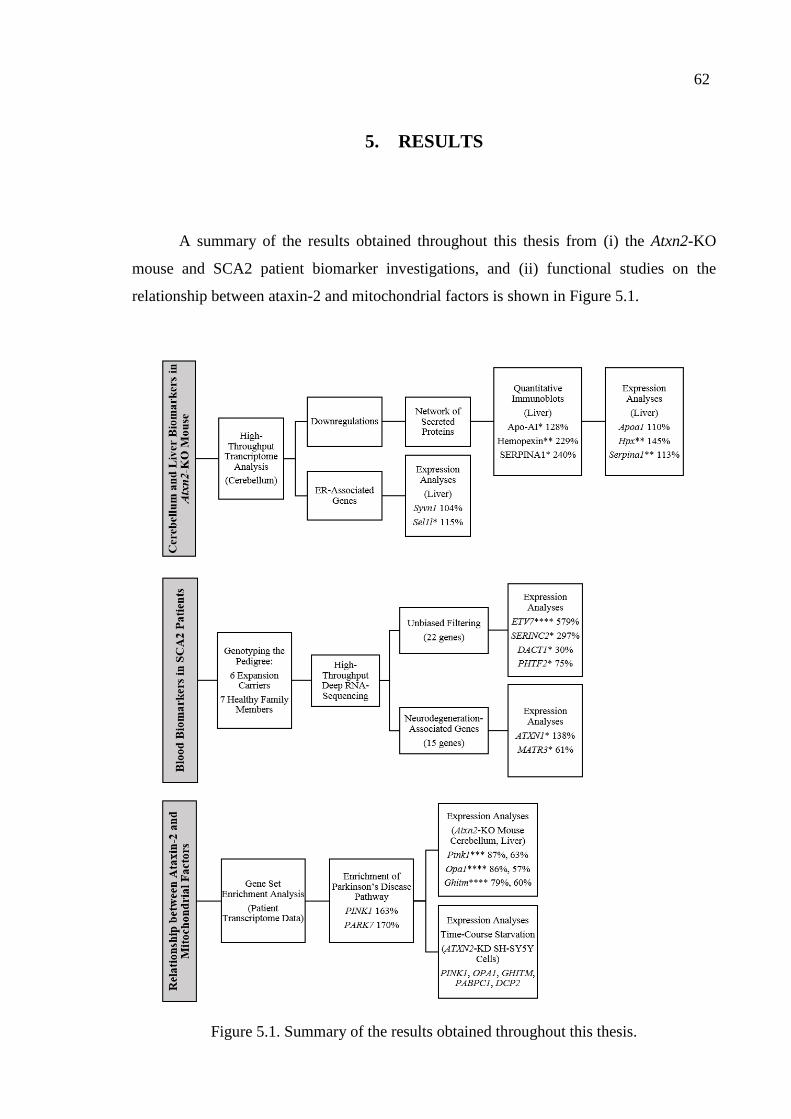
62
5. RESULTS
A summary of the results obtained throughout this thesis from (i) the Atxn2-KO
mouse and SCA2 patient biomarker investigations, and (ii) functional studies on the
relationship between ataxin-2 and mitochondrial factors is shown in Figure 5.1.
Figure 5.1. Summary of the results obtained throughout this thesis.
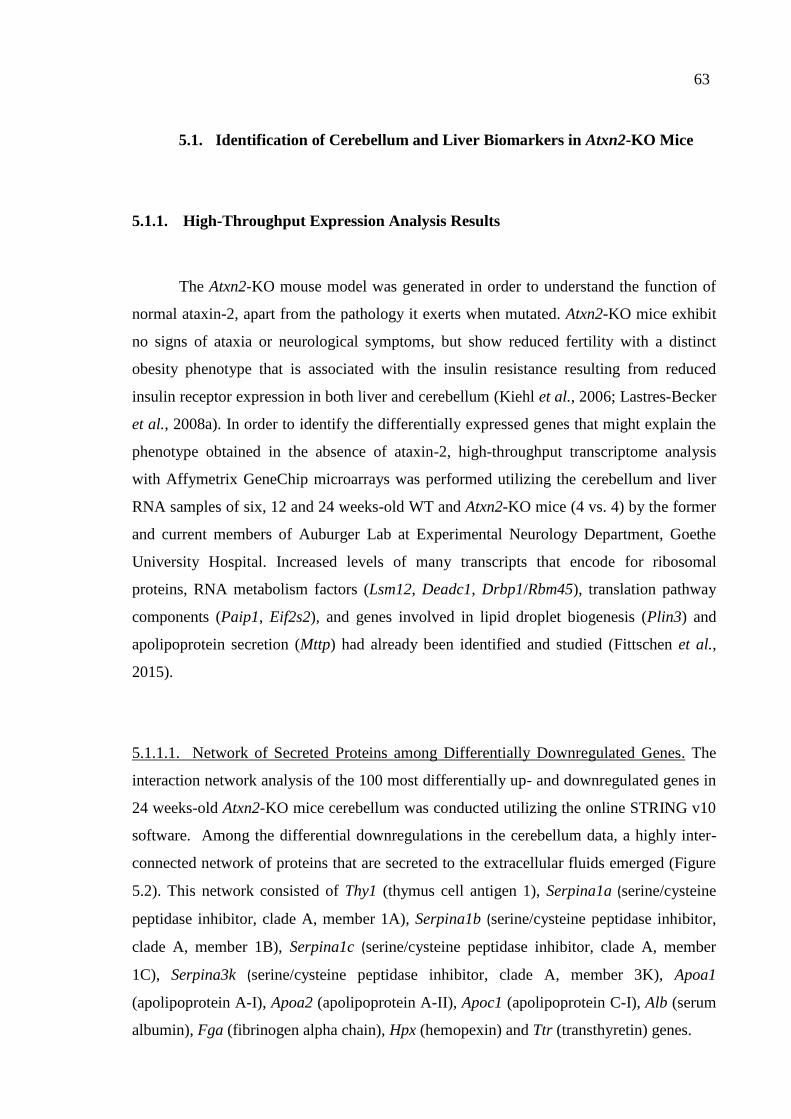
63
5.1. Identification of Cerebellum and Liver Biomarkers in Atxn2-KO Mice
5.1.1. High-Throughput Expression Analysis Results
The Atxn2-KO mouse model was generated in order to understand the function of
normal ataxin-2, apart from the pathology it exerts when mutated. Atxn2-KO mice exhibit
no signs of ataxia or neurological symptoms, but show reduced fertility with a distinct
obesity phenotype that is associated with the insulin resistance resulting from reduced
insulin receptor expression in both liver and cerebellum (Kiehl et al., 2006; Lastres-Becker
et al., 2008a). In order to identify the differentially expressed genes that might explain the
phenotype obtained in the absence of ataxin-2, high-throughput transcriptome analysis
with Affymetrix GeneChip microarrays was performed utilizing the cerebellum and liver
RNA samples of six, 12 and 24 weeks-old WT and Atxn2-KO mice (4 vs. 4) by the former
and current members of Auburger Lab at Experimental Neurology Department, Goethe
University Hospital. Increased levels of many transcripts that encode for ribosomal
proteins, RNA metabolism factors (Lsm12, Deadc1, Drbp1/Rbm45), translation pathway
components (Paip1, Eif2s2), and genes involved in lipid droplet biogenesis (Plin3) and
apolipoprotein secretion (Mttp) had already been identified and studied (Fittschen et al.,
2015).
5.1.1.1. Network of Secreted Proteins among Differentially Downregulated Genes. The
interaction network analysis of the 100 most differentially up- and downregulated genes in
24 weeks-old Atxn2-KO mice cerebellum was conducted utilizing the online STRING v10
software. Among the differential downregulations in the cerebellum data, a highly inter-
connected network of proteins that are secreted to the extracellular fluids emerged (Figure
5.2). This network consisted of Thy1 (thymus cell antigen 1), Serpina1a (serine/cysteine
peptidase inhibitor, clade A, member 1A), Serpina1b (serine/cysteine peptidase inhibitor,
clade A, member 1B), Serpina1c (serine/cysteine peptidase inhibitor, clade A, member
1C), Serpina3k (serine/cysteine peptidase inhibitor, clade A, member 3K), Apoa1
(apolipoprotein A-I), Apoa2 (apolipoprotein A-II), Apoc1 (apolipoprotein C-I), Alb (serum
albumin), Fga (fibrinogen alpha chain), Hpx (hemopexin) and Ttr (transthyretin) genes.
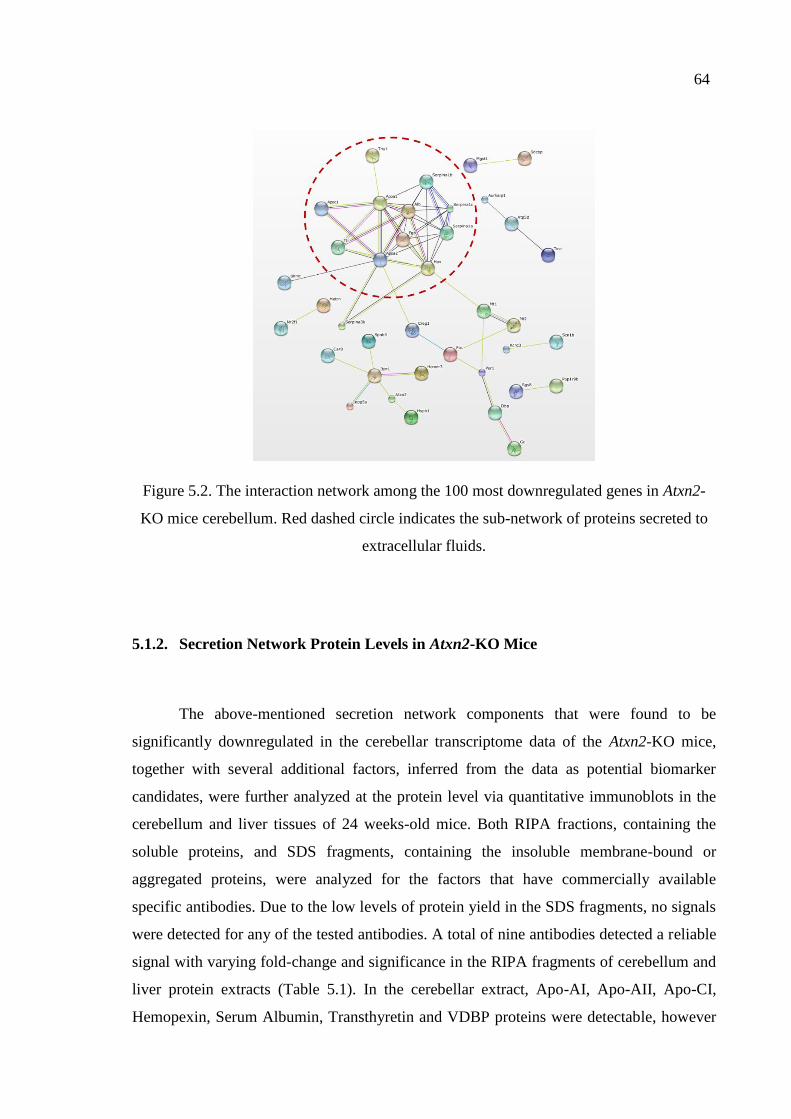
64
Figure 5.2. The interaction network among the 100 most downregulated genes in Atxn2-
KO mice cerebellum. Red dashed circle indicates the sub-network of proteins secreted to
extracellular fluids.
5.1.2. Secretion Network Protein Levels in Atxn2-KO Mice
The above-mentioned secretion network components that were found to be
significantly downregulated in the cerebellar transcriptome data of the Atxn2-KO mice,
together with several additional factors, inferred from the data as potential biomarker
candidates, were further analyzed at the protein level via quantitative immunoblots in the
cerebellum and liver tissues of 24 weeks-old mice. Both RIPA fractions, containing the
soluble proteins, and SDS fragments, containing the insoluble membrane-bound or
aggregated proteins, were analyzed for the factors that have commercially available
specific antibodies. Due to the low levels of protein yield in the SDS fragments, no signals
were detected for any of the tested antibodies. A total of nine antibodies detected a reliable
signal with varying fold-change and significance in the RIPA fragments of cerebellum and
liver protein extracts (Table 5.1). In the cerebellar extract, Apo-AI, Apo-AII, Apo-CI,
Hemopexin, Serum Albumin, Transthyretin and VDBP proteins were detectable, however
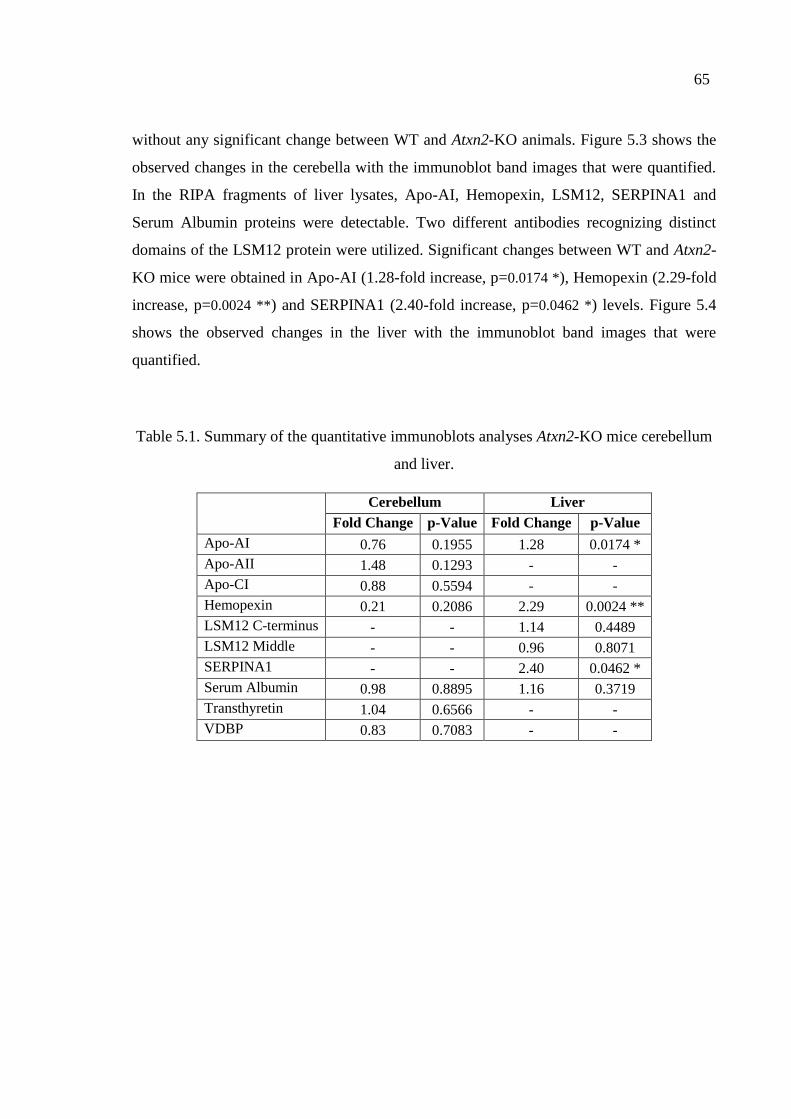
65
without any significant change between WT and Atxn2-KO animals. Figure 5.3 shows the
observed changes in the cerebella with the immunoblot band images that were quantified.
In the RIPA fragments of liver lysates, Apo-AI, Hemopexin, LSM12, SERPINA1 and
Serum Albumin proteins were detectable. Two different antibodies recognizing distinct
domains of the LSM12 protein were utilized. Significant changes between WT and Atxn2-
KO mice were obtained in Apo-AI (1.28-fold increase, p=0.0174 *), Hemopexin (2.29-fold
increase, p=0.0024 **) and SERPINA1 (2.40-fold increase, p=0.0462 *) levels. Figure 5.4
shows the observed changes in the liver with the immunoblot band images that were
quantified.
Table 5.1. Summary of the quantitative immunoblots analyses Atxn2-KO mice cerebellum
and liver.
Cerebellum Liver
Fold Change p-Value Fold Change p-Value
Apo-AI 0.76 0.1955 1.28 0.0174 *
Apo-AII 1.48 0.1293 - -
Apo-CI 0.88 0.5594 - -
Hemopexin 0.21 0.2086 2.29 0.0024 **
LSM12 C-terminus - - 1.14 0.4489
LSM12 Middle - - 0.96 0.8071
SERPINA1 - - 2.40 0.0462 *
Serum Albumin 0.98 0.8895 1.16 0.3719
Transthyretin 1.04 0.6566 - -
VDBP 0.83 0.7083 - -
66
Figure 5.3. Fold-change differences of the biomarker candidates at the protein level in
Atxn2-KO mice cerebellum.
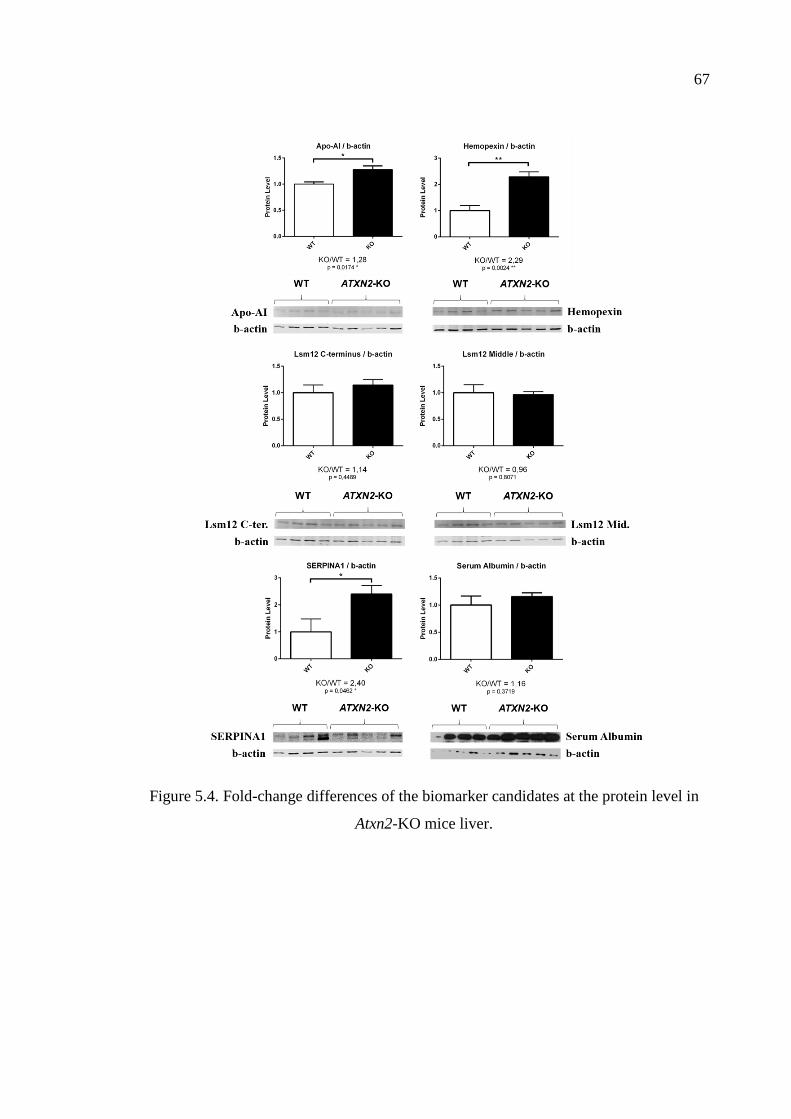
67
Figure 5.4. Fold-change differences of the biomarker candidates at the protein level in
Atxn2-KO mice liver.
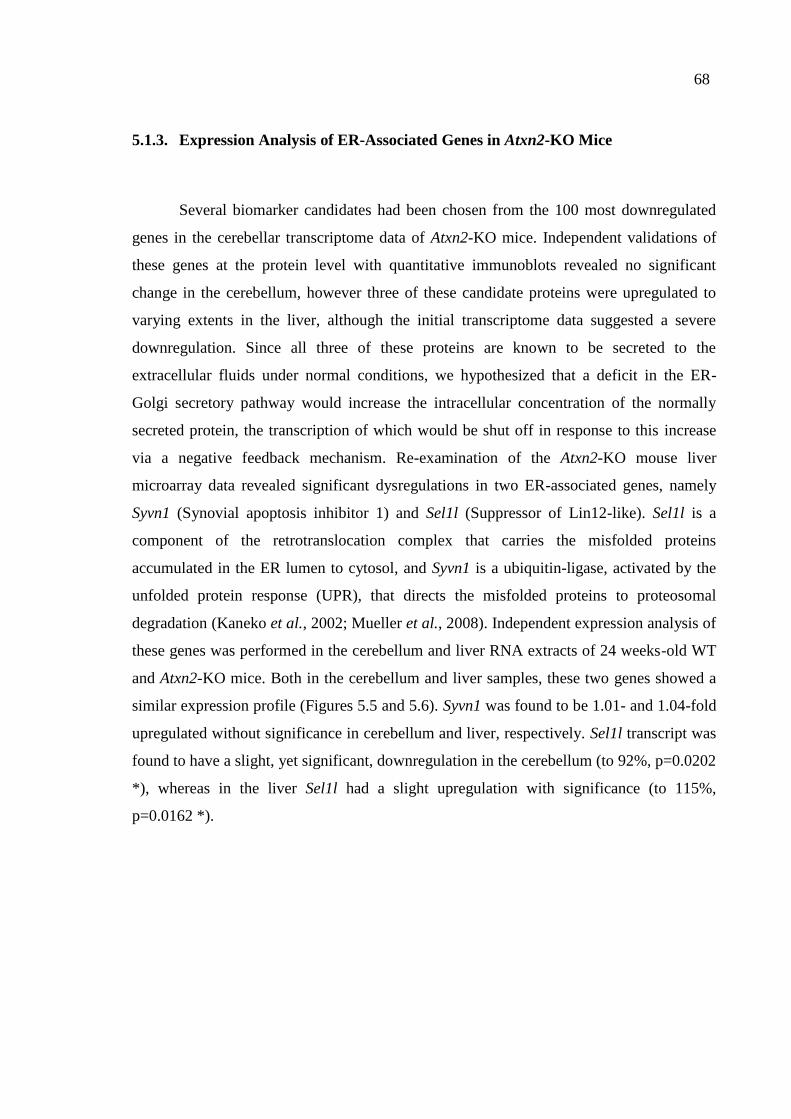
68
5.1.3. Expression Analysis of ER-Associated Genes in Atxn2-KO Mice
Several biomarker candidates had been chosen from the 100 most downregulated
genes in the cerebellar transcriptome data of Atxn2-KO mice. Independent validations of
these genes at the protein level with quantitative immunoblots revealed no significant
change in the cerebellum, however three of these candidate proteins were upregulated to
varying extents in the liver, although the initial transcriptome data suggested a severe
downregulation. Since all three of these proteins are known to be secreted to the
extracellular fluids under normal conditions, we hypothesized that a deficit in the ER-
Golgi secretory pathway would increase the intracellular concentration of the normally
secreted protein, the transcription of which would be shut off in response to this increase
via a negative feedback mechanism. Re-examination of the Atxn2-KO mouse liver
microarray data revealed significant dysregulations in two ER-associated genes, namely
Syvn1 (Synovial apoptosis inhibitor 1) and Sel1l (Suppressor of Lin12-like). Sel1l is a
component of the retrotranslocation complex that carries the misfolded proteins
accumulated in the ER lumen to cytosol, and Syvn1 is a ubiquitin-ligase, activated by the
unfolded protein response (UPR), that directs the misfolded proteins to proteosomal
degradation (Kaneko et al., 2002; Mueller et al., 2008). Independent expression analysis of
these genes was performed in the cerebellum and liver RNA extracts of 24 weeks-old WT
and Atxn2-KO mice. Both in the cerebellum and liver samples, these two genes showed a
similar expression profile (Figures 5.5 and 5.6). Syvn1 was found to be 1.01- and 1.04-fold
upregulated without significance in cerebellum and liver, respectively. Sel1l transcript was
found to have a slight, yet significant, downregulation in the cerebellum (to 92%, p=0.0202
*), whereas in the liver Sel1l had a slight upregulation with significance (to 115%,
p=0.0162 *).
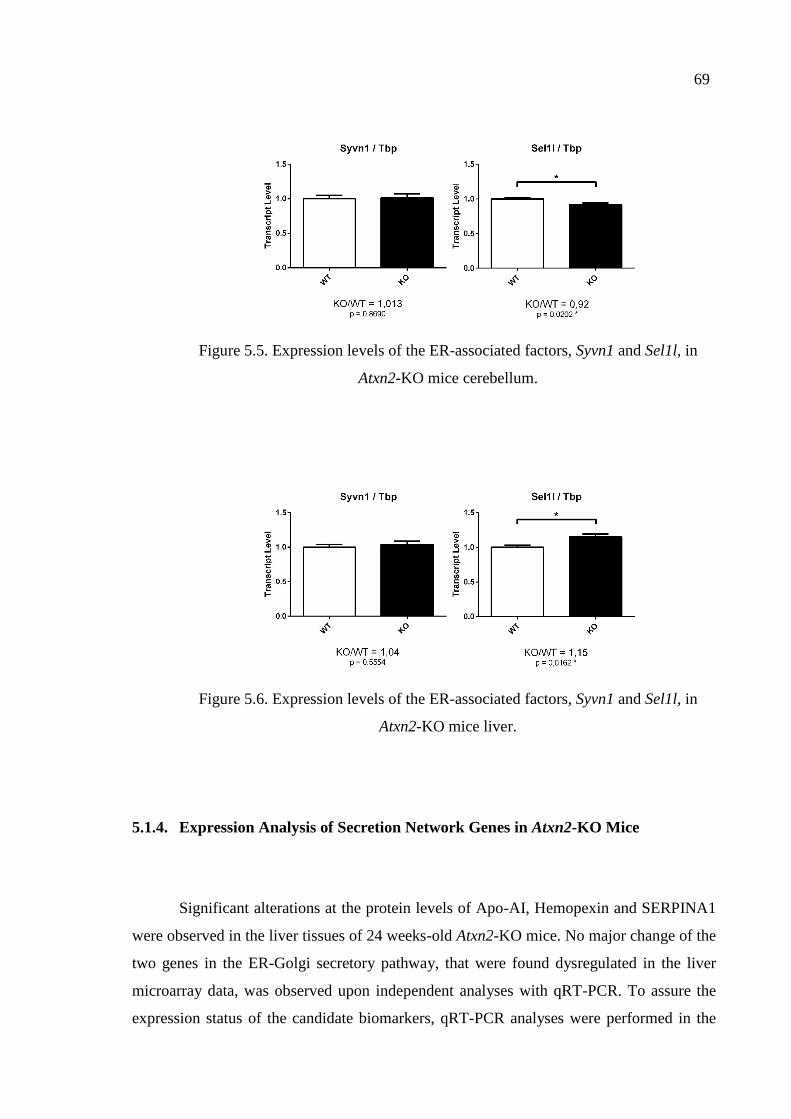
69
Figure 5.5. Expression levels of the ER-associated factors, Syvn1 and Sel1l, in
Atxn2-KO mice cerebellum.
Figure 5.6. Expression levels of the ER-associated factors, Syvn1 and Sel1l, in
Atxn2-KO mice liver.
5.1.4. Expression Analysis of Secretion Network Genes in Atxn2-KO Mice
Significant alterations at the protein levels of Apo-AI, Hemopexin and SERPINA1
were observed in the liver tissues of 24 weeks-old Atxn2-KO mice. No major change of the
two genes in the ER-Golgi secretory pathway, that were found dysregulated in the liver
microarray data, was observed upon independent analyses with qRT-PCR. To assure the
expression status of the candidate biomarkers, qRT-PCR analyses were performed in the
70
cerebellum and liver tissues of WT and Atxn2-KO mice with the relevant Taqman probes.
Successful knock-out of Atxn2 gene was assessed in both tissues (Figures 5.7 and 5.8).
Curiously, Hpx levels were found significantly upregulated in both tissues (Cerebellum:
1.27-fold, p=0.0493 *, Liver: 1.45-fold, p=0.0013 **). Apoa1 levels were also slightly
upregulated in both tissues without significance (Cerebellum: 1.11-fold, p=0.6317, Liver:
1.10-fold, p=0.1359). There are six isoforms of Serpina1 gene in mouse, among which
Serpina1a, Serpina1b and Serpina1c were significantly dysregulated in the high-
throughput transcriptome data. There was a commercially available Taqman probe
designed to measure Serpina1a levels. However, two other available Taqman probes
covered Serpina1a and Serpina1c together, and Serpina1a, Serpina1b and Serpina1c
together. Expression analyses of the Serpina1 genes were performed with all three Taqman
probes in cerebellum and liver tissues (Figures 5.7 and 5.8). In the cerebellum, Serpina1a
alone showed a 1.65-fold increase without significance, whereas the degree of the
upregulation fell to 1.39-fold when Serpina1a and Serpina1c were quantified together. In
the quantification of Serpina1a, Serpina1b and Serpina1c all together, a non-significant
1% downregulation was observed between the WT and Atxn2-KO mice cerebellum (Figure
5.7). On the contrary, while Serpina1a alone in the liver showed a 1% downregulation,
quantification of Serpina1a and Serpina1c together presented a 1.06-fold upregulation
without significance. The total transcript levels of all three isoforms in the liver
interestingly showed a significant 1.13-fold upregulation as shown in Figure 5.8 (p=0.0085
**).
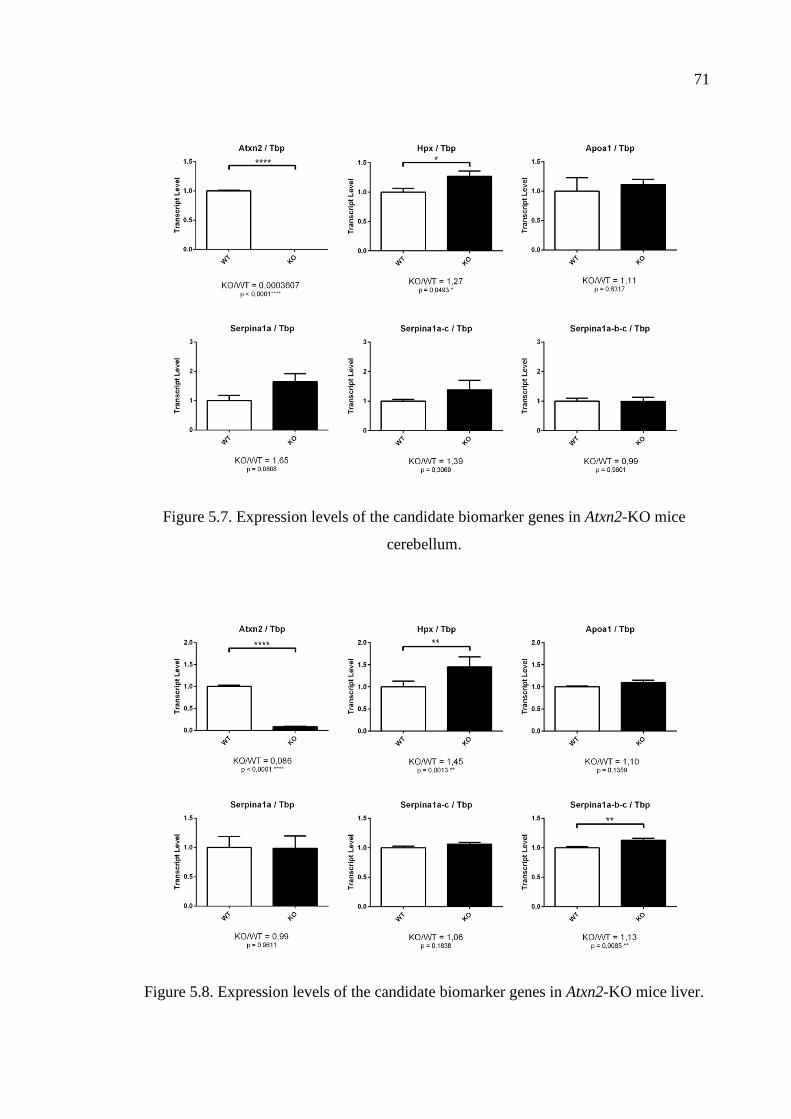
71
Figure 5.7. Expression levels of the candidate biomarker genes in Atxn2-KO mice
cerebellum.
Figure 5.8. Expression levels of the candidate biomarker genes in Atxn2-KO mice liver.
72
5.2. Identification of Blood Biomarkers in SCA2 Patients
5.2.1. Genotypes of the SCA2 Pedigree
In order to determine the number of CAG repeats in the ATXN2 gene of the blood donors
from the large SCA2 pedigree living in Balıkesir, Turkey (Figure 5.9), also to assess the
purity of the repeat regions (absence of CAA interruptions), fragment length analysis
(RefGen, Ankara) and Sanger sequencing (Macrogen, Europe) were performed following
the amplification of the repeat region by conventional PCR. Five individuals already
presenting SCA2 symptoms at the time of sample collection were found to carry an
expanded allele varying between 39-44 repeats (Table 5.2). Another individual in the
family, with no disease manifestation yet, was found to carry a long-intermediate allele
with 32 repeats. Rest of the non-symptomatic family members were found negative for an
expanded ATXN2 allele. All the normal-length alleles in the family were interrupted at
least once with a CAA triplet. The expanded alleles, in contrast, consisted of pure CAG
repeats, a characteristic feature exclusive to SCA2. Therefore, the individual with pure 32
CAG repeats in this family was grouped with ‘patients’ in the up-coming analyses, in line
with the scope of this study, which investigates the basis of pathogenicity caused by
ATXN2 expansions.
Anticipation, which is another characteristic feature of SCA2, is also observed
within this family. Individual #3, carrying an expanded allele with 40 repeats, transmitted
this allele to his offspring with 44 repeats (individuals #6 and #7). The offspring show an
earlier manifestation of the disease with a faster progression.
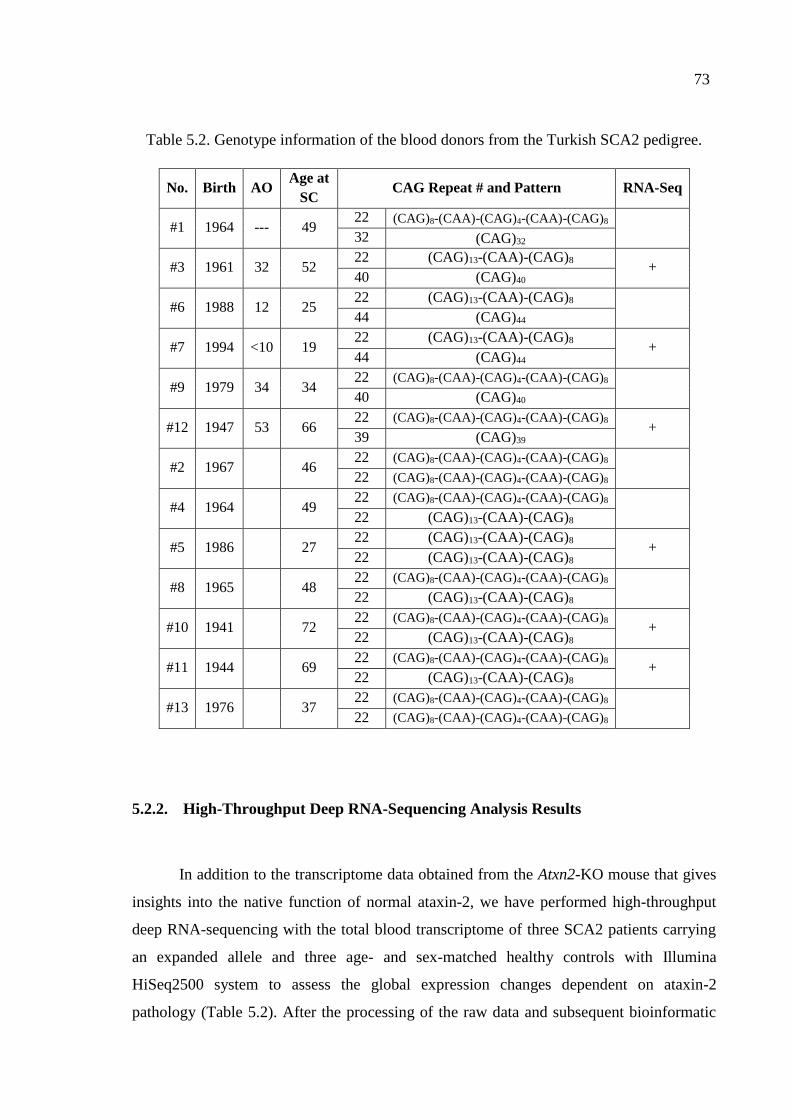
73
Table 5.2. Genotype information of the blood donors from the Turkish SCA2 pedigree.
No. Birth AO Age at
SC CAG Repeat # and Pattern RNA-Seq
#1 1964 --- 49 22 (CAG)8-(CAA)-(CAG)4-(CAA)-(CAG)8
32 (CAG)32
#3 1961 32 52 22 (CAG)13-(CAA)-(CAG)8
+ 40 (CAG)40
#6 1988 12 25 22 (CAG)13-(CAA)-(CAG)8
44 (CAG)44
#7 1994 <10 19 22 (CAG)13-(CAA)-(CAG)8
+ 44 (CAG)44
#9 1979 34 34 22 (CAG)8-(CAA)-(CAG)4-(CAA)-(CAG)8
40 (CAG)40
#12 1947 53 66 22 (CAG)8-(CAA)-(CAG)4-(CAA)-(CAG)8
+ 39 (CAG)39
#2 1967 46 22 (CAG)8-(CAA)-(CAG)4-(CAA)-(CAG)8
22 (CAG)8-(CAA)-(CAG)4-(CAA)-(CAG)8
#4 1964 49 22 (CAG)8-(CAA)-(CAG)4-(CAA)-(CAG)8
22 (CAG)13-(CAA)-(CAG)8
#5 1986 27 22 (CAG)13-(CAA)-(CAG)8
+ 22 (CAG)13-(CAA)-(CAG)8
#8 1965 48 22 (CAG)8-(CAA)-(CAG)4-(CAA)-(CAG)8
22 (CAG)13-(CAA)-(CAG)8
#10 1941 72 22 (CAG)8-(CAA)-(CAG)4-(CAA)-(CAG)8
+ 22 (CAG)13-(CAA)-(CAG)8
#11 1944 69 22 (CAG)8-(CAA)-(CAG)4-(CAA)-(CAG)8
+ 22 (CAG)13-(CAA)-(CAG)8
#13 1976 37 22 (CAG)8-(CAA)-(CAG)4-(CAA)-(CAG)8
22 (CAG)8-(CAA)-(CAG)4-(CAA)-(CAG)8
5.2.2. High-Throughput Deep RNA-Sequencing Analysis Results
In addition to the transcriptome data obtained from the Atxn2-KO mouse that gives
insights into the native function of normal ataxin-2, we have performed high-throughput
deep RNA-sequencing with the total blood transcriptome of three SCA2 patients carrying
an expanded allele and three age- and sex-matched healthy controls with Illumina
HiSeq2500 system to assess the global expression changes dependent on ataxin-2
pathology (Table 5.2). After the processing of the raw data and subsequent bioinformatic
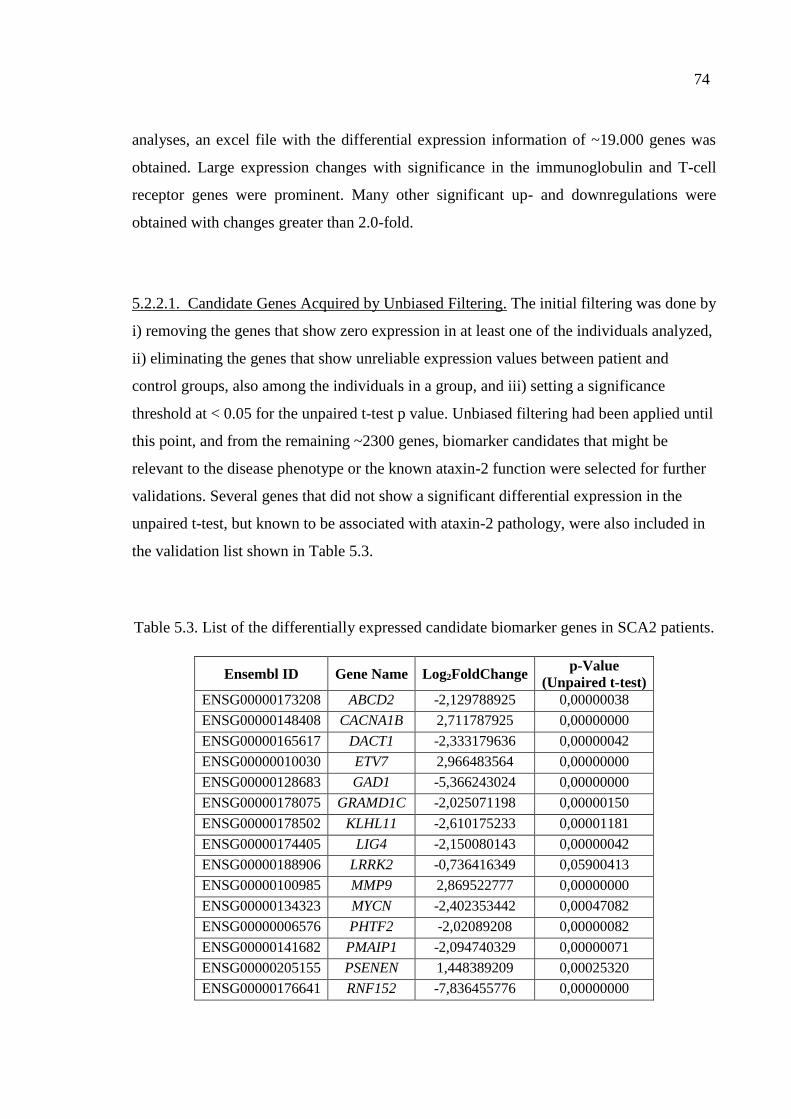
74
analyses, an excel file with the differential expression information of ~19.000 genes was
obtained. Large expression changes with significance in the immunoglobulin and T-cell
receptor genes were prominent. Many other significant up- and downregulations were
obtained with changes greater than 2.0-fold.
5.2.2.1. Candidate Genes Acquired by Unbiased Filtering. The initial filtering was done by
i) removing the genes that show zero expression in at least one of the individuals analyzed,
ii) eliminating the genes that show unreliable expression values between patient and
control groups, also among the individuals in a group, and iii) setting a significance
threshold at < 0.05 for the unpaired t-test p value. Unbiased filtering had been applied until
this point, and from the remaining ~2300 genes, biomarker candidates that might be
relevant to the disease phenotype or the known ataxin-2 function were selected for further
validations. Several genes that did not show a significant differential expression in the
unpaired t-test, but known to be associated with ataxin-2 pathology, were also included in
the validation list shown in Table 5.3.
Table 5.3. List of the differentially expressed candidate biomarker genes in SCA2 patients.
Ensembl ID Gene Name Log2FoldChange p-Value
(Unpaired t-test)
ENSG00000173208 ABCD2 -2,129788925 0,00000038
ENSG00000148408 CACNA1B 2,711787925 0,00000000
ENSG00000165617 DACT1 -2,333179636 0,00000042
ENSG00000010030 ETV7 2,966483564 0,00000000
ENSG00000128683 GAD1 -5,366243024 0,00000000
ENSG00000178075 GRAMD1C -2,025071198 0,00000150
ENSG00000178502 KLHL11 -2,610175233 0,00001181
ENSG00000174405 LIG4 -2,150080143 0,00000042
ENSG00000188906 LRRK2 -0,736416349 0,05900413
ENSG00000100985 MMP9 2,869522777 0,00000000
ENSG00000134323 MYCN -2,402353442 0,00047082
ENSG00000006576 PHTF2 -2,02089208 0,00000082
ENSG00000141682 PMAIP1 -2,094740329 0,00000071
ENSG00000205155 PSENEN 1,448389209 0,00025320
ENSG00000176641 RNF152 -7,836455776 0,00000000
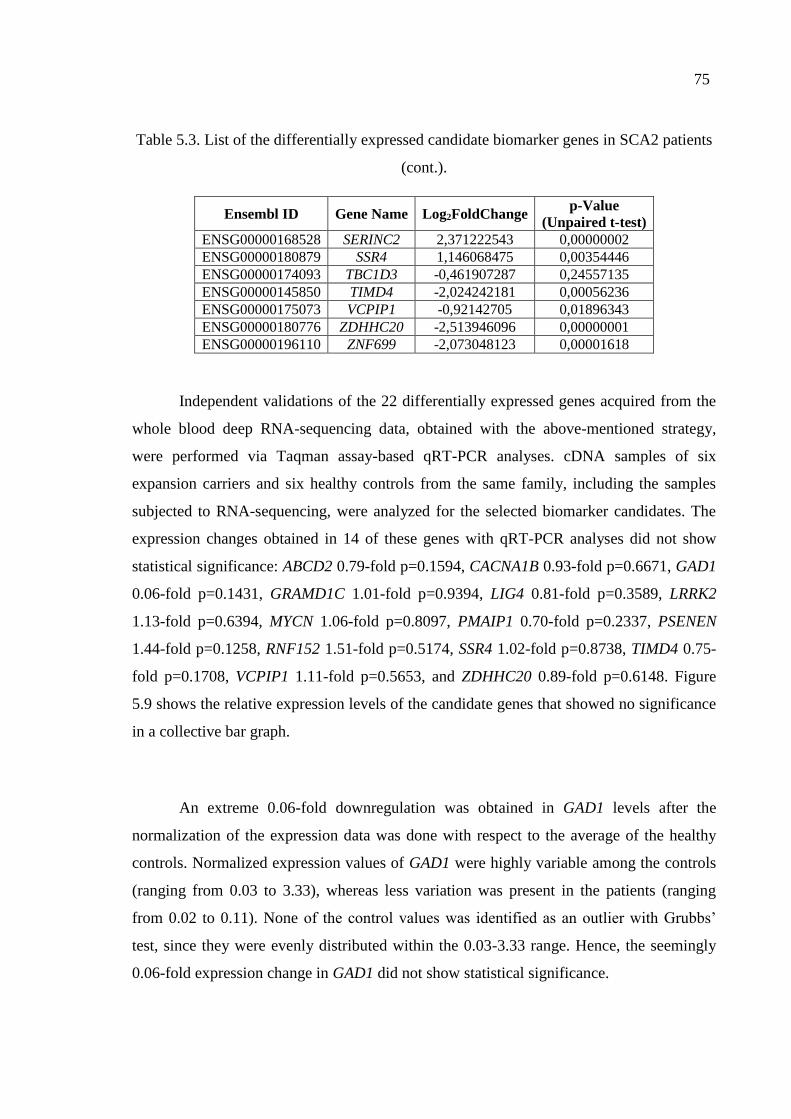
75
Table 5.3. List of the differentially expressed candidate biomarker genes in SCA2 patients
(cont.).
Ensembl ID Gene Name Log2FoldChange p-Value
(Unpaired t-test)
ENSG00000168528 SERINC2 2,371222543 0,00000002
ENSG00000180879 SSR4 1,146068475 0,00354446
ENSG00000174093 TBC1D3 -0,461907287 0,24557135
ENSG00000145850 TIMD4 -2,024242181 0,00056236
ENSG00000175073 VCPIP1 -0,92142705 0,01896343
ENSG00000180776 ZDHHC20 -2,513946096 0,00000001
ENSG00000196110 ZNF699 -2,073048123 0,00001618
Independent validations of the 22 differentially expressed genes acquired from the
whole blood deep RNA-sequencing data, obtained with the above-mentioned strategy,
were performed via Taqman assay-based qRT-PCR analyses. cDNA samples of six
expansion carriers and six healthy controls from the same family, including the samples
subjected to RNA-sequencing, were analyzed for the selected biomarker candidates. The
expression changes obtained in 14 of these genes with qRT-PCR analyses did not show
statistical significance: ABCD2 0.79-fold p=0.1594, CACNA1B 0.93-fold p=0.6671, GAD1
0.06-fold p=0.1431, GRAMD1C 1.01-fold p=0.9394, LIG4 0.81-fold p=0.3589, LRRK2
1.13-fold p=0.6394, MYCN 1.06-fold p=0.8097, PMAIP1 0.70-fold p=0.2337, PSENEN
1.44-fold p=0.1258, RNF152 1.51-fold p=0.5174, SSR4 1.02-fold p=0.8738, TIMD4 0.75-
fold p=0.1708, VCPIP1 1.11-fold p=0.5653, and ZDHHC20 0.89-fold p=0.6148. Figure
5.9 shows the relative expression levels of the candidate genes that showed no significance
in a collective bar graph.
An extreme 0.06-fold downregulation was obtained in GAD1 levels after the
normalization of the expression data was done with respect to the average of the healthy
controls. Normalized expression values of GAD1 were highly variable among the controls
(ranging from 0.03 to 3.33), whereas less variation was present in the patients (ranging
from 0.02 to 0.11). None of the control values was identified as an outlier with Grubbs’
test, since they were evenly distributed within the 0.03-3.33 range. Hence, the seemingly
0.06-fold expression change in GAD1 did not show statistical significance.
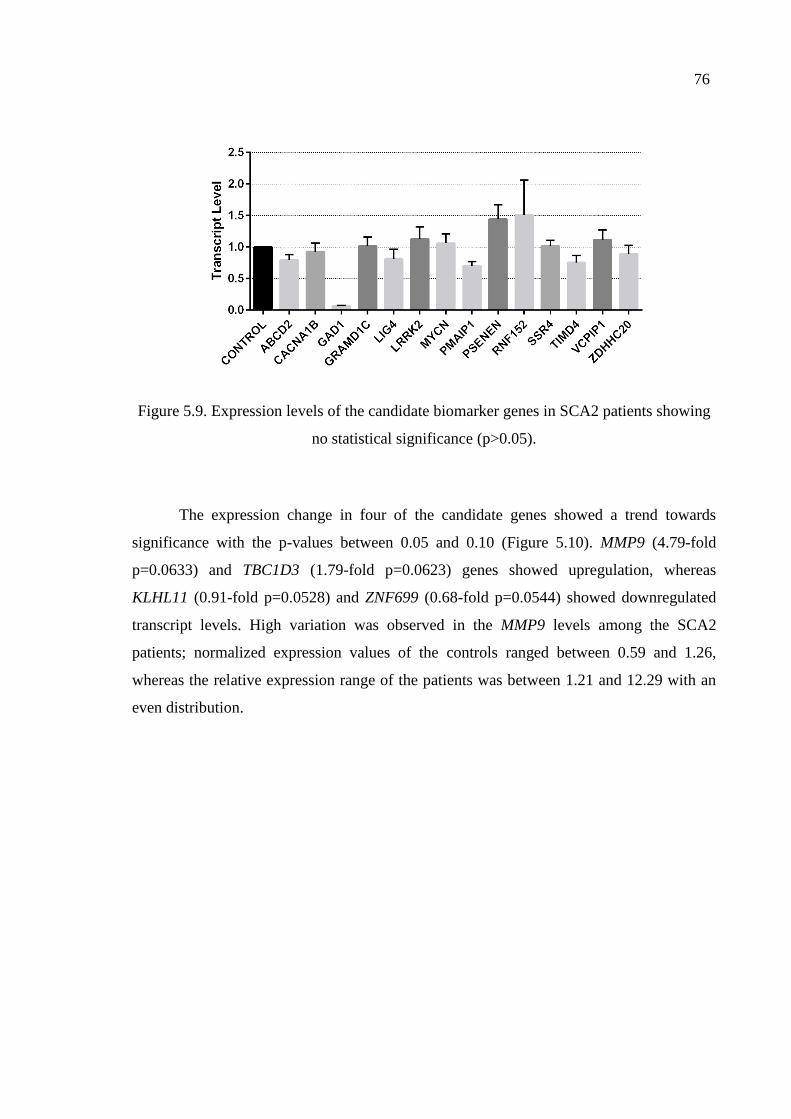
76
Figure 5.9. Expression levels of the candidate biomarker genes in SCA2 patients showing
no statistical significance (p>0.05).
The expression change in four of the candidate genes showed a trend towards
significance with the p-values between 0.05 and 0.10 (Figure 5.10). MMP9 (4.79-fold
p=0.0633) and TBC1D3 (1.79-fold p=0.0623) genes showed upregulation, whereas
KLHL11 (0.91-fold p=0.0528) and ZNF699 (0.68-fold p=0.0544) showed downregulated
transcript levels. High variation was observed in the MMP9 levels among the SCA2
patients; normalized expression values of the controls ranged between 0.59 and 1.26,
whereas the relative expression range of the patients was between 1.21 and 12.29 with an
even distribution.
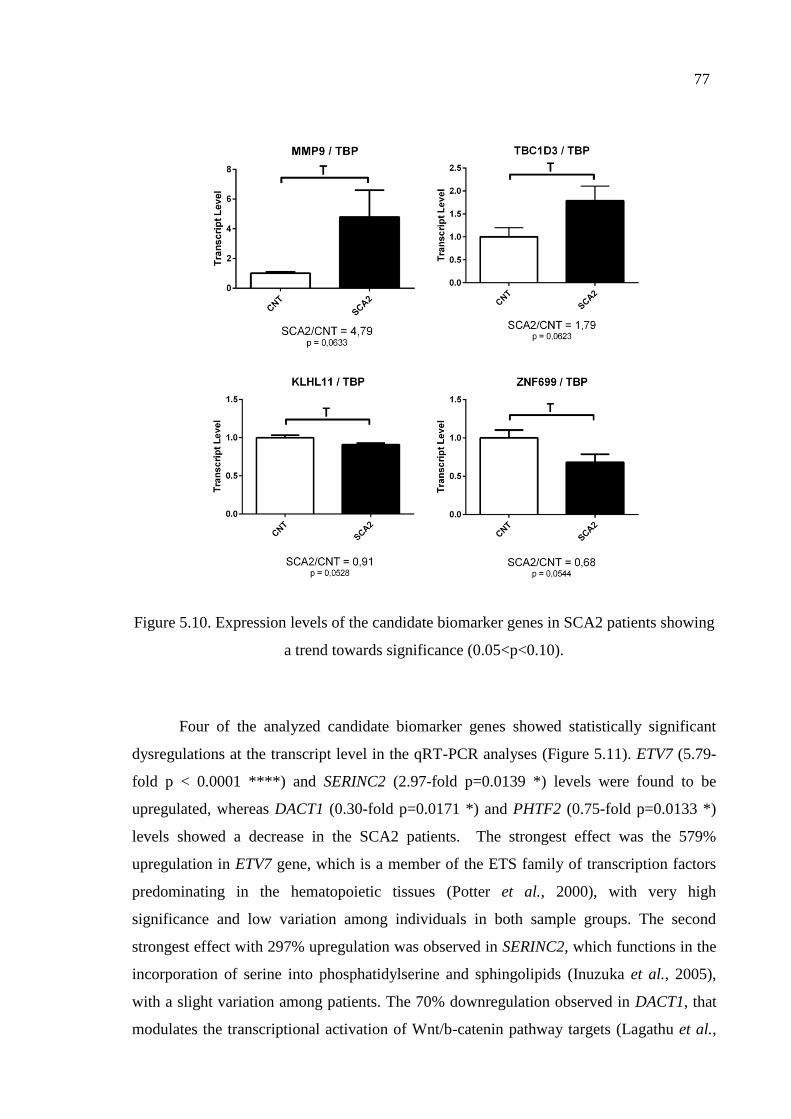
77
Figure 5.10. Expression levels of the candidate biomarker genes in SCA2 patients showing
a trend towards significance (0.05<p<0.10).
Four of the analyzed candidate biomarker genes showed statistically significant
dysregulations at the transcript level in the qRT-PCR analyses (Figure 5.11). ETV7 (5.79-
fold p < 0.0001 ****) and SERINC2 (2.97-fold p=0.0139 *) levels were found to be
upregulated, whereas DACT1 (0.30-fold p=0.0171 *) and PHTF2 (0.75-fold p=0.0133 *)
levels showed a decrease in the SCA2 patients. The strongest effect was the 579%
upregulation in ETV7 gene, which is a member of the ETS family of transcription factors
predominating in the hematopoietic tissues (Potter et al., 2000), with very high
significance and low variation among individuals in both sample groups. The second
strongest effect with 297% upregulation was observed in SERINC2, which functions in the
incorporation of serine into phosphatidylserine and sphingolipids (Inuzuka et al., 2005),
with a slight variation among patients. The 70% downregulation observed in DACT1, that
modulates the transcriptional activation of Wnt/b-catenin pathway targets (Lagathu et al.,
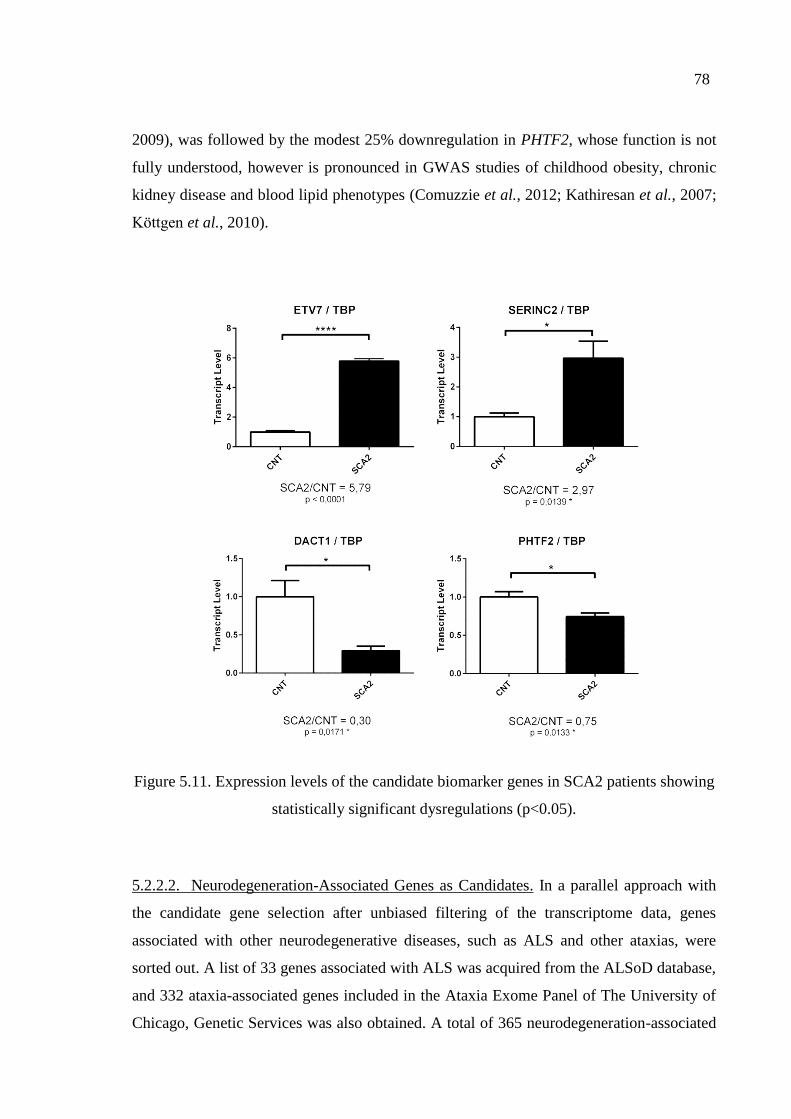
78
2009), was followed by the modest 25% downregulation in PHTF2, whose function is not
fully understood, however is pronounced in GWAS studies of childhood obesity, chronic
kidney disease and blood lipid phenotypes (Comuzzie et al., 2012; Kathiresan et al., 2007;
Köttgen et al., 2010).
Figure 5.11. Expression levels of the candidate biomarker genes in SCA2 patients showing
statistically significant dysregulations (p<0.05).
5.2.2.2. Neurodegeneration-Associated Genes as Candidates. In a parallel approach with
the candidate gene selection after unbiased filtering of the transcriptome data, genes
associated with other neurodegenerative diseases, such as ALS and other ataxias, were
sorted out. A list of 33 genes associated with ALS was acquired from the ALSoD database,
and 332 ataxia-associated genes included in the Ataxia Exome Panel of The University of
Chicago, Genetic Services was also obtained. A total of 365 neurodegeneration-associated
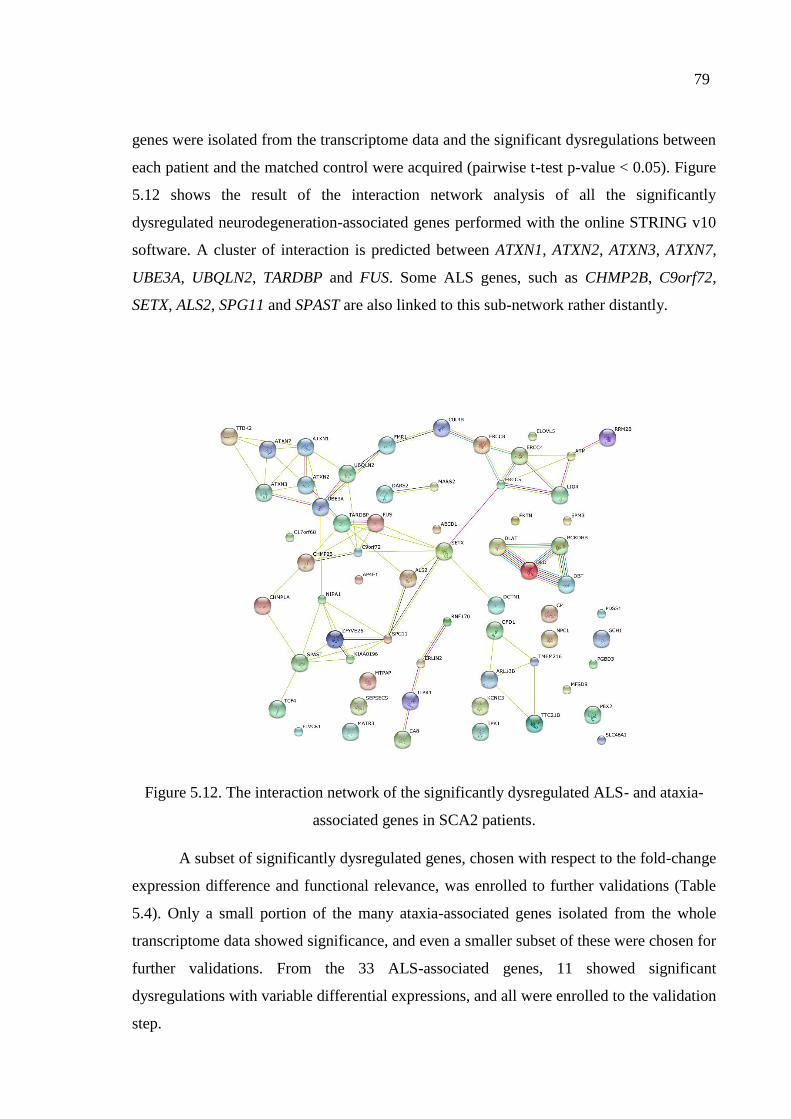
79
genes were isolated from the transcriptome data and the significant dysregulations between
each patient and the matched control were acquired (pairwise t-test p-value < 0.05). Figure
5.12 shows the result of the interaction network analysis of all the significantly
dysregulated neurodegeneration-associated genes performed with the online STRING v10
software. A cluster of interaction is predicted between ATXN1, ATXN2, ATXN3, ATXN7,
UBE3A, UBQLN2, TARDBP and FUS. Some ALS genes, such as CHMP2B, C9orf72,
SETX, ALS2, SPG11 and SPAST are also linked to this sub-network rather distantly.
Figure 5.12. The interaction network of the significantly dysregulated ALS- and ataxia-
associated genes in SCA2 patients.
A subset of significantly dysregulated genes, chosen with respect to the fold-change
expression difference and functional relevance, was enrolled to further validations (Table
5.4). Only a small portion of the many ataxia-associated genes isolated from the whole
transcriptome data showed significance, and even a smaller subset of these were chosen for
further validations. From the 33 ALS-associated genes, 11 showed significant
dysregulations with variable differential expressions, and all were enrolled to the validation
step.
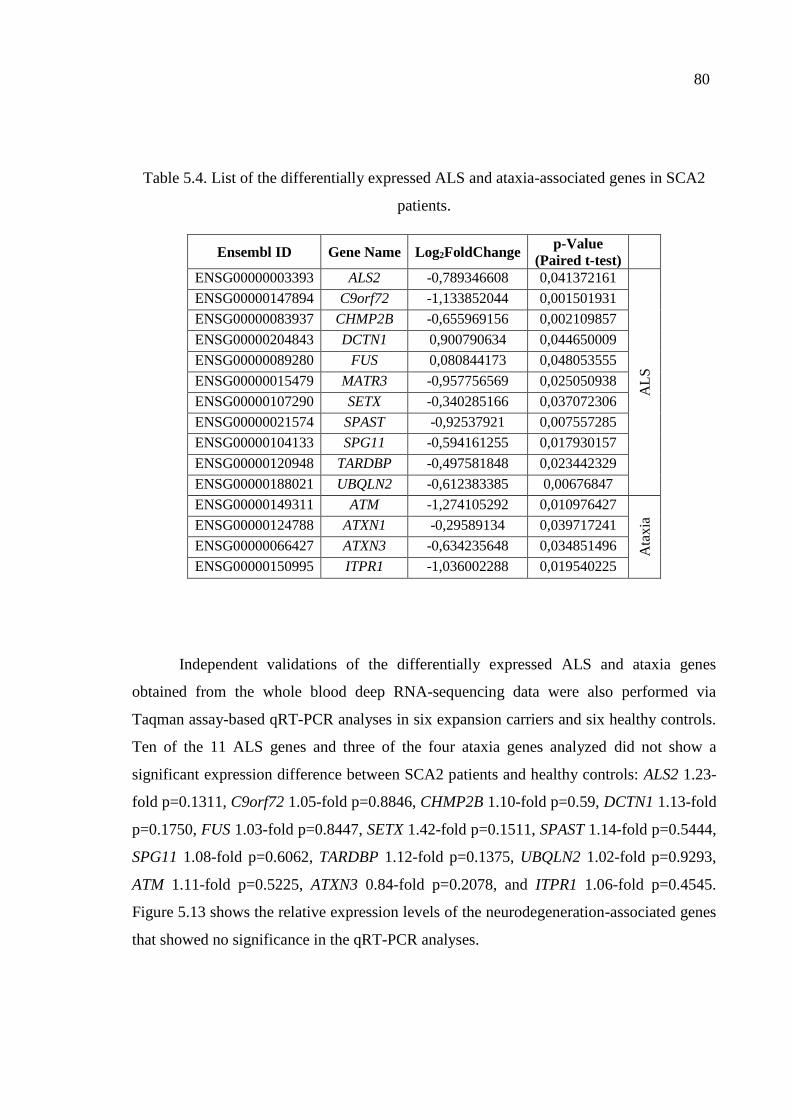
80
Table 5.4. List of the differentially expressed ALS and ataxia-associated genes in SCA2
patients.
Ensembl ID Gene Name Log2FoldChange p-Value
(Paired t-test)
ENSG00000003393 ALS2 -0,789346608 0,041372161
AL
S
ENSG00000147894 C9orf72 -1,133852044 0,001501931
ENSG00000083937 CHMP2B -0,655969156 0,002109857
ENSG00000204843 DCTN1 0,900790634 0,044650009
ENSG00000089280 FUS 0,080844173 0,048053555
ENSG00000015479 MATR3 -0,957756569 0,025050938
ENSG00000107290 SETX -0,340285166 0,037072306
ENSG00000021574 SPAST -0,92537921 0,007557285
ENSG00000104133 SPG11 -0,594161255 0,017930157
ENSG00000120948 TARDBP -0,497581848 0,023442329
ENSG00000188021 UBQLN2 -0,612383385 0,00676847
ENSG00000149311 ATM -1,274105292 0,010976427
Ata
xia
ENSG00000124788 ATXN1 -0,29589134 0,039717241
ENSG00000066427 ATXN3 -0,634235648 0,034851496
ENSG00000150995 ITPR1 -1,036002288 0,019540225
Independent validations of the differentially expressed ALS and ataxia genes
obtained from the whole blood deep RNA-sequencing data were also performed via
Taqman assay-based qRT-PCR analyses in six expansion carriers and six healthy controls.
Ten of the 11 ALS genes and three of the four ataxia genes analyzed did not show a
significant expression difference between SCA2 patients and healthy controls: ALS2 1.23-
fold p=0.1311, C9orf72 1.05-fold p=0.8846, CHMP2B 1.10-fold p=0.59, DCTN1 1.13-fold
p=0.1750, FUS 1.03-fold p=0.8447, SETX 1.42-fold p=0.1511, SPAST 1.14-fold p=0.5444,
SPG11 1.08-fold p=0.6062, TARDBP 1.12-fold p=0.1375, UBQLN2 1.02-fold p=0.9293,
ATM 1.11-fold p=0.5225, ATXN3 0.84-fold p=0.2078, and ITPR1 1.06-fold p=0.4545.
Figure 5.13 shows the relative expression levels of the neurodegeneration-associated genes
that showed no significance in the qRT-PCR analyses.
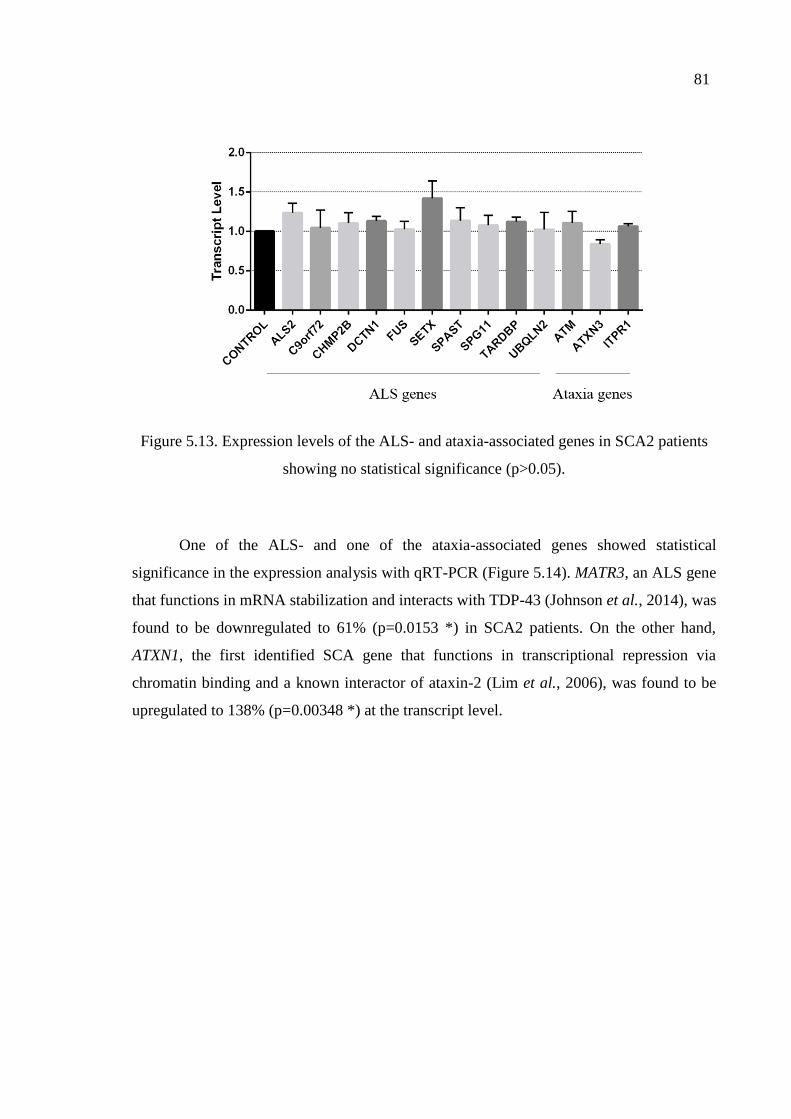
81
Figure 5.13. Expression levels of the ALS- and ataxia-associated genes in SCA2 patients
showing no statistical significance (p>0.05).
One of the ALS- and one of the ataxia-associated genes showed statistical
significance in the expression analysis with qRT-PCR (Figure 5.14). MATR3, an ALS gene
that functions in mRNA stabilization and interacts with TDP-43 (Johnson et al., 2014), was
found to be downregulated to 61% (p=0.0153 *) in SCA2 patients. On the other hand,
ATXN1, the first identified SCA gene that functions in transcriptional repression via
chromatin binding and a known interactor of ataxin-2 (Lim et al., 2006), was found to be
upregulated to 138% (p=0.00348 *) at the transcript level.
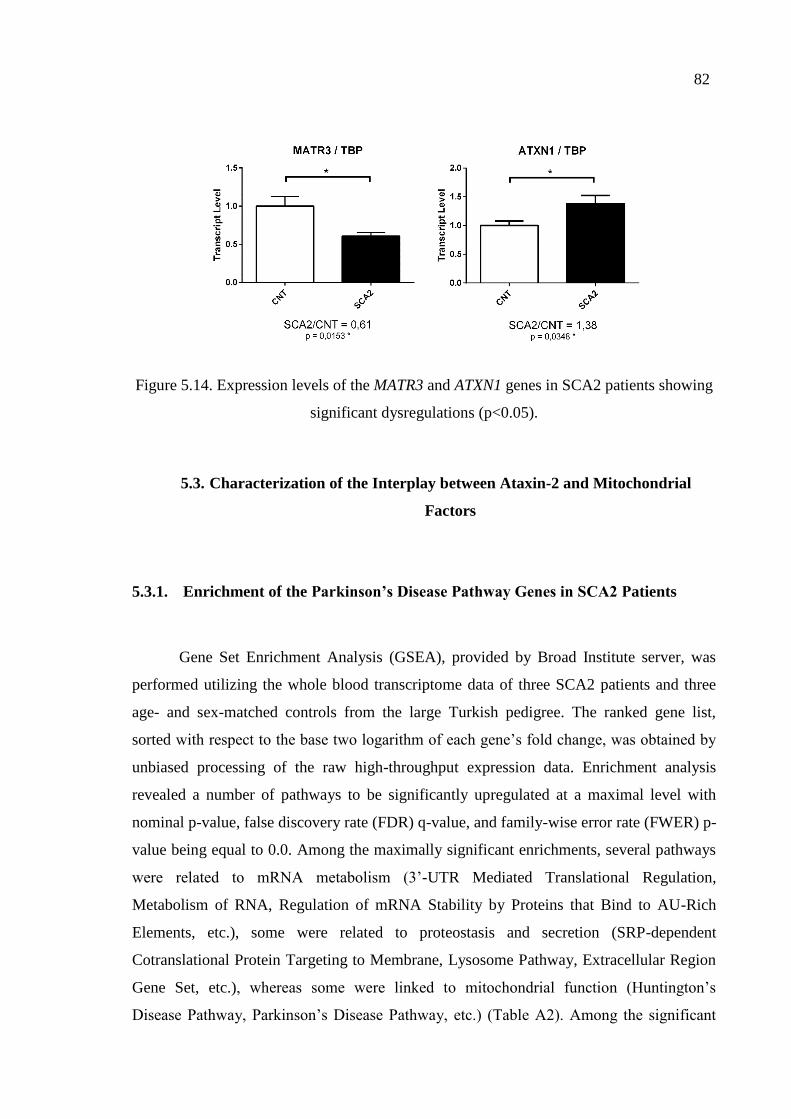
82
Figure 5.14. Expression levels of the MATR3 and ATXN1 genes in SCA2 patients showing
significant dysregulations (p<0.05).
5.3. Characterization of the Interplay between Ataxin-2 and Mitochondrial
Factors
5.3.1. Enrichment of the Parkinson’s Disease Pathway Genes in SCA2 Patients
Gene Set Enrichment Analysis (GSEA), provided by Broad Institute server, was
performed utilizing the whole blood transcriptome data of three SCA2 patients and three
age- and sex-matched controls from the large Turkish pedigree. The ranked gene list,
sorted with respect to the base two logarithm of each gene’s fold change, was obtained by
unbiased processing of the raw high-throughput expression data. Enrichment analysis
revealed a number of pathways to be significantly upregulated at a maximal level with
nominal p-value, false discovery rate (FDR) q-value, and family-wise error rate (FWER) p-
value being equal to 0.0. Among the maximally significant enrichments, several pathways
were related to mRNA metabolism (3’-UTR Mediated Translational Regulation,
Metabolism of RNA, Regulation of mRNA Stability by Proteins that Bind to AU-Rich
Elements, etc.), some were related to proteostasis and secretion (SRP-dependent
Cotranslational Protein Targeting to Membrane, Lysosome Pathway, Extracellular Region
Gene Set, etc.), whereas some were linked to mitochondrial function (Huntington’s
Disease Pathway, Parkinson’s Disease Pathway, etc.) (Table A2). Among the significant
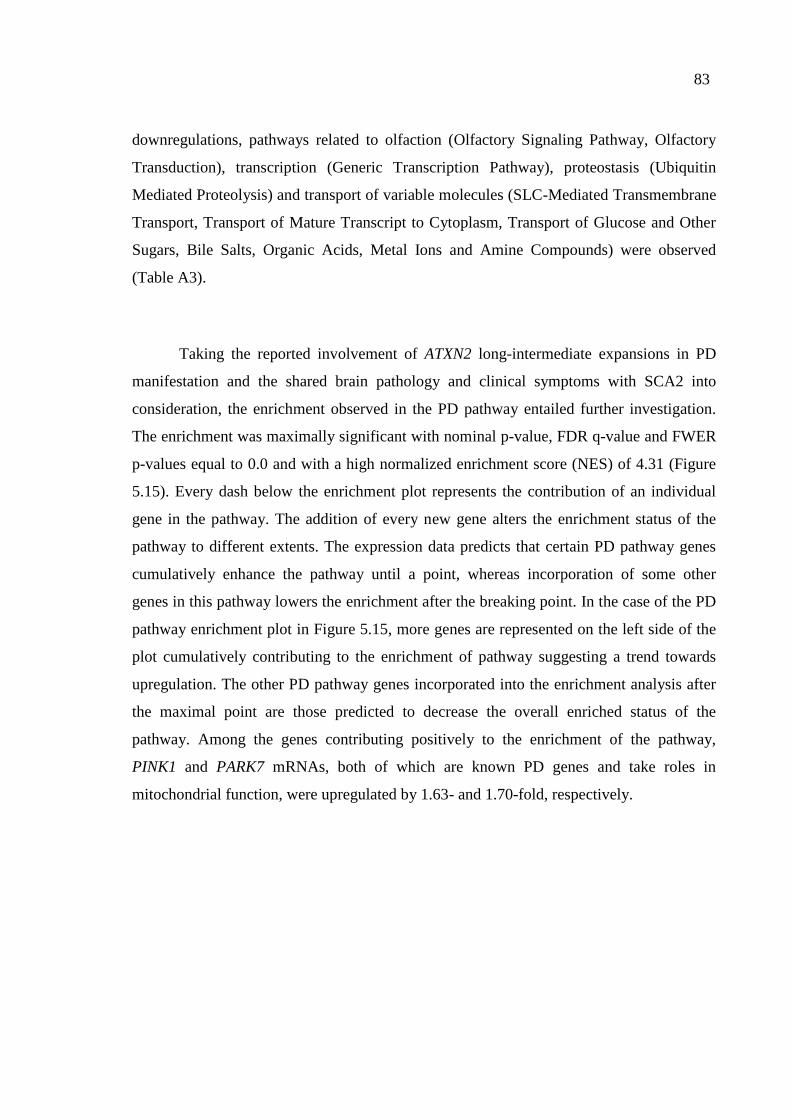
83
downregulations, pathways related to olfaction (Olfactory Signaling Pathway, Olfactory
Transduction), transcription (Generic Transcription Pathway), proteostasis (Ubiquitin
Mediated Proteolysis) and transport of variable molecules (SLC-Mediated Transmembrane
Transport, Transport of Mature Transcript to Cytoplasm, Transport of Glucose and Other
Sugars, Bile Salts, Organic Acids, Metal Ions and Amine Compounds) were observed
(Table A3).
Taking the reported involvement of ATXN2 long-intermediate expansions in PD
manifestation and the shared brain pathology and clinical symptoms with SCA2 into
consideration, the enrichment observed in the PD pathway entailed further investigation.
The enrichment was maximally significant with nominal p-value, FDR q-value and FWER
p-values equal to 0.0 and with a high normalized enrichment score (NES) of 4.31 (Figure
5.15). Every dash below the enrichment plot represents the contribution of an individual
gene in the pathway. The addition of every new gene alters the enrichment status of the
pathway to different extents. The expression data predicts that certain PD pathway genes
cumulatively enhance the pathway until a point, whereas incorporation of some other
genes in this pathway lowers the enrichment after the breaking point. In the case of the PD
pathway enrichment plot in Figure 5.15, more genes are represented on the left side of the
plot cumulatively contributing to the enrichment of pathway suggesting a trend towards
upregulation. The other PD pathway genes incorporated into the enrichment analysis after
the maximal point are those predicted to decrease the overall enriched status of the
pathway. Among the genes contributing positively to the enrichment of the pathway,
PINK1 and PARK7 mRNAs, both of which are known PD genes and take roles in
mitochondrial function, were upregulated by 1.63- and 1.70-fold, respectively.
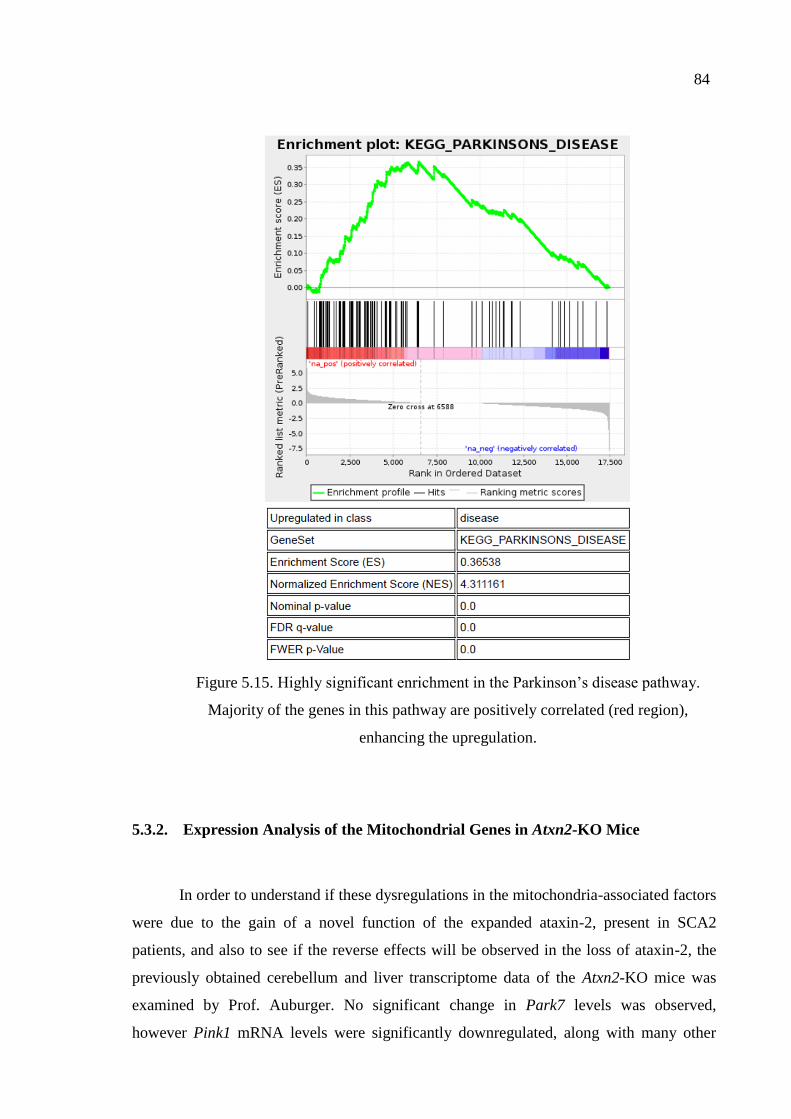
84
Figure 5.15. Highly significant enrichment in the Parkinson’s disease pathway.
Majority of the genes in this pathway are positively correlated (red region),
enhancing the upregulation.
5.3.2. Expression Analysis of the Mitochondrial Genes in Atxn2-KO Mice
In order to understand if these dysregulations in the mitochondria-associated factors
were due to the gain of a novel function of the expanded ataxin-2, present in SCA2
patients, and also to see if the reverse effects will be observed in the loss of ataxin-2, the
previously obtained cerebellum and liver transcriptome data of the Atxn2-KO mice was
examined by Prof. Auburger. No significant change in Park7 levels was observed,
however Pink1 mRNA levels were significantly downregulated, along with many other
85
mitochondria-associated genes, in both cerebellum and liver tissues. Independent
validations of a set of these genes in the six months-old WT and Atxn2-KO mice
cerebellum (15 WT vs. 10 KO) and liver (8 WT vs. 7 KO) via qRT-PCR analysis
confirmed the downregulation of Pink1 (to 87% in cerebellum with p<0.0001, to 63% in
liver with p<0.0001), Opa1 (to 86% in cerebellum with p<0.0001, to 57% in liver with
p<0.0001) and Ghitm (to 79% in cerebellum with p<0.0001, to 60% in liver with
p<0.0001) transcripts in both tissues (Figure 5.16) (performed by Bianca Scholz in Prof.
Auburger’s Lab in the Experimental Neurology Department of Goethe University
Hospital).
Figure 5.16. Significant downregulations of the mitochondrial genes in Atxn2-KO mice
cerebellum and liver (provided by Auburger Lab).
86
5.3.3. Expression Analysis of the Mitochondria- and Ataxin-2-Associated Genes in
ATXN2-KD SH-SY5Y Cells
The expression of PINK1 has been reported to be enhanced in a time-course
manner by nutrient deprivation in vitro (Klinkenberg et al., 2012). Upon upregulation in
response to starvation, PINK1 induces the selective consumption of the dysfunctional
mitochondria as a nutrient source (Jin and Youle, 2012). In order to elucidate the
relationship between ataxin-2 and PINK1, and to see if the time-course change in PINK1
levels upon starvation stress will be affected from the silencing of ATXN2, the expression
status of PINK1 and several other mitochondrial and ataxin-2-associated factors were
investigated over time in the context of nutrient-deprived SH-SY5Y neuroblastoma cells
stably transduced with ATXN2 or non-target (NT) shRNAs.
Expression analyses were performed after two, four, eight, 12, 16, 24, and 48 hours
of starvation using NT- and ATXN2-KD SH-SY5Y cells cultured in HBSS starvation
medium without the supplement of any other nutrients. The expression value of each gene
was normalized to HPRT1 levels, and expression values at all the time-points were
compared to the non-starved NT-KD cells cultured for two hours in RPMI+FCS general
culture medium.
Maintenance of the ATXN2 knock-down was confirmed with high significances at
all time-points (n=8 replicates). In the NT-KD cells, an immediate 1.5-fold induction of
ATXN2 expression is observed starting at two hours, reaching to the maximum 3.5-fold
change after 12 hours and clearing out gradually over the next 36 hours. A slight tendency
towards upregulation is also present in ATXN2-KD cells over time, which is suppressed by
the stably expressed shRNA constructs (Figure 5.17).
No significant change in the expression of PINK1 was observed throughout 48-hour
starvation between NT- and ATXN2-KD cells (n=8). Although no major dysregulation in
the transcript level emerged, the induction pattern of PINK1 greatly resembled that of
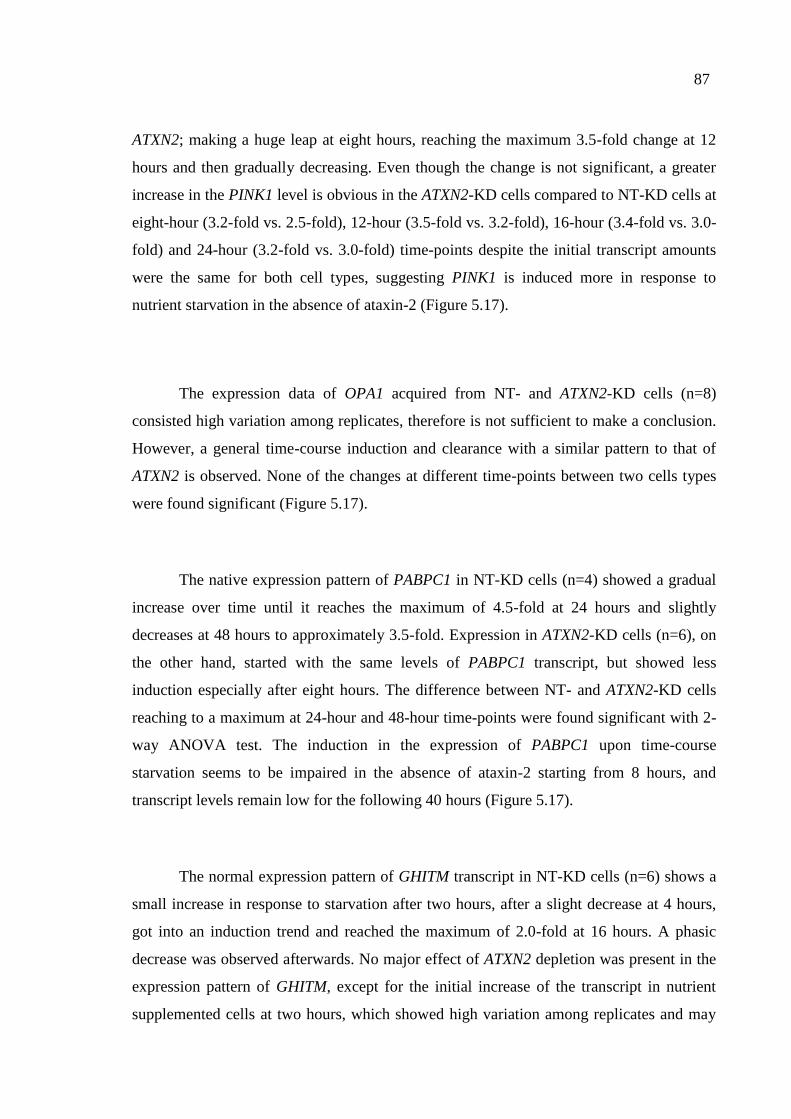
87
ATXN2; making a huge leap at eight hours, reaching the maximum 3.5-fold change at 12
hours and then gradually decreasing. Even though the change is not significant, a greater
increase in the PINK1 level is obvious in the ATXN2-KD cells compared to NT-KD cells at
eight-hour (3.2-fold vs. 2.5-fold), 12-hour (3.5-fold vs. 3.2-fold), 16-hour (3.4-fold vs. 3.0-
fold) and 24-hour (3.2-fold vs. 3.0-fold) time-points despite the initial transcript amounts
were the same for both cell types, suggesting PINK1 is induced more in response to
nutrient starvation in the absence of ataxin-2 (Figure 5.17).
The expression data of OPA1 acquired from NT- and ATXN2-KD cells (n=8)
consisted high variation among replicates, therefore is not sufficient to make a conclusion.
However, a general time-course induction and clearance with a similar pattern to that of
ATXN2 is observed. None of the changes at different time-points between two cells types
were found significant (Figure 5.17).
The native expression pattern of PABPC1 in NT-KD cells (n=4) showed a gradual
increase over time until it reaches the maximum of 4.5-fold at 24 hours and slightly
decreases at 48 hours to approximately 3.5-fold. Expression in ATXN2-KD cells (n=6), on
the other hand, started with the same levels of PABPC1 transcript, but showed less
induction especially after eight hours. The difference between NT- and ATXN2-KD cells
reaching to a maximum at 24-hour and 48-hour time-points were found significant with 2-
way ANOVA test. The induction in the expression of PABPC1 upon time-course
starvation seems to be impaired in the absence of ataxin-2 starting from 8 hours, and
transcript levels remain low for the following 40 hours (Figure 5.17).
The normal expression pattern of GHITM transcript in NT-KD cells (n=6) shows a
small increase in response to starvation after two hours, after a slight decrease at 4 hours,
got into an induction trend and reached the maximum of 2.0-fold at 16 hours. A phasic
decrease was observed afterwards. No major effect of ATXN2 depletion was present in the
expression pattern of GHITM, except for the initial increase of the transcript in nutrient
supplemented cells at two hours, which showed high variation among replicates and may
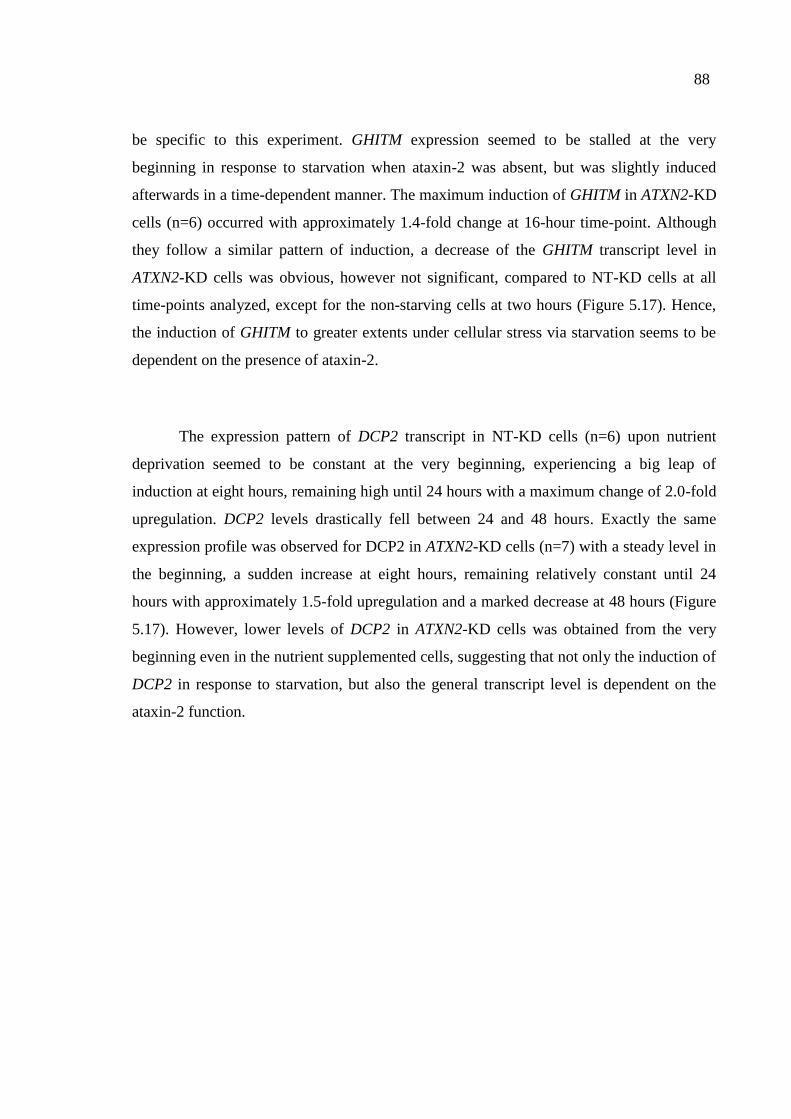
88
be specific to this experiment. GHITM expression seemed to be stalled at the very
beginning in response to starvation when ataxin-2 was absent, but was slightly induced
afterwards in a time-dependent manner. The maximum induction of GHITM in ATXN2-KD
cells (n=6) occurred with approximately 1.4-fold change at 16-hour time-point. Although
they follow a similar pattern of induction, a decrease of the GHITM transcript level in
ATXN2-KD cells was obvious, however not significant, compared to NT-KD cells at all
time-points analyzed, except for the non-starving cells at two hours (Figure 5.17). Hence,
the induction of GHITM to greater extents under cellular stress via starvation seems to be
dependent on the presence of ataxin-2.
The expression pattern of DCP2 transcript in NT-KD cells (n=6) upon nutrient
deprivation seemed to be constant at the very beginning, experiencing a big leap of
induction at eight hours, remaining high until 24 hours with a maximum change of 2.0-fold
upregulation. DCP2 levels drastically fell between 24 and 48 hours. Exactly the same
expression profile was observed for DCP2 in ATXN2-KD cells (n=7) with a steady level in
the beginning, a sudden increase at eight hours, remaining relatively constant until 24
hours with approximately 1.5-fold upregulation and a marked decrease at 48 hours (Figure
5.17). However, lower levels of DCP2 in ATXN2-KD cells was obtained from the very
beginning even in the nutrient supplemented cells, suggesting that not only the induction of
DCP2 in response to starvation, but also the general transcript level is dependent on the
ataxin-2 function.
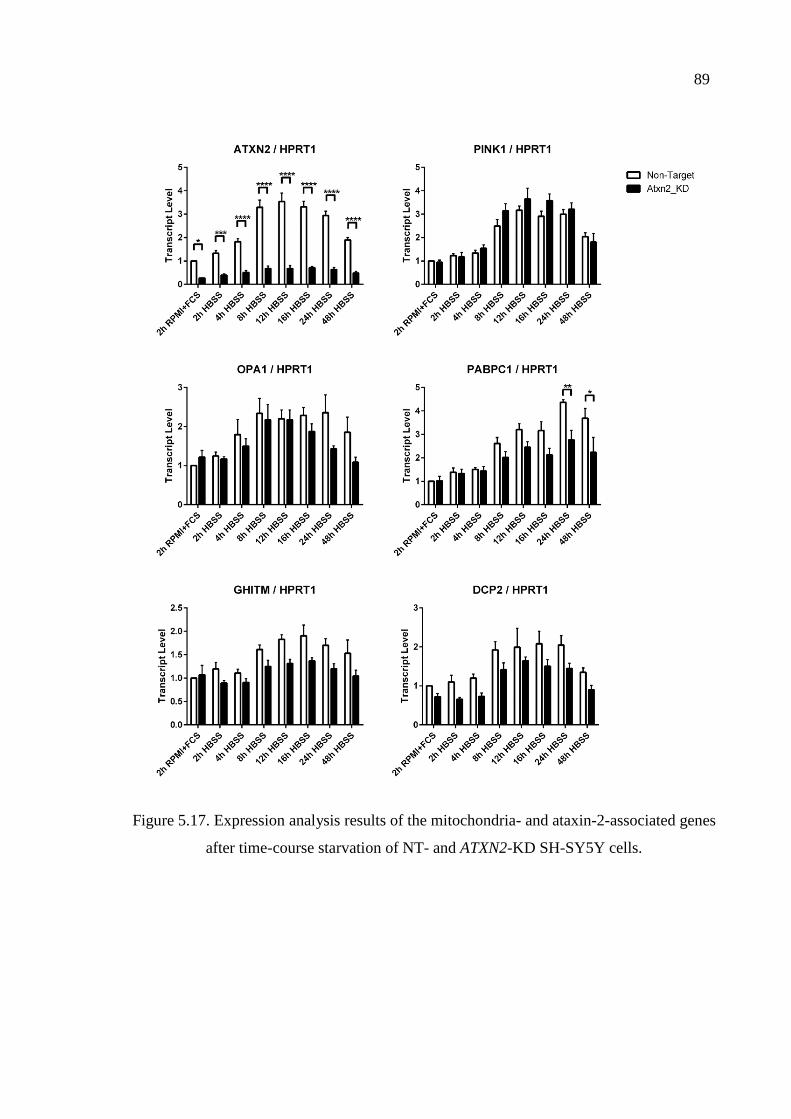
89
Figure 5.17. Expression analysis results of the mitochondria- and ataxin-2-associated genes
after time-course starvation of NT- and ATXN2-KD SH-SY5Y cells.
90
6. DISCUSSION
Spinocerebellar Ataxia Type 2 is a progressive neurodegenerative disorder caused
by the neuronal loss mainly in the cerebellum, and also in the midbrain, spinal cord and
brain cortex. Degeneration of the Purkinje neurons in the cerebellum, the dopaminergic
neurons in the substantia nigra, and the motor neurons in the spinal cord and brain cortex
underlies the incoordination, postural rigidity, velocity saccade loss, dysarthria and distal
amyotrophy present in SCA2 patients (Lastres-Becker et al., 2008b). These symptoms,
with the addition of cognitive deficiencies and loss of autonomic tasks, severely increase
throughout the disease progression, cumulatively contributing to the eventual decease of
the patient in approximately 10 years. As the disease is autosomal dominantly inherited,
even de novo occurrence of the expansion in a generation easily turns into a familial case
potentially affecting many individuals, unfortunately without the possibility of a preventive
treatment.
Although not as frequent as in Cuba, SCA2 is the most common type of autosomal
dominant cerebellar ataxia in Turkey (Statistical data obtained from NDAL patient cohort).
Turkey is a pool of not only dominant, but also recessive genetic disorders primarily due to
the high rate of consanguinity, early marriages and conceiving large number of offspring
prior to disease manifestation. Therefore, there are many families present in Turkey,
similar to the one examined in the context of this thesis, several members of which are
suffering from SCA2 and awaiting a potent cure.
The development of therapies that not only alleviate the symptoms, as the current
treatments do, but directly target the disease is dependent on the thorough comprehension
of the causative pathogenesis, that is poly-Q expansions in the ATXN2 gene. To this day,
expansion-induced pathogenesis underlying poly-Q disorders has been defined to possess
both gain- and loss-of-function characteristics (Lim et al., 2008). The intracellular protein
aggregates and the RNA foci induced by the expansion in distinct brain regions have been
hypothesized to cause toxicity that leads to the dysfunction and death of the neurons (Li
and Li, 2004; Orr and Zoghbi, 2007). The loss-of-function theory, on the other hand,
suggests that the expansion leads to the clearance of the protein from its native habitat as a
91
result of aggregations, and also to a decrease in its normal interaction capability with other
proteins due to alterations in the 3-D conformation and disruption of the functional
domains. The knock-out models of several poly-Q disorders, although share similarities
regarding the dysregulated expression levels of some transcripts with the knock-in model,
do not show neurological symptoms that mimic the normal disease phenotype (Crespo-
Barreto et al., 2010; Kiehl et al., 2006; Lastres-Becker et al., 2008a; Zeitlin et al., 1995).
Having the Atxn2-KO mouse model on one hand, and the large Turkish SCA2
pedigree on the other, we believe to have gathered a strong sample set and a great
advantage in dissecting the loss-/gain-of-function phenomenon of ATXN2 expansions.
Examination of the pathogenesis-induced downstream transcriptional changes in the SCA2
patients especially, rather than a disease model, also holds benefit towards making more
accurate and insightful inferences. In this sense, the family investigated in this thesis to
elucidate the downstream effects of ataxin-2 pathology, and maybe even to look deeper at
the different stages of the disease, is exceptionally important due to the reduced genetic
background shared among family members and minimal epigenetic differences, as they all
live in the same region with similar life-style preferences and subjected to the same
environmental cues. In addition to the genetic and epigenetic suitability for functional
studies, the best possible conditions for the high-throughput transcriptome analysis of this
family were provided, since the blood transcriptome profile may easily be affected from
the simplest stimulants. All individuals had fasted over-night prior to sample collection and
peripheral blood samples were collected simultaneously from all donors into PAXgene
Blood RNA tubes. Within the three hour incubation of the tubes at the room temperature,
the total blood RNA was fixed by the solution provided in the PAXgene tube, after which
samples were frozen and transported to Istanbul all together in the same day. The
subsequent processing of the blood samples, such as RNA isolation, DNaseI treatment and
cDNA synthesis, were all performed in parallel to prevent any disturbance. Hence, we are
confident that the global transcriptome profile of the SCA2 pedigree is as accurate as
possible for a patient-based study.
Even though our general aim is to elucidate ataxin-2 mechanism and the basis of
pathogenicity, understanding the progressive changes in both loss- and toxic gain-of-
function scenarios are of equal importance. Most of the NDs show similar phases of
92
pathogenesis; starting with the induction in a single or several cells, followed by a latent
period where minute molecular and cellular alterations occur locally and accumulate
without an obvious manifestation. After a certain threshold the first symptoms appear, and
depending on the strength of the primary cause, symptoms worsen progressively and the
pathology spreads to other regions of the CNS leading to additional secondary symptoms.
Therefore, the phasic progression seen in SCA2 might be due to the dynamic nature of
ataxin-2 pathology imposed by the collective changes in 3-D conformation, interaction
partners and aggregation rate to different levels throughout the disease course. Hence,
different cellular mechanisms are altered at different stages of the disease. The progressive
pathology asserted by ataxin-2 also correlates well with the fact that intermediate and
short-pathogenic expansions occasionally present distinct phenotypes and are associated
with various NDs. The genetic background of the individual bearing the expansion,
together with the environmental factors, jointly contribute to manifestation of the ATXN2
expansion-induced pathogenesis with a range of symptoms belonging to a spectrum of
disorders.
6.1. Cerebellum and Liver Biomarkers in Atxn2-KO Mouse
Examining the global transcriptome profiles of Atxn2-KO mice and SCA2 patients
in parallel holds great potential to unravel the native function of ataxin-2 and the
expansion-induced pathology, also to identify disease biomarkers. The microarray data of
Atxn2-KO mice was examined to see if a global dysregulation in transcription and
translation machineries was present considering the roles of ataxin-2 in RNA-binding,
translation and stress granule formation. Among the upregulated factors, ribosomal
proteins were the predominant observation, accompanied by RNA processing factors
(several DCP genes, Lsm12), and regulators of lipid droplet biogenesis (Plin3) and
apolipoprotein secretion (Mttp) (Fittschen et al., 2015). For the investigation of the
downregulated factors in the mouse microarray data, an interaction network was generated
taking the 100 most significant changes, and a closely connected sub-network of factors
secreted to extracellular fluids was observed. The validation of these dysregulations was
conducted using the cerebellum and liver tissues of Atxn2-KO mice at the protein level to
identify biomarker candidates for future analysis in SCA2 patients. None of the detected
93
factors showed significant changes in cerebellum, whereas three factors, Apo-AI (+1.3-
fold), Hemopexin (+2.3-fold) and SERPINA1 (+2.4-fold), were all found significantly
upregulated in Atxn2-KO mouse liver. Apo-AI is the major protein component of high
density lipoproteins, and mediates the cholesterol efflux from the cells (Phillips, 2014).
Hemopexin is a glycoprotein found in the plasma that strongly binds and transports the
heme groups to the liver for breakdown and iron recovery, in the meantime protecting cells
from oxidative stress. Loss of Hemopexin in mice show increased iron staining in the brain
slices at basal ganglia level (Tolosano et al., 2010). SERPINA1 is a serine protease
inhibitor found in the serum, whose main substrate is the Elastase enzyme that breaks
down elastic fiber proteins of the connective tissue in the alveolar walls and a series of
other tissues (Gettins, 2002).
6.1.1. Potential Dysregulation of the ER-Golgi Secretory Pathway
Interestingly, a relationship between ataxin-2 and the secreted lipid-traffic factors
was previously shown in a study examining the blood proteome of SCA2 patients.
Significant dysregulations of Apo-AI (-3-fold), Apo-CII (-2-fold), Apo-CIII (-4-fold) and
Apo-E (+4-fold) were reported at the protein level. Also, transthyretin and albumin protein
levels, members of our secretion sub-network that showed no significant change in
validations, have been found significantly dysregulated in patient blood (3-fold down and
4-fold up, respectively) (Swarup et al., 2013). The observed increase in the intracellular
protein levels of the secreted factors, although their mRNAs were initially found
downregulated in the transcriptome data, brought up the hypothesis that a deficit might
have been present in the ER-Golgi secretory pathway. The accumulation of the proteins,
which were supposed to be secreted to the extracellular fluids, due to a problem in this
pathway might be activating a negative feedback response that halts the transcription of the
relevant genes. Examination of the mouse transcriptome data again revealed significant
dysregulations of Sel1l, taking role in the retrotranslocation of the misfolded proteins back
to the cytosol, and Syvn1, a ubiquitin-ligase activated upon ER-stress and mediates the
degradation of accumulated proteins (Kaneko et al., 2002; Mueller et al., 2008).
94
Independent validations with qRT-PCR, however, showed no major change in the
expression of these genes both in the cerebellum and liver of the Atxn2-KO mice.
The expression analyses of Apoa1, Hpx and Serpina1a/b/c transcripts in both
tissues also showed controversy compared to the transcriptome data acquired from Atxn2-
KO mouse cerebellum. Validations with independent methods, such as qRT-PCR, are
preferred for the currently improving high-throughput analyses. Taking these results into
consideration, we would have to say that no major change is actually present in the
transcript levels of Apoa1 and Serpina1a/b/c in both cerebellum and liver, although the
transcriptome data suggested otherwise. However, their protein levels are still significantly
upregulated in the liver by 1.3- and 2.4-fold, respectively. Hpx transcript, on the other
hand, is significantly upregulated by 1.3- and 1.5-fold in the cerebellum and liver,
respectively, also showing an induction of the protein in the liver by 2.3-fold. The
disproved downregulations in the transcript levels of Apoa1, Hpx and Serpina1a/b/c might
also refute the “ER-Golgi secretory pathway deficiency” hypothesis and steady levels of
ER-associated factors Syvn1 and Sel1l would be explained. Yet, the accumulation of
apolipoproteins within the liver cells, their decrease in the patient blood plasma, and the
increase in the apolipoprotein secretion mediator, Mttp, all suggest a problem in the
secretion machinery and an effort to mitigate intracellular apolipoprotein accumulation.
There may have been other factors in the mouse transcriptome data that we have
overlooked, maybe more relevant to the Golgi apparatus and the secretion part of the
pathway rather than ER-associated degradation.
Combining the global findings provided by the high-throughput transcriptome
studies in Atxn2-KO mouse, one might conclude that ataxin-2 is indeed involved in the
processing and the translation of the mRNAs, also regulating the biogenesis and transport
of the lipids and other nutrient carriers. The expansion-induced pathogenesis, therefore,
might be due to the alterations in the global protein synthesis occurring at the rER, where
ataxin-2 localizes and interacts with polysomes. Cerebellar Purkinje cells, spinal and
cortical motor neurons and dopaminergic neurons of the substantia nigra, the most affected
neurons in SCA2, are among the most vulnerable cell types against the alterations in
95
proteostasis due to high numbers of large rER structures, complex dendritic spine networks
and massive metabolic activities. Thus, the selective vulnerability of these magnocellular
neurons in SCA2 pathogenesis might be explained to some level with the global
impairment of proteostasis and induction of the cellular stress. Regulation of the energy
and nutrient consumption is among the primary stress responses of a cell. Taking the
involvement of ataxin-2 in lipid storage, secretion and transport into consideration, the
cellular stress induced by the malfunctioning of the translation machinery due to ATXN2
expansions, may not be handled properly. Therefore, the expansions in ATXN2 not only
alter the global mRNA metabolism and protein synthesis, but may also impair the response
given to the intracellular stress induced by these alterations.
6.2. Blood Biomarkers in SCA2 Patients
The investigation of SCA2 blood biomarkers initially started with the attempt of
validating the secretion network components, acquired from the Atxn2-KO mouse data, at
the protein level in SCA2 blood samples, and to assess if the opposite effects will be
observed when the loss- and the toxic gain-of-function models are compared.
Unfortunately, quantitative immunoblots performed with the whole proteins isolated from
SCA2 patient blood showed no success due to the dominating amount of hemoglobin in the
serum. Although depletion was performed prior to the immunoblot analyses with
hemoglobin-binding beads, even many more times than suggested by the manufacturer, the
remaining hemoglobin was still enough to interfere with the quantitation of the total
isolated proteins. The protein sample loaded to the SDS gel mostly consisted of
hemoglobin, rendering other proteins in such a minute amount that could not be detected
by the same antibodies previously used in mouse experiments. Hence, no comparison of
the Apo-AI, Hemopexin and SERPINA1 protein levels was possible between Atxn2-KO
mouse liver and the patient blood samples.
In the meantime, high-throughput RNA-sequencing results of three patients and
three healthy individuals from the same family were compared in order to identify RNA
biomarkers of SCA2 that would represent the ataxin-2 pathology and possibly the
96
progression of the disease. Significant dysregulations greater than 2-fold were observed in
many transcripts, and two different filtering approaches were utilized. First, all the
transcripts were sorted out with respect to the fold-change difference and the significance
of this change. In the second approach, known ALS- and ataxia-associated genes gathered
from online databases were filtered out from the whole transcriptome data and eliminated
again with respect to the fold change and significance. The first approach has advantages
in finding novel transcripts affected by the expansion, and might unravel a previously
unknown aspect of ataxin-2 pathology. Selection of dysregulated ND-associated genes, on
the other hand, might help in clarifying the commonality of several molecular mechanisms
or phenotypes prominent in diverse NDs. Examining the ND-associated genes in the
transcriptome of SCA2 patients, where ataxin-2 can fully exert its pathologic effect, may
raise novel explanations of wide ataxin-2 involvement in many disorders.
Among the candidate biomarker genes chosen by the first approach, ETV7,
SERINC2, DACT1 and PHTF2 were validated as significant changes. The greatest effect
was observed in the blood variant of ETS-family transcription factors, ETV7. Another
member of this family, ETS1, is the only identified transcription factor regulating ATXN2
expression (Scoles et al., 2012). Therefore, the 579% increase of the ETV7 transcript level
in patient blood is in excellent agreement with the previous findings and paves the way of
new inquiries regarding the regulation of ATXN2. Two other large effects were observed in
SERINC2 with 279% increase, and DACT1 with 70% decrease of the transcript levels in
patient blood. The expression of SERINC2, which normally functions in the incorporation
of serine amino acid into phosphatidylserine and sphingolipids, has been found upregulated
in the rat hippocampus and the cerebellar Purkinje layer. The expression increased even
more in the hippocampus upon seizures induced by kainite, a neuroexcitatory amino acid
that activates glutamatergic receptors (Inuzuka et al., 2005). Therefore, the upregulation of
the SERINC2 transcript we observed in the SCA2 patient blood samples might be relevant
to the neurological syndrome and represent the ongoing pathology in the brain. The
decrease observed in plasma DACT1 levels might also be relevant to the pathology due to
its involvement in the morphogenesis of the notochord and establishment of the excitatory
synapses during development. DACT1 normally antagonizes the transcription of the
Wnt/beta-catenin pathway target genes by regulating the membrane localization or
97
degradation of beta-catenin and recruiting HDAC1, which enhances heterochromatin
formation, to the target gene promoters (Lagathu et al., 2009). Dact1 null mice show
severe posterior malformations due to the problems in primitive streak morphogenesis and
depletion of the mRNA in Xenopus results in the loss of notochord and head structures
(Suriben et al., 2009). Further investigation of these huge downstream effects of ATXN2
expansion on SERINC2 and DACT1 might reveal novel aspects of the pathology or explain
at least some of the previously unsolved mechanistic impairments. Although there is scarce
information on the function of PHTF2 in the literature, several GWAS studies show its
association with chronic kidney disease, childhood obesity and blood lipid phenotype. The
25% decrease seen in PHTF2 might be relevant to ataxin-2 pathology, considering the
obesity phenotype of the Atxn2-KO mouse and the impairments of apolipoprotein levels
both in Atxn2-KO mouse tissues and patient blood plasma, previously discussed in this
chapter.
Two genes previously associated with neurodegenerative disorders, MATR3 and
ATXN1, showed significant changes in SCA2 patient blood. MATR3 is an ALS-associated
gene involved in mRNA stabilization, normally located in the nuclei of motor neurons and
the surrounding glia of the spinal cord. However, a diffuse distribution of MATR3 in the
cytoplasm is observed along with intense nuclear localization in the spinal cord sections of
ALS patients. MATR3 interacts with TDP-43, another ALS-associated protein involved in
mRNA metabolism in the nucleus, but shuttles to the cytoplasm to form stress granules
(Johnson et al., 2014). The 40% decrease seen in MATR3 level is quite interesting and
emphasizes the ATXN2 involvement in ALS and the similarities between the pathogenesis
of both disorders that are aberrant RNA metabolism and possibly alterations in stress
granule dynamics. The 138% increase observed in ATXN1 levels is also anticipated and
strengthens the previous reports suggesting its direct and strong interaction with ataxin-2,
and the regulation of ataxin-1 toxicity by the sequestration of ataxin-2 into intranuclear
aggregates (Al-Ramahi et al., 2007; Lim et al., 2006). In the same sense, the observed
increase of ATXN1 in patient blood may be contributing to the expanded ataxin-2 toxicity.
98
The emergence of two genes, that are especially involved in the most pronounced
pathogenic mechanism and are established interactors of ataxin-2, among many ND-
associated genes examined, provides a proof of principle for the targeted filtration
approach we employed. Also, the presence of great expression changes in previously
unrelated factors to ataxin-2 evokes the discovery of completely novel mechanisms
affected by or contributing to the pathology exerted by ATXN2 expansions.
6.3. Gene Set Enrichment Analysis
The enrichment analysis revealed dysregulations in many pathways and gene sets to
be maximally significant with nominal p-value, FDR q-value, and FWER p-values equal to
zero. Upregulations of several mRNA metabolism, lysosomal degradation and secretion
pathways, with mitochondrial dysfunction-associated disease gene sets were observed
(Table A2). Specifically, upregulations in ‘3’-UTR Mediated Translational Regulation’
and ‘Regulation of mRNA Stability by Proteins that Bind to AU-Rich Elements’ pathways
are in good agreement with the previously reported binding of ataxin-2 to AU-rich
elements in the 3’-UTRs of mRNA molecules, which promotes the stability of the
translation machinery and enhances translation (Yokoshi et al., 2014). Moreover, two
members of the enriched ‘Extracellular Region Gene Set’, namely APOA1 and APOE,
have been previously found dysregulated at the protein level in SCA2 patient serum.
However, the mode of dysregulations in our blood transcriptome and the reported blood
proteome data show opposition; APOA1 is increased at the mRNA level (+2.1-fold) and
decreased at the protein level (-2.9-fold), whereas APOE has a decreased mRNA (-0.69-
fold) and an increased protein level (+4.4-fold) in the serum of SCA2 patients (Swarup et
al., 2013).
It is also interesting to note that the maximally enriched transcript in the
‘Extracellular Region Gene Set’ is MMP9, which was among the validated genes acquired
by unbiased selection in SCA2 blood RNA biomarker investigation, showing a trend
towards significance (0.05 < p < 0.1) (Figure 5.10). MMP9 is a zinc-dependent
endopeptidase involved in the degradation of extra-cellular matrix components, such as
99
type IV and V collagens. High levels of MMP9 protein is detected in the cerebrospinal
fluids of multiple sclerosis and tuberculosis meningitis patients (Gijbels et al., 1992; Price
et al., 2001), and the release of MMP9 is believed to induce hematopoietic progenitor cell
mobilization in the bone marrow by the cleavage of the surrounding ECM molecules
(Pruijt et al., 1999). Moreover, MMP9 has been reported as a determinant of neuronal
death in ALS mouse models, showing >10-fold increase in the selectively vulnerable fast
motor neurons (Kaplan et al., 2014). Its co-distribution with ETV5, an ETS-family
transcription factor variant highly expressed in brain, in various carcinomas, also makes a
contribution to its relevance with ataxin-2 pathology considering the reported regulation of
ATXN2 expression by ETS1, and the significant 579% increase of the ETV7 transcript in
the serum of SCA2 patients reported in this thesis (Planagumà et al., 2011; Scoles et al.,
2012).
Altogether, GSEA revealed several dysregulated pathways that ataxin-2 was
already known to be involved in, such as mRNA and translation stabilization and
strengthened their association with the pathology. However, investigating the contributory
transcripts to these known pathways, as well as examining the rather rarely pronounced
pathways, led to the identification of novel players, such as apolipoproteins and MMP9,
that may clarify a part of the complex ataxin-2 network.
6.4. The Relationship between Ataxin-2 and the Mitochondrial Factors
Enrichment of two pathways, Parkinson’s disease and Huntington’s disease, was
especially interesting, since both disorders share mitochondrial dysfunction features
underlying the disease pathogenesis, and alterations in the expression of mitochondrial
genes in SCA2 patient samples is a novel finding. The common brain pathology, shared
clinical symptoms and the involvement of intermediate ATXN2 expansion in the disease
manifestation, provoked further investigation of the Parkinson’s disease pathway. Two
genes pronounced in autosomal recessive juvenile PD, PINK1 and PARK7, both of which
function in the mitochondrial mechanisms, were found upregulated by 1.63- and 1.70-fold,
respectively. The expression analyses of several mitochondria-associated genes were
100
conducted in Atxn2-KO mouse in order to see if the reverse effect would be observed.
Indeed, the transcript levels of Pink1, Opa1 and Ghitm were found downregulated in
Atxn2-KO mouse cerebellum and liver with maximal significances, strengthening the
association between ataxin-2 and mitochondrial genes (Figure 5.16).
The transcription of PINK1 can be induced by nutrient starvation which leads to the
degradation of dysfunctional mitochondria by a selective autophagy process called
‘mitophagy’ (Jin and Youle, 2012; Klinkenberg et al., 2012). The PTEN-dependent
activation of PINK1 is regulated by the upstream PI3K signaling cascade that maintains
lipid and carbohydrate metabolisms in balance depending on the availability of these
nutrients. PI3K signaling is tightly interconnected with the mTOR pathway that detects
amino acid availability and eventually regulates growth and cell proliferation. The yeast
homolog of ataxin-2 has been shown to sequester the TORC1 subunit of mTOR into stress
granules during heat stress and low energy input, interfering with native mTOR function
and leading to the transient cellular arrest (DeMille et al., 2014; Takahara and Maeda,
2012). Therefore, ataxin-2 is a more general factor responding to the starvation stress by
halting cell growth, whereas PINK1 is particularly employed in the degradation of
dysfunctional mitochondria to recycle lipids and amino acids as food source. The obesity
phenotype and the reduced level of Pink1 transcript in Atxn2-KO mouse are consistent
with this mechanism, since the lack of ataxin-2 exterminates the control over growth and
proliferation of the fat cells and the excess energy provided by ad libitum feeding is stored
in this tissue, without the need of mitophagy as long as the mice are under no starvation
stress. In contrast, PINK1 levels are upregulated in the SCA2 patient blood, representing a
stress condition probably caused by the induction of autophagy in the degenerating tissues.
A time-course starvation experiment with ATXN2-KD SH-SY5Y cells was
designed to investigate the relationship between ataxin-2 and the mitochondria-associated
genes, also to assess if the time-course induction pattern of PINK1 will be affected from
ATXN2 silencing. The pattern of PINK1 expression in ATXN2 depleted and normal cells
are similar, but a greater PINK1 induction is observed in the absence of ATXN2 possibly
representing a compensatory effort to overcome the starvation stress, especially after eight
hours of starvation. The expression of ATXN2 immediately increases in the first two hours
of starvation in normal cells, hence the initial delay observed in PINK1 induction in
101
ATXN2-KD cells suggests that ataxin-2 might be in the upstream of PINK1 as a stress
sensor, in the absence of which PINK1 gets to be induced by an alternative mechanism
with a slight delay.
Drawing a meaningful conclusion for the expression status of OPA1, another
mitochondrial factor associated with autosomal dominant optic atrophy, in starved ATXN2-
KD cells is impossible due to the high variation between replicate sets at every time point.
In contrast to PINK1, the expression levels of GHITM, which is involved in mitochondrial
morphology and the release of apoptotic cytochrome c from mitochondria, shows a slight
reduction in ATXN2 depleted cells at the beginning of starvation, in line with the decrease
observed in Atxn2-KO mouse tissues. The downregulation of GHITM is reported to cause
mitochondrial fragmentation and the release of proapoptotic proteins (Oka et al., 2008).
The anti-apoptotic control over GHITM expression under stress conditions, potentially
exerted by ataxin-2, is initially diminished in ATXN2-KD cells, comprising the risk of
mitochondrial fragmentation and apoptosis. GHITM levels increase in the ATXN2-KD cells
to a smaller extent compared to normal cells, probably under the control of an alternative
mechanism starting from eight hours of starvation (Figure 5.17).
The expression patterns of two genes related to ataxin-2 function, DCP2 and
PABPC1, were investigated in the time-course starved ATXN2-KD cells along with
mitochondrial factors. In a previous study, the increase in ATXN2 levels was shown to
interfere with the p-body formation leading to a reduction in their number, whereas the
decrease of ATXN2 altered stress granule assembly and increased intracellular PABP levels
(Nonhoff et al., 2007). The expression of DCP2, which is a key component of the mRNA
de-capping machinery and found in p-bodies, is reduced in ATXN2-KD cells from the
beginning of starvation compared to the normal cells. The initially constant expression and
the rise after eight hours are similar in both cell types suggesting ATXN2 involvement not
in the timing, but in the degree of DCP2 induction. In the case of PABPC1, which is a
stress granule component liberating to the cytoplasm in the depletion of ATXN2, a gap in
the transcript levels emerge between the ATXN2-KD and normal cells only after eight
hours, showing the same expression rate until this point. The only statistically significant

102
results in the time-course starvation experiments were obtained at the 24- and 48-hour time
point expression level differences of PABPC1. However, this change we observe suggests
that the induction of PABPC1 here is due to starvation stress rather than to ataxin-2
depletion, since higher concentrations of PABPC1 transcript would otherwise be expected
in ATXN2-KD cells.
103
7. CONCLUSION
We have examined the high-throughput transcriptome data of Atxn2-KO mice and
SCA2 patients from a large Turkish pedigree in parallel to basically understand the native
function of ataxin-2 and the expansion-induced pathogenesis, which would eventually lead
to the development of molecular diagnostics of disease progression and the identification
of molecular targets for therapy.
Possessing the loss- and the toxic-gain-of-function models, we had the chance to
combine the findings in both sample sets and make reliable inferences regarding the
functional and pathological aspects of ataxin-2. Previously known mechanisms of ataxin-2,
such as mRNA stabilization and processing, translational regulation, and stress granule
formation, were strengthened by several findings both in the Atxn2-KO and the SCA2
patient transcriptome data. Some shared novel functions and downstream effects of ataxin-
2 have also been identified in Atxn2-KO mice and SCA2 patients, such as the biogenesis
and transport of the lipids, and the dysregulated levels of apolipoproteins and other
members of the extracellular region gene set.
The overall recurrence of previously known ataxin-2 mechanisms and the
emergence of shared novel effects between the knock-out mouse model and the SCA2
patients, is a proof of principle for the theoretical and the experimental approach we
employed in the filtration and evaluation of the high-throughput transcriptome data. Some
factors identified in this study to be differentially altered among patients, but showing
stable expression in controls, might actually be biomarkers of disease progression
representing a specific stage, however getting shaded due to the distinct phenotypic and
expression features presented by other patients. The number of patients examined in this
study, although they possess very little genetic and epigenetic background differences, may
not be large enough to dissect such changes. Further investigation of these dysregulated
genes in larger cohorts with clinically well-defined progression states would provide better
correlation between the stages of the disease and the dysregulation of certain transcripts.

104
Altogether, we investigated the general function and the expansion-based
pathogenicity of ataxin-2 with the long-term goal of paving the way for a cause-targeted
treatment. Starting with the dissection of the progression stages at the molecular level,
explaining the selective vulnerability of certain cell types and assembling the pieces of
complex neural networks, we hope to gain a thorough understanding of ataxin-2 pathology
and cure SCA2, hopefully together with other neurodegenerative disorders that ataxin-2 is
widely involved in.
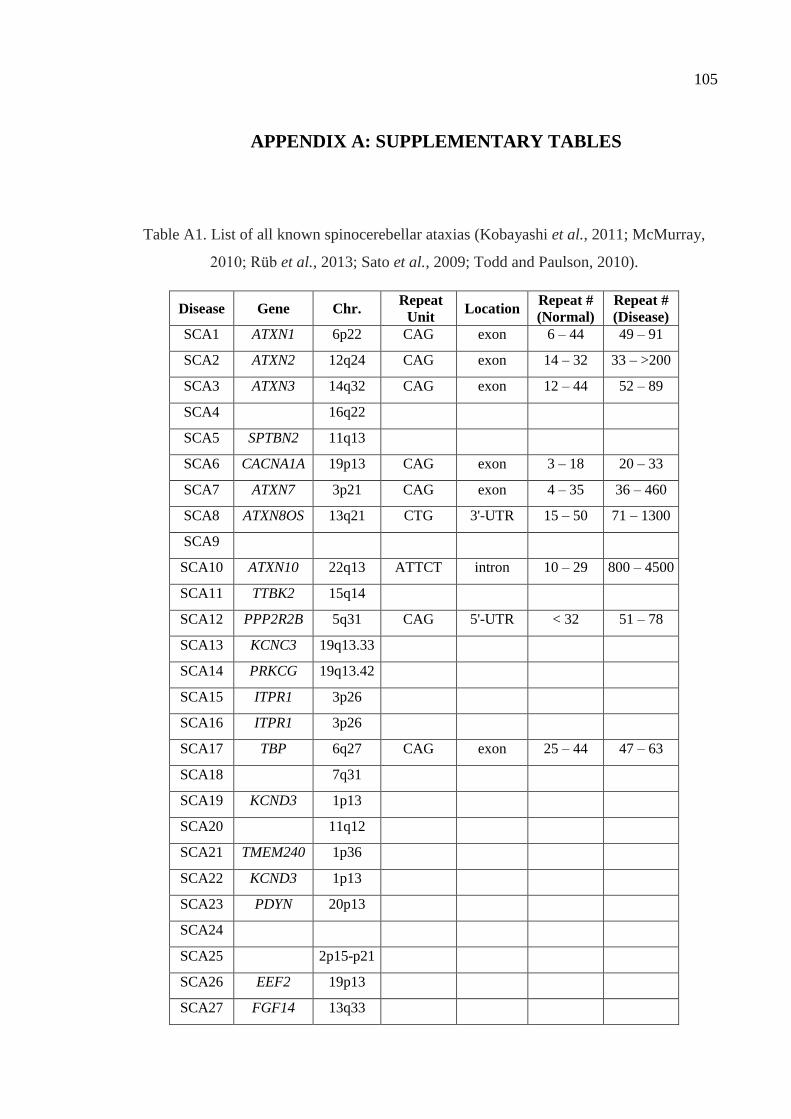
105
APPENDIX A: SUPPLEMENTARY TABLES
Table A1. List of all known spinocerebellar ataxias (Kobayashi et al., 2011; McMurray,
2010; Rüb et al., 2013; Sato et al., 2009; Todd and Paulson, 2010).
Disease Gene Chr. Repeat
Unit Location
Repeat #
(Normal)
Repeat #
(Disease)
SCA1 ATXN1 6p22 CAG exon 6 – 44 49 – 91
SCA2 ATXN2 12q24 CAG exon 14 – 32 33 – >200
SCA3 ATXN3 14q32 CAG exon 12 – 44 52 – 89
SCA4 16q22
SCA5 SPTBN2 11q13
SCA6 CACNA1A 19p13 CAG exon 3 – 18 20 – 33
SCA7 ATXN7 3p21 CAG exon 4 – 35 36 – 460
SCA8 ATXN8OS 13q21 CTG 3'-UTR 15 – 50 71 – 1300
SCA9
SCA10 ATXN10 22q13 ATTCT intron 10 – 29 800 – 4500
SCA11 TTBK2 15q14
SCA12 PPP2R2B 5q31 CAG 5'-UTR < 32 51 – 78
SCA13 KCNC3 19q13.33
SCA14 PRKCG 19q13.42
SCA15 ITPR1 3p26
SCA16 ITPR1 3p26
SCA17 TBP 6q27 CAG exon 25 – 44 47 – 63
SCA18 7q31
SCA19 KCND3 1p13
SCA20 11q12
SCA21 TMEM240 1p36
SCA22 KCND3 1p13
SCA23 PDYN 20p13
SCA24
SCA25 2p15-p21
SCA26 EEF2 19p13
SCA27 FGF14 13q33
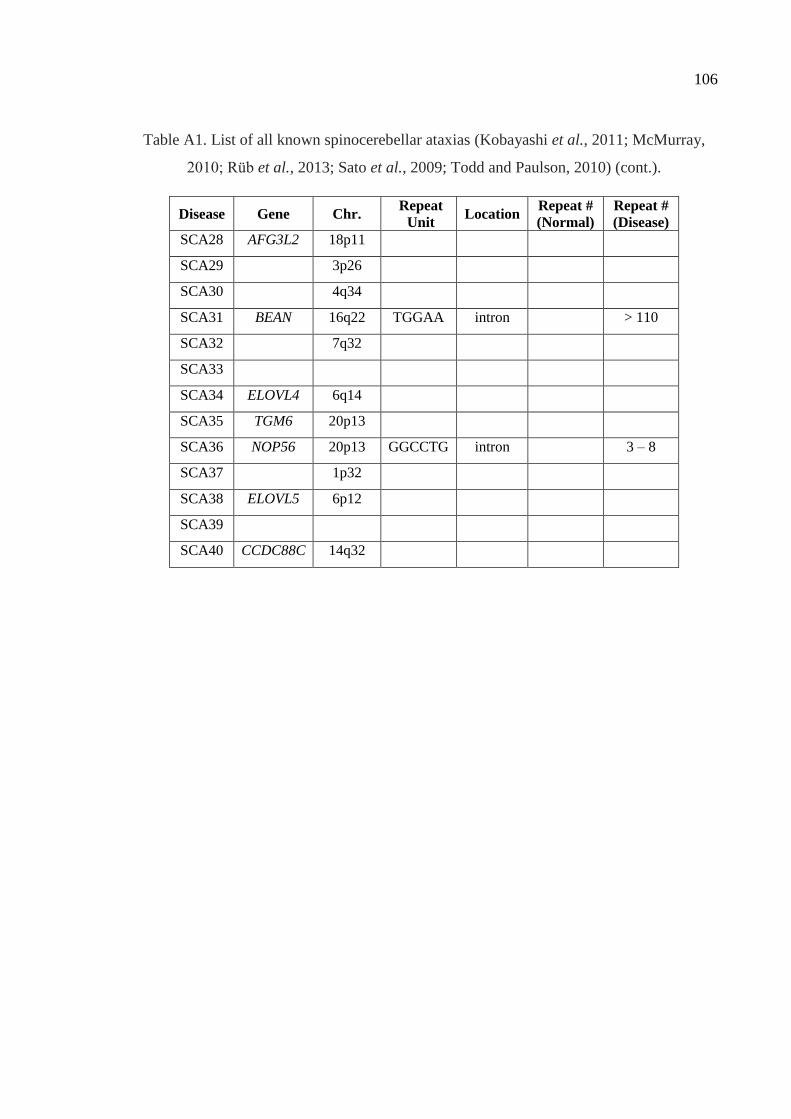
106
Table A1. List of all known spinocerebellar ataxias (Kobayashi et al., 2011; McMurray,
2010; Rüb et al., 2013; Sato et al., 2009; Todd and Paulson, 2010) (cont.).
Disease Gene Chr. Repeat
Unit Location
Repeat #
(Normal)
Repeat #
(Disease)
SCA28 AFG3L2 18p11
SCA29 3p26
SCA30 4q34
SCA31 BEAN 16q22 TGGAA intron > 110
SCA32 7q32
SCA33
SCA34 ELOVL4 6q14
SCA35 TGM6 20p13
SCA36 NOP56 20p13 GGCCTG intron 3 – 8
SCA37 1p32
SCA38 ELOVL5 6p12
SCA39
SCA40 CCDC88C 14q32
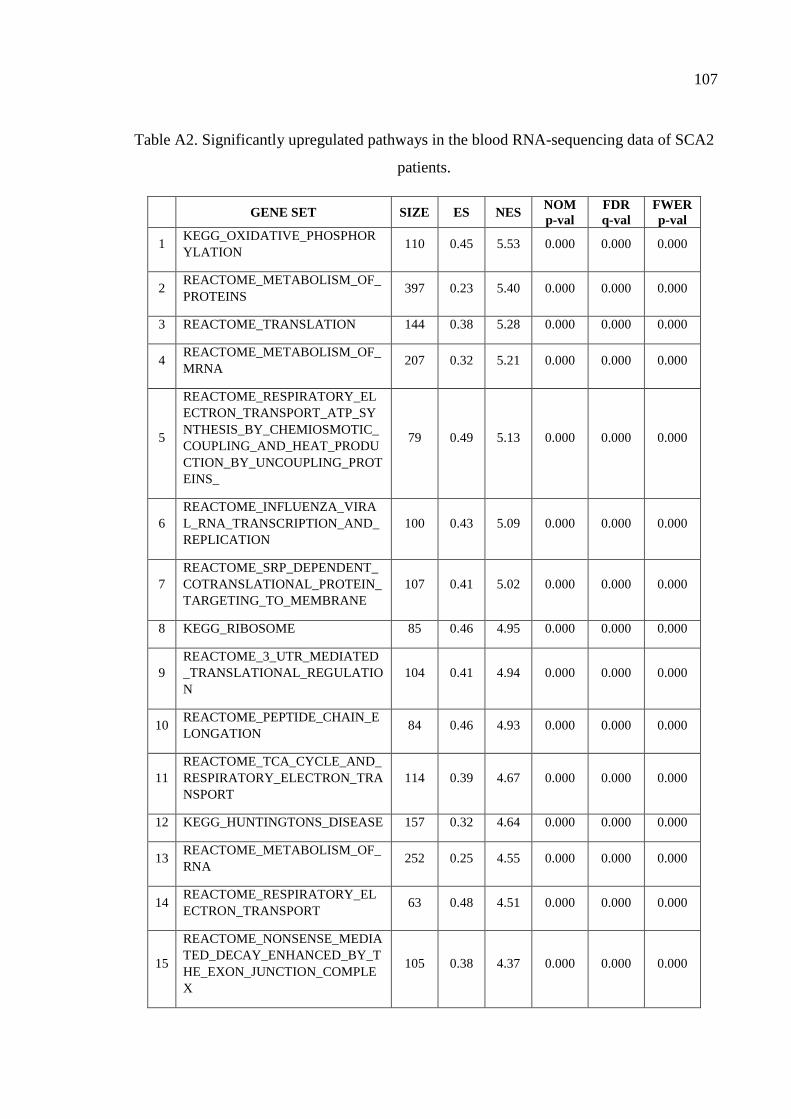
107
Table A2. Significantly upregulated pathways in the blood RNA-sequencing data of SCA2
patients.
GENE SET SIZE ES NES
NOM
p-val
FDR
q-val
FWER
p-val
1 KEGG_OXIDATIVE_PHOSPHOR
YLATION 110 0.45 5.53 0.000 0.000 0.000
2 REACTOME_METABOLISM_OF_
PROTEINS 397 0.23 5.40 0.000 0.000 0.000
3 REACTOME_TRANSLATION 144 0.38 5.28 0.000 0.000 0.000
4 REACTOME_METABOLISM_OF_
MRNA 207 0.32 5.21 0.000 0.000 0.000
5
REACTOME_RESPIRATORY_EL
ECTRON_TRANSPORT_ATP_SY
NTHESIS_BY_CHEMIOSMOTIC_
COUPLING_AND_HEAT_PRODU
CTION_BY_UNCOUPLING_PROT
EINS_
79 0.49 5.13 0.000 0.000 0.000
6
REACTOME_INFLUENZA_VIRA
L_RNA_TRANSCRIPTION_AND_
REPLICATION
100 0.43 5.09 0.000 0.000 0.000
7
REACTOME_SRP_DEPENDENT_
COTRANSLATIONAL_PROTEIN_
TARGETING_TO_MEMBRANE
107 0.41 5.02 0.000 0.000 0.000
8 KEGG_RIBOSOME 85 0.46 4.95 0.000 0.000 0.000
9
REACTOME_3_UTR_MEDIATED
_TRANSLATIONAL_REGULATIO
N
104 0.41 4.94 0.000 0.000 0.000
10 REACTOME_PEPTIDE_CHAIN_E
LONGATION 84 0.46 4.93 0.000 0.000 0.000
11
REACTOME_TCA_CYCLE_AND_
RESPIRATORY_ELECTRON_TRA
NSPORT
114 0.39 4.67 0.000 0.000 0.000
12 KEGG_HUNTINGTONS_DISEASE 157 0.32 4.64 0.000 0.000 0.000
13 REACTOME_METABOLISM_OF_
RNA 252 0.25 4.55 0.000 0.000 0.000
14 REACTOME_RESPIRATORY_EL
ECTRON_TRANSPORT 63 0.48 4.51 0.000 0.000 0.000
15
REACTOME_NONSENSE_MEDIA
TED_DECAY_ENHANCED_BY_T
HE_EXON_JUNCTION_COMPLE
X
105 0.38 4.37 0.000 0.000 0.000
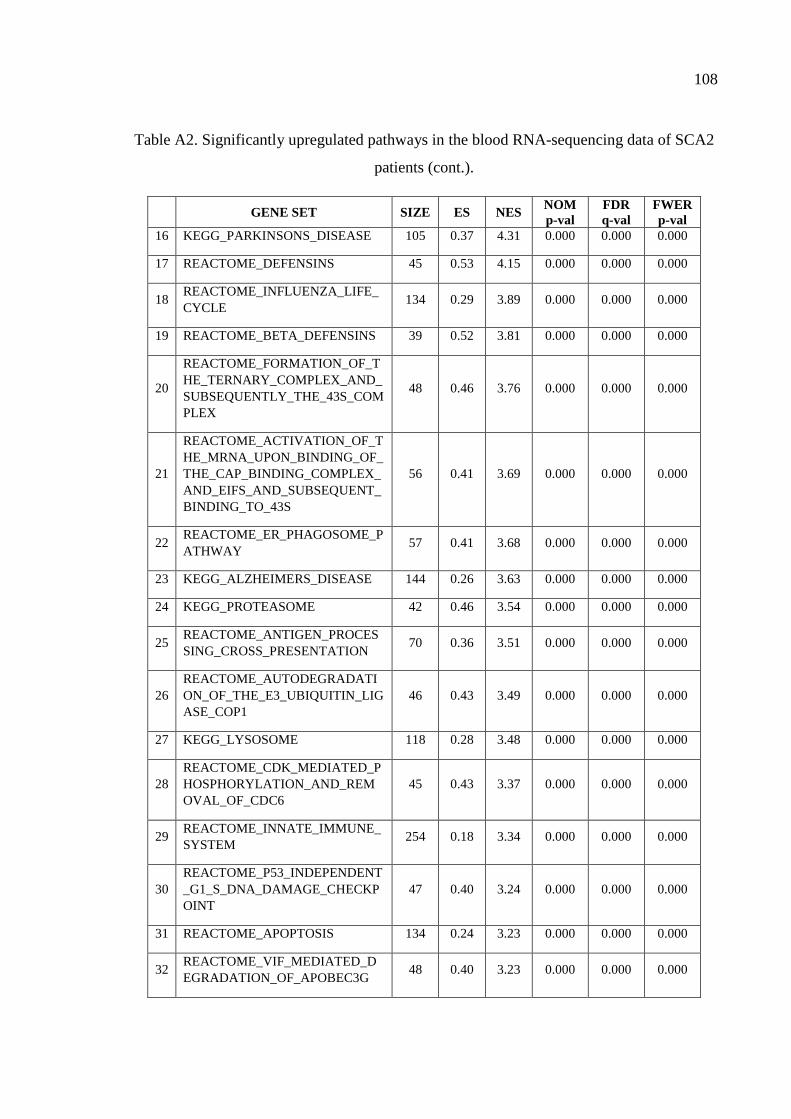
108
Table A2. Significantly upregulated pathways in the blood RNA-sequencing data of SCA2
patients (cont.).
GENE SET SIZE ES NES NOM
p-val
FDR
q-val
FWER
p-val
16 KEGG_PARKINSONS_DISEASE 105 0.37 4.31 0.000 0.000 0.000
17 REACTOME_DEFENSINS 45 0.53 4.15 0.000 0.000 0.000
18 REACTOME_INFLUENZA_LIFE_
CYCLE 134 0.29 3.89 0.000 0.000 0.000
19 REACTOME_BETA_DEFENSINS 39 0.52 3.81 0.000 0.000 0.000
20
REACTOME_FORMATION_OF_T
HE_TERNARY_COMPLEX_AND_
SUBSEQUENTLY_THE_43S_COM
PLEX
48 0.46 3.76 0.000 0.000 0.000
21
REACTOME_ACTIVATION_OF_T
HE_MRNA_UPON_BINDING_OF_
THE_CAP_BINDING_COMPLEX_
AND_EIFS_AND_SUBSEQUENT_
BINDING_TO_43S
56 0.41 3.69 0.000 0.000 0.000
22 REACTOME_ER_PHAGOSOME_P
ATHWAY 57 0.41 3.68 0.000 0.000 0.000
23 KEGG_ALZHEIMERS_DISEASE 144 0.26 3.63 0.000 0.000 0.000
24 KEGG_PROTEASOME 42 0.46 3.54 0.000 0.000 0.000
25 REACTOME_ANTIGEN_PROCES
SING_CROSS_PRESENTATION 70 0.36 3.51 0.000 0.000 0.000
26
REACTOME_AUTODEGRADATI
ON_OF_THE_E3_UBIQUITIN_LIG
ASE_COP1
46 0.43 3.49 0.000 0.000 0.000
27 KEGG_LYSOSOME 118 0.28 3.48 0.000 0.000 0.000
28
REACTOME_CDK_MEDIATED_P
HOSPHORYLATION_AND_REM
OVAL_OF_CDC6
45 0.43 3.37 0.000 0.000 0.000
29 REACTOME_INNATE_IMMUNE_
SYSTEM 254 0.18 3.34 0.000 0.000 0.000
30
REACTOME_P53_INDEPENDENT
_G1_S_DNA_DAMAGE_CHECKP
OINT
47 0.40 3.24 0.000 0.000 0.000
31 REACTOME_APOPTOSIS 134 0.24 3.23 0.000 0.000 0.000
32 REACTOME_VIF_MEDIATED_D
EGRADATION_OF_APOBEC3G 48 0.40 3.23 0.000 0.000 0.000
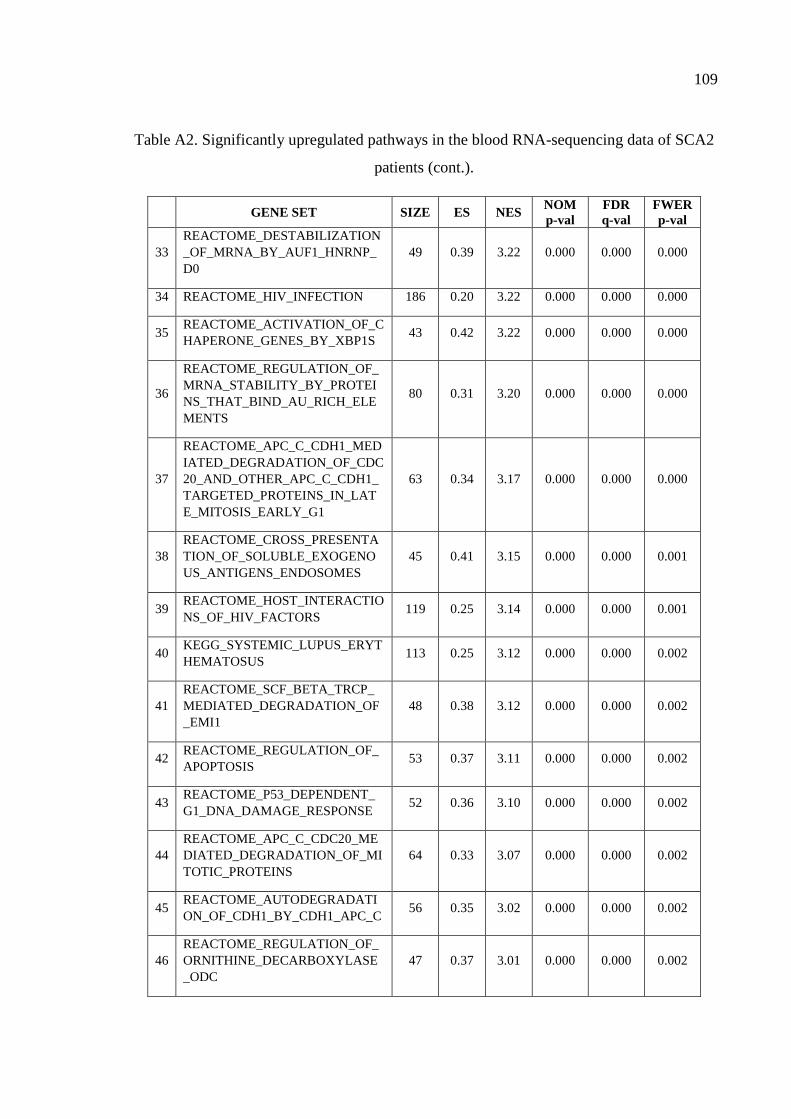
109
Table A2. Significantly upregulated pathways in the blood RNA-sequencing data of SCA2
patients (cont.).
GENE SET SIZE ES NES NOM
p-val
FDR
q-val
FWER
p-val
33
REACTOME_DESTABILIZATION
_OF_MRNA_BY_AUF1_HNRNP_
D0
49 0.39 3.22 0.000 0.000 0.000
34 REACTOME_HIV_INFECTION 186 0.20 3.22 0.000 0.000 0.000
35 REACTOME_ACTIVATION_OF_C
HAPERONE_GENES_BY_XBP1S 43 0.42 3.22 0.000 0.000 0.000
36
REACTOME_REGULATION_OF_
MRNA_STABILITY_BY_PROTEI
NS_THAT_BIND_AU_RICH_ELE
MENTS
80 0.31 3.20 0.000 0.000 0.000
37
REACTOME_APC_C_CDH1_MED
IATED_DEGRADATION_OF_CDC
20_AND_OTHER_APC_C_CDH1_
TARGETED_PROTEINS_IN_LAT
E_MITOSIS_EARLY_G1
63 0.34 3.17 0.000 0.000 0.000
38
REACTOME_CROSS_PRESENTA
TION_OF_SOLUBLE_EXOGENO
US_ANTIGENS_ENDOSOMES
45 0.41 3.15 0.000 0.000 0.001
39 REACTOME_HOST_INTERACTIO
NS_OF_HIV_FACTORS 119 0.25 3.14 0.000 0.000 0.001
40 KEGG_SYSTEMIC_LUPUS_ERYT
HEMATOSUS 113 0.25 3.12 0.000 0.000 0.002
41
REACTOME_SCF_BETA_TRCP_
MEDIATED_DEGRADATION_OF
_EMI1
48 0.38 3.12 0.000 0.000 0.002
42 REACTOME_REGULATION_OF_
APOPTOSIS 53 0.37 3.11 0.000 0.000 0.002
43 REACTOME_P53_DEPENDENT_
G1_DNA_DAMAGE_RESPONSE 52 0.36 3.10 0.000 0.000 0.002
44
REACTOME_APC_C_CDC20_ME
DIATED_DEGRADATION_OF_MI
TOTIC_PROTEINS
64 0.33 3.07 0.000 0.000 0.002
45 REACTOME_AUTODEGRADATI
ON_OF_CDH1_BY_CDH1_APC_C 56 0.35 3.02 0.000 0.000 0.002
46
REACTOME_REGULATION_OF_
ORNITHINE_DECARBOXYLASE
_ODC
47 0.37 3.01 0.000 0.000 0.002
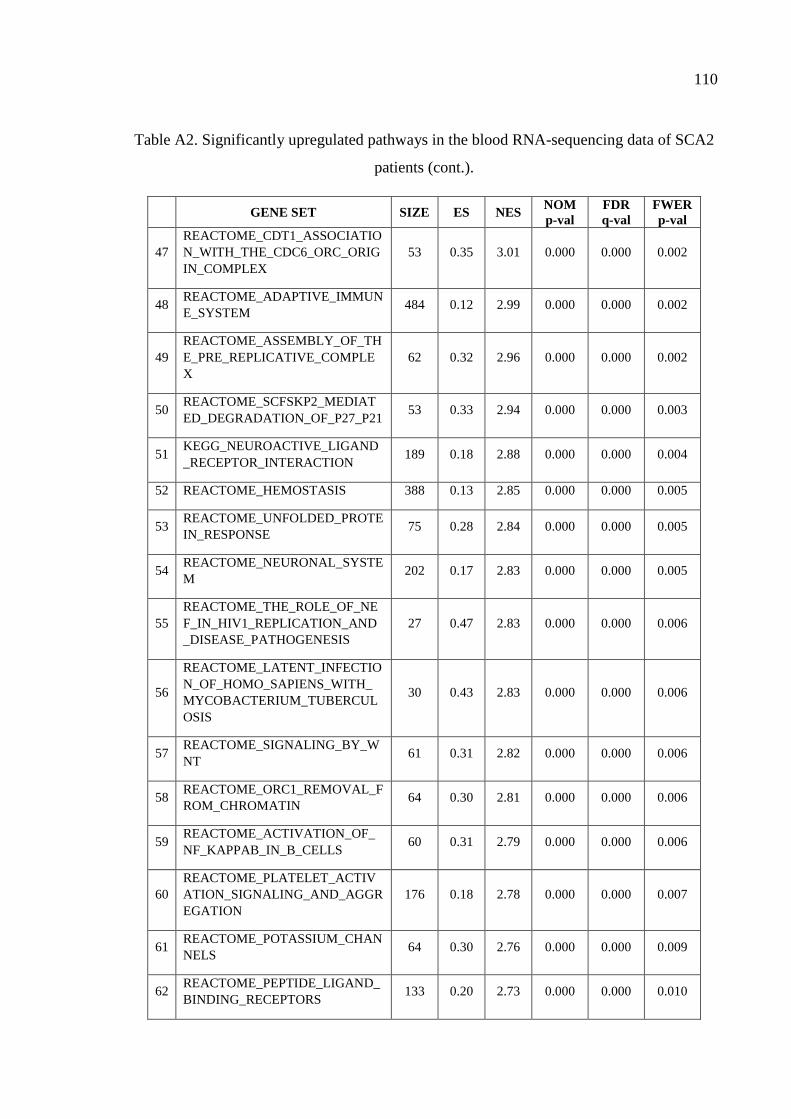
110
Table A2. Significantly upregulated pathways in the blood RNA-sequencing data of SCA2
patients (cont.).
GENE SET SIZE ES NES
NOM
p-val
FDR
q-val
FWER
p-val
47
REACTOME_CDT1_ASSOCIATIO
N_WITH_THE_CDC6_ORC_ORIG
IN_COMPLEX
53 0.35 3.01 0.000 0.000 0.002
48 REACTOME_ADAPTIVE_IMMUN
E_SYSTEM 484 0.12 2.99 0.000 0.000 0.002
49
REACTOME_ASSEMBLY_OF_TH
E_PRE_REPLICATIVE_COMPLE
X
62 0.32 2.96 0.000 0.000 0.002
50 REACTOME_SCFSKP2_MEDIAT
ED_DEGRADATION_OF_P27_P21 53 0.33 2.94 0.000 0.000 0.003
51 KEGG_NEUROACTIVE_LIGAND
_RECEPTOR_INTERACTION 189 0.18 2.88 0.000 0.000 0.004
52 REACTOME_HEMOSTASIS 388 0.13 2.85 0.000 0.000 0.005
53 REACTOME_UNFOLDED_PROTE
IN_RESPONSE 75 0.28 2.84 0.000 0.000 0.005
54 REACTOME_NEURONAL_SYSTE
M 202 0.17 2.83 0.000 0.000 0.005
55
REACTOME_THE_ROLE_OF_NE
F_IN_HIV1_REPLICATION_AND
_DISEASE_PATHOGENESIS
27 0.47 2.83 0.000 0.000 0.006
56
REACTOME_LATENT_INFECTIO
N_OF_HOMO_SAPIENS_WITH_
MYCOBACTERIUM_TUBERCUL
OSIS
30 0.43 2.83 0.000 0.000 0.006
57 REACTOME_SIGNALING_BY_W
NT 61 0.31 2.82 0.000 0.000 0.006
58 REACTOME_ORC1_REMOVAL_F
ROM_CHROMATIN 64 0.30 2.81 0.000 0.000 0.006
59 REACTOME_ACTIVATION_OF_
NF_KAPPAB_IN_B_CELLS 60 0.31 2.79 0.000 0.000 0.006
60
REACTOME_PLATELET_ACTIV
ATION_SIGNALING_AND_AGGR
EGATION
176 0.18 2.78 0.000 0.000 0.007
61 REACTOME_POTASSIUM_CHAN
NELS 64 0.30 2.76 0.000 0.000 0.009
62 REACTOME_PEPTIDE_LIGAND_
BINDING_RECEPTORS 133 0.20 2.73 0.000 0.000 0.010
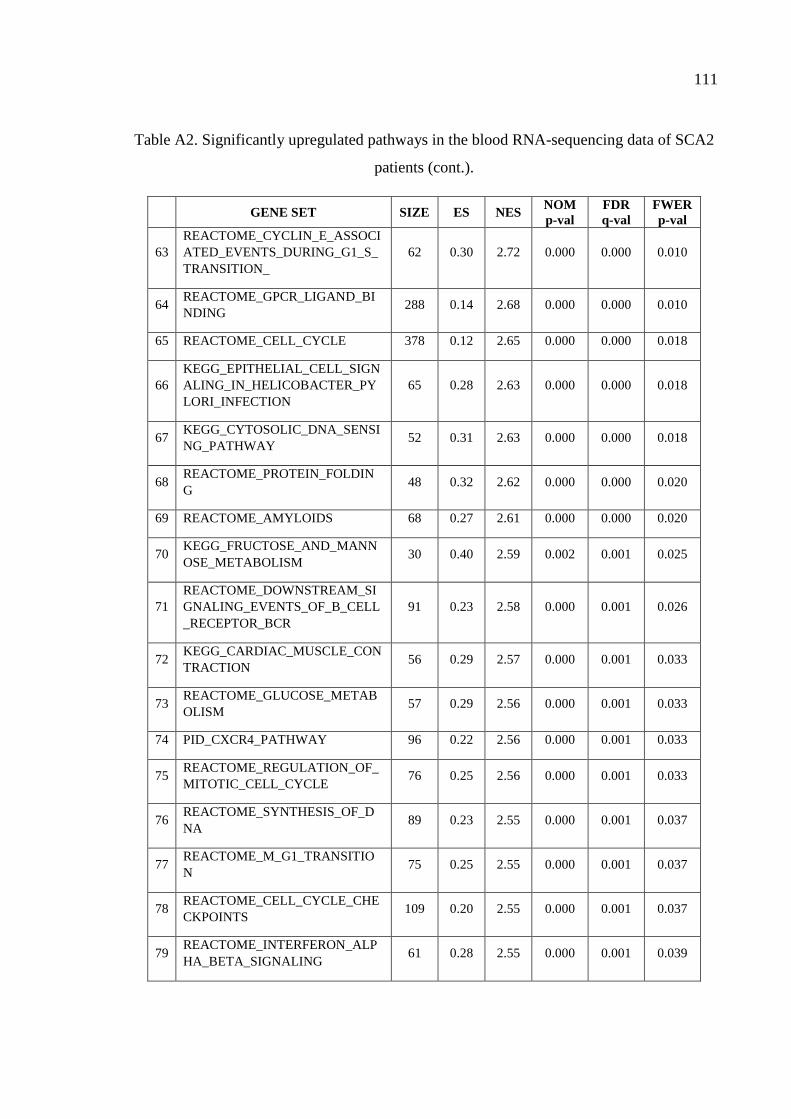
111
Table A2. Significantly upregulated pathways in the blood RNA-sequencing data of SCA2
patients (cont.).
GENE SET SIZE ES NES NOM
p-val
FDR
q-val
FWER
p-val
63
REACTOME_CYCLIN_E_ASSOCI
ATED_EVENTS_DURING_G1_S_
TRANSITION_
62 0.30 2.72 0.000 0.000 0.010
64 REACTOME_GPCR_LIGAND_BI
NDING 288 0.14 2.68 0.000 0.000 0.010
65 REACTOME_CELL_CYCLE 378 0.12 2.65 0.000 0.000 0.018
66
KEGG_EPITHELIAL_CELL_SIGN
ALING_IN_HELICOBACTER_PY
LORI_INFECTION
65 0.28 2.63 0.000 0.000 0.018
67 KEGG_CYTOSOLIC_DNA_SENSI
NG_PATHWAY 52 0.31 2.63 0.000 0.000 0.018
68 REACTOME_PROTEIN_FOLDIN
G 48 0.32 2.62 0.000 0.000 0.020
69 REACTOME_AMYLOIDS 68 0.27 2.61 0.000 0.000 0.020
70 KEGG_FRUCTOSE_AND_MANN
OSE_METABOLISM 30 0.40 2.59 0.002 0.001 0.025
71
REACTOME_DOWNSTREAM_SI
GNALING_EVENTS_OF_B_CELL
_RECEPTOR_BCR
91 0.23 2.58 0.000 0.001 0.026
72 KEGG_CARDIAC_MUSCLE_CON
TRACTION 56 0.29 2.57 0.000 0.001 0.033
73 REACTOME_GLUCOSE_METAB
OLISM 57 0.29 2.56 0.000 0.001 0.033
74 PID_CXCR4_PATHWAY 96 0.22 2.56 0.000 0.001 0.033
75 REACTOME_REGULATION_OF_
MITOTIC_CELL_CYCLE 76 0.25 2.56 0.000 0.001 0.033
76 REACTOME_SYNTHESIS_OF_D
NA 89 0.23 2.55 0.000 0.001 0.037
77 REACTOME_M_G1_TRANSITIO
N 75 0.25 2.55 0.000 0.001 0.037
78 REACTOME_CELL_CYCLE_CHE
CKPOINTS 109 0.20 2.55 0.000 0.001 0.037
79 REACTOME_INTERFERON_ALP
HA_BETA_SIGNALING 61 0.28 2.55 0.000 0.001 0.039
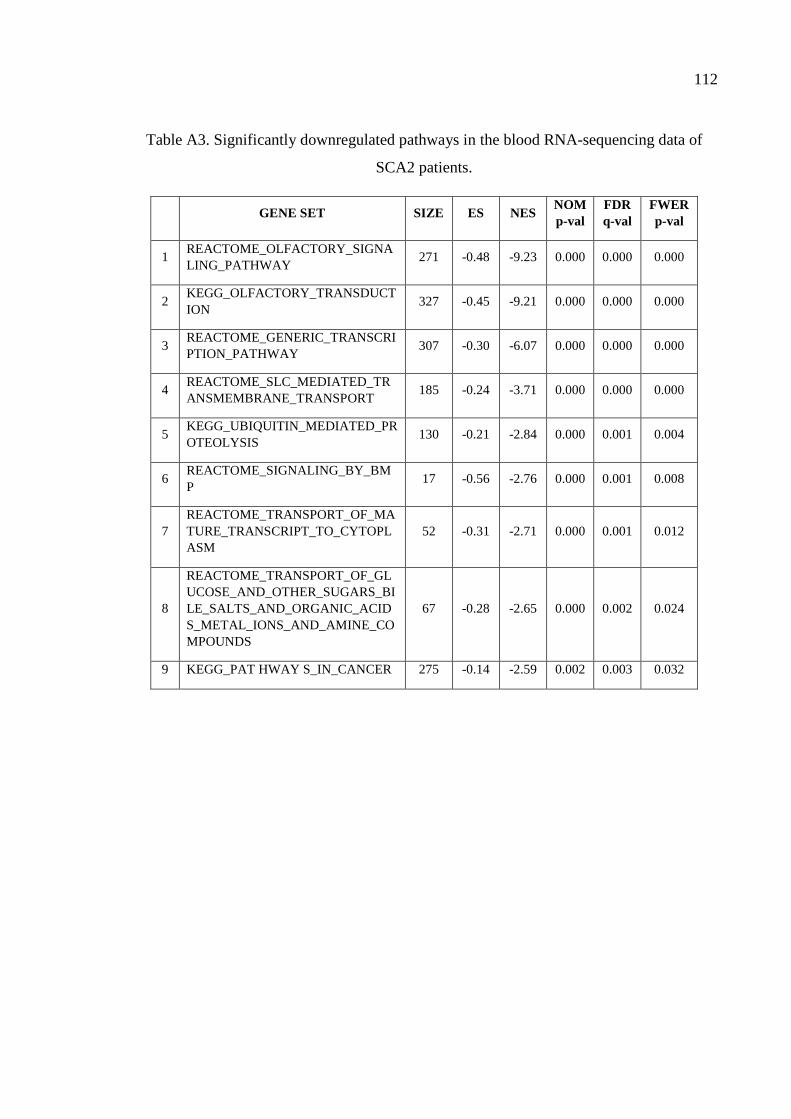
112
Table A3. Significantly downregulated pathways in the blood RNA-sequencing data of
SCA2 patients.
GENE SET SIZE ES NES
NOM
p-val
FDR
q-val
FWER
p-val
1 REACTOME_OLFACTORY_SIGNA
LING_PATHWAY 271 -0.48 -9.23 0.000 0.000 0.000
2 KEGG_OLFACTORY_TRANSDUCT
ION 327 -0.45 -9.21 0.000 0.000 0.000
3 REACTOME_GENERIC_TRANSCRI
PTION_PATHWAY 307 -0.30 -6.07 0.000 0.000 0.000
4 REACTOME_SLC_MEDIATED_TR
ANSMEMBRANE_TRANSPORT 185 -0.24 -3.71 0.000 0.000 0.000
5 KEGG_UBIQUITIN_MEDIATED_PR
OTEOLYSIS 130 -0.21 -2.84 0.000 0.001 0.004
6 REACTOME_SIGNALING_BY_BM
P 17 -0.56 -2.76 0.000 0.001 0.008
7
REACTOME_TRANSPORT_OF_MA
TURE_TRANSCRIPT_TO_CYTOPL
ASM
52 -0.31 -2.71 0.000 0.001 0.012
8
REACTOME_TRANSPORT_OF_GL
UCOSE_AND_OTHER_SUGARS_BI
LE_SALTS_AND_ORGANIC_ACID
S_METAL_IONS_AND_AMINE_CO
MPOUNDS
67 -0.28 -2.65 0.000 0.002 0.024
9 KEGG_PAT HWAY S_IN_CANCER 275 -0.14 -2.59 0.002 0.003 0.032
113
APPENDIX B: PUBLICATIONS
Two scientific papers published during this thesis are:
Halbach MV, Stehning T, Damrath E, Jendrach M, Şen NE, Başak AN, Auburger G. “Both
ubiquitin ligases FBXW8 and PARK2 are sequestrated into insolubility by ATXN2
PolyQ expansions, but only FBXW8 expression is dysregulated.” Public Library of
Science One, 2015 Mar 19;10(3):e0121089.
Özoğuz A, Uyan Ö, Birdal G, Iskender C, Kartal E, Lahut S, Ömür Ö, Agim ZS, Eken AG,
Sen NE, Kavak P, Saygı C, Sapp PC, Keagle P, Parman Y, Tan E, Koç F, Deymeer
F, Oflazer P, Hanağası H, Gürvit H, Bilgiç B, Durmuş H, Ertaş M, Kotan D, Akalın
MA, Güllüoğlu H, Zarifoğlu M, Aysal F, Döşoğlu N, Bilguvar K, Günel M, Keskin
Ö, Akgün T, Özçelik H, Landers JE, Brown RH, Başak AN. “The distinct genetic
pattern of ALS in Turkey and novel mutations.” Neurobiology of Aging, 2015
Apr;36(4):1764.e9-18.
114
REFERENCES
Adanyeguh, I.M., P.-G. Henry, T.M. Nguyen, D. Rinaldi, C. Jauffret, R. Valabregue, U.E.
Emir, D.K. Deelchand, A. Brice, L.E. Eberly, G. Öz, A. Durr and F. Mochel, 2015,
"In Vivo Neurometabolic Profiling in Patients with Spinocerebellar Ataxia Types 1,
2, 3, and 7", Movement Disorders : Official Journal of the Movement Disorder
Society, Vol. 30, No. 5, pp. 662-670.
Aguiar, J., S. Santurlidis, J. Nowok, C. Alexander, D. Rudnicki, S. Gispert, W. Schulz and
G. Auburger, 1999, "Identification of the Physiological Promoter for
Spinocerebellar Ataxia 2 Gene Reveals a Cpg Island for Promoter Activity Situated
into the Exon 1 of This Gene and Provides Data About the Origin of the
Nonmethylated State of These Types of Islands", Biochemical and Biophysical
Research Communications, Vol. 254, No. 2, pp. 315-318.
Al-Mahdawi, S., R.M. Pinto, D. Varshney, L. Lawrence, M.B. Lowrie, S. Hughes, Z.
Webster, J. Blake, J.M. Cooper, R. King and M.A. Pook, 2006, "Gaa Repeat
Expansion Mutation Mouse Models of Friedreich Ataxia Exhibit Oxidative Stress
Leading to Progressive Neuronal and Cardiac Pathology", Genomics, Vol. 88, No.
5, pp. 580-590.
Al-Ramahi, I., A.M. Pérez, J. Lim, M. Zhang, R. Sorensen, M. De Haro, J. Branco, S.M.
Pulst, H.Y. Zoghbi and J. Botas, 2007, "Dataxin-2 Mediates Expanded Ataxin-1-
Induced Neurodegeneration in a Drosophila Model of Sca1", Public Library of
Science Genetics, Vol. 3, No. 12, pp. 2551-2564.
Albrecht, M., M. Golatta, U. Wüllner and T. Lengauer, 2004, "Structural and Functional
Analysis of Ataxin-2 and Ataxin-3", European Journal of Biochemistry / FEBS,
Vol. 271, No. 15, pp. 3155-3170.
115
Albrecht, M. and T. Lengauer, 2004, "Survey on the Pabc Recognition Motif Pam2",
Biochemical and Biophysical Research Communications, Vol. 316, No. 1, pp. 129-
138.
Almaguer-Mederos, L.E., N.S. Falcón, Y.R. Almira, Y.G. Zaldivar, D.C. Almarales, E.M.
Góngora, M. Herrera, K.E. Batallán, R.R. Armiñán, M.V. Manresa, G.S. Cruz, J.
Laffita-Mesa, T.M. Cyuz, V. Chang, G. Auburger, S. Gispert and L.V. Pérez, 2010,
"Estimation of the Age at Onset in Spinocerebellar Ataxia Type 2 Cuban Patients
by Survival Analysis", Clinical Genetics, Vol. 78, No. 4, pp. 169-174.
Apps, R. and M. Garwicz, 2005, "Anatomical and Physiological Foundations of Cerebellar
Information Processing", Nature Reviews. Neuroscience, Vol. 6, No. 4, pp. 297-
311.
Babovic-Vuksanovic, D., K. Snow, M.C. Patterson and V.V. Michels, 1998,
"Spinocerebellar Ataxia Type 2 (Sca 2) in an Infant with Extreme Cag Repeat
Expansion", American Journal of Medical Genetics, Vol. 79, No. 5, pp. 383-387.
Bauer, P.O., A. Zumrova, V. Matoska, K. Mitsui and P. Goetz, 2004, "Can Ataxin-2 Be
Down-Regulated by Allele-Specific De Novo DNA Methylation in Sca2 Patients?",
Medical Hypotheses, Vol. 63, No. 6, pp. 1018-1023.
Biedler, J.L., S. Roffler-Tarlov, M. Schachner and L.S. Freedman, 1978, "Multiple
Neurotransmitter Synthesis by Human Neuroblastoma Cell Lines and Clones",
Cancer Research, Vol. 38, No. 11, pp. 3751-3757.
Brais, B., J.P. Bouchard, Y.G. Xie, D.L. Rochefort, N. Chrétien, F.M. Tomé, R.G.
Lafrenière, J.M. Rommens, E. Uyama, O. Nohira, S. Blumen, A.D. Korczyn, P.
Heutink, J. Mathieu, A. Duranceau, F. Codère, M. Fardeau, G.A. Rouleau and A.D.
Korcyn, 1998, "Short Gcg Expansions in the Pabp2 Gene Cause Oculopharyngeal
Muscular Dystrophy", Nature Genetics, Vol. 18, No. 2, pp. 164-167.
116
Cancel, G., A. Dürr, O. Didierjean, G. Imbert, K. Bürk, A. Lezin, S. Belal, A. Benomar, M.
Abada-Bendib, C. Vial, J. Guimarães, H. Chneiweiss, G. Stevanin, G. Yvert, N.
Abbas, F. Saudou, A.S. Lebre, M. Yahyaoui, F. Hentati, J.C. Vernant, T.
Klockgether, J.L. Mandel, Y. Agid and A. Brice, 1997, "Molecular and Clinical
Correlations in Spinocerebellar Ataxia 2: A Study of 32 Families", Human
Molecular Genetics, Vol. 6, No. 5, pp. 709-715.
Cellini, E., P. Forleo, B. Nacmias, A. Tedde, S. Latorraca, S. Piacentini, L. Parnetti, V.
Gallai and S. Sorbi, 2001, "Clinical and Genetic Analysis of Hereditary and
Sporadic Ataxia in Central Italy", Brain Research Bulletin, Vol. 56, No. 3-4, pp.
363-366.
Chakor, R.T. and H. Bharote, 2012, "Inherited Ataxia with Slow Saccades", Journal of
Postgraduate Medicine, Vol. 58, No. 4, pp. 318-325.
Charles, P., A. Camuzat, N. Benammar, F. Sellal, A. Destée, A.M. Bonnet, S. Lesage, I. Le
Ber, G. Stevanin, A. Dürr and A. Brice, 2007, "Are Interrupted Sca2 Cag Repeat
Expansions Responsible for Parkinsonism?", Neurology, Vol. 69, No. 21, pp. 1970-
1975.
Chiò, A., A. Calvo, C. Moglia, A. Canosa, M. Brunetti, M. Barberis, G. Restagno, A.
Conte, G. Bisogni, G. Marangi, A. Moncada, S. Lattante, M. Zollino, M. Sabatelli,
A. Bagarotti, L. Corrado, G. Mora, E. Bersano, L. Mazzini and S. D'Alfonso, 2015,
"Atxn2 Polyq Intermediate Repeats Are a Modifier of Als Survival", Neurology,
Vol. 84, No. 3, pp. 251-258.
Choudhry, S., M. Mukerji, a.K. Srivastava, S. Jain and S.K. Brahmachari, 2001, "Cag
Repeat Instability at Sca2 Locus: Anchoring Caa Interruptions and Linked Single
Nucleotide Polymorphisms", Human Molecular Genetics, Vol. 10, No. 21, pp.
2437-2446.
Comuzzie, A.G., S.A. Cole, S.L. Laston, V.S. Voruganti, K. Haack, R.A. Gibbs and N.F.
Butte, 2012, "Novel Genetic Loci Identified for the Pathophysiology of Childhood
117
Obesity in the Hispanic Population", Public Library of Science One, Vol. 7, No. 12,
pp. e51954-e51954.
Costanzi-Porrini, S., D. Tessarolo, C. Abbruzzese, M. Liguori, T. Ashizawa and M.
Giacanelli, 2000, "An Interrupted 34-Cag Repeat Sca-2 Allele in Patients with
Sporadic Spinocerebellar Ataxia", Neurology, Vol. 54, No. 2, pp. 491-493.
Crespo-Barreto, J., J.D. Fryer, C.A. Shaw, H.T. Orr and H.Y. Zoghbi, 2010, "Partial Loss
of Ataxin-1 Function Contributes to Transcriptional Dysregulation in
Spinocerebellar Ataxia Type 1 Pathogenesis", Public Library of Science Genetics,
Vol. 6, No. 7, pp. e1001021-e1001021.
Czeredys, M., J. Gruszczynska-Biegala, T. Schacht, A. Methner and J. Kuznicki, 2013,
"Expression of Genes Encoding the Calcium Signalosome in Cellular and
Transgenic Models of Huntington's Disease", Frontiers in Molecular Neuroscience,
Vol. 6, pp. 42-42.
DeJesus-Hernandez, M., I.R. Mackenzie, B.F. Boeve, A.L. Boxer, M. Baker, N.J.
Rutherford, A.M. Nicholson, N.A. Finch, H. Flynn, J. Adamson, N. Kouri, A.
Wojtas, P. Sengdy, G.-Y.R. Hsiung, A. Karydas, W.W. Seeley, K.A. Josephs, G.
Coppola, D.H. Geschwind, Z.K. Wszolek, H. Feldman, D.S. Knopman, R.C.
Petersen, B.L. Miller, D.W. Dickson, K.B. Boylan, N.R. Graff-Radford and R.
Rademakers, 2011, "Expanded Ggggcc Hexanucleotide Repeat in Noncoding
Region of C9orf72 Causes Chromosome 9p-Linked Ftd and Als", Neuron, Vol. 72,
No. 2, pp. 245-256.
DeMille, D., B.D. Badal, J.B. Evans, a.D. Mathis, J.F. Anderson and J.H. Grose, 2014,
"Pas Kinase Is Activated by Direct Snf1-Dependent Phosphorylation and Mediates
Inhibition of Torc1 through the Phosphorylation and Activation of Pbp1",
Molecular Biology of the Cell, Vol. 26, No. 3, pp. 569-582.
118
Egorova, P., E. Popugaeva and I. Bezprozvanny, 2015, "Disturbed Calcium Signaling in
Spinocerebellar Ataxias and Alzheimer's Disease", Seminars in Cell &
Developmental Biology, pp. 1-7.
Elden, A.C., H.-J. Kim, M.P. Hart, A.S. Chen-Plotkin, B.S. Johnson, X. Fang, M.
Armakola, F. Geser, R. Greene, M.M. Lu, A. Padmanabhan, D. Clay-Falcone, L.
McCluskey, L. Elman, D. Juhr, P.J. Gruber, U. Rüb, G. Auburger, J.Q.
Trojanowski, V.M.Y. Lee, V.M. Van Deerlin, N.M. Bonini and A.D. Gitler, 2010,
"Ataxin-2 Intermediate-Length Polyglutamine Expansions Are Associated with
Increased Risk for Als", Nature, Vol. 466, No. 7310, pp. 1069-1075.
Farg, M.a., K.Y. Soo, S.T. Warraich, V. Sundaramoorthy, I.P. Blair and J.D. Atkin, 2013,
"Ataxin-2 Interacts with Fus and Intermediate-Length Polyglutamine Expansions
Enhance Fus-Related Pathology in Amyotrophic Lateral Sclerosis", Human
Molecular Genetics, Vol. 22, No. 4, pp. 717-728.
Fecto, F., J. Yan, S.P. Vemula, E. Liu, Y. Yang, W. Chen, J.G. Zheng, Y. Shi, N. Siddique,
H. Arrat, S. Donkervoort, S. Ajroud-Driss, R.L. Sufit, S.L. Heller, H.-X. Deng and
T. Siddique, 2011, "Sqstm1 Mutations in Familial and Sporadic Amyotrophic
Lateral Sclerosis", Archives of Neurology, Vol. 68, No. 11, pp. 1440-1446.
Figley, M.D., G. Bieri, R.-M. Kolaitis, J.P. Taylor and A.D. Gitler, 2014, "Profilin 1
Associates with Stress Granules and Als-Linked Mutations Alter Stress Granule
Dynamics", The Journal of Neuroscience, Vol. 34, No. 24, pp. 8083-8097.
Fittschen, M., I. Lastres-Becker, M.V. Halbach, E. Damrath, S. Gispert, M. Azizov, M.
Walter, S. Müller and G. Auburger, 2015, "Genetic Ablation of Ataxin-2 Increases
Several Global Translation Factors in Their Transcript Abundance but Decreases
Translation Rate", Neurogenetics.
Furtado, S., M. Farrer, Y. Tsuboi, M.L. Klimek, R. de la Fuente-Fernández, J. Hussey, P.
Lockhart, D.B. Calne, O. Suchowersky, A.J. Stoessl and Z.K. Wszolek, 2002, "Sca-
119
2 Presenting as Parkinsonism in an Alberta Family: Clinical, Genetic, and Pet
Findings", Neurology, Vol. 59, No. 10, pp. 1625-1627.
Gal, J., A.-L. Ström, R. Kilty, F. Zhang and H. Zhu, 2007, "P62 Accumulates and
Enhances Aggregate Formation in Model Systems of Familial Amyotrophic Lateral
Sclerosis", The Journal of Biological Chemistry, Vol. 282, No. 15, pp. 11068-
11077.
Geschwind, D.H., S. Perlman, C.P. Figueroa, L.J. Treiman and S.M. Pulst, 1997, "The
Prevalence and Wide Clinical Spectrum of the Spinocerebellar Ataxia Type 2
Trinucleotide Repeat in Patients with Autosomal Dominant Cerebellar Ataxia",
American Journal of Human Genetics, Vol. 60, No. 4, pp. 842-850.
Gettins, P.G.W., 2002, "Serpin Structure, Mechanism, and Function", Chemical Reviews,
Vol. 102, No. 12, pp. 4751-4804.
Gijbels, K., S. Masure, H. Carton and G. Opdenakker, 1992, "Gelatinase in the
Cerebrospinal Fluid of Patients with Multiple Sclerosis and Other Inflammatory
Neurological Disorders", Journal of Neuroimmunology, Vol. 41, No. 1, pp. 29-34.
Gispert, S., R. Twells, G. Orozco, A. Brice, J. Weber, L. Heredero, K. Scheufler, B. Riley,
R. Allotey and C. Nothers, 1993, "Chromosomal Assignment of the Second Locus
for Autosomal Dominant Cerebellar Ataxia (Sca2) to Chromosome 12q23-24.1",
Nature Genetics, Vol. 4, No. 3, pp. 295-299.
Goldbaum, O. and C. Richter-Landsberg, 2004, "Proteolytic Stress Causes Heat Shock
Protein Induction, Tau Ubiquitination, and the Recruitment of Ubiquitin to Tau-
Positive Aggregates in Oligodendrocytes in Culture", The Journal of Neuroscience,
Vol. 24, No. 25, pp. 5748-5757.
Gorman, G.S., G. Pfeffer, H. Griffin, E.L. Blakely, M. Kurzawa-Akanbi, J. Gabriel, K.
Sitarz, M. Roberts, B. Schoser, A. Pyle, A.M. Schaefer, R. McFarland, D.M.
Turnbull, R. Horvath, P.F. Chinnery and R.W. Taylor, 2015, "Clonal Expansion of
120
Secondary Mitochondrial DNA Deletions Associated with Spinocerebellar Ataxia
Type 28", JAMA Neurology, Vol. 72, No. 1, pp. 106-111.
Halbach, M.V., T. Stehning, E. Damrath, M. Jendrach, N.E. Şen, a.N. Başak and G.
Auburger, 2015, "Both Ubiquitin Ligases Fbxw8 and Park2 Are Sequestrated into
Insolubility by Atxn2 Polyq Expansions, but Only Fbxw8 Expression Is
Dysregulated", Public Library of Science One, Vol. 10, No. 3, pp. e0121089-
e0121089.
Hallen, L., H. Klein, C. Stoschek, S. Wehrmeyer, U. Nonhoff, M. Ralser, J. Wilde, C.
Röhr, M.R. Schweiger, K. Zatloukal, M. Vingron, H. Lehrach, Z. Konthur and S.
Krobitsch, 2011, "The Krab-Containing Zinc-Finger Transcriptional Regulator
Zbrk1 Activates Sca2 Gene Transcription through Direct Interaction with Its Gene
Product, Ataxin-2", Human Molecular Genetics, Vol. 20, No. 1, pp. 104-114.
Hansen, S.T., P. Meera, T.S. Otis and S.M. Pulst, 2013, "Changes in Purkinje Cell Firing
and Gene Expression Precede Behavioral Pathology in a Mouse Model of Sca2",
Human Molecular Genetics, Vol. 22, No. 2, pp. 271-283.
Hart, M.P. and A.D. Gitler, 2012, "Als-Associated Ataxin 2 Polyq Expansions Enhance
Stress-Induced Caspase 3 Activation and Increase Tdp-43 Pathological
Modifications", The Journal of Neuroscience, Vol. 32, No. 27, pp. 9133-9142.
Hayes, S., G. Turecki, K. Brisebois, I. Lopes-Cendes, C. Gaspar, O. Riess, L.P. Ranum,
S.M. Pulst and G.a. Rouleau, 2000, "Cag Repeat Length in Rai1 Is Associated with
Age at Onset Variability in Spinocerebellar Ataxia Type 2 (Sca2)", Human
Molecular Genetics, Vol. 9, No. 12, pp. 1753-1758.
He, W. and R. Parker, 2000, "Functions of Lsm Proteins in Mrna Degradation and
Splicing", Current Opinion in Cell Biology, Vol. 12, No. 3, pp. 346-350.
Hekman, K.E. and C.M. Gomez, 2015, "The Autosomal Dominant Spinocerebellar
Ataxias: Emerging Mechanistic Themes Suggest Pervasive Purkinje Cell
121
Vulnerability", Journal of Neurology, Neurosurgery, and Psychiatry, Vol. 86, No.
5, pp. 554-561.
Hiji, M., T. Takahashi, H. Fukuba, H. Yamashita, T. Kohriyama and M. Matsumoto, 2008,
"White Matter Lesions in the Brain with Frontotemporal Lobar Degeneration with
Motor Neuron Disease: Tdp-43-Immunopositive Inclusions Co-Localize with P62,
but Not Ubiquitin", Acta Neuropathologica, Vol. 116, No. 2, pp. 183-191.
Homma, T., D. Ishibashi, T. Nakagaki, K. Satoh, K. Sano, R. Atarashi and N. Nishida,
2014, "Increased Expression of P62/Sqstm1 in Prion Diseases and Its Association
with Pathogenic Prion Protein", Scientific Reports, Vol. 4, pp. 4504-4504.
Huynh, D.P., M.R. Del Bigio, D.H. Ho and S.M. Pulst, 1999, "Expression of Ataxin-2 in
Brains from Normal Individuals and Patients with Alzheimer's Disease and
Spinocerebellar Ataxia 2", Annals of Neurology, Vol. 45, No. 2, pp. 232-241.
Huynh, D.P., H.T. Yang, H. Vakharia, D. Nguyen and S.M. Pulst, 2003, "Expansion of the
Polyq Repeat in Ataxin-2 Alters Its Golgi Localization, Disrupts the Golgi
Complex and Causes Cell Death", Human Molecular Genetics, Vol. 12, No. 13, pp.
1485-1496.
Imbert, G., F. Saudou, G. Yvert, D. Devys, Y. Trottier, J.-M. Garnier, C. Weber, J.-L.
Mandel, G. Cancel, N. Abbas, A. Dürr, O. Didierjean, G. Stevanin, Y. Agid and A.
Brice, 1996, "Cloning of the Gene for Spinocerebellar Ataxia 2 Reveals a Locus
with High Sensitivity to Expanded Cag/Glutamine Repeats", Nature Genetics, Vol.
14, No. 3, pp. 285-291.
Inuzuka, M., M. Hayakawa and T. Ingi, 2005, "Serinc, an Activity-Regulated Protein
Family, Incorporates Serine into Membrane Lipid Synthesis", The Journal of
Biological Chemistry, Vol. 280, No. 42, pp. 35776-35783.
Jin, S.M. and R.J. Youle, 2012, "Pink1- and Parkin-Mediated Mitophagy at a Glance",
Journal of Cell Science, Vol. 125, No. Pt 4, pp. 795-799.
122
Jobling, R.K., M. Assoum, O. Gakh, S. Blaser, J.A. Raiman, C. Mignot, E. Roze, A. Dürr,
A. Brice, N. Lévy, C. Prasad, T. Paton, A.D. Paterson, N.M. Roslin, C.R. Marshall,
J.-P. Desvignes, N. Roëckel-Trevisiol, S.W. Scherer, G.A. Rouleau, A. Mégarbané,
G. Isaya, V. Delague and G. Yoon, 2015, "Pmpca Mutations Cause Abnormal
Mitochondrial Protein Processing in Patients with Non-Progressive Cerebellar
Ataxia", Brain.
Johnson, J.O., E.P. Pioro, A. Boehringer, R. Chia, H. Feit, A.E. Renton, H.A. Pliner, Y.
Abramzon, G. Marangi, B.J. Winborn, J.R. Gibbs, M.A. Nalls, S. Morgan, M.
Shoai, J. Hardy, A. Pittman, R.W. Orrell, A. Malaspina, K.C. Sidle, P. Fratta, M.B.
Harms, R.H. Baloh, A. Pestronk, C.C. Weihl, E. Rogaeva, L. Zinman, V.E. Drory,
G. Borghero, G. Mora, A. Calvo, J.D. Rothstein, C. Drepper, M. Sendtner, A.B.
Singleton, J.P. Taylor, M.R. Cookson, G. Restagno, M. Sabatelli, R. Bowser, A.
Chiò and B.J. Traynor, 2014, "Mutations in the Matrin 3 Gene Cause Familial
Amyotrophic Lateral Sclerosis", Nature Neuroscience, Vol. 17, No. 5, pp. 664-666.
Juvonen, V., M. Hietala, V. Kairisto and M.L. Savontaus, 2005, "The Occurrence of
Dominant Spinocerebellar Ataxias among 251 Finnish Ataxia Patients and the Role
of Predisposing Large Normal Alleles in a Genetically Isolated Population", Acta
Neurologica Scandinavica, Vol. 111, No. 3, pp. 154-162.
Kaneko, M., M. Ishiguro, Y. Niinuma, M. Uesugi and Y. Nomura, 2002, "Human Hrd1
Protects against Er Stress-Induced Apoptosis through Er-Associated Degradation",
FEBS Letters, Vol. 532, No. 1-2, pp. 147-152.
Kaplan, A., K.J. Spiller, C. Towne, K.C. Kanning, G.T. Choe, A. Geber, T. Akay, P.
Aebischer and C.E. Henderson, 2014, "Neuronal Matrix Metalloproteinase-9 Is a
Determinant of Selective Neurodegeneration", Neuron, Vol. 81, No. 2, pp. 333-348.
Kathiresan, S., A.K. Manning, S. Demissie, R.B. D'Agostino, A. Surti, C. Guiducci, L.
Gianniny, N.P. Burtt, O. Melander, M. Orho-Melander, D.K. Arnett, G.M. Peloso,
J.M. Ordovas and L.A. Cupples, 2007, "A Genome-Wide Association Study for
123
Blood Lipid Phenotypes in the Framingham Heart Study", BioMed Central Medical
Genetics, Vol. 8 Suppl 1, pp. S17-S17.
Kiehl, T.-R., A. Nechiporuk, K.P. Figueroa, M.T. Keating, D.P. Huynh and S.-M. Pulst,
2006, "Generation and Characterization of Sca2 (Ataxin-2) Knockout Mice",
Biochemical and Biophysical Research Communications, Vol. 339, No. 1, pp. 17-
24.
Kitada, T., S. Asakawa, N. Hattori, H. Matsumine, Y. Yamamura, S. Minoshima, M.
Yokochi, Y. Mizuno and N. Shimizu, 1998, "Mutations in the Parkin Gene Cause
Autosomal Recessive Juvenile Parkinsonism", Nature, Vol. 392, No. 6676, pp. 605-
608.
Klinkenberg, M., S. Gispert, J.A. Dominguez-Bautista, I. Braun, G. Auburger and M.
Jendrach, 2012, "Restriction of Trophic Factors and Nutrients Induces Parkin
Expression", Neurogenetics, Vol. 13, No. 1, pp. 9-21.
Knight, S.J., A.V. Flannery, M.C. Hirst, L. Campbell, Z. Christodoulou, S.R. Phelps, J.
Pointon, H.R. Middleton-Price, A. Barnicoat and M.E. Pembrey, 1993,
"Trinucleotide Repeat Amplification and Hypermethylation of a Cpg Island in
Fraxe Mental Retardation", Cell, Vol. 74, No. 1, pp. 127-134.
Kobayashi, H., K. Abe, T. Matsuura, Y. Ikeda, T. Hitomi, Y. Akechi, T. Habu, W. Liu, H.
Okuda and A. Koizumi, 2011, "Expansion of Intronic Ggcctg Hexanucleotide
Repeat in Nop56 Causes Sca36, a Type of Spinocerebellar Ataxia Accompanied by
Motor Neuron Involvement", The American Journal of Human Genetics, Vol. 89,
No. 1, pp. 121-130.
Köttgen, A., C. Pattaro, C.a. Böger, C. Fuchsberger, M. Olden, N.L. Glazer, A. Parsa, X.
Gao, Q. Yang, A.V. Smith, J.R.O. Connell, M. Li, H. Schmidt and T. Tanaka,
2010, "Multiple Loci Associated with Indices of Renal Function and Chronic
Kidney Disease", Nature Genetics, Vol. 42, No. 5, pp. 376-384.
124
Laffita-Mesa, J.M., P.O. Bauer, V. Kourí, L.P. Serrano, J. Roskams, D.A. Gotay, J.C.M.
Brown, P.A.M. Rodríguez, Y. González-Zaldívar, L.A. Mederos, D. Cuello-
Almarales and J.A. Santiago, 2012, "Epigenetics DNA Methylation in the Core
Ataxin-2 Gene Promoter: Novel Physiological and Pathological Implications",
Human Genetics, Vol. 131, pp. 625-638.
Lagathu, C., C. Christodoulides, S. Virtue, W.P. Cawthorn, C. Franzin, W.A. Kimber, E.D.
Nora, M. Campbell, G. Medina-Gomez, B.N.R. Cheyette, A.J. Vidal-Puig and J.K.
Sethi, 2009, "Dact1, a Nutritionally Regulated Preadipocyte Gene, Controls
Adipogenesis by Coordinating the Wnt/Beta-Catenin Signaling Network",
Diabetes, Vol. 58, No. 3, pp. 609-619.
Lahut, S., Ö. Ömür, Ö. Uyan, Z.S. Aǧim, A. Özoǧuz, Y. Parman, F. Deymeer, P. Oflazer,
F. Koç, H. Özçelik, G. Auburger and a.N. Başak, 2012, "Atxn2 and Its
Neighbouring Gene Sh2b3 Are Associated with Increased Als Risk in the Turkish
Population", Public Library of Science One, Vol. 7, No. 8,
Lastres-Becker, I., S. Brodesser, D. Lütjohann, M. Azizov, J. Buchmann, E. Hintermann,
K. Sandhoff, A. Schürmann, J. Nowock and G. Auburger, 2008a, "Insulin Receptor
and Lipid Metabolism Pathology in Ataxin-2 Knock-out Mice", Human Molecular
Genetics, Vol. 17, No. 10, pp. 1465-1481.
Lastres-Becker, I., U. Rüb and G. Auburger, 2008b, "Spinocerebellar Ataxia 2 (Sca2)",
Cerebellum, Vol. 7, No. 2, pp. 115-124.
Lee, T., Y.R. Li, C. Ingre, M. Weber, T. Grehl, O. Gredal, M. de Carvalho, T. Meyer, O.-
B. Tysnes, G. Auburger, S. Gispert, N.M. Bonini, P.M. Andersen and A.D. Gitler,
2011, "Ataxin-2 Intermediate-Length Polyglutamine Expansions in European Als
Patients", Human Molecular Genetics, Vol. 20, No. 9, pp. 1697-1700.
Lessing, D. and N.M. Bonini, 2008, "Polyglutamine Genes Interact to Modulate the
Severity and Progression of Neurodegeneration in Drosophila", Public Library of
Science Biology, Vol. 6, No. 2, pp. e29-e29.
125
Li, S.-H. and X.-J. Li, 2004, "Huntingtin-Protein Interactions and the Pathogenesis of
Huntington's Disease", Trends in Genetics, Vol. 20, No. 3, pp. 146-154.
Li, Y.R., O.D. King, J. Shorter and A.D. Gitler, 2013, "Stress Granules as Crucibles of Als
Pathogenesis", Journal of Cell Biology, Vol. 201, No. 3, pp. 361-372.
Lilienbaum, A., 2013, "Relationship between the Proteasomal System and Autophagy",
International Journal of Biochemistry and Molecular Biology, Vol. 4, No. 1, pp. 1-
26.
Lim, J., J. Crespo-Barreto, P. Jafar-Nejad, A.B. Bowman, R. Richman, D.E. Hill, H.T. Orr
and H.Y. Zoghbi, 2008, "Opposing Effects of Polyglutamine Expansion on Native
Protein Complexes Contribute to Sca1", Nature, Vol. 452, No. 7188, pp. 713-718.
Lim, J., T. Hao, C. Shaw, A.J. Patel, G. Szabó, J.-F. Rual, C.J. Fisk, N. Li, A. Smolyar,
D.E. Hill, A.-L. Barabási, M. Vidal and H.Y. Zoghbi, 2006, "A Protein-Protein
Interaction Network for Human Inherited Ataxias and Disorders of Purkinje Cell
Degeneration", Cell, Vol. 125, No. 4, pp. 801-814.
Lim, J., M.L. Lachenmayer, S. Wu, W. Liu, M. Kundu, R. Wang, M. Komatsu, Y.J. Oh, Y.
Zhao and Z. Yue, 2015, "Proteotoxic Stress Induces Phosphorylation of
P62/Sqstm1 by Ulk1 to Regulate Selective Autophagic Clearance of Protein
Aggregates", Public Library of Science Genetics, Vol. 11, No. 2, pp. e1004987-
e1004987.
Lin, X., B. Antalffy, D. Kang, H.T. Orr and H.Y. Zoghbi, 2000, "Polyglutamine Expansion
Down-Regulates Specific Neuronal Genes before Pathologic Changes in Sca1",
Nature Neuroscience, Vol. 3, No. 2, pp. 157-163.
Liu, J., T.-S. Tang, H. Tu, O. Nelson, E. Herndon, D.P. Huynh, S.M. Pulst and I.
Bezprozvanny, 2009, "Deranged Calcium Signaling and Neurodegeneration in
126
Spinocerebellar Ataxia Type 2", The Journal of Neuroscience, Vol. 29, No. 29, pp.
9148-9162.
Liu, X., M. Lu, L. Tang, N. Zhang, D. Chui and D. Fan, 2013, "Atxn2 Cag Repeat
Expansions Increase the Risk for Chinese Patients with Amyotrophic Lateral
Sclerosis", Neurobiology of Aging, Vol. 34, No. 9, pp. 2236.e2235-2238.
Livak, K.J. and T.D. Schmittgen, 2001, "Analysis of Relative Gene Expression Data Using
Real-Time Quantitative Pcr and the 2(-Delta Delta C(T)) Method", Methods, Vol.
25, No. 4, pp. 402-408.
Lopes-Cendes, I., H.G. Teive, M.E. Calcagnotto, J.C. Da Costa, F. Cardoso, E. Viana, J.A.
Maciel, J. Radvany, W.O. Arruda, P.C. Trevisol-Bittencourt, P. Rosa Neto, I.
Silveira, C.E. Steiner, W. Pinto Júnior, A.S. Santos, Y. Correa Neto, L.C. Werneck,
A.Q. Araújo, G. Carakushansky, L.R. Mello, L.B. Jardim and G.A. Rouleau, 1997,
"Frequency of the Different Mutations Causing Spinocerebellar Ataxia (Sca1, Sca2,
Mjd/Sca3 and Drpla) in a Large Group of Brazilian Patients", Arquivos de Neuro-
psiquiatria, Vol. 55, No. 3B, pp. 519-529.
Mangus, D.a., M.C. Evans, N.S. Agrin, M. Smith, P. Gongidi, and A. Jacobson, 2004,
"Positive and Negative Regulation of Poly ( a ) Nuclease", Molecular Cell Biology,
Vol. 24, No. 12, pp. 5521-5533.
Mao, R., A.S. Aylsworth, N. Potter, W.G. Wilson, G. Breningstall, M.J. Wick, D. Babovic-
Vuksanovic, M. Nance, M.C. Patterson, C.M. Gomez and K. Snow, 2002,
"Childhood-Onset Ataxia: Testing for Large Cag-Repeats in Sca2 and Sca7",
American Journal of Medical Genetics, Vol. 110, No. 4, pp. 338-345.
Matilla-Dueñas, A., T. Ashizawa, A. Brice, S. Magri, K.N. McFarland, M. Pandolfo, S.M.
Pulst, O. Riess, D.C. Rubinsztein, J. Schmidt, T. Schmidt, D.R. Scoles, G.
Stevanin, F. Taroni, B.R. Underwood and I. Sánchez, 2014, "Consensus Paper:
Pathological Mechanisms Underlying Neurodegeneration in Spinocerebellar
Ataxias", Cerebellum, Vol. 13, No. 2, pp. 269-302.
127
Matsumura, R., N. Futamura, N. Ando and S. Ueno, 2003, "Frequency of Spinocerebellar
Ataxia Mutations in the Kinki District of Japan", Acta Neurologica Scandinavica,
Vol. 107, No. 1, pp. 38-41.
McCann, C., E.E. Holohan, S. Das, A. Dervan, A. Larkin, J.A. Lee, V. Rodrigues, R.
Parker and M. Ramaswami, 2011, "The Ataxin-2 Protein Is Required for Microrna
Function and Synapse-Specific Long-Term Olfactory Habituation", Proceedings of
the National Academy of Sciences of the United States of America, Vol. 108, No.
36, pp. E655-E662.
McMurray, C., 2010, "Mechanisms of Trinucleotide Repeat Instability During Human
Development", Nature Reviews Genetics, Vol. 11, No. 11, pp. 786-799.
Mirkin, S.M., 2007, "Expandable DNA Repeats and Human Disease", Nature, Vol. 447,
No. 7147, pp. 932-940.
Moretti, P., M. Blazo, L. Garcia, D. Armstrong, R.A. Lewis, B. Roa and F. Scaglia, 2004,
"Spinocerebellar Ataxia Type 2 (Sca2) Presenting with Ophthalmoplegia and
Developmental Delay in Infancy", American Journal of Medical Genetics. Part A,
Vol. 124A, No. 4, pp. 392-396.
Mueller, B., E.J. Klemm, E. Spooner, J.H. Claessen and H.L. Ploegh, 2008, "Sel1l
Nucleates a Protein Complex Required for Dislocation of Misfolded
Glycoproteins", Proceedings of the National Academy of Sciences of the United
States of America, Vol. 105, No. 34, pp. 12325-12330.
Nakamura, K., T. Mieda, N. Suto, S. Matsuura and H. Hirai, 2014, "Mesenchymal Stem
Cells as a Potential Therapeutic Tool for Spinocerebellar Ataxia", The Cerebellum,
Vol. 14, No. 2, pp. 165-170.
128
Nechiporuk, T., D.P. Huynh, K. Figueroa, S. Sahba, A. Nechiporuk and S.M. Pulst, 1998,
"The Mouse Sca2 Gene: Cdna Sequence, Alternative Splicing and Protein
Expression", Human Molecular Genetics, Vol. 7, No. 8, pp. 1301-1309.
Nielsen, T.T., K. Svenstrup, E. Budtz-Jørgensen, H. Eiberg, L. Hasholt and J.E. Nielsen,
2012, "Atxn2 with Intermediate-Length Cag/Caa Repeats Does Not Seem to Be a
Risk Factor in Hereditary Spastic Paraplegia", Journal of the Neurological
Sciences, Vol. 321, No. 1-2, pp. 100-102.
Nonhoff, U., M. Ralser, F. Welzel, I. Piccini, D. Balzereit, M.-L. Yaspo, H. Lehrach and S.
Krobitsch, 2007, "Ataxin-2 Interacts with the Dead/H-Box Rna Helicase Ddx6 and
Interferes with P-Bodies and Stress Granules", Molecular Biology of the Cell, Vol.
18, No. 4, pp. 1385-1396.
Nonis, D., M.H.H. Schmidt, S. van de Loo, F. Eich, I. Dikic, J. Nowock and G. Auburger,
2008, "Ataxin-2 Associates with the Endocytosis Complex and Affects Egf
Receptor Trafficking", Cellular Signalling, Vol. 20, No. 10, pp. 1725-1739.
Oka, T., T. Sayano, S. Tamai, S. Yokota, H. Kato, G. Fujii and K. Mihara, 2008,
"Identification of a Novel Protein Mics1 That Is Involved in Maintenance of
Mitochondrial Morphology and Apoptotic Release of Cytochrome C", Molecular
Biology of the Cell, Vol. 19, No. 6, pp. 2597-2608.
Orr, H.T., M.Y. Chung, S. Banfi, T.J. Kwiatkowski, A. Servadio, A.L. Beaudet, A.E.
McCall, L.A. Duvick, L.P. Ranum and H.Y. Zoghbi, 1993, "Expansion of an
Unstable Trinucleotide Cag Repeat in Spinocerebellar Ataxia Type 1", Nature
Genetics, Vol. 4, No. 3, pp. 221-226.
Orr, H.T. and H.Y. Zoghbi, 2007, "Trinucleotide Repeat Disorders", Annual Review of
Neuroscience, Vol. 30, pp. 575-621.
129
Park, J.H., B.R. Yoon, H.J. Kim, P.H. Lee, B.-O. Choi and K.W. Chung, 2014,
"Compound Mitochondrial DNA Mutations in a Neurological Patient with Ataxia,
Myoclonus and Deafness", Journal of Genetics, Vol. 93, No. 1, pp. 173-177.
Payami, H., J. Nutt, S. Gancher, T. Bird, M.G. McNeal, W.K. Seltzer, J. Hussey, P.
Lockhart, K. Gwinn-Hardy, A.A. Singleton, A.B. Singleton, J. Hardy and M.
Farrer, 2003, "Sca2 May Present as Levodopa-Responsive Parkinsonism",
Movement Disorders, Vol. 18, No. 4, pp. 425-429.
Phillips, M.C., 2014, "Molecular Mechanisms of Cellular Cholesterol Efflux", Journal of
Biological Chemistry, Vol. 289, No. 35, pp. 24020-24029.
Planagumà, J., M. Liljeström, F. Alameda, R. Bützow, I. Virtanen, J. Reventós and M.
Hukkanen, 2011, "Matrix Metalloproteinase-2 and Matrix Metalloproteinase-9
Codistribute with Transcription Factors Runx1/Aml1 and Etv5/Erm at the Invasive
Front of Endometrial and Ovarian Carcinoma", Human Pathology, Vol. 42, No. 1,
pp. 57-67.
Potter, M.D., A. Buijs, B. Kreider, L. van Rompaey and G.C. Grosveld, 2000,
"Identification and Characterization of a New Human Ets-Family Transcription
Factor, Tel2, That Is Expressed in Hematopoietic Tissues and Can Associate with
Tel1/Etv6", Blood, Vol. 95, No. 11, pp. 3341-3348.
Price, N.M., J. Farrar, T.T. Tran, T.H. Nguyen, T.H. Tran and J.S. Friedland, 2001,
"Identification of a Matrix-Degrading Phenotype in Human Tuberculosis in Vitro
and in Vivo", Journal of Immunology, Vol. 166, No. 6, pp. 4223-4230.
Pruijt, J.F., W.E. Fibbe, L. Laterveer, R.A. Pieters, I.J. Lindley, L. Paemen, S. Masure, R.
Willemze and G. Opdenakker, 1999, "Prevention of Interleukin-8-Induced
Mobilization of Hematopoietic Progenitor Cells in Rhesus Monkeys by Inhibitory
Antibodies against the Metalloproteinase Gelatinase B (Mmp-9)", Proceedings of
the National Academy of Sciences of the United States of America, Vol. 96, No. 19,
pp. 10863-10868.
130
Przedborski, S., M. Vila and V. Jackson-lewis, 2003, "Neurodegeneration : What Is It and
Where Are We ?", Journal of Clinical Investigations, Vol. 111, No. 1, pp. 3-10.
Pujana, M.A., J. Corral, M. Gratacòs, O. Combarros, J. Berciano, D. Genís, I. Banchs, X.
Estivill and V. Volpini, 1999, "Spinocerebellar Ataxias in Spanish Patients: Genetic
Analysis of Familial and Sporadic Cases. The Ataxia Study Group", Human
Genetics, Vol. 104, No. 6, pp. 516-522.
Pulst, S.M., A. Nechiporuk, T. Nechiporuk, S. Gispert, X.N. Chen, I. Lopes-Cendes, S.
Pearlman, S. Starkman, G. Orozco-Diaz, A. Lunkes, P. DeJong, G.A. Rouleau, G.
Auburger, J.R. Korenberg, C. Figueroa and S. Sahba, 1996, "Moderate Expansion
of a Normally Biallelic Trinucleotide Repeat in Spinocerebellar Ataxia Type 2",
Nature Genetics, Vol. 14, No. 3, pp. 269-276.
Ragothaman, M. and U. Muthane, 2008, "Homozygous Sca 2 Mutations Changes
Phenotype and Hastens Progression", Movement Disorders, Vol. 23, No. 5, pp.
770-771.
Ralser, M., U. Nonhoff, M. Albrecht, T. Lengauer, E.E. Wanker, H. Lehrach and S.
Krobitsch, 2005, "Ataxin-2 and Huntingtin Interact with Endophilin-a Complexes
to Function in Plastin-Associated Pathways", Human Molecular Genetics, Vol. 14,
No. 19, pp. 2893-2909.
Ramachandra, N.B. and L. Kusuma, 2015, "An Understanding of Spinocerebellar Ataxia",
The Indian Journal of Medical Research, Vol. 141, No. 2, pp. 148-150.
Reddy, K., B. Zamiri, S.Y.R. Stanley, R.B. Macgregor and C.E. Pearson, 2013, "The
Disease-Associated R(Ggggcc)N Repeat from the C9orf72 Gene Forms Tract
Length-Dependent Uni- and Multimolecular Rna G-Quadruplex Structures", The
Journal of Biological Chemistry, Vol. 288, No. 14, pp. 9860-9866.
131
Renton, A.E., A. Chiò and B.J. Traynor, 2014, "State of Play in Amyotrophic Lateral
Sclerosis Genetics", Nature Neuroscience, Vol. 17, No. 1, pp. 17-23.
Renton, A.E., E. Majounie, A. Waite, J. Simón-Sánchez, S. Rollinson, J.R. Gibbs, J.C.
Schymick, H. Laaksovirta, J.C. van Swieten, L. Myllykangas, H. Kalimo, A.
Paetau, Y. Abramzon, A.M. Remes, A. Kaganovich, S.W. Scholz, J. Duckworth, J.
Ding, D.W. Harmer, D.G. Hernandez, J.O. Johnson, K. Mok, M. Ryten, D.
Trabzuni, R.J. Guerreiro, R.W. Orrell, J. Neal, A. Murray, J. Pearson, I.E. Jansen,
D. Sondervan, H. Seelaar, D. Blake, K. Young, N. Halliwell, J.B. Callister, G.
Toulson, A. Richardson, A. Gerhard, J. Snowden, D. Mann, D. Neary, M.A. Nalls,
T. Peuralinna, L. Jansson, V.-M. Isoviita, A.-L. Kaivorinne, M. Hölttä-Vuori, E.
Ikonen, R. Sulkava, M. Benatar, J. Wuu, A. Chiò, G. Restagno, G. Borghero, M.
Sabatelli, D. Heckerman, E. Rogaeva, L. Zinman, J.D. Rothstein, M. Sendtner, C.
Drepper, E.E. Eichler, C. Alkan, Z. Abdullaev, S.D. Pack, A. Dutra, E. Pak, J.
Hardy, A. Singleton, N.M. Williams, P. Heutink, S. Pickering-Brown, H.R. Morris,
P.J. Tienari and B.J. Traynor, 2011, "A Hexanucleotide Repeat Expansion in
C9orf72 Is the Cause of Chromosome 9p21-Linked Als-Ftd", Neuron, Vol. 72, No.
2, pp. 257-268.
Riess, O., F.A. Laccone, S. Gispert, L. Schöls, C. Zühlke, A.M. Vieira-Saecker, S. Herlt,
K. Wessel, J.T. Epplen, B.H. Weber, F. Kreuz, S. Chahrokh-Zadeh, A. Meindl, A.
Lunkes, J. Aguiar, M. Macek, A. Krebsová, K. Bürk, S. Tinschert, I. Schreyer,
S.M. Pulst and G. Auburger, 1997, "Sca2 Trinucleotide Expansion in German Sca
Patients", Neurogenetics, Vol. 1, No. 1, pp. 59-64.
Ross, O.a., N.J. Rutherford, M. Baker, A.I. Soto-Ortolaza, M.M. Carrasquillo, M. DeJesus-
Hernandez, J. Adamson, M. Li, K. Volkening, E. Finger, W.W. Seeley, K.J.
Hatanpaa, C. Lomen-Hoerth, A. Kertesz, E.H. Bigio, C. Lippa, B.K. Woodruff,
D.S. Knopman, C.L. White, J.a. Van Gerpen, J.F. Meschia, I.R. Mackenzie, K.
Boylan, B.F. Boeve, B.L. Miller, M.J. Strong, R.J. Uitti, S.G. Younkin, N.R. Graff-
Radford, R.C. Petersen, Z.K. Wszolek, D.W. Dickson and R. Rademakers, 2011,
"Ataxin-2 Repeat-Length Variation and Neurodegeneration", Human Molecular
Genetics, Vol. 20, No. 16, pp. 3207-3212.
132
Rottnek, M., S. Riggio, W. Byne, M. Sano, R.L. Margolis and R.H. Walker, 2008,
"Schizophrenia in a Patient with Spinocerebellar Ataxia 2: Coincidence of Two
Disorders or a Neurodegenerative Disease Presenting with Psychosis?", The
American Journal of Psychiatry, Vol. 165, No. 8, pp. 964-967.
Rüb, U., L. Schöls, H. Paulson, G. Auburger, P. Kermer, J.C. Jen, K. Seidel, H.W. Korf
and T. Deller, 2013, "Clinical Features, Neurogenetics and Neuropathology of the
Polyglutamine Spinocerebellar Ataxias Type 1, 2, 3, 6 and 7", Progress in
Neurobiology, Vol. 104, pp. 38-66.
Saegusa, H., M. Wakamori, Y. Matsuda, J. Wang, Y. Mori, S. Zong and T. Tanabe, 2007,
"Properties of Human Cav2.1 Channel with a Spinocerebellar Ataxia Type 6
Mutation Expressed in Purkinje Cells", Molecular and Cellular Neurosciences,
Vol. 34, No. 2, pp. 261-270.
Sahba, S., A. Nechiporuk, K.P. Figueroa, T. Nechiporuk and S.M. Pulst, 1998, "Genomic
Structure of the Human Gene for Spinocerebellar Ataxia Type 2 (Sca2) on
Chromosome 12q24.1", Genomics, Vol. 47, No. 3, pp. 359-364.
Sanpei, K., H. Takano, S. Igarashi, T. Sato, M. Oyake, H. Sasaki, A. Wakisaka, K. Tashiro,
Y. Ishida, T. Ikeuchi, R. Koide, M. Saito, A. Sato, T. Tanaka, S. Hanyu, Y.
Takiyama, M. Nishizawa, N. Shimizu, Y. Nomura, M. Segawa, K. Iwabuchi, I.
Eguchi, H. Tanaka, H. Takahashi and S. Tsuji, 1996, "Identification of the
Spinocerebellar Ataxia Type 2 Gene Using a Direct Identification of Repeat
Expansion and Cloning Technique, Direct", Nature Genetics, Vol. 14, No. 3, pp.
277-284.
Sato, N., T. Amino, K. Kobayashi, S. Asakawa, T. Ishiguro, T. Tsunemi, M. Takahashi, T.
Matsuura, K.M. Flanigan, S. Iwasaki, F. Ishino, Y. Saito, S. Murayama, M.
Yoshida, Y. Hashizume, Y. Takahashi, S. Tsuji, N. Shimizu, T. Toda, K. Ishikawa
and H. Mizusawa, 2009, "Spinocerebellar Ataxia Type 31 Is Associated with
133
"Inserted" Penta-Nucleotide Repeats Containing (Tggaa)N", American Journal of
Human Genetics, Vol. 85, No. 5, pp. 544-557.
Satterfield, T.F., S.M. Jackson and L.J. Pallanck, 2002, "A Drosophila Homolog of the
Polyglutamine Disease Gene Sca2 Is a Dosage-Sensitive Regulator of Actin
Filament Formation", Genetics, Vol. 162, No. 4, pp. 1687-1702.
Satterfield, T.F. and L.J. Pallanck, 2006, "Ataxin-2 and Its Drosophila Homolog, Atx2,
Physically Assemble with Polyribosomes", Human Molecular Genetics, Vol. 15,
No. 16, pp. 2523-2532.
Scherzed, W., E.R. Brunt, H. Heinsen, R.a. De Vos, K. Seidel, K. Bürk, L. Schöls, G.
Auburger, D. Del Turco, T. Deller, H.W. Korf, W.F. Den Dunnen and U. Rüb,
2012, "Pathoanatomy of Cerebellar Degeneration in Spinocerebellar Ataxia Type 2
(Sca2) and Type 3 (Sca3)", Cerebellum, Vol. 11, No. 3, pp. 749-760.
Scoles, D.R., L.T. Pflieger, K.K. Thai, S.T. Hansen, W. Dansithong and S.M. Pulst, 2012,
"Ets1 Regulates the Expression of Atxn2", Human Molecular Genetics, Vol. 21,
No. 23, pp. 5048-5065.
Seidel, K., S. Siswanto, E.R.P. Brunt, W. den Dunnen, H.-W. Korf and U. Rüb, 2012,
"Brain Pathology of Spinocerebellar Ataxias", Acta Neuropathologica, Vol. 124,
No. 1, pp. 1-21.
Shibata, H., D.P. Huynh and S.M. Pulst, 2000, "A Novel Protein with Rna-Binding Motifs
Interacts with Ataxin-2", Human Molecular Genetics, Vol. 9, No. 9, pp. 1303-1313.
Spadafora, P., G. Annesi, M. Liguori, P. Tarantino, N. Cutuli, S. Carrideo, I.C. Cirò
Candiano, E.V. De Marco, D. Civitelli, F. Annesi, S. Giuffrida and A. Quattrone,
2007, "Gene Dosage Influences the Age at Onset of Sca2 in a Family from
Southern Italy", Clinical Genetics, Vol. 72, No. 4, pp. 381-383.
134
Suriben, R., S. Kivimäe, D.A.C. Fisher, R.T. Moon and B.N.R. Cheyette, 2009, "Posterior
Malformations in Dact1 Mutant Mice Arise through Misregulated Vangl2 at the
Primitive Streak", Nature Genetics, Vol. 41, No. 9, pp. 977-985.
Swarup, V., A.K. Srivastava, M.V. Padma and R.R. Moganty, 2013, "Quantitative
Profiling and Identification of Plasma Proteins of Spinocerebellar Ataxia Type 2
Patients", Neuro-degenerative Diseases, Vol. 12, No. 4, pp. 199-206.
Takahara, T. and T. Maeda, 2012, "Transient Sequestration of Torc1 into Stress Granules
During Heat Stress", Molecular Cell, Vol. 47, No. 2, pp. 242-252.
Tian, X., U. Gala, Y. Zhang, W. Shang, S. Nagarkar Jaiswal, A. di Ronza, M. Jaiswal, S.
Yamamoto, H. Sandoval, L. Duraine, M. Sardiello, R.V. Sillitoe, K.
Venkatachalam, H. Fan, H.J. Bellen and C. Tong, 2015, "A Voltage-Gated Calcium
Channel Regulates Lysosomal Fusion with Endosomes and Autophagosomes and Is
Required for Neuronal Homeostasis", Public Library of Science Biology, Vol. 13,
No. 3, pp. e1002103-e1002103.
Todd, P.K. and H.L. Paulson, 2010, "Rna-Mediated Neurodegeneration in Repeat
Expansion Disorders", Annals of Neurology, Vol. 67, No. 3, pp. 291-300.
Tolosano, E., S. Fagoonee, N. Morello, F. Vinchi and V. Fiorito, 2010, "Heme Scavenging
and the Other Facets of Hemopexin", Antioxidants and Redox Signaling, Vol. 12,
No. 2, pp. 305-320.
van Blitterswijk, M., B. Mullen, M.G. Heckman, M.C. Baker, M. DeJesus-Hernandez, P.H.
Brown, M.E. Murray, G.Y.R. Hsiung, H. Stewart, A.M. Karydas, E. Finger, A.
Kertesz, E.H. Bigio, S. Weintraub, M. Mesulam, K.J. Hatanpaa, C.L. White, M.
Neumann, M.J. Strong, T.G. Beach, Z.K. Wszolek, C. Lippa, R. Caselli, L.
Petrucelli, K.a. Josephs, J.E. Parisi, D.S. Knopman, R.C. Petersen, I.R. Mackenzie,
W.W. Seeley, L.T. Grinberg, B.L. Miller, K.B. Boylan, N.R. Graff-Radford, B.F.
Boeve, D.W. Dickson and R. Rademakers, 2014, "Ataxin-2 as Potential Disease
Modifier in C9orf72 Expansion Carriers", Neurobiology of Aging, Vol. 35, pp. 1-5.
135
Van den Heuvel, D.M.a., O. Harschnitz, L.H. van den Berg and R.J. Pasterkamp, 2014,
"Taking a Risk: A Therapeutic Focus on Ataxin-2 in Amyotrophic Lateral
Sclerosis?", Trends in Molecular Medicine, Vol. 20, No. 1, pp. 25-35.
Velázquez-Perez, L., R. Rodríguez-Labrada, N. Canales-Ochoa, G. Sanchez-Cruz, J.
Fernandez-Ruiz, J.M. Montero, R. Aguilera-Rodríguez, R. Diaz, L.E. Almaguer-
Mederos and A.P. Truitz, 2010, "Progression Markers of Spinocerebellar Ataxia 2.
A Twenty Years Neurophysiological Follow up Study", Journal of the
Neurological Sciences, Vol. 290, No. 1-2, pp. 22-26.
Wadia, N.H. and R.K. Swami, 1971, "A New Form of Heredo-Familial Spinocerebellar
Degeneration with Slow Eye Movements (Nine Families)", Brain, Vol. 94, No. 2,
pp. 359-374.
Wang, S., B. Wang, N. Pan, L. Fu, C. Wang, G. Song, J. An, Z. Liu, W. Zhu, Y. Guan, Z.-
Q.D. Xu, P. Chan, Z. Chen and Y.A. Zhang, 2015, "Differentiation of Human
Induced Pluripotent Stem Cells to Mature Functional Purkinje Neurons", Scientific
Reports, Vol. 5, pp. 9232-9232.
Wang, Y.-C., C.-M. Lee, L.-C. Lee, L.-C. Tung, H.-M. Hsieh-Li, G.-J. Lee-Chen and M.-
T. Su, 2011, "Mitochondrial Dysfunction and Oxidative Stress Contribute to the
Pathogenesis of Spinocerebellar Ataxia Type 12 (Sca12)", The Journal of
Biological Chemistry, Vol. 286, No. 24, pp. 21742-21754.
Wiedemeyer, R., F. Westermann, I. Wittke, J. Nowock and M. Schwab, 2003, "Ataxin-2
Promotes Apoptosis of Human Neuroblastoma Cells", Oncogene, Vol. 22, No. 3,
pp. 401-411.
Wong, Y.C. and E.L.F. Holzbaur, 2015, "Autophagosome Dynamics in Neurodegeneration
at a Glance", Journal of Cell Science, Vol. 128, No. 7, pp. 1259-1267.
136
Yokoshi, M., Q. Li, M. Yamamoto, H. Okada, Y. Suzuki and Y. Kawahara, 2014, "Direct
Binding of Ataxin-2 to Distinct Elements in 3' Utrs Promotes Mrna Stability and
Protein Expression", Molecular Cell, Vol. 55, No. 2, pp. 186-198.
Yu, Z., Y. Zhu, A.S. Chen-Plotkin, D. Clay-Falcone, L. McCluskey, L. Elman, R.G. Kalb,
J.Q. Trojanowski, V.M.Y. Lee, V.M. van Deerlin, A.D. Gitler and N.M. Bonini,
2011, "Polyq Repeat Expansions in Atxn2 Associated with Als Are Caa Interrupted
Repeats", Public Library of Science One, Vol. 6, No. 3, pp. 14-19.
Zeitlin, S., J.P. Liu, D.L. Chapman, V.E. Papaioannou and A. Efstratiadis, 1995,
"Increased Apoptosis and Early Embryonic Lethality in Mice Nullizygous for the
Huntington's Disease Gene Homologue", Nature Genetics, Vol. 11, No. 2, pp. 155-
163.
Zhang, F., G. Wang, Y.Y. Shugart, Y. Xu, C. Liu, L. Wang, T. Lu, H. Yan, Y. Ruan, Z.
Cheng, L. Tian, C. Jin, J. Yuan, Z. Wang, W. Zhu, L. Cao, Y. Liu, W. Yue and D.
Zhang, 2014, "Association Analysis of a Functional Variant in Atxn2 with
Schizophrenia", Neuroscience Letters, Vol. 562, pp. 24-27.


![Spinocerebellar ataxia: an update · ataxia with pigmentary macular degeneration and con-sists of only SCA 7 [20]. ADCA type 3 refers to ‘pure’ cerebellar ataxia, which includes](https://img.pdfslide.net/doc/110x75/5f60a23d2190f22226185a55/spinocerebellar-ataxia-an-update-ataxia-with-pigmentary-macular-degeneration-and.jpg)