Embed Size (px)
Citation preview
Vaughn et al. International Journal of Behavioral Nutrition and Physical Activity 2013, 10:61http://www.ijbnpa.org/content/10/1/61
REVIEW Open Access
Measuring parent food practices: a systematicreview of existing measures and examinationof instrumentsAmber E Vaughn1*, Rachel G Tabak2, Maria J Bryant3 and Dianne S Ward4
Abstract
During the last decade, there has been a rapid increase in development of instruments to measure parent foodpractices. Because these instruments often measure different constructs, or define common constructs differently,an evaluation of these instruments is needed. A systematic review of the literature was conducted to identifyexisting measures of parent food practices and to assess the quality of their development. The initial search usedterms capturing home environment, parenting behaviors, feeding practices and eating behaviors, and wasperformed in October of 2009 using PubMed/Medline, PsychInfo, Web of knowledge (ISI), and ERIC, and updated inJuly of 2012. A review of titles and abstracts was used to narrow results, after which full articles were retrieved andreviewed. Only articles describing development of measures of parenting food practices designed for families withchildren 2-12 years old were retained for the current review. For each article, two reviewers extracted data andappraised the quality of processes used for instrument development and evaluation. The initial search yielded28,378 unique titles; review of titles and abstracts narrowed the pool to 1,352 articles; from which 57 uniqueinstruments were identified. The review update yielded 1,772 new titles from which14 additional instruments wereidentified. The extraction and appraisal process found that 49% of instruments clearly identified and definedconcepts to be measured, and 46% used theory to guide instrument development. Most instruments (80%) hadsome reliability testing, with internal consistency being the most common (79%). Test-retest or inter-rater reliabilitywas reported for less than half the instruments. Some form of validity evidence was reported for 84% ofinstruments. Construct validity was most commonly presented (86%), usually with analysis of associations with childdiet or weight/BMI. While many measures of food parenting practices have emerged, particularly in recent years,few have demonstrated solid development methods. Substantial variation in items across different scales/constructsmakes comparison between instruments extremely difficult. Future efforts should be directed toward consensusdevelopment of food parenting practices constructs and measures.
Keywords: Feeding, Measures development, Psychometric properties
BackgroundThe role of the home environment in shaping a child’sdiet and growth is an area of increasing interest, particu-larly among those working in child obesity preventionand treatment. The home environment has significant in-fluence on child socialization [1], including adoption ofeating behaviors [2]. This is particularly true for younger
* Correspondence: [email protected] for Health Promotion and Disease Prevention, University of NorthCarolina at Chapel Hill, 1700 Martin L. King Jr. Blvd., CB 7426, Chapel Hill, NC27599-7426, USAFull list of author information is available at the end of the article
© 2013 Vaughn et al.; licensee BioMed CentraCommons Attribution License (http://creativecreproduction in any medium, provided the or
children (2-12 years old) given their limited autonomyand dependence on adult caretakers, who influence diet-ary intake and eating behaviors through the foods theyprovide as well as the social environment they create [3].Parent food practices and feeding style represent a
large component of parent behaviors that influence childdiet and/or weight. Parent food practices are the specifictechniques or behaviors used by parents to influencechildren’s food intake [4]. Traditionally, food practiceconstructs have included pressure to eat, restriction,monitoring of the child’s food intake, or the use of re-wards for food consumption. More recently, constructs
l Ltd. This is an Open Access article distributed under the terms of the Creativeommons.org/licenses/by/2.0), which permits unrestricted use, distribution, andiginal work is properly cited.
Vaughn et al. International Journal of Behavioral Nutrition and Physical Activity 2013, 10:61 Page 2 of 27http://www.ijbnpa.org/content/10/1/61
have been expanded to include parent food modeling,family mealtime environments, food preparation prac-tices, involvement of children in food planning andpreparation, and control allowed to children over when,where, what and how much they eat. While food prac-tices are specific behaviors or actions, they are oftenused to categorize parent feeding style [5]. A parent’sfeeding style reflects the emotional climate in whichthese practices occur, or the balance between demandingversus responsive feeding practices [6].Reviews of family environmental correlates have found
fairly consistent associations between child fruit andvegetable consumption and parent food practices suchas dietary modeling, food rules, and encouragement[7-9]. However, these reviews have also highlighted gapsin the literature with regard to measurement. How con-structs are defined and measured is highly variableacross studies, making it difficult to draw clear conclu-sions. Additionally, studies tend to assess only a limitednumber of constructs; thus hampering efforts to under-stand the relative importance of factors and how theymight interact. While there have been two recent re-views on measurement of home food availability and ac-cessibility [10,11], there has not been a similar reviewfocused on measurement of the parent behaviors that in-fluence child diet.This paper addresses this gap in the literature by pre-
senting results from a comprehensive, systematic reviewdesigned to identify and evaluate instruments or specificscales assessing parent food practices. It captures the fullarray of parental food practices thought to shape thesociocultural food environment of the home in an at-tempt to bring some order to a field of measurementthat has become increasingly complex and confusing.
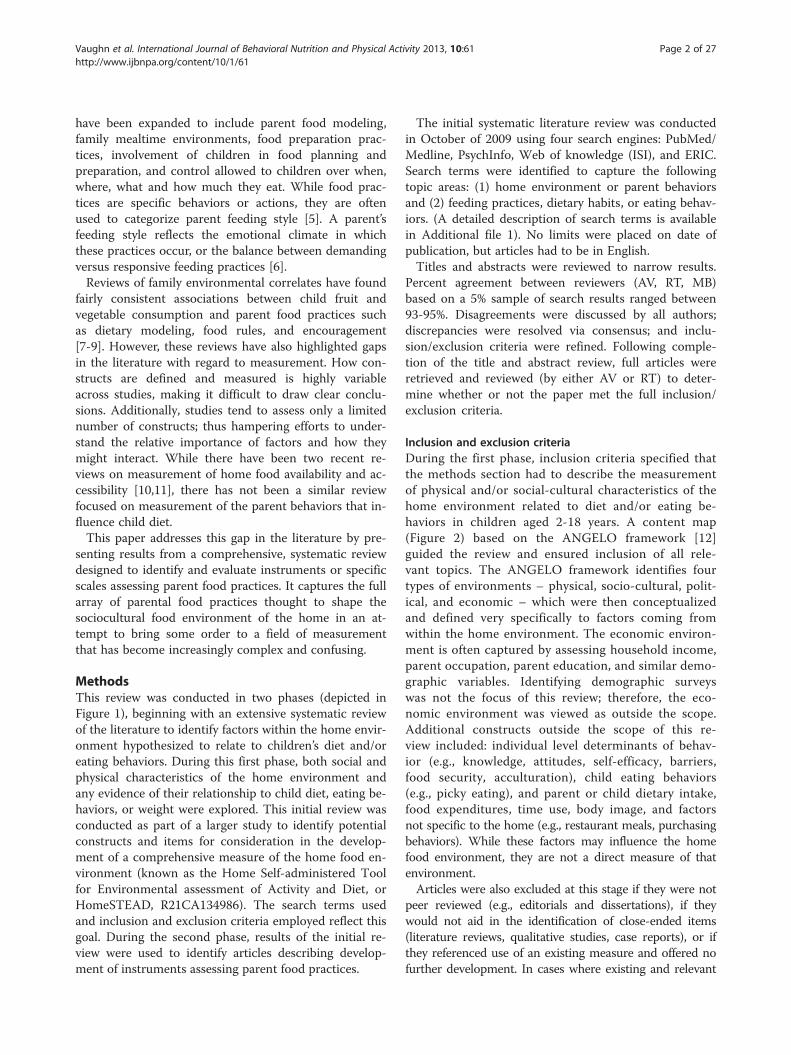
MethodsThis review was conducted in two phases (depicted inFigure 1), beginning with an extensive systematic reviewof the literature to identify factors within the home envir-onment hypothesized to relate to children’s diet and/oreating behaviors. During this first phase, both social andphysical characteristics of the home environment andany evidence of their relationship to child diet, eating be-haviors, or weight were explored. This initial review wasconducted as part of a larger study to identify potentialconstructs and items for consideration in the develop-ment of a comprehensive measure of the home food en-vironment (known as the Home Self-administered Toolfor Environmental assessment of Activity and Diet, orHomeSTEAD, R21CA134986). The search terms usedand inclusion and exclusion criteria employed reflect thisgoal. During the second phase, results of the initial re-view were used to identify articles describing develop-ment of instruments assessing parent food practices.
The initial systematic literature review was conductedin October of 2009 using four search engines: PubMed/Medline, PsychInfo, Web of knowledge (ISI), and ERIC.Search terms were identified to capture the followingtopic areas: (1) home environment or parent behaviorsand (2) feeding practices, dietary habits, or eating behav-iors. (A detailed description of search terms is availablein Additional file 1). No limits were placed on date ofpublication, but articles had to be in English.Titles and abstracts were reviewed to narrow results.
Percent agreement between reviewers (AV, RT, MB)based on a 5% sample of search results ranged between93-95%. Disagreements were discussed by all authors;discrepancies were resolved via consensus; and inclu-sion/exclusion criteria were refined. Following comple-tion of the title and abstract review, full articles wereretrieved and reviewed (by either AV or RT) to deter-mine whether or not the paper met the full inclusion/exclusion criteria.
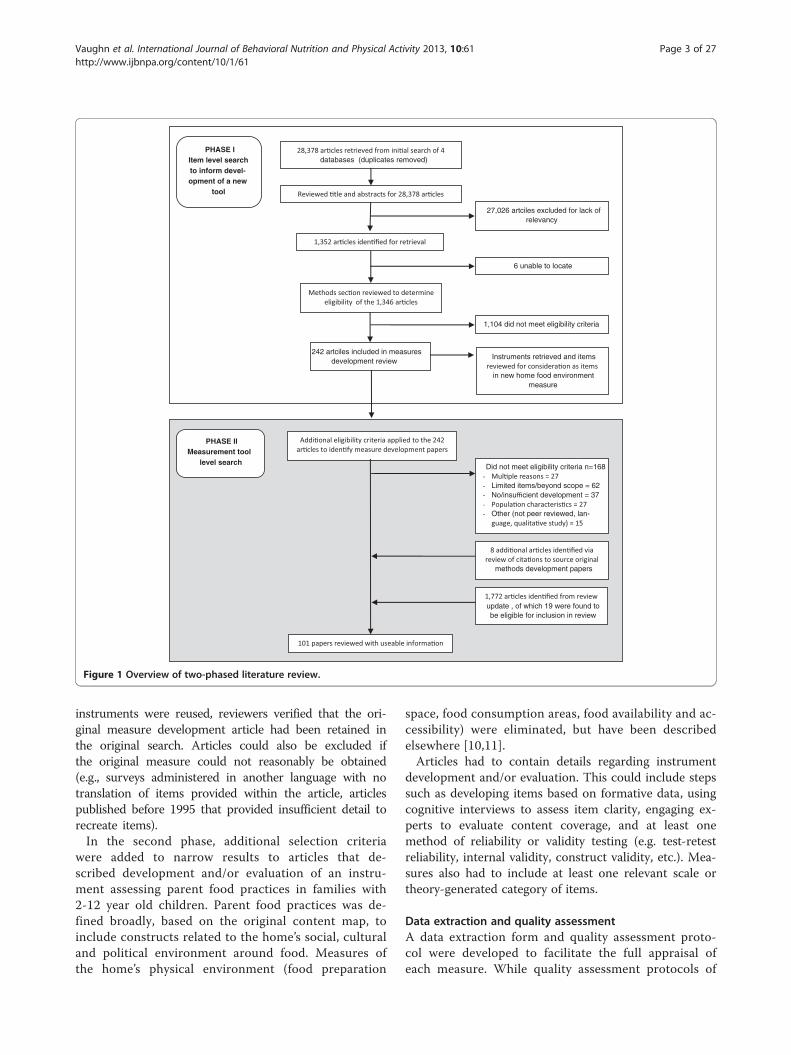
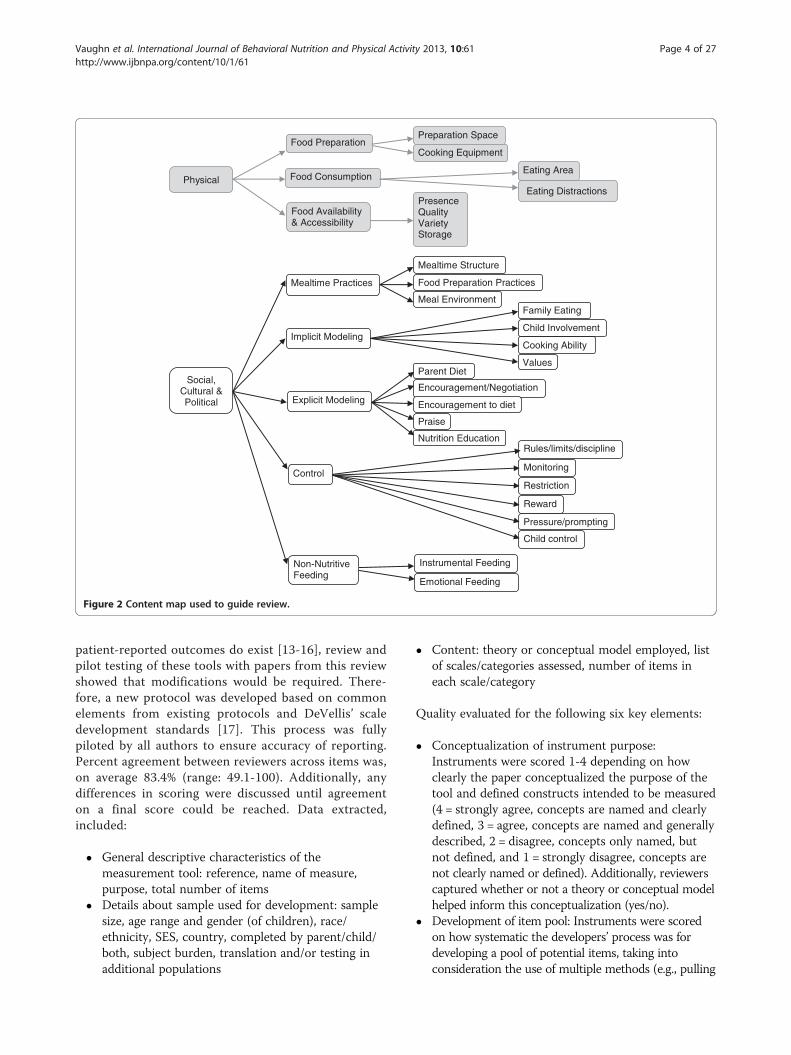
Inclusion and exclusion criteriaDuring the first phase, inclusion criteria specified thatthe methods section had to describe the measurementof physical and/or social-cultural characteristics of thehome environment related to diet and/or eating be-haviors in children aged 2-18 years. A content map(Figure 2) based on the ANGELO framework [12]guided the review and ensured inclusion of all rele-vant topics. The ANGELO framework identifies fourtypes of environments – physical, socio-cultural, polit-ical, and economic – which were then conceptualizedand defined very specifically to factors coming fromwithin the home environment. The economic environ-ment is often captured by assessing household income,parent occupation, parent education, and similar demo-graphic variables. Identifying demographic surveyswas not the focus of this review; therefore, the eco-nomic environment was viewed as outside the scope.Additional constructs outside the scope of this re-view included: individual level determinants of behav-ior (e.g., knowledge, attitudes, self-efficacy, barriers,food security, acculturation), child eating behaviors(e.g., picky eating), and parent or child dietary intake,food expenditures, time use, body image, and factorsnot specific to the home (e.g., restaurant meals, purchasingbehaviors). While these factors may influence the homefood environment, they are not a direct measure of thatenvironment.Articles were also excluded at this stage if they were not
peer reviewed (e.g., editorials and dissertations), if theywould not aid in the identification of close-ended items(literature reviews, qualitative studies, case reports), or ifthey referenced use of an existing measure and offered nofurther development. In cases where existing and relevant
PHASE IItem level search to inform devel-opment of a new
tool
27,026 artciles excluded for lack of relevancy
6 unable to locate
242 artciles included in measures development review
Instruments retrieved and items
in new home food environment measure
databases (duplicates removed)
1,104 did not meet eligibility criteria
methods development papers
PHASE IIMeasurement tool
level searchDid not meet eligibility criteria n=168-- Limited items/beyond scope = 62- No/insufficient development = 37-- Other (not peer reviewed, lan-
update , of which 19 were found to be eligible for inclusion in review
Figure 1 Overview of two-phased literature review.
Vaughn et al. International Journal of Behavioral Nutrition and Physical Activity 2013, 10:61 Page 3 of 27http://www.ijbnpa.org/content/10/1/61
instruments were reused, reviewers verified that the ori-ginal measure development article had been retained inthe original search. Articles could also be excluded ifthe original measure could not reasonably be obtained(e.g., surveys administered in another language with notranslation of items provided within the article, articlespublished before 1995 that provided insufficient detail torecreate items).In the second phase, additional selection criteria
were added to narrow results to articles that de-scribed development and/or evaluation of an instru-ment assessing parent food practices in families with2-12 year old children. Parent food practices was de-fined broadly, based on the original content map, toinclude constructs related to the home’s social, culturaland political environment around food. Measures ofthe home’s physical environment (food preparation
space, food consumption areas, food availability and ac-cessibility) were eliminated, but have been describedelsewhere [10,11].Articles had to contain details regarding instrument
development and/or evaluation. This could include stepssuch as developing items based on formative data, usingcognitive interviews to assess item clarity, engaging ex-perts to evaluate content coverage, and at least onemethod of reliability or validity testing (e.g. test-retestreliability, internal validity, construct validity, etc.). Mea-sures also had to include at least one relevant scale ortheory-generated category of items.
Data extraction and quality assessmentA data extraction form and quality assessment proto-col were developed to facilitate the full appraisal ofeach measure. While quality assessment protocols of
Physical
Food Preparation
Food Consumption
Food Availability & Accessibility
Preparation Space
Cooking Equipment
Eating Area
Eating DistractionsPresenceQualityVarietyStorage
Social, Cultural & Political
Mealtime Practices
Implicit Modeling
Explicit Modeling
Control
Non-Nutritive Feeding
Mealtime Structure
Food Preparation Practices
Meal EnvironmentFamily Eating
Child Involvement
Cooking Ability
ValuesParent Diet
Encouragement/Negotiation
Encouragement to diet
Praise
Nutrition EducationRules/limits/discipline
Monitoring
Restriction
Reward
Pressure/prompting
Child control
Instrumental Feeding
Emotional Feeding
Figure 2 Content map used to guide review.
Vaughn et al. International Journal of Behavioral Nutrition and Physical Activity 2013, 10:61 Page 4 of 27http://www.ijbnpa.org/content/10/1/61
patient-reported outcomes do exist [13-16], review andpilot testing of these tools with papers from this reviewshowed that modifications would be required. There-fore, a new protocol was developed based on commonelements from existing protocols and DeVellis’ scaledevelopment standards [17]. This process was fullypiloted by all authors to ensure accuracy of reporting.Percent agreement between reviewers across items was,on average 83.4% (range: 49.1-100). Additionally, anydifferences in scoring were discussed until agreementon a final score could be reached. Data extracted,included:
� General descriptive characteristics of themeasurement tool: reference, name of measure,purpose, total number of items
� Details about sample used for development: samplesize, age range and gender (of children), race/ethnicity, SES, country, completed by parent/child/both, subject burden, translation and/or testing inadditional populations
� Content: theory or conceptual model employed, listof scales/categories assessed, number of items ineach scale/category
Quality evaluated for the following six key elements:
� Conceptualization of instrument purpose:Instruments were scored 1-4 depending on howclearly the paper conceptualized the purpose of thetool and defined constructs intended to be measured(4 = strongly agree, concepts are named and clearlydefined, 3 = agree, concepts are named and generallydescribed, 2 = disagree, concepts only named, butnot defined, and 1 = strongly disagree, concepts arenot clearly named or defined). Additionally, reviewerscaptured whether or not a theory or conceptual modelhelped inform this conceptualization (yes/no).
� Development of item pool: Instruments were scoredon how systematic the developers’ process was fordeveloping a pool of potential items, taking intoconsideration the use of multiple methods (e.g., pulling
Vaughn et al. International Journal of Behavioral Nutrition and Physical Activity 2013, 10:61 Page 5 of 27http://www.ijbnpa.org/content/10/1/61
items from existing instruments, consulting expertopinion, extrapolating from qualitative data, andextracting from the literature) and an iterative process.Scores ranged from 1-3 where 3 = fully systematicprocesses were used, 2 = systematic process were weakor only used for pieces (but not whole instrument),and 1 = no systematic process used/reported.
� Refinement of item pool: Reviewers extractedinformation about the methods employed to refinethe item pool (e.g., expert review, pilot testing orcognitive interviews with draft instrument,assessment of item performance, and use ofexploratory factor analysis. When applicable andavailable, factor loading were recorded so that theycould be compared against generally recognizedstatistical standards to retain only items with factorloading greater than 0.4 and to address any itemswith cross-loadings greater than 0.32 [18].
� Reliability: To capture evidence of reliability,reviewers extracted information regarding theevaluation of test-retest, inter-rater, and/or internalconsistency testing. Results of test-retest and inter-rater reliability testing, which generally presentcorrelation analysis, were extracted so that resultscould be compared against generally acceptedstandards where 0-0.2 indicates poor agreement,0.3-0.4 indicates fair agreement, 0.5-0.6 indicatesmoderate agreement, 0.7-0.8 indicates strongagreement, and >0.8 indicates almost perfectagreement [19]. Results of internal consistency,which generally report Cronbach’s alpha, wereextracted so that results could be compared againstgenerally accepted standards where 0.6-0.7 isquestionable (but often considered sufficient inexploratory analyses), 0.7-0.8 is acceptable, 0.8-0.9 isgood, and ≥0.9 is excellent [20].
� Validity: Reviewers extracted information aboutthree types of validity: construct validity, structuralvalidity, and criterion validity. Construct validity wasdefined as evidence that the new scale(s) “behavesthe way that the construct it purports to measureshould behave with regard to established measuresof other constructs.” (DeVellis, pg. 46) This caninclude evidence of associations/correlationsbetween the new scale(s) and established measuresof general parenting practices, child dietary intake oreating habits, and/or child weight. Evaluation ofconstruct validity could employ simple correlationsor t-tests, or more complex methods like regressionmodels. While correlations ≥0.3 are consideredacceptable, the significance of results must beinterpreted in light of the underlying theory.Evidence of structural validity, specifically resultsfrom confirmatory factor analysis (CFA), were
extracted so that results could be compared againstgenerally accepted cutoffs for “acceptable” fit indices:maximum likelihood-based Tucker-Lewis Index,Bollen’s Delta, Comparative Fit Index, RelativeCentrality Index, and Gamma Hat ≥0.95,McDonald’s Centrality Index ≥0.90, StandardizedRoot Mean Squared Residual ≥0.08, and Root MeanSquared Error of Approximation ≤0.06 [21].Evidence of criterion validity was also extracted,generally assessed by correlational analysis betweenthe new scale and a gold standard. The criterionused for the gold standard in this review had to bean objective assessment of food parenting practices(e.g., observation protocols completed by trainedresearch staff ).
� Responsiveness: Evidence of responsiveness was alsoextracted. Responsiveness testing is usuallyconducted using Effect Size statistics orStandardized Response Means (with values greaterthan 0.5 considered moderate [22]) or by theReliable Change Index (with 1.96 considered as aminimally important difference [23]).
An updated literature search was conducted in July2012 to identify additional measures published since theoriginal search. Given the broad scope of the originalsearch, terms were refined to focus the search on foodparenting practices (using the diversity of terms uncov-ered during the original search) and specifically articlesdescribing the development of measures.
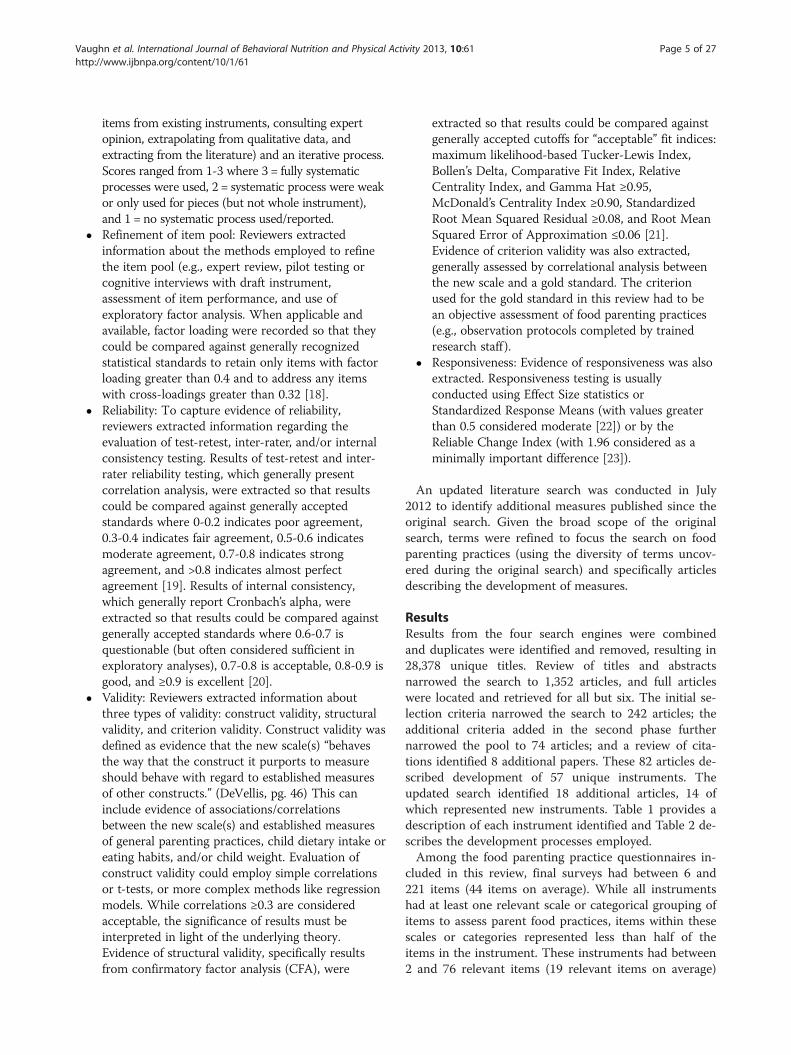
ResultsResults from the four search engines were combinedand duplicates were identified and removed, resulting in28,378 unique titles. Review of titles and abstractsnarrowed the search to 1,352 articles, and full articleswere located and retrieved for all but six. The initial se-lection criteria narrowed the search to 242 articles; theadditional criteria added in the second phase furthernarrowed the pool to 74 articles; and a review of cita-tions identified 8 additional papers. These 82 articles de-scribed development of 57 unique instruments. Theupdated search identified 18 additional articles, 14 ofwhich represented new instruments. Table 1 provides adescription of each instrument identified and Table 2 de-scribes the development processes employed.Among the food parenting practice questionnaires in-
cluded in this review, final surveys had between 6 and221 items (44 items on average). While all instrumentshad at least one relevant scale or categorical grouping ofitems to assess parent food practices, items within thesescales or categories represented less than half of theitems in the instrument. These instruments had between2 and 76 relevant items (19 relevant items on average)
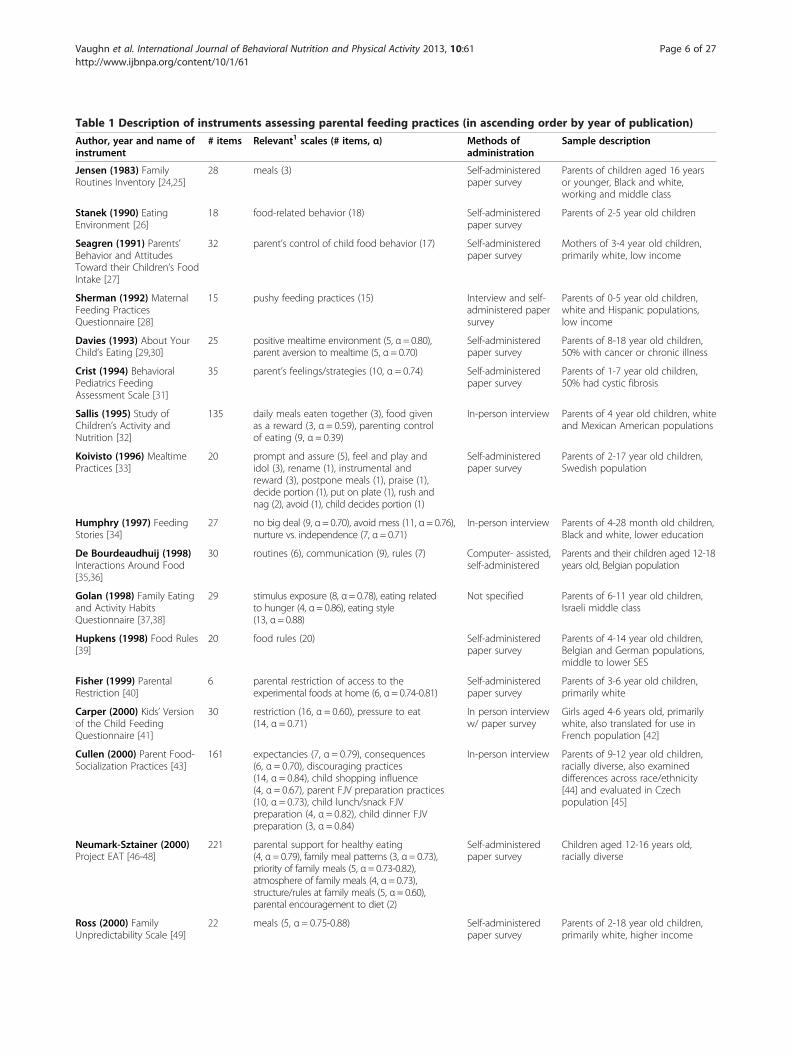
Table 1 Description of instruments assessing parental feeding practices (in ascending order by year of publication)
Author, year and name ofinstrument
# items Relevant1 scales (# items, α) Methods ofadministration
Sample description
Jensen (1983) FamilyRoutines Inventory [24,25]
28 meals (3) Self-administeredpaper survey
Parents of children aged 16 yearsor younger, Black and white,working and middle class
Stanek (1990) EatingEnvironment [26]
18 food-related behavior (18) Self-administeredpaper survey
Parents of 2-5 year old children
Seagren (1991) Parents’Behavior and AttitudesToward their Children’s FoodIntake [27]
32 parent’s control of child food behavior (17) Self-administeredpaper survey
Mothers of 3-4 year old children,primarily white, low income
Sherman (1992) MaternalFeeding PracticesQuestionnaire [28]
15 pushy feeding practices (15) Interview and self-administered papersurvey
Parents of 0-5 year old children,white and Hispanic populations,low income
Davies (1993) About YourChild’s Eating [29,30]
25 positive mealtime environment (5, α= 0.80),parent aversion to mealtime (5, α= 0.70)
Self-administeredpaper survey
Parents of 8-18 year old children,50% with cancer or chronic illness
Crist (1994) BehavioralPediatrics FeedingAssessment Scale [31]
35 parent’s feelings/strategies (10, α = 0.74) Self-administeredpaper survey
Parents of 1-7 year old children,50% had cystic fibrosis
Sallis (1995) Study ofChildren’s Activity andNutrition [32]
135 daily meals eaten together (3), food givenas a reward (3, α = 0.59), parenting controlof eating (9, α = 0.39)
In-person interview Parents of 4 year old children, whiteand Mexican American populations
Koivisto (1996) MealtimePractices [33]
20 prompt and assure (5), feel and play andidol (3), rename (1), instrumental andreward (3), postpone meals (1), praise (1),decide portion (1), put on plate (1), rush andnag (2), avoid (1), child decides portion (1)
Self-administeredpaper survey
Parents of 2-17 year old children,Swedish population
Humphry (1997) FeedingStories [34]
27 no big deal (9, α= 0.70), avoid mess (11, α= 0.76),nurture vs. independence (7, α= 0.71)
In-person interview Parents of 4-28 month old children,Black and white, lower education
De Bourdeaudhuij (1998)Interactions Around Food[35,36]
30 routines (6), communication (9), rules (7) Computer- assisted,self-administered
Parents and their children aged 12-18years old, Belgian population
Golan (1998) Family Eatingand Activity HabitsQuestionnaire [37,38]
29 stimulus exposure (8, α= 0.78), eating relatedto hunger (4, α= 0.86), eating style(13, α= 0.88)
Not specified Parents of 6-11 year old children,Israeli middle class
Hupkens (1998) Food Rules[39]
20 food rules (20) Self-administeredpaper survey
Parents of 4-14 year old children,Belgian and German populations,middle to lower SES
Fisher (1999) ParentalRestriction [40]
6 parental restriction of access to theexperimental foods at home (6, α= 0.74-0.81)
Self-administeredpaper survey
Parents of 3-6 year old children,primarily white
Carper (2000) Kids’ Versionof the Child FeedingQuestionnaire [41]
30 restriction (16, α = 0.60), pressure to eat(14, α = 0.71)
In person intervieww/ paper survey
Girls aged 4-6 years old, primarilywhite, also translated for use inFrench population [42]
Cullen (2000) Parent Food-Socialization Practices [43]
161 expectancies (7, α = 0.79), consequences(6, α = 0.70), discouraging practices(14, α = 0.84), child shopping influence(4, α = 0.67), parent FJV preparation practices(10, α = 0.73), child lunch/snack FJVpreparation (4, α = 0.82), child dinner FJVpreparation (3, α = 0.84)
In-person interview Parents of 9-12 year old children,racially diverse, also examineddifferences across race/ethnicity[44] and evaluated in Czechpopulation [45]
Neumark-Sztainer (2000)Project EAT [46-48]
221 parental support for healthy eating(4, α= 0.79), family meal patterns (3, α= 0.73),priority of family meals (5, α= 0.73-0.82),atmosphere of family meals (4, α= 0.73),structure/rules at family meals (5, α= 0.60),parental encouragement to diet (2)
Self-administeredpaper survey
Children aged 12-16 years old,racially diverse
Ross (2000) FamilyUnpredictability Scale [49]
22 meals (5, α = 0.75-0.88) Self-administeredpaper survey
Parents of 2-18 year old children,primarily white, higher income
Vaughn et al. International Journal of Behavioral Nutrition and Physical Activity 2013, 10:61 Page 6 of 27http://www.ijbnpa.org/content/10/1/61
Table 1 Description of instruments assessing parental feeding practices (in ascending order by year of publication)(Continued)
Baughcum (2001)Preschooler FeedingQuestionnaire [50]
32 pushing the child to eat more (5, α = 0.70),using food to calm the child (4, α = 0.68),child’s control of feeding interactions(3, α = 0.50), structure during feedinginteractions (3, α = 0.37), age-inappropriatefeeding (2, α = 0.18)
Self-administeredpaper survey
Mothers of 23-60 month old children,56% WIC participants, translated intoSpanish [51]
Birch (2001) Child FeedingQuestionnaire [52-54]
31 perceived responsibility (3, α= 0.88), restriction(8, α= 0.73), pressure to eat (4, α= 0.70),monitoring (3, α= 0.92)
Self-administeredpaper survey
Parents of 2-11 year old children,primarily white, but also tested inBlack [55-57], Hispanic [52,55],Japanese [58], Australian [59], andHmong [60] samples
Cullen (2001) Family andPeer Influences on FJV Intake[61]
160 family FJV normative expectations (7, α= 0.88),parent control (11, α= 0.77), permissive eating(4, α= 0.76), food self-preparation (4, α= 0.76),parent FJV/LFF modeling (15, α= 0.89)
Self-administeredpaper survey
Children aged 9-12 years old, raciallydiverse
Tibbs (2001) ParentalDietary Modeling Scale[62,63]
6 parent diet modeling (6, α = 0.59-0.74) self- administeredpaper survey, andphone interview
Parents of 0-13 year old children,including an African Americanpopulation [62]
Tiggemann (2002) ControlOver Child Feeding [64]
7 monitoring (5, α = 0.69), family rules (2) Self-administeredsurvey
Parents of 5-8 year old children,Australian population
Wardle (2002) ParentalFeeding Style Questionnaire[65]
27 control over eating (10, α = 0.81), prompting/encouragement (8, α = 0.74), instrumentalfeeding (4, α = 0.67), emotional feeding(5, α = 0.83). Note: during pre-testing α’sranged 0.65-0.85.
Self-administeredpaper survey
Parents of 3-7 year old children,twins, but also tested in parentsof 4-10 year old children from lowand high SES [66], and Dutchpopulation [67]
Bourcier (2003) Eating for aHealthy Life – Strategies toInfluence Eating Behavior[68]
14 reliance on self (4, α = 0.66), pressuring(4, α = 0.52), positive (4, α = 0.63)
Phone interview Parents of 0-17 year old children,primarily white
Cullen (2004) GEMS - Diet-Related PsychosocialQuestionnaire [69]
116 low-fat food preparation practices (8, α= 0.66)and high-fat food preparation practices(7, α= 0.58)
Not specified Parents of 7-10 year old girls,African American
Melgar-Quinonez (2004)Child Feeding Strategies[70,71]
12 control (4, α = 0.61), accommodating(3, α = 0.44)
In-person interview Parents of 36-72 month old children,Latino/Hispanic population, lowincome
Vereecken (2004) FoodParenting Practices [72,73]
43 permissiveness/restriction rules (4, α= 0.71),pressure (5, α= 0.74), encouragement throughmaterial reward (3, α= 0.75), verbal praise(2, α= 0.94), encouragement through negotiation(5, α= 0.71), encouragement through rationale(fruit: 4, α= 0.81; veg: 4, α= 0.86),discouragement through rationale (sweets:5, α= 0.80; soda: 5, α= 0.86), catering onchildren’s demand (4, α= 0.79), avoidingnegative behavior (2, α= 0.82)
Self-administeredpaper survey
Parents of 2.5-7 year old children,Belgian population
De Bourdeaudhuij (2005)Pro Children Project [74]
104 parallel scales for fruit and veg: active parentencouragement (2, αF = 0.83 αV = 0.89),demand family rule (1), allow family rule (1)
Self-administeredpaper survey
Children aged 10-11 years old, from5 European countries
Horodynski (2005) Child-Parent Mealtime BehaviorQuestionnaire [75]
44 caregiver’s tendency to get upset with child(4, α= 0.77-0.83), caregiver’s tendency toimpose requirements on child’s eating(4, α= 0.68-0.70), caregiver’s emphasis on socialinteractions during meals (8, α= 0.67-0.73)
Self-administeredpaper survey
Parents of 11-25 month oldchildren, low-income
Hughes (2005) Caregiver’sFeeding Style Questionnaire[6,76,77]
24 parent-centered strategies (12, α= 0.86), child-centered strategies (7, α= 0.71). Note: thesetwo scales were used to score two dimensionsof demandingness and responsiveness, whichcan then be used to categorize feeding style.
Self-administeredpaper survey
Parents of 3-5 year old children,Black and Hispanic, low income,available in English and Spanish
Vaughn et al. International Journal of Behavioral Nutrition and Physical Activity 2013, 10:61 Page 7 of 27http://www.ijbnpa.org/content/10/1/61
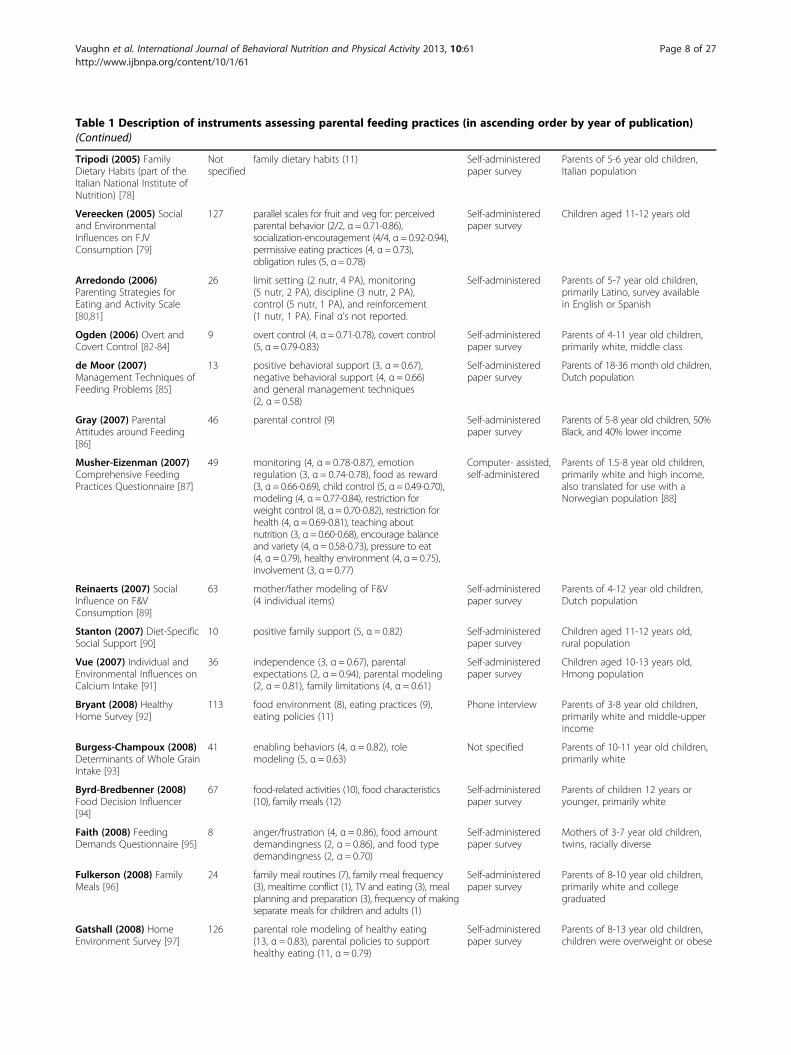
Table 1 Description of instruments assessing parental feeding practices (in ascending order by year of publication)(Continued)
Tripodi (2005) FamilyDietary Habits (part of theItalian National Institute ofNutrition) [78]
Notspecified
family dietary habits (11) Self-administeredpaper survey
Parents of 5-6 year old children,Italian population
Vereecken (2005) Socialand EnvironmentalInfluences on FJVConsumption [79]
127 parallel scales for fruit and veg for: perceivedparental behavior (2/2, α= 0.71-0.86),socialization-encouragement (4/4, α= 0.92-0.94),permissive eating practices (4, α= 0.73),obligation rules (5, α= 0.78)
Self-administeredpaper survey
Children aged 11-12 years old
Arredondo (2006)Parenting Strategies forEating and Activity Scale[80,81]
26 limit setting (2 nutr, 4 PA), monitoring(5 nutr, 2 PA), discipline (3 nutr, 2 PA),control (5 nutr, 1 PA), and reinforcement(1 nutr, 1 PA). Final α’s not reported.
Self-administered Parents of 5-7 year old children,primarily Latino, survey availablein English or Spanish
Ogden (2006) Overt andCovert Control [82-84]
9 overt control (4, α= 0.71-0.78), covert control(5, α= 0.79-0.83)
Self-administeredpaper survey
Parents of 4-11 year old children,primarily white, middle class
de Moor (2007)Management Techniques ofFeeding Problems [85]
13 positive behavioral support (3, α = 0.67),negative behavioral support (4, α = 0.66)and general management techniques(2, α = 0.58)
Self-administeredpaper survey
Parents of 18-36 month old children,Dutch population
Gray (2007) ParentalAttitudes around Feeding[86]
46 parental control (9) Self-administeredpaper survey
Parents of 5-8 year old children, 50%Black, and 40% lower income
Musher-Eizenman (2007)Comprehensive FeedingPractices Questionnaire [87]
49 monitoring (4, α = 0.78-0.87), emotionregulation (3, α = 0.74-0.78), food as reward(3, α= 0.66-0.69), child control (5, α= 0.49-0.70),modeling (4, α= 0.77-0.84), restriction forweight control (8, α= 0.70-0.82), restriction forhealth (4, α= 0.69-0.81), teaching aboutnutrition (3, α= 0.60-0.68), encourage balanceand variety (4, α= 0.58-0.73), pressure to eat(4, α= 0.79), healthy environment (4, α= 0.75),involvement (3, α= 0.77)
Computer- assisted,self-administered
Parents of 1.5-8 year old children,primarily white and high income,also translated for use with aNorwegian population [88]
Reinaerts (2007) SocialInfluence on F&VConsumption [89]
63 mother/father modeling of F&V(4 individual items)
Self-administeredpaper survey
Parents of 4-12 year old children,Dutch population
Stanton (2007) Diet-SpecificSocial Support [90]
10 positive family support (5, α = 0.82) Self-administeredpaper survey
Children aged 11-12 years old,rural population
Vue (2007) Individual andEnvironmental Influences onCalcium Intake [91]
36 independence (3, α = 0.67), parentalexpectations (2, α = 0.94), parental modeling(2, α = 0.81), family limitations (4, α = 0.61)
Self-administeredpaper survey
Children aged 10-13 years old,Hmong population
Bryant (2008) HealthyHome Survey [92]
113 food environment (8), eating practices (9),eating policies (11)
Phone interview Parents of 3-8 year old children,primarily white and middle-upperincome
Burgess-Champoux (2008)Determinants of Whole GrainIntake [93]
41 enabling behaviors (4, α = 0.82), rolemodeling (5, α = 0.63)
Not specified Parents of 10-11 year old children,primarily white
Byrd-Bredbenner (2008)Food Decision Influencer[94]
67 food-related activities (10), food characteristics(10), family meals (12)
Self-administeredpaper survey
Parents of children 12 years oryounger, primarily white
Faith (2008) FeedingDemands Questionnaire [95]
8 anger/frustration (4, α = 0.86), food amountdemandingness (2, α = 0.86), and food typedemandingness (2, α = 0.70)
Self-administeredpaper survey
Mothers of 3-7 year old children,twins, racially diverse
Fulkerson (2008) FamilyMeals [96]
24 family meal routines (7), family meal frequency(3), mealtime conflict (1), TV and eating (3), mealplanning and preparation (3), frequency of makingseparate meals for children and adults (1)
Self-administeredpaper survey
Parents of 8-10 year old children,primarily white and collegegraduated
Gatshall (2008) HomeEnvironment Survey [97]
126 parental role modeling of healthy eating(13, α = 0.83), parental policies to supporthealthy eating (11, α = 0.79)
Self-administeredpaper survey
Parents of 8-13 year old children,children were overweight or obese
Vaughn et al. International Journal of Behavioral Nutrition and Physical Activity 2013, 10:61 Page 8 of 27http://www.ijbnpa.org/content/10/1/61
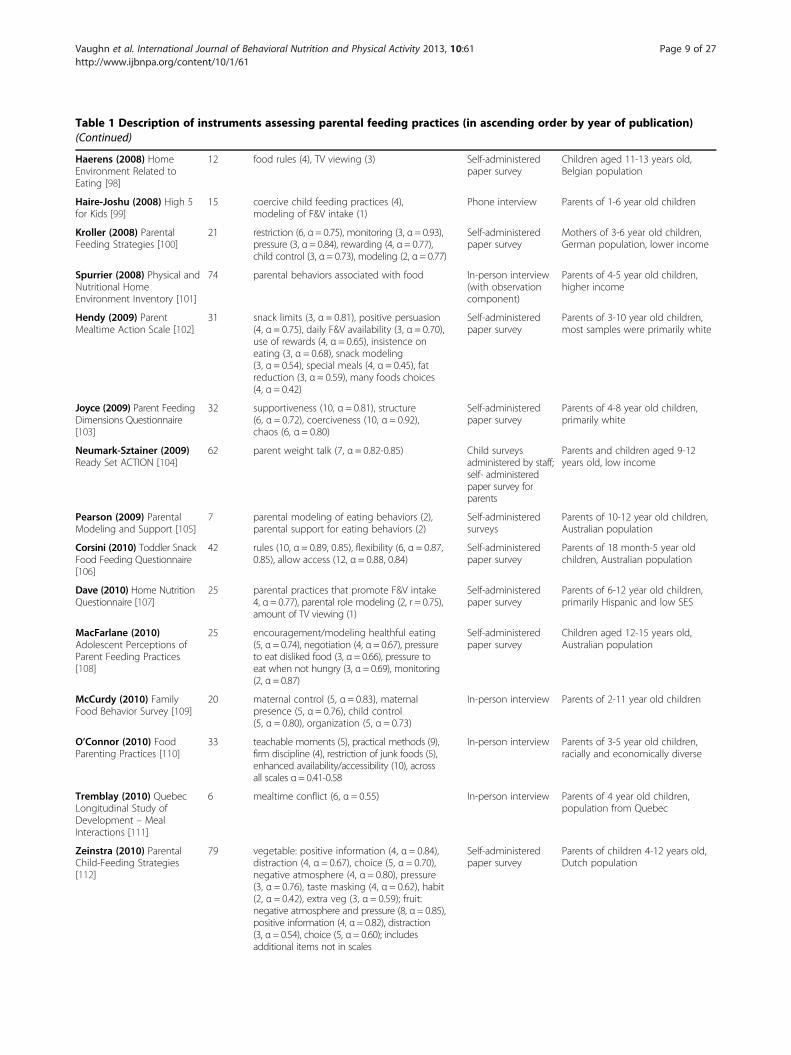
Table 1 Description of instruments assessing parental feeding practices (in ascending order by year of publication)(Continued)
Haerens (2008) HomeEnvironment Related toEating [98]
12 food rules (4), TV viewing (3) Self-administeredpaper survey
Children aged 11-13 years old,Belgian population
Haire-Joshu (2008) High 5for Kids [99]
15 coercive child feeding practices (4),modeling of F&V intake (1)
Phone interview Parents of 1-6 year old children
Kroller (2008) ParentalFeeding Strategies [100]
21 restriction (6, α= 0.75), monitoring (3, α= 0.93),pressure (3, α= 0.84), rewarding (4, α= 0.77),child control (3, α= 0.73), modeling (2, α= 0.77)
Self-administeredpaper survey
Mothers of 3-6 year old children,German population, lower income
Spurrier (2008) Physical andNutritional HomeEnvironment Inventory [101]
74 parental behaviors associated with food In-person interview(with observationcomponent)
Parents of 4-5 year old children,higher income
Hendy (2009) ParentMealtime Action Scale [102]
31 snack limits (3, α = 0.81), positive persuasion(4, α = 0.75), daily F&V availability (3, α = 0.70),use of rewards (4, α = 0.65), insistence oneating (3, α = 0.68), snack modeling(3, α = 0.54), special meals (4, α = 0.45), fatreduction (3, α = 0.59), many foods choices(4, α = 0.42)
Self-administeredpaper survey
Parents of 3-10 year old children,most samples were primarily white
Joyce (2009) Parent FeedingDimensions Questionnaire[103]
32 supportiveness (10, α = 0.81), structure(6, α = 0.72), coerciveness (10, α = 0.92),chaos (6, α = 0.80)
Self-administeredpaper survey
Parents of 4-8 year old children,primarily white
Neumark-Sztainer (2009)Ready Set ACTION [104]
62 parent weight talk (7, α = 0.82-0.85) Child surveysadministered by staff;self- administeredpaper survey forparents
Parents and children aged 9-12years old, low income
Pearson (2009) ParentalModeling and Support [105]
7 parental modeling of eating behaviors (2),parental support for eating behaviors (2)
Self-administeredsurveys
Parents of 10-12 year old children,Australian population
Corsini (2010) Toddler SnackFood Feeding Questionnaire[106]
42 rules (10, α = 0.89, 0.85), flexibility (6, α = 0.87,0.85), allow access (12, α = 0.88, 0.84)
Self-administeredpaper survey
Parents of 18 month-5 year oldchildren, Australian population
Dave (2010) Home NutritionQuestionnaire [107]
25 parental practices that promote F&V intake4, α= 0.77), parental role modeling (2, r = 0.75),amount of TV viewing (1)
Self-administeredpaper survey
Parents of 6-12 year old children,primarily Hispanic and low SES
MacFarlane (2010)Adolescent Perceptions ofParent Feeding Practices[108]
25 encouragement/modeling healthful eating(5, α= 0.74), negotiation (4, α= 0.67), pressureto eat disliked food (3, α= 0.66), pressure toeat when not hungry (3, α= 0.69), monitoring(2, α= 0.87)
Self-administeredpaper survey
Children aged 12-15 years old,Australian population
McCurdy (2010) FamilyFood Behavior Survey [109]
20 maternal control (5, α = 0.83), maternalpresence (5, α = 0.76), child control(5, α = 0.80), organization (5, α = 0.73)
In-person interview Parents of 2-11 year old children
O’Connor (2010) FoodParenting Practices [110]
33 teachable moments (5), practical methods (9),firm discipline (4), restriction of junk foods (5),enhanced availability/accessibility (10), acrossall scales α= 0.41-0.58
In-person interview Parents of 3-5 year old children,racially and economically diverse
Tremblay (2010) QuebecLongitudinal Study ofDevelopment – MealInteractions [111]
6 mealtime conflict (6, α = 0.55) In-person interview Parents of 4 year old children,population from Quebec
Zeinstra (2010) ParentalChild-Feeding Strategies[112]
79 vegetable: positive information (4, α = 0.84),distraction (4, α = 0.67), choice (5, α = 0.70),negative atmosphere (4, α = 0.80), pressure(3, α = 0.76), taste masking (4, α = 0.62), habit(2, α = 0.42), extra veg (3, α = 0.59); fruit:negative atmosphere and pressure (8, α= 0.85),positive information (4, α= 0.82), distraction(3, α= 0.54), choice (5, α= 0.60); includesadditional items not in scales
Self-administeredpaper survey
Parents of children 4-12 years old,Dutch population
Vaughn et al. International Journal of Behavioral Nutrition and Physical Activity 2013, 10:61 Page 9 of 27http://www.ijbnpa.org/content/10/1/61
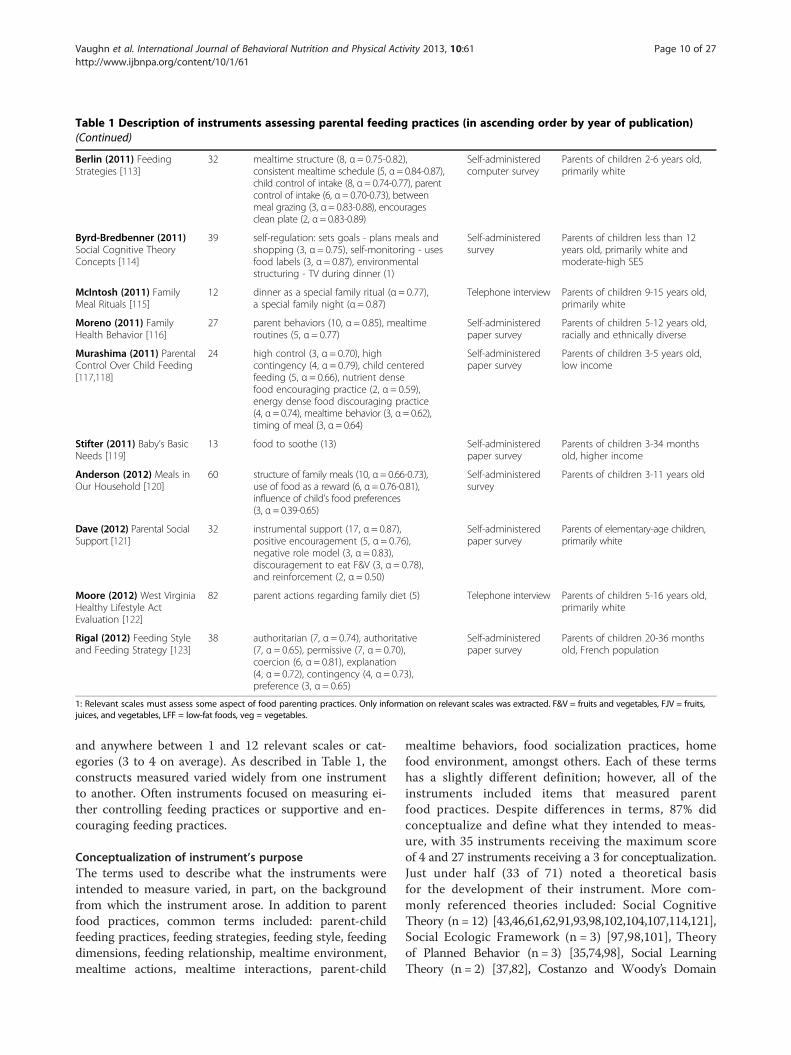
Table 1 Description of instruments assessing parental feeding practices (in ascending order by year of publication)(Continued)
Berlin (2011) FeedingStrategies [113]
32 mealtime structure (8, α = 0.75-0.82),consistent mealtime schedule (5, α= 0.84-0.87),child control of intake (8, α= 0.74-0.77), parentcontrol of intake (6, α= 0.70-0.73), betweenmeal grazing (3, α= 0.83-0.88), encouragesclean plate (2, α= 0.83-0.89)
Self-administeredcomputer survey
Parents of children 2-6 years old,primarily white
Byrd-Bredbenner (2011)Social Cognitive TheoryConcepts [114]
39 self-regulation: sets goals - plans meals andshopping (3, α = 0.75), self-monitoring - usesfood labels (3, α = 0.87), environmentalstructuring - TV during dinner (1)
Self-administeredsurvey
Parents of children less than 12years old, primarily white andmoderate-high SES
McIntosh (2011) FamilyMeal Rituals [115]
12 dinner as a special family ritual (α = 0.77),a special family night (α = 0.87)
Telephone interview Parents of children 9-15 years old,primarily white
Moreno (2011) FamilyHealth Behavior [116]
27 parent behaviors (10, α = 0.85), mealtimeroutines (5, α = 0.77)
Self-administeredpaper survey
Parents of children 5-12 years old,racially and ethnically diverse
Murashima (2011) ParentalControl Over Child Feeding[117,118]
24 high control (3, α = 0.70), highcontingency (4, α = 0.79), child centeredfeeding (5, α = 0.66), nutrient densefood encouraging practice (2, α = 0.59),energy dense food discouraging practice(4, α= 0.74), mealtime behavior (3, α= 0.62),timing of meal (3, α= 0.64)
Self-administeredpaper survey
Parents of children 3-5 years old,low income
Stifter (2011) Baby’s BasicNeeds [119]
13 food to soothe (13) Self-administeredpaper survey
Parents of children 3-34 monthsold, higher income
Anderson (2012) Meals inOur Household [120]
60 structure of family meals (10, α= 0.66-0.73),use of food as a reward (6, α= 0.76-0.81),influence of child’s food preferences(3, α= 0.39-0.65)
Self-administeredsurvey
Parents of children 3-11 years old
Dave (2012) Parental SocialSupport [121]
32 instrumental support (17, α = 0.87),positive encouragement (5, α = 0.76),negative role model (3, α = 0.83),discouragement to eat F&V (3, α = 0.78),and reinforcement (2, α = 0.50)
Self-administeredpaper survey
Parents of elementary-age children,primarily white
Moore (2012) West VirginiaHealthy Lifestyle ActEvaluation [122]
82 parent actions regarding family diet (5) Telephone interview Parents of children 5-16 years old,primarily white
Rigal (2012) Feeding Styleand Feeding Strategy [123]
38 authoritarian (7, α = 0.74), authoritative(7, α = 0.65), permissive (7, α = 0.70),coercion (6, α = 0.81), explanation(4, α = 0.72), contingency (4, α = 0.73),preference (3, α = 0.65)
Self-administeredpaper survey
Parents of children 20-36 monthsold, French population
1: Relevant scales must assess some aspect of food parenting practices. Only information on relevant scales was extracted. F&V = fruits and vegetables, FJV = fruits,juices, and vegetables, LFF = low-fat foods, veg = vegetables.
Vaughn et al. International Journal of Behavioral Nutrition and Physical Activity 2013, 10:61 Page 10 of 27http://www.ijbnpa.org/content/10/1/61
and anywhere between 1 and 12 relevant scales or cat-egories (3 to 4 on average). As described in Table 1, theconstructs measured varied widely from one instrumentto another. Often instruments focused on measuring ei-ther controlling feeding practices or supportive and en-couraging feeding practices.
Conceptualization of instrument’s purposeThe terms used to describe what the instruments wereintended to measure varied, in part, on the backgroundfrom which the instrument arose. In addition to parentfood practices, common terms included: parent-childfeeding practices, feeding strategies, feeding style, feedingdimensions, feeding relationship, mealtime environment,mealtime actions, mealtime interactions, parent-child
mealtime behaviors, food socialization practices, homefood environment, amongst others. Each of these termshas a slightly different definition; however, all of theinstruments included items that measured parentfood practices. Despite differences in terms, 87% didconceptualize and define what they intended to meas-ure, with 35 instruments receiving the maximum scoreof 4 and 27 instruments receiving a 3 for conceptualization.Just under half (33 of 71) noted a theoretical basisfor the development of their instrument. More com-monly referenced theories included: Social CognitiveTheory (n = 12) [43,46,61,62,91,93,98,102,104,107,114,121],Social Ecologic Framework (n = 3) [97,98,101], Theoryof Planned Behavior (n = 3) [35,74,98], Social LearningTheory (n = 2) [37,82], Costanzo and Woody’s Domain
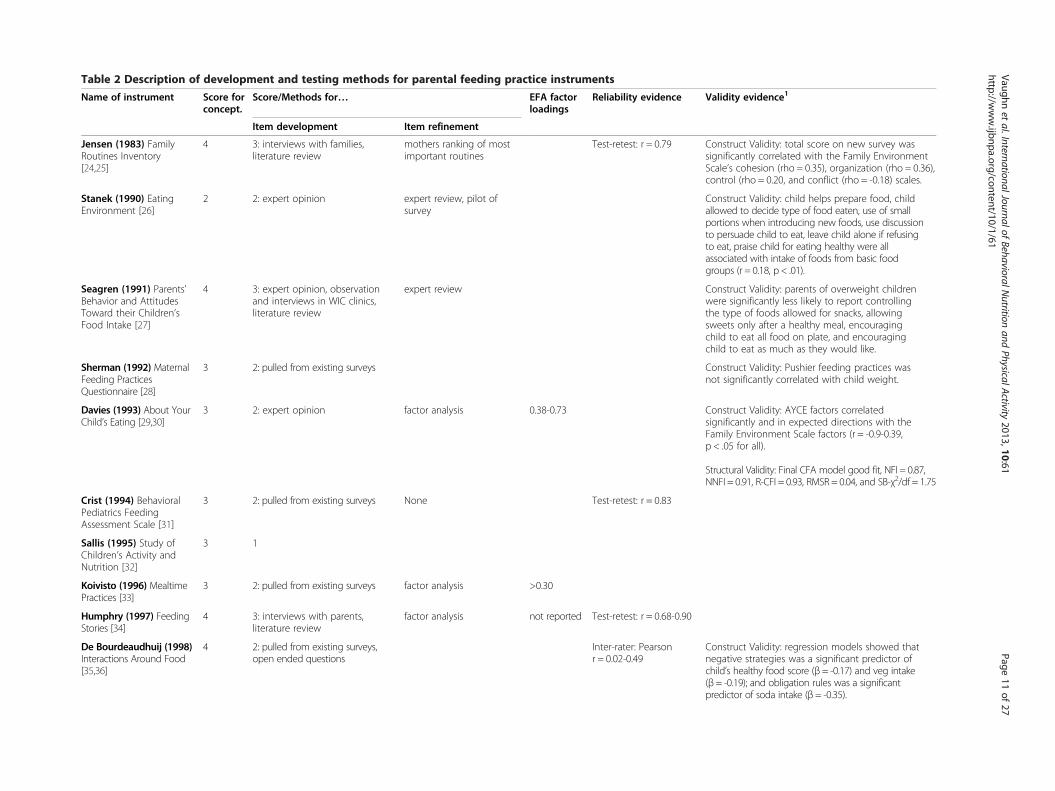
Table 2 Description of development and testing methods for parental feeding practice instruments
Name of instrument Score forconcept.
Score/Methods for… EFA factorloadings
Reliability evidence Validity evidence1
Item development Item refinement
Jensen (1983) FamilyRoutines Inventory[24,25]
4 3: interviews with families,literature review
mothers ranking of mostimportant routines
Test-retest: r = 0.79 Construct Validity: total score on new survey wassignificantly correlated with the Family EnvironmentScale’s cohesion (rho = 0.35), organization (rho = 0.36),control (rho = 0.20, and conflict (rho = -0.18) scales.
Stanek (1990) EatingEnvironment [26]
2 2: expert opinion expert review, pilot ofsurvey
Construct Validity: child helps prepare food, childallowed to decide type of food eaten, use of smallportions when introducing new foods, use discussionto persuade child to eat, leave child alone if refusingto eat, praise child for eating healthy were allassociated with intake of foods from basic foodgroups (r = 0.18, p < .01).
Seagren (1991) Parents’Behavior and AttitudesToward their Children’sFood Intake [27]
4 3: expert opinion, observationand interviews in WIC clinics,literature review
expert review Construct Validity: parents of overweight childrenwere significantly less likely to report controllingthe type of foods allowed for snacks, allowingsweets only after a healthy meal, encouragingchild to eat all food on plate, and encouragingchild to eat as much as they would like.
Sherman (1992) MaternalFeeding PracticesQuestionnaire [28]
3 2: pulled from existing surveys Construct Validity: Pushier feeding practices wasnot significantly correlated with child weight.
Davies (1993) About YourChild’s Eating [29,30]
3 2: expert opinion factor analysis 0.38-0.73 Construct Validity: AYCE factors correlatedsignificantly and in expected directions with theFamily Environment Scale factors (r = -0.9-0.39,p < .05 for all).
Structural Validity: Final CFA model good fit, NFI = 0.87,NNFI = 0.91, R-CFI = 0.93, RMSR = 0.04, and SB-χ2/df = 1.75
Crist (1994) BehavioralPediatrics FeedingAssessment Scale [31]
3 2: pulled from existing surveys None Test-retest: r = 0.83
Sallis (1995) Study ofChildren’s Activity andNutrition [32]
3 1
Koivisto (1996) MealtimePractices [33]
3 2: pulled from existing surveys factor analysis >0.30
Humphry (1997) FeedingStories [34]
4 3: interviews with parents,literature review
factor analysis not reported Test-retest: r = 0.68-0.90
De Bourdeaudhuij (1998)Interactions Around Food[35,36]
4 2: pulled from existing surveys,open ended questions
Inter-rater: Pearsonr = 0.02-0.49
Construct Validity: regression models showed thatnegative strategies was a significant predictor ofchild’s healthy food score (β = -0.17) and veg intake(β = -0.19); and obligation rules was a significantpredictor of soda intake (β = -0.35).
Vaughnet
al.InternationalJournalofBehavioralN
utritionand
PhysicalActivity
2013,10:61Page
11of
27http://w
ww.ijbnpa.org/content/10/1/61
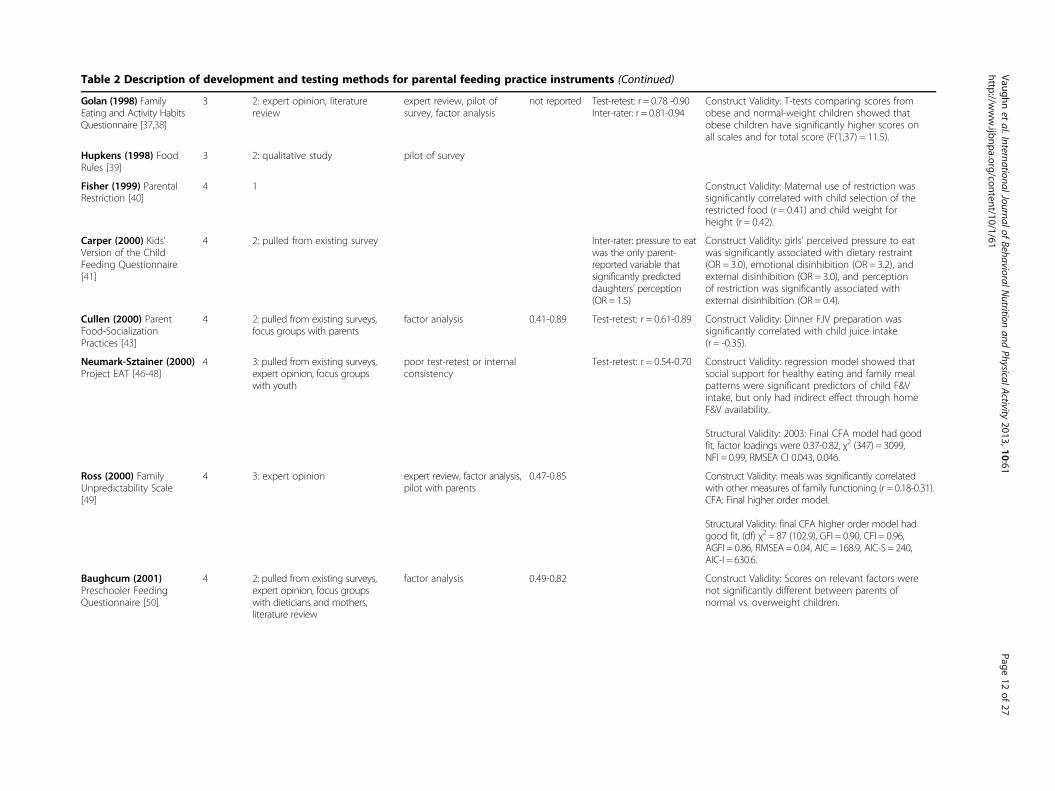
Table 2 Description of development and testing methods for parental feeding practice instruments (Continued)
Golan (1998) FamilyEating and Activity HabitsQuestionnaire [37,38]
3 2: expert opinion, literaturereview
expert review, pilot ofsurvey, factor analysis
not reported Test-retest: r = 0.78 -0.90Inter-rater: r = 0.81-0.94
Construct Validity: T-tests comparing scores fromobese and normal-weight children showed thatobese children have significantly higher scores onall scales and for total score (F(1,37) = 11.5).
Hupkens (1998) FoodRules [39]
3 2: qualitative study pilot of survey
Fisher (1999) ParentalRestriction [40]
4 1 Construct Validity: Maternal use of restriction wassignificantly correlated with child selection of therestricted food (r = 0.41) and child weight forheight (r = 0.42).
Carper (2000) Kids'Version of the ChildFeeding Questionnaire[41]
4 2: pulled from existing survey Inter-rater: pressure to eatwas the only parent-reported variable thatsignificantly predicteddaughters’ perception(OR = 1.5)
Construct Validity: girls' perceived pressure to eatwas significantly associated with dietary restraint(OR = 3.0), emotional disinhibition (OR = 3.2), andexternal disinhibition (OR = 3.0), and perceptionof restriction was significantly associated withexternal disinhibition (OR = 0.4).
Cullen (2000) ParentFood-SocializationPractices [43]
4 2: pulled from existing surveys,focus groups with parents
factor analysis 0.41-0.89 Test-retest: r = 0.61-0.89 Construct Validity: Dinner FJV preparation wassignificantly correlated with child juice intake(r = -0.35).
Neumark-Sztainer (2000)Project EAT [46-48]
4 3: pulled from existing surveys,expert opinion, focus groupswith youth
poor test-retest or internalconsistency
Test-retest: r = 0.54-0.70 Construct Validity: regression model showed thatsocial support for healthy eating and family mealpatterns were significant predictors of child F&Vintake, but only had indirect effect through homeF&V availability.
Structural Validity: 2003: Final CFA model had goodfit, factor loadings were 0.37-0.82, χ2 (347) = 3099,NFI = 0.99, RMSEA CI 0.043, 0.046.
Ross (2000) FamilyUnpredictability Scale[49]
4 3: expert opinion expert review, factor analysis,pilot with parents
0.47-0.85 Construct Validity: meals was significantly correlatedwith other measures of family functioning (r = 0.18-0.31).CFA: Final higher order model.
Structural Validity: final CFA higher order model hadgood fit, (df) χ2 = 87 (102.9), GFI = 0.90, CFI = 0.96,AGFI = 0.86, RMSEA = 0.04, AIC = 168.9, AIC-S = 240,AIC-I = 630.6.
Baughcum (2001)Preschooler FeedingQuestionnaire [50]
4 2: pulled from existing surveys,expert opinion, focus groupswith dieticians and mothers,literature review
factor analysis 0.49-0.82 Construct Validity: Scores on relevant factors werenot significantly different between parents ofnormal vs. overweight children.
Vaughnet
al.InternationalJournalofBehavioralN
utritionand
PhysicalActivity
2013,10:61Page
12of
27http://w
ww.ijbnpa.org/content/10/1/61
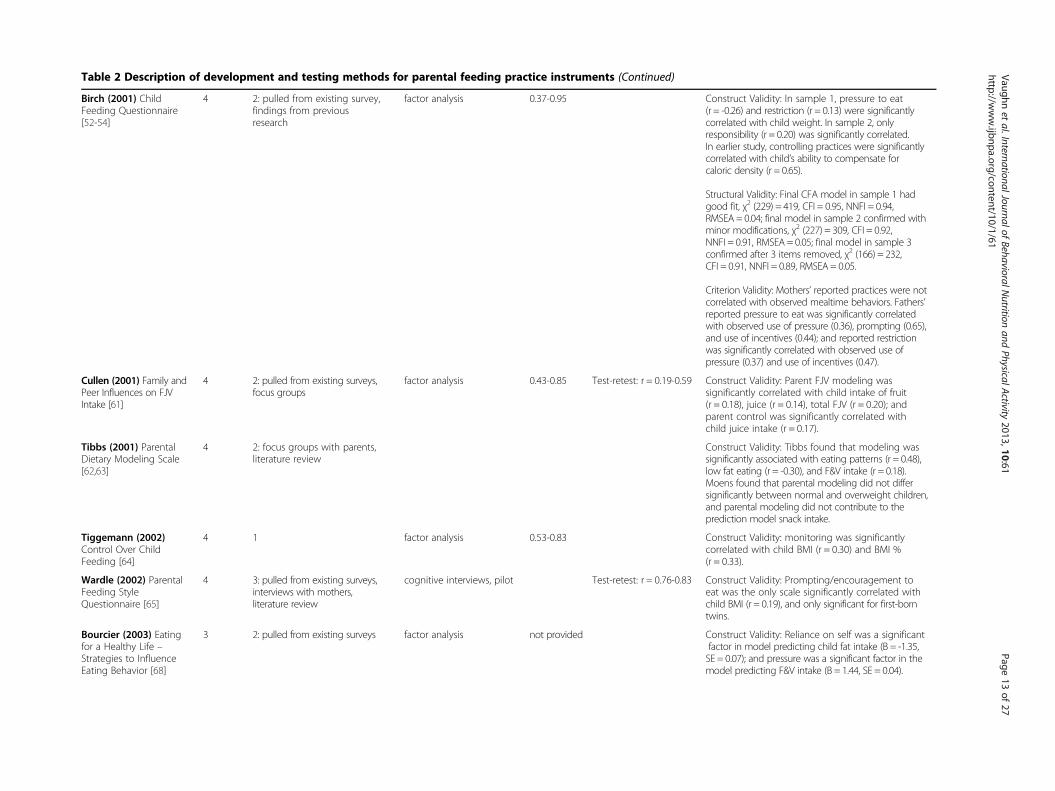
Table 2 Description of development and testing methods for parental feeding practice instruments (Continued)
Birch (2001) ChildFeeding Questionnaire[52-54]
4 2: pulled from existing survey,findings from previousresearch
factor analysis 0.37-0.95 Construct Validity: In sample 1, pressure to eat(r = -0.26) and restriction (r = 0.13) were significantlycorrelated with child weight. In sample 2, onlyresponsibility (r = 0.20) was significantly correlated.In earlier study, controlling practices were significantlycorrelated with child’s ability to compensate forcaloric density (r = 0.65).
Structural Validity: Final CFA model in sample 1 hadgood fit, χ2 (229) = 419, CFI = 0.95, NNFI = 0.94,RMSEA = 0.04; final model in sample 2 confirmed withminor modifications, χ2 (227) = 309, CFI = 0.92,NNFI = 0.91, RMSEA = 0.05; final model in sample 3confirmed after 3 items removed, χ2 (166) = 232,CFI = 0.91, NNFI = 0.89, RMSEA = 0.05.
Criterion Validity: Mothers’ reported practices were notcorrelated with observed mealtime behaviors. Fathers’reported pressure to eat was significantly correlatedwith observed use of pressure (0.36), prompting (0.65),and use of incentives (0.44); and reported restrictionwas significantly correlated with observed use ofpressure (0.37) and use of incentives (0.47).
Cullen (2001) Family andPeer Influences on FJVIntake [61]
4 2: pulled from existing surveys,focus groups
factor analysis 0.43-0.85 Test-retest: r = 0.19-0.59 Construct Validity: Parent FJV modeling wassignificantly correlated with child intake of fruit(r = 0.18), juice (r = 0.14), total FJV (r = 0.20); andparent control was significantly correlated withchild juice intake (r = 0.17).
Tibbs (2001) ParentalDietary Modeling Scale[62,63]
4 2: focus groups with parents,literature review
Construct Validity: Tibbs found that modeling wassignificantly associated with eating patterns (r = 0.48),low fat eating (r = -0.30), and F&V intake (r = 0.18).Moens found that parental modeling did not differsignificantly between normal and overweight children,and parental modeling did not contribute to theprediction model snack intake.
Tiggemann (2002)Control Over ChildFeeding [64]
4 1 factor analysis 0.53-0.83 Construct Validity: monitoring was significantlycorrelated with child BMI (r = 0.30) and BMI %(r = 0.33).
Wardle (2002) ParentalFeeding StyleQuestionnaire [65]
4 3: pulled from existing surveys,interviews with mothers,literature review
cognitive interviews, pilot Test-retest: r = 0.76-0.83 Construct Validity: Prompting/encouragement toeat was the only scale significantly correlated withchild BMI (r = 0.19), and only significant for first-borntwins.
Bourcier (2003) Eatingfor a Healthy Life –Strategies to InfluenceEating Behavior [68]
3 2: pulled from existing surveys factor analysis not provided Construct Validity: Reliance on self was a significantfactor in model predicting child fat intake (B = -1.35,SE = 0.07); and pressure was a significant factor in themodel predicting F&V intake (B = 1.44, SE = 0.04).
Vaughnet
al.InternationalJournalofBehavioralN
utritionand
PhysicalActivity
2013,10:61Page
13of
27http://w
ww.ijbnpa.org/content/10/1/61
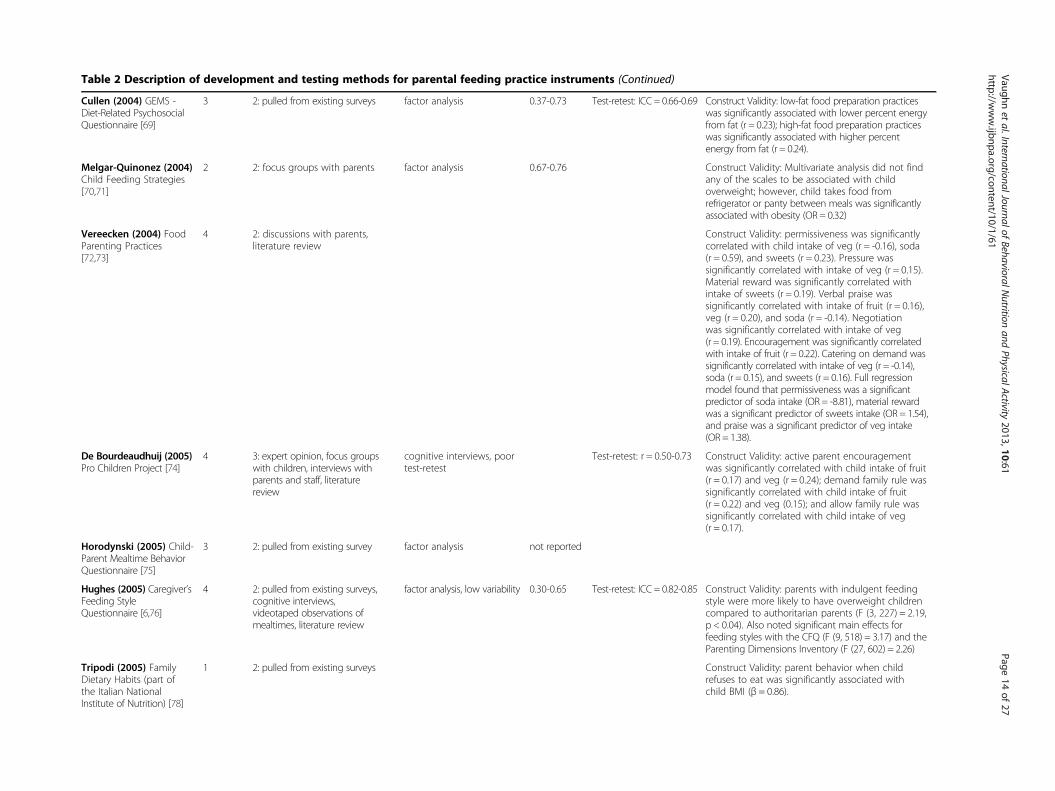
Table 2 Description of development and testing methods for parental feeding practice instruments (Continued)
Cullen (2004) GEMS -Diet-Related PsychosocialQuestionnaire [69]
3 2: pulled from existing surveys factor analysis 0.37-0.73 Test-retest: ICC = 0.66-0.69 Construct Validity: low-fat food preparation practiceswas significantly associated with lower percent energyfrom fat (r = 0.23); high-fat food preparation practiceswas significantly associated with higher percentenergy from fat (r = 0.24).
Melgar-Quinonez (2004)Child Feeding Strategies[70,71]
2 2: focus groups with parents factor analysis 0.67-0.76 Construct Validity: Multivariate analysis did not findany of the scales to be associated with childoverweight; however, child takes food fromrefrigerator or panty between meals was significantlyassociated with obesity (OR = 0.32)
Vereecken (2004) FoodParenting Practices[72,73]
4 2: discussions with parents,literature review
Construct Validity: permissiveness was significantlycorrelated with child intake of veg (r = -0.16), soda(r = 0.59), and sweets (r = 0.23). Pressure wassignificantly correlated with intake of veg (r = 0.15).Material reward was significantly correlated withintake of sweets (r = 0.19). Verbal praise wassignificantly correlated with intake of fruit (r = 0.16),veg (r = 0.20), and soda (r = -0.14). Negotiationwas significantly correlated with intake of veg(r = 0.19). Encouragement was significantly correlatedwith intake of fruit (r = 0.22). Catering on demand wassignificantly correlated with intake of veg (r = -0.14),soda (r = 0.15), and sweets (r = 0.16). Full regressionmodel found that permissiveness was a significantpredictor of soda intake (OR = -8.81), material rewardwas a significant predictor of sweets intake (OR = 1.54),and praise was a significant predictor of veg intake(OR = 1.38).
De Bourdeaudhuij (2005)Pro Children Project [74]
4 3: expert opinion, focus groupswith children, interviews withparents and staff, literaturereview
cognitive interviews, poortest-retest
Test-retest: r = 0.50-0.73 Construct Validity: active parent encouragementwas significantly correlated with child intake of fruit(r = 0.17) and veg (r = 0.24); demand family rule wassignificantly correlated with child intake of fruit(r = 0.22) and veg (0.15); and allow family rule wassignificantly correlated with child intake of veg(r = 0.17).
Horodynski (2005) Child-Parent Mealtime BehaviorQuestionnaire [75]
3 2: pulled from existing survey factor analysis not reported
Hughes (2005) Caregiver’sFeeding StyleQuestionnaire [6,76]
4 2: pulled from existing surveys,cognitive interviews,videotaped observations ofmealtimes, literature review
factor analysis, low variability 0.30-0.65 Test-retest: ICC = 0.82-0.85 Construct Validity: parents with indulgent feedingstyle were more likely to have overweight childrencompared to authoritarian parents (F (3, 227) = 2.19,p < 0.04). Also noted significant main effects forfeeding styles with the CFQ (F (9, 518) = 3.17) and theParenting Dimensions Inventory (F (27, 602) = 2.26)
Tripodi (2005) FamilyDietary Habits (part ofthe Italian NationalInstitute of Nutrition) [78]
1 2: pulled from existing surveys Construct Validity: parent behavior when childrefuses to eat was significantly associated withchild BMI (β = 0.86).
Vaughnet
al.InternationalJournalofBehavioralN
utritionand
PhysicalActivity
2013,10:61Page
14of
27http://w
ww.ijbnpa.org/content/10/1/61
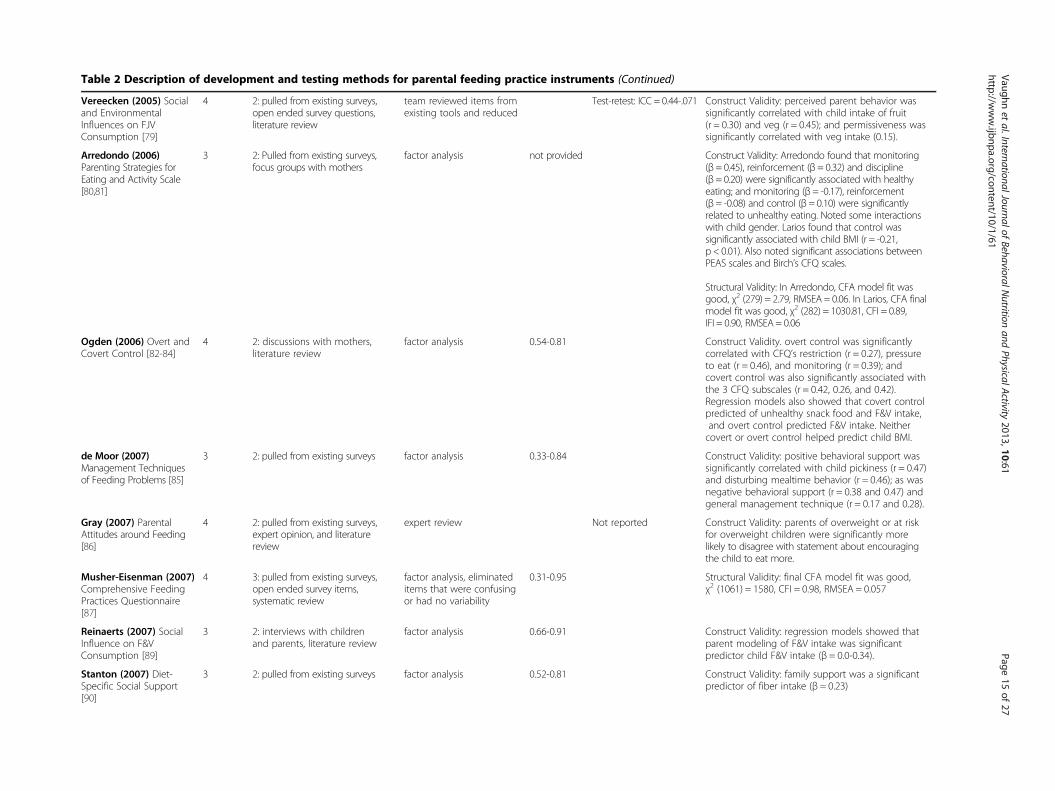
Table 2 Description of development and testing methods for parental feeding practice instruments (Continued)
Vereecken (2005) Socialand EnvironmentalInfluences on FJVConsumption [79]
4 2: pulled from existing surveys,open ended survey questions,literature review
team reviewed items fromexisting tools and reduced
Test-retest: ICC = 0.44-.071 Construct Validity: perceived parent behavior wassignificantly correlated with child intake of fruit(r = 0.30) and veg (r = 0.45); and permissiveness wassignificantly correlated with veg intake (0.15).
Arredondo (2006)Parenting Strategies forEating and Activity Scale[80,81]
3 2: Pulled from existing surveys,focus groups with mothers
factor analysis not provided Construct Validity: Arredondo found that monitoring(β = 0.45), reinforcement (β= 0.32) and discipline(β = 0.20) were significantly associated with healthyeating; and monitoring (β= -0.17), reinforcement(β = -0.08) and control (β = 0.10) were significantlyrelated to unhealthy eating. Noted some interactionswith child gender. Larios found that control wassignificantly associated with child BMI (r = -0.21,p < 0.01). Also noted significant associations betweenPEAS scales and Birch’s CFQ scales.
Structural Validity: In Arredondo, CFA model fit wasgood, χ2 (279) = 2.79, RMSEA = 0.06. In Larios, CFA finalmodel fit was good, χ2 (282) = 1030.81, CFI = 0.89,IFI = 0.90, RMSEA = 0.06
Ogden (2006) Overt andCovert Control [82-84]
4 2: discussions with mothers,literature review
factor analysis 0.54-0.81 Construct Validity. overt control was significantlycorrelated with CFQ’s restriction (r = 0.27), pressureto eat (r = 0.46), and monitoring (r = 0.39); andcovert control was also significantly associated withthe 3 CFQ subscales (r = 0.42, 0.26, and 0.42).Regression models also showed that covert controlpredicted of unhealthy snack food and F&V intake,and overt control predicted F&V intake. Neithercovert or overt control helped predict child BMI.
de Moor (2007)Management Techniquesof Feeding Problems [85]
3 2: pulled from existing surveys factor analysis 0.33-0.84 Construct Validity: positive behavioral support wassignificantly correlated with child pickiness (r = 0.47)and disturbing mealtime behavior (r = 0.46); as wasnegative behavioral support (r = 0.38 and 0.47) andgeneral management technique (r = 0.17 and 0.28).
Gray (2007) ParentalAttitudes around Feeding[86]
4 2: pulled from existing surveys,expert opinion, and literaturereview
expert review Not reported Construct Validity: parents of overweight or at riskfor overweight children were significantly morelikely to disagree with statement about encouragingthe child to eat more.
Musher-Eisenman (2007)Comprehensive FeedingPractices Questionnaire[87]
4 3: pulled from existing surveys,open ended survey items,systematic review
factor analysis, eliminateditems that were confusingor had no variability
0.31-0.95 Structural Validity: final CFA model fit was good,χ2 (1061) = 1580, CFI = 0.98, RMSEA = 0.057
Reinaerts (2007) SocialInfluence on F&VConsumption [89]
3 2: interviews with childrenand parents, literature review
factor analysis 0.66-0.91 Construct Validity: regression models showed thatparent modeling of F&V intake was significantpredictor child F&V intake (β = 0.0-0.34).
Stanton (2007) Diet-Specific Social Support[90]
3 2: pulled from existing surveys factor analysis 0.52-0.81 Construct Validity: family support was a significantpredictor of fiber intake (β = 0.23)
Vaughnet
al.InternationalJournalofBehavioralN
utritionand
PhysicalActivity
2013,10:61Page
15of
27http://w
ww.ijbnpa.org/content/10/1/61
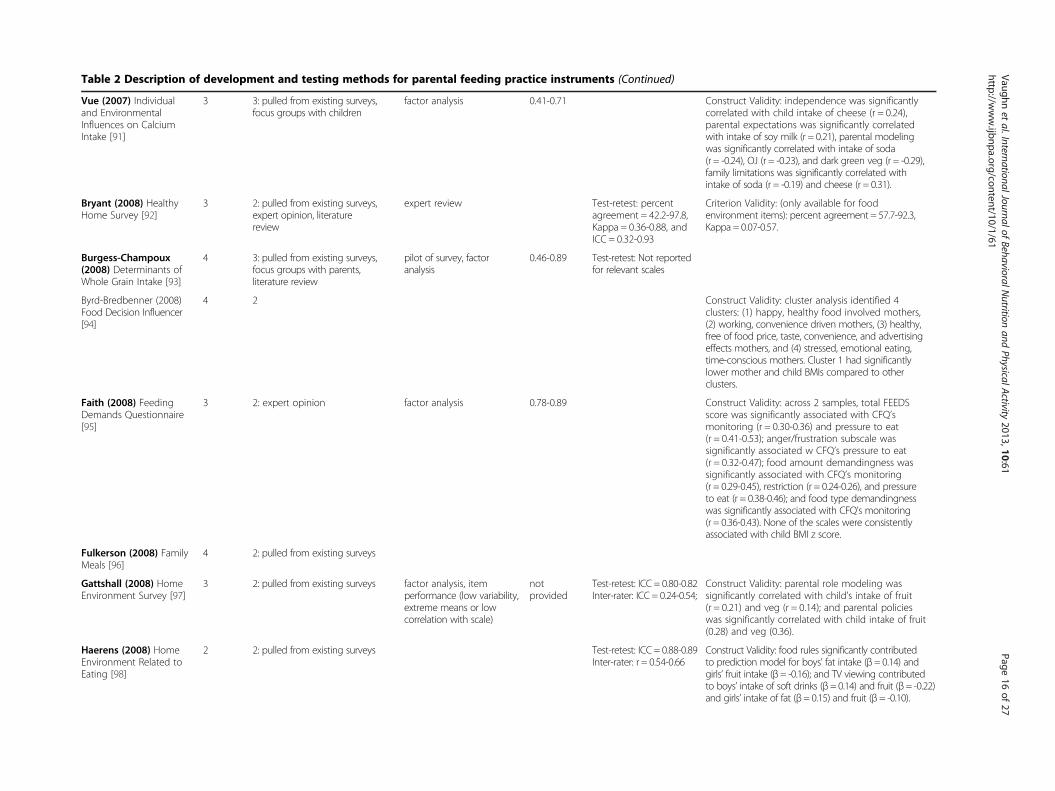
Table 2 Description of development and testing methods for parental feeding practice instruments (Continued)
Vue (2007) Individualand EnvironmentalInfluences on CalciumIntake [91]
3 3: pulled from existing surveys,focus groups with children
factor analysis 0.41-0.71 Construct Validity: independence was significantlycorrelated with child intake of cheese (r = 0.24),parental expectations was significantly correlatedwith intake of soy milk (r = 0.21), parental modelingwas significantly correlated with intake of soda(r = -0.24), OJ (r = -0.23), and dark green veg (r = -0.29),family limitations was significantly correlated withintake of soda (r = -0.19) and cheese (r = 0.31).
Bryant (2008) HealthyHome Survey [92]
3 2: pulled from existing surveys,expert opinion, literaturereview
expert review Test-retest: percentagreement = 42.2-97.8,Kappa = 0.36-0.88, andICC = 0.32-0.93
Criterion Validity: (only available for foodenvironment items): percent agreement = 57.7-92.3,Kappa = 0.07-0.57.
Burgess-Champoux(2008) Determinants ofWhole Grain Intake [93]
4 3: pulled from existing surveys,focus groups with parents,literature review
pilot of survey, factoranalysis
0.46-0.89 Test-retest: Not reportedfor relevant scales
Byrd-Bredbenner (2008)Food Decision Influencer[94]
4 2 Construct Validity: cluster analysis identified 4clusters: (1) happy, healthy food involved mothers,(2) working, convenience driven mothers, (3) healthy,free of food price, taste, convenience, and advertisingeffects mothers, and (4) stressed, emotional eating,time-conscious mothers. Cluster 1 had significantlylower mother and child BMIs compared to otherclusters.
Faith (2008) FeedingDemands Questionnaire[95]
3 2: expert opinion factor analysis 0.78-0.89 Construct Validity: across 2 samples, total FEEDSscore was significantly associated with CFQ’smonitoring (r = 0.30-0.36) and pressure to eat(r = 0.41-0.53); anger/frustration subscale wassignificantly associated w CFQ’s pressure to eat(r = 0.32-0.47); food amount demandingness wassignificantly associated with CFQ’s monitoring(r = 0.29-0.45), restriction (r = 0.24-0.26), and pressureto eat (r = 0.38-0.46); and food type demandingnesswas significantly associated with CFQ’s monitoring(r = 0.36-0.43). None of the scales were consistentlyassociated with child BMI z score.
Fulkerson (2008) FamilyMeals [96]
4 2: pulled from existing surveys
Gattshall (2008) HomeEnvironment Survey [97]
3 2: pulled from existing surveys factor analysis, itemperformance (low variability,extreme means or lowcorrelation with scale)
notprovided
Test-retest: ICC = 0.80-0.82Inter-rater: ICC = 0.24-0.54;
Construct Validity: parental role modeling wassignificantly correlated with child’s intake of fruit(r = 0.21) and veg (r = 0.14); and parental policieswas significantly correlated with child intake of fruit(0.28) and veg (0.36).
Haerens (2008) HomeEnvironment Related toEating [98]
2 2: pulled from existing surveys Test-retest: ICC = 0.88-0.89Inter-rater: r = 0.54-0.66
Construct Validity: food rules significantly contributedto prediction model for boys’ fat intake (β= 0.14) andgirls’ fruit intake (β= -0.16); and TV viewing contributedto boys’ intake of soft drinks (β= 0.14) and fruit (β= -0.22)and girls’ intake of fat (β= 0.15) and fruit (β= -0.10).
Vaughnet
al.InternationalJournalofBehavioralN
utritionand
PhysicalActivity
2013,10:61Page
16of
27http://w
ww.ijbnpa.org/content/10/1/61
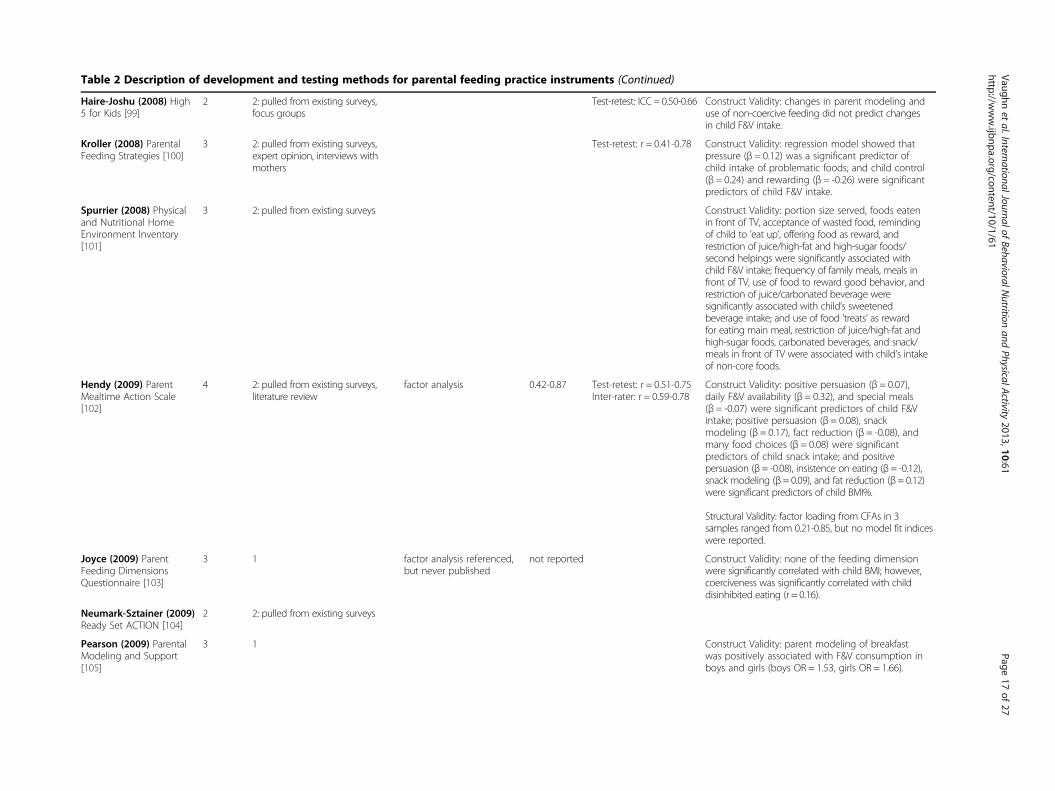
Table 2 Description of development and testing methods for parental feeding practice instruments (Continued)
Haire-Joshu (2008) High5 for Kids [99]
2 2: pulled from existing surveys,focus groups
Test-retest: ICC = 0.50-0.66 Construct Validity: changes in parent modeling anduse of non-coercive feeding did not predict changesin child F&V intake.
Kroller (2008) ParentalFeeding Strategies [100]
3 2: pulled from existing surveys,expert opinion, interviews withmothers
Test-retest: r = 0.41-0.78 Construct Validity: regression model showed thatpressure (β = 0.12) was a significant predictor ofchild intake of problematic foods; and child control(β = 0.24) and rewarding (β = -0.26) were significantpredictors of child F&V intake.
Spurrier (2008) Physicaland Nutritional HomeEnvironment Inventory[101]
3 2: pulled from existing surveys Construct Validity: portion size served, foods eatenin front of TV, acceptance of wasted food, remindingof child to ’eat up’, offering food as reward, andrestriction of juice/high-fat and high-sugar foods/second helpings were significantly associated withchild F&V intake; frequency of family meals, meals infront of TV, use of food to reward good behavior, andrestriction of juice/carbonated beverage weresignificantly associated with child’s sweetenedbeverage intake; and use of food ’treats’ as rewardfor eating main meal, restriction of juice/high-fat andhigh-sugar foods, carbonated beverages, and snack/meals in front of TV were associated with child’s intakeof non-core foods.
Hendy (2009) ParentMealtime Action Scale[102]
4 2: pulled from existing surveys,literature review
factor analysis 0.42-0.87 Test-retest: r = 0.51-0.75Inter-rater: r = 0.59-0.78
Construct Validity: positive persuasion (β = 0.07),daily F&V availability (β = 0.32), and special meals(β = -0.07) were significant predictors of child F&Vintake; positive persuasion (β = 0.08), snackmodeling (β = 0.17), fact reduction (β = -0.08), andmany food choices (β = 0.08) were significantpredictors of child snack intake; and positivepersuasion (β = -0.08), insistence on eating (β = -0.12),snack modeling (β= 0.09), and fat reduction (β= 0.12)were significant predictors of child BMI%.
Structural Validity: factor loading from CFAs in 3samples ranged from 0.21-0.85, but no model fit indiceswere reported.
Joyce (2009) ParentFeeding DimensionsQuestionnaire [103]
3 1 factor analysis referenced,but never published
not reported Construct Validity: none of the feeding dimensionwere significantly correlated with child BMI; however,coerciveness was significantly correlated with childdisinhibited eating (r = 0.16).
Neumark-Sztainer (2009)Ready Set ACTION [104]
2 2: pulled from existing surveys
Pearson (2009) ParentalModeling and Support[105]
3 1 Construct Validity: parent modeling of breakfastwas positively associated with F&V consumption inboys and girls (boys OR = 1.53, girls OR = 1.66).
Vaughnet
al.InternationalJournalofBehavioralN
utritionand
PhysicalActivity
2013,10:61Page
17of
27http://w
ww.ijbnpa.org/content/10/1/61
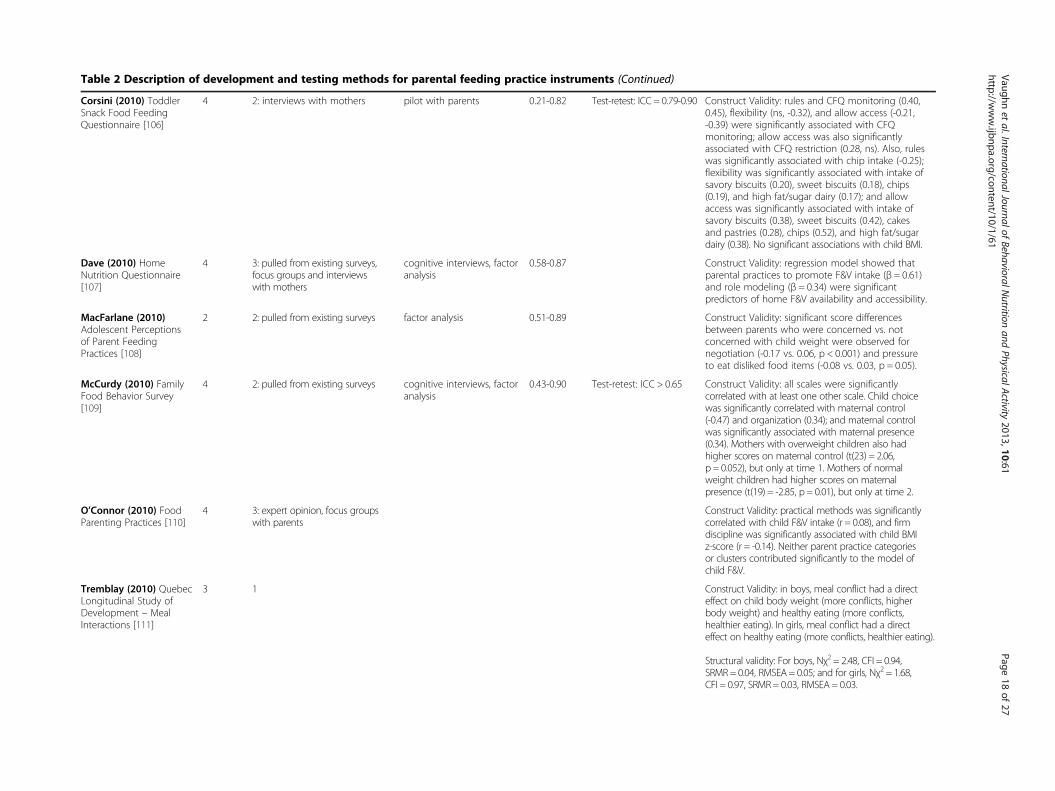
Table 2 Description of development and testing methods for parental feeding practice instruments (Continued)
Corsini (2010) ToddlerSnack Food FeedingQuestionnaire [106]
4 2: interviews with mothers pilot with parents 0.21-0.82 Test-retest: ICC = 0.79-0.90 Construct Validity: rules and CFQ monitoring (0.40,0.45), flexibility (ns, -0.32), and allow access (-0.21,-0.39) were significantly associated with CFQmonitoring; allow access was also significantlyassociated with CFQ restriction (0.28, ns). Also, ruleswas significantly associated with chip intake (-0.25);flexibility was significantly associated with intake ofsavory biscuits (0.20), sweet biscuits (0.18), chips(0.19), and high fat/sugar dairy (0.17); and allowaccess was significantly associated with intake ofsavory biscuits (0.38), sweet biscuits (0.42), cakesand pastries (0.28), chips (0.52), and high fat/sugardairy (0.38). No significant associations with child BMI.
Dave (2010) HomeNutrition Questionnaire[107]
4 3: pulled from existing surveys,focus groups and interviewswith mothers
cognitive interviews, factoranalysis
0.58-0.87 Construct Validity: regression model showed thatparental practices to promote F&V intake (β = 0.61)and role modeling (β = 0.34) were significantpredictors of home F&V availability and accessibility.
MacFarlane (2010)Adolescent Perceptionsof Parent FeedingPractices [108]
2 2: pulled from existing surveys factor analysis 0.51-0.89 Construct Validity: significant score differencesbetween parents who were concerned vs. notconcerned with child weight were observed fornegotiation (-0.17 vs. 0.06, p < 0.001) and pressureto eat disliked food items (-0.08 vs. 0.03, p = 0.05).
McCurdy (2010) FamilyFood Behavior Survey[109]
4 2: pulled from existing surveys cognitive interviews, factoranalysis
0.43-0.90 Test-retest: ICC > 0.65 Construct Validity: all scales were significantlycorrelated with at least one other scale. Child choicewas significantly correlated with maternal control(-0.47) and organization (0.34); and maternal controlwas significantly associated with maternal presence(0.34). Mothers with overweight children also hadhigher scores on maternal control (t(23) = 2.06,p = 0.052), but only at time 1. Mothers of normalweight children had higher scores on maternalpresence (t(19) = -2.85, p = 0.01), but only at time 2.
O’Connor (2010) FoodParenting Practices [110]
4 3: expert opinion, focus groupswith parents
Construct Validity: practical methods was significantlycorrelated with child F&V intake (r = 0.08), and firmdiscipline was significantly associated with child BMIz-score (r = -0.14). Neither parent practice categoriesor clusters contributed significantly to the model ofchild F&V.
Tremblay (2010) QuebecLongitudinal Study ofDevelopment – MealInteractions [111]
3 1 Construct Validity: in boys, meal conflict had a directeffect on child body weight (more conflicts, higherbody weight) and healthy eating (more conflicts,healthier eating). In girls, meal conflict had a directeffect on healthy eating (more conflicts, healthier eating).
Structural validity: For boys, Nχ2 = 2.48, CFI = 0.94,SRMR = 0.04, RMSEA= 0.05; and for girls, Nχ2 = 1.68,CFI = 0.97, SRMR= 0.03, RMSEA = 0.03.
Vaughnet
al.InternationalJournalofBehavioralN
utritionand
PhysicalActivity
2013,10:61Page
18of
27http://w
ww.ijbnpa.org/content/10/1/61
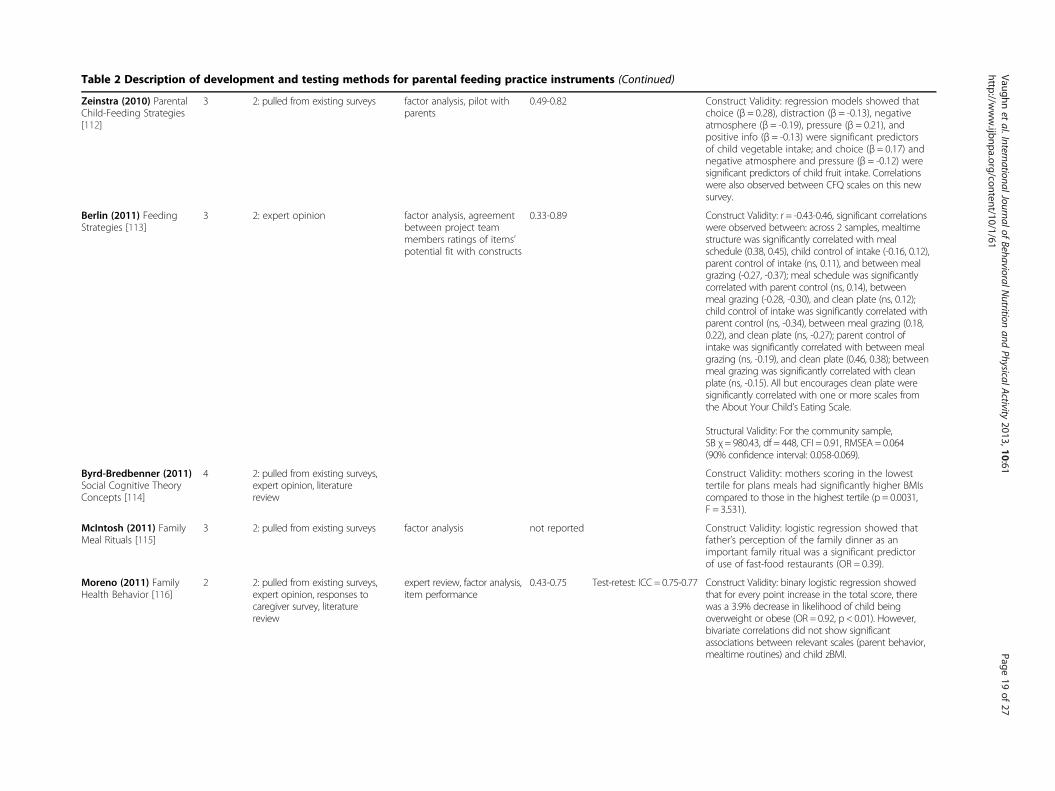
Table 2 Description of development and testing methods for parental feeding practice instruments (Continued)
Zeinstra (2010) ParentalChild-Feeding Strategies[112]
3 2: pulled from existing surveys factor analysis, pilot withparents
0.49-0.82 Construct Validity: regression models showed thatchoice (β = 0.28), distraction (β = -0.13), negativeatmosphere (β = -0.19), pressure (β = 0.21), andpositive info (β = -0.13) were significant predictorsof child vegetable intake; and choice (β = 0.17) andnegative atmosphere and pressure (β = -0.12) weresignificant predictors of child fruit intake. Correlationswere also observed between CFQ scales on this newsurvey.
Berlin (2011) FeedingStrategies [113]
3 2: expert opinion factor analysis, agreementbetween project teammembers ratings of items’potential fit with constructs
0.33-0.89 Construct Validity: r = -0.43-0.46, significant correlationswere observed between: across 2 samples, mealtimestructure was significantly correlated with mealschedule (0.38, 0.45), child control of intake (-0.16, 0.12),parent control of intake (ns, 0.11), and between mealgrazing (-0.27, -0.37); meal schedule was significantlycorrelated with parent control (ns, 0.14), betweenmeal grazing (-0.28, -0.30), and clean plate (ns, 0.12);child control of intake was significantly correlated withparent control (ns, -0.34), between meal grazing (0.18,0.22), and clean plate (ns, -0.27); parent control ofintake was significantly correlated with between mealgrazing (ns, -0.19), and clean plate (0.46, 0.38); betweenmeal grazing was significantly correlated with cleanplate (ns, -0.15). All but encourages clean plate weresignificantly correlated with one or more scales fromthe About Your Child’s Eating Scale.
Structural Validity: For the community sample,SB χ= 980.43, df = 448, CFI = 0.91, RMSEA = 0.064(90% confidence interval: 0.058-0.069).
Byrd-Bredbenner (2011)Social Cognitive TheoryConcepts [114]
4 2: pulled from existing surveys,expert opinion, literaturereview
Construct Validity: mothers scoring in the lowesttertile for plans meals had significantly higher BMIscompared to those in the highest tertile (p = 0.0031,F = 3.531).
McIntosh (2011) FamilyMeal Rituals [115]
3 2: pulled from existing surveys factor analysis not reported Construct Validity: logistic regression showed thatfather’s perception of the family dinner as animportant family ritual was a significant predictorof use of fast-food restaurants (OR = 0.39).
Moreno (2011) FamilyHealth Behavior [116]
2 2: pulled from existing surveys,expert opinion, responses tocaregiver survey, literaturereview
expert review, factor analysis,item performance
0.43-0.75 Test-retest: ICC = 0.75-0.77 Construct Validity: binary logistic regression showedthat for every point increase in the total score, therewas a 3.9% decrease in likelihood of child beingoverweight or obese (OR = 0.92, p < 0.01). However,bivariate correlations did not show significantassociations between relevant scales (parent behavior,mealtime routines) and child zBMI.
Vaughnet
al.InternationalJournalofBehavioralN
utritionand
PhysicalActivity
2013,10:61Page
19of
27http://w
ww.ijbnpa.org/content/10/1/61
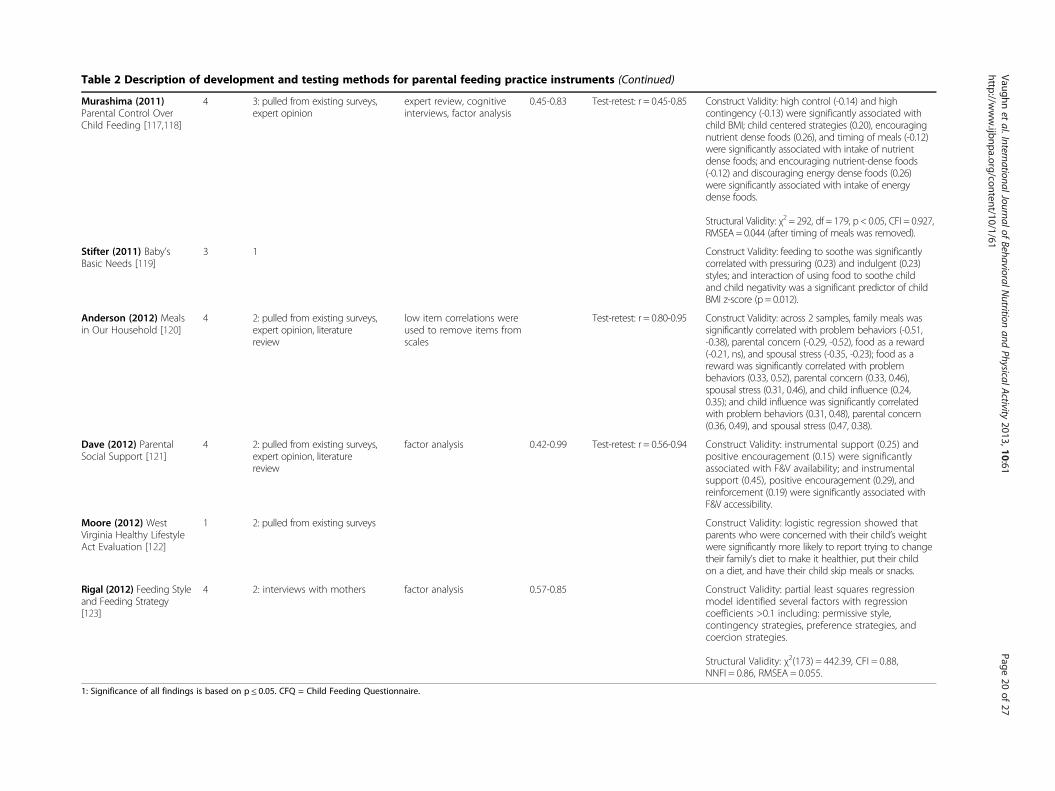
Table 2 Description of development and testing methods for parental feeding practice instruments (Continued)
Murashima (2011)Parental Control OverChild Feeding [117,118]
4 3: pulled from existing surveys,expert opinion
expert review, cognitiveinterviews, factor analysis
0.45-0.83 Test-retest: r = 0.45-0.85 Construct Validity: high control (-0.14) and highcontingency (-0.13) were significantly associated withchild BMI; child centered strategies (0.20), encouragingnutrient dense foods (0.26), and timing of meals (-0.12)were significantly associated with intake of nutrientdense foods; and encouraging nutrient-dense foods(-0.12) and discouraging energy dense foods (0.26)were significantly associated with intake of energydense foods.
Structural Validity: χ2 = 292, df = 179, p < 0.05, CFI = 0.927,RMSEA = 0.044 (after timing of meals was removed).
Stifter (2011) Baby’sBasic Needs [119]
3 1 Construct Validity: feeding to soothe was significantlycorrelated with pressuring (0.23) and indulgent (0.23)styles; and interaction of using food to soothe childand child negativity was a significant predictor of childBMI z-score (p = 0.012).
Anderson (2012) Mealsin Our Household [120]
4 2: pulled from existing surveys,expert opinion, literaturereview
low item correlations wereused to remove items fromscales
Test-retest: r = 0.80-0.95 Construct Validity: across 2 samples, family meals wassignificantly correlated with problem behaviors (-0.51,-0.38), parental concern (-0.29, -0.52), food as a reward(-0.21, ns), and spousal stress (-0.35, -0.23); food as areward was significantly correlated with problembehaviors (0.33, 0.52), parental concern (0.33, 0.46),spousal stress (0.31, 0.46), and child influence (0.24,0.35); and child influence was significantly correlatedwith problem behaviors (0.31, 0.48), parental concern(0.36, 0.49), and spousal stress (0.47, 0.38).
Dave (2012) ParentalSocial Support [121]
4 2: pulled from existing surveys,expert opinion, literaturereview
factor analysis 0.42-0.99 Test-retest: r = 0.56-0.94 Construct Validity: instrumental support (0.25) andpositive encouragement (0.15) were significantlyassociated with F&V availability; and instrumentalsupport (0.45), positive encouragement (0.29), andreinforcement (0.19) were significantly associated withF&V accessibility.
Moore (2012) WestVirginia Healthy LifestyleAct Evaluation [122]
1 2: pulled from existing surveys Construct Validity: logistic regression showed thatparents who were concerned with their child’s weightwere significantly more likely to report trying to changetheir family’s diet to make it healthier, put their childon a diet, and have their child skip meals or snacks.
Rigal (2012) Feeding Styleand Feeding Strategy[123]
4 2: interviews with mothers factor analysis 0.57-0.85 Construct Validity: partial least squares regressionmodel identified several factors with regressioncoefficients >0.1 including: permissive style,contingency strategies, preference strategies, andcoercion strategies.
Structural Validity: χ2(173) = 442.39, CFI = 0.88,NNFI = 0.86, RMSEA = 0.055.
1: Significance of all findings is based on p ≤ 0.05. CFQ = Child Feeding Questionnaire.
Vaughnet
al.InternationalJournalofBehavioralN
utritionand
PhysicalActivity
2013,10:61Page
20of
27http://w
ww.ijbnpa.org/content/10/1/61
Vaughn et al. International Journal of Behavioral Nutrition and Physical Activity 2013, 10:61 Page 21 of 27http://www.ijbnpa.org/content/10/1/61
Specific Parenting or Baumrind’s Parenting Styles (n = 4)[6,52,64,123], and Satter’s model of the feeding relationship(n = 3) [27,29,113].
Development of item poolThe processes used to develop a pool of items variedwidely. Only 14 (20%) received the maximum score of 3,indicating a fully systematic process was employed.Common methods employed for item development in-cluded: pulled or modified items from existing instru-ments (n = 44), extrapolation from qualitative formativedata such as focus groups or interviews (n = 36), cre-ated items based on a review of the literature (n = 22),expert guidance (n = 19), or some combination of methods(n = 33). Seven instruments had no description regardinghow items were created.
Refinement of item poolAbout one third (n = 24) of the instruments identified inthis review did not report any attempts to refine thepool of items once created. Among those who did at-tempt to refine their pool of items, factor analysis wasthe most commonly used method (n = 36). Those whoemployed factor analyses generally used widely acceptedcriteria for cut-offs for factor loadings and cross load-ings. Only 16 instruments had items reviewed by expertsto assess content validity, and only 30 piloted the instru-ment or conducted cognitive interviews to assess clarity ofitems and face validity. Item performance was also notedas a means to reduce the item pool for 7 instruments.
ReliabilitySome form of reliability was reported for a majority ofinstruments (n = 57 or 80%). Internal consistency wasthe most common form of reliability reported (n = 56).Generally those that employed such methods retainedonly those scales that met generally established cut-offcriteria with 38 reporting Cronbach’s alphas of at least0.6 or higher. None of these 38 instruments had alphasgreater than 0.9 for all scales, only 5 had alphas con-sistently above 0.8, and an additional 23 had alphasconsistently above 0.7. Test-retest was reported for 27instruments, typically using a 1-3 week interval. Thetwo notable exceptions were the GEMS’ Diet-RelatedPsychosocial Questionnaire [69], which administeredtest-retest over a 12-week period (during which timethere was also an intervention delivered); and the Behav-ioral Pediatrics Feeding Assessment Scale [31], which ad-ministered test-retest over a 2 year interval. Correlationsreported for test-retest were generally acceptable (>0.6)for most scales within a given instrument. However,when looking at test-retest correlations of all scales on agiven instrument only 5 had correlations for all scalesabove 0.8; 6 additional had correlations >0.7; and 5 more
had correlations >0.6. Inter-rater reliability was reportedfor 6 instruments, but only 1 instrument reported that allcorrelations were >0.8, the remaining 5 included correla-tions less than 0.6 for at least one scale.
ValidityThe majority of instruments (n = 61 or 86%) reportedsome type of validity evidence. Construct validity was byfar the most common type of validity evidence evaluated(n = 59), often testing for relationships between food par-enting practices and child diet or child weight. Most in-struments had one or more scales that were significantlyassociated with one of these outcomes; however, correla-tions were generally in the range of 0.15-0.45. While allpapers including this type of evidence were given creditfor evaluating construct validity, these tests were notalways presented as construct validity within the articles.Confirmatory factor analysis was reported for only 10instruments. Those that did attempt to explore struc-tural validity were generally successful with only minormodifications to their original model. Only two studiesattempted to establish criterion validity.
ResponsivenessThe Family Eating and Activity Habits Questionnaire[37] was the only paper that formally assessed the instru-ments’ responsiveness to treatment results. The ques-tionnaire was administered to families taking part in aweight loss program both at baseline and follow-up.Changes in questionnaire scores as well as changes inweight were observed in the intervention group, andweight loss in the child was highly correlated with im-provement in the questionnaire score.
Completeness of development processIdeally, instrument development would involve all 6components described thus far: (1) clear conceptualizationof what the instrument is intended to measure, (2) system-atic process for developing item pool, (3) refinement of theitem pool (through at least one method: factor ana-lysis, expert review, cognitive interviews, and/or piloting),(4) some type of reliability testing (inter-rater, test-retest,and/or internal consistency), (5) at least one type of validitytesting, and (6) responsiveness or stability testing. On aver-age, instruments reported only 2 or 3 of these 6 steps(range: 0 to 4).
DiscussionIn the current review, 71 instruments were identified thatincluded assessment of parent food practices. The qualityof processes used and reported for instrument develop-ment varied widely, but there are instruments that demon-strate reasonably thorough development work. The qualityassessment of the 71 instruments in this review highlights
Vaughn et al. International Journal of Behavioral Nutrition and Physical Activity 2013, 10:61 Page 22 of 27http://www.ijbnpa.org/content/10/1/61
many key lessons that should inform future research in theareas of conceptualization of constructs, development andrefinement of the item pool, collection of multiple types ofreliability and validity evidence, and planning for respon-siveness or stability testing.
Conceptualization of constructsParent food practices is a rapidly growing area of re-search that would benefit greatly from a common con-ceptual model. The content map (Figure 2) representsan initial effort to capture relevant constructs thatshould be included in this conceptual model. It servedas a useful guide for the current review and may helpinform future work to develop a conceptual model.Consensus is required in order to develop a clear con-ceptual model including an indication of what con-structs should be included and how those constructsshould be defined. The current lack of consensus hasresulted in scales from different instruments that mayshare similar names, but include items measuring verydifferent behaviors. Further, other instruments may in-clude similar items, but employ different names fortheir scales. For example, the Restriction subscale fromthe Child Feeding Questionnaire [52] includes itemsabout ensuring the child does not eat too many sweetsor high fat foods and items about guiding and regulat-ing child’s intake of certain foods – both of which re-flect how “restriction” is typically defined. However, thissubscale also includes items regarding offering sweetsas a reward for good behavior, which other measurescall “instrumental feeding” [65]. Researchers working inthis field need consensus and a clear conceptual modelbased on current knowledge. Future research can thenexpand upon or clarify components of the model.The use of theory to guide instrument development
helps ensure clear conceptualization of all relevant con-structs. Unfortunately, only half of developers noted atheoretical basis for their instruments. Social CognitiveTheory (SCT) [124] and the Social Ecologic Framework[125,126] were two of the most commonly referencedtheories, both of which recognize the influence thatthe environment, and the shared environment in par-ticular, has on behavior. A number of instrumentsoriginated from family psychology, using theoriesabout Social Learning Theory [127], Parenting Dimen-sions [128-130], and Domain Specific Parenting [131]to guide development of their instruments. These the-ories generally recognize that parents play a centralrole in the socialization of their children and hencethe behaviors that a child adopts, including eating be-haviors. All of the theories provided useful guidanceto instrument development, and should be consideredin efforts to develop a conceptual model for parentfood practices.
Development and refinement of the item poolIdeally, development and refinement of the item pooluses a systematic approach that involves multiplemethods and allows for multiple iterations. Consultingthe current literature is a good starting point, but lessthan one third of instruments reported reviewing the lit-erature as part of their process. Many instrumentsreported pulling items from existing instruments, but itis unknown how systematically existing instrumentswere reviewed before selecting which instruments anditems to use for the new measure. Development of anew measure should also address gaps in measurement,creating items and scales for constructs not being mea-sured by current instruments. Informed processes areneeded to guide creation of new questions. Qualitativedata (e.g., focus groups and interviews) can provide sucha resource, but less than half of instruments reporteddrawing on such data sources. Once an initial item poolis created, it is also important to evaluate and refine thatitem pool; however, over a third of instruments reportedno details on item refinement. Among those that did,factor analysis was the most common strategy employed.Expert review, cognitive interviews and piloting are im-portant steps for ensuring complete content coverageand inclusion of items that are easily interpreted by thetarget audience. However, very few instruments reportedassessment of content or face validity. The developmentarticle for the Comprehensive Feeding Practices Ques-tionnaire [87] provides a useful example of a thoroughand iterative process combining multiple strategies togenerate and refine an item pool. To create an initialitem pool, these researchers drew items from mostwidely used instruments, adapted items from adult mea-sures where no existing items existed and reviewed theliterature to gather information about additional con-structs. The original item pool was piloted and factoranalysis used to identify constructs needing additionalitems. Then, open-ended questions were given to an-other sample of parents to help generate these additionalitems. Future researchers interested in instrument de-velopment should aim to adopt similar methodologiesand incorporate multiple strategies into their ownplans for developing and refining the item pool fortheir new instruments.
Reliability and validity evidenceWhile almost all instruments received credit forperforming some evaluation of reliability (80%) or valid-ity (86%), there was clear reliance on more statistical ap-proaches using data collected from a single time pointfor supplying such evidence. For reliability, many instru-ments presented only a Cronbach’s alpha. While this pro-vides information on how well items within a scale grouptogether, it does not provide evidence of repeatability.
Vaughn et al. International Journal of Behavioral Nutrition and Physical Activity 2013, 10:61 Page 23 of 27http://www.ijbnpa.org/content/10/1/61
Assessment of test-retest and inter-rater reliability pro-vides this type of evidence, but requires more investmentin data collection. Not surprisingly, few instruments in-cluded these latter types of evaluation. Similarly, mostvalidity evidence came from assessment of construct val-idity. Structural validity and criterion validity requiregreater investment in data collection to administer theinstrument in multiple samples or to collect a gold stand-ard measure. Use of these latter types of validity was lim-ited. A thorough assessment of reliability and validityshould include multiple strategies for each, which willrequire researchers to devote more time to instrumentdevelopment by collecting data across multiple timepoints or in multiple samples or incorporating use of agold standard.
Responsiveness testingThe area of instrument development that clearly needsthe most attention is instrument responsiveness. Re-searchers seeking to evaluate interventions need evidenceregarding the level of change that these instruments areable to detect. This type of information is essential whentrying to calculate power and sample size needed for astudy. While many of these instruments have indeedbeen used in studies to evaluate interventions, respon-siveness testing is almost never reported as part of thedevelopment.
Additional issuesAnother important consideration when selecting an in-strument is its relevance for the target population. Thefeeding relationship changes as children get older, andhence the feeding practices parents employ change aswell. At younger ages, children are more dependent ontheir parents to provide food choices. As they get older,they become more independent and peers are thoughtto exert a greater influence on eating habits [132], whichmay in turn influence the feeding approaches parentsemploy. All of the instruments included in this reviewwere developed for families with children between theages of 2 and 12 years old. Similarly, parent food prac-tices may vary across different cultural groups [44,51].Some practices may appear to be detrimental to healthyeating habits in certain populations, but those samepractices are found to be protective in others. For thisreason, Table 1 describes the population in which eachinstrument was tested.
LimitationsAuthors of this review provided a comprehensive in-ventory and assessment of existing measures of par-ent food practices. However, the current review islimited to instruments developed for families withchildren 2-12 years old. Additional instruments that
were developed for families with adolescent childrenare not included. We limited this review to youngerchildren because the parents and the home environ-ment are the predominant influence on child eatingbehaviors at this age. Similarly, this review is limitedto articles written in English. While it includes instru-ments that were developed in other languages, thereare additional non-English instruments that have un-doubtedly been left out of the current inventory. Theresults focus on presenting the primary developmentarticles for each of the identified instruments; how-ever, many of these instruments have been used inlater studies with different populations. During the re-view process, 244 articles were identified that de-scribed studies in which existing instruments wereused. Some of these may provide additional informa-tion about construct validity (e.g., association withchild diet or weight), but were not included or sum-marized here. However, articles in which there wasclear development work to adapt and evaluate scalesfor new populations are captured in Table 1. Also, noattempt was made to provide an overall quality scoresfor each instrument. To be truly informative, a scor-ing rubric would need to take into account not justattempts to complete the various development steps,but also the appropriateness of tests used, and the sig-nificance of the outcomes across factors measuredwithin an instrument. Such a scoring tool is expectedto be complex and is not yet available at the time ofwriting. Therefore, the authors have summarized thedevelopment work that has been done, the reliabilityand validity evidence reported, and well-accepted cri-teria for assessing those results. Readers are thus ableto judge for themselves the strength of the evidencein light of other factors.
ConclusionsThis review was able to identify 71 different measuresof parent food practices. However, these existing in-struments measure a variety of different constructs.Additionally, the rigor with which they were developedvaried widely. Ideally, instrument development andevaluation are multi-staged processes that require timeand patience. Researchers or practitioners who do nothave the resources to dedicate to instrument develop-ment should be encouraged to look for existing instru-ments that measure the specific constructs needed fortheir study. Future work should focus on further evalu-ation of appropriate instruments where possible. Un-doubtedly, new instruments will need to be developed;however, this future development work should considerthe lessons learned from the current review and to con-sider all stages of development needed to create a validand reliable measure.
Vaughn et al. International Journal of Behavioral Nutrition and Physical Activity 2013, 10:61 Page 24 of 27http://www.ijbnpa.org/content/10/1/61
Additional file
Additional file 1: Search Terms for Diet and Feeding Environment.
Competing interestsThe authors declare that they have no competing interests.
Authors’ contributionsAll authors have made substantial contributions to the design, acquisitionof data, and summarization of findings, and all have been involved inwriting of the manuscript and given final approval of the version to bepublished. AV performed the original search and compiled the database ofarticles. AV, RT and MB reviewed titles and abstracts, and AV and RTapplied inclusion and exclusion criteria to narrow the remaining pool. AV,RT, MB and DW all participated in the review of final articles, developmentof the quality assessment protocol, and use of this protocol to evaluateeach instrument identified. AV summarized results and discussed findingswith RT, MB and DW to develop structure for paper and tables and identifykey messages for the discussion. All authors participated in the writing andediting of the final manuscript.
AcknowledgementsThis paper is part of a projected funded by the National Cancer Institute(R21CA134986). Additional support was received through the National Heart,Lung, and Blood Institute (R01HL091093). The work was done at the UNCCenter for Health Promotion and Disease Prevention, a member of thePrevention Research Centers Program of the Center for Disease Control andPrevention (CDC) (#U48-DP000059). The content is solely the responsibility ofthe authors and does not necessarily represent the official views of the CDC.In addition to these sponsors, we would like to recognize the efforts ofDr. Robert DeVellis who provided feedback and guidance regarding thedevelopment of our quality assessment protocol. We would also like to thankGracey Uffman, a graduate student in the Department of Maternal and ChildHealth at the University of North Carolina at Chapel Hill, for her assistancewith compiled responses for the quality assessment and entering data.
Author details1Center for Health Promotion and Disease Prevention, University of NorthCarolina at Chapel Hill, 1700 Martin L. King Jr. Blvd., CB 7426, Chapel Hill, NC27599-7426, USA. 2Prevention Research Center in St. Louis, Brown School,Washington University in St. Louis, 621 North Skinker Blvd., St. Louis, MO63130-4838, USA. 3Clinical Trials Unit (CTRU), University of Leeds, Leeds LS29JT, UK. 4Department of Nutrition, Gillings School of Global Public Health,University of North Carolina at Chapel Hill, 2207 McGavran-Greenberg Hall,CB 7461, Chapel Hill, NC 27599-7461, USA.
Received: 13 September 2012 Accepted: 8 May 2013Published: 20 May 2013
References1. Maccoby E: The role of parents in the socialization of children: an
historical overview. Dev Psychol 1992, 28(6):1006–1017.2. Patrick H, Nicklas TA: A review of family and social determinants of children's
eating patterns and diet quality. J Am Coll Nutr 2005, 24(2):83–92.3. Pearson N, Biddle SJ, Gorely T: Family correlates of fruit and vegetable
consumption in children and adolescents: a systematic review. PublicHealth Nutr 2008, 12(2):1–17.
4. Blissett J: Relationships between parenting style, feeding style and feedingpractices and fruit and vegetable consumption in early childhood. Appetite2011, 57(3):826–831.
5. Rosenkranz RR, Dzewaltowski DA: Model of the home food environmentpertaining to childhood obesity. Nutr Rev 2008, 66(3):123–140.
6. Hughes SO, Power TG, Orlet Fisher J, Mueller S, Nicklas TA: Revisiting aneglected construct: parenting styles in a child-feeding context. Appetite2005, 44(1):83–92.
7. Pearson N, Biddle SJ, Gorely T: Family correlates of fruit and vegetableconsumption in children and adolescents: a systematic review. PublicHealth Nutr 2009, 12(2):267–283.
8. van der Horst K, Oenema A, Ferreira I, Wendel-Vos W, Giskes K, van Lenthe F,Brug J: A systematic review of environmental correlates of obesity-relateddietary behaviors in youth. Health Educ Res 2007, 22(2):203–226.
9. Rasmussen M, Krolner R, Klepp KI, Lytle L, Brug J, Bere E, Due P:Determinants of fruit and vegetable consumption among children andadolescents: a review of the literature. Part I: Quantitative studies. Int JBehav Nutr Phys Act 2006, 3:22.
10. French SA, Shimotsu ST, Wall M, Gerlach AF: Capturing the spectrum ofhousehold food and beverage purchasing behavior: a review. J Am DietAssoc 2008, 108(12):2051–2058.
11. Bryant M, Stevens J: Measurement of food availability in the home. NutrRev 2006, 64(2 Pt 1):67–76.
12. Swinburn B, Egger G, Raza F: Dissecting obesogenic environments: thedevelopment and application of a framework for identifying and prioritizingenvironmental interventions for obesity. Prev Med 1999, 29(6 Pt 1):563–570.
13. Valderas JM, Ferrer M, Mendivil J, Garin O, Rajmil L, Herdman M, Alonso J:Development of EMPRO: a tool for the standardized assessment ofpatient-reported outcome measures. Value Health 2008, 11(4):700–708.
14. Mokkink LB, Terwee CB, Knol DL, Stratford PW, Alonso J, Patrick DL,Bouter LM, de Vet HC: Protocol of the cosmin study: consensus-basedstandards for the selection of health measurement instruments.BMC Med Res Methodol 2006, 6:2.
15. U.S. Department of Health and Human Services, FDA Center for Drug Evaluationand Research, FDA Center for Biologics Evaluation and Research, FDA Center forDevices and Radiological Health: Guidance for industry: patient-reportedoutcome measures: use in medical product development to supportlabeling claims. Health Qual Life Outcomes 2006, 4:79.
16. Scientific Advisory Committee of the Medical Outcomes Trust: Assessinghealth status and quality of life instruments: Attributes and reviewcriteria. Qual Life Res 2002, 11:193–205.
17. DeVellis R: Scale Development Theory and Applications. 2nd edition.Thousand Oaks: Sage Publications; 2003.
18. Costello AB, Osborne J: Best practices in exploratory factor analysis: fourrecommendations for getting the most from your analysis. PracticalAssessment, Research and Evaluation 2005, 10(7).
19. Landis JR, Koch GG: The measurement of observer agreement for categoricaldata. Biometrics 1977, 33(1):159–174.
20. Hair JF, Anderson RE, Tatham RL, Black WC: Multivariate Data Analysis. 5thedition. New Jersey: Prentice-Hall International, Inc.; 1998.
21. Hu L, Bentler PM: Cutoff criteria for fit indices in covariance structureanalysis: conventional criteria versus new alternatives. Struct Equ Model1999, 6:1–55.
22. Cohen J: Statistical Power Analysis for the Behavioural Sciences. 2nd edition.New Jersey: Lawrence Earlbaum Associates, Inc.; 1988.
23. Jacobson NS, Truax P: Clinical significance: a statistical approach todefining meaningful change in psychotherapy research. J Consult ClinPsychol 1991, 59:12–19.
24. Jensen EW, James SA, Boyce WT, Hartnett SA: The family routines inventory:development and validation. Soc Sci Med 1983, 17(4):201–211.
25. Boyce WT, Jensen EW, James SA, Peacock JL: The family routines inventory:theoretical origins. Soc Sci Med 1983, 17(4):193–200.
26. Stanek K, Abbott D, Cramer S: Diet quality and the eating environment ofpreschool children. J Am Diet Assoc 1990, 90(11):1582–1584.
27. Seagren JS, Terry RD: WIC Female Parents’ Behavior and Attitudes TowardTheir Children’s Food Intake - Relationship to Children's Relative Weight.J Nutr Educ 1991, 23(5):223–230.
28. Sherman JB, Alexander MA, Clark L, Dean A, Welter L: Instruments measuringmaternal factors in obese preschool children. West J Nurs Res 1992,14(5):555–569. discussion 569-575.
29. Davies WH, Ackerman LK, Davies CM, Vannatta K, Noll RB: About YourChild’s Eating: factor structure and psychometric properties of a feedingrelationship measure. Eat Behav 2007, 8(4):457–463.
30. Davies CM, Noll RB, Davies WH, Bukowski WM: Mealtime interactions andfamily relationships of families with children who have cancer in long-termremission and controls. J Am Diet Assoc 1993, 93(7):773–776.
31. Crist W, McDonnell P, Beck M, Gillespie CT, Barrett P, Matthews J: Behaviorat Mealtimes and the Young Child with Cystic Fibrosis. J Dev Behav Pediatr1994, 15(3):157–161.
32. Sallis JF, Broyles SL, Frank-Spohrer G, Berry CC, Davis TB, Nader PR: Child’shome environment in relation to the mother’s adiposity. Int J Obes RelatMetab Disord 1995, 19(3):190–197.
Vaughn et al. International Journal of Behavioral Nutrition and Physical Activity 2013, 10:61 Page 25 of 27http://www.ijbnpa.org/content/10/1/61
33. Koivisto UK, Sjoden PO: Reasons for rejection of food items in Swedishfamilies with children aged 2-17. Appetite 1996, 26(1):89–103.
34. Humphry R, Thigpen-Beck B: Caregiver Role: Ideas about feeding infantsand toddlers. Occup Ther J Res 1997, 17(4):237–263.
35. De Bourdeaudhuij I, Van Oost P: Personal and family determinants ofdietary behavior in adolescents and their parents. Psychol Health 2000,15(6):751–770.
36. De Bourdeaudhuij I, Van Oost P: Family members' influence on decisionmaking about food: differences in perception and relationship withhealthy eating. Am J Health Promot 1998, 13(2):73–81.
37. Golan M, Weizman A: Reliability and validity of the Family Eating andActivity Habits Questionnaire. Eur J Clin Nutr 1998, 52(10):771–777.
38. Golan M, Fainaru M, Weizman A: Role of behaviour modification in thetreatment of childhood obesity with the parents as the exclusive agentsof change. Int J Obes Relat Metab Disord 1998, 22(12):1217–1224.
39. Hupkens CL, Knibbe RA, Van Otterloo AH, Drop MJ: Class differences in thefood rules mothers impose on their children: a cross-national study. SocSci Med 1998, 47(9):1331–1339.
40. Fisher JO, Birch LL: Restricting access to palatable foods affects children’sbehavioral response, food selection, and intake. Am J Clin Nutr 1999,69(6):1264–1272.
41. Carper JL, Orlet Fisher J, Birch LL: Young girls’ emerging dietary restraintand disinhibition are related to parental control in child feeding. Appetite2000, 35(2):121–129.
42. Monnery-Patris S, Rigal N, Chabanet C, Boggio V, Lange C, Cassuto DA,Issanchou S: Parental practices perceived by children using a French versionof the Kids’ Child Feeding Questionnaire. Appetite 2011, 57(1):161–166.
43. Cullen KW, Baranowski T, Rittenberry L, Cosart C, Owens E, Hebert D, Moor C:Socioenvironmental influences on children’s fruit and vegetableconsumption as reported by parents: reliability and validity of measures.Public Health Nutr 2000, 3(3):345–356.
44. Cullen KW, Baranowski T, Owens E, De MC, Rittenberry L, Olvera N,Resnicow K: Ethnic differences in social correlates of diet. Health Educ Res2002, 17(1):7–18.
45. Humenikova L, Gates GE: Social and physical environmental factors andchild overweight in a sample of American and Czech school-agedchildren: a pilot study. J Nutr Educ Behav 2008, 40(4):251–257.
46. Neumark-Sztainer D, Wall M, Perry C, Story M: Correlates of fruit andvegetable intake among adolescents: findings from Project EAT. PrevMed 2003, 37(3):198–208.
47. Neumark-Stzainer D, Story M, Ackard DM, Moe J, Perry C: Family mealsamong adolescents: Findings from a pilot study. J Nutr Educ 2000,32(6):335–340.
48. Neumark-Sztainer D, Wall M, Story M, Fulkerson JA: Are family mealpatterns associated with disordered eating behaviors amongadolescents? J Adolesc Health: 2004, 35(5):350–359.
49. Ross LT, Hill EM: The family unpredictability scale: reliability and validity. JMarriage Fam 2000, 62:549–562.
50. Baughcum AE, Powers SW, Johnson SB, Chamberlin LA, Deeks CM, Jain A,Whitaker RC: Maternal feeding practices and beliefs and their relationships tooverweight in early childhood. J Dev Behav Pediatr 2001, 22(6):391–408.
51. Seth JG, Evans AE, Harris KK, Loyo JJ, Ray TC, Spaulding C, Gottlieb NH:Preschooler feeding practices and beliefs: differences amongSpanish- and English-speaking WIC clients. Fam Community Health 2007,30(3):257–270.
52. Birch LL, Fisher JO, Grimm-Thomas K, Markey CN, Sawyer R, Johnson SL:Confirmatory factor analysis of the Child Feeding Questionnaire: ameasure of parental attitudes, beliefs and practices about child feedingand obesity proneness. Appetite 2001, 36(3):201–210.
53. Johnson SL, Birch LL: Parents’ and children’s adiposity and eating style.Pediatrics 1994, 94(5):653–661.
54. Haycraft EL, Blissett JM: Maternal and paternal controlling feedingpractices: reliability and relationships with BMI. Obesity (Silver Spring) 2008,16(7):1552–1558.
55. Anderson CB, Hughes SO, Fisher JO, Nicklas TA: Cross-cultural equivalenceof feeding beliefs and practices: the psychometric properties of the childfeeding questionnaire among blacks and hispanics. Prev Med 2005,41(2):521–531.
56. Kaur H, Li C, Nazir N, Choi WS, Resnicow K, Birch LL, Ahluwalia JS:Confirmatory factor analysis of the child-feeding questionnaire amongparents of adolescents. Appetite 2006, 47(1):36–45.
57. Boles RE, Nelson TD, Chamberlin LA, Valenzuela JM, Sherman SN, Johnson SL,Powers SW: Confirmatory factor analysis of the child feeding questionnaireamong low-income african american families of preschool children. Appetite2010, 54(2):402–405.
58. Geng G, Zhu Z, Suzuki K, Tanaka T, Ando D, Sato M, Yamagata Z: Confirmatoryfactor analysis of the child feeding questionnaire (CFQ) in japaneseelementary school children. Appetite 2009, 52(1):8–14.
59. Corsini N, Danthiir V, Kettler L, Wilson C: Factor structure and psychometricproperties of the child feeding questionnaire in australian preschoolchildren. Appetite 2008, 51(3):474–481.
60. Kasemsup R, Reicks M: The relationship between maternal child-feedingpractices and overweight in Hmong preschool children. Ethn Dis 2006,16(1):187–193.
61. Cullen KW, Baranowski T, Rittenberry L, Cosart C, Hebert D, de Moor C:Child-reported family and peer influences on fruit, juice and vegetableconsumption: reliability and validity of measures. Health Educ Res 2001,16(2):187–200.
62. Tibbs T, Haire-Joshu D, Schechtman KB, Brownson RC, Nanney MS, Houston C,Auslander W: The relationship between parental modeling, eating patterns,and dietary intake among African-American parents. J Am Diet Assoc 2001,101(5):535–541.
63. Moens E, Braet C: Predictors of disinhibited eating in children with andwithout overweight. Behav Res Ther 2007, 45(6):1357–1368.
64. Tiggemann M, Lowes J: Predictors of maternal control over children’seating behaviour. Appetite 2002, 39(1):1–7.
65. Wardle J, Sanderson S, Guthrie CA, Rapoport L, Plomin R: Parental feedingstyle and the inter-generational transmission of obesity risk. Obes Res2002, 10(6):453–462.
66. Clark HR, Goyder E, Bissell P, Blank L, Walters SJ, Peters J: A pilot survey ofsocio-economic differences in child-feeding behaviours among parentsof primary-school children. Public Health Nutr 2008, 11(10):1030–1036.
67. Sleddens EF, Kremers SP, De Vries NK, Thijs C: Relationship between parentalfeeding styles and eating behaviours of Dutch children aged 6-7. Appetite2010, 54(1):30–36.
68. Bourcier E, Bowen DJ, Meischke H, Moinpour C: Evaluation of strategiesused by family food preparers to influence healthy eating. Appetite 2003,41(3):265–272.
69. Cullen KW, Klesges LM, Sherwood NE, Baranowski T, Beech B, Pratt C, Zhou A,Rochon J: Measurement characteristics of diet-related psychosocialquestionnaires among African-American parents and their 8- to 10-year-olddaughters: results from the Girls’ health Enrichment Multi-site Studies. PrevMed 2004, 38(Suppl):S34–S42.
70. Melgar-Quinonez HR, Kaiser LL: Relationship of child-feeding practices tooverweight in low-income Mexican-American preschool-aged children.J Am Diet Assoc 2004, 104(7):1110–1119.
71. Kaiser LL, Melgar-Quinonez HR, Lamp CL, Johns MC, Harwood JO: Acculturationof Mexican-American mothers influences child feeding strategies. J Am DietAssoc 2001, 101(5):542–547.
72. Vereecken CA, Keukelier E, Maes L: Influence of mother’s educational levelon food parenting practices and food habits of young children. Appetite2004, 43(1):93–103.
73. Vereecken C, Legiest E, De Bourdeaudhuij I, Maes L: Associationsbetween general parenting styles and specific food-related parentingpractices and children's food consumption. Am J Health Promot 2009,23(4):233–240.
74. De Bourdeaudhuij I, Klepp KI, Due P, Rodrigo CP, de Almeida M, Wind M,Krolner R, Sandvik C, Brug J: Reliability and validity of a questionnaire tomeasure personal, social and environmental correlates of fruit andvegetable intake in 10-11-year-old children in five European countries.Public Health Nutr 2005, 8(2):189–200.
75. Horodynski MA, Stommel M: Nutrition education aimed at toddlers: anintervention study. Pediatr Nurs 2005, 31(5):364, 367–372.
76. Hughes SO, Anderson CB, Power TG, Micheli N, Jaramillo S, Nicklas TA:Measuring feeding in low-income African-American and Hispanicparents. Appetite 2006, 46(2):215–223.
77. Hughes SO, Cross MB, Hennessy E, Tovar A, Economos CD, Power TG:Caregiver's Feeding Styles Questionnaire: establishing cutoff points.Appetite 2012, 58(1):393–395.
78. Tripodi A, Daghio MM, Severi S, Ferrari L, Ciardullo AV: Surveillance ofdietary habits and lifestyles among 5-6 year-old children and theirfamilies living in Central-North Italy. Soz Praventivmed 2005, 50(3):134–141.
Vaughn et al. International Journal of Behavioral Nutrition and Physical Activity 2013, 10:61 Page 26 of 27http://www.ijbnpa.org/content/10/1/61
79. Vereecken CA, Van Damme W, Maes L: Measuring attitudes, self-efficacy,and social and environmental influences on fruit and vegetableconsumption of 11- and 12-year-old children: reliability and validity. J AmDiet Assoc 2005, 105(2):257–261.
80. Arredondo EM, Elder JP, Ayala GX, Campbell N, Baquero B, Duerksen S: Isparenting style related to children’s healthy eating and physical activityin Latino families? Health Educ Res 2006, 21(6):862–871.
81. Larios SE, Ayala GX, Arredondo EM, Baquero B, Elder JP: Development andvalidation of a scale to measure Latino parenting strategies related tochildren’s obesigenic behaviors: the parenting strategies for eating andactivity scale (PEAS). Appetite 2008, 52(1):166–172.
82. Ogden J, Reynolds R, Smith A: Expanding the concept of parental control:a role for overt and covert control in children’s snacking behaviour?Appetite 2006, 47(1):100–106.
83. Brown R, Ogden J: Children’s eating attitudes and behaviour: a study ofthe modelling and control theories of parental influence. Health Educ Res2004, 19(3):261–271.
84. Brown KA, Ogden J, Vogele C, Gibson EL: The role of parental control practicesin explaining children’s diet and BMI. Appetite 2008, 50(2–3):252–259.
85. de Moor J, Didden R, Korzilius H: Parent-reported feeding and feedingproblems in a sample of Dutch toddlers. Early Child Dev Care 2007,177(3):219–234.
86. Gray VB, Byrd SH, Cossman JS, Chromiak JA, Cheek W, Jackson G: Parentalattitudes toward child nutrition and weight have a limited relationshipwith child’s weight status. Nutr Res 2007, 27(9):548–558.
87. Musher-Eizenman D, Holub S: Comprehensive Feeding PracticesQuestionnaire: validation of a new measure of parental feedingpractices. J Pediatr Psychol 2007, 32(8):960–972.
88. Melbye EL, Ogaard T, Overby NC: Validation of the comprehensive feedingpractices questionnaire with parents of 10-to-12-year-olds. BMC Med ResMethodol 2011, 11:113.
89. Reinaerts E, de Nooijer J, Candel M, de Vries N: Explaining school children’sfruit and vegetable consumption: the contributions of availability,accessibility, exposure, parental consumption and habit in addition topsychosocial factors. Appetite 2007, 48(2):248–258.
90. Stanton CA, Green SL, Fries EA: Diet-specific social support among ruraladolescents. J Nutr Educ Behav 2007, 39(4):214–218.
91. Vue H, Reicks M: Individual and environmental influences on intake ofcalcium-rich food and beverages by young Hmong adolescent girls.J Nutr Educ Behav 2007, 39(5):264–272.
92. Bryant MJ, Ward DS, Hales D, Vaughn A, Tabak RG, Stevens J: Reliability andvalidity of the Healthy Home Survey: A tool to measure factors withinhomes hypothesized to relate to overweight in children. Int J Behav NutrPhys Act 2008, 5(1):23.
93. Burgess-Champoux TL, Rosen R, Marquart L, Reicks M: The development ofpsychosocial measures for whole-grain intake among children and theirparents. J Am Diet Assoc 2008, 108(4):714–717.
94. Byrd-Bredbenner C, Abbot JM, Cussler E: Mothers of young children clusterinto 4 groups based on psychographic food decision influencers. Nutr Res2008, 28(8):506–516.
95. Faith MS, Storey M, Kral TV, Pietrobelli A: The feeding demands questionnaire:assessment of parental demand cognitions concerning parent-child feedingrelations. J Am Diet Assoc 2008, 108(4):624–630.
96. Fulkerson JA, Story M, Neumark-Sztainer D, Rydell S: Family meals: perceptionsof benefits and challenges among parents of 8- to 10-year-old children. J AmDiet Assoc 2008, 108(4):706–709.
97. Gattshall ML, Shoup JA, Marshall JA, Crane LA, Estabrooks PA: Validation ofa survey instrument to assess home environments for physical activityand healthy eating in overweight children. Int J Behav Nutr Phys Act 2008,5:3.
98. Haerens L, Craeynest M, Deforche B, Maes L, Cardon G, De Bourdeaudhuij I:The contribution of psychosocial and home environmental factors inexplaining eating behaviours in adolescents. Eur J Clin Nutr 2008,62(1):51–59.
99. Haire-Joshu D, Elliott MB, Caito NM, Hessler K, Nanney MS, Hale N, Boehmer TK,Kreuter M, Brownson RC: High 5 for Kids: The impact of a home visitingprogram on fruit and vegetable intake of parents and their preschoolchildren. Prev Med 2008, 47(1):77–82.
100. Kroller K, Warschburger P: Associations between maternal feeding styleand food intake of children with a higher risk for overweight. Appetite2008, 51(1):166–172.
101. Spurrier NJ, Magarey AA, Golley R, Curnow F, Sawyer MG: Relationshipsbetween the home environment and physical activity and dietarypatterns of preschool children: a cross-sectional study. Int J Behav NutrPhys Act 2008, 5(1):31.
102. Hendy HM, Williams KE, Camise TS, Eckman N, Hedemann A: The ParentMealtime Action Scale (PMAS): development and association withchildren's diet and weight. Appetite 2009, 52(2):328–339.
103. Joyce JL, Zimmer-Gembeck MJ: Parent feeding restriction and child weight.The mediating role of child disinhibited eating and the moderating role ofthe parenting context. Appetite 2009, 52(3):726–734.
104. Neumark-Sztainer D, Haines J, Robinson-O’Brien R, Hannan PJ, Robins M,Morris B, Petrich CA: Ready. Set. Action! a theater-based obesityprevention program for children: a feasibility study. Health Educ Res 2009,24(3):407–420.
105. Pearson N, Timperio A, Salmon J, Crawford D, Biddle SJ: Family influenceson children’s physical activity and fruit and vegetable consumption. Int JBehav Nutr Phys Act 2009, 6:34.
106. Corsini N, Wilson C, Kettler L, Danthiir V: Development and preliminaryvalidation of the Toddler Snack Food Feeding Questionnaire. Appetite2010, 54(3):570–578.
107. Dave JM, Evans AE, Pfeiffer KA, Watkins KW, Saunders RP: Correlates ofavailability and accessibility of fruits and vegetables in homes of low-income Hispanic families. Health Educ Res 2010, 25(1):97–108.
108. MacFarlane A, Crawford D, Worsley A: Associations between parentalconcern for adolescent weight and the home food environment anddietary intake. J Nutr Educ Behav 2010, 42(3):152–160.
109. McCurdy K, Gorman KS: Measuring family food environments in diversefamilies with young children. Appetite 2010, 54(3):615–618.
110. O’Connor TM, Hughes SO, Watson KB, Baranowski T, Nicklas TA, Fisher JO,Beltran A, Baranowski JC, Qu H, Shewchuk RM: Parenting practices areassociated with fruit and vegetable consumption in pre-school children.Public Health Nutr 2010, 13(1):91–101.
111. Tremblay L, Rinaldi CM: The prediction of preschool children’s weightfrom family environment factors: gender-linked differences. Eat Behav2010, 11(4):266–275.
112. Zeinstra GG, Koelen MA, Kok FJ, van der Laan N, de Graaf C: Parental child-feeding strategies in relation to Dutch children’s fruit and vegetableintake. Public Health Nutr 2010, 13(6):787–796.
113. Berlin KS, Davies WH, Silverman AH, Rudolph CD: Assessing family-basedfeeding strategies, strengths, and mealtime structure with the FeedingStrategies Questionnaire. J Pediatr Psychol 2011, 36(5):586–595.
114. Byrd-Bredbenner C, Abbot JM, Cussler E: Relationship of social cognitivetheory concepts to mothers’ dietary intake and BMI. Matern Child Nutr2011, 7(3):241–252.
115. McIntosh A, Kubena KS, Tolle G, Dean W, Kim MJ, Jan JS, Anding J:Determinants of children’s use of and time spent in fast-food andfull-service restaurants. J Nutr Educ Behav 2011, 43(3):142–149.
116. Moreno JP, Kelley ML, Landry DN, Paasch V, Terlecki MA, Johnston CA,Foreyt JP: Development and validation of the Family Health BehaviorScale. Int J Pediatr Obes 2011, 6(2-2):e480–e486.
117. Murashima M, Hoerr SL, Hughes SO, Kaplowitz S: Confirmatory factoranalysis of a questionnaire measuring control in parental feedingpractices in mothers of Head Start children. Appetite 2011,56(3):594–601.
118. Murashima M, Hoerr SL, Hughes SO, Kaplowitz SA: Feeding behaviors oflow-income mothers: directive control relates to a lower BMI in children,and a nondirective control relates to a healthier diet in preschoolers.Am J Clin Nutr 2012, 95(5):1031–1037.
119. Stifter CA, Anzman-Frasca S, Birch LL, Voegtline K: Parent use of food tosoothe infant/toddler distress and child weight status. An exploratorystudy. Appetite 2011, 57(3):693–699.
120. Anderson SE, Must A, Curtin C, Bandini LG: Meals in Our Household:reliability and initial validation of a questionnaire to assess child mealtimebehaviors and family mealtime environments. J Acad Nutr Diet 2012,112(2):276–284.
121. Dave JM, Evans AE, Condrasky MD, Williams JE: Parent-reported socialsupport for child’s fruit and vegetable intake: validity of measures. J NutrEduc Behav 2012, 44(2):132–139.
122. Moore LC, Harris CV, Bradlyn AS: Exploring the relationship between parentalconcern and the management of childhood obesity. Matern Child Health J2012, 16(4):902–908.
Vaughn et al. International Journal of Behavioral Nutrition and Physical Activity 2013, 10:61 Page 27 of 27http://www.ijbnpa.org/content/10/1/61
123. Rigal N, Chabanet C, Issanchou S, Monnery-Patris S: Links betweenmaternal feeding practices and children's eating difficulties: validation ofFrench tools. Appetite 2012, 58(2):629–637.
124. Bandura A: Self-Efficacy: the Exercise of Control. New York: W.H. Freemanand Co; 1997.
125. McLeroy KR, Bibeau D, Steckler A, Glanz K: An ecological perspective onhealth promotion programs. Health Educ Q 1988, 15(4):351–377.
126. Stokols D: Establishing and maintaining healthy environments: Toward asocial ecology of health promotion. Am Psychol 1992, 47(1):6–22.
127. Bandura A: Social learning theory. Englewood Cliffs, NJ: Prentice Hall; 1977.128. Baumrind D: Current patterns of parental authority. Dev Psychol
Monograph 1971, 4(1, Part 2):1–103.129. Baumrind D: Rearing competent children. In Child development today and
tomorrow. Edited by Damon W. San Francisco: Jossey-Bass; 1989:349–378.130. Maccoby E, Martin JA: Socialization in the context of the family: Parent-
child interaction. In Socialization, Personality, and Social Development.Volume 4. Edited by Hetherington E. New York: John Wiley; 1983:1–101.
131. Costanzo P, Woody E: Domain-specific parenting styles and their impacton the child’s development of particular deviance: the example ofobesity proneness. J Soc Clin Psych 1985, 3:425–445.
132. Story M, Neumark-Sztainer D, French S: Individual and EnvironmentalInfluences on Adolescent Eating Behaviors. J Am Diet Assoc 2002,102(3):S40–S51.
doi:10.1186/1479-5868-10-61Cite this article as: Vaughn et al.: Measuring parent food practices: asystematic review of existing measures and examination of instruments.International Journal of Behavioral Nutrition and Physical Activity 2013 10:61.
Submit your next manuscript to BioMed Centraland take full advantage of:
• Convenient online submission
• Thorough peer review
• No space constraints or color figure charges
• Immediate publication on acceptance
• Inclusion in PubMed, CAS, Scopus and Google Scholar
• Research which is freely available for redistribution
Submit your manuscript at www.biomedcentral.com/submit