Embed Size (px)
Citation preview
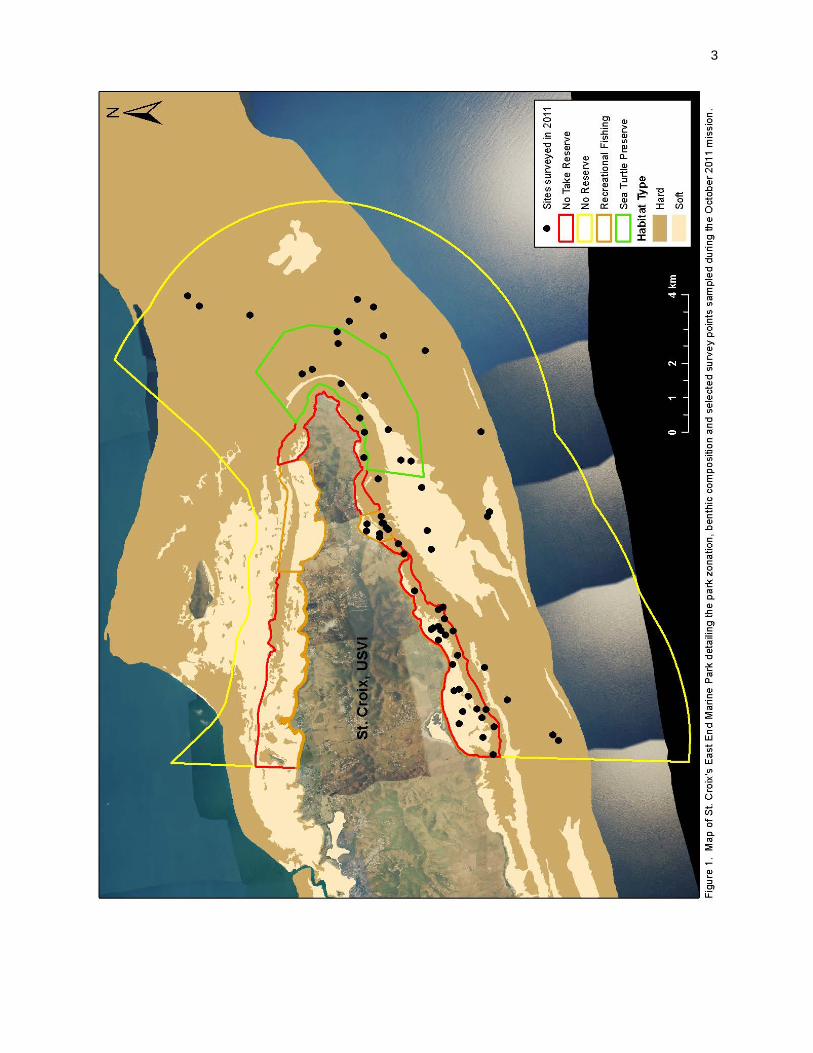
St. Croix, USVI East End Marine Park Mission Report
NOAA/NOS/NCCOS/CCMA/Biogeography Branch
October 31 – November 10, 2010
A cooperative investigation between NOAA’s National Ocean Service, the Virgin Islands Department of Planning and Natural Resources and East
End Marine Park, and The Nature Conservancy
NOAA National Ocean Service
National Centers for Coastal Ocean Science Center for Coastal Monitoring and Assessment
Biogeography Branch Silver Spring, MD 20910
January 2012
Funding provided by NOAA’s CRCP and CCMA, USVI DPNR and TNC
2
St. Croix, USVI Mission Report A cooperative investigation between NOAA’s National Ocean Service, the Virgin Islands Department of
Planning and Natural Resources and East End Marine Park, and The Nature Conservancy
October 31 – November 10, 2011 During this mission data were collected for both the Caribbean Coral Reef Ecosystem Monitoring (CREM) project and a land-sea characterization of the East End Marine Park (EEMP) to determine Marine Protected Area (MPA) efficacy. Mission Purpose: The intent of this field mission was twofold. First, to continue ongoing efforts of the CREM project: (1) to spatially characterize the distribution, abundance and size of both reef fishes and conch, benthic habitat composition, and abundance of Diadema and Caribbean spiny lobster within and around the waters of the EEMP of St. Croix; (2) to correlate this information to in-situ data collected on associated habitat parameters; and (3) to use this information to establish the knowledge base necessary for enacting management decisions in a spatial setting and to establish the efficacy of those management decisions. Second, the sampling region was extended eastward and southward to encompass a more extensive area of the EEMP. The surveys were conducted in partnership with EEMP (VIDPNR), The Nature Conservancy (TNC) and NOAA’s Center for Coastal Fisheries Habitat Research (CCFHR). The purpose of this modification was to collect information on the distribution and diversity of marine communities across the zones in the southern half of EEMP where presently very little information is available. The survey techniques used are compatible with those used for the northern portion of EEMP and neighboring BUIS to facilitate comparative analyses. In water surveys collected data on federally listed Acropora species, Nassau grouper (Epinephelus striatus) and other fauna of special concern (i.e., conch, sea urchins, lobster and the invasive lionfish). Information collected thus far for the on-going CREM project is being extensively utilized by NOAA, NPS, DPNR and others. Examples include NPS’ use of NOAA-produced habitat maps in monitoring efforts; The Ocean Conservancy’s use of maps and fish data in efforts to assist EEMP with zonation designations within the Park; and USGS/University of Miami’s and NOVA Southeastern University’s use of habitat maps for cryptic fish inventories. Information is also used to develop protocols for NPS, detailing how, where, and when to monitor nearshore fish assemblages, and by NOAA Coral Reef Watch to characterize and monitor the spatial extent of coral bleaching and recovery within U.S. Caribbean coral reef ecosystems. The data collected will aid NPS managers in understanding and making informed decisions regarding the resources of the South Florida / Caribbean Network. The data are also available to the public online and have been used by academia, other institutions and various individuals. Operational Accomplishments:
♦ A total of 66 sites were surveyed within the study area (Figure 1), and information on fish distribution, abundance and size (Table 1); benthic habitat composition (Table 2); bleaching; conch, lobster and Diadema abundance and distribution (Table 3); and marine debris (Table 4) was collected. The project team consisted of eight NOAA (seven CCMA, one CCFHR) and 2 TNC scientific divers. NOAA dive logs were maintained.
♦ One TNC and one VIDPNR boat were used for the duration of the mission. The NPS policy of live-boating was implemented to avoid any potential damage to resources from anchor drops and allowed divers to work more efficiently.
♦ The boat captains for the EEMP south side sampling were: Jose Sanchez (VIDPNR), Stopher Slade (TNC) and Chris Biggs (TNC).
♦ TNC and Dive Experience air and Nitrox (32%) tanks were used during this mission. All tanks were filled at Dive Experience.
3
4
Summary of Surveys:
Fish
♦ Fish species abundance, size and distribution were characterized using the belt transect survey method (http://ccma.nos.noaa.gov/ecosystems/coralreef/reef_fish/protocols.html) at all sites. The data are weighted based on area sampled and are summarized in Tables 1. See Appendix A for data calculations.
Table 1. Fish abundance, richness and biomass (all per 100m2). Data are from the October 2011 St. Croix EEMP mission.
Habitat Location
Habitat Strata
Number of # indiv / 100m2 biomass (g)
/100m2 # species / 100m2 Mean Diversity*
Surveys Mean ( + SE) Mean ( + SE) Mean ( + SE) Mean ( + SE)
No-Take
Hard 15 147.8 13.6 4031.03 1287.98 16.8 1.3 2.08 0.10
Soft 14 15.9 4.7 160.66 76.63 3.3 0.7 0.70 0.16
OVERALL 29 84.0 4.7 2157.3 360.7 10.3 0.5 1.41 0.06
Fish-Rec
Hard 5 320.4 201.2 2084.47 627.20 17.2 2.6 1.86 0.38
Soft 4 24.8 10.8 235.63 89.05 4.8 1.5 0.94 0.33
OVERALL 9 147.3 38.3 1001.9 138.3 9.9 1.0 1.32 0.18
Turtle
Hard 5 130.0 6.1 3470.12 1641.67 19.4 0.9 2.20 0.06
Soft 4 89.5 25.4 1349.36 782.92 10.0 1.6 1.58 0.29
OVERALL 9 123.6 5.0 3132.5 1180.5 17.9 0.7 2.10 0.05
None
Hard 14 166.3 16.9 4477.10 789.99 21.8 1.4 2.37 0.07
Soft 5 22.4 6.1 1278.47 784.15 5.4 1.2 1.16 0.30
OVERALL 19 145.2 12.4 4008.2 592.2 19.4 1.0 2.19 0.05
All Zones
Hard 39 161.6 11.5 4316.2 560.6 21.2 0.9 2.33 0.05
Soft 27 28.5 3.1 1016.9 341.4 5.4 0.5 1.10 0.14
OVERALL 66 137.8 7.8 3726.4 389.0 18.4 0.7 2.11 0.03 *Shannon Diversity Index
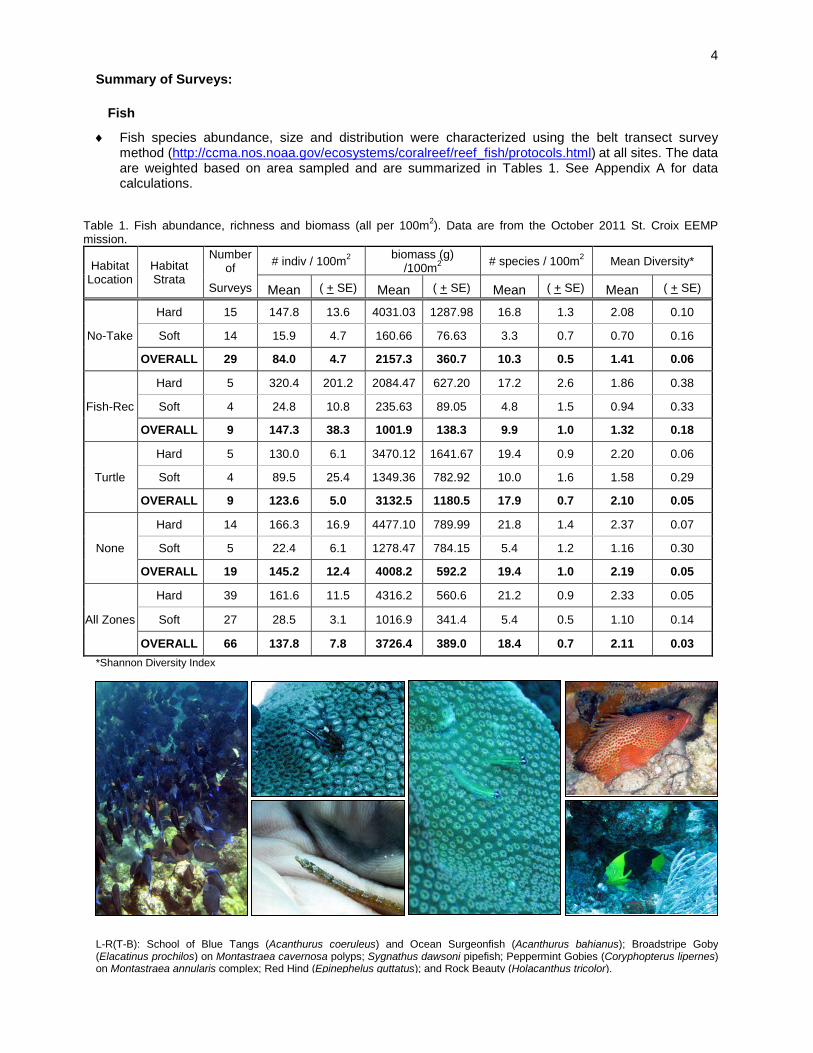
L-R(T-B): School of Blue Tangs (Acanthurus coeruleus) and Ocean Surgeonfish (Acanthurus bahianus); Broadstripe Goby (Elacatinus prochilos) on Montastraea cavernosa polyps; Sygnathus dawsoni pipefish; Peppermint Gobies (Coryphopterus lipernes) on Montastraea annularis complex; Red Hind (Epinephelus guttatus); and Rock Beauty (Holacanthus tricolor).
5
Habitat
♦ Benthic composition data were collected at all sites during the October 2011 mission. Hardbottom data are weighted based on area sampled and are summarized in Tables 2. Detailed methodology can be found at http://ccma.nos.noaa.gov/ecosystems/coralreef/reef_fish/protocols.html. See Appendix A for data calculations.
Table 2. Average percent cover of habitat types for 66 hardbottom sites for October 2011 St. Croix EEMP mission.
Strata Type
# of Surveys
% Coral % Hydrocorals % Algae/ Seagrass
% Turf/ Crustose % Gorgonian % Sponge
Mean (+SE) Mean (+SE) Mean (+SE) Mean (+SE) Mean (+SE) Mean (+SE)
No-Take 15 2.39 0.96 0.08 0.04 16.64 2.71 50.08 6.70 0.17 0.10 0.18 0.07
Fish-Rec 5 3.68 1.00 0.04 0.03 20.78 5.72 63.00 8.76 4.12 1.16 0.10 0.04
Turtle 5 1.36 0.46 0.10 0.06 28.46 4.36 57.09 5.58 1.38 0.73 2.12 0.11
None 14 3.35 1.25 0.14 0.02 29.16 4.82 35.71 5.94 1.30 0.42 2.34 0.33
All zones 39 3.06 2.28 0.13 0.10 28.42 20.11 39.24 25.05 1.27 0.90 2.19 1.61
Macroinvertebrates
Macroinvertebrate data were collected at all 66 sites during the October 2011 St. Croix EEMP mission. Conch
♦ The number of queen conch
(Eustrombas gigas) observed within 16 of the 66 transects surveyed is summarized by location and benthic composition type in Table 3.
Location Habitat # surveys Immature Mature Total
No-take Hard 0 0 0 0 Soft 5 5 2 7
OVERALL 5 5 2 7
Fish-Rec Hard 0 0 0 0 Soft 2 4 2 6
OVERALL 2 4 2 6
Turtle Hard 0 0 0 0 Soft 2 0 2 2
OVERALL 2 0 2 2
None (Open)
Hard 4 3 7 10 Soft 3 0 2 3
OVERALL 7 3 9 13
All zones Hard 4 3 7 10 Soft 12 9 8 18
OVERALL 16 12 15 28
Table 3. Conch abundance surveyed during the St. Croix -EEMP October 2011 mission.
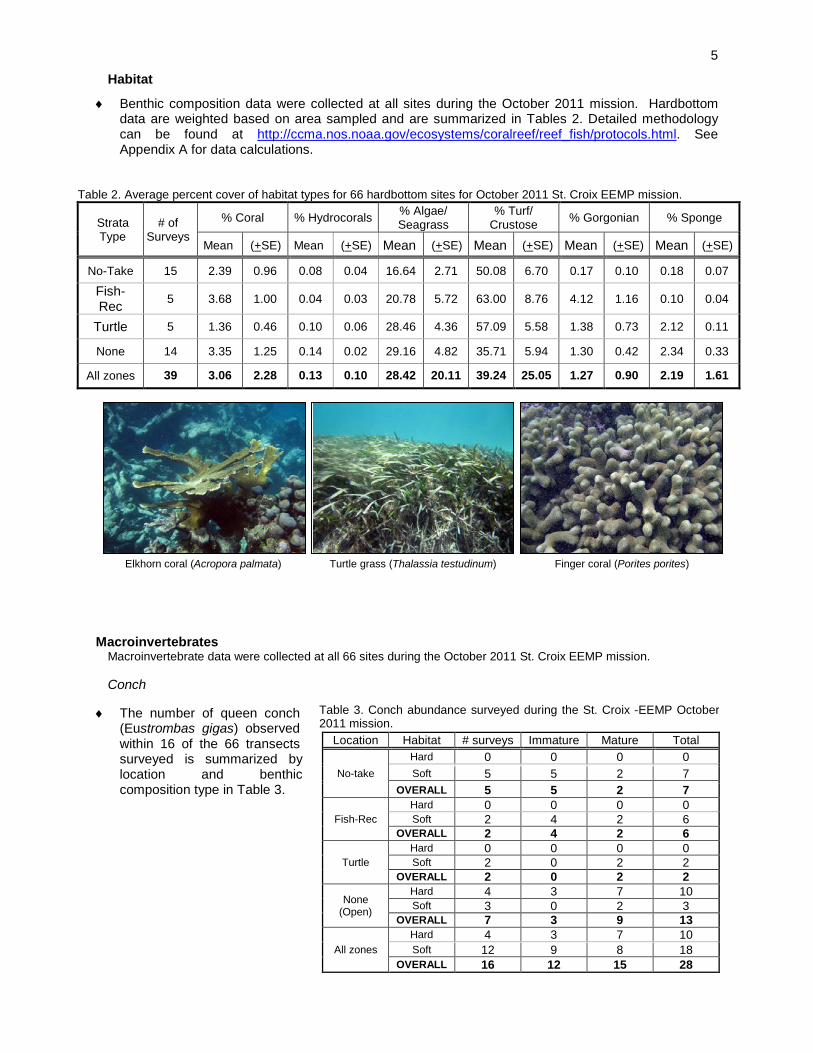
Elkhorn coral (Acropora palmata) Turtle grass (Thalassia testudinum) Finger coral (Porites porites)
6
Lobster ♦ There were 15 Caribbean spiny lobster, Panulirus argus, recorded on 5 of the 66 transects surveyed
during this mission. All of the individuals were recorded on hardbottom habitats within the No-take zone of the EEMP.
Sea urchins
♦ There were 13 long-spined sea urchins, Diadema antillarum, recorded on 5 of the 66 transects surveyed during this mission, all in hardbottom habitats. Eleven individuals were recorded at two stations within the No-take zone, three urchins at two stations within the No Restriction zone and one urchin was recorded at one station within the Fishing-Recreation zone of the EEMP.
Marine Debris
♦ The marine debris observed within transects during this mission are summarized in Table 4. Both pieces of debris were recorded within the No-take zone of EEMP.
Table 4. The type and size of debris, area affected, and what the debris was colonized by during this 2011 St. Croix EEMP mission. Station Habitat
Type Debris Type Debris Area (cm3)
Area Affected (cm3) Colonized By
HR43 Hard rope 40 20 turf, macroalgae, Millepora spp. HR46 Hard glass bottle 120 120 crustose algae, bryozoans
Events of Note:
♦ Very little debris were recorded or observed during this mission.
♦ A shark was seen at one sampling station
♦ Dolphins were seen on occasion, primarily at the surface
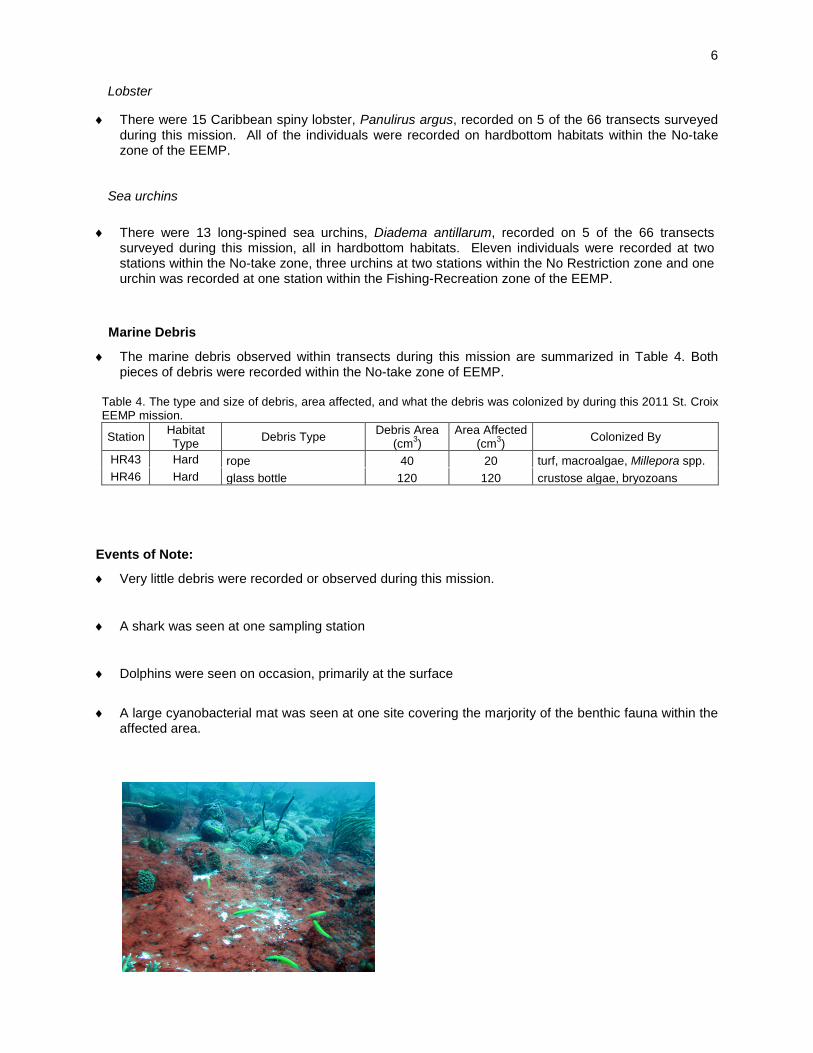
♦ A large cyanobacterial mat was seen at one site covering the marjority of the benthic fauna within the affected area.
7
Logistics of Note:
♦ Thunderstorms and rough seas forced the two dive teams in early one day.
♦ We continued to implement the NPS policy of live-boating during our dive operations.
♦ Commute times for the EEMP South side teams on the EEMP and TNC boats ranged from 45 minutes (calm days) to one and quarter hour (rough days).
♦ TNC divers Stopher Slade and Chris Biggs dove as observational divers as time and conditions permitted.
♦ Overall, seas were calm with water temperatures reported from 82°-85° at depth.
Mission Participants: Laurie Bauer (NOAA/CCMA BB) Bryan Costa (NOAA/CCMA BB) Kimberly Edwards (NOAA/CCMA BB) Matt Kendall (NOAA/CCMA BB) Kemit-Amon Lewis (TNC) Stopher Slade (TNC-Boat Captain)
Jenny Vanderpluym (NCCOS/CCFHR) Randy Clark (NCCOS/CCMA BB) Chris Biggs (TNC-Boat Captain) Mark Monaco (NCCOS/CCMA BB) Kimberly Roberson-UDS (NOAA/CCMA BB) Jose Sanchez (VIDPNR/EEMP –Boat Captain)
Roger Mays-UDS (NOAA/CCFHR)
8
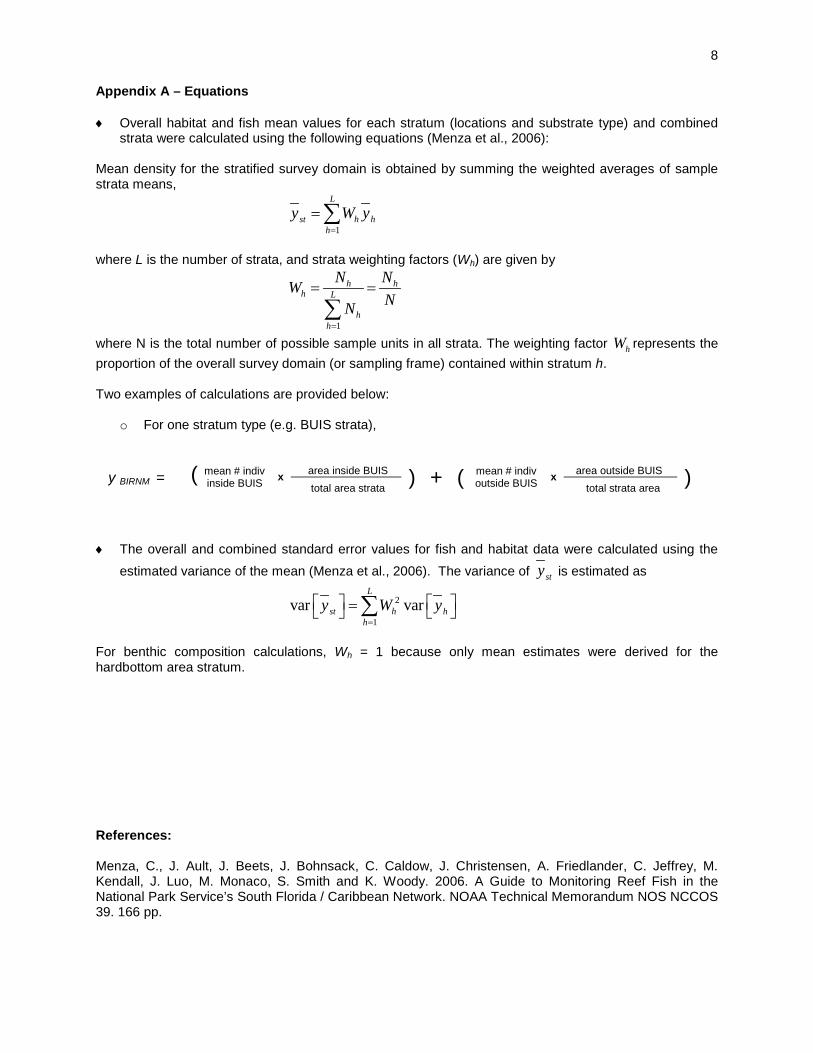
Appendix A – Equations ♦ Overall habitat and fish mean values for each stratum (locations and substrate type) and combined
strata were calculated using the following equations (Menza et al., 2006): Mean density for the stratified survey domain is obtained by summing the weighted averages of sample strata means,
1
L
hst hh
y W y=
=∑
where L is the number of strata, and strata weighting factors (Wh) are given by
1
h hh L
hh
N NWNN
=
= =
∑
where N is the total number of possible sample units in all strata. The weighting factor hW represents the proportion of the overall survey domain (or sampling frame) contained within stratum h. Two examples of calculations are provided below:
o For one stratum type (e.g. BUIS strata),
( mean # indiv inside BUIS x area inside BUIS ) + ( mean # indiv
outside BUIS x area outside BUIS ) total area strata total strata area
♦ The overall and combined standard error values for fish and habitat data were calculated using the
estimated variance of the mean (Menza et al., 2006). The variance of sty is estimated as
2
1var var
L
hst hh
y W y=
= ∑
For benthic composition calculations, Wh = 1 because only mean estimates were derived for the hardbottom area stratum. References: Menza, C., J. Ault, J. Beets, J. Bohnsack, C. Caldow, J. Christensen, A. Friedlander, C. Jeffrey, M. Kendall, J. Luo, M. Monaco, S. Smith and K. Woody. 2006. A Guide to Monitoring Reef Fish in the National Park Service’s South Florida / Caribbean Network. NOAA Technical Memorandum NOS NCCOS 39. 166 pp.
y BIRNM =