Embed Size (px)
Citation preview
DIABETES ALTERS THE OCCUPANCY OF THE HEPATIC HMG-COA REDUCTASE PROMOTER
William R. Lagor, Eric D. de Groh, and Gene C. Ness Department of Biochemistry and Molecular Biology,
University of South Florida, College of Medicine
Send correspondence to: Dr. Gene C. Ness, Department of Biochemistry and Molecular Biology, College of Medicine, University of South Florida, 12901 Bruce B. Downs Blvd., Tampa, FL 33612. E-mail: [email protected] Telephone: 813-974-9596. Fax 813-974-5798
Hepatic HMG-CoA reductase1
(HMGR) protein and mRNA are substantially decreased in diabetic animals and rapidly restored by administration of insulin. To begin to examine the underlying molecular mechanisms, measurements of transcription by nuclear run-on assays and an investigation of occupancy of the promoter were performed. The rate of transcription was substantially reduced in the diabetic rats, and fully restored within two hours after insulin treatment. In vivofootprinting revealed several areas of protein binding as shown by dimethyl sulfate protection or enhancement. The CRE was heavily protected in all conditions- including diabetes, feeding of dietary cholesterol, or statin treatment. Striking enhancements in footprints from diabetic animals were visible at -142 and at -161 (in the SRE). Protections at a newly identified NF-Y site at -70/-71 were observed in normal animals, and not in diabetics. This NF-Y site was found to be required for efficient HMGR transcription in luciferase assays. CREB-1 was able to bind the HMGR CRE in vitro, and to the promoter in vivo. This evidence supports an essential role for CREB in transcription of hepatic HMGR, and identifies at least two sites where in vivo occupancy is regulated by insulin.
INTRODUCTION
Type I diabetes is associated with lower rates of cholesterol synthesis and
increased absorption of dietary cholesterol in humans (1). These individuals are at high risk for the development of cardiovascular disease (2), and have higher total serum cholesterol levels. In rats, streptozotocin-induced diabetes also renders animals particularly susceptible to a dietary cholesterol insult (3). For reasons that are still unclear, this sensitivity correlates well with decreased expression of hepatic HMG-CoA reductase (4), the enzyme that catalyzes the rate-limiting reaction in cholesterol biosynthesis.
Hepatic HMG-CoA reductase is responsible for the majority of the body’s regulatable cholesterol synthesis. The expression of this enzyme is affected by cholesterol, insulin, thyroid hormone, bile acids, fasting and refeeding, and also varies diurnally (5). HMG-CoA reductase (HMGR) protein and mRNA levels are both decreased in diabetic animals, and can be rapidly restored with insulin treatment (6), suggesting regulation at the transcriptional level. Previous experiments in H4IIE cells (rat hepatoma), showed that the proximal reductase promoter could be activated by insulin (7), at levels greater than or equal to those seen in live animals. Questions remain as to whether this mode of insulin activation mirrors the physiological regulation of the gene.
The hamster HMG-CoA reductase gene requires about 300 base pairs of sequence upstream of the transcription start site for high level expression (8). This proximal promoter was found to contain sequences sufficient for
1
JBC Papers in Press. Published on August 26, 2005 as Manuscript M504346200
Copyright 2005 by The American Society for Biochemistry and Molecular Biology, Inc.
by guest on April 4, 2019
http://ww
w.jbc.org/
Dow
nloaded from
sterol regulation in cultured cells (9) and shares about 90% sequence identity with the rat promoter (10, Genbank S78687). The HMGR promoter contains a sterol-response element (SRE) that can be activated by SREBP-1 and SREBP-2 in cultured cells, and in transgenic mice overexpressing these proteins (11, 12, 13). Although SREBP-1c appears to be insulin-responsive at the mRNA level, recent evidence suggests this factor is more closely tied to lipogenesis than cholesterol biosynthesis (14-16). SREBP-2 is a potent activator of the HMG-CoA reductase gene, but insulin regulation of this protein has not been reported. There are several other important elements in the HMG-CoA reductase promoter. These include possible binding sites for Sp1, and NF-Y, as well as a functional cyclic AMP response element (CRE) (10). The CRE in particular, was shown to be required for insulin-activation of the HMGR promoter in rat hepatoma cells (7).
Because of the problems inherent in a cell culture model, especially for a gene that is sterol-sensitive, we decided to perform in vivofootprinting in rat liver. This approach allows for a complete unbiased survey of the HMGR promoter. Performing this technique in animals ensures that the footprint reflects physiological regulation of the gene, in the context of the many nutritional and hormonal stimuli that the liver receives. In vivofootprinting has been used successfully to map where transcription factors are bound to DNA in vivo (17, 18). Previous in vitro footprinting studies of the HMGR promoter were successful in identifying sterol-responsive elements (19). The only previous in vivofootprints of this promoter failed to detect changes in occupancy in response to insulin in HepG2 cells, although a 1.5 fold increase in mRNA was observed (20). In this report we show that diabetes alters the occupancy of the HMG-CoA reductase promoter in live animals.
MATERIALS AND METHODS
Animal care and treatment: Male Sprague Dawley rats 125-150 g (Harlan) were allowed
free access to Harlan Teklad 22/5 rodent chow and water. Animals were kept on a reverse cycle lighting system, and sacrificed at 9:00-10:00 a.m., when HMG-CoA reductase expression is at its diurnal high. Animals were rendered diabetic by a single subcutaneous injection of streptozotocin (Sigma), 65 mg/kg. Diabetes was verified by the presence of urinary glucose using Clinistix from Bayer. Where indicated, animals were injected subcutaneously with 3.0 units/100 g of recombinant human insulin (Novolin 70/30, Novo Nordisk) 2 hours prior to sacrifice.
Nuclei isolation: Nuclei were prepared as previously described by centrifugation through dense sucrose (21).
Nuclear run-on assay: Nuclear run-on assays were carried out essentially as previously described (22). After centrifugation, nuclei from 2 g of liver were resuspended in 100 μl of PBS with 3 mM MgCl2 . Next, 100 μl of 2x run-on buffer (160 mM Tris pH 7.5, 20 mM MgCl2, 2 mg/ml heparin, 1% sarkosyl, 0.7 M ammonium sulfate, 0.8 mM each of ATP, GTP, UTP) and 250 μCi of -32P-CTP were added to each reaction. Samples were incubated at 37ºC to continue extension of RNA transcripts. Samples were then treated with 50 units DNase I, 40 μg proteinase K, and lysed with the addition of 50 μl of 10% SDS and 25 μl of 0.2 M EDTA. After extraction and precipitation, equal counts of 32P-labeled RNA were added to each membrane- approximately 5 x 10⁶ dpm. These membranes were previously spotted with 5 μg of cDNA encoding HMG-CoA reductase, catalase, or the bluescript vector. Hybridizations were performed overnight at 57ºC. The next day membranes were washed with 2x SSC, 0.1% SDS at room temperature for 1 minute, then 0.2x SSC, 0.1% SDS at 60ºC for 30 minutes, followed by 2x SSC containing 250 μg of RNAse A at 37ºC for 30 minutes. Membranes were given a quick final rinse in 2x SSC and dried, followed by exposure to autoradiography film with an enhancing screen at -70ºC for 1-5 days.
2
by guest on April 4, 2019
http://ww
w.jbc.org/
Dow
nloaded from
Sequencing: The rat HMG-CoA reductase promoter was obtained by PCR of rat liver genomic DNA, using primers to the previously published sequence (10). PCR products were sequenced by Retrogen (San Diego).
In vivo footprinting of rat liver: Rat liver (2.2g) was minced in 8 ml of ice cold PBS. Liver pieces were homogenized 4-5 times on a drill press with a Teflon pestle in a glass vessel. A 5 ml portion of filtered homogenate was placed in a 50 ml polypropylene centrifuge tube. Each filtered homogenate was treated with 5 μl of dimethyl sulfate for 2 minutes at room temperature. The DMS reaction was slowed by rapid dilution with 40 ml of ice cold PBS. Tubes were centrifuged at 1000 g for 5 minutes at 4ºC. Pellets were resuspended in 20 ml of PBS and washed again. The pellet was then resuspended in 15 ml of lysis buffer (60 mM Tris pH 7.5, 100 mM EDTA, 0.5% SDS and 100 μg/ml proteinase K). Samples were rocked gently at room temperature for 3 hours to completely lyse nuclei. Genomic DNA isolation and piperidine treatment were performed as described previously (17). Roughly 200-300 μg of DNA was obtained per sample.
Ligation-Mediated PCR: Ligation-mediated PCR was performed according to the original method (17). The primers corresponding to the coding (top) strand of the HMGR promoter starting at -185 were as follows: 1, 5 ’CAA TAG GAA GGC CGC GAT GC-3’; 2, 5’-ATG CTG GGA CCC GAC TAG CCA TTG-3’ ; 3, 5’-ATG CTG GGA CCC GAC TAG CCA TTG GTT G-3’. The primers to reveal the template (bottom) strand starting at -58 were as follows: 1, 5’-CGG AAG GAA CTG CGC TTA CG-3’; 2, 5’-AAC CGG CCG CCA ATA AGG AAG GAT C-3’; 3, 5’-CGG CCG CCA ATA AGG AAG GAT CGT CCG ATC-3’. The following annealing temperatures were used for both primer sets: 58°C, 63°C and 68°C. All primers were ordered PAGE-purifed from Integrated DNA Technologies. Products were resolved on a 6% polyacrylamide wedge gel with 7.75 M urea. Each PCR reaction used 6-9 μg of DNA.
Nuclear extract: Nuclei isolated from 2 g rat liver were resuspended in 1 ml of PBS containing 3 mM MgCl2, and centrifuged at 3000 g for 5 minutes at 4°C. Nuclear pellets were resuspended in 0.5 to 1.0 ml high salt buffer (420 mM NaCl, 20 mM HEPES pH 7.9, 1 mM EDTA, 1 mM EGTA, 20% glycerol, 20 mM NaF, 1 mM Na3VO4, 1 mM Na4P2O7, 1 mM DTT, 0.5 mM PMSF, 1x protease inhibitor cocktail [Sigma]). Nuclei were lysed by rotating slowly at 4°C for 30 minutes. The lysates were then centrifuged at 15,700 g for 15 minutes to pellet nuclear debris. The supernatant (nuclear extract) was collected and stored at -70°C until needed. Protein concentrations were determined using the BCA assay (Pierce).
EMSA: Electrophoretic mobility shift assays were performed as previously described (23). Briefly, probes corresponding to the HMG-CoA reductase promoter footprinted regions were generated by annealing two complementary oligonucleotides (IDT) The sequences are as follows: (-59/-82) 5’-CAG CCT CCC GCC GAT TGG CTA GGG-3’, and 5’-CTG ACC CTA GCC AAT CGG CGG GAG GCT G-3’ ; (-115/-85) 5’GCG ACC GTT CGT GAC GTA GGC CGT CAG GCT-3’, 5’-AGC CTG ACG GCC TAC GTC ACG AAA CGG T-3’; (-119/-142) 5-GGG TGC GAG CAG TGG GCG GTT GTT-3’, 5’-CTG AAA CAA CCG CCC ACT GCT CGC ACC C-3’; (-129/-152) 5’-TTC TCC GCC CGG GTG CGA GCA GTG-3’, 5’-CTG ACA CTG CTC GCA CCC GGG CGG AGA A-3’. One pmol of probe was labeled by the Klenow fill in reaction using 20 μCi of 32P-dCTP, along with cold 0.125 mM dATP, dGTP, and dTTP. Each probe (25 fmol) was incubated with 10 μg of rat liver nuclear extract in a binding buffer (10 mM HEPES pH 7.9, 25 mM KCl, 0.5 mM EDTA, 50 μg/ml poly dI:dC, 5% glycerol, 0.5 mM DTT, 125 μg/ml BSA) for 20 minutes at room temperature. One to two μg of the following antisera were added to the binding reactions: NF-Y (sc-7711x), NF-Y (sc-13045x), NF-1 (sc-870), CREB-1 (sc-187x), Sp1 (sc-59x), Sp1 (sc-420x) from Santa Cruz Biotechnology. Binding reactions were run on a 6% polyacrylamide gel in 0.25x TBE.
3
by guest on April 4, 2019
http://ww
w.jbc.org/
Dow
nloaded from
Chromatin preparation from rat liver: Rat liver (2.2 g) was placed in a beaker containing 10 ml of ice-cold PBS. The liver was minced into small pieces and diluted with an equal volume of 2% formaldehyde in PBS followed by a 10 minute incubation at room temperature. Formaldehyde cross-linking was stopped by the addition of 2 ml of 1.25 M glycine. Liver pieces were washed 3 times with 10 ml of ice-cold PBS. Samples were then homogenized in 12 ml of nuclei isolation buffer + Triton X-100 using a Teflon-glass homogenizer in a drill press. Nuclei were isolated by centrifugation through dense sucrose. Nuclei were resuspended in 1-2 ml of PBS containing 3 mM MgCl2 and centrifuged at 3,000 g, for 5 minutes in 1.5 ml tubes. The nuclear pellet occupied about 50 μl volume and was white in color. Nuclei were then resuspended in 1 ml of nuclei lysis buffer (50 mM Tris pH 8.1, 10 mM EDTA, 1% SDS, 1μg/ml leupeptin, 1μg/ml aprotinin, and 0.1 μM PMSF). Sonication was accomplished with a Heat Systems-Ultrasonics W375 sonicater with a microtip. Ten 10-second bursts at a power setting of 4, 40% duty cycle, were sufficient to shear chromatin to an average size of 200-600 bp. Shearing of chromatin was checked by electrophoresis on a 3% agarose gel. Chromatin concentrations were equalized to 0.3 mg/ml by A260 and stored at -70ºC until needed.
Chromatin Immunoprecipitation assays:Chromatin immunoprecipitations were performed essentially as previously described (24). Briefly, chromatin suspensions were diluted 1:10 and pre-cleared with ssDNA/Protein A agarose beads (Upstate). Each immunoprecipitation reaction received 15 μg of chromatin and 5 μg of the appropriate antibody: USF-2 (sc-862), CREB-1 (sc-187x), phospho-CREB (sc7978r). All antibodies were polyclonal rabbit IgG from Santa Cruz. PCR was performed using the following primers (25): HMG-CoA reductase promoter- left 5’-CAA TAG GAA GGC CGC GAT GC-3’, right 5’-CGG AAG GAA CTG CGC TTA CG-3’ (58ºC); HMG-CoA reductase Exon 12- left 5’-GGC GGT CAG
TGG TAA CTA TT-3’, right 5’ GCA GAG CCC ACA AGA TTC TT-3’ (57ºC).
Plasmid Construction: A PCR product from rat genomic DNA containing the HMG-CoA reductase promoter from -325 to +70 was cloned into the PGL3 basic vector (Promega) using standard molecular biology techniques. Briefly, the 5’ primer was designed to possess an overhang to introduce an MluI site by PCR, and the 3’ overhang added an XhoI site. The resulting PCR product was digested and cloned into the pGL3 basic backbone. Mutant HMGR promoter-luciferase plasmids were generated using the Quik Change kit from Stratagene. Both mutants were verified by sequencing at the core sequencing facility at the Moffitt Cancer Center, University of South Florida, Tampa, FL. pRL-TK, a vector containing the Renilla luciferase gene driven by the thymidine kinase promoter was from Promega. (Primer sequences are available upon request.)
Cell Culture: H4IIE cells (rat hepatoma), were purchased from the American Type Culture Collection. Cells were grown in Eagle’s Modified Essential Media (EMEM) supplemented with 10% fetal bovine serum, 100 units of penicillin/streptomycin per mL, and 1 mM sodium pyruvate. Cells were kept at 37°C and 5% CO2 in a humidified incubator.
Transient transfections: H4IIE cells were plated to an initial density of 100,000 cells per well in 24 well plates the day before the experiment. The following day, the media was removed and the cells were washed one time with PBS. Cells were transfected with 1 μg of DNA/ well using Promega’s Transfast reagent in the recommended 2:1 ratio. Cells were co-transfected with reporter construct and pRL-TK in a 4:1 ratio. One hour after transfection, the 200 μl of transfection mix in each well was diluted with 800 μl of growth media. 12-16 hours later, cells were harvested in 100 μl of passive lysis buffer and assayed for luciferase activity using the Dual Luciferase Assay Kit (Promega). Data are shown as the average ratio of firefly to Renilla luciferase counts +/- standard deviation of the mean. At least six
4
by guest on April 4, 2019
http://ww
w.jbc.org/
Dow
nloaded from
independent yet identical transfections were performed per condition. All plasmid concentrations were checked by A260 prior to transfection.
RESULTS
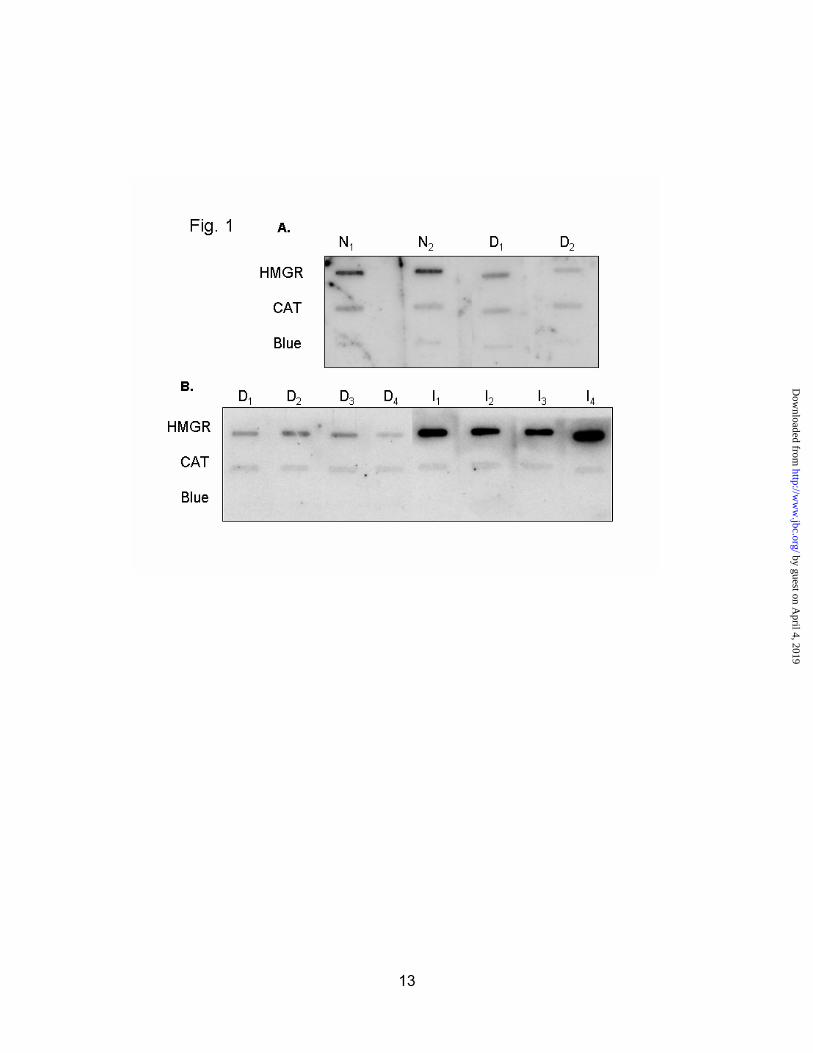
Nuclear run-on assays were performed to determine if insulin acts to increase transcription of the HMG-CoA reductase gene. Inbred male Sprague-Dawley rats were injected with streptozotocin (65 mg/kg) to induce diabetes. Animals were sacrificed during the third hour of the dark cycle, at the diurnal high for hepatic HMG-CoA reductase expression. Nuclei were isolated from the livers of these animals, and nuclear run-on assays were performed as described in the methods section. HMG-CoA reductase transcription was greatly diminished in the diabetic animals (Fig. 1A). It was also found that administration of insulin to diabetic animals restored HMG-CoA reductase transcription to normal in just two hours (Fig. 1B).
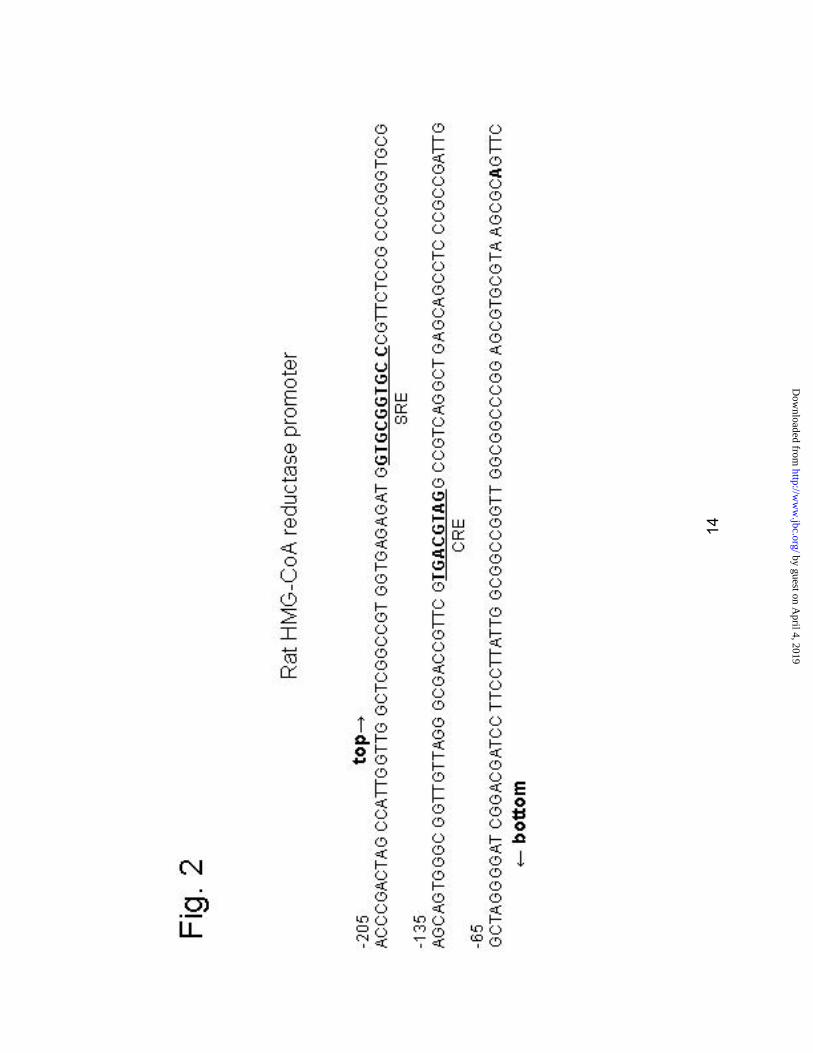
We next carried out in vivofootprinting to examine the occupancy of the hepatic HMGR promoter. Livers from normal and diabetic animals were treated with dimethyl sulfate and subjected to footprinting by ligation-mediated PCR. A primer set designed to reveal the top strand begins by reading cytosines at -185. Another primer set reveals the bottom strand by reading guanines beginning at -58. It should be noted that these primers were designed against the rat HMGR promoter sequence, which varies slightly (about 10 bp) from the hamster (10). Our primers were designed against sequence from the inbred Sprague-Dawley rats used in our experiments. Minor differences from the published rat sequence included an extra G at -15 and a reversal of the CG at -3,-4. Numbering is therefore -1 bp relative to the previously published sequence, based on the transcription start site (Fig. 2).
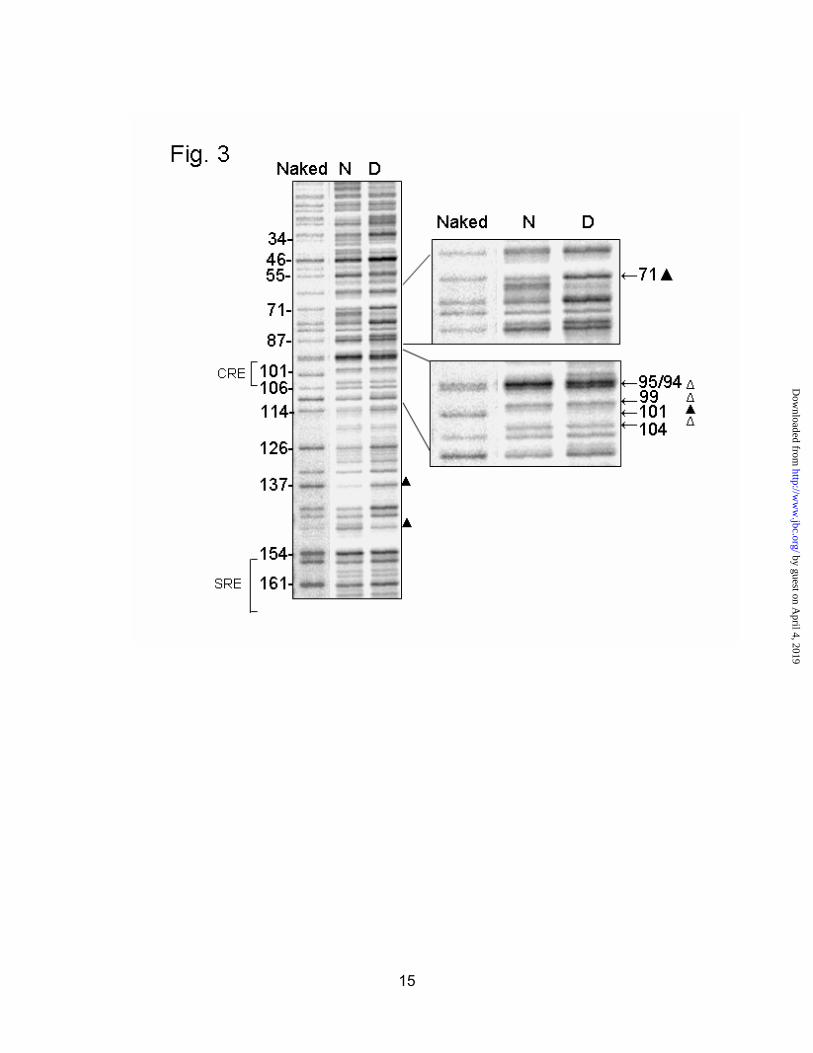
On the top strand, several areas of DMS protection or enhancement were detected (Fig. 3). The “naked” lane refers to
DNA that was first extracted and purified, and then treated with DMS in vitro. This lane is a control that shows all the reactive G residues in the sequence. Bands that are absent or reduced in intensity in the in vivo samples (lanes N and D) represent protections where protein binding shields the DNA from dimethyl sulfate attack. Bands that are significantly darker in the in vivo samples, or new bands that appear in these lanes, are known as enhancements. Enhanced DMS reactivity is indicative of protein binding in the nearby area, although generally not on that particular residue. Protections are noted with a filled triangle ( ), while enhancements are marked with an open triangle ( ). In both normal and diabetic samples, the CRE was completely protected at -101, and showed enhanced DMS reactivity at -104, -99 and -95/-94 (Fig. 3, inset). This pattern was seen in all animals regardless of treatment. A significant protection seen only in normal animals occurred at -71, as shown in the inset. Protections at -137 and -147 were not consistently observed.
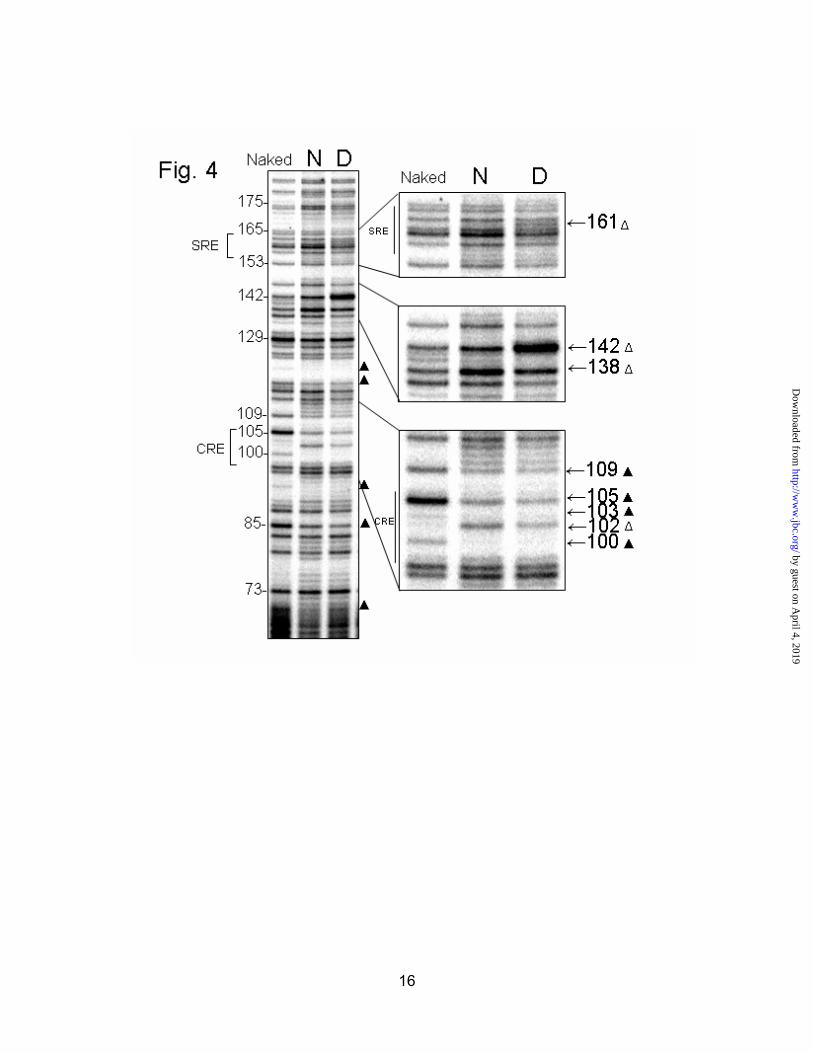
On the bottom strand, the CRE is heavily protected at -100, -105, -103 and -109 (Fig. 4, bottom inset) in both normal and diabetic animals. The A at -102 showed up as an enhancement in both cases. A key difference in the footprints is a very obvious enhancement at -142 seen only in the diabetic samples (Fig. 4, middle inset). This particularly dark band, indicating enhanced DMS reactivity, was seen in 4/5 diabetic footprints and 0/5 normal footprints. Conversely, the nearby enhancement at -138 of the normal lane was not seen in diabetic footprints, suggesting possible competition for a binding site in this region. Another obvious difference is an enhancement at -161 in the diabetic lane (Fig. 4, top inset). This residue is in the middle of the sterol response element (SRE) located between -164 and -155. The SRE appears unoccupied under normal conditions, and enhanced in diabetic samples (4/5 animals). Protections at -189/-190 were seen in all groups, while those at -70 were not observed in the diabetics. Both of these areas
5
by guest on April 4, 2019
http://ww
w.jbc.org/
Dow
nloaded from
contain potential NF-Y binding sites, with the sequence ATTGG.
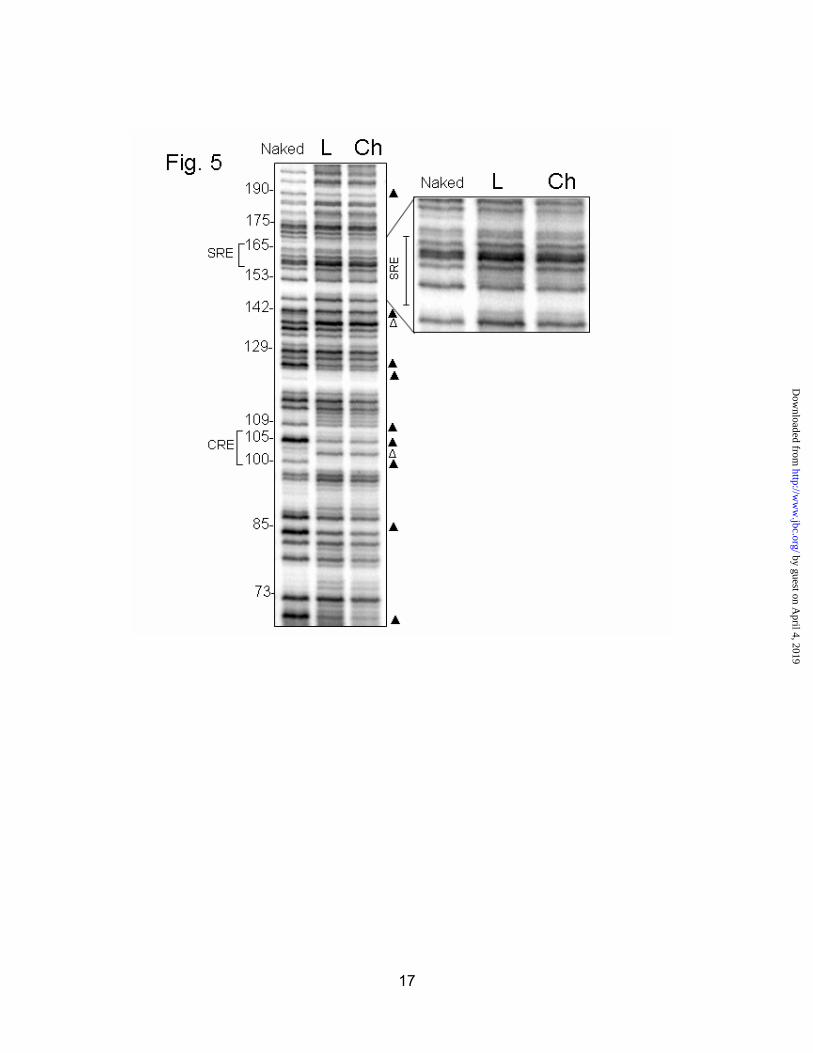
Since there was an enhancement at -161 of the SRE in four of the five diabetic animals, we wondered if insulin activation could be a result of sterol regulation through the SRE. To investigate this possibility, we examined livers of rats fed lovastatin or cholesterol to alter liver cholesterol levels. Animals were fed 0.02% lovastatin or 1% cholesterol for five days. Previous research in our lab has shown that a similar dose of lovastatin elevates HMGR transcription 4-6 fold (22); while dietary cholesterol reduces HMGR protein levels to about 1% of control. It should be noted that dietary cholesterol has only a minor repressive effect on the rate of HMGR transcription in these animals (26). We predicted that the lovastatin-fed animals would show strong protections at the SRE, because of elevated cleavage of SREBPs, induced by sterol deprivation. Curiously, no definitive protections or enhancements at the SRE were visible when animals were fed either lovastatin or cholesterol (Fig. 5, inset). The footprints were the same for the two animals in each group. The CRE was also heavily protected in these animals, but unchanged by either treatment. The enhancement at -138 seen in normal animals was also seen in both lovastatin and cholesterol-fed rats. The enhancement at -142 seen in diabetics was noticeably absent from these animals. In addition, the NF-Y sites at -189/-190 and -70 are readily visible in this footprint, and protected in both cases. A summary of the major differences between normal and diabetic footprints is presented in Fig. 6.
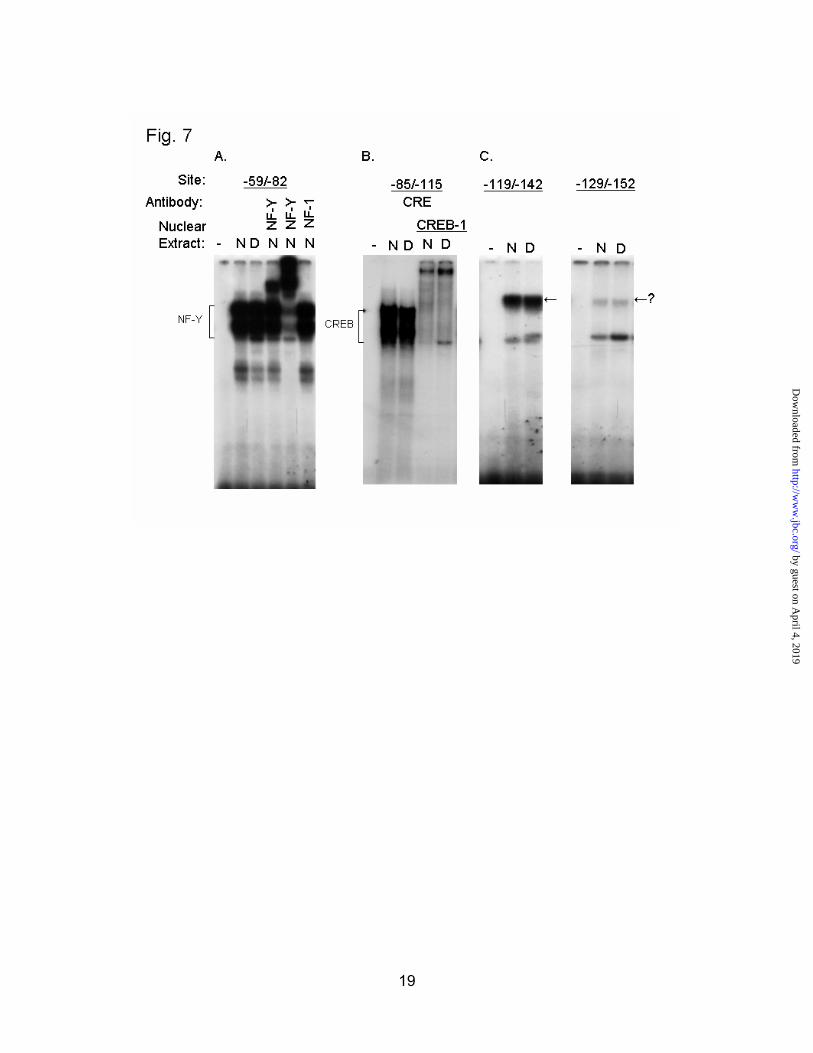
In order to identify some of the major factors bound to footprinted regions, we performed EMSAs with short oligonucleotide probes for these elements. Nuclear extracts prepared from normal and diabetic rats were used in this assay. Using the probe from -59 to -82, we observed strong binding that could be super-shifted with two different NF-Y antisera, but not with antisera to NF-1, an unrelated protein (Fig. 7a). This confirms the presence
of another NF-Y binding site in the HMGR promoter, in addition to the one previously described upstream of the SRE (9). NF-Y binding did not change in liver nuclear extracts, despite a marked difference in occupancy of this site in vivo (Fig. 6). A probe corresponding to the CRE was able to bind CREB-1 from normal and diabetic nuclear extracts (Fig. 7b). Overall binding to the CRE was not different between normal and diabetic extracts, as expected from the footprinting. Probes for the -119/-142 and -129/-152 regions showed strong binding of an unknown factor, whose in vitro binding ability was unaffected by diabetes (Fig. 7c)
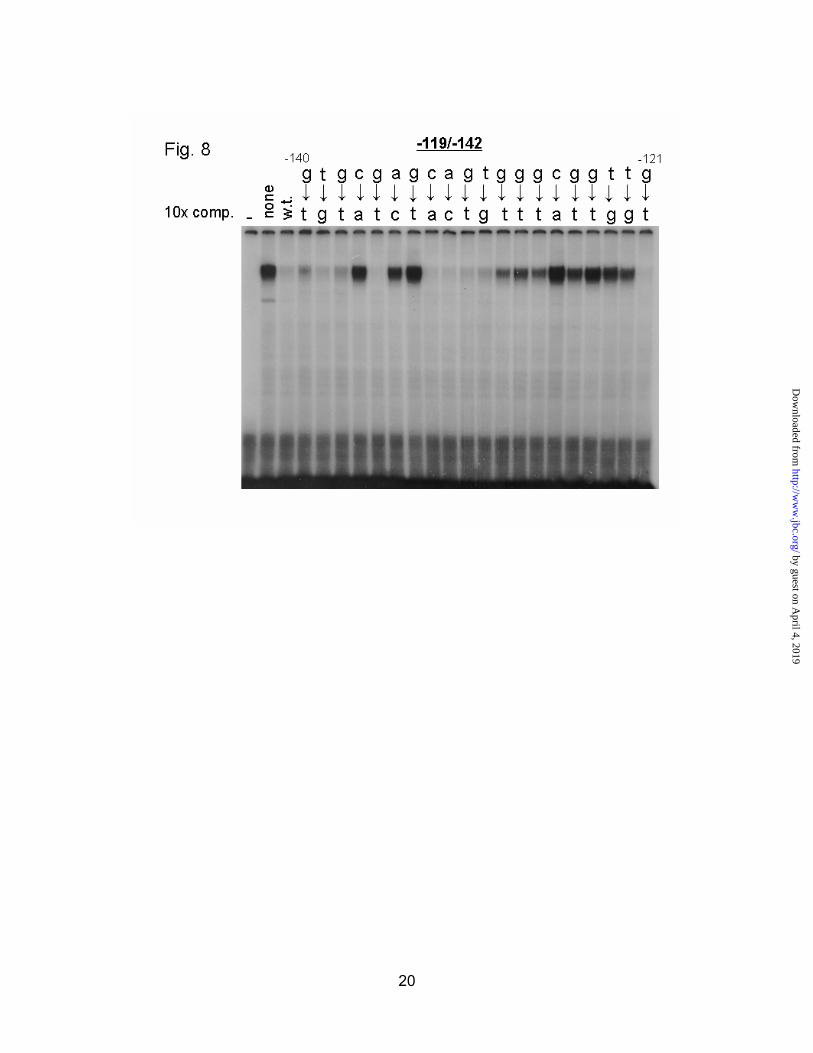
In an effort to identify the factor binding to the –119/-142 region, we performed additional EMSAs. Figure 8 shows an experiment in which a probe to the –119/-142 region was incubated in a binding reaction with normal rat liver nuclear extract (lane 2). An unlabeled double-stranded oligonucleotide was added in 10 fold molar excess relative to the hot probe in the remaining lanes. The sequence at the top of the figure is the wild type promoter sequence, with an arrow highlighting the point mutation in each lane. The upper band can be efficiently competed away with wild type competitor (lane 3), and most of the mutant oligos. Noteworthy exceptions are “C_AG” from –137 to –134, and the entire sequence “GGGCGGTT” between –129 and –122. The presence of two binding sites explains why this band is seen as well in the overlapping –129/-152 probe, albeit with weaker signal. The sequence “GGGCGGTT” seems like a good match for Sp1, whose consensus sequence is “GGGGCGGGGC” with a strong requirement for the core “GGGCGG”(27). Curiously, neither of our Sp1 antisera were able to supershift this band, nor was antibody to Egr-1, another GC-box binding protein (data not shown). The lower band in the first lane was found to be non-specific, as it was present regardless of probe used.
Given the strong protection of the CRE seen in all the in vivo footprints, and the ability of CREB to bind in vitro, we wanted to
6
by guest on April 4, 2019
http://ww
w.jbc.org/
Dow
nloaded from
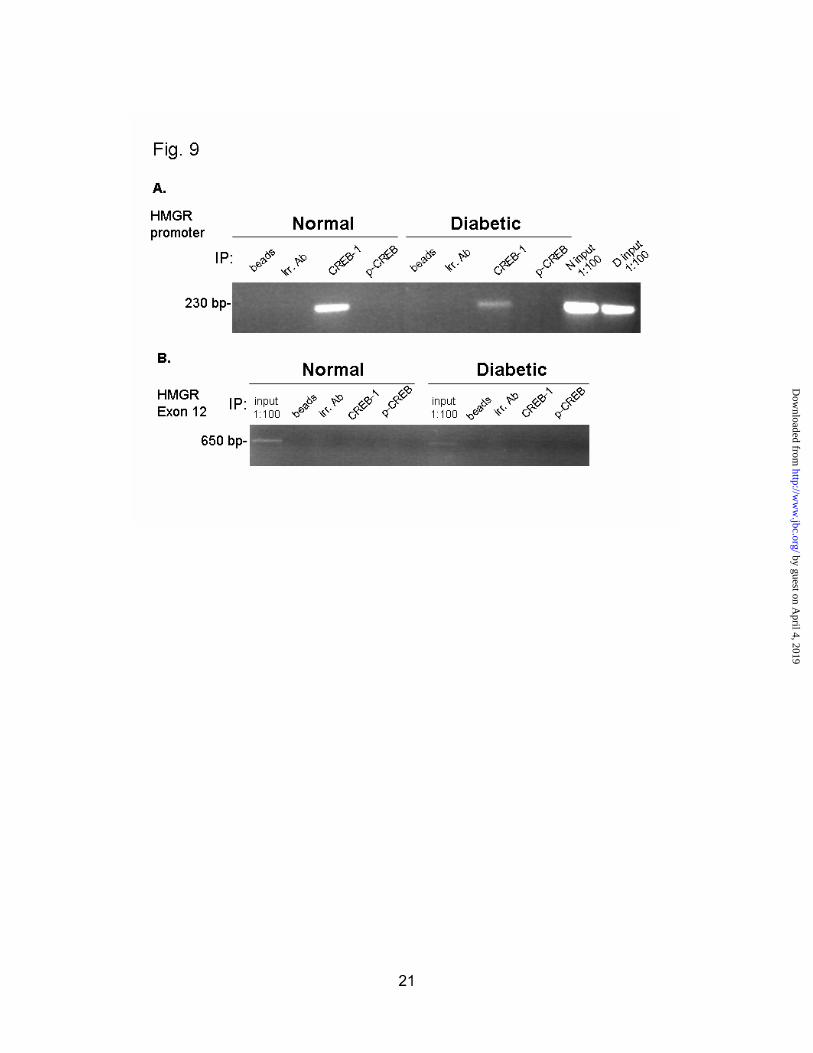
find out if CREB was in fact bound in vivo to the hepatic HMGR promoter. To accomplish this, liver sections from normal and diabetic rats were cross-linked with formaldehyde, and subjected to ChIP analysis. CREB-1 antibody was able to pull down the HMGR promoter from both normal and diabetic chromatin, while an isotype-matched antibody to an irrelevant nuclear protein was not (Fig.9a). The minor difference in intensity of this band between normal and diabetic samples was not reproducible, although CREB was clearly bound in both cases. This immunoprecipitation was not able to pull down Exon 12 of the HMGR gene, confirming that DNA was sheared to an appropriate size. The inability of p-CREB to pull down the HMGR promoter could be a result of poor antibody-antigen interaction. We would expect that at least some of the endogenous CREB is phosphorylated. This data confirms reports that CREB is bound to the HMGR promoter invivo (25), and validates this observation in the context of the live animal.
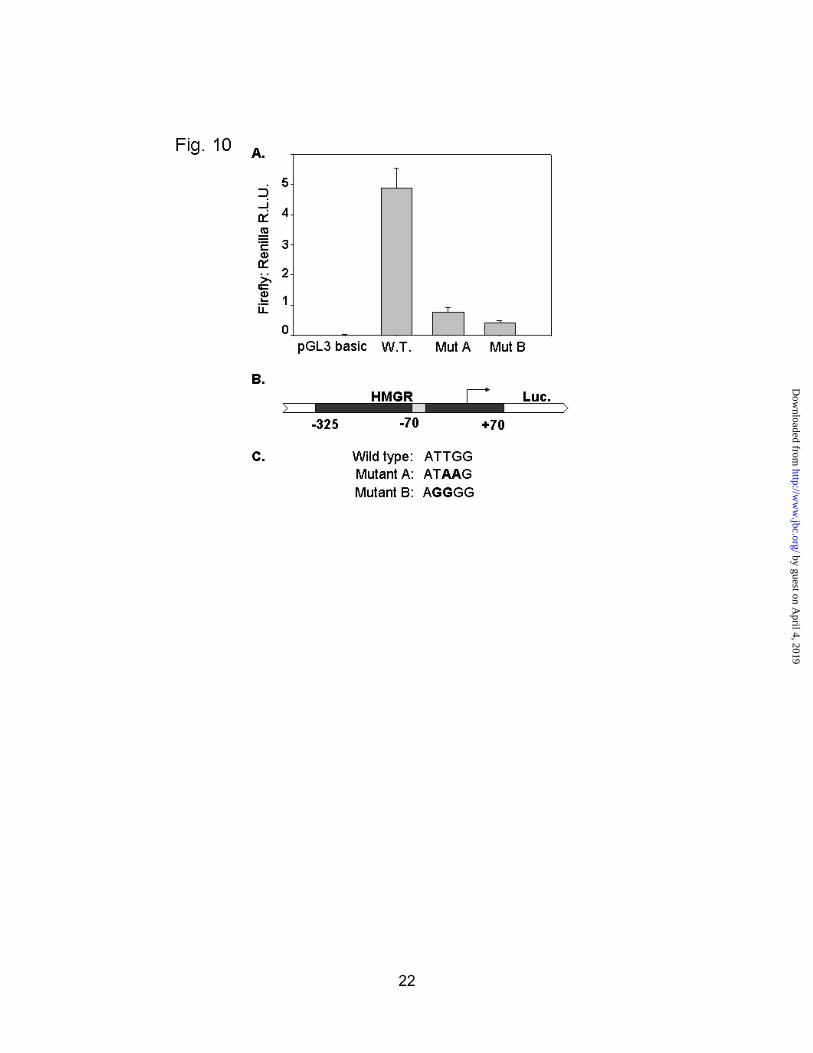
Another point of interest in the in vivofootprints was the consistent protection of the NF-Y site identified at –70. Since this site was strongly protected in 4/5 of the normal footprints, and none of the diabetics, we hypothesized that this element might play a critical role in activation of transcription. In order to investigate a possible functional role for this site, we constructed luciferase reporter plasmids containing the full length HMG-CoA reductase promoter starting at –325 and ending at +70 of the 5’ untranslated region. Two identical plasmids harboring mutations in the NF-Y site were also made. These plasmids were transfected into H4IIE cells, a rat hepatoma line. The cells were harvested and assayed for luciferase activity (Renilla luciferase was co-transfected for normalization purposes). As seen in Figure 10, the wild type promoter shows a high level of activity relative to the vector backbone. Both of the mutants significantly inhibited luciferase production, indicating that this NF-Y site is required for efficient HMGR transcription.
DISCUSSION
These studies address the regulation of the HMG-CoA reductase promoter by insulin in live animals. Here we present the first evidence that insulin acts to directly increase transcription of the HMG-CoA reductase gene in rat liver. Diabetic rats have lower rates of HMG-CoA reductase transcription than normal rats. With only two hours of insulin treatment, transcription was restored to normal. Previous work from our lab showed that the corresponding increase in mRNA could be accomplished even in the presence of cycloheximide (6). Taken together, these results suggest that insulin acts rather directly to stimulate the HMG-CoA reductase promoter, and does not require protein synthesis.
In vivo footprinting revealed numerous protections and enhancements throughout the HMGR promoter. The most pronounced of these was at the CRE, which was occupied under all conditions tested. EMSA analysis confirmed that CREB-1 present in nuclear extracts from normal or diabetic rat livers could bind to this element invitro, in agreement with observations in FRTL-5 cells (10). ChIP analysis of rat liver confirms the previous finding that CREB is bound to the HMGR promoter in vivo (25). Given the overwhelming and invariant occupancy of the CRE in vivo, it seems unlikely that CREB binding is the regulated event in insulin activation. This may differ from sterol regulation in which SREBP binding has been shown to selectively recruit CREB to the promoter in CHO cells (28). Although we previously showed that the CRE was required for insulin activation of this promoter in H4IIE cells (7), in vivo occupancy of this site did not vary in rat liver. It is possible that insulin regulation in cultured rat hepatoma cells differs from the physiological regulation of this gene seen in whole animals. It is also possible that the CRE is necessary but not sufficient for insulin activation, inasmuch as it is required for maintaining an
7
by guest on April 4, 2019
http://ww
w.jbc.org/
Dow
nloaded from
appropriate level of basal transcriptional activity.
The enhancement at -138 in normal footprints was not seen in diabetic samples. Given the GC-rich content of the nearby sequence, it is likely that this may be due to binding of an Sp1-related factor. In fact, strong in vitro binding activity was observed with the probe from –119 to –142. The sequence “gggcggctt” is a close match to the consensus binding sequence for Sp1. Though generally regarded as a more basal transcription factor, Sp1 has been invoked in the insulin regulation of several genes, including SREBP-1a (29).
Four of the five diabetic animals showed a particularly striking enhancement at -142. This enhancement was never seen under the other conditions examined, including cholesterol and lovastatin treatment. In addition, only diabetic samples showed a change in the DMS reactivity of the SRE. This enhancement at -161 of the SRE coincided with the enhancement at -142, and may be a result of binding of a repressive factor in the -161/-142 region. Binding of a factor in this region could distort the DNA in such a way that both -142 and -161 are more susceptible to dimethyl sulfate attack. In addition, this factor may preclude binding to the Sp1 site downstream of –138. This competition would explain why enhancements at –138 were only seen in the normal animals (due to binding at Sp1 sites), and the enhancement at –142 only in the diabetics.
When animals were fed either lovastatin or cholesterol, the footprint looked essentially identical to that seen in normal animals. This is peculiar because a similar dose of lovastatin was shown to elevate HMGR transcription 4-6 fold (22). Three possible reasons for the lack of occupancy at the SRE come to mind: 1) SREBP binding has been proposed to be a rapid and transient event. It is known that SREBPs are by themselves weak binders of DNA, suggesting that nearby factors are needed to stabilize them (25). Therefore SREBPs may not occupy
their binding site in a large enough percentage of cells to show up in the footprint 2) Lovastatin activation of this gene could occur through another site elsewhere in the promoter. This seems reasonable since HMGR is known to have a variant SRE, with lower affinity for SREBPs than those found in the LDL receptor and HMG-CoA synthase. It has also been demonstrated that SREBP-1 can bind to the HMGR promoter at sites other than the SRE (11). 3) Perhaps not all of the cells in the liver respond to lovastatin. It has been previously shown by immunostaining of livers from rats fed mevinolin (lovastatin), that HMGR expression is clustered around the blood supply (30). Uneven distribution of the drug could mean that some cells show a drastic upregulation of HMGR message, while a larger percentage remains unaffected. Since in vivo footprinting examines the net promoter occupancy of a population of cells, the effect could be muted even though mRNA is markedly higher. In either case, the data suggests that insulin activation of this promoter occurs by a mechanism distinct from sterol regulation.
The protections at -71/-70 were not observed in footprints from diabetic animals. It was found that NF-Y from nuclear extracts could bind to this element. Curiously, in vitrobinding of NF-Y from nuclear extracts did not vary with diabetes suggesting that other factors may be necessary to stabilize its interaction with the promoter in vivo. This is the first identification of this NF-Y site in the HMGR promoter. It is also clear that this site is of particular functional importance. Both mutations to this site substantially decreased overall transcription in H4IIE cells. Given its proximity to the transcription start site, recruitment of this factor is probably a key event in insulin regulation of HMGR.
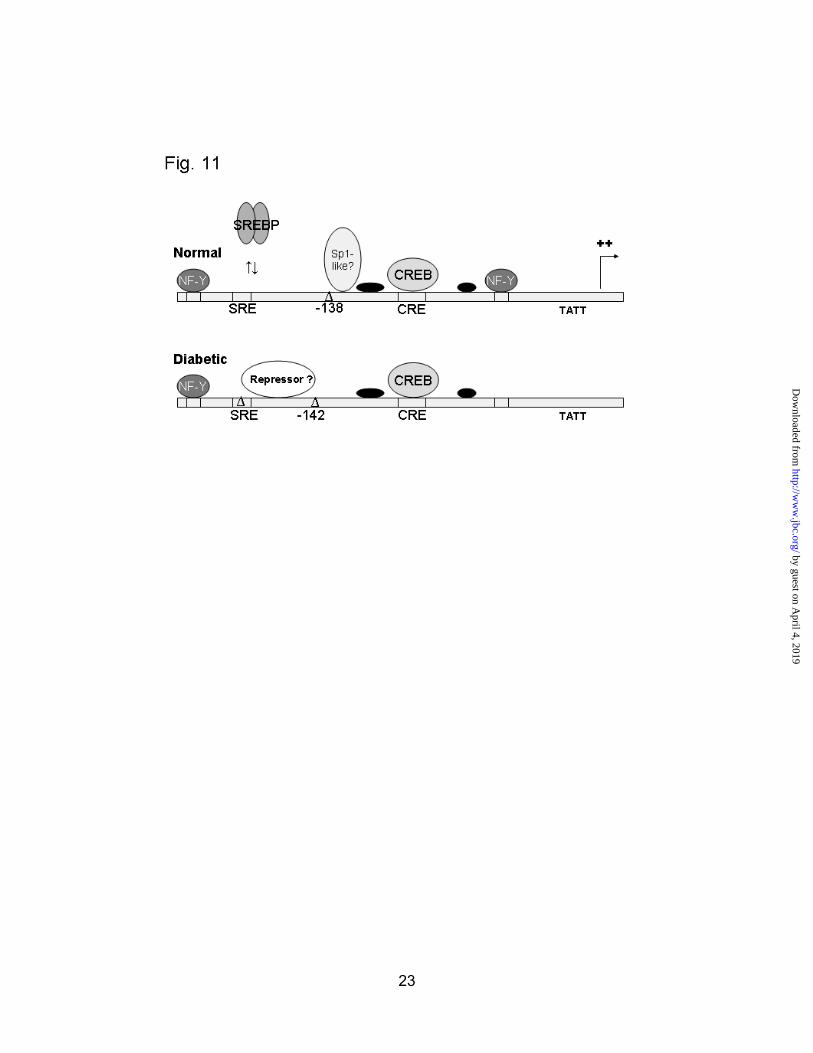
Using the information obtained from these experiments, we can construct a basic model of promoter occupancy in normal and diabetic rats (Fig. 11). CREB is bound to the promoter at the CRE in both normal and diabetic rats. The previously described NF-Y site around -189/-190 is occupied in both
8
by guest on April 4, 2019
http://ww
w.jbc.org/
Dow
nloaded from
situations. Sp1 or a related factor binds in the –119/-142 region, possibly accounting for the enhancement at -138 in normal rats. This binding is likely prevented by the presence of a repressive factor that occupies the region between -142 and -161 in the diabetic animals. The SRE is not protected to a detectable degree in the liver. While it is likely that SREBP-2 participates to some extent in basal transcription, it is not known what percentage of endogenous SREBPs are bound to the hepatic HMGR promoter under normal conditions. The diagram also shows a newly identified NF-Y site at -71/-70 that is preferentially occupied in the normal animals.
In summary, the areas of protection or enhancement identified in this study generally correspond with the large protected regions seen previously in DNase I footprinting studies of the hamster promoter (19). Previous in vivo footprints of the human promoter in HepG2 cells did not find any differences with insulin treatment, despite a 1.5 fold increase in mRNA (20). These previous in vivo studies also identified the SRE as a protected region,
something that was not observed in rat liver. These reports were useful in both helping us design the experiments, and in allowing us to compare results from cultured tumor cells to rat liver. Our work represents the first examination of the in vivo occupancy of the hepatic HMGR promoter in live animals. This is also the first demonstration that the CRE is occupied in vivo. We report a novel NF-Y site that is more often protected in normal animals, and required for efficient HMGR transcription. Most importantly, we have identified a few key areas where occupancy varies with diabetes, particularly -138, -142 and -161. This work will help focus future studies of insulin activation of this promoter, and further our understanding of the transcriptional regulation of genes in the liver. Additional studies are needed to address the functionalroles of these footprinted elements in the context of the live animal. Such investigations into insulin regulation of cholesterol biosynthesis are of paramount importance if we are to understand the links between diabetes and cardiovascular disease.
REFERENCES
1. Miettinen T.A., Gylling H., Tuominen J., Simonen P., Koivisto V. (2004) Diabetes Care.27(1), 53-58.
2. Armitage J., Bowman L. (2004) Curr. Opin. Lipidol. 15 (4), 439-446. 3. Ness G.C., Gertz K.R. (2004) Exp. Biol. Med. 229 (5), 407-411. 4. Ness G.C., Gertz K.R. (2004) Exp. Biol. Med. 229 (5), 412-416. 5. Ness G.C., Chambers C.M. (2000) Proc. Exp. Biol. Med. 224 (1), 8-19. 6. Ness G.C., Wiggins L., Zhao Z. (1994) Arch. Biochem. Biophys. 309 (1), 193-194. 7. Osborne A.R., Pollock V.V., Lagor W.R., Ness G.C. (2004) Biochem. Biophys.
Res.Commun. 318 (4), 814-818. 8. Osborne T.F., Goldstein J.L., Brown M.S. (1985) Cell 42 (1), 203-12. 9. Osborne T.F., Gil G., Goldstein J.L., Brown M.S. (1988) J. Biol. Chem.
263 (7), 3380-3387.10. Bifulco M., Perillo B., Saji M., Laezza C., Tedesco I., Kohn L.D., Aloj S.M. (1995) J.
Biol. Chem. 270 (25), 15231-15236. 11. Vallett S.M., Sanchez H.B., Rosenfeld J.M., Osborne T.F. (1996) J. Biol.
Chem. 271 (21), 12247-12253. 12. Bennett M.K., Toth J.I., Osborne T.F. (2004) J. Biol. Chem. 279 (36),
37360-37367. 13. Kersten S. (2001) EMBO 2 (4), 282-286. 14. Shimano H., Horton J.D., Hammer R.E., Shimomura I., Brown M.S., Goldstein J.L.
9
by guest on April 4, 2019
http://ww
w.jbc.org/
Dow
nloaded from
(1996) J. Clin. Invest.98 (7), 1575-1584. 15. Horton, J. D., Shimomura, I., Brown, M. S., Hammer, R. E., Goldstein, J. L., and Shimano, H. (1998) J. Clin. Invest. 101, 2331-2339. 16. Osborne T.F. (2000) J. Biol. Chem. 275 (42), 32379-32382. 17. Mueller P.R., Wold B. (1989) Science 246 (4931), 780-786. 18. Bossard P., McPherson C.E., Zaret K.S. (1997) Methods 11, 180-188. 19. Osborne T.F., Gil G., Brown M.S., Kowal R.C., Goldstein J.L. (1987) Proc. Natl. Acad. Sci. 84 (11), 3614-3618. 20. Lloyd D.B., Thompson J.F. (1995) J. Biol. Chem. 270 (43), 25812- 25818. 21. Mano H., Mori R., Ozawa T., Takeyama K.I., Yoshizawa Y., Kojima R., Arao Y., Masushigo S., Kato S. (1994) J. Biol. Chem 269, 1591-1594. 22. Lopez D., Chambers C.M., Ness G.C. (1997) Arch. Biochem. Biophys. 343 (1), 118-122. 23. Yu C.L., Meyer D.J., Campbell G.S., Larner A.C., Carter-Su C., Schwartz J., Jove R. (1995) Science 269, 81-83. 24. Latasa M.J., Griffin M.J., Moon Y.S., Sul H.S. (2003) Mol. Cell Biol. 23 (26), 5896-
5907. 25. Bennett M.K., Osborne T.F. (2000) Proc. Natl. Acad. Sci. 97 (12), 6340-6344. 26. Chambers C.M., Ness G.C. (1997) Biochem. Biophys. Res. Commun. 232 (2), 278-281. 27. Kriwacki R.W., Schultz S.C., Steitz T.A., Caradonna J.P. (1992) Proc. Natl Acad. Sci.
U.S.A. 89 (20): 9759-9763. 28. Ngo. T.T., Bennett M.K., Bourgeois A.L., Toth J.I., Osborne T.F. (2002) J. Biol. Chem.
277 (37) 33901-33905. 29. Zhang C., Shin D.J., Osborne T.F. (2005) Biochem J. 386 (1), 161-168. 30. Singer I.I., Kawka D.W., Kazazis D.M., Alberts A.W., Chen J.S., Huff J.W., Ness G.C. (1984) Proc. Natl. Acad. Sci. 81 (17), 5556-5560.
FOOTNOTES
Acknowledgements: The authors thank Dayami Lopez for her input on nuclear run-on assays. Kenneth Wright, Jian Wu, and Sophie Bolick contributed invaluable advice on in vivofootprinting. Louis Crowley and Glenn Roma provided advice on site-directed mutagenesis. This work was supported by grant 04-TSP-03 from the Florida Department of Health.
1The Abbreviations used are: HMGR, 3-hydroxy-3-methylglutaryl coenzyme A reductase; SRE, sterol response element; SREBP, sterol response element binding protein; CRE, cyclic AMP response element; CREB, cyclic AMP response element binding protein; HepG2, human hepatoma cell line; PBS, phosphate buffered saline; PCR, polymerase chain reaction; DMS, dimethyl sulfate; bp, base pair of DNA; EMSA, electrophoretic mobility shift assay; EDTA, Ethylenediaminetetraacetic acid; TBE, Tris-Borate EDTA; USF-2, upstream stimulatory factor 2; DTT, dithiothreitol; PMSF, phenylmethylsulfonylfluoride.
FIGURE LEGENDS
Fig. 1. Insulin activates HMG-CoA reductase transcription in diabetic rats. Nuclei were isolated from normal (N), diabetic (D), or insulin-injected diabetic rats (I). Extension of RNA transcripts was carried out with 32P- labeled CTP. Equal dpm of RNA were hybridized to membranes containing 5 μg of cDNA for HMG-CoA reductase (HMGR), catalase (CAT), or the Bluescript
10
by guest on April 4, 2019
http://ww
w.jbc.org/
Dow
nloaded from
vector (Blue) A, Nuclear run-ons from two normal (N1 ,N2), and two diabetic rats (D1, D2). B,Nuclear run-ons from four diabetic rats (D1-4), and four insulin-replenished diabetic rats (I1-4).
Fig. 2. Partial sequence of the rat HMG-CoA reductase promoter. The rat HMG-CoA reductase promoter was cloned by PCR and sequenced. The sterol response element (SRE) and cyclic AMP response element (CRE) are highlighted. The boldface A denotes the transcription start site. Locations of the labeling primers for footprinting are indicated by arrows.
Fig. 3. In vivo footprint of the hepatic HMGR promoter, top strand. Livers from normal (N), or diabetic (D) rats were treated with dimethyl sulfate to methylate exposed guanine residues. DNA was footprinted by ligation-mediated PCR. The“naked” lane shows all reactive guanine residues. Protected bases are indicated by a solid triangle ( ), while areas of enhanced DMS reactivity are denoted with an open triangle ( ). Due to weak overall signal, the naked lane was given a longer exposure to allow for comparison to the in vivo samples. The -71 region and CRE have been enlarged in the insets.
Fig. 4. In vivo footprint of the hepatic HMGR promoter, bottom strand. Livers from normal (N), or diabetic (D) rats were treated with dimethyl sulfate to methylate exposed guanine residues. DNA was footprinted by ligation-mediated PCR. The“naked” lane shows all reactive guanine residues. Protected bases are indicated by a solid triangle ( ), while areas of enhanced DMS reactivity are denoted with an open triangle ( ). The SRE, -142 region, and the CRE have been enlarged.
Fig. 5. In vivo footprinting of the HMGR promoter in rats fed lovastatin or cholesterol. Rats were fed either 0.02% Lovastatin (L) or 1% cholesterol (Ch) chow for 5 days. Livers were treated with dimethyl sulfate and footprinted by ligation-mediated PCR. Protected bases are indicated by a solid triangle ( ), while areas of enhanced DMS reactivity are denoted with an open triangle ( ).The SRE (-164/-155) has been enlarged in the inset.
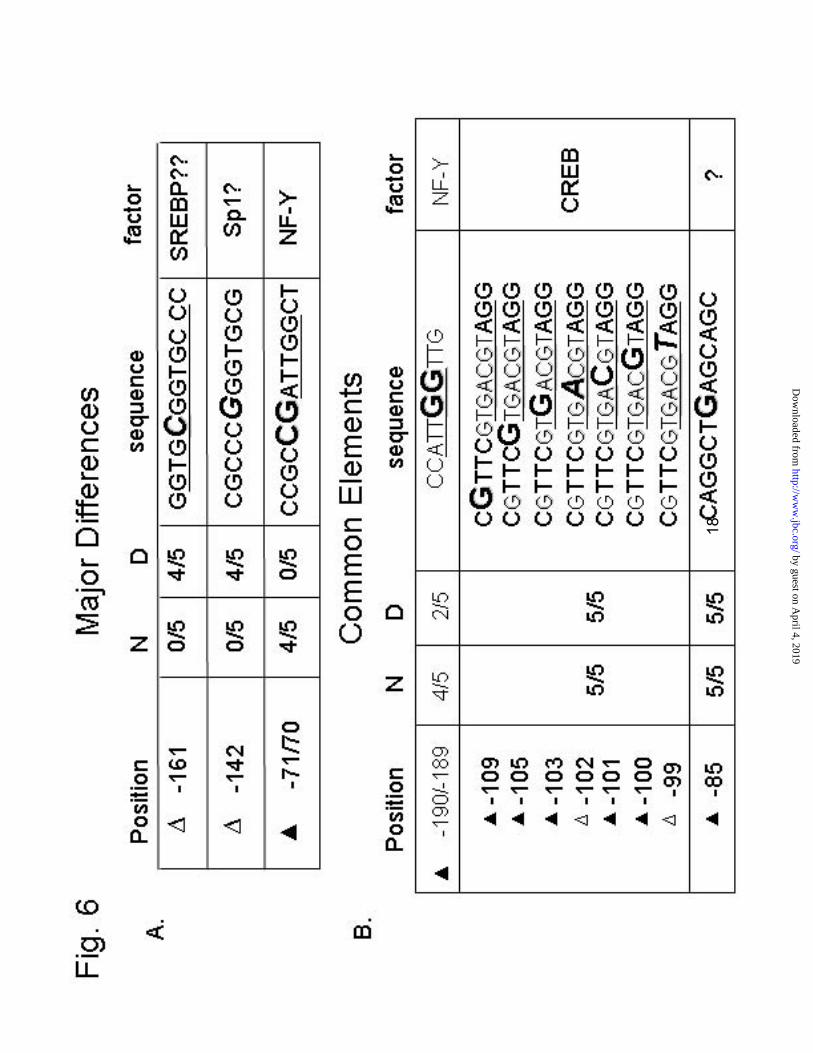
Fig. 6. Summary of DMS reactivity. Many areas of DMS protection and enhancement were observed by in vivo footprinting. The most common and reproducible sites are noted in this table. Protected bases are indicated by a solid triangle ( ), while areas of enhanced DMS reactivity are denoted with an open triangle ( ). The nucleotide position is given relative to the transcription start site. Five normal (N) and five diabetic (D) animals were footprinted. The number of times each protection or enhancement was observed is expressed as a fraction of the total animals in the group. In the next column, the sequence is given, showing the reactive residue that was detected. Possible factors that may bind are listed in the last column.
Fig. 7. EMSA analysis of footprinted regions. Short DNA probes corresponding to the major footprinted areas were used to detect in vitro protein binding in normal (N) and diabetic (D) rat liver nuclear extracts. A, Probe to the -59/-82 region, with two different NF-Y antisera or NF-1 antisera added as indicated. B, Probe for the CRE (-85/-115) with CREB-1 antisera added where indicated. C, Probe for the -119/-142 and the -129/-152 regions.
Fig. 8. EMSA analysis of Sp1-like factor binding to the -119/-142 region. A short DNA probe corresponding to the footprinted region between -119 and -142 was used to detect in vitro binding ability in rat liver nuclear extracts. Competitor oligos were used in a 10 fold molar excess to the probe where indicated. The first lane (-) is a binding reaction without nuclear extract. The second lane (none) is a binding reaction with rat liver nuclear extract but no competitor. The third lane (w.t.) is a binding reaction with the wild type sequence used as a competitor. The remaining lanes
11
by guest on April 4, 2019
http://ww
w.jbc.org/
Dow
nloaded from
are labeled with the wild type promoter sequence on top, and an arrow pointing to the point mutation in the competitor oligo.
Fig. 9. CREB is bound to the HMGR promoter in live animals. Liver pieces from normal (N) and diabetic (D) rats were cross-linked in 1% formaldehyde. Nuclei were isolated and lysed. Chromatin was sonicated to an average size of 200-600 bp. Chromatin 15 μg was immunoprecipitated with no antibody (beads), an irrelevant antibody (USF-2), CREB-1 antibody, or phospho-CREB antibody. Forty cycles of PCR were performed, and products were run on a 2.2% agarose gel with ethidium bromide. A, PCR to detect the HMG-CoA reductase promoter. B, PCR to detect HMG-CoA reductase Exon 12.
Fig. 10. The NF-Y site at -70 is required for efficient transcription of HMG-CoA reductase. A, H4IIE cells were transfected with pGL3 basic, the wild type HMG-CoA reductase promoter-luciferase construct (W.T.), or the same plasmid harboring mutations in the NF-Y site (Mut A, Mut B). For normalization purposes, each construct was co-transfected with pRL-TK, a plasmid containing the renilla luciferase gene driven by the thymidine kinase promoter. Relative luciferase units (R.L.U.) are expressed as the ratio of firefly to renilla luciferase +/- standard deviation of the mean. B, Schematic of the HMG-CoA reductase promoter-luciferase construct in pGL3. C, Sequence of the NF-Y site in the mutant plasmids from -69 to -65.
Fig. 11. Model of the HMGR promoter in normal and diabetic rat liver. Schematic of the HMGR promoter showing the major elements that are occupied in vivo in normal or diabetic rats, along with putative factors bound to those elements.
12
by guest on April 4, 2019
http://ww
w.jbc.org/
Dow
nloaded from
William R. Lagor, Eric D. de Groh and Gene C. NessDiabetes alters the occupancy of the hepatic HMG-CoA reductase promoter
published online August 26, 2005J. Biol. Chem.
10.1074/jbc.M504346200Access the most updated version of this article at doi:
Alerts:
When a correction for this article is posted•
When this article is cited•
to choose from all of JBC's e-mail alertsClick here
by guest on April 4, 2019
http://ww
w.jbc.org/
Dow
nloaded from


![[Thomas Aquinas; Etienne Gilson] St Thomas Aquinas(Bookos.org)](https://img.pdfslide.net/doc/110x75/5572125f497959fc0b907905/thomas-aquinas-etienne-gilson-st-thomas-aquinasbookosorg.jpg)