Embed Size (px)
Citation preview
Stability and Change in AdultPersonality: Genetic and
Environmental Components
NANCY L. PEDERSEN1,2* and CHANDRA A. REYNOLDS2
1Division of Genetic Epidemiology, Institute of Environmental
Medicine, The Karolinska Institute, Stockholm, Sweden2Department of Psychology, University of Southern California,
Los Angeles, USA
Abstract
The enduring nature of personality, particularly in adulthood, has been demonstratedin numerous cross-sectional and longitudinal studies where high stability has beenobserved even with decades between testing intervals. Biometrical studies, reportinggenetic e�ects as the primary cause of familial resemblance, have been interpreted aslending further support to theories concerning an inherent stability of personality.Heterogeneity in heritability estimates across age cohorts may, however, alter thisnotion. Furthermore, recent phenotypic studies report some evidence for change over thelife course for characteristics such as `outgoingness'. The purpose of the present analysiswas to examine longitudinal stability and change in the sources of variation in personalityin the latter half of the life-span using a twin/adoption design with up to four times ofmeasurement. Data from the Swedish Adoption/Twin Study of Aging (SATSA) are usedboth to demonstrate how genetic and environmental e�ects can contribute to phenotypicstability, and to estimate the extent to which these in¯uences are, themselves, stable.Particularly intriguing are ®ndings of increasing variability in rate of change despiterelative mean level stability as well as genetic stability.# 1998 John Wiley & Sons, Ltd.
INTRODUCTION
Models of adult personality
Several theorists have posited models of personality ranging from numerous factors(e.g. Catell, 1947) to as few as three major factors (e.g. extraversion (E), neuroticism(N), and psychoticism (P); Eysenck, 1991). A model that is recently enjoying somefavour is one which orders theoretically posed personality traits as well as naturallanguage trait adjectives into a framework of ®ve dimensions: neuroticism (N),
CCC 0890±2070/98/050365±22$17.50 Received 30 June 1998# 1998 John Wiley & Sons, Ltd. Accepted 30 July 1998
European Journal of PersonalityEur. J. Pers. 12, 365±386 (1998)
*Correspondence to: Nancy L. Pedersen, Division of Genetic Epidemiology, Institute of EnvironmentalMedicine, The Karolinska Institute, Box 210, 17177 Stockholm. E-mail: [email protected]
Contract grant sponsor: MacArthur Foundation Network in Successful Aging; National Institute ofAging; Swedish Council for Social Research.
extraversion (E), intellect or openness to experience (O), agreeableness (A) and con-scientiousness (C) (see Goldberg, 1993). Within these broad factors a multitude oftraits is contained. We shall focus our analysis and discussion on three of the Big-Fivetraits: neuroticism (N), extraversion (E) and openness to experience (O).
Longitudinal Studies of the Big-Five dimensions and related traits
Kogan (1990) reviewed four major longitudinal studies of personality: (i) TheBaltimore Longitudinal Study of Aging (Costa, McCrae and Arenberg, 1983), (ii)Kelly's (1955) longitudinal study of engaged couples initiated in the 1930s with twolater follow-up studies (Conley, 1984; 1985), (iii) the Cardiovascular Disease Project(Finn, 1986), and (iv) the Oakland Growth Study (Haan, Millsap and Hartka, 1986).Across a variety of measures and methods the studies demonstrated substantialstability of personality across long intervals of testing. However, conclusions regard-ing mean-level stability have not been consistent across studies, partly re¯ectingdi�erences in the initial ages of longitudinal samples (e.g. college samples versus post-college adults). It may be that less change is found with increasing age. For example,Haan et al. (1986) found stability to be lowest from late adolescence to early adult-hood, whereas Finn's (1986) ®ndings were supportive of high stability for someMMPI scales across a 30 year period in college-age and middle-aged men.
Recent evidence has been presented for change across 30 or 40 year spans forself-con®dence, cognitive commitment, outgoingness, and dependability (Jonesand Meredith, 1996) as well as change in stimulation-seeking, both cross-sectionallyand longitudinally (Giambra, Camp and Grodsky, 1992). The study of Jones andMeredith (1996) applied latent curve methods to longitudinal data from the BerkeleyGuidance Study and the Oakland Growth Study. Relevant results indicated increasesin outgoingness over time for both men and women from ages 18 to 62 years of age.Furthermore, nine per cent of the women showed particularly striking increases inoutgoingness between 30 and 40 years of age. The study of Giambra et al. (1992)found signi®cant decreases in average scores on two sensation-seeking measures(boredom susceptibility, need for external stimulation) utilizing both cross-sectionaland longitudinal information from the Baltimore Longitudinal Study of Aging.However, results of gender were less clear, given that longitudinal decreases werefound for women only on the boredom scale and decreases on the need for externalstimulation scale were found for men only.
Regardless of the extent of mean-level stability, there is considerable variability inbehavior at all ages (Nelson andDannefer, 1992; Neugarten, 1977). Behavioral geneticstudies can address issues concerning the source of these individual di�erences, and,more importantly, evaluate the extent to which phenotypic stability re¯ects geneticand environmental in¯uences (for a detailed description of various concepts andtechniques, see Pedersen, 1993). Genetic factors can contribute to change as well as tostability. Demonstrating genetic in¯uence implies neither immutability nor stability;some genes may be `turned on' only at speci®c stages during the life span while othersmay be inactivated. Temporal genes may be involved in the timing of speci®c age-related events (Farrar, 1987; Paigen, 1980). Presumed examples of genetic changeoccur during puberty and menopause, when di�erent genes governing hormoneproduction become active and later inactive. Even moderately stable traits may bein¯uenced by di�erent sets of genes at di�erent periods in the life span (Plomin, 1986).
366 N. L. Pedersen and C. A. Reynolds
# 1998 John Wiley & Sons, Ltd. Eur. J. Pers. 12, 365±386 (1998)
Behavioral genetic studies of personality
That genetic e�ects are important for individual di�erences in personality is wellestablished (Bouchard, 1994; Eaves, Eysenck and Martin, 1989; Loehlin, 1992;Pedersen, 1994). Across the measures best re¯ecting the Big Five, additive and non-additive genetic e�ects accounted for over 40 per cent of the phenotypic variation andshared environmental e�ects contributed to approximately seven per cent of thevariance. The remaining variation was accounted for equally by nonshared environ-mental e�ects and measurement error.
Meta-analyses of past twin studies suggest that twin similarity for several person-ality dimensions (e.g. activity±impulsivity, sociability) appears to decrease cross-sectionally across age (age range 1 to 50 years; McCartney, Harris and Bernieri,1990), suggesting a larger role for nonshared environmental in¯uences over time.Heterogeneity in heritabilities across birth cohorts has also been demonstrated fromthe Swedish Twin Registry sample of 12,898 like-sex twin pairs (Floderus-Myrhed,Pedersen and Rasmuson, 1980). A reanalysis of those data by Eaves et al. (1989)suggested that cohort di�erences in heritabilities were sex and phenotype speci®c.
Behavioral genetic studies of personality: Longitudinal Findings
There are very few behavioral genetic studies of personality with longitudinal dataon adults. Three studies of young adults (Dworkin et al. 1976; Eaves and Eysenck,1976; Pogue-Geile and Rose, 1985) lead us to the conclusion that there is signi®cantstability in genetic in¯uences across short (3ÿ 12 year) intervals. More recently, across-sequential analysis, across two time points six years apart, of extraversion andneuroticism in Finnish twins between the ages of 18 and 59 years was conducted(Viken et al. 1994). Six-year birth cohorts were organized: 18±23 years, 24±29 years,30±35 years, 36±41 years, 42±47 years, 48±53 years, 54±59 years. Heritabilities wereevaluated as a function of both cohort and time. Furthermore, the stability of geneticand environmental in¯uences was evaluated. Overall, for both extraversion andneuroticism, results suggest moderate heritabilities with waning in¯uence across age(e.g. for extraversion from 0.52 to 0.41 across the age groups), although the genetice�ects per se were quite stable. In other words, no signi®cant new genetic in¯uenceswere found after 29 years of age, as re¯ected by age-to-age genetic correlations ofunity. Environmental in¯uences were less stable: new environmental in¯uences at eachage and time point were found and age to age environmental correlations were lessthan unity.
The present study
An important and interesting addition to the literature on change in stability ofpersonality would be to examine sources of variation contributing to personality inthe latter half of the age-span with multiple time-points of measurement. Preliminaryanalyses of data from the Swedish Adopting/Twin Study of Aging (SATSA) indicatethat, across a 3 year measurement period, genetic and environmental e�ects contri-buted approximately equally to phenotypic stability (Pedersen, 1993). Furthermore,there was considerable stability in genetic e�ects; genetic e�ects at time 1 overlappednearly completely with genetic e�ects of time 2. On the other hand, environmental
Stability and change in personality 367
# 1998 John Wiley & Sons, Ltd. Eur. J. Pers. 12, 365±386 (1998)
e�ects were less stable, and, similar to the Finnish ®ndings, there were new environ-mental in¯uences after 3 years. A subset of the SATSA twins had also responded to ashort form of the Eysenck Personality Inventory as part of the initial questionnairesent in 1972, to establish the cohort of twins born 1926±1958. Across the 12 yearperiod (from 1972 to 1984) as well as the 9 year period from 1984 to 1993, there werenew genetic in¯uences coming into play for neuroticism, but not for extraversion(Grant et al. 1995). For both measures, new non-shared environmental in¯uencesbecame important.
SATSA twins have participated in up to four waves of questionnaire basedassessment, with three-year inter-occasion intervals. In the following, we presentlongitudinal analyses with the following features:
(i) cohort-sequential descriptions of mean change and rate of change;(ii) combined factor simplex models of phenotypic stability and change; and(iii) evaluations of genetic and environmental contributions to stability and change
within the framework of combined factor simplex models.
METHOD
Sample
The present study included participants from the SATSA, a population-based samplefrom the Swedish Twin Registry which contains data on approximately 24,000 like-sextwin pairs born between 1886 and 1958 (CederloÈ f and Lorich, 1978). The SATSAsample, described in detail elsewhere (Pedersen et al. 1991) includes twin pairs separ-ated before age 10, with a majority of twin pairs being separated by age 2 years (twinsreared apart, TRA), and a control sample of twins (matched on date of birth, genderand county of birth) who were reared together (TRT). Altogether, 2209 individualsresponded to at least one questionnaire mailing in 1984, 1987, 1990 or 1993. The meanage in 1984 was 60.15 (sd � 14.04) and 59 per cent of individuals were female. A totalof 821 complete pairs responded to one or more questionnaire mailings.
Measures
Awidely used short form of the Eysenck Personality Inventory (EPI; Floderus, 1974)was utilized to assess extraversion and neuroticism. For each scale, nine items weresummed where a yes answer added one point to the total score. As reported byPedersen et al. (1998) Cronbach's alpha at time one was 0.66 and 0.75 for extraversionand neuroticism, respectively.
The Openness to Experience scale of the NEO-PI (Costa and McCrae, 1985) wasalso examined in this study. Six items of the scale were summed for a total score. Thisshortened scale included the highest-loading items based on previous factor analyticwork of the full openness to experience scale and was available for all subsequentquestionnaire waves following the ®rst questionnaire mailing. The items included (i) Ilike to solve problems or riddles, (ii) I ®nd it easy to empathize with others, (iii) I havegreat intellectual curiosity, (iv) I ®nd it interesting to take up new hobbies, (v) I like toponder on theories and/or philosophical ideas, and (vi) I often try out new and foreignfoods.
368 N. L. Pedersen and C. A. Reynolds
# 1998 John Wiley & Sons, Ltd. Eur. J. Pers. 12, 365±386 (1998)
Analyses
Two types of analysis were performed: (i) phenotypic analyses of change and stabilityof extraversion (EXT), neuroticism (NEUR), and openness to experience (OPEN)and (ii) structural model-®tting analyses of genetic and environmental sources ofvariation. The goal of model-®tting analyses was to examine phenotypic, genetic, andenvironmental underpinnings of personality in late adulthood and to examine thestability of these e�ects over time.
Twin Design
The resolution of genetic and environmental e�ects in the twins reared apart/togetherdesign rests upon the assumptions of (i) equal environmental similarity for MZand DZ twins, (ii) random mating for the traits being studied, and (iii) no gene±environment correlations (GE) correlations) or interactions (G� E interactions).
There are essentially ®ve components of phenotypic variance (Vp) that could beestimated from this design: a2, additive genetic variance; d2, nonadditive geneticvariance (i.e. dominance); s2, shared environmental variance; c2, correlated environ-mental variance; e2, nonshared variance. However, it is impossible to resolve c2 and d2
because they are confounded in the classic twin design and our models must eitherestimate c2 or d2. If the DZ correlation is less than half of that of the MZ correlation,then dominance e�ects may be present. Correlated environmental e�ects on the otherhand will increase DZ similarity to greater than half of that of the MZ twins ifpresent. If the TRT correlation is greater than the TRA correlation, then sharedenvironmental e�ects may be present. The standardized components of variance are
Vp � a2 � d
2 � s2 � c
2 � e2 � 1.0 �1�
The following delineates the expected correlations for MZ and DZ twins by rearingstatus (a, reared apart; t, reared together) in the univariate case:
rmzt � a2 � d
2 � s2 � c
2 �2�rdzt � 1=2a2 � 1=4d2 � s
2 � c2 �3�
rmza � a2 � d
2 � c2 �4�
rdza � 1=2a2 � 1=4d2 � c2 �5�
In practice, resolution of these genetic and environmental components acrossmultiple measurement occasions can be approached by ®tting models, such as simplexor factor models, to the observed variances and covariances (Neale and Cardon,1992). We chose to explore a combined factor and simplex model (see Figure 1) basedon the work of Cardon et al. (1992). The simplex pattern (transmissions denoted bybi) would indicate high similarity between personality scores in close temporalsequence but lower similarity between distantly related scores as cumulatively moreinnovative in¯uences occur in the intervening time points (loadings denoted by mi). Acommon factor pattern (loadings denoted by ci) would suggest that in¯uences a�ectpersonality scores in a constant manner. Both simplex and common factor systemsmay act concurrently. The combined phenotypic model in Figure 1 was then modi®ed
Stability and change in personality 369
# 1998 John Wiley & Sons, Ltd. Eur. J. Pers. 12, 365±386 (1998)
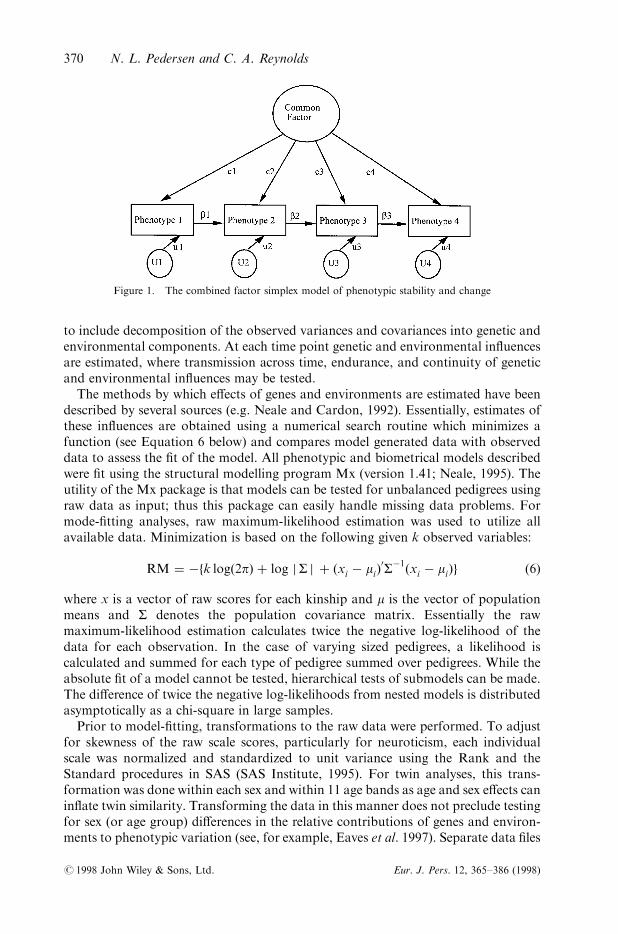
to include decomposition of the observed variances and covariances into genetic andenvironmental components. At each time point genetic and environmental in¯uencesare estimated, where transmission across time, endurance, and continuity of geneticand environmental in¯uences may be tested.
The methods by which e�ects of genes and environments are estimated have beendescribed by several sources (e.g. Neale and Cardon, 1992). Essentially, estimates ofthese in¯uences are obtained using a numerical search routine which minimizes afunction (see Equation 6 below) and compares model generated data with observeddata to assess the ®t of the model. All phenotypic and biometrical models describedwere ®t using the structural modelling program Mx (version 1.41; Neale, 1995). Theutility of the Mx package is that models can be tested for unbalanced pedigrees usingraw data as input; thus this package can easily handle missing data problems. Formode-®tting analyses, raw maximum-likelihood estimation was used to utilize allavailable data. Minimization is based on the following given k observed variables:
RM � ÿfk log�2p� � log jS j � �xi ÿ mi�0Sÿ1�xi ÿ mi�g �6�
where x is a vector of raw scores for each kinship and m is the vector of populationmeans and S denotes the population covariance matrix. Essentially the rawmaximum-likelihood estimation calculates twice the negative log-likelihood of thedata for each observation. In the case of varying sized pedigrees, a likelihood iscalculated and summed for each type of pedigree summed over pedigrees. While theabsolute ®t of a model cannot be tested, hierarchical tests of submodels can be made.The di�erence of twice the negative log-likelihoods from nested models is distributedasymptotically as a chi-square in large samples.
Prior to model-®tting, transformations to the raw data were performed. To adjustfor skewness of the raw scale scores, particularly for neuroticism, each individualscale was normalized and standardized to unit variance using the Rank and theStandard procedures in SAS (SAS Institute, 1995). For twin analyses, this trans-formation was done within each sex and within 11 age bands as age and sex e�ects canin¯ate twin similarity. Transforming the data in this manner does not preclude testingfor sex (or age group) di�erences in the relative contributions of genes and environ-ments to phenotypic variation (see, for example, Eaves et al. 1997). Separate data ®les
Figure 1. The combined factor simplex model of phenotypic stability and change
370 N. L. Pedersen and C. A. Reynolds
# 1998 John Wiley & Sons, Ltd. Eur. J. Pers. 12, 365±386 (1998)
for each of the rearing-by-zygosity groups were created after the normalization/standardization procedures.
RESULTS
Descriptive Analyses
Mean-Level Change
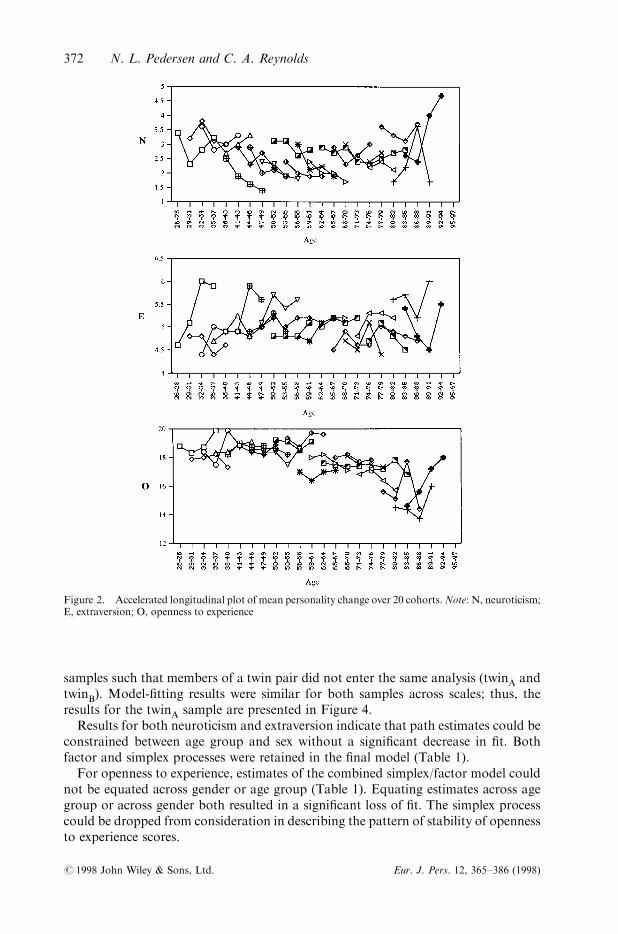
Average personality scores for 20 three-year age cohorts were plotted; given the smallnumber of participants above the age of 85 years, these subjects' data were consideredtogether with the 83±85 year age cohort. These plots enable preliminary analysis ofchange in mean-levels and attrition e�ects may be noted. Data were plotted for eachof two independent samples (twinA and twinB) such that the data from both membersof a twin pair were not represented on the same plot. Given the similarity of plots forboth samples, we present data from the twinA sample in Figure 2.
The pattern of means for neuroticism (denoted `N') across age cohorts suggests fewdi�erences in means at initial testing; however, there is a suggestion that scoresdecrease with time. Slight decreases in endorsement of neuroticism items can be seenlongitudinally and cross-sectionally except for the oldest cohorts (those who were75 years older at time one). Averaged over cohorts and time, there was no change inmean levels across age. The pattern of means for extraversion across time of measure-ment suggests small increases in average scores (denoted `E') with time in the youngestcohorts, but no real age-related change averaged across cohort and time. The patternof means for openness to experience (denoted `O' in Figure 2) exhibits considerablestability (across time and cohort) in cohorts less than age 55 at ®rst testing, followedby a general decrease in cohorts aged 55 to 71 years. In the oldest cohorts (aged71 years and older) there was considerable variability across both age and cohort.
Individual Change Over Time
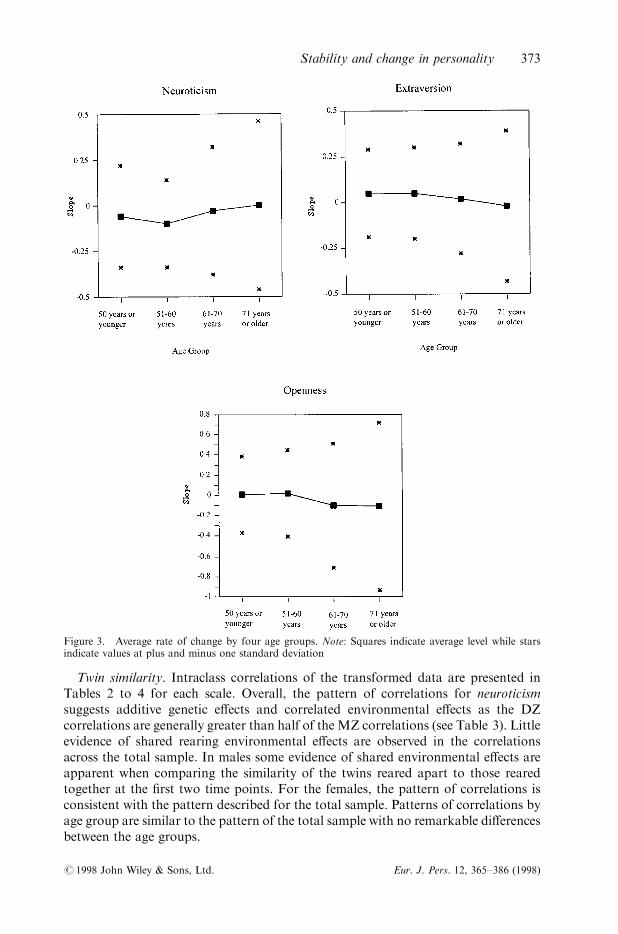
The ®tting of individual least-squares regressions was applied to subjects with two ormore occasions of testing in order to summarize each individual's personality data interms of regression parameters (intercept and slope) using PROC REG in SAS (SASInstitute, 1995). Average slopes (rates of change) for each scale and their associatedstandard deviations are presented in Figure 3. For neuroticism and extraversion, theaverage rate of change is small. However, there is notable evidence of increasingvariability of the individual slopes across the age groups, particularly for openness toexperience (note the di�erence in axis values in Figure 3).
Homogeneity of variance tests and a test of group di�erences in slope values wereperformed. Maximum-likelihood tests of models constraining variances to be equalindicated signi®cant heterogeneity in slopes across age groups for all three measures.
Model-Fitting Analyses
Phenotypic Models
The combined simplex/factor model presented in Figure 1 was individually ®t to allavailable data for extraversion, neuroticism, and openness to experience, using split
Stability and change in personality 371
# 1998 John Wiley & Sons, Ltd. Eur. J. Pers. 12, 365±386 (1998)
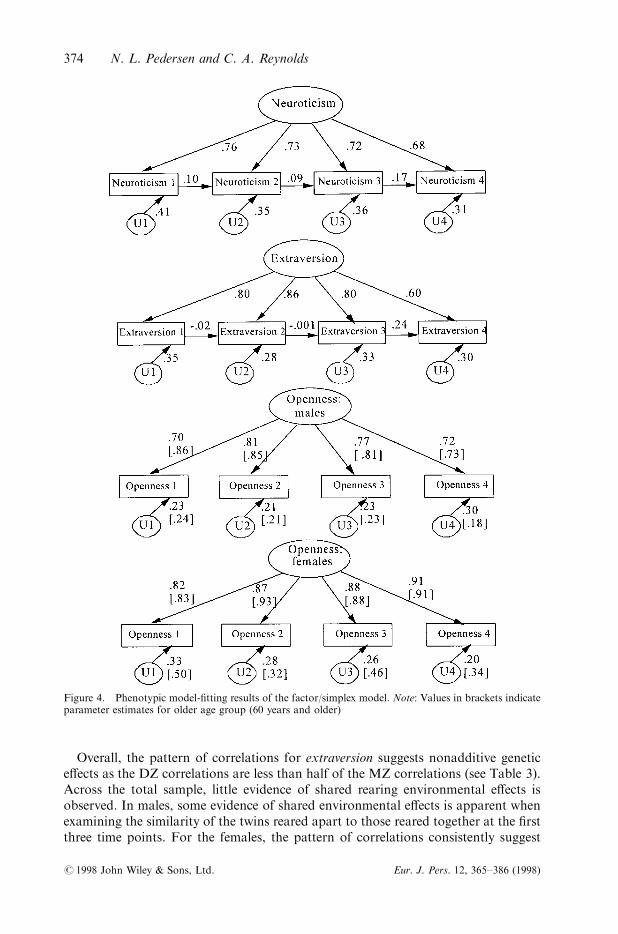
samples such that members of a twin pair did not enter the same analysis (twinA andtwinB). Model-®tting results were similar for both samples across scales; thus, theresults for the twinA sample are presented in Figure 4.
Results for both neuroticism and extraversion indicate that path estimates could beconstrained between age group and sex without a signi®cant decrease in ®t. Bothfactor and simplex processes were retained in the ®nal model (Table 1).
For openness to experience, estimates of the combined simplex/factor model couldnot be equated across gender or age group (Table 1). Equating estimates across agegroup or across gender both resulted in a signi®cant loss of ®t. The simplex processcould be dropped from consideration in describing the pattern of stability of opennessto experience scores.
Figure 2. Accelerated longitudinal plot of mean personality change over 20 cohorts.Note: N, neuroticism;E, extraversion; O, openness to experience
372 N. L. Pedersen and C. A. Reynolds
# 1998 John Wiley & Sons, Ltd. Eur. J. Pers. 12, 365±386 (1998)
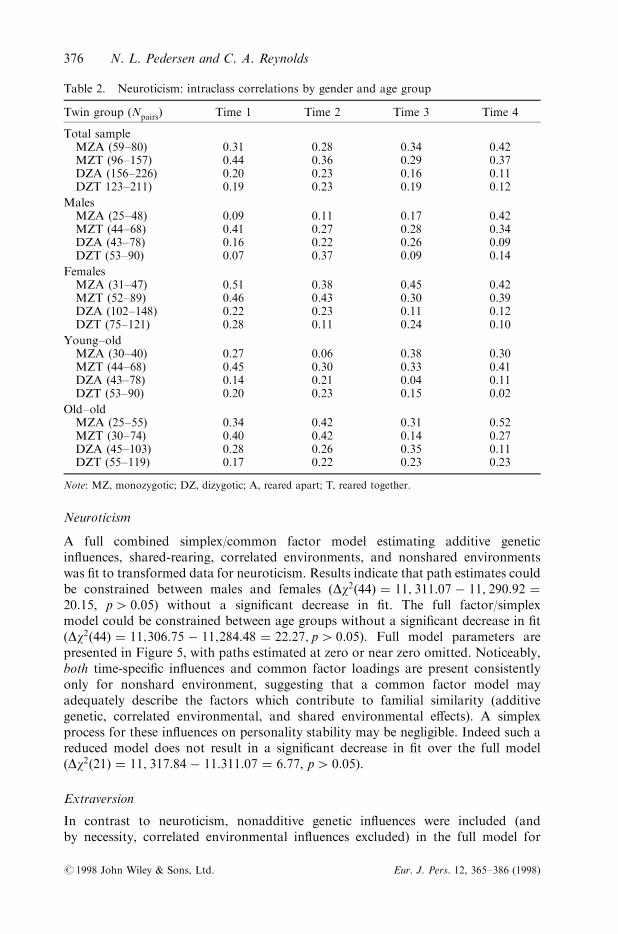
Twin similarity. Intraclass correlations of the transformed data are presented inTables 2 to 4 for each scale. Overall, the pattern of correlations for neuroticismsuggests additive genetic e�ects and correlated environmental e�ects as the DZcorrelations are generally greater than half of the MZ correlations (see Table 3). Littleevidence of shared rearing environmental e�ects are observed in the correlationsacross the total sample. In males some evidence of shared environmental e�ects areapparent when comparing the similarity of the twins reared apart to those rearedtogether at the ®rst two time points. For the females, the pattern of correlations isconsistent with the pattern described for the total sample. Patterns of correlations byage group are similar to the pattern of the total sample with no remarkable di�erencesbetween the age groups.
Figure 3. Average rate of change by four age groups. Note: Squares indicate average level while starsindicate values at plus and minus one standard deviation
Stability and change in personality 373
# 1998 John Wiley & Sons, Ltd. Eur. J. Pers. 12, 365±386 (1998)
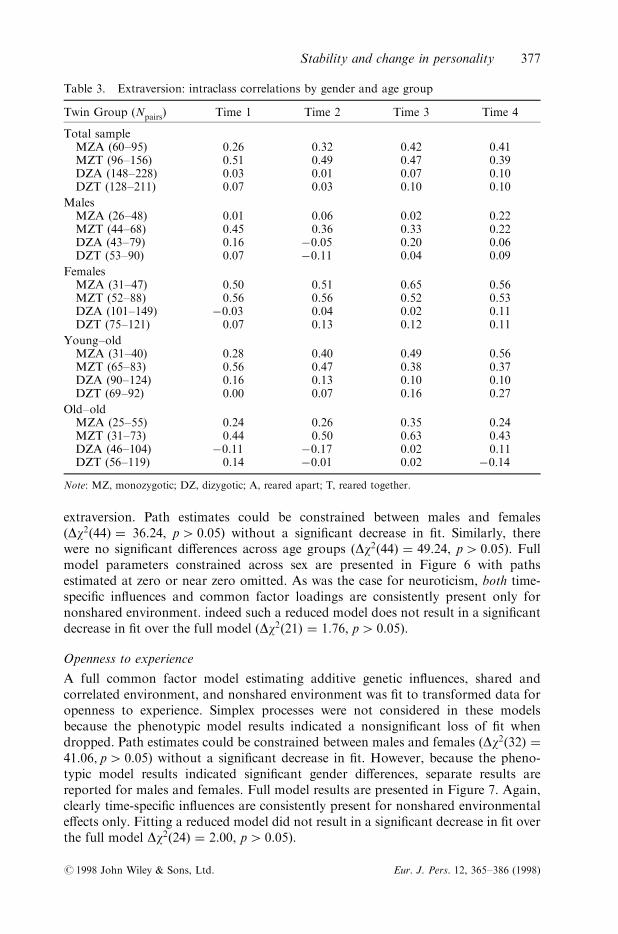
Overall, the pattern of correlations for extraversion suggests nonadditive genetice�ects as the DZ correlations are less than half of the MZ correlations (see Table 3).Across the total sample, little evidence of shared rearing environmental e�ects isobserved. In males, some evidence of shared environmental e�ects is apparent whenexamining the similarity of the twins reared apart to those reared together at the ®rstthree time points. For the females, the pattern of correlations consistently suggest
Figure 4. Phenotypic model-®tting results of the factor/simplex model. Note: Values in brackets indicateparameter estimates for older age group (60 years and older)
374 N. L. Pedersen and C. A. Reynolds
# 1998 John Wiley & Sons, Ltd. Eur. J. Pers. 12, 365±386 (1998)
nonadditive genetic e�ects. Patterns of correlations by age group are similar to thepattern of the total sample with no remarkable di�erences between the age groups.
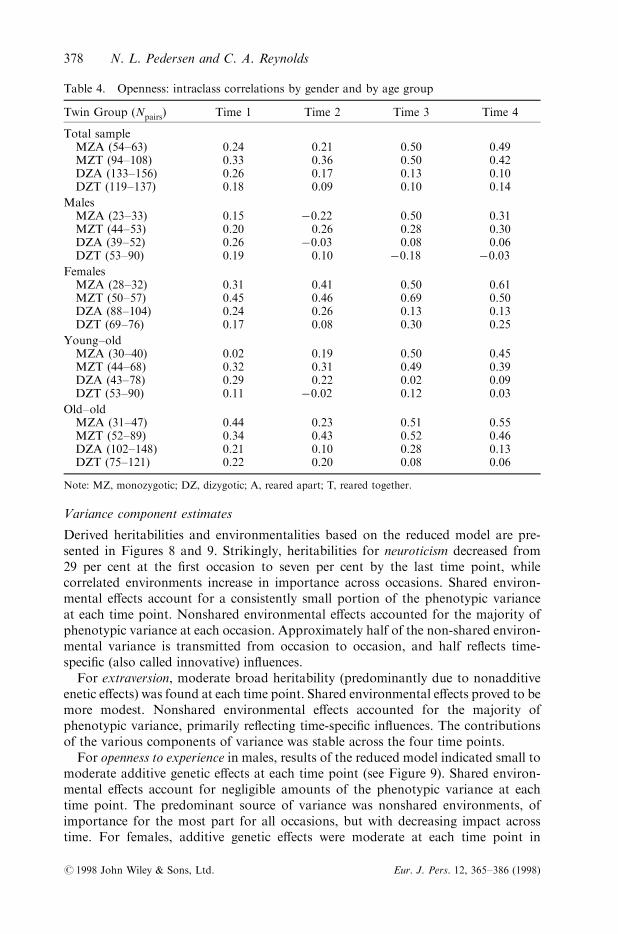
Overall, the pattern of correlations for openness to experience suggests smalladditive genetic e�ects and larger correlated environmental e�ects as the DZcorrelations are grater than half of the MZ correlations (see Table 4). Little evidenceof shared environmental e�ects is observed in the correlations across the total sample.In males MZ twin similarity is markedly lower than for females, suggesting smallerfamiliarity. For the females, the pattern of correlations is consistent with the patterndescribed for the total sample. Patterns of correlations by age group suggest remark-ably few di�erences between the age groups; at time 1, the MZA correlation is notablyhigher in the old±old group (0.44) than the young±old group (0.02).
Biometric Models
Models were ®t separately ®rst through comparing e�ects by sex and then separatelyby age group. Means estimated for each time point were not constrained to be equalby sex (nor by age group when considering age comparisons). However, as meandi�erences were not expected between twinA and twinB nor by twin type (MZ or DZ),the means were constrained across twin member (twinA and twinB) and twin type tobe equal in all models described.
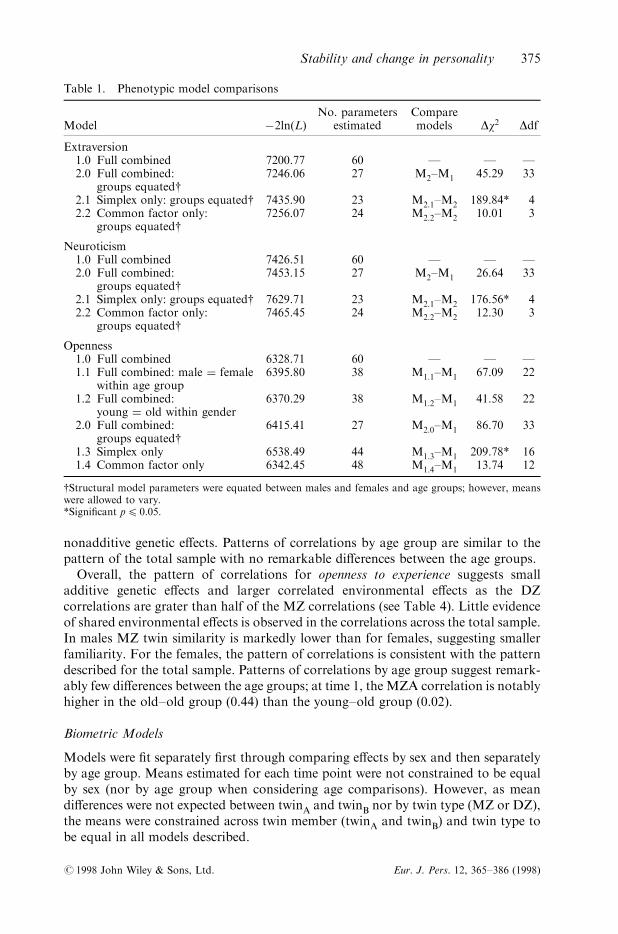
Table 1. Phenotypic model comparisons
Model ÿ2ln(L)No. parameters
estimatedComparemodels Dw2 Ddf
Extraversion1.0 Full combined 7200.77 60 Ð Ð Ð2.0 Full combined:
groups equated{7246.06 27 M2±M1 45.29 33
2.1 Simplex only: groups equated{ 7435.90 23 M2.1±M2 189.84* 42.2 Common factor only:
groups equated{7256.07 24 M2.2±M2 10.01 3
Neuroticism1.0 Full combined 7426.51 60 Ð Ð Ð2.0 Full combined:
groups equated{7453.15 27 M2±M1 26.64 33
2.1 Simplex only: groups equated{ 7629.71 23 M2.1±M2 176.56* 42.2 Common factor only:
groups equated{7465.45 24 M2.2±M2 12.30 3
Openness1.0 Full combined 6328.71 60 Ð Ð Ð1.1 Full combined: male � female
within age group6395.80 38 M1.1±M1 67.09 22
1.2 Full combined:young � old within gender
6370.29 38 M1.2±M1 41.58 22
2.0 Full combined:groups equated{
6415.41 27 M2.0±M1 86.70 33
1.3 Simplex only 6538.49 44 M1.3±M1 209.78* 161.4 Common factor only 6342.45 48 M1.4±M1 13.74 12
{Structural model parameters were equated between males and females and age groups; however, meanswere allowed to vary.*Signi®cant p4 0.05.
Stability and change in personality 375
# 1998 John Wiley & Sons, Ltd. Eur. J. Pers. 12, 365±386 (1998)
Neuroticism
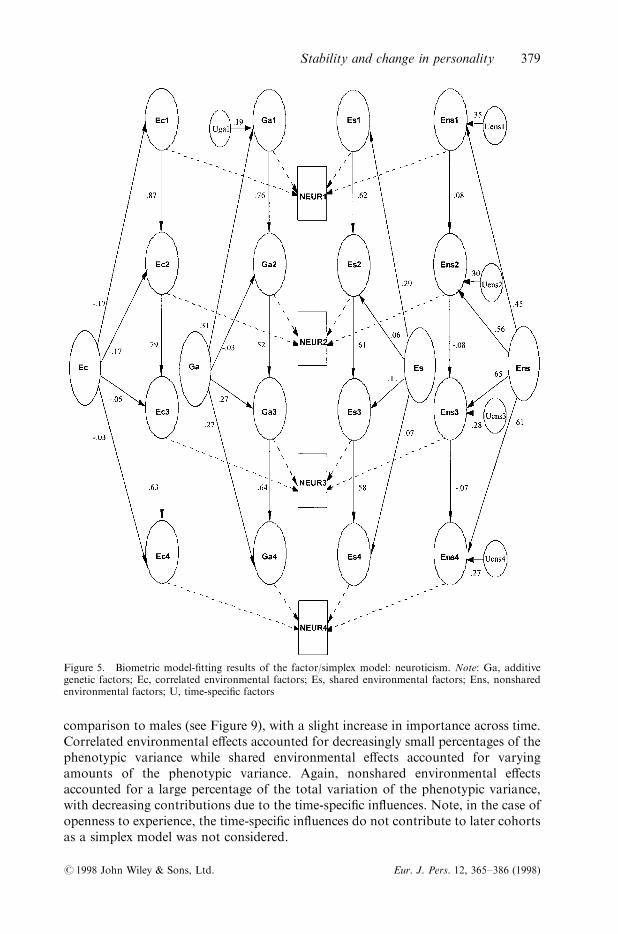
A full combined simplex/common factor model estimating additive geneticin¯uences, shared-rearing, correlated environments, and nonshared environmentswas ®t to transformed data for neuroticism. Results indicate that path estimates couldbe constrained between males and females �Dw2�44� � 11; 311.07 ÿ 11; 290.92 �20.15, p4 0.05� without a signi®cant decrease in ®t. The full factor/simplexmodel could be constrained between age groups without a signi®cant decrease in ®t�Dw2�44� � 11;306.75 ÿ 11;284.48 � 22.27; p4 0.05�. Full model parameters arepresented in Figure 5, with paths estimated at zero or near zero omitted. Noticeably,both time-speci®c in¯uences and common factor loadings are present consistentlyonly for nonshard environment, suggesting that a common factor model mayadequately describe the factors which contribute to familial similarity (additivegenetic, correlated environmental, and shared environmental e�ects). A simplexprocess for these in¯uences on personality stability may be negligible. Indeed such areduced model does not result in a signi®cant decrease in ®t over the full model�Dw2�21� � 11; 317.84 ÿ 11.311.07 � 6.77, p4 0.05�.
Extraversion
In contrast to neuroticism, nonadditive genetic in¯uences were included (andby necessity, correlated environmental in¯uences excluded) in the full model for
Table 2. Neuroticism: intraclass correlations by gender and age group
Twin group (Npairs) Time 1 Time 2 Time 3 Time 4
Total sampleMZA (59±80) 0.31 0.28 0.34 0.42MZT (96±157) 0.44 0.36 0.29 0.37DZA (156±226) 0.20 0.23 0.16 0.11DZT 123±211) 0.19 0.23 0.19 0.12
MalesMZA (25±48) 0.09 0.11 0.17 0.42MZT (44±68) 0.41 0.27 0.28 0.34DZA (43±78) 0.16 0.22 0.26 0.09DZT (53±90) 0.07 0.37 0.09 0.14
FemalesMZA (31±47) 0.51 0.38 0.45 0.42MZT (52±89) 0.46 0.43 0.30 0.39DZA (102±148) 0.22 0.23 0.11 0.12DZT (75±121) 0.28 0.11 0.24 0.10
Young±oldMZA (30±40) 0.27 0.06 0.38 0.30MZT (44±68) 0.45 0.30 0.33 0.41DZA (43±78) 0.14 0.21 0.04 0.11DZT (53±90) 0.20 0.23 0.15 0.02
Old±oldMZA (25±55) 0.34 0.42 0.31 0.52MZT (30±74) 0.40 0.42 0.14 0.27DZA (45±103) 0.28 0.26 0.35 0.11DZT (55±119) 0.17 0.22 0.23 0.23
Note: MZ, monozygotic; DZ, dizygotic; A, reared apart; T, reared together.
376 N. L. Pedersen and C. A. Reynolds
# 1998 John Wiley & Sons, Ltd. Eur. J. Pers. 12, 365±386 (1998)
extraversion. Path estimates could be constrained between males and females�Dw2�44� � 36.24, p4 0.05� without a signi®cant decrease in ®t. Similarly, therewere no signi®cant di�erences across age groups �Dw2�44� � 49.24, p4 0.05�. Fullmodel parameters constrained across sex are presented in Figure 6 with pathsestimated at zero or near zero omitted. As was the case for neuroticism, both time-speci®c in¯uences and common factor loadings are consistently present only fornonshared environment. indeed such a reduced model does not result in a signi®cantdecrease in ®t over the full model �Dw2�21� � 1.76, p4 0.05�.
Openness to experience
A full common factor model estimating additive genetic in¯uences, shared andcorrelated environment, and nonshared environment was ®t to transformed data foropenness to experience. Simplex processes were not considered in these modelsbecause the phenotypic model results indicated a nonsigni®cant loss of ®t whendropped. Path estimates could be constrained between males and females �Dw2�32� �41.06; p4 0.05� without a signi®cant decrease in ®t. However, because the pheno-typic model results indicated signi®cant gender di�erences, separate results arereported for males and females. Full model results are presented in Figure 7. Again,clearly time-speci®c in¯uences are consistently present for nonshared environmentale�ects only. Fitting a reduced model did not result in a signi®cant decrease in ®t overthe full model Dw2�24� � 2.00, p4 0.05�.
Table 3. Extraversion: intraclass correlations by gender and age group
Twin Group (Npairs) Time 1 Time 2 Time 3 Time 4
Total sampleMZA (60±95) 0.26 0.32 0.42 0.41MZT (96±156) 0.51 0.49 0.47 0.39DZA (148±228) 0.03 0.01 0.07 0.10DZT (128±211) 0.07 0.03 0.10 0.10
MalesMZA (26±48) 0.01 0.06 0.02 0.22MZT (44±68) 0.45 0.36 0.33 0.22DZA (43±79) 0.16 ÿ0.05 0.20 0.06DZT (53±90) 0.07 ÿ0.11 0.04 0.09
FemalesMZA (31±47) 0.50 0.51 0.65 0.56MZT (52±88) 0.56 0.56 0.52 0.53DZA (101±149) ÿ0.03 0.04 0.02 0.11DZT (75±121) 0.07 0.13 0.12 0.11
Young±oldMZA (31±40) 0.28 0.40 0.49 0.56MZT (65±83) 0.56 0.47 0.38 0.37DZA (90±124) 0.16 0.13 0.10 0.10DZT (69±92) 0.00 0.07 0.16 0.27
Old±oldMZA (25±55) 0.24 0.26 0.35 0.24MZT (31±73) 0.44 0.50 0.63 0.43DZA (46±104) ÿ0.11 ÿ0.17 0.02 0.11DZT (56±119) 0.14 ÿ0.01 0.02 ÿ0.14
Note: MZ, monozygotic; DZ, dizygotic; A, reared apart; T, reared together.
Stability and change in personality 377
# 1998 John Wiley & Sons, Ltd. Eur. J. Pers. 12, 365±386 (1998)
Variance component estimates
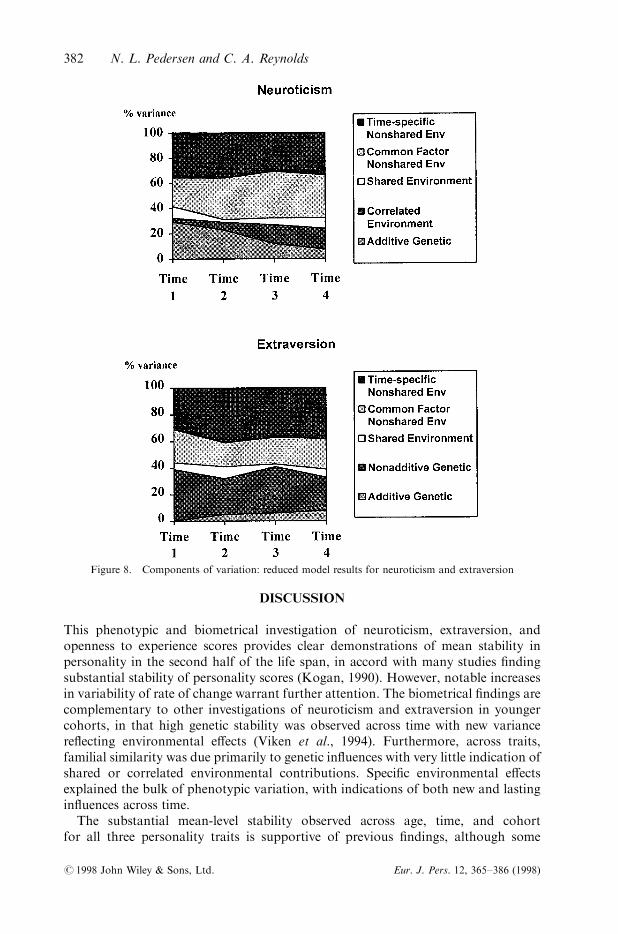
Derived heritabilities and environmentalities based on the reduced model are pre-sented in Figures 8 and 9. Strikingly, heritabilities for neuroticism decreased from29 per cent at the ®rst occasion to seven per cent by the last time point, whilecorrelated environments increase in importance across occasions. Shared environ-mental e�ects account for a consistently small portion of the phenotypic varianceat each time point. Nonshared environmental e�ects accounted for the majority ofphenotypic variance at each occasion. Approximately half of the non-shared environ-mental variance is transmitted from occasion to occasion, and half re¯ects time-speci®c (also called innovative) in¯uences.
For extraversion, moderate broad heritability (predominantly due to nonadditiveenetic e�ects) was found at each time point. Shared environmental e�ects proved to bemore modest. Nonshared environmental e�ects accounted for the majority ofphenotypic variance, primarily re¯ecting time-speci®c in¯uences. The contributionsof the various components of variance was stable across the four time points.
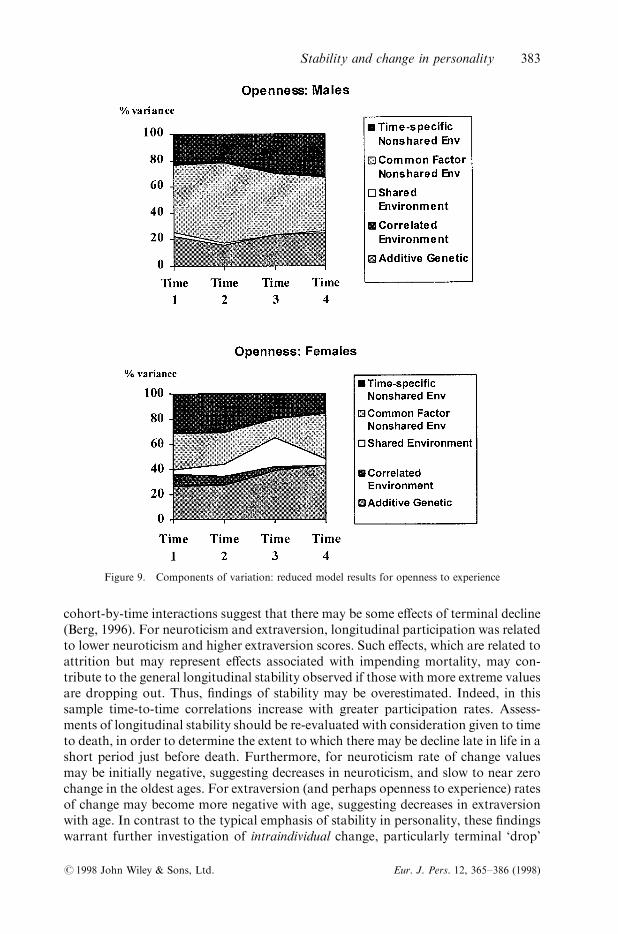
For openness to experience in males, results of the reduced model indicated small tomoderate additive genetic e�ects at each time point (see Figure 9). Shared environ-mental e�ects account for negligible amounts of the phenotypic variance at eachtime point. The predominant source of variance was nonshared environments, ofimportance for the most part for all occasions, but with decreasing impact acrosstime. For females, additive genetic e�ects were moderate at each time point in
Table 4. Openness: intraclass correlations by gender and by age group
Twin Group (Npairs) Time 1 Time 2 Time 3 Time 4
Total sampleMZA (54±63) 0.24 0.21 0.50 0.49MZT (94±108) 0.33 0.36 0.50 0.42DZA (133±156) 0.26 0.17 0.13 0.10DZT (119±137) 0.18 0.09 0.10 0.14
MalesMZA (23±33) 0.15 ÿ0.22 0.50 0.31MZT (44±53) 0.20 0.26 0.28 0.30DZA (39±52) 0.26 ÿ0.03 0.08 0.06DZT (53±90) 0.19 0.10 ÿ0.18 ÿ0.03
FemalesMZA (28±32) 0.31 0.41 0.50 0.61MZT (50±57) 0.45 0.46 0.69 0.50DZA (88±104) 0.24 0.26 0.13 0.13DZT (69±76) 0.17 0.08 0.30 0.25
Young±oldMZA (30±40) 0.02 0.19 0.50 0.45MZT (44±68) 0.32 0.31 0.49 0.39DZA (43±78) 0.29 0.22 0.02 0.09DZT (53±90) 0.11 ÿ0.02 0.12 0.03
Old±oldMZA (31±47) 0.44 0.23 0.51 0.55MZT (52±89) 0.34 0.43 0.52 0.46DZA (102±148) 0.21 0.10 0.28 0.13DZT (75±121) 0.22 0.20 0.08 0.06
Note: MZ, monozygotic; DZ, dizygotic; A, reared apart; T, reared together.
378 N. L. Pedersen and C. A. Reynolds
# 1998 John Wiley & Sons, Ltd. Eur. J. Pers. 12, 365±386 (1998)
comparison to males (see Figure 9), with a slight increase in importance across time.Correlated environmental e�ects accounted for decreasingly small percentages of thephenotypic variance while shared environmental e�ects accounted for varyingamounts of the phenotypic variance. Again, nonshared environmental e�ectsaccounted for a large percentage of the total variation of the phenotypic variance,with decreasing contributions due to the time-speci®c in¯uences. Note, in the case ofopenness to experience, the time-speci®c in¯uences do not contribute to later cohortsas a simplex model was not considered.
Figure 5. Biometric model-®tting results of the factor/simplex model: neuroticism. Note: Ga, additivegenetic factors; Ec, correlated environmental factors; Es, shared environmental factors; Ens, nonsharedenvironmental factors; U, time-speci®c factors
Stability and change in personality 379
# 1998 John Wiley & Sons, Ltd. Eur. J. Pers. 12, 365±386 (1998)
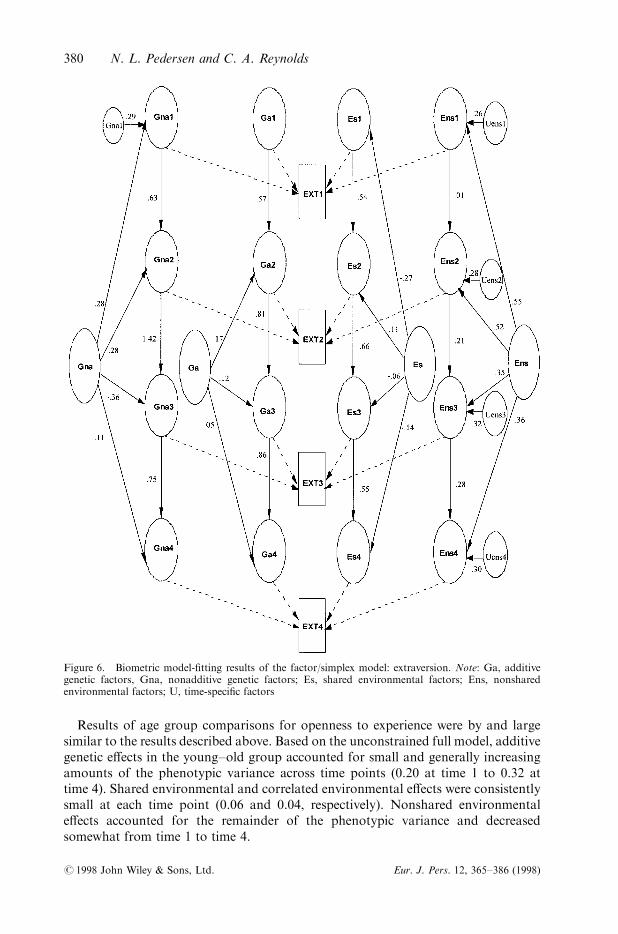
Results of age group comparisons for openness to experience were by and largesimilar to the results described above. Based on the unconstrained full model, additivegenetic e�ects in the young±old group accounted for small and generally increasingamounts of the phenotypic variance across time points (0.20 at time 1 to 0.32 attime 4). Shared environmental and correlated environmental e�ects were consistentlysmall at each time point (0.06 and 0.04, respectively). Nonshared environmentale�ects accounted for the remainder of the phenotypic variance and decreasedsomewhat from time 1 to time 4.
Figure 6. Biometric model-®tting results of the factor/simplex model: extraversion. Note: Ga, additivegenetic factors, Gna, nonadditive genetic factors; Es, shared environmental factors; Ens, nonsharedenvironmental factors; U, time-speci®c factors
380 N. L. Pedersen and C. A. Reynolds
# 1998 John Wiley & Sons, Ltd. Eur. J. Pers. 12, 365±386 (1998)
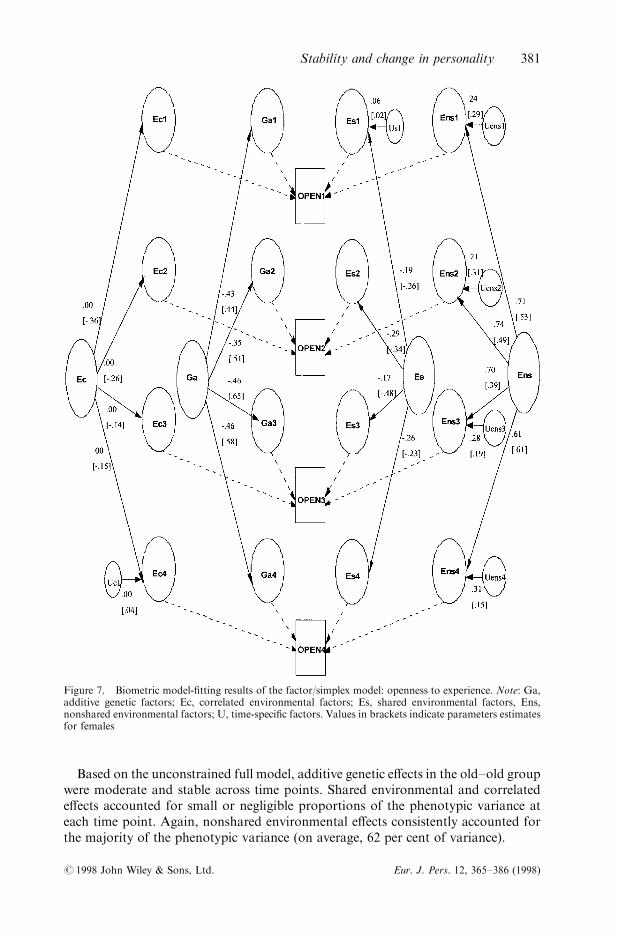
Based on the unconstrained full model, additive genetic e�ects in the old±old groupwere moderate and stable across time points. Shared environmental and correlatede�ects accounted for small or negligible proportions of the phenotypic variance ateach time point. Again, nonshared environmental e�ects consistently accounted forthe majority of the phenotypic variance (on average, 62 per cent of variance).
Figure 7. Biometric model-®tting results of the factor/simplex model: openness to experience. Note: Ga,additive genetic factors; Ec, correlated environmental factors; Es, shared environmental factors, Ens,nonshared environmental factors; U, time-speci®c factors. Values in brackets indicate parameters estimatesfor females
Stability and change in personality 381
# 1998 John Wiley & Sons, Ltd. Eur. J. Pers. 12, 365±386 (1998)
DISCUSSION
This phenotypic and biometrical investigation of neuroticism, extraversion, andopenness to experience scores provides clear demonstrations of mean stability inpersonality in the second half of the life span, in accord with many studies ®ndingsubstantial stability of personality scores (Kogan, 1990). However, notable increasesin variability of rate of change warrant further attention. The biometrical ®ndings arecomplementary to other investigations of neuroticism and extraversion in youngercohorts, in that high genetic stability was observed across time with new variancere¯ecting environmental e�ects (Viken et al., 1994). Furthermore, across traits,familial similarity was due primarily to genetic in¯uences with very little indication ofshared or correlated environmental contributions. Speci®c environmental e�ectsexplained the bulk of phenotypic variation, with indications of both new and lastingin¯uences across time.
The substantial mean-level stability observed across age, time, and cohortfor all three personality traits is supportive of previous ®ndings, although some
Figure 8. Components of variation: reduced model results for neuroticism and extraversion
382 N. L. Pedersen and C. A. Reynolds
# 1998 John Wiley & Sons, Ltd. Eur. J. Pers. 12, 365±386 (1998)
cohort-by-time interactions suggest that there may be some e�ects of terminal decline(Berg, 1996). For neuroticism and extraversion, longitudinal participation was relatedto lower neuroticism and higher extraversion scores. Such e�ects, which are related toattrition but may represent e�ects associated with impending mortality, may con-tribute to the general longitudinal stability observed if those with more extreme valuesare dropping out. Thus, ®ndings of stability may be overestimated. Indeed, in thissample time-to-time correlations increase with greater participation rates. Assess-ments of longitudinal stability should be re-evaluated with consideration given to timeto death, in order to determine the extent to which there may be decline late in life in ashort period just before death. Furthermore, for neuroticism rate of change valuesmay be initially negative, suggesting decreases in neuroticism, and slow to near zerochange in the oldest ages. For extraversion (and perhaps openness to experience) ratesof change may become more negative with age, suggesting decreases in extraversionwith age. In contrast to the typical emphasis of stability in personality, these ®ndingswarrant further investigation of intraindividual change, particularly terminal `drop'
Figure 9. Components of variation: reduced model results for openness to experience
Stability and change in personality 383
# 1998 John Wiley & Sons, Ltd. Eur. J. Pers. 12, 365±386 (1998)
changes that may in¯uence personality. Latent growth models may be most fruitful inthis regard (e.g. Jones and Meredith, 1996, McArdle et al. 1998).
Increasing variability in indicators of health with age has been well documented.In a summary of 127 articles from the gerontological literature, Nelson and Dannefer(1992) report that 75 per cent of the biologically oriented studies report patternsof increasing variability. Unfortunately, longitudinal data concerning variabilityare sparse and little information exists concerning personality characteristics.Interestingly, our investigation of individual rate of change in personality revealedincreasing variability with age, particularly for openness to experience. Thus, regard-less of changes in variability in level, a most intriguing ®nding is greater variabilityin slope. These ®ndings give further support to the suggestion above that some sortof terminal decline e�ect may be operating. As the sample becomes closer to death,more and more individuals may be entering into a period of change, with apparentlyvarying rates of entry into this terminal period. The factors in¯uencing the timing andrate of change in the period warrant further investigation.
Phenotypic analyses indicated the importance of both simplex and commonfactor processes contributing to phenotypic change and stability for neuroticism andextraversion, whereas a simpler common factor model with unique time-speci®cin¯uences was adequate to describe stability and change for openness to experience.Biometrical analyses informed the phenotypic ®ndings by suggesting common factorprocesses of genetic and environmental in¯uences, and the simplex process due tononshared environmental in¯uences in the case of neuroticism and extraversion. Inother words, genetic in¯uences at one time point were generally acting at subsequenttime points, whereas environmental in¯uences were in themselves less stable and newenvironmental in¯uences came into play across time.
Indeed, the present biometrical results dovetail nicely with those found in theFinnish study (Viken et al., 1994). The Finnish sample was age 18 to 53 years atbaseline, and measured on two occasions, 6 years apart, whereas over 60 per cent ofthe Swedish sample was older than the oldest Finns at baseline, and followup spanned9 years. The heritabilities in the present study for neuroticism were similar (0.29) tothe heritability found for the oldest cohorts in the Finnish study (0.31 for the latestmale cohort, and 0.42 for females in the latest cohorts), and decreased across time,supporting the notion that heritabilities decrease with age for neuroticism. However,we did not ®nd support for signi®cant gender di�erences in biometrical parameters.The broad heritabilities in the present study for extraversion (0.32±0.39) were onlyslightly smaller in value than the narrow heritability found for the oldest cohort in theFinnish study (0.41).
In neither study were time-speci®c genetic in¯uences found after age 30, and in bothstudies new nonshared environmental in¯uences were found at each age and timepoint. Thus, genetic in¯uences are considerably more stable then environmentalin¯uences. Nevertheless, genetic in¯uences contribute to only approximately half ofthe phenotypic stability (Pedersen, 1993). This is because the contributions tophenotypic stability are a function not only of the stability of the in¯uences, but alsoof their relative contributions at each time point. Environmental e�ects are of greaterrelative importance at each time, but are less stable from time to time, while genetice�ects are stable but of less relative importance. Thus, a moderate heritability andgeneral stability in genetic e�ects should not be construed as imposing phenotypicstability of immutability (Plomin, 1986).
384 N. L. Pedersen and C. A. Reynolds
# 1998 John Wiley & Sons, Ltd. Eur. J. Pers. 12, 365±386 (1998)
The extent to which individual rate of change is relevant to the discussion ofpersonality stability is a valid question: are there merely age related changes inpersonality levels while the relative ranking of individuals remains the same? Or isthere reliable variation in rate of change that could be studied in its own right? Arethere cohort di�erences in personality change? The analyses presented on linear rateof change by age group warrant further investigation. Yet to be addressed arestructural stability and change. Does the structure of personality dedi�erentiate assuggested for cognition in the oldest-old? Certainly, terminal drop or other develop-mental processes may moderate personality change towards the end of the lifespan.
ACKNOWLEDGEMENTS
The Swedish Adoption/Twin Study of Aging (SATSA) is supported in part by grantsfrom theMacArthur Foundation Network in Successful Aging, the National Instituteof Aging (AG 04563, AG 10175), and the Swedish Council for Social Research.
REFERENCES
Berg, S. (1996). `Aging, behavior, and terminal decline'. In: Birren, J.E. and Schaie, K.W. (Eds),Handbook of the Psychology of Aging, pp 323±337, Academic, San Diego.
Bouchard, T. J. (1994). `Genes, environment, and personality', Science, 264: 1700±1701.Cardon, L. R., Fulker, D. W., De Fries, J. C. and Plomin, R. (1992). `Continuity and change ingeneral cognitive ability from 1 to 7 years of age'. Developmental Psychology, 28: 64±73.
Cattell, R. B. (1947). `Con®rmation and clari®cation of primary personality factors', Psycho-metrika, 12: 197±220.
CederloÈ f, R. and Lorich, U. (1978). `The Swedish Twin Registry'. In: Nance, W.E., Allen, G.and Parisi, P. (Eds), Twin Research: Biology and Epidemiology, pp. 189±195, Liss, New York.
Conley, J. J. (1984). `Longitudinal consistency of adult personality: self-reported psychologicalcharacteristics across 45 years', Journal of Personality and Social Psychology, 47: 1325±1333.
Conley, J. J. (1985). `Longitudinal stability of personality traits: a multi-trait, multi-method,multi-occasion analysis', Journal of Personality and Social Psychology, 49: 1266±1282.
Costa, P. T., Jr. and McCrae, R. R. (1985). The NEO personality Inventory Manual, Psycho-logical Assessment Resources, Odessa, FL.
Costa, P. T., Jr., McCrae, R. R. and Arenberg, D. (1983). `Recent longitudinal research onpersonality and aging'. In: Schaie, K.W. (Ed), Longitudinal Studies of Adult PsychologicalDevelopment, Guilford, New York.
Dworkin, R. H., Burke, B. W., Maher, B. A. and Gottesman, I. I. (1976). `A longitudinal studyof the genetics of personality'. Journal of Personality and Social Psychology, 34: 510±518.
Eaves, L. J. and Eysenck, H. J. (1976). `Genetic and environmental components of incon-sistency and unrepeatability of twins' responses to a neuroticism questionnaire', BehaviorGenetics, 6, 145±160.
Eaves, L. J., Eysenck, H. J. and Martin, N. G. (1989). Genes, Culture and Personality,Academic, Berkeley, CA.
Eaves, L J., Silberg, J. L., Meyer, J. M., Maes, H. H., Simono�, E., Pickles, A., Rutter, M.,Neale, M. C., Reynolds, C. A., Erickson, M. T., Heath, A. C., Loeber, R., Truett, K. R. andHewitt, J. K. (1997). `Genetics and developmental psychopathology: 2. The main e�ects ofgenes and environment on behavioral problems in the Virginia Twin Study of AdolescentBehavioral Development', Journal of Child Psychology and Psychiatry, 38: 965±980.
Eysenck, H. J. (1991). `Dimensions of personality: 16, 5, or 3?Ðcriteria for a taxonomicparadigm', Personality and Individual Di�erences, 12: 773±790.
Farrer, L. A. (1987). `Genetic neurodegenerative disease models for human aging', Review ofBiological Research in Aging, 3: 163±189.
Stability and change in personality 385
# 1998 John Wiley & Sons, Ltd. Eur. J. Pers. 12, 365±386 (1998)
Finn, S. E. (1986). `Stability of personality self-ratings over 30 years: evidence for age/cohortinteraction', Journal of Personality and Social Psychology, 50: 813±818.
Floderus, B. (1974). `Psycho-social factors in relation to coronary heart disease and associatedrisk factors', Nordisk Hygienisk Tidskrif, Monograph Suppl 6: 1±148.
Floderus-Myrhed, B., Pedersen, N. and Rasmuson, I. (1980). `Assessment of heritability forpersonality, based on a short-form of the Eysenck Personality Inventory: a study of 12,989twin pairs', Behavior Genetics, 10: 153±162.
Giambra, L. M., Camp, C. J. and Grodsky, A. (1992). `Curiosity and stimulation seekingacross the adult life span: cross-sectional and 6 to 8 year longitudinal ®ndings', Psychologyand Aging, 7: 150±157.
Goldbetg, L. R. (1993). `The structure of phenotypic personality traits,' American Psych-ologist, 48: 26±34.
Grant, J. D., Pedersen, N., Whit®eld, K. E., Plomin, R. and McClearn, G. E. (1995).`Personality stability and change: a twenty year follow-up', The Gerontologist, 35: 112.
Haan, N., Millsap, R. and Hartka, E. (1986). `As time goes by: change and stability inpersonality over ®fty years,' Psychology and Aging, 1: 220±232.
Jones, C. J. and Meredith, W. (1996). `Patterns of personality change across the lifespan',Psychology and Aging, 11: 57±65.
Kelly, E. L. (1955). `Consistency of adult personality', American Psychologist, 10: 659±681.Kogan, N. (1990). `Personality and aging'. In: Birren, J.E. and Schaie, K.W. (Eds), Handbookof the Psychology of Aging, pp. 330ÿ 346, Academic, San Diego CA.
Loehlin, J. C. (1992).Genes and Environment in Personality Development, Sage, Newbury Park, CA.McCartney, K., Harris, M. J. and Bernieri, F. (1990). `Growing up and growing apart: adevelopmental meta-analysis of twin studies', Psychological Bulletin, 107: 226±237.
McArdle, J. J., Prescott, C. A., Hamagami, F., and Horn, J. L. (1998). `A contemporarymethod for developmental-genetic analyses of age changes in intellectual abilities', Develop-mental Neuropsychology, 14, 69±114.
Neale, M. C. (1995). Mx Statistical Modelling 3rd edn, Department of Psychiatry, MCV,Richmond, VA.
Neale, M. C. and Cardon, L. R. (1992). Methodology for Genetic Studies of Twins andFamilies, Kluwer, London.
Nelson, E. A. and Dannefer, D. (1992). `Aged heterogeneity: fact or ®ction? The fate ofdiversity in gerontological research', The Gerontologist, 32: 17±23.
Neugarten, B. L. (1977). `Personality and aging'. In: Birren, J. E. and Schaie, K. W. (Eds),Handbook of the Psychology of Aging, pp. 626±649, Van Nostrand Reinhold, New York.
Paigen, K. (1980). `Temporal genes and other developmental regulators in mammals',In: Leighten, T. and Loomis, W.F. (Eds), The Molecular Genetics of Development pp. 419±471, Academic, New York.
Pedersen, N. L. (1993). `Genetic and environmental continuity and change in personality'.In: Bouchard, T. J. Jr. and Propping, P. (Eds), Twins as a Tool of Behavioral Genetics,pp. 147±162, Wiley, New York.
Pedersen, N. L. (1994). `The nature and nurture of personality'. In: De Raad, B., Hofstee,W.K.B. and Van Heck, G.L. (Eds), Personality Psychology in Europe, pp. 110±132, TilburgUniversity Press, Tilburg.
Pedersen, N. L., McClearn, G. E., Plomin, R., Nesselroade, J. R., Berg, S. and deFaire,U. (1991). `The Swedish Adoption Twin Study of Aging: an update', Acta Genetica Medicaeet Gemmellologiae 40: 7±20.
Pedersen, N. L., Plomin, R., McClearn, G. E. and Friberg, L. (1988). `Neuroticism,extraversion, and related traits in adult twins reared apart and reared together', Journal ofPersonality and Social Psychology, 55: 950±957.
Plomin, R. (1986). Development, Genetics and Psychology, Erlbaum, Hillsdale, NJ.Pogue±Geile, M. F. and Rose, R. J. (1985). `Developmental genetic studies of adultpersonality', Developmental Psychology, 21: 547±557.
SAS Institute (1995). The SAS System for Windows (Version 6.11), SAS Institute, Cary, NC.Viken, R. J., Rose, R. J., Kaprio, J. and Koskenvuo, M. (1994). `A developmental geneticanalysis of adult personality: extraversion and neuroticism from 18 to 59 years of age',Journal of Personality and Social Psychology, 66: 722±730.
386 N. L. Pedersen and C. A. Reynolds
# 1998 John Wiley & Sons, Ltd. Eur. J. Pers. 12, 365±386 (1998)