Embed Size (px)
Citation preview
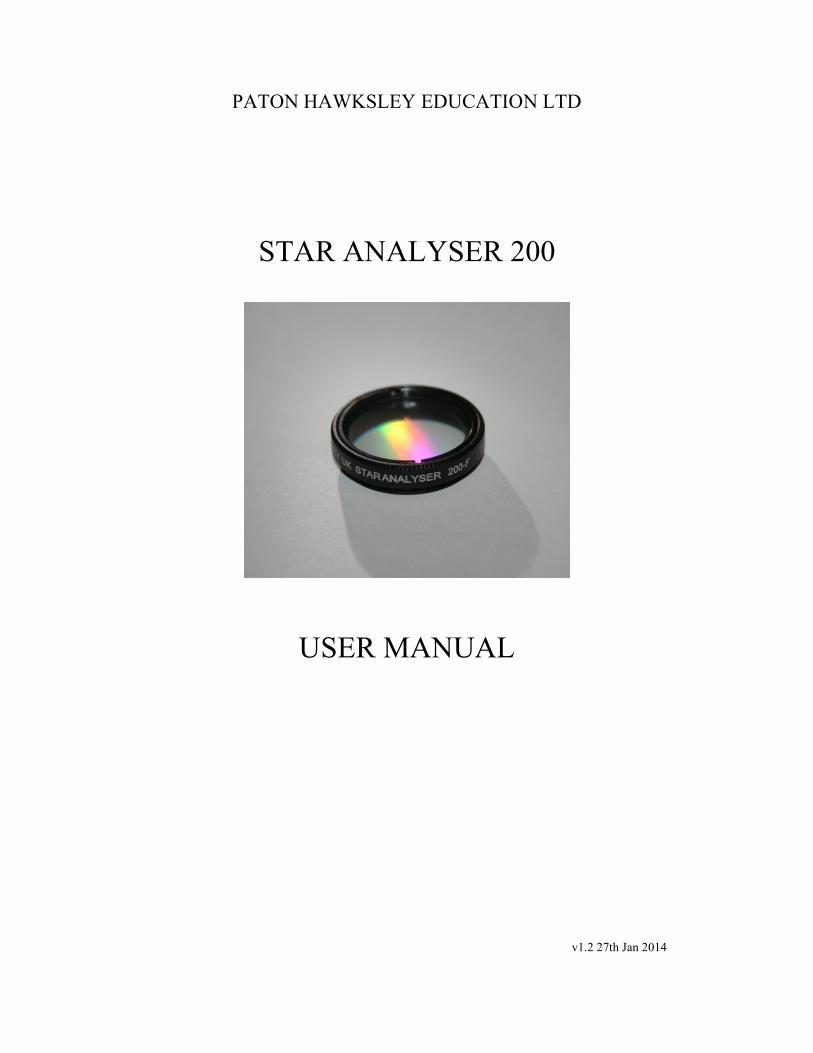
PATON HAWKSLEY EDUCATION LTD
STAR ANALYSER 200
USER MANUAL
v1.2 27th Jan 2014
CONTENTS
INSTRUCTIONS
Description
Care and maintenance
A quick look
Mounting the Star Analyser 200
First light
Troubleshooting
Processing
Wavelength Calibration
Displaying the results graphically
Tips for recording spectra of faint objects
Visual Use
Further advice and information
FREQUENTLY ASKED QUESTIONS
APPENDIX I
BRIGHT STAR SPECTRAL TYPES
APPENDIX II
TWENTY BRIGHTEST WOLF RAYET STARS
APPENDIX III
TELLURIC LINES (O2)
APPENDIX IV
HYDROGEN BALMER LINES
APPENDIX V
“INTRODUCING THE STAR ANALYSER 200”
STAR ANALYSER 200
INSTRUCTIONS
Description
The Star Analyser 200 is a high efficiency 200 lines/mm transmission diffraction
grating, blazed in the first order. It is mounted in a low profile 1.25 inch diameter
threaded cell, to be compatible with most telescopes and accessories. It has been
designed to make the production of low resolution spectrum images of a wide range
of point like astronomical objects as easy as possible. It complements a wide range of
types of camera used in astro-imaging. It can however also be adapted for visual use.
It is designed primarily for applications where it is difficult to achieve the optimum
spacing needed for the Star Analyser 100. The SA200 gives the same length of
spectrum when mounted half the distance from the camera sensor compared with the
SA100 (Note that where there is sufficient space to achieve the optimum spacing, the
SA100 model is the recommended option)
Typical applications of the SA200 are:
Mounting in close coupled filter wheels (The smaller distance requirement, low
profile design and optional mounting kit allow the SA200 to be accommodated in a
wider range of filter wheels than the SA100)
With larger aperture, longer focal length telescopes used with larger camera sensors
where a longer spectrum can be produced using the SA200 to give
optimum resolution.
See also Appendix V “Introducing the Star Analyser 200”
for further technical information on the SA200
Care and maintenance
The Star Analyser has been designed and built to give many years of trouble free
service. It cannot be dismantled by the user. To protect the delicate diffraction grating
surface, it has been sealed between anti-reflection coated glass cover discs. The
sealed unit is fixed in the cell in the correct alignment.
As with any optical device, care should be taken to protect the optical surfaces. It
should be stored in its protective box when not in use. (After use, any dew which may
have condensed on the device should be allowed to evaporate before closing the box)
Avoid touching the glass. Any dust should be removed with a blower brush or clean
oil free canned air. More stubborn marks and fingerprints can be removed with care
using conventional lens cleaning techniques. (Lens cleaning fluids should be used
very sparingly to avoid the risk of seepage of the fluid between the glass elements)
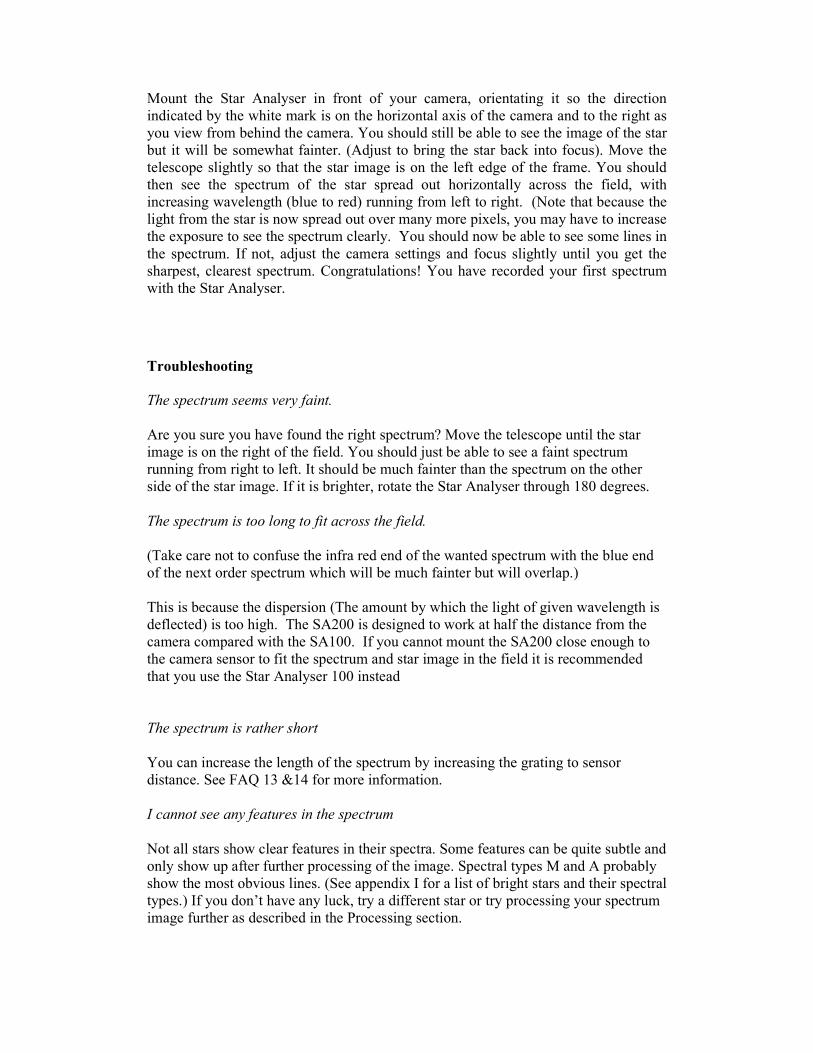
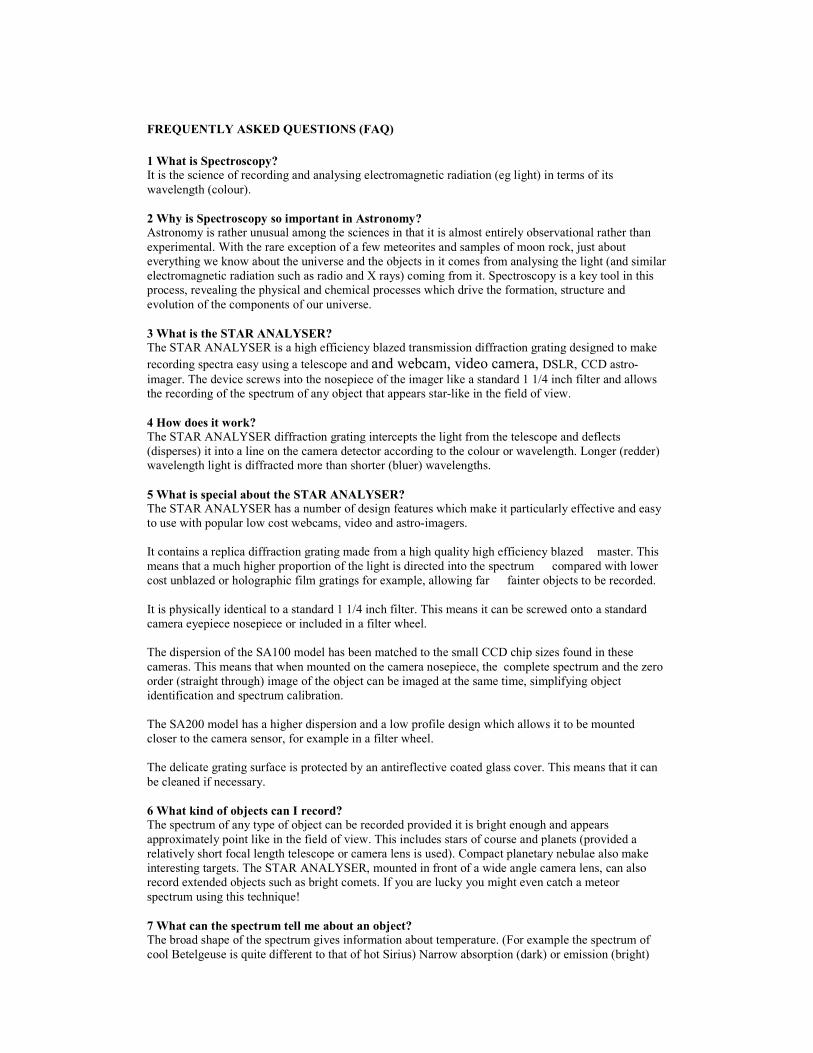
A quick look
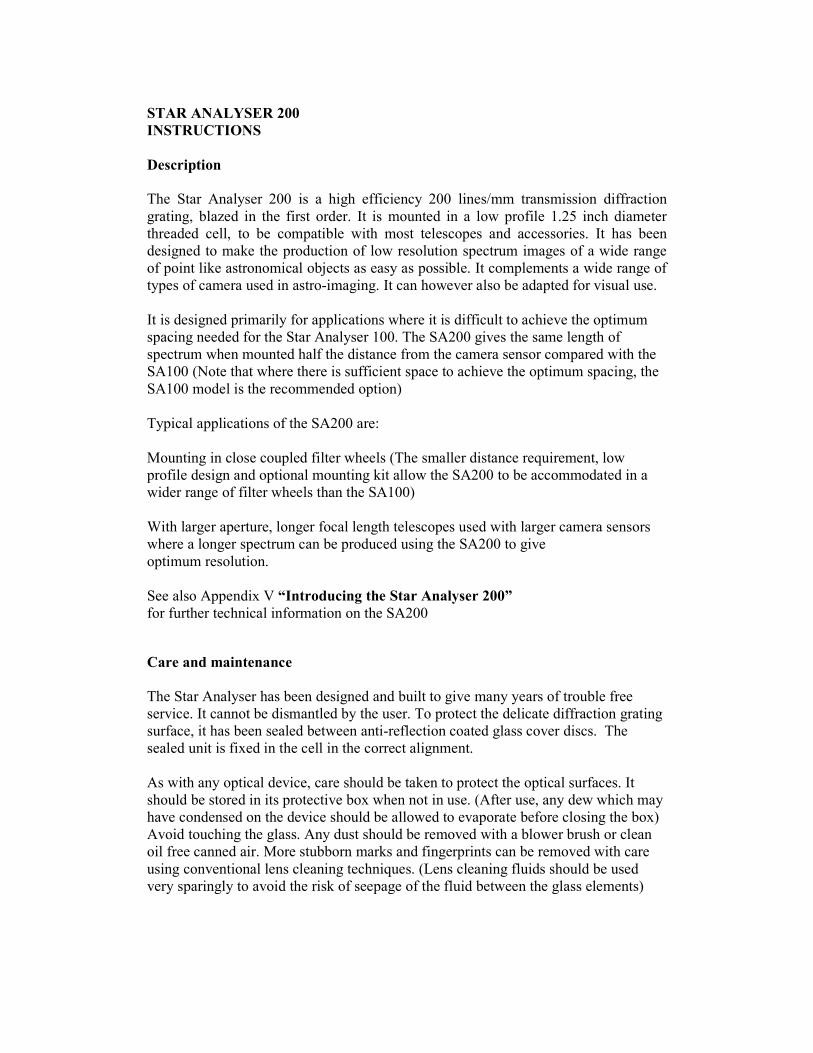
If you hold the Star Analyser up to you eye and view
a compact source of white light through it, you will
see the light source flanked by a series of rainbow
spectra, stretching away in both directions. One of
the pair of spectra closest to the light source will
look significantly brighter than the others. This is the
blazed first order spectrum and is the one we are
aiming to image, along with the straight through
view of the light source (the zero order) If you look
at the edge of the filter cell, you will see a white line
marking the direction of the blazed first order. This
will help identify the right spectrum and line it up in
the field of view of your camera.
Mounting the Star Analyser 200
General
The SA200 uses a standard 1.25 inch filter cell design and is mounted between the
telescope and camera at the recommended distance from the camera sensor using
standard adapters. (See FAQ 13 and 14 to calculate the recommended distance for
your particular setup) Orientate the grating so the direction indicated by the white
mark is on the horizontal axis of the camera and to the right as you view from behind
the camera.
Mounting in filter wheels
The SA200-F has a significantly lower profile than the SA100 (7.7mm total height
including thread compared with 11.2mm for the SA100) which allows it to be
mounted in filter wheels designed for 1.25 inch filters without risk of fouling the
wheel housing. (Note that the low profile design means that, unlike the SA100, there
is no thread available above the grating to screw on other accessories.) The SA200-F
can be aligned with the camera sensor and held in the correct orientation for example
with PTFE tape on the thread or a spot of hot melt adhesive.
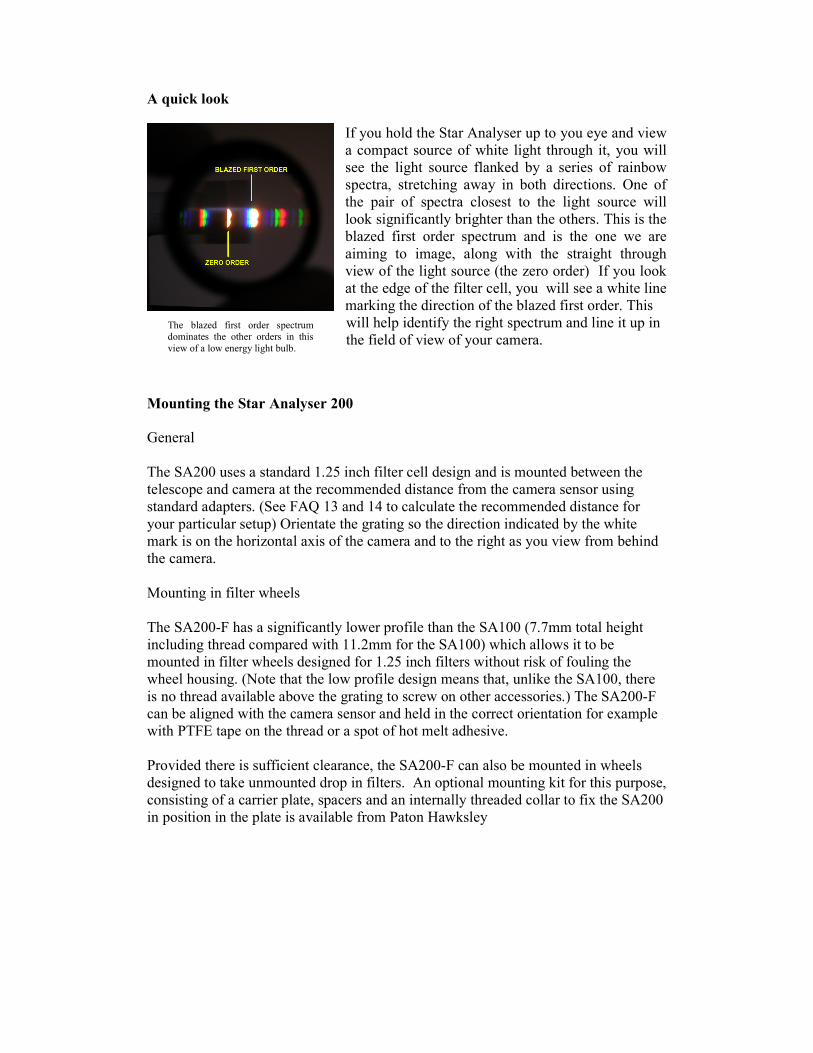
Provided there is sufficient clearance, the SA200-F can also be mounted in wheels
designed to take unmounted drop in filters. An optional mounting kit for this purpose,
consisting of a carrier plate, spacers and an internally threaded collar to fix the SA200
in position in the plate is available from Paton Hawksley
The blazed first order spectrum
dominates the other orders in this
view of a low energy light bulb.
The pre-punched 1mm thick black styrene carrier plate is trimmed to size using a craft
knife (score and snap) or scissors to match the filter size used in the wheel (eg 50mm
square, 2 inches round etc) and the SA200 mounted through the pre punched hole,
orientated and fixed in position using the threaded collar. Additional spacers of the
same material, supplied pre-punched with oversized holes can be added above or
below the carrier plate as required to increase the total thickness and place the SA200
at the optimum height to clear the wheel housing. It is even feasible to fabricate a
carrier which lowers the position of the SA200 below that shown here if necessary, by
laminating the material (bonded using polystyrene cement). As a result, provided a
clearance of at least 7.7mm (The total height of the SA200) is available within the
filter wheel it should be possible to fabricate a suitable carrier. Users are advised to
check their particular model of filter wheel to ensure there is enough clearance.
Tip:- To ensure a good fit when trimming the plates to size, first make a template
using backed label paper and check it fits correctly in the filter wheel. Then stick the
label centrally onto the plate and trim round it.
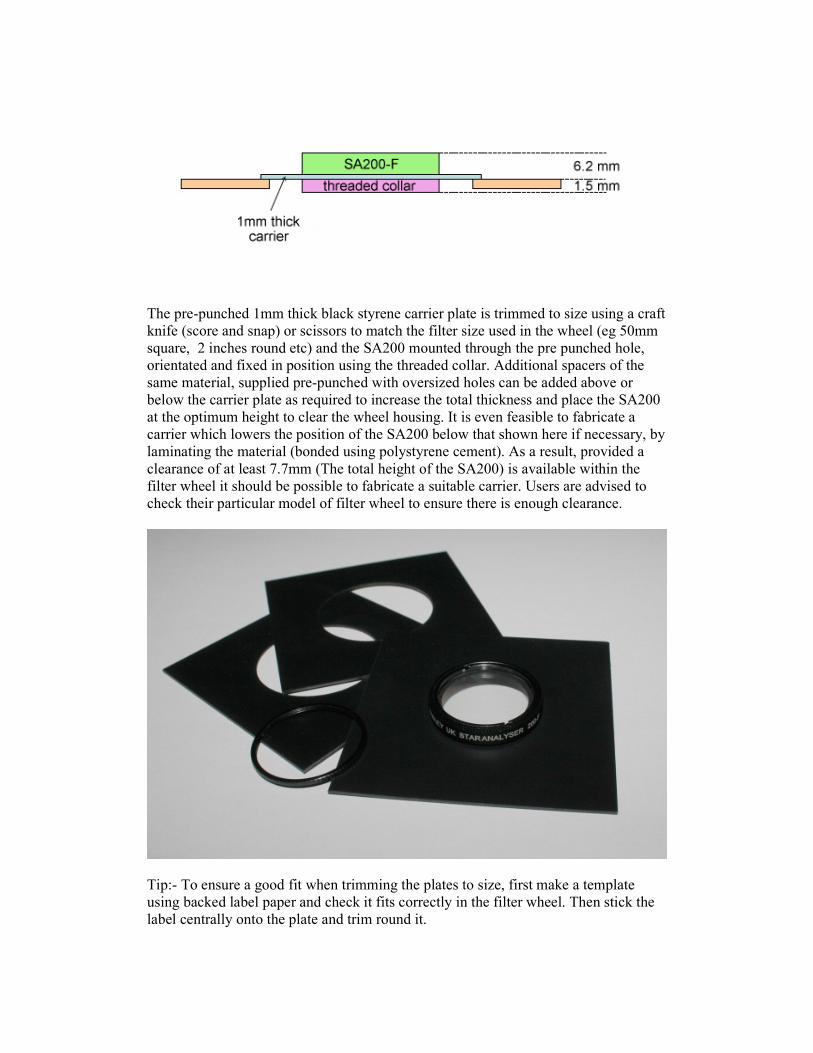
A similar technique can also be used to mount the SA200-F in a (user supplied) blank
2 inch filter cell for wheels designed for 2 inch screw in filters.
(Note that, since the light cone from the star is only dispersed into a spectrum beyond
the grating, any vignetting of the field due to the smaller aperture of the SA200,
compared with filters used for imaging, is not a problem provided the zero order
image of the star is placed within the unvignetted area.)
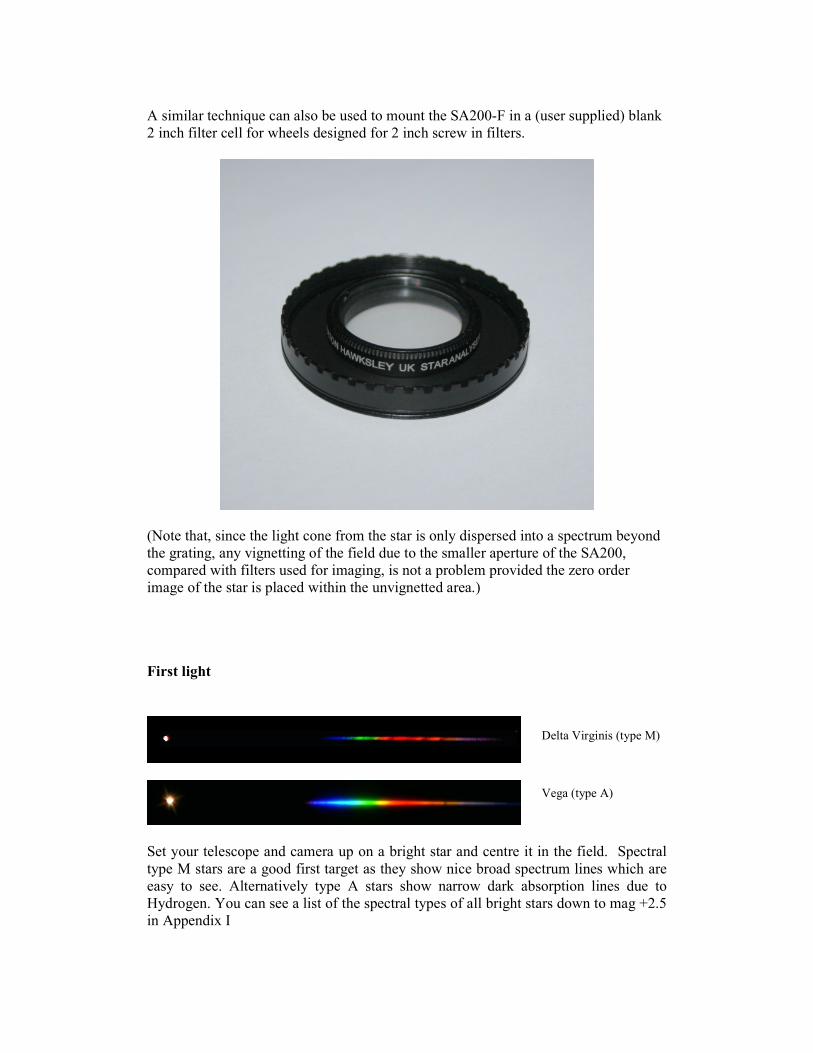
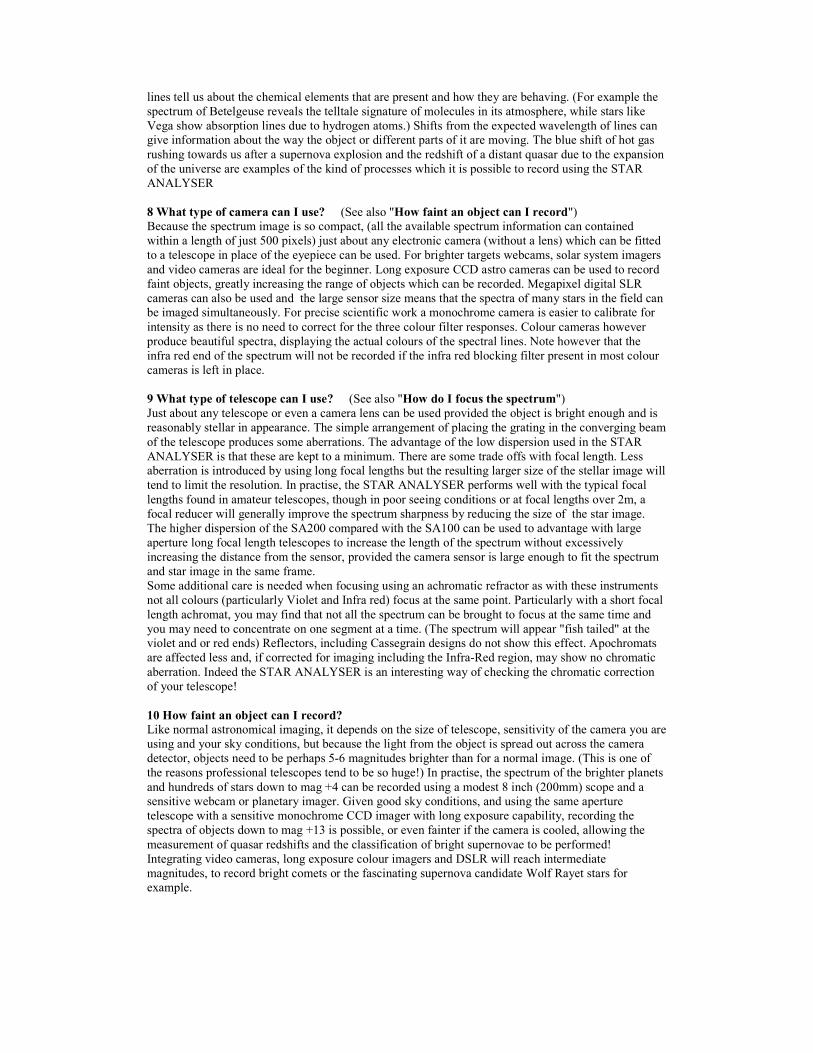
First light
Set your telescope and camera up on a bright star and centre it in the field. Spectral
type M stars are a good first target as they show nice broad spectrum lines which are
easy to see. Alternatively type A stars show narrow dark absorption lines due to
Hydrogen. You can see a list of the spectral types of all bright stars down to mag +2.5
in Appendix I
Delta Virginis (type M)
Vega (type A)
Mount the Star Analyser in front of your camera, orientating it so the direction
indicated by the white mark is on the horizontal axis of the camera and to the right as
you view from behind the camera. You should still be able to see the image of the star
but it will be somewhat fainter. (Adjust to bring the star back into focus). Move the
telescope slightly so that the star image is on the left edge of the frame. You should
then see the spectrum of the star spread out horizontally across the field, with
increasing wavelength (blue to red) running from left to right. (Note that because the
light from the star is now spread out over many more pixels, you may have to increase
the exposure to see the spectrum clearly. You should now be able to see some lines in
the spectrum. If not, adjust the camera settings and focus slightly until you get the
sharpest, clearest spectrum. Congratulations! You have recorded your first spectrum
with the Star Analyser.
Troubleshooting
The spectrum seems very faint.
Are you sure you have found the right spectrum? Move the telescope until the star
image is on the right of the field. You should just be able to see a faint spectrum
running from right to left. It should be much fainter than the spectrum on the other
side of the star image. If it is brighter, rotate the Star Analyser through 180 degrees.
The spectrum is too long to fit across the field.
(Take care not to confuse the infra red end of the wanted spectrum with the blue end
of the next order spectrum which will be much fainter but will overlap.)
This is because the dispersion (The amount by which the light of given wavelength is
deflected) is too high. The SA200 is designed to work at half the distance from the
camera compared with the SA100. If you cannot mount the SA200 close enough to
the camera sensor to fit the spectrum and star image in the field it is recommended
that you use the Star Analyser 100 instead
The spectrum is rather short
You can increase the length of the spectrum by increasing the grating to sensor
distance. See FAQ 13 &14 for more information.
I cannot see any features in the spectrum
Not all stars show clear features in their spectra. Some features can be quite subtle and
only show up after further processing of the image. Spectral types M and A probably
show the most obvious lines. (See appendix I for a list of bright stars and their spectral
types.) If you don’t have any luck, try a different star or try processing your spectrum
image further as described in the Processing section.
The features are indistinct and smeared out
This simple type of slitless spectrograph depends on the target being almost a point
source. If it is not (for example if the seeing is bad or you are using a long focal
length) then sharp features in the spectrum can be smeared out and become indistinct.
Particularly if you are using a focal length of over 2m, a focal reducer will often help
to sharpen the spectrum features.
I cannot focus all positions along the spectrum at the same time.
There will be a slight shift in focus due to the increasing angle of the light beam from
blue to red so you may find you have to compromise focus slightly at the far ends of
the spectrum. If you are using an achromatic refractor, the focus errors will be larger
due to chromatic aberration of the telescope. Particularly with short focal length
achromats, you may find you can only focus part of the spectrum at a time. See the
FAQ for more information on focussing and other factors which affect resolution.
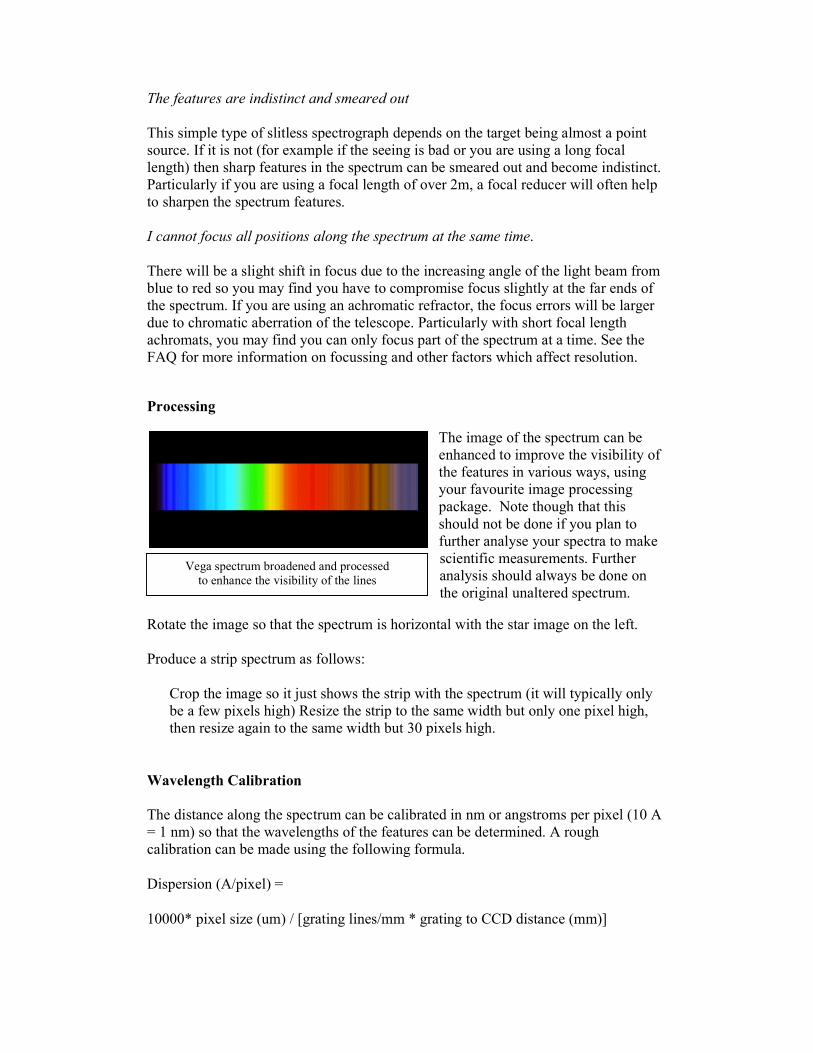
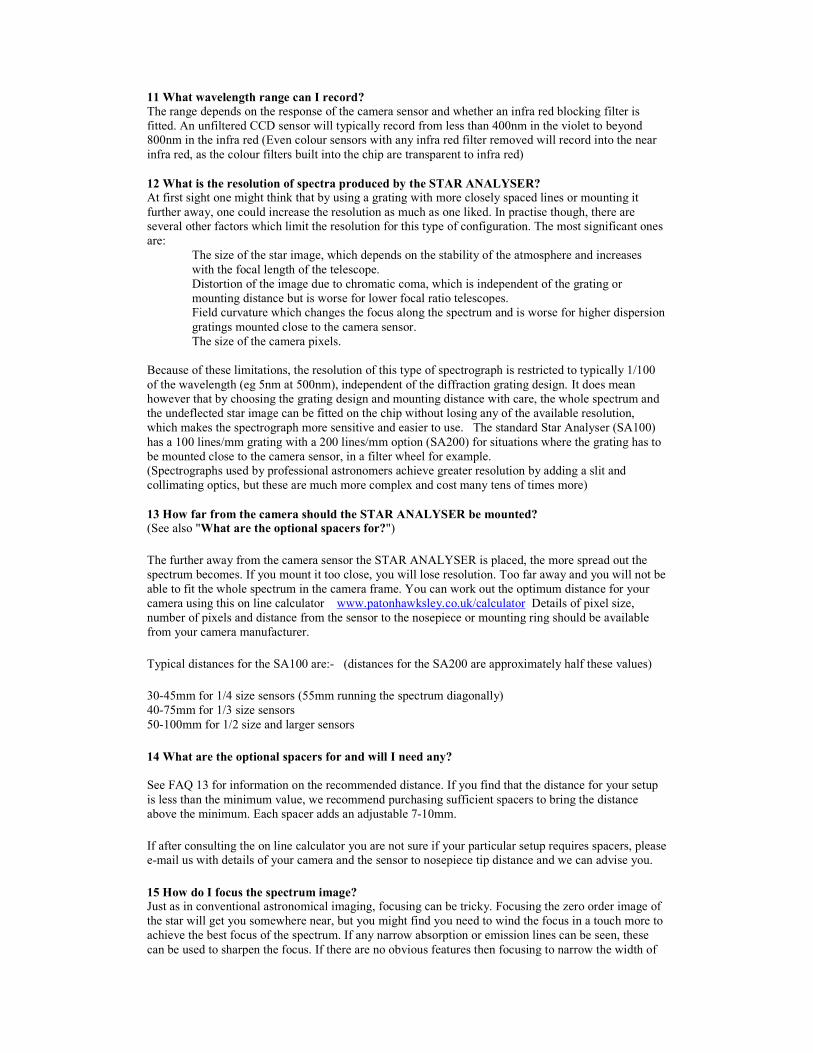
Processing
The image of the spectrum can be
enhanced to improve the visibility of
the features in various ways, using
your favourite image processing
package. Note though that this
should not be done if you plan to
further analyse your spectra to make
scientific measurements. Further
analysis should always be done on
the original unaltered spectrum.
Rotate the image so that the spectrum is horizontal with the star image on the left.
Produce a strip spectrum as follows:
Crop the image so it just shows the strip with the spectrum (it will typically only
be a few pixels high) Resize the strip to the same width but only one pixel high,
then resize again to the same width but 30 pixels high.
Wavelength Calibration
The distance along the spectrum can be calibrated in nm or angstroms per pixel (10 A
= 1 nm) so that the wavelengths of the features can be determined. A rough
calibration can be made using the following formula.
Dispersion (A/pixel) =
10000* pixel size (um) / [grating lines/mm * grating to CCD distance (mm)]
Vega spectrum broadened and processed
to enhance the visibility of the lines
e.g. for the Star Analyser 200 at 30 mm distance from a camera with 6um pixels, the
dispersion would be
10000 * 6 / [ 200 * 30] = 10 A/pixel
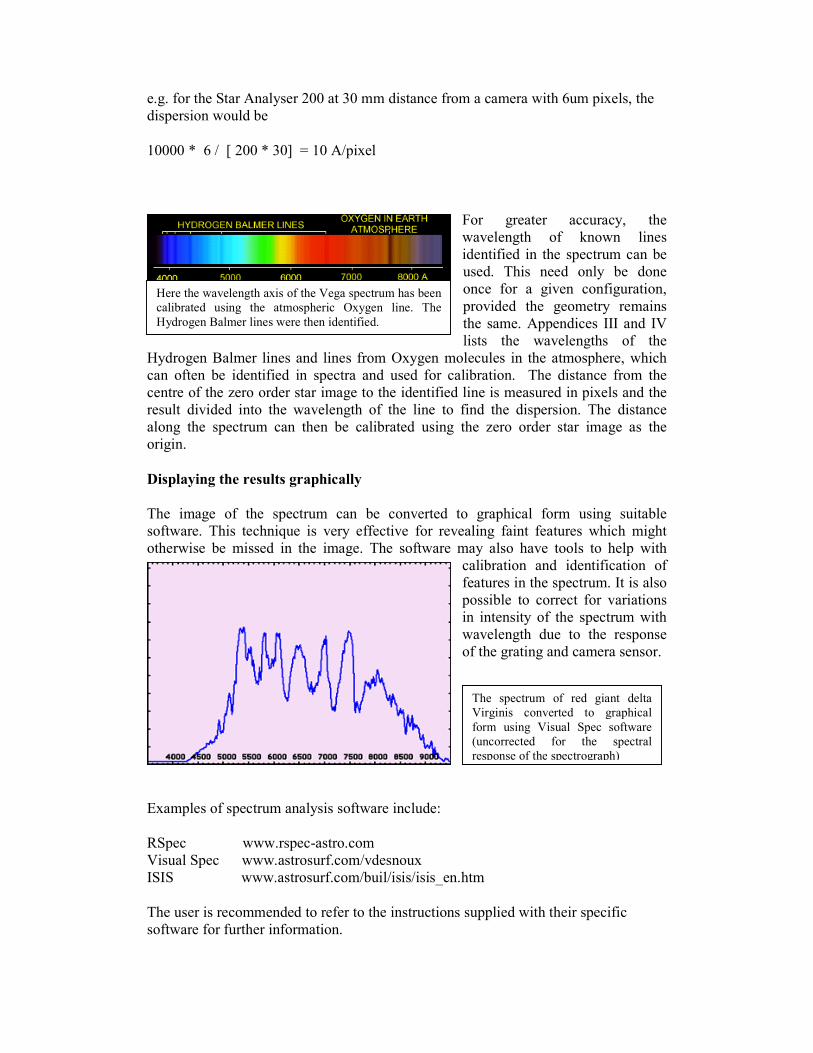
For greater accuracy, the
wavelength of known lines
identified in the spectrum can be
used. This need only be done
once for a given configuration,
provided the geometry remains
the same. Appendices III and IV
lists the wavelengths of the
Hydrogen Balmer lines and lines from Oxygen molecules in the atmosphere, which
can often be identified in spectra and used for calibration. The distance from the
centre of the zero order star image to the identified line is measured in pixels and the
result divided into the wavelength of the line to find the dispersion. The distance
along the spectrum can then be calibrated using the zero order star image as the
origin.
Displaying the results graphically
The image of the spectrum can be converted to graphical form using suitable
software. This technique is very effective for revealing faint features which might
otherwise be missed in the image. The software may also have tools to help with
calibration and identification of
features in the spectrum. It is also
possible to correct for variations
in intensity of the spectrum with
wavelength due to the response
of the grating and camera sensor.
Examples of spectrum analysis software include:
RSpec www.rspec-astro.com
Visual Spec www.astrosurf.com/vdesnoux
ISIS www.astrosurf.com/buil/isis/isis_en.htm
The user is recommended to refer to the instructions supplied with their specific
software for further information.
Here the wavelength axis of the Vega spectrum has been
calibrated using the atmospheric Oxygen line. The
Hydrogen Balmer lines were then identified.
The spectrum of red giant delta
Virginis converted to graphical
form using Visual Spec software
(uncorrected for the spectral
response of the spectrograph)
Tips for recording spectra of faint objects
Before imaging a faint object, set up and focus on a bright A type star first. The
spectrum produced can also be used as a calibration check.
In crowded star fields, unwanted star and spectrum images can interfere with the
spectrum you want to record. Rotate the camera so that the spectrum misses them.
If you have trouble with star trailing on long exposures, orientate the grating so that
the spectrum is at 90deg to the direction of drift. This will prevent the drift blurring
the spectrum.
Visual Use
The Star Analyser can be fitted directly to the bottom of an eyepiece threaded for
filters. The length of spectrum can be increased by increasing the distance between
the Star Analyser and the eyepiece. This can be accomplished for example by
attaching the Star Analyser to the incoming end of a star diagonal. Note that these
configurations require increased inward travel of the focuser, which may not be
available with some telescopes, particularly Newtonians.
Further advice and information
There is an on line community of Star Analyser users where you can get advice,
exchange ideas and share results at http://groups.yahoo.com/group/staranalyser.
FREQUENTLY ASKED QUESTIONS (FAQ)
1 What is Spectroscopy?
It is the science of recording and analysing electromagnetic radiation (eg light) in terms of its
wavelength (colour).
2 Why is Spectroscopy so important in Astronomy?
Astronomy is rather unusual among the sciences in that it is almost entirely observational rather than
experimental. With the rare exception of a few meteorites and samples of moon rock, just about
everything we know about the universe and the objects in it comes from analysing the light (and similar
electromagnetic radiation such as radio and X rays) coming from it. Spectroscopy is a key tool in this
process, revealing the physical and chemical processes which drive the formation, structure and
evolution of the components of our universe.
3 What is the STAR ANALYSER?
The STAR ANALYSER is a high efficiency blazed transmission diffraction grating designed to make
recording spectra easy using a telescope and and webcam, video camera, DSLR, CCD astro-
imager. The device screws into the nosepiece of the imager like a standard 1 1/4 inch filter and allows
the recording of the spectrum of any object that appears star-like in the field of view.
4 How does it work?
The STAR ANALYSER diffraction grating intercepts the light from the telescope and deflects
(disperses) it into a line on the camera detector according to the colour or wavelength. Longer (redder)
wavelength light is diffracted more than shorter (bluer) wavelengths.
5 What is special about the STAR ANALYSER?
The STAR ANALYSER has a number of design features which make it particularly effective and easy
to use with popular low cost webcams, video and astro-imagers.
It contains a replica diffraction grating made from a high quality high efficiency blazed master. This
means that a much higher proportion of the light is directed into the spectrum compared with lower
cost unblazed or holographic film gratings for example, allowing far fainter objects to be recorded.
It is physically identical to a standard 1 1/4 inch filter. This means it can be screwed onto a standard
camera eyepiece nosepiece or included in a filter wheel.
The dispersion of the SA100 model has been matched to the small CCD chip sizes found in these
cameras. This means that when mounted on the camera nosepiece, the complete spectrum and the zero
order (straight through) image of the object can be imaged at the same time, simplifying object
identification and spectrum calibration.
The SA200 model has a higher dispersion and a low profile design which allows it to be mounted
closer to the camera sensor, for example in a filter wheel.
The delicate grating surface is protected by an antireflective coated glass cover. This means that it can
be cleaned if necessary.
6 What kind of objects can I record?
The spectrum of any type of object can be recorded provided it is bright enough and appears
approximately point like in the field of view. This includes stars of course and planets (provided a
relatively short focal length telescope or camera lens is used). Compact planetary nebulae also make
interesting targets. The STAR ANALYSER, mounted in front of a wide angle camera lens, can also
record extended objects such as bright comets. If you are lucky you might even catch a meteor
spectrum using this technique!
7 What can the spectrum tell me about an object?
The broad shape of the spectrum gives information about temperature. (For example the spectrum of
cool Betelgeuse is quite different to that of hot Sirius) Narrow absorption (dark) or emission (bright)
lines tell us about the chemical elements that are present and how they are behaving. (For example the
spectrum of Betelgeuse reveals the telltale signature of molecules in its atmosphere, while stars like
Vega show absorption lines due to hydrogen atoms.) Shifts from the expected wavelength of lines can
give information about the way the object or different parts of it are moving. The blue shift of hot gas
rushing towards us after a supernova explosion and the redshift of a distant quasar due to the expansion
of the universe are examples of the kind of processes which it is possible to record using the STAR
ANALYSER
8 What type of camera can I use? (See also "How faint an object can I record")
Because the spectrum image is so compact, (all the available spectrum information can contained
within a length of just 500 pixels) just about any electronic camera (without a lens) which can be fitted
to a telescope in place of the eyepiece can be used. For brighter targets webcams, solar system imagers
and video cameras are ideal for the beginner. Long exposure CCD astro cameras can be used to record
faint objects, greatly increasing the range of objects which can be recorded. Megapixel digital SLR
cameras can also be used and the large sensor size means that the spectra of many stars in the field can
be imaged simultaneously. For precise scientific work a monochrome camera is easier to calibrate for
intensity as there is no need to correct for the three colour filter responses. Colour cameras however
produce beautiful spectra, displaying the actual colours of the spectral lines. Note however that the
infra red end of the spectrum will not be recorded if the infra red blocking filter present in most colour
cameras is left in place.
9 What type of telescope can I use? (See also "How do I focus the spectrum")
Just about any telescope or even a camera lens can be used provided the object is bright enough and is
reasonably stellar in appearance. The simple arrangement of placing the grating in the converging beam
of the telescope produces some aberrations. The advantage of the low dispersion used in the STAR
ANALYSER is that these are kept to a minimum. There are some trade offs with focal length. Less
aberration is introduced by using long focal lengths but the resulting larger size of the stellar image will
tend to limit the resolution. In practise, the STAR ANALYSER performs well with the typical focal
lengths found in amateur telescopes, though in poor seeing conditions or at focal lengths over 2m, a
focal reducer will generally improve the spectrum sharpness by reducing the size of the star image.
The higher dispersion of the SA200 compared with the SA100 can be used to advantage with large
aperture long focal length telescopes to increase the length of the spectrum without excessively
increasing the distance from the sensor, provided the camera sensor is large enough to fit the spectrum
and star image in the same frame.
Some additional care is needed when focusing using an achromatic refractor as with these instruments
not all colours (particularly Violet and Infra red) focus at the same point. Particularly with a short focal
length achromat, you may find that not all the spectrum can be brought to focus at the same time and
you may need to concentrate on one segment at a time. (The spectrum will appear "fish tailed" at the
violet and or red ends) Reflectors, including Cassegrain designs do not show this effect. Apochromats
are affected less and, if corrected for imaging including the Infra-Red region, may show no chromatic
aberration. Indeed the STAR ANALYSER is an interesting way of checking the chromatic correction
of your telescope!
10 How faint an object can I record?
Like normal astronomical imaging, it depends on the size of telescope, sensitivity of the camera you are
using and your sky conditions, but because the light from the object is spread out across the camera
detector, objects need to be perhaps 5-6 magnitudes brighter than for a normal image. (This is one of
the reasons professional telescopes tend to be so huge!) In practise, the spectrum of the brighter planets
and hundreds of stars down to mag +4 can be recorded using a modest 8 inch (200mm) scope and a
sensitive webcam or planetary imager. Given good sky conditions, and using the same aperture
telescope with a sensitive monochrome CCD imager with long exposure capability, recording the
spectra of objects down to mag +13 is possible, or even fainter if the camera is cooled, allowing the
measurement of quasar redshifts and the classification of bright supernovae to be performed!
Integrating video cameras, long exposure colour imagers and DSLR will reach intermediate
magnitudes, to record bright comets or the fascinating supernova candidate Wolf Rayet stars for
example.
11 What wavelength range can I record?
The range depends on the response of the camera sensor and whether an infra red blocking filter is
fitted. An unfiltered CCD sensor will typically record from less than 400nm in the violet to beyond
800nm in the infra red (Even colour sensors with any infra red filter removed will record into the near
infra red, as the colour filters built into the chip are transparent to infra red)
12 What is the resolution of spectra produced by the STAR ANALYSER?
At first sight one might think that by using a grating with more closely spaced lines or mounting it
further away, one could increase the resolution as much as one liked. In practise though, there are
several other factors which limit the resolution for this type of configuration. The most significant ones
are:
The size of the star image, which depends on the stability of the atmosphere and increases
with the focal length of the telescope.
Distortion of the image due to chromatic coma, which is independent of the grating or
mounting distance but is worse for lower focal ratio telescopes.
Field curvature which changes the focus along the spectrum and is worse for higher dispersion
gratings mounted close to the camera sensor.
The size of the camera pixels.
Because of these limitations, the resolution of this type of spectrograph is restricted to typically 1/100
of the wavelength (eg 5nm at 500nm), independent of the diffraction grating design. It does mean
however that by choosing the grating design and mounting distance with care, the whole spectrum and
the undeflected star image can be fitted on the chip without losing any of the available resolution,
which makes the spectrograph more sensitive and easier to use. The standard Star Analyser (SA100)
has a 100 lines/mm grating with a 200 lines/mm option (SA200) for situations where the grating has to
be mounted close to the camera sensor, in a filter wheel for example.
(Spectrographs used by professional astronomers achieve greater resolution by adding a slit and
collimating optics, but these are much more complex and cost many tens of times more)
13 How far from the camera should the STAR ANALYSER be mounted?
(See also "What are the optional spacers for?")
The further away from the camera sensor the STAR ANALYSER is placed, the more spread out the
spectrum becomes. If you mount it too close, you will lose resolution. Too far away and you will not be
able to fit the whole spectrum in the camera frame. You can work out the optimum distance for your
camera using this on line calculator www.patonhawksley.co.uk/calculator Details of pixel size,
number of pixels and distance from the sensor to the nosepiece or mounting ring should be available
from your camera manufacturer.
Typical distances for the SA100 are:- (distances for the SA200 are approximately half these values)
30-45mm for 1/4 size sensors (55mm running the spectrum diagonally)
40-75mm for 1/3 size sensors
50-100mm for 1/2 size and larger sensors
14 What are the optional spacers for and will I need any?
See FAQ 13 for information on the recommended distance. If you find that the distance for your setup
is less than the minimum value, we recommend purchasing sufficient spacers to bring the distance
above the minimum. Each spacer adds an adjustable 7-10mm.
If after consulting the on line calculator you are not sure if your particular setup requires spacers, please
e-mail us with details of your camera and the sensor to nosepiece tip distance and we can advise you.
15 How do I focus the spectrum image?
Just as in conventional astronomical imaging, focusing can be tricky. Focusing the zero order image of
the star will get you somewhere near, but you might find you need to wind the focus in a touch more to
achieve the best focus of the spectrum. If any narrow absorption or emission lines can be seen, these
can be used to sharpen the focus. If there are no obvious features then focusing to narrow the width of
the line can get you nearer. Once you have good focus, it can be useful to note for future reference how
much the focuser had to be moved compared with the zero order star image focus point. (Note that it
may not be possible to obtain good focus at all wavelengths simultaneously when using an achromatic
refractor due to the telescope design)
16 How can I turn my narrow spectrum image into a wide strip?
Many image processing programs have all you need.
First rotate your spectrum image so it is horizontal and crop the image so it just shows the
strip with the spectrum (it will typically only be a few pixels high)
Resize the strip to the same width but only one pixel high, then resize again to the same width
but 30 pixels high and voila! A professional looking strip spectrum which will make the
spectral lines much easier to see.
17 How can I calibrate my spectrum?
The STAR ANALYSER has been designed to make calibration as easy as possible. With most
configurations you will be able to capture the image of the star as well as the spectrum in the same
frame. The star image is your zero point. Because the dispersion of the STAR ANALYSER is low, the
wavelength is essentially proportional to the distance along the spectrum. (Note that this is not true for
higher dispersion designs used in the same configuration and is a particular problem for prism based
spectrometers) All you have to do is measure the number of pixels from the centre of the star image to
a feature of known wavelength in the image (eg a Hydrogen Balmer line in a star such as Vega or a
Telluric line due to the earth's atmosphere, which can be seen in many spectra). If you divide the
wavelength by the number of pixels, you have a calibration constant (in angstroms per pixel or nm per
pixel) which can be used for all your measurements provided you do not change your setup.
18 How can I convert my spectrum into a graph? There are commercial and freeware programs which can take the image of a spectrum, measure the
pixel values along the line and convert them into a graph or a data file for use in a spreadsheet. Some
also have functions to aid calibration and analysis of your spectrum.
Examples of spectrum analysis software include.
RSpec http://www.rspec-astro.com
Visual Spec http://www.astrosurf.com/vdesnoux
ISIS http://www.astrosurf.com/buil/isis/isis_en.htm
19 Can I use the STAR ANALYSER for visual observations?
Yes, though the length of the spectrum will be rather short unless you can mount the STAR
ANALYSER some distance before the eyepiece. (Note: The SA200 will give a 2x longer spectrum
compared with the SA100) This can be achieved for example by screwing it into the ingoing side of a
diagonal threaded for filters. (Note that achieving sufficient distance may be a problem with some
telescopes, particularly Newtonians where inward focus travel tends to be limited) A cylindrical lens
fixed over the eyepiece can be useful to spread the width of the spectrum and make the lines more
visible. Tapping the eyepiece sometimes produces a similar effect.
20. Where can I share my results with other users or get advice?
You can get support by e-mailing us or alternatively, why not join the Yahoo group “staranalyser”
where you can get support, meet other users and share and discuss your results!
21 Can I take spectra of stars without a telescope using a DSLR camera?
It is possible to take spectra of bright stars just by mounting the Star Analyser in front of a Digital SLR
camera lens. Best results are with the camera mounted on a tracking mount but spectra of the brightest
stars can even be recorded using a camera on as fixed tripod. See this link for more information on this
technique
http://www.threehillsobservatory.co.uk/astro/spectroscopy_11.htm
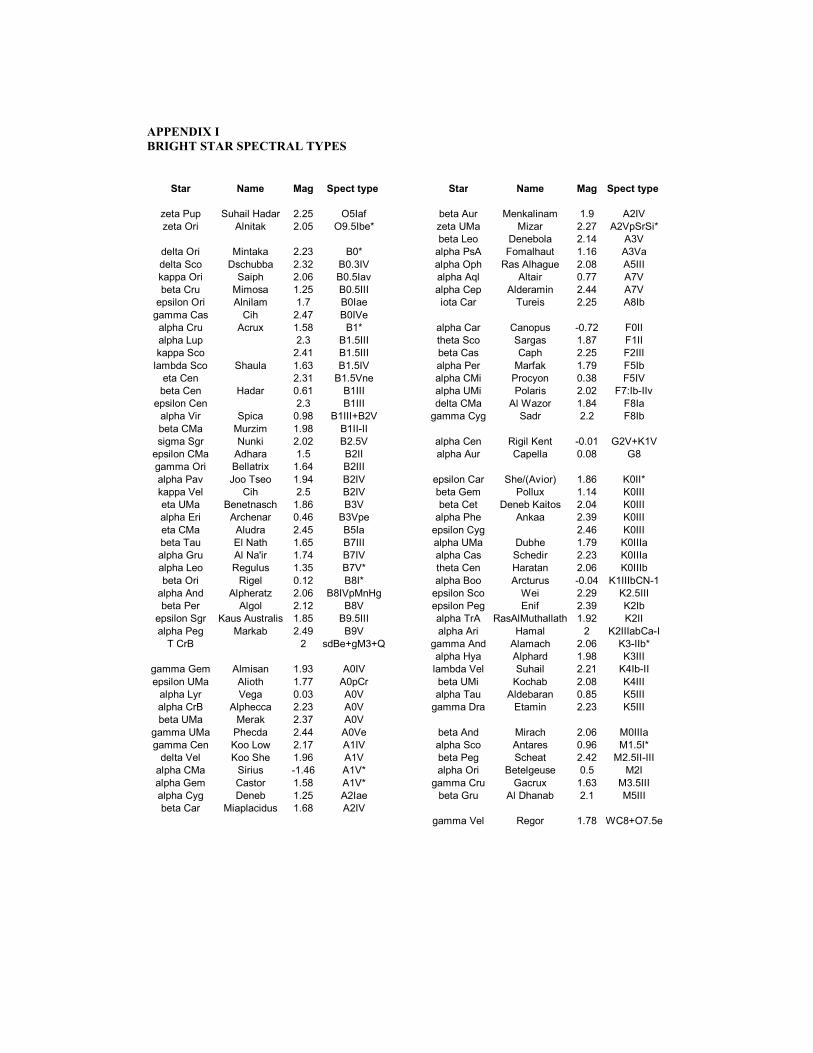
APPENDIX I
BRIGHT STAR SPECTRAL TYPES
Star Name Mag Spect type Star Name Mag Spect type
zeta Pup Suhail Hadar 2.25 O5Iaf beta Aur Menkalinam 1.9 A2IV
zeta Ori Alnitak 2.05 O9.5Ibe* zeta UMa Mizar 2.27 A2VpSrSi*
beta Leo Denebola 2.14 A3V
delta Ori Mintaka 2.23 B0* alpha PsA Fomalhaut 1.16 A3Va
delta Sco Dschubba 2.32 B0.3IV alpha Oph Ras Alhague 2.08 A5III
kappa Ori Saiph 2.06 B0.5Iav alpha Aql Altair 0.77 A7V
beta Cru Mimosa 1.25 B0.5III alpha Cep Alderamin 2.44 A7V
epsilon Ori Alnilam 1.7 B0Iae iota Car Tureis 2.25 A8Ib
gamma Cas Cih 2.47 B0IVe
alpha Cru Acrux 1.58 B1* alpha Car Canopus -0.72 F0II
alpha Lup 2.3 B1.5III theta Sco Sargas 1.87 F1II
kappa Sco 2.41 B1.5III beta Cas Caph 2.25 F2III
lambda Sco Shaula 1.63 B1.5IV alpha Per Marfak 1.79 F5Ib
eta Cen 2.31 B1.5Vne alpha CMi Procyon 0.38 F5IV
beta Cen Hadar 0.61 B1III alpha UMi Polaris 2.02 F7:Ib-IIv
epsilon Cen 2.3 B1III delta CMa Al Wazor 1.84 F8Ia
alpha Vir Spica 0.98 B1III+B2V gamma Cyg Sadr 2.2 F8Ib
beta CMa Murzim 1.98 B1II-II
sigma Sgr Nunki 2.02 B2.5V alpha Cen Rigil Kent -0.01 G2V+K1V
epsilon CMa Adhara 1.5 B2II alpha Aur Capella 0.08 G8
gamma Ori Bellatrix 1.64 B2III
alpha Pav Joo Tseo 1.94 B2IV epsilon Car She/(Avior) 1.86 K0II*
kappa Vel Cih 2.5 B2IV beta Gem Pollux 1.14 K0III
eta UMa Benetnasch 1.86 B3V beta Cet Deneb Kaitos 2.04 K0III
alpha Eri Archenar 0.46 B3Vpe alpha Phe Ankaa 2.39 K0III
eta CMa Aludra 2.45 B5Ia epsilon Cyg 2.46 K0III
beta Tau El Nath 1.65 B7III alpha UMa Dubhe 1.79 K0IIIa
alpha Gru Al Na'ir 1.74 B7IV alpha Cas Schedir 2.23 K0IIIa
alpha Leo Regulus 1.35 B7V* theta Cen Haratan 2.06 K0IIIb
beta Ori Rigel 0.12 B8I* alpha Boo Arcturus -0.04 K1IIIbCN-1
alpha And Alpheratz 2.06 B8IVpMnHg epsilon Sco Wei 2.29 K2.5III
beta Per Algol 2.12 B8V epsilon Peg Enif 2.39 K2Ib
epsilon Sgr Kaus Australis 1.85 B9.5III alpha TrA RasAlMuthallath 1.92 K2II
alpha Peg Markab 2.49 B9V alpha Ari Hamal 2 K2IIIabCa-I
T CrB 2 sdBe+gM3+Q gamma And Alamach 2.06 K3-IIb*
alpha Hya Alphard 1.98 K3III
gamma Gem Almisan 1.93 A0IV lambda Vel Suhail 2.21 K4Ib-II
epsilon UMa Alioth 1.77 A0pCr beta UMi Kochab 2.08 K4III
alpha Lyr Vega 0.03 A0V alpha Tau Aldebaran 0.85 K5III
alpha CrB Alphecca 2.23 A0V gamma Dra Etamin 2.23 K5III
beta UMa Merak 2.37 A0V
gamma UMa Phecda 2.44 A0Ve beta And Mirach 2.06 M0IIIa
gamma Cen Koo Low 2.17 A1IV alpha Sco Antares 0.96 M1.5I*
delta Vel Koo She 1.96 A1V beta Peg Scheat 2.42 M2.5II-III
alpha CMa Sirius -1.46 A1V* alpha Ori Betelgeuse 0.5 M2I
alpha Gem Castor 1.58 A1V* gamma Cru Gacrux 1.63 M3.5III
alpha Cyg Deneb 1.25 A2Iae beta Gru Al Dhanab 2.1 M5III
beta Car Miaplacidus 1.68 A2IV
gamma Vel Regor 1.78 WC8+O7.5e
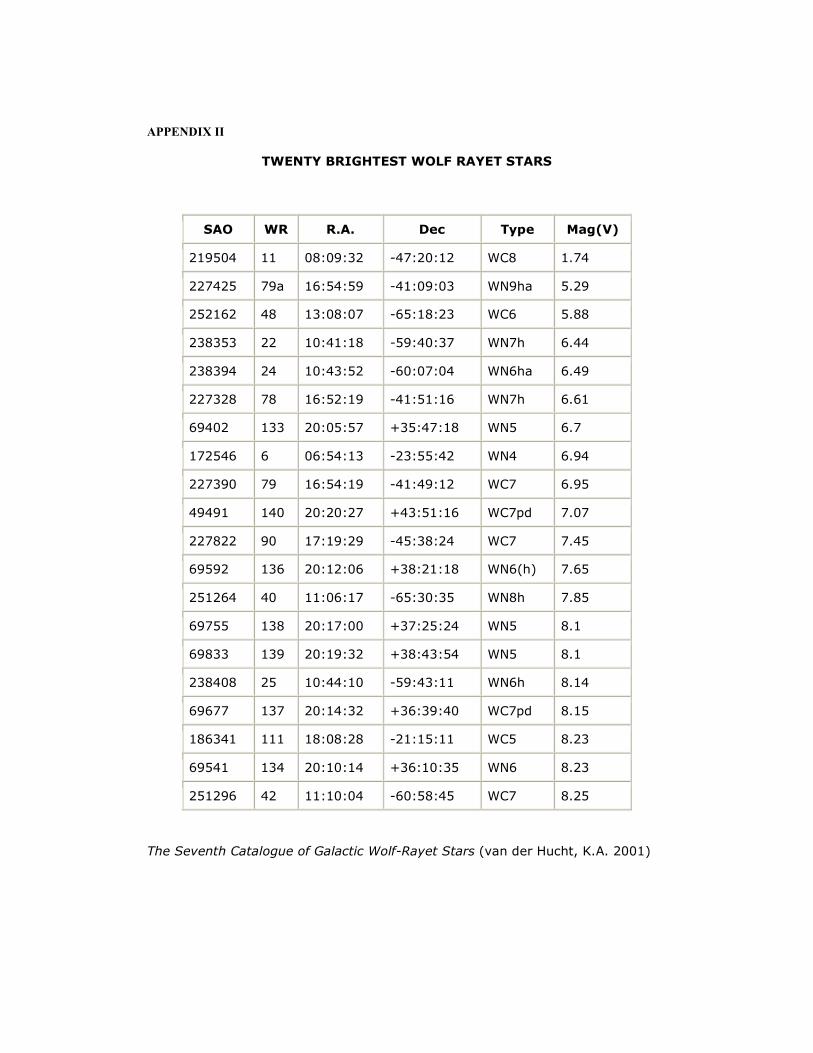
APPENDIX II
TWENTY BRIGHTEST WOLF RAYET STARS
SAO WR R.A. Dec Type Mag(V)
219504 11 08:09:32 -47:20:12 WC8 1.74
227425 79a 16:54:59 -41:09:03 WN9ha 5.29
252162 48 13:08:07 -65:18:23 WC6 5.88
238353 22 10:41:18 -59:40:37 WN7h 6.44
238394 24 10:43:52 -60:07:04 WN6ha 6.49
227328 78 16:52:19 -41:51:16 WN7h 6.61
69402 133 20:05:57 +35:47:18 WN5 6.7
172546 6 06:54:13 -23:55:42 WN4 6.94
227390 79 16:54:19 -41:49:12 WC7 6.95
49491 140 20:20:27 +43:51:16 WC7pd 7.07
227822 90 17:19:29 -45:38:24 WC7 7.45
69592 136 20:12:06 +38:21:18 WN6(h) 7.65
251264 40 11:06:17 -65:30:35 WN8h 7.85
69755 138 20:17:00 +37:25:24 WN5 8.1
69833 139 20:19:32 +38:43:54 WN5 8.1
238408 25 10:44:10 -59:43:11 WN6h 8.14
69677 137 20:14:32 +36:39:40 WC7pd 8.15
186341 111 18:08:28 -21:15:11 WC5 8.23
69541 134 20:10:14 +36:10:35 WN6 8.23
251296 42 11:10:04 -60:58:45 WC7 8.25
The Seventh Catalogue of Galactic Wolf-Rayet Stars (van der Hucht, K.A. 2001)
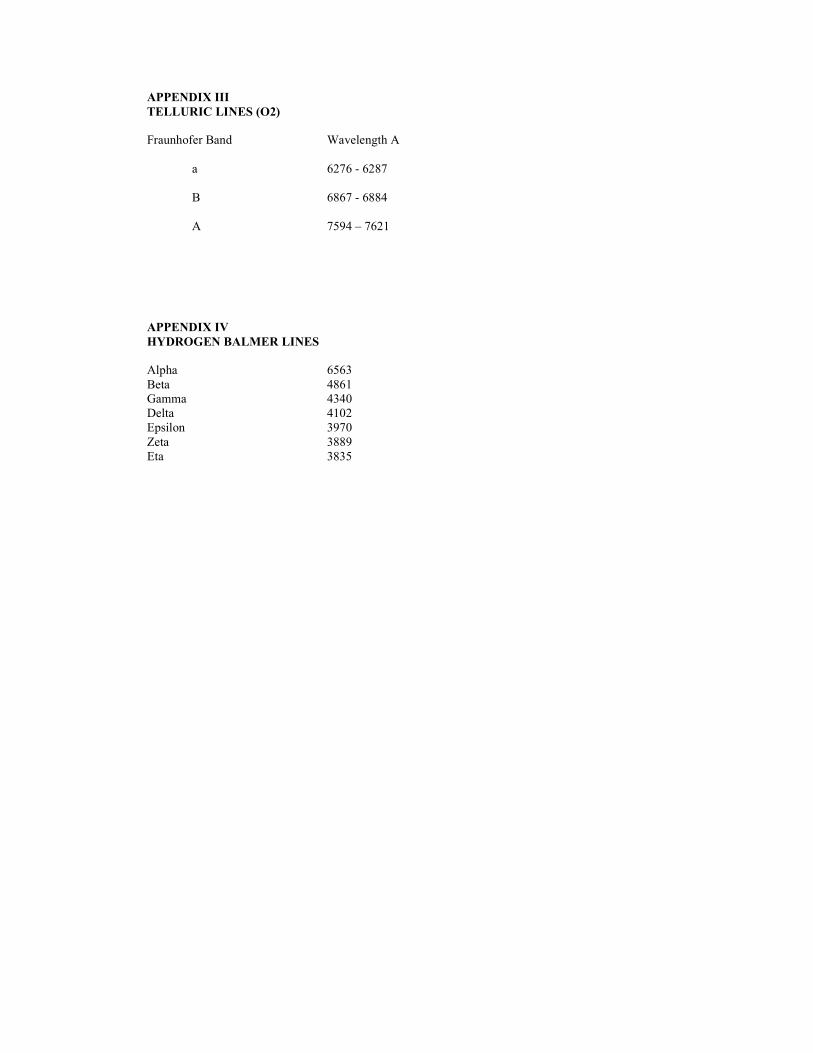
APPENDIX III
TELLURIC LINES (O2)
Fraunhofer Band Wavelength A
a 6276 - 6287
B 6867 - 6884
A 7594 – 7621
APPENDIX IV
HYDROGEN BALMER LINES
Alpha 6563
Beta 4861
Gamma 4340
Delta 4102
Epsilon 3970
Zeta 3889
Eta 3835
APPENDIX V
Introducing the Star Analyser 200
Since its launch in 2005, the Star Analyser 100 has introduced thousands of amateur
astronomers worldwide to the fascinating field of spectroscopy. Over this period, the
equipment used by amateurs has evolved with larger aperture telescopes, bigger
camera sensors and close coupled filter wheels becoming more common. The new
Star Analyser 200 model has been developed with these users in mind. Using the
same Paton Hawksley high efficiency blazed diffraction grating technology as the
SA100, but with double the line density, the SA200 gives approximately the same
length of spectrum but at half the spacing from the camera sensor. A new low profile
design has been used for the SA200, allowing it to be used with a wider range of filter
wheel models and can even be adapted for use in wheels designed for unmounted
drop in filters (See later section for dimensions and mounting suggestions)
Is the SA200 a replacement for the SA100?
Most definitely not! For most users the SA100 will to continue to be the model of
choice, particularly for those using cameras with small sensors, giving optimum
performance for example with the SA100 mounted on the camera nosepiece. In
circumstances though where a 100 lines/mm grating cannot be mounted far enough
away from the sensor to produce the optimum length of spectrum, the SA200 gives
the opportunity to significantly improve performance over what is achievable using
the SA100 in the same configuration.
What is the optimum spacing and when should I choose the SA200?
The on line calculator www.patonhawksley.co.uk/calculator (selecting the box for the
SA200) will calculate the dispersion (in Angstrom/pixel) for a given equipment setup.
This figure, combined with the guidelines there gives a rough indication of the
optimum spacing for a typical setup. To see where the SA200 can help achieve the
best performance though we need to delve into this in a bit more detail.
The maximum resolution achievable using the simple arrangement of a grating
mounted in the converging beam in front of the camera sensor is limited by various
optical factors to around 30-40 Angstrom. To be able to achieve this resolution
however the spectrum must first be spread out sufficiently to overcome two other
limitations.
Firstly the resolution cannot be better than 2 pixels (The Nyquist sampling condition)
so to achieve a resolution of say 36A, we need to aim for18A/pixel or less.
Secondly the resolution cannot be better than the length of the spectrum covered by
the star image. So for example if the star image is 3 pixels in diameter (FWHM,
measured in focus without the grating in place) and we want to achieve a resolution of
36A, then we need to aim for 36/3 = 12A/pixel or less, first checking that the sensor is
large enough to fit the spectrum and zero order in the frame at this dispersion. (Note
that the star image size depends on the focal length of the telescope and the
atmospheric conditions. Good collimation, focussing and measuring targets when
they are higher in the sky all help here)
For typical amateur setups, it is usually the second condition which is harder to meet
and the following examples illustrate typical situations where the SA200 can help
The Star Analyser mounted in a filter wheel
Filter wheels are typically positioned as close to the camera sensor as possible to
minimise vignetting in astrophotography. This distance is usually less than optimum
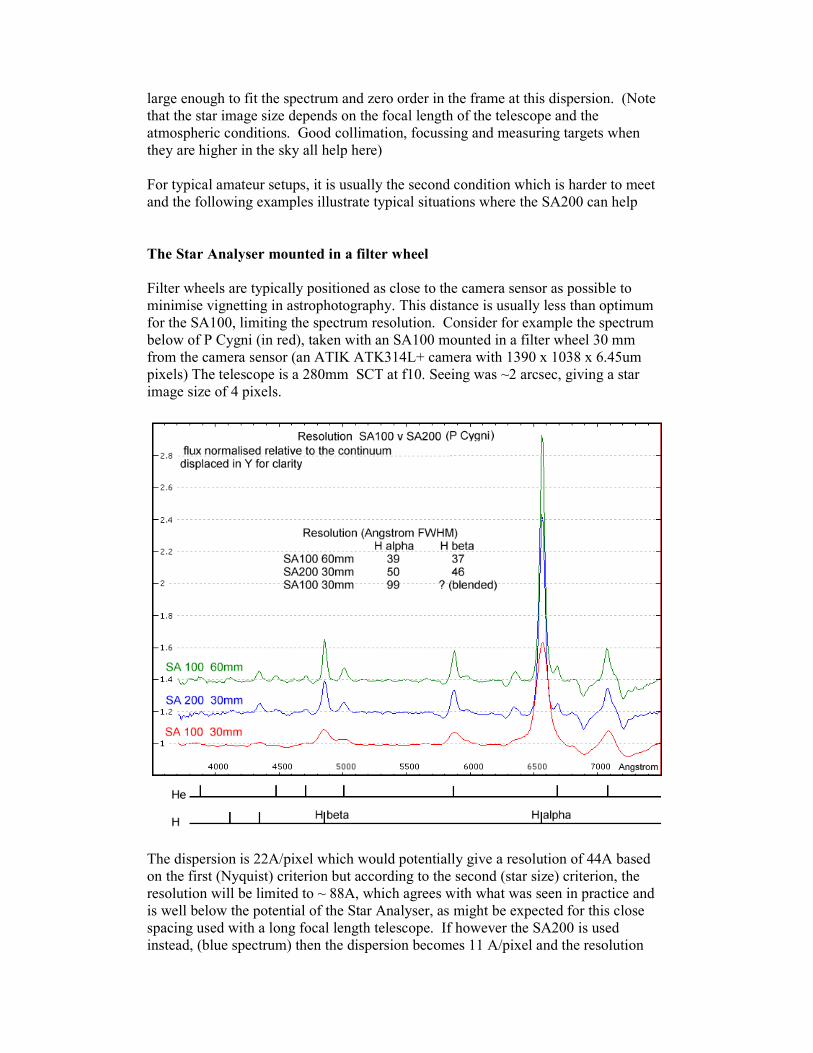
for the SA100, limiting the spectrum resolution. Consider for example the spectrum
below of P Cygni (in red), taken with an SA100 mounted in a filter wheel 30 mm
from the camera sensor (an ATIK ATK314L+ camera with 1390 x 1038 x 6.45um
pixels) The telescope is a 280mm SCT at f10. Seeing was ~2 arcsec, giving a star
image size of 4 pixels.
The dispersion is 22A/pixel which would potentially give a resolution of 44A based
on the first (Nyquist) criterion but according to the second (star size) criterion, the
resolution will be limited to ~ 88A, which agrees with what was seen in practice and
is well below the potential of the Star Analyser, as might be expected for this close
spacing used with a long focal length telescope. If however the SA200 is used
instead, (blue spectrum) then the dispersion becomes 11 A/pixel and the resolution
limit based on star image size limit is now ~ 44A, close to the maximum potential
resolution using the Star Analyser, confirmed by the increased detail seen in the blue
spectrum. (The green spectrum shows the result of achieving the same dispersion but
this time with an SA100 at double the distance. The resulting resolution is slightly
higher than when using the SA200 at half the distance, confirming that provided the
optimum distance can be achieved using the SA100 then this remains the best option)
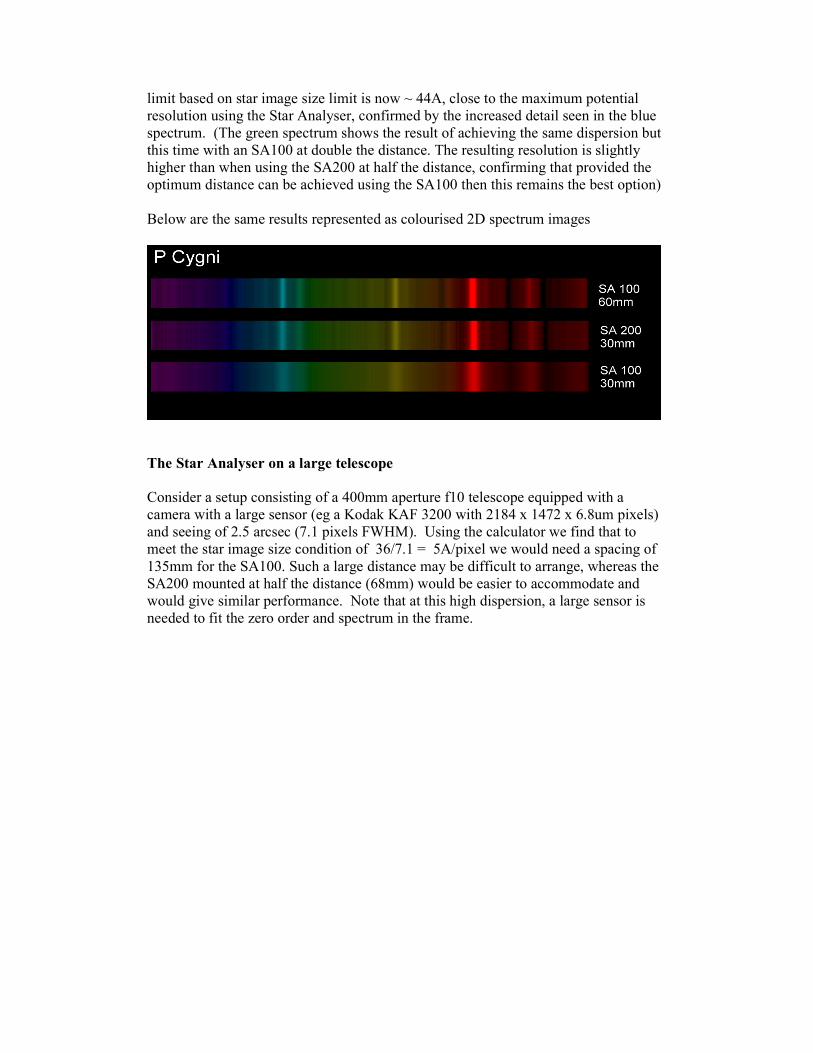
Below are the same results represented as colourised 2D spectrum images
The Star Analyser on a large telescope
Consider a setup consisting of a 400mm aperture f10 telescope equipped with a
camera with a large sensor (eg a Kodak KAF 3200 with 2184 x 1472 x 6.8um pixels)
and seeing of 2.5 arcsec (7.1 pixels FWHM). Using the calculator we find that to
meet the star image size condition of 36/7.1 = 5A/pixel we would need a spacing of
135mm for the SA100. Such a large distance may be difficult to arrange, whereas the
SA200 mounted at half the distance (68mm) would be easier to accommodate and
would give similar performance. Note that at this high dispersion, a large sensor is
needed to fit the zero order and spectrum in the frame.


![TLE ANALYSER · TLE ANALYSER User Manual v2.8 TLE analysis ... TLE ANALYSER Version 2.8 - 2013 TLE ANALYSER - User Manual [4] 2. TLE Analyser Setup and Options TLE Updater allow to](https://img.pdfslide.net/doc/110x75/5aa68a5c7f8b9a517d8ea13c/tle-analyser-analyser-user-manual-v28-tle-analysis-tle-analyser-version-28.jpg)