Embed Size (px)
Citation preview
© PFM 1© PFM 1© PFM 1
State of ArkansasTax Relief and Reform Legislative Task Force
Arkansas Tax Issues Presentation
October 3, 2017
PFM Group Consulting LLC.
1735 Market St. 43rd FloorPhiladelphia, PA, 19139
(267) 713-0700pfm.com
EXHIBIT E

© PFM 2© PFM 2© PFM 2
Randall Bauer, Project ManagerRandall Bauer joined PFM in 2005, where he has led numerous state and local government finance and revenue-related projects. These project clients have included the States of Delaware, Hawaii, Illinois, Kansas, New York, Oklahoma, Pennsylvania and Washington as well as the Cities of Baltimore, Cincinnati, Colorado Springs, St. Louis, and Washington DC. Prior to joining PFM, Mr. Bauer served for nearly 7 years as Budget Director for the State of Iowa and 11 years in senior tax and budget staff roles for the Iowa State Senate.
Deanna Yocco, Senior AnalystDeanna Yocco joined PFM in 2015 and is based in PFM’s Philadelphia office. She provides quantitative, analytical, and research support for governmental performance improvement projects. Ms. Yocco has served as the lead analyst for projects with the States of Hawaii, Illinois and Oklahoma. Prior to joining PFM, Ms. Yocco was a Budget Analyst for the Ohio Office of Budget and Management, where she was responsible for the preparation of the Governor’s Monthly Financial Report, detailing the State’s economic forecast, revenues, and preliminary monthly disbursements.
Project Team Leaders
© PFM 3© PFM 3© PFM 3
John Cape, Subject Matter ExpertJohn F. Cape is a national expert on public policy, with over 35 years experience in the public sector. At PFM, he served as the Engagement Director for project clients that included the States of Colorado, Georgia, New Jersey, New Mexico, Oregon, Pennsylvania and Virginia. Prior to joining PFM, Mr. Cape was the Director of the Budget for New York State. Mr. Cape serves as a Senior Fellow of the Rockefeller Institute of Government and is a Fellow of the State Academy of Public Administrators.
Andrew Sidamon-Eristoff, Subject Matter ExpertAndrew Sidamon-Eristoff has over 30 years of experience in tax policy and administration. Among his experience is serving as New Jersey State Treasurer, Commissioner of the New York State Department of Taxation and Finance, Commissioner of the New York City Department of Finance and as a Senior Tax Advisor to the USAID Business Climate Reform Project. Mr. Sidamon-Eristoff also served as a Council Member on the New York City Council. He served on the Board of the Federation of Tax Administrators and is also certified in the use of the IMF Tax Administration’s Diagnostic Assessment Tool.
Project Team Leaders

© PFM 4© PFM 4© PFM 4
PFM Overview and Project Team General Outline of a Direction/Roadmap Towards Reform and
.Relief Options
How Does Arkansas Stack Up?
Exemptions: How Do You Score Them?
Coverage Topics
© PFM 5© PFM 5© PFM 5
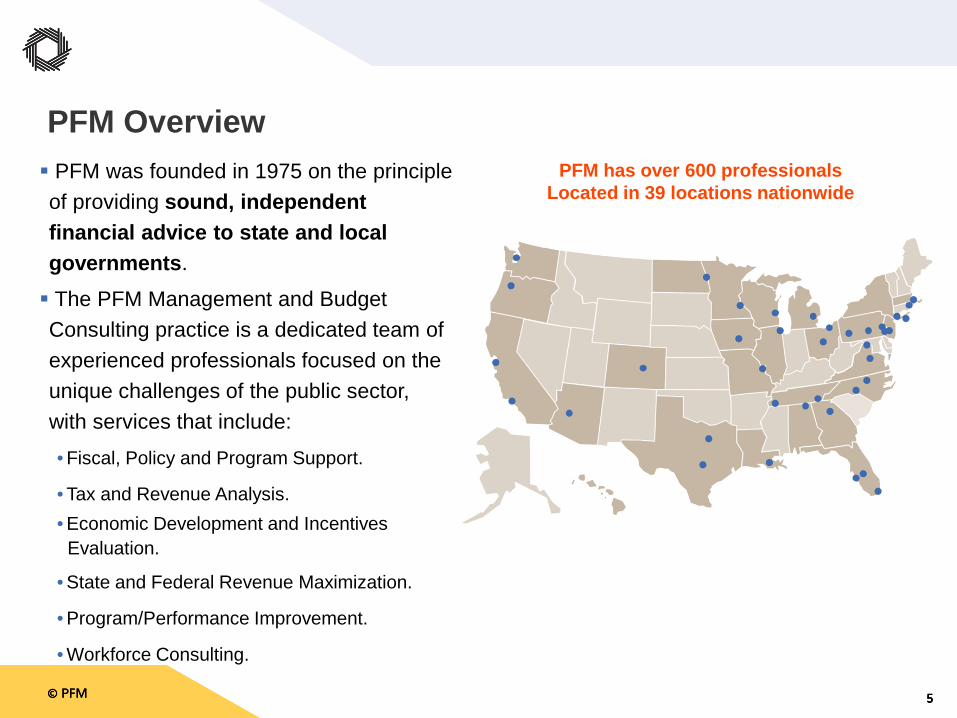
PFM Overview PFM was founded in 1975 on the principle of providing sound, independent financial advice to state and local governments.
The PFM Management and Budget Consulting practice is a dedicated team of experienced professionals focused on the unique challenges of the public sector, with services that include:
• Fiscal, Policy and Program Support.
• Tax and Revenue Analysis.• Economic Development and Incentives ..Evaluation.
• State and Federal Revenue Maximization.
• Program/Performance Improvement.
• Workforce Consulting.
PFM has over 600 professionals Located in 39 locations nationwide
© PFM 6© PFM 6© PFM 6
PFM Services for State and Local Governments
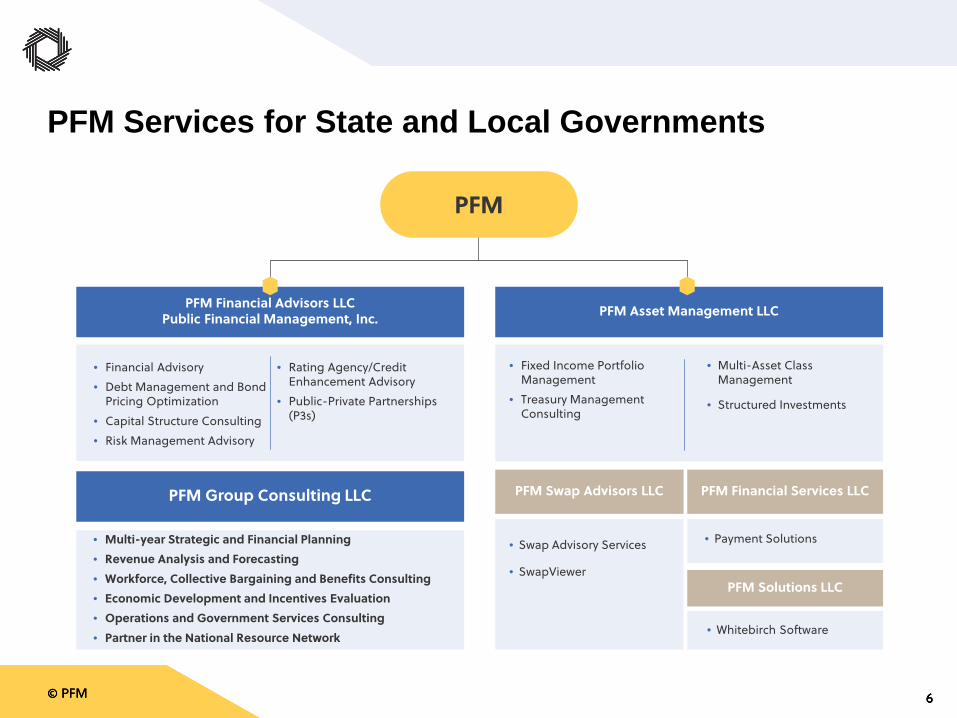
PFM
PFM Financial Advisors LLCPublic Financial Management, Inc. PFM Asset Management LLC
PFM Swap Advisors LLC
• Fixed Income Portfolio Management
• Treasury Management Consulting
• Multi-Asset Class Management
• Structured Investments
PFM Financial Services LLC
• Swap Advisory Services
• SwapViewer
• Payment Solutions
• Financial Advisory• Debt Management and Bond
Pricing Optimization• Capital Structure Consulting• Risk Management Advisory
• Rating Agency/Credit Enhancement Advisory
• Public-Private Partnerships (P3s)
PFM Group Consulting LLC
• Multi-year Strategic and Financial Planning• Revenue Analysis and Forecasting• Workforce, Collective Bargaining and Benefits Consulting• Economic Development and Incentives Evaluation• Operations and Government Services Consulting• Partner in the National Resource Network
PFM Solutions LLC
• Whitebirch Software
© PFM 7© PFM 7© PFM 7
Tax and Revenue Structures:-Delaware options for changes to the State/County finance relationship (current).
-Hawaii review of state revenue structure including sufficiency, equity and efficiency.
-Hawaii review of state revenue structure including ability to export revenue, collections processes and systems (current).
-Kansas options to increase the capture of non-tax revenue.
-Pennsylvania review of revenue estimating and administrative processes.
-Washington review of existing fee structure to determine sufficiency.-Long Island Regional Planning Council study of alternatives to the property tax (current).
-Aurora review of tax sufficiency and revisions to City tax and revenue structure.
-Colorado Springs analyze existing revenue structure for long-term sufficiency.
-Pittsburgh recommendations for revisions to City tax structure and internal processes.
-Providence analysis of alternatives to existing tax and revenue structure.
-St. Louis recommendations for revisions to City tax and revenue structure.
Relevant PFM Past/Current Projects
© PFM 8© PFM 8© PFM 8
Economic Development and Incentives:-Oklahoma evaluation of incentives efficacy, financial and economic impact (current).
-Hawaii evaluation of incentives financial and economic impact.
-New York evaluation of financial incentives and economic impact from specific projects.
-Pennsylvania evaluation of financial incentives and economic impact from a specific project.
-Kansas City review of City tax incentives and economic and financial impact.
-St. Louis review of City tax incentives and economic and financial impact.
Revenue Estimating:-Pennsylvania revenue estimating processes and peer benchmarking.
-New Orleans establishing processes after Hurricane Katrina.
-Pittsburgh vetting City revenue estimates.
-Portsmouth identifying areas of concern with current City revenue estimates.
Relevant PFM Past/Current Projects
© PFM 9© PFM 9© PFM 9
Menu of Alternatives to Study and Provide Written Reports- Analysis by tax type (income, sales, excise, property taxes)- Problem/solution analysis (competitiveness, tax burden, grow specific sectors)- Multiple unrelated areas of study (state ‘x’ reform, approaches to Nexus, simplification)
Facilitated Task Force Discussion- Questions and discussion to lead to topics for written preliminary report- Presentations and discussion for topics for written preliminary report- Multiple meetings versus one or two remaining meeting
Multiple-day Meeting Combination of these Approaches- In-depth benchmarking and case studies- Analysis (both dynamic and static) of tax alternatives- Combination of options based on parameters identified by the Task Force
Path Forward: Outline Towards Reform/Relief Options
© PFM 10© PFM 10© PFM 10
Reviewed Past Task Force Presentations and Information- NCSL: high-level benchmarking on structure, rates, other state reform experience- DFA home-grown resources: listing of incentives and exemptions- Tax Foundation: ‘Arkansas The Road Map to Tax Reform’- COST: Testimony on business taxes
Additional Areas for Benchmarking and Analysis- Economic development incentives – types and evaluation methods- Key features of income tax (exemptions, deductions, credits, treatment capital gains .and losses)
- Measures of tax burden- Tax administration features- Other state tax reform
How Does Arkansas Stack Up?
© PFM 11© PFM 11© PFM 11
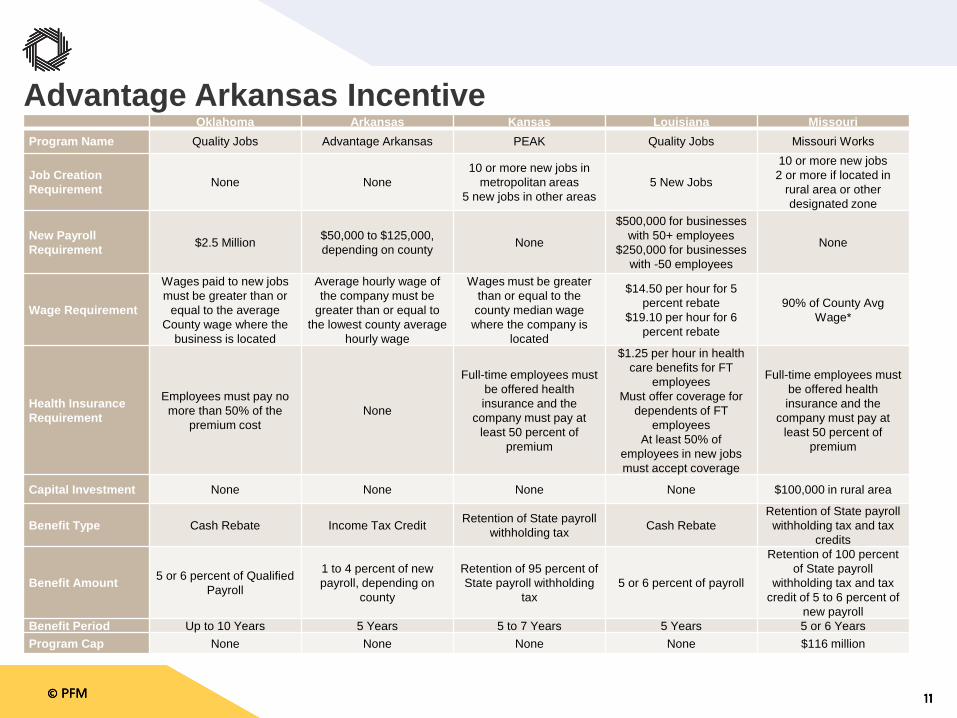
Advantage Arkansas IncentiveOklahoma Arkansas Kansas Louisiana Missouri
Program Name Quality Jobs Advantage Arkansas PEAK Quality Jobs Missouri Works
Job Creation Requirement None None
10 or more new jobs in metropolitan areas
5 new jobs in other areas5 New Jobs
10 or more new jobs2 or more if located in
rural area or other designated zone
New Payroll Requirement $2.5 Million $50,000 to $125,000,
depending on county None
$500,000 for businesses with 50+ employees
$250,000 for businesses with -50 employees
None
Wage Requirement
Wages paid to new jobs must be greater than or
equal to the average County wage where the
business is located
Average hourly wage of the company must be
greater than or equal to the lowest county average
hourly wage
Wages must be greater than or equal to the county median wage
where the company is located
$14.50 per hour for 5 percent rebate
$19.10 per hour for 6 percent rebate
90% of County Avg Wage*
Health Insurance Requirement
Employees must pay no more than 50% of the
premium costNone
Full-time employees must be offered health insurance and the
company must pay at least 50 percent of
premium
$1.25 per hour in health care benefits for FT
employeesMust offer coverage for
dependents of FTemployees
At least 50% of employees in new jobs must accept coverage
Full-time employees must be offered health insurance and the
company must pay at least 50 percent of
premium
Capital Investment None None None None $100,000 in rural area
Benefit Type Cash Rebate Income Tax Credit Retention of State payroll withholding tax Cash Rebate
Retention of State payroll withholding tax and tax
credits
Benefit Amount 5 or 6 percent of Qualified Payroll
1 to 4 percent of new payroll, depending on
county
Retention of 95 percent of State payroll withholding
tax5 or 6 percent of payroll
Retention of 100 percent of State payroll
withholding tax and tax credit of 5 to 6 percent of
new payrollBenefit Period Up to 10 Years 5 Years 5 to 7 Years 5 Years 5 or 6 YearsProgram Cap None None None None $116 million
© PFM 12© PFM 12© PFM 12
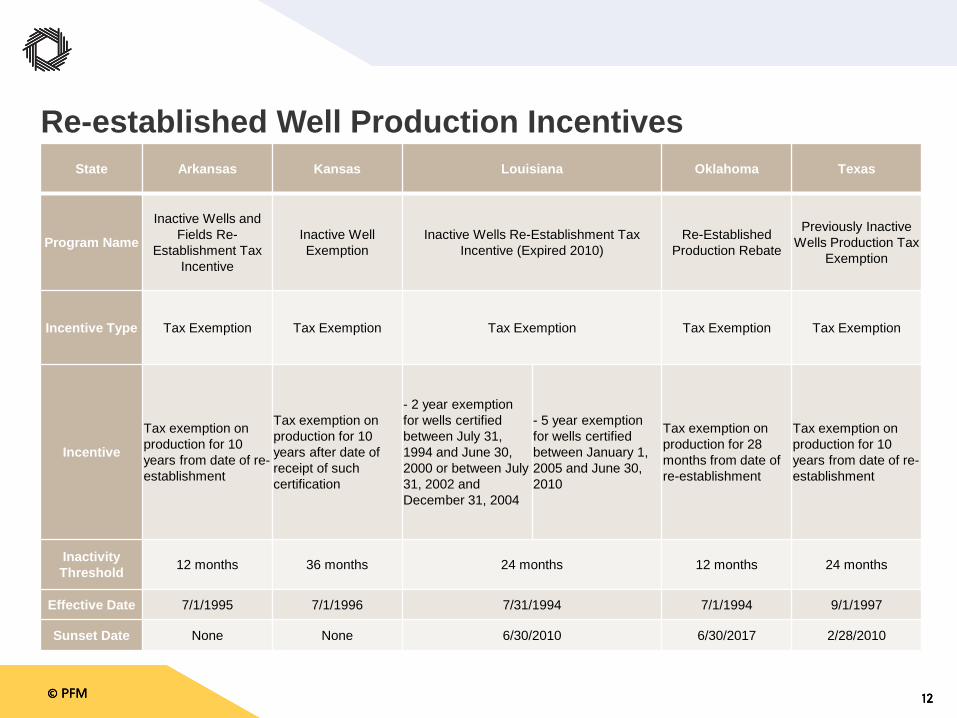
Re-established Well Production IncentivesState Arkansas Kansas Louisiana Oklahoma Texas
Program Name
Inactive Wells and Fields Re-
Establishment Tax Incentive
Inactive Well Exemption
Inactive Wells Re-Establishment Tax Incentive (Expired 2010)
Re-Established Production Rebate
Previously Inactive Wells Production Tax
Exemption
Incentive Type Tax Exemption Tax Exemption Tax Exemption Tax Exemption Tax Exemption
Incentive
Tax exemption on production for 10 years from date of re-establishment
Tax exemption on production for 10 years after date of receipt of such certification
- 2 year exemption for wells certified between July 31, 1994 and June 30, 2000 or between July 31, 2002 and December 31, 2004
- 5 year exemption for wells certified between January 1, 2005 and June 30, 2010
Tax exemption on production for 28 months from date of re-establishment
Tax exemption on production for 10 years from date of re-establishment
Inactivity Threshold 12 months 36 months 24 months 12 months 24 months
Effective Date 7/1/1995 7/1/1996 7/31/1994 7/1/1994 9/1/1997
Sunset Date None None 6/30/2010 6/30/2017 2/28/2010
© PFM 13© PFM 13© PFM 13
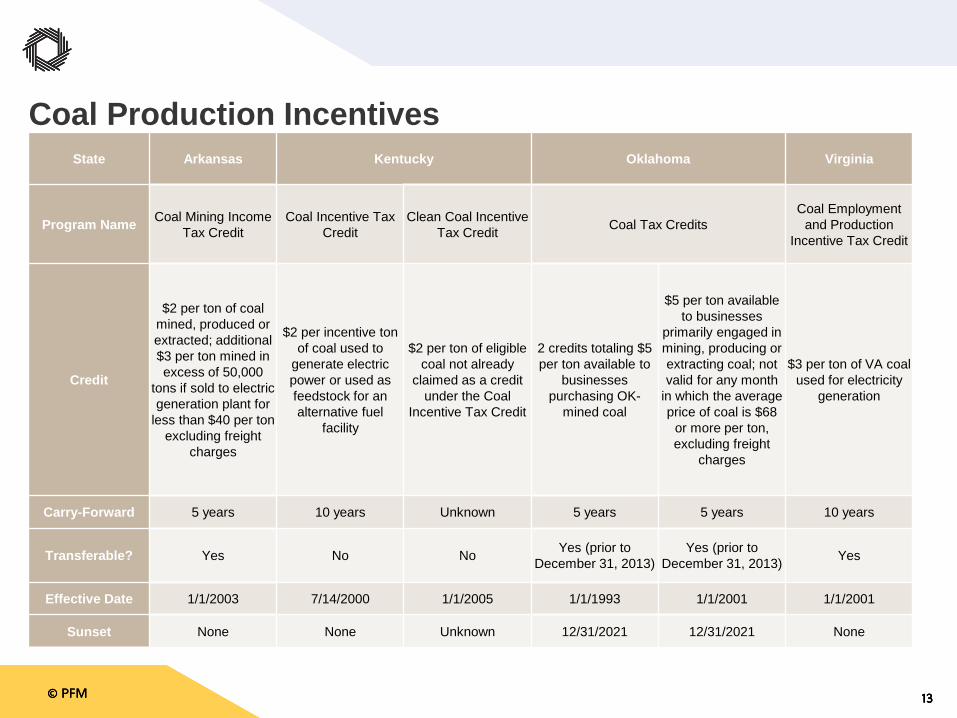
Coal Production IncentivesState Arkansas Kentucky Oklahoma Virginia
Program Name Coal Mining Income Tax Credit
Coal Incentive Tax Credit
Clean Coal Incentive Tax Credit Coal Tax Credits
Coal Employment and Production
Incentive Tax Credit
Credit
$2 per ton of coal mined, produced or extracted; additional $3 per ton mined in excess of 50,000
tons if sold to electric generation plant for
less than $40 per ton excluding freight
charges
$2 per incentive ton of coal used to
generate electric power or used as feedstock for an alternative fuel
facility
$2 per ton of eligible coal not already
claimed as a credit under the Coal
Incentive Tax Credit
2 credits totaling $5 per ton available to
businesses purchasing OK-
mined coal
$5 per ton available to businesses
primarily engaged in mining, producing or extracting coal; not valid for any month
in which the average price of coal is $68
or more per ton, excluding freight
charges
$3 per ton of VA coal used for electricity
generation
Carry-Forward 5 years 10 years Unknown 5 years 5 years 10 years
Transferable? Yes No No Yes (prior to December 31, 2013)
Yes (prior to December 31, 2013) Yes
Effective Date 1/1/2003 7/14/2000 1/1/2005 1/1/1993 1/1/2001 1/1/2001
Sunset None None Unknown 12/31/2021 12/31/2021 None
© PFM 14© PFM 14© PFM 14
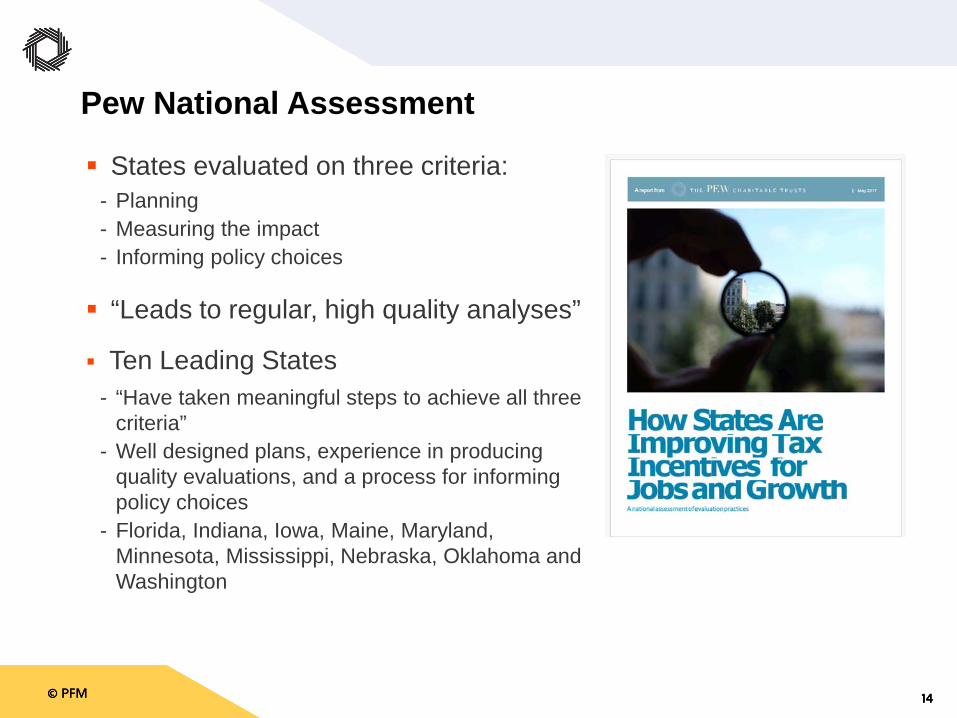
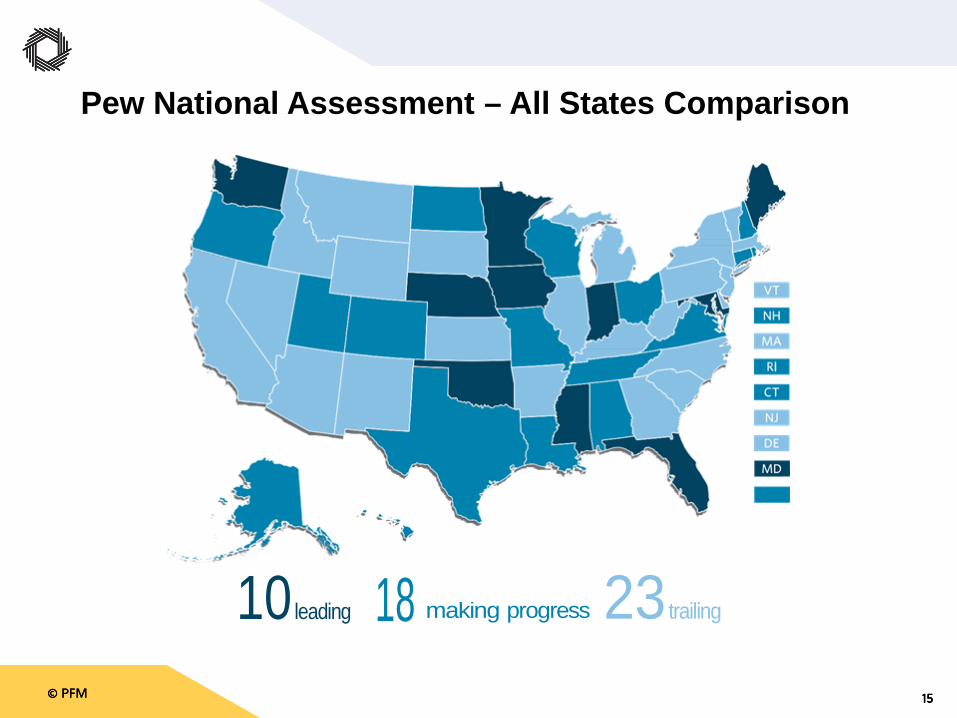
States evaluated on three criteria:- Planning- Measuring the impact- Informing policy choices
“Leads to regular, high quality analyses”
Ten Leading States- “Have taken meaningful steps to achieve all three .criteria”
- Well designed plans, experience in producing .quality evaluations, and a process for informing .policy choices
- Florida, Indiana, Iowa, Maine, Maryland, .Minnesota, Mississippi, Nebraska, Oklahoma and .Washington
Pew National Assessment
© PFM 15© PFM 15© PFM 15
Pew National Assessment – All States Comparison
10 leading 18 making progress 23 trailing
© PFM 16© PFM 16© PFM 16
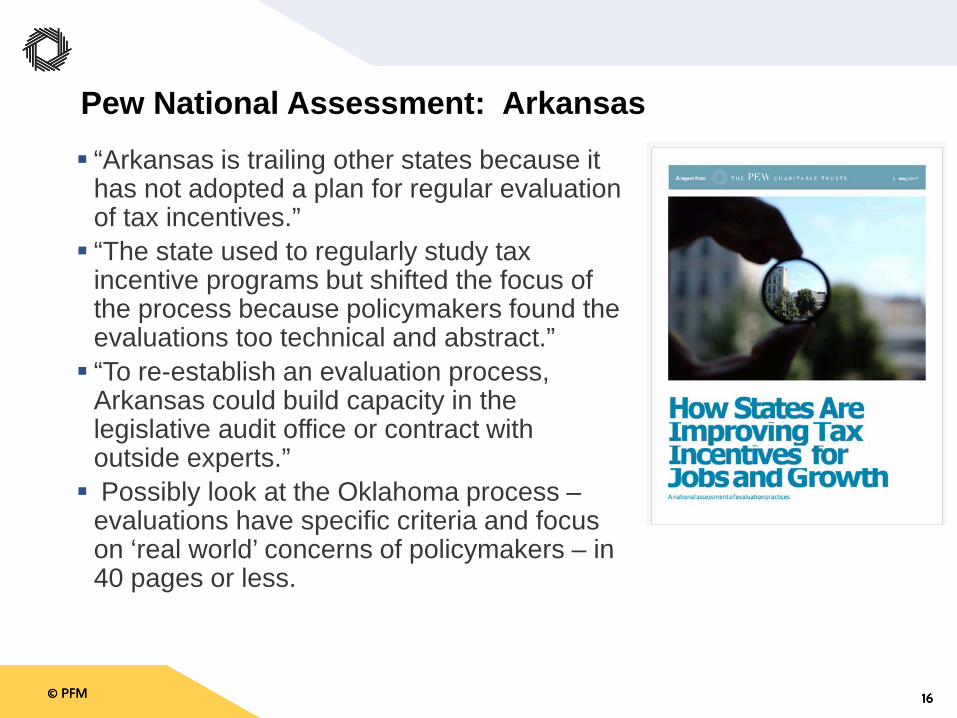
“Arkansas is trailing other states because it has not adopted a plan for regular evaluation of tax incentives.” “The state used to regularly study tax
incentive programs but shifted the focus of the process because policymakers found the evaluations too technical and abstract.” “To re-establish an evaluation process,
Arkansas could build capacity in the legislative audit office or contract with outside experts.” Possibly look at the Oklahoma process –
evaluations have specific criteria and focus on ‘real world’ concerns of policymakers – in 40 pages or less.
Pew National Assessment: Arkansas
© PFM 17© PFM 17© PFM 17
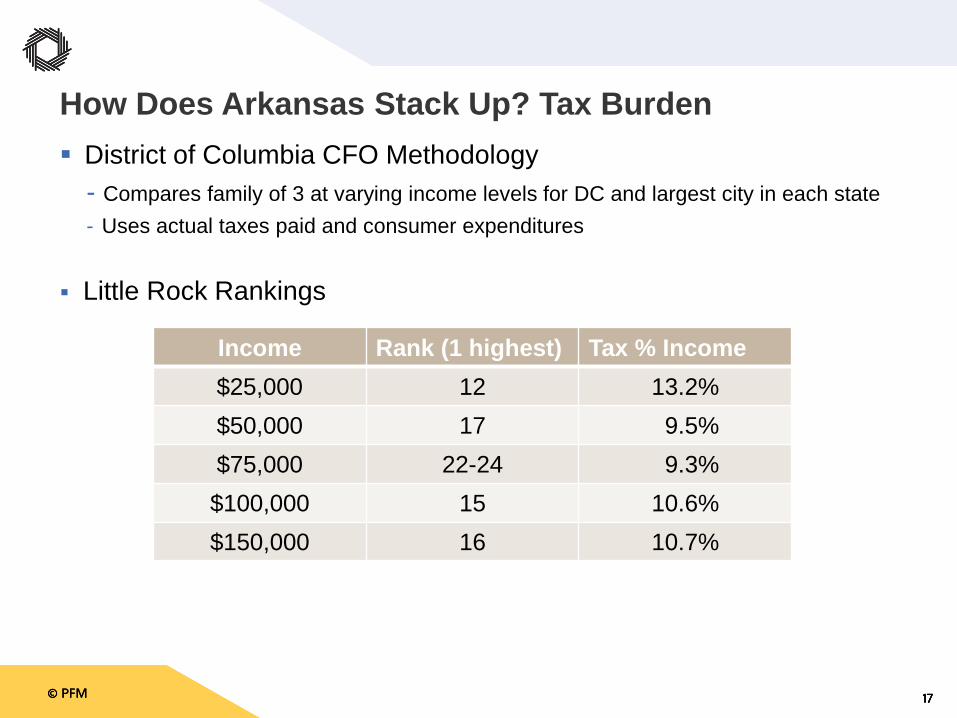
District of Columbia CFO Methodology- Compares family of 3 at varying income levels for DC and largest city in each state- Uses actual taxes paid and consumer expenditures
Little Rock Rankings
How Does Arkansas Stack Up? Tax Burden
Income Rank (1 highest) Tax % Income$25,000 12 13.2%$50,000 17 9.5%$75,000 22-24 9.3%$100,000 15 10.6%$150,000 16 10.7%
© PFM 18© PFM 18© PFM 18
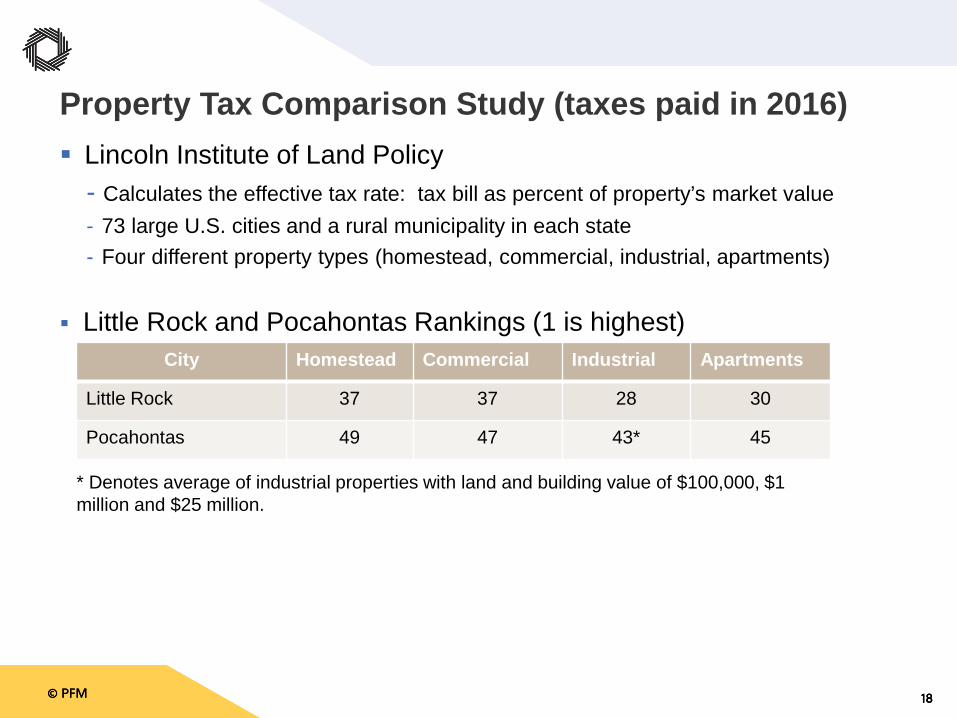
Lincoln Institute of Land Policy- Calculates the effective tax rate: tax bill as percent of property’s market value- 73 large U.S. cities and a rural municipality in each state- Four different property types (homestead, commercial, industrial, apartments)
Little Rock and Pocahontas Rankings (1 is highest)
Property Tax Comparison Study (taxes paid in 2016)
City Homestead Commercial Industrial Apartments
Little Rock 37 37 28 30
Pocahontas 49 47 43* 45
* Denotes average of industrial properties with land and building value of $100,000, $1 million and $25 million.
© PFM 19© PFM 19© PFM 19
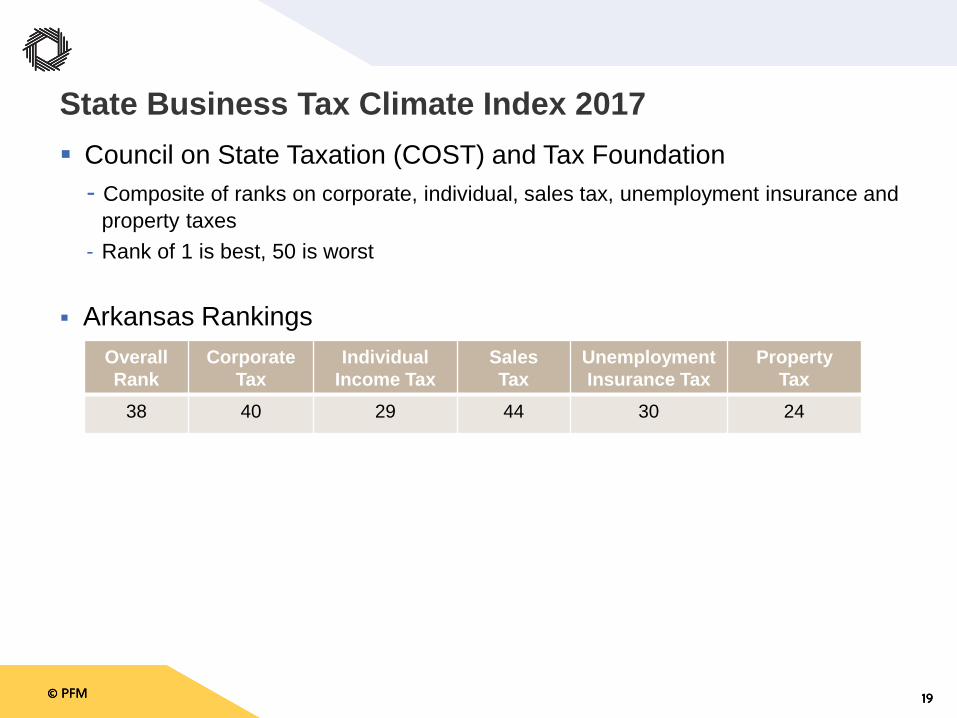
Council on State Taxation (COST) and Tax Foundation- Composite of ranks on corporate, individual, sales tax, unemployment insurance and .property taxes
- Rank of 1 is best, 50 is worst
Arkansas Rankings
State Business Tax Climate Index 2017
Overall Rank
CorporateTax
IndividualIncome Tax
SalesTax
UnemploymentInsurance Tax
PropertyTax
38 40 29 44 30 24
© PFM 20© PFM 20© PFM 20
Simplification- Moving to Federal AGI base for the income tax would reduce taxpayer compliance .costs and facilitate broader federal conformity
- This could include, if desired, adoption of a state EITC based on the federal EITC to .replace the current low-income tax exemption
-There might be compliance benefits arising from increased data sharing opportunities .with the Feds
- Extensive list (and growing) of sales tax exemptions- Sales tax holidays and tax amnesty are administratively burdensome
Low hanging fruit?- Arkansas scores a B+ on the COST Scorecard on Tax Appeals and Procedural .Requirements
- Establishing an independent tax dispute forum would lift Arkansas to an “A”- An inexpensive way to position the state as more business friendly- http://www.cost.org/WorkArea/DownloadAsset.aspx?id=94726
Administrative Issues
© PFM 21© PFM 21© PFM 21
Individual Income Tax- Reduction of brackets, simplification- Reduced reliance on the income tax- Tax fairness – EITC, increased standard deduction, other refundable credits
Sales Tax- Reduced rate and broadened base – particularly consumer services- Simplify complicated administrative structures- Nexus and reporting issues related to e-commerce- Taxation of virtual purchases
Corporate Tax- Simplification of administration- Changes in methods of apportionment
Property Tax- Circuit breakers, credits, other relief- Limits on growth
Other States’ Tax Reform
© PFM 22© PFM 22© PFM 22
NCSL Identified Key Tax Reform Features- Lowered personal and corporate income tax rates/broadened base- Personal income tax changed to flat tax, rate of 5.499% in 2017- Corporate tax rate lowered from 6.9% in 2013 to 3.0% in 2017 (with revenue trigger)- Repealed the Estate Tax
Additional Changes in 2017 Session- Broad-based reductions with 1/1/2019 tax year effective date- Reduced personal income tax rate from 5.499% to 5.25%- Increase the personal income tax standard deduction from $17,500 to $20,000 for joint
filers and surviving spouses, $14,000 to $15,000 for heads of households, and $8,750 to $10,000 single filers and married taxpayers filing separately
- Reduced the corporate franchise tax for S-corporations- Changed child care tax credit to a deduction, based on income and filing status- Part of budget bill vetoed by Governor Cooper- Overrode by the North Carolina Legislature
Other States’ Tax Reform: North Carolina
© PFM 23© PFM 23© PFM 23
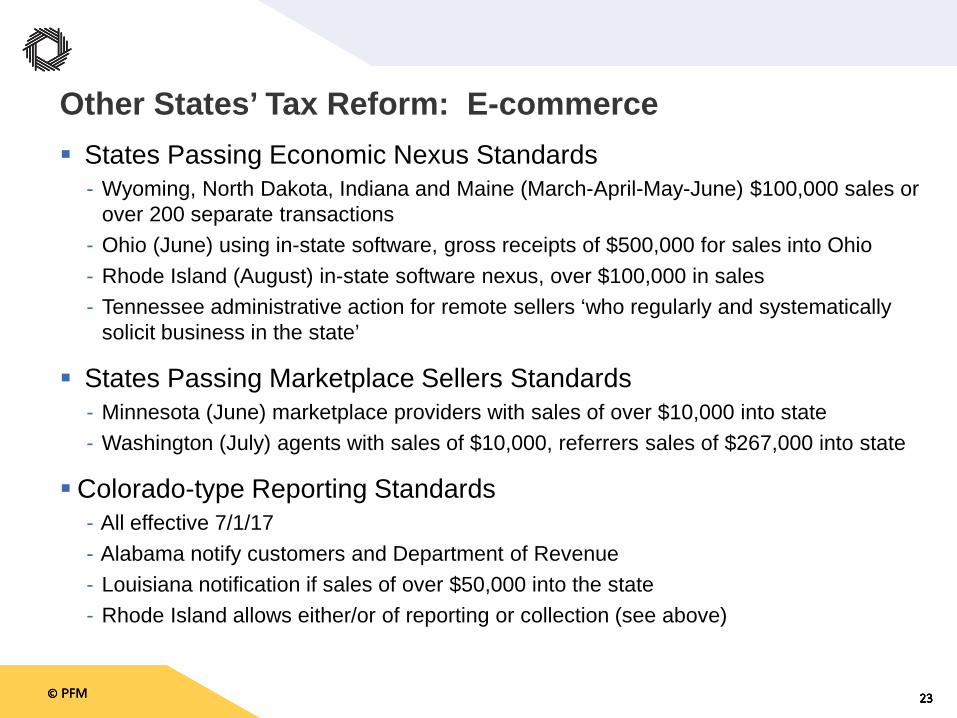
States Passing Economic Nexus Standards- Wyoming, North Dakota, Indiana and Maine (March-April-May-June) $100,000 sales or
over 200 separate transactions- Ohio (June) using in-state software, gross receipts of $500,000 for sales into Ohio- Rhode Island (August) in-state software nexus, over $100,000 in sales- Tennessee administrative action for remote sellers ‘who regularly and systematically
solicit business in the state’
States Passing Marketplace Sellers Standards- Minnesota (June) marketplace providers with sales of over $10,000 into state- Washington (July) agents with sales of $10,000, referrers sales of $267,000 into state
Colorado-type Reporting Standards - All effective 7/1/17- Alabama notify customers and Department of Revenue- Louisiana notification if sales of over $50,000 into the state- Rhode Island allows either/or of reporting or collection (see above)
Other States’ Tax Reform: E-commerce
© PFM 24© PFM 24© PFM 24
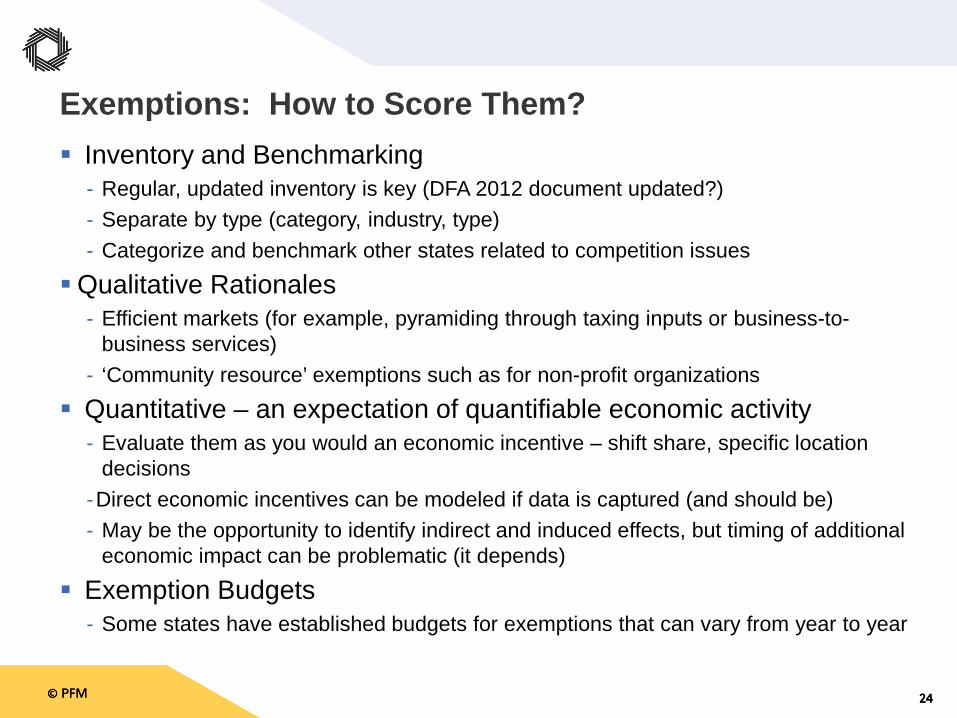
Inventory and Benchmarking- Regular, updated inventory is key (DFA 2012 document updated?)- Separate by type (category, industry, type) - Categorize and benchmark other states related to competition issues
Qualitative Rationales- Efficient markets (for example, pyramiding through taxing inputs or business-to-.business services)
- ‘Community resource’ exemptions such as for non-profit organizations
Quantitative – an expectation of quantifiable economic activity- Evaluate them as you would an economic incentive – shift share, specific location .decisions
-Direct economic incentives can be modeled if data is captured (and should be)- May be the opportunity to identify indirect and induced effects, but timing of additional .economic impact can be problematic (it depends)
Exemption Budgets- Some states have established budgets for exemptions that can vary from year to year
Exemptions: How to Score Them?

© PFM 25© PFM 25© PFM 25
Questions and Discussion