Embed Size (px)
Citation preview
Determination of optimum cure state of elastomers
Master’s thesis
Submitted by
Ragini Rajarajan
(Matriculation Number – 3104437)
Institute for Materials Science
October 2017
Examiner: Prof. Dr. Joachim Bill
Supervisor – Dr. Ali Golriz
in cooperation with
Supervisors - Dr. Günter Auernhammer
Dr. Rüdiger Berger
2
DECLARATION OF AUTHORSHIP
This master thesis report is written by Ragini Rajarajan under the supervision of Prof. Dr. Joachim Bill, Dr. Günter Auernhammer, Dr. Rüdiger Berger and Dr. Ali Golriz.
I, Ragini Rajarajan, hereby declare that this master thesis is a result of my own work and has not been submitted earlier in any other university or institute. The information derived from the published or unpublished works of others has been cited and all the references have been listed in the appended bibliography.
Stuttgart, 25 Oct. 17 Ragini Rajarajan
Place and Date Signature
3
TABLE OF CONTENTS
ACKNOWLEDGEMENTS..............................................................................................................4
ABSTRACT ..................................................................................................................................5
1. INTRODUCTION ..................................................................................................................6
1.1. MOTIVATION ...............................................................................................................7
1.2. MATERIALS – ELASTOMERS.........................................................................................9
1.2.1. Poly(dimethylsiloxane) (PDMS)............................................................................9
1.2.2. Natural Rubber (NR)...........................................................................................10
2. THEORETICAL BACKGROUND ...........................................................................................13
2.1. EXISTING TECHNIQUES..............................................................................................13
2.1.1. Compression Set ................................................................................................13
2.1.2. Swelling Experiments .........................................................................................15
2.1.3. Rheometer .........................................................................................................16
2.1.4. Other Methods in Literature..............................................................................17
2.2. MICRO CANTILEVER SENSOR (MCS) TECHNOLOGY...................................................19
2.3. PIEZORHEOLOGY .......................................................................................................22
2.3.1. Flory – Rehner theory ........................................................................................22
2.3.2. Piezorheology.....................................................................................................22
3. EXPERIMENT.....................................................................................................................26
3.1. SAMPLES....................................................................................................................26
3.2. PIEZORHEOLOGY .......................................................................................................27
3.3. SWELLING EXPERIMENTS ..........................................................................................29
4. RESULTS AND DISCUSSION ...............................................................................................30
4.1. POLY(DIMETHYLSILOXANE) (PDMS) ..........................................................................30
4.2. NATURAL RUBBER .....................................................................................................34
5. CONCLUSION ....................................................................................................................44
6. FUTURE SCOPE .................................................................................................................46
REFERENCES.............................................................................................................................48
APPENDIX A..............................................................................................................................50

4
ACKNOWLEDGEMENTS
First and foremost, I would like to thank Vibracoustic to have given me such an opportunity,
and my supervisor Dr. Ali Golriz, without whom this project would not have been possible. I
would like to express my profound gratitude to my supervisor Prof. Dr. Joachim Bill, for being
a pillar of support throughout my thesis. I would like to thank the Max Planck Institute for
Polymer Research, Mainz, for giving me an opportunity to work and learn the nuances of
research. I am grateful to my supervisors, Dr. Günter Auernhammer and Dr. Rüdiger Berger
for their guidance, constant motivation and patience while correcting my thesis. Finally, I
would like to extend my thanks to my family and friends, for lending their shoulder of
support throughout my thesis.
5
ABSTRACT
The enhancement of an elastomer’s functional properties like dimensional stability, resistance
to solvents and to high temperatures is a result of the curing or crosslinking between the
various chains of an elastomer [3]. One of the methods used in industry to predict cure state
is the rheometer. The methods existing in the industry and in literature to measure the cure
state have some advantages and disadvantages. The main objective of the master’s thesis is
to establish and evaluate one standard method that can be relied on, to measure the optimum
cure state of an elastomer. This method should be fast, precise and help in predicting cure
state of products with complex geometries.
Piezorheometers follow the set up and principles of classic oscillatory rheometers. Here, the
excitation of piezoactuators is achieved by the principles of piezoelectric and inverse
piezoelectric effect, contrary to the use of electro motors and capacitive transducers in
conventional rheometers [18]. Evaluation was done for two elastomers – one reference and
one real time sample. The reference was Poly(dimethylsiloxane) and the other sample was
natural rubber. Results produced were evaluated and the method was tested for variations.
Piezorheology is a reproducible and reliable technique which is easy to use and can be applied
in the industry.
6
1. INTRODUCTION
Elastomers are viscoelastic materials that exhibit extraordinary elasticity. They are long chains
of organic macromolecules, often cross-linked [1]. Elastomers are known for their nature of
stretching and returning to their original shape in a reversible way [2]. The presence of
heteroatoms such as fluorine, silicon, oxygen and nitrogen in the backbone chain are shown
to extend an elastomer’s chemical resistance [1]. Elastomers are flexible, with excellent oil
and moisture impermeability, abrasion resistance and insulation, and are used in many
applications like gaskets, shoe heels, tires, industrial belts, wire insulators and medical
prosthetics [1].
The enhancement of functional properties like dimensional stability, resistance to solvents
and to high temperatures is a result of the crosslinking between the various chains of an
elastomer [3]. The main constituents of rubber are long macromolecular chains. In the non
crosslinked state, the material exhibits plastic behavior as the chances of chain sliding are high.
After crosslinking, a three dimensional network is formed and relative chain sliding is
minimized, thus exhibiting elastic behavior [4]. The mechanical properties of an elastomer
depend on crosslinking as much as they depend on compounding [4].
Crosslinking is often done by externally added crosslinking agents that form chemical bonds
at functional sites [1]. Vulcanization or curing is the formation of chemical crosslinks between
coiled and long elastomer chains with sulphur as a crosslinking agent, in order to improve their
mechanical properties (tensile strength and modulus), and improve resistance to thermal and
chemical degradation [2]. Vulcanization or crosslinking or curing is an essential part of
processing of an elastomer product. It is the final stage in processing, and it helps in improving
the elastic strength, solvent resistance and oxidation resistance of elastomers [1].
Vulcanization is done at high temperatures (110 - 210˚C) and high pressures for most rubbers,
inside the mold, or press in the case of compression molding [1]. However, there are also other
rubbers that crosslink at room temperature, without sulphur. These room temperature
vulcanization rubbers are usually Silicones like poly(dimethylsiloxane), and their crosslinking
is catalyzed by Platinum. During vulcanization, various chemicals are mixed into the initial
rubber and compounded. This includes a curing agent, accelerators, activators and retarders.
1 INTRODUCTION
7
Sulphur is used as the most common curing agent, followed by organic peroxides [1]. The
mechanism of sulphur vulcanization is strongly dependent on the components present,
temperature and duration of the process. During the initial period, the structural fragments
mainly include disulphide and polysulfide linkages and pendant polysulfide chains. These
chains are terminated by an accelerator fragment. Isomerization of the double bonds is also
believed to occur leading to the formation of conjugated diene and triene sequences [1].
For the process of vulcanization to be useful and successful, it should be controlled, and
stopped at the right time. Premature vulcanization may create bubbles in the elastomer and
make it unusable in some cases. Over curing or overexposure might lead to reversion of
crosslinks, which occurs since the polysulphide linkages in crosslinks are susceptible to scission
[1]. Vulcanization is controlled by the production unit to a certain point, such that the product
produced fulfils the requirements expected out of it. Understanding cure chemistry can be
beneficial in characterizing the exact time to stop vulcanization, as the process consumes a
high amount of energy and time. To characterize the exact cure state has been a challenge to
most rubber technologists. Curing or crosslinking of elastomers has been studied by
researchers and industrialists, to understand the chemistry and process better. Some of the
methods used in the industry and in literature to measure the cure state are outlined in the
upcoming chapters.
1.1. MOTIVATION
The main objective of the master’s thesis is to establish one standard method that can be
relied on, to measure the optimum cure state of an elastomer. It is important to know the
cure state of an elastomer product, as this helps in stopping vulcanization at the right time, to
save energy and time. The other advantage is that the performance of any product is
enhanced as it reaches optimum cure state. The methods existing in the industry and in
literature to measure the cure state have some advantages and disadvantages. The most
widely used methods are outlined on the basis of test sample geometry, reversion detection,
error and timing, in Table 1.1. From Table 1.1 it can be understood that there is not one
standard method in the industry for optimum cure time measurement.
1 INTRODUCTION
8
One of the other main methods used in the industry is the Moving Die Rheometer (MDR). This
method is further explained in section 2.1.3. The t90 from MDR is used as an effective
characterization of 90% cure state in the industry. This gives an insight to the cure state of the
elastomer. This method is reliable and effective, but cannot be applied on complex sample
parts. The die in the apparatus is usually of 25 mm diameter [5]. Some of the other methods
include compression set, mass swelling, and porosity. Compression set and mass swelling
require at least 22 – 24 hours as test time and the sample preparation for compression set
from complex parts is not possible. Thus, every method existing has a disadvantage, and hence
there is a need for a new method that has maximum advantages, and can be easily applied in
the industry. The main focus of the thesis is to answer questions about the optimum
vulcanization time, and to evaluate a new method regarding its feasibility and practicability
for industrial applications.
1.2. MATERIALS – ELASTOMERS
1.2.1. Poly(dimethylsiloxane) (PDMS)
To assess the exact cure time of a crosslinked elastomer by a new method, a reference with a
simple crosslink system had to be chosen. Poly(dimethylsiloxane) is selected as reference due
to its simple chemistry, and the limited amount of compounding ingredients, as compared to
conventional rubbers. PDMS is also used in this thesis due to the ease of breaking down the
chemistry to understand the cure state. Another reason for choosing PDMS as a reference was
the fact that swelling experiments are usually characterized on this elastomer. The following
chapters discuss the different methods, and solvent swelling is one of the important ones. In
this regard, PDMS is widely used by researchers to be characterized in terms of swelling
experiments [6] [7]. Thus, it would be the most ideal reference substance for this thesis.
Poly(dimethylsiloxane) is a silicone elastomer with structure (Figure 1.1). PDMS is one of the
largely used silicon-based organic polymers. It is most widely used as contact lenses and
medical devices, caulking, lubricating oils and heat resistant tiles. PDMS is optically clear, non-
toxic and non-flammable [8]. The mechanical properties of PDMS can be fine-tuned by varying
the crosslink density in the polymer [6].
1 INTRODUCTION
9
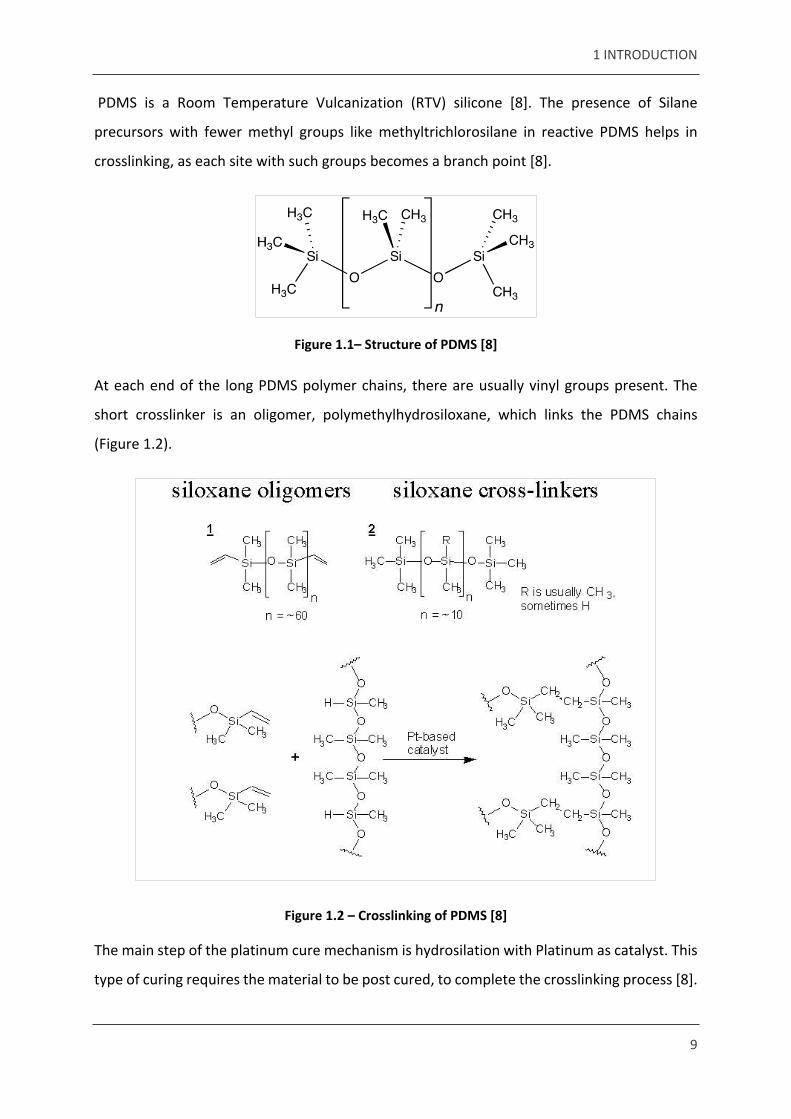
PDMS is a Room Temperature Vulcanization (RTV) silicone [8]. The presence of Silane
precursors with fewer methyl groups like methyltrichlorosilane in reactive PDMS helps in
crosslinking, as each site with such groups becomes a branch point [8].
Figure 1.1– Structure of PDMS [8]
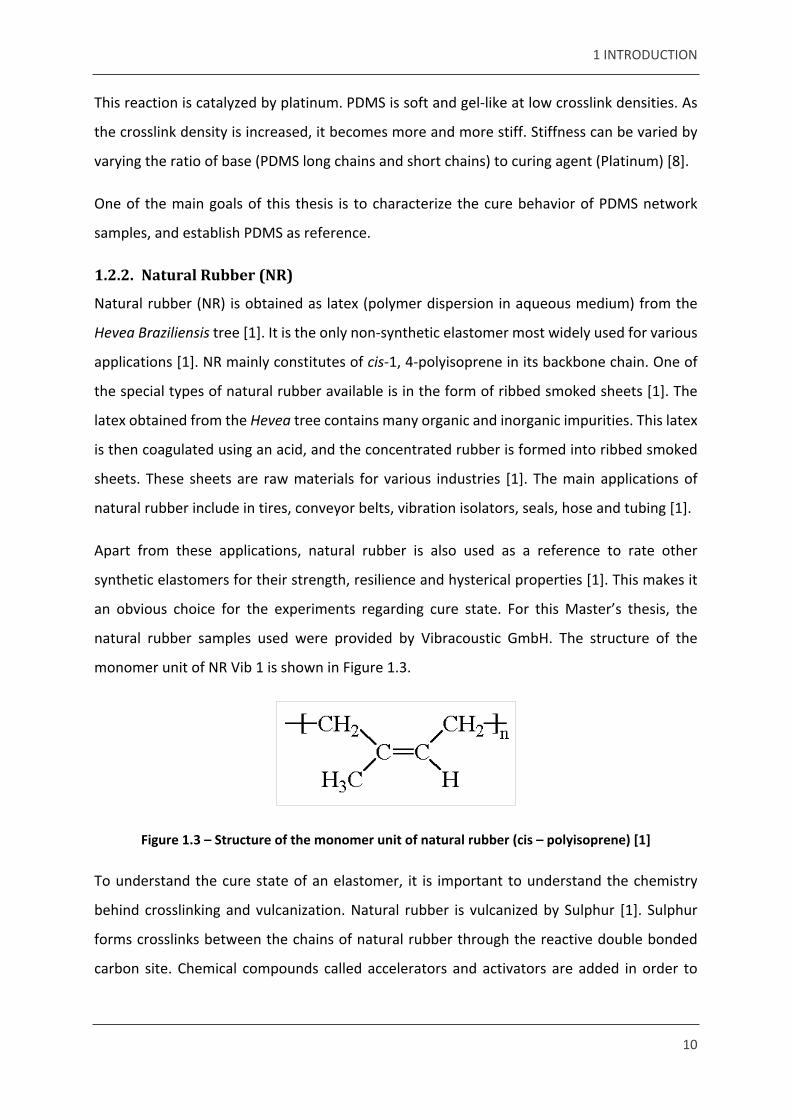
At each end of the long PDMS polymer chains, there are usually vinyl groups present. The
short crosslinker is an oligomer, polymethylhydrosiloxane, which links the PDMS chains
(Figure 1.2).
Figure 1.2 – Crosslinking of PDMS [8]
The main step of the platinum cure mechanism is hydrosilation with Platinum as catalyst. This
type of curing requires the material to be post cured, to complete the crosslinking process [8].
1 INTRODUCTION
10
This reaction is catalyzed by platinum. PDMS is soft and gel-like at low crosslink densities. As
the crosslink density is increased, it becomes more and more stiff. Stiffness can be varied by
varying the ratio of base (PDMS long chains and short chains) to curing agent (Platinum) [8].
One of the main goals of this thesis is to characterize the cure behavior of PDMS network
samples, and establish PDMS as reference.
1.2.2. Natural Rubber (NR)
Natural rubber (NR) is obtained as latex (polymer dispersion in aqueous medium) from the
Hevea Braziliensis tree [1]. It is the only non-synthetic elastomer most widely used for various
applications [1]. NR mainly constitutes of cis-1, 4-polyisoprene in its backbone chain. One of
the special types of natural rubber available is in the form of ribbed smoked sheets [1]. The
latex obtained from the Hevea tree contains many organic and inorganic impurities. This latex
is then coagulated using an acid, and the concentrated rubber is formed into ribbed smoked
sheets. These sheets are raw materials for various industries [1]. The main applications of
natural rubber include in tires, conveyor belts, vibration isolators, seals, hose and tubing [1].
Apart from these applications, natural rubber is also used as a reference to rate other
synthetic elastomers for their strength, resilience and hysterical properties [1]. This makes it
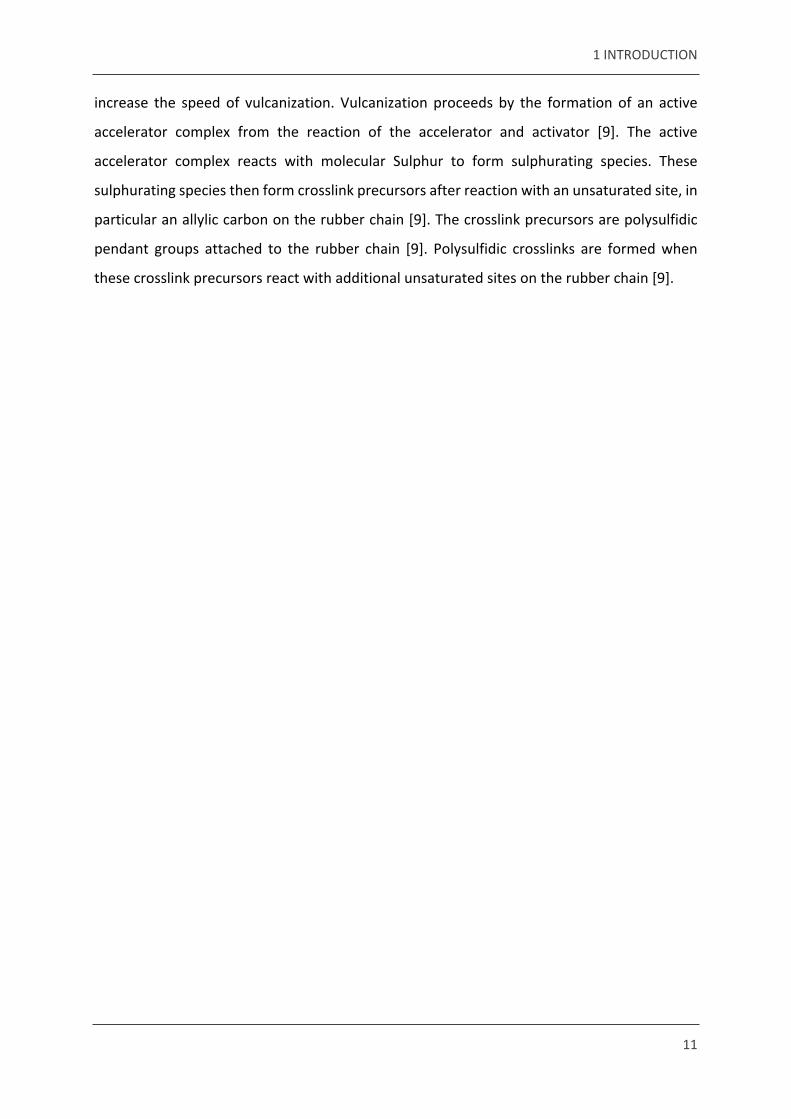
an obvious choice for the experiments regarding cure state. For this Master’s thesis, the
natural rubber samples used were provided by Vibracoustic GmbH. The structure of the
monomer unit of NR Vib 1 is shown in Figure 1.3.
Figure 1.3 – Structure of the monomer unit of natural rubber (cis – polyisoprene) [1]
To understand the cure state of an elastomer, it is important to understand the chemistry
behind crosslinking and vulcanization. Natural rubber is vulcanized by Sulphur [1]. Sulphur
forms crosslinks between the chains of natural rubber through the reactive double bonded
carbon site. Chemical compounds called accelerators and activators are added in order to
1 INTRODUCTION
11
increase the speed of vulcanization. Vulcanization proceeds by the formation of an active
accelerator complex from the reaction of the accelerator and activator [9]. The active
accelerator complex reacts with molecular Sulphur to form sulphurating species. These
sulphurating species then form crosslink precursors after reaction with an unsaturated site, in
particular an allylic carbon on the rubber chain [9]. The crosslink precursors are polysulfidic
pendant groups attached to the rubber chain [9]. Polysulfidic crosslinks are formed when
these crosslink precursors react with additional unsaturated sites on the rubber chain [9].

INTRODUCTION
12
13
2. THEORETICAL BACKGROUND
2.1. EXISTING TECHNIQUES
There are numerous methods existing in the industry today to characterize the vulcanization
time of elastomer products. Some major methods, their advantages and shortcomings, are
outlined in this section (Table 1.1). This provides an insight to the need for a new standardized
method to measure the cure time precisely.
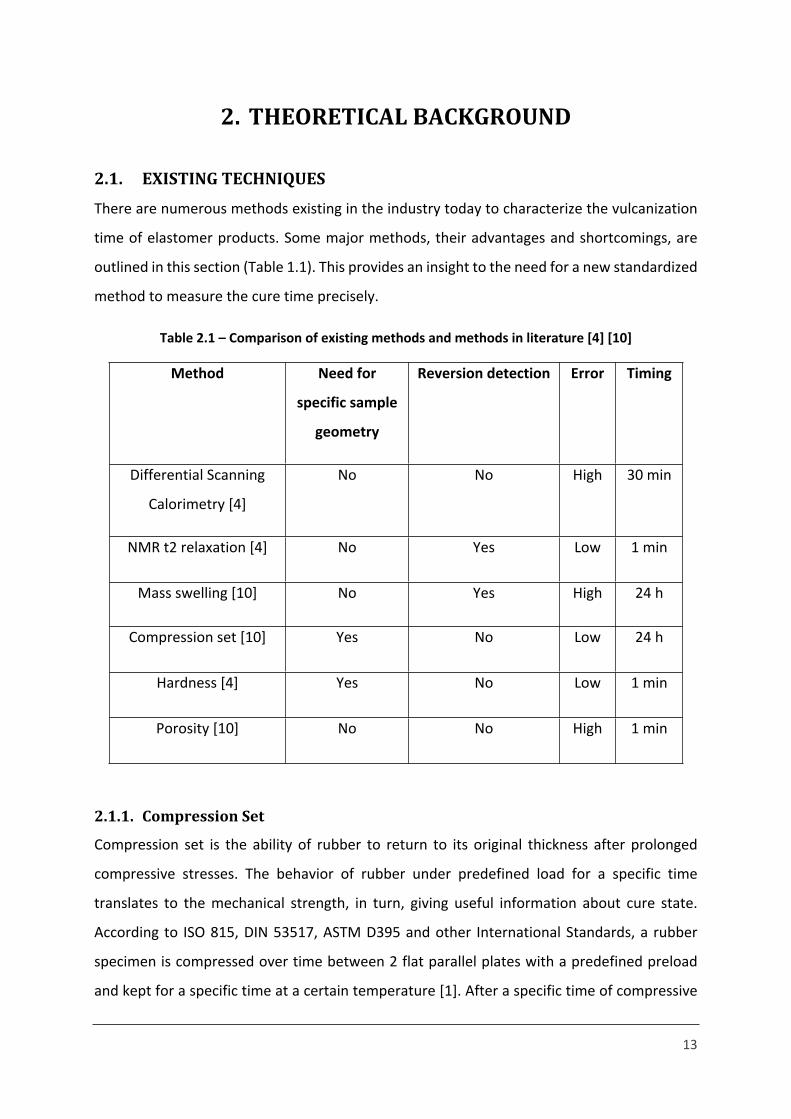
Table 2.1 – Comparison of existing methods and methods in literature [4] [10]
Method Need for
specific sample
geometry
Reversion detection Error Timing
Differential Scanning
Calorimetry [4]
No No High 30 min
NMR t2 relaxation [4] No Yes Low 1 min
Mass swelling [10] No Yes High 24 h
Compression set [10] Yes No Low 24 h
Hardness [4] Yes No Low 1 min
Porosity [10] No No High 1 min
2.1.1. Compression Set
Compression set is the ability of rubber to return to its original thickness after prolonged
compressive stresses. The behavior of rubber under predefined load for a specific time
translates to the mechanical strength, in turn, giving useful information about cure state.
According to ISO 815, DIN 53517, ASTM D395 and other International Standards, a rubber
specimen is compressed over time between 2 flat parallel plates with a predefined preload
and kept for a specific time at a certain temperature [1]. After a specific time of compressive
2 THEORETICAL BACKGROUND
14
force, the elastomer loses its ability to return to its original thickness. This test method also
characterizes the capability of an elastomeric product to perform elastically over a long period
of time [11].
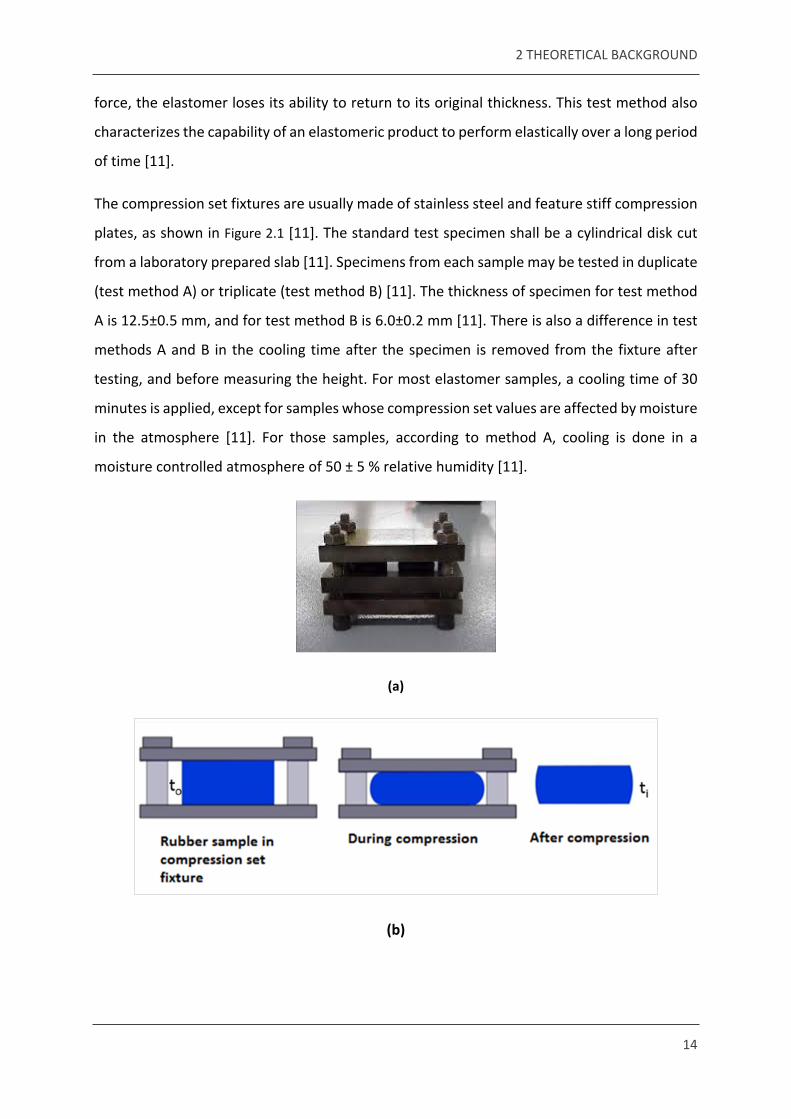
The compression set fixtures are usually made of stainless steel and feature stiff compression
plates, as shown in Figure 2.1 [11]. The standard test specimen shall be a cylindrical disk cut
from a laboratory prepared slab [11]. Specimens from each sample may be tested in duplicate
(test method A) or triplicate (test method B) [11]. The thickness of specimen for test method
A is 12.5±0.5 mm, and for test method B is 6.0±0.2 mm [11]. There is also a difference in test
methods A and B in the cooling time after the specimen is removed from the fixture after
testing, and before measuring the height. For most elastomer samples, a cooling time of 30
minutes is applied, except for samples whose compression set values are affected by moisture
in the atmosphere [11]. For those samples, according to method A, cooling is done in a
moisture controlled atmosphere of 50 ± 5 % relative humidity [11].
(a)
(b)
2 THEORETICAL BACKGROUND
15
Figure 2.1– (a) Compression set fixture (b) A rubber sample being subjected to compressive force
[11]
The compression set is calculated for test method A below (2.1).
(2.1) [11] 𝑪𝑨 = (𝒕𝒐 ‒ 𝒕𝒊
𝒕𝒐 ) × 𝟏𝟎𝟎
Where,
CA = Compression set (Test Method A) as a percentage of the original thickness
to = original thickness, and
ti = final thickness
Compression set is a classic method used in the industry to help determine the cure state of
an elastomer. The higher the crosslinking, lower is the chain mobility, and hence, lower the
compression set. A low compression set elastomer performs better during application of
compressive stresses than a high compression set elastomer. Since vulcanization is also done
to enhance the mechanical performance of elastomers in the field, compression set is an ideal
method to characterize the extent of cure in an elastomer.
Compression set requires at least 22 – 24 hours of testing time, during which the samples are
heated to a specific temperature [11]. The results are obtained after 24 hours of testing time
and 30 minutes of cooling time, which is a drawback, considering an industry setup where
production runs for 24 hours a day. The method is highly dependent on sample preparation,
sample mounting and pre-loading. Measurement of height after the test is done manually,
usually with a dial gauge, which might induce human error and can become unreliable. The
preparation of samples from complex geometries is not possible. Hence, the need for a new
method that optimizes the measurement time and is also reliable and reproducible is
prominent.
2.1.2. Swelling Experiments
Elastomers swell when they are in contact with a suitable solvent. This is a result of the
elastomer imbibing the solvent [7]. In the case of a linear non-crosslinked chain of an
2 THEORETICAL BACKGROUND
16
elastomer, the swelling is limited to the availability of solvent. When the elastomer is
crosslinked, and possesses a network structure, the amount of solvent absorbed, will reach
saturation, beyond which swelling will not occur. As the number of crosslinks in an elastomer
increases, swelling in a solvent decreases. The concept of swelling can be explained as the
effect of osmotic forces between the elastomer and the solvent. Swelling or expansion of the
elastomer is analogous to elastic deformation. When the elastic response of the network
structure is balanced by the osmotic forces, equilibrium between solvent in the gel and excess
solvent is attained [7]. Flory et al explained in his work on configurations theories that to reach
swelling equilibrium, the partial molal free energy of the solvent in the gel and the molal free
energy of the unabsorbed solvent should be equal [7]. Hence, for a crosslinked system,
swelling equilibrium is reached far earlier than for a linear non-crosslinked gel.
The classical swelling experiment used to determine cure state in the industry. In a standard
swelling experiment, a sample of the elastomer is made to come in contact with a suitable
solvent for 24 hours [12]. The elastomer sample swells in the due to the solvent. The sample
is weighted before the experiment and the swollen sample is weighted after exposure to the
solvent [12]. The swelling ratio is the ratio of initial and final weights of the sample, before
and after immersion. It is calculated using the formula below.
(2.2) [12]𝑺𝒘𝒆𝒍𝒍𝒊𝒏𝒈 𝒓𝒂𝒕𝒊𝒐 = 𝑾𝒇
𝑾𝒊
(2.3) [12]𝑺𝒘𝒆𝒍𝒍𝒊𝒏𝒈 % = (𝑾𝒊 ‒ 𝑾𝒇)
𝑾𝒊× 𝟏𝟎𝟎
Where, Wi is the initial weight of the elastomer, and Wf is the weight of the elastomer after
swelling in the solvent.
Swelling experiments are a simple and inexpensive way to characterize polymer networks.
They are essentially used for quality control and aid as an indexing tool for polymer systems
with different levels of crosslinking in the industry [12]. Swelling experiments are done
manually, and mostly with a liquid solvent. This makes handling and measurement of weight
after immersion tricky. Also, the removal of excess solvent from the sample can be done by
various methods like wiping or blow drying. This produces discrepancies. The elastomer is
immersed in the solvent for at least 24 hours, which makes the experiment time consuming.
2 THEORETICAL BACKGROUND
17
2.1.3. Rheometer
The study of flow and deformation of materials under applied forces is called rheology [1].
Rheology tests of polymers study the relationship between the stress and deformation with
respect to flow properties. Laboratory methods to study rheology can help in deciding optimal
processing conditions, which save costs and minimize waste. Rheology tests could also give an
insight to cure state of an elastomer [7].
The rheometer can be used to analyze the vulcanization characteristics of elastomer
compounds [1]. A sinusoidal strain is applied to the uncured elastomer sample in a sealed and
pressurized cavity [1]. Due to the viscoelastic nature of elastomers, the applied strain is out of
phase with the measured complex torque response. The out of phase response is quantified
by the phase angle δ [1].
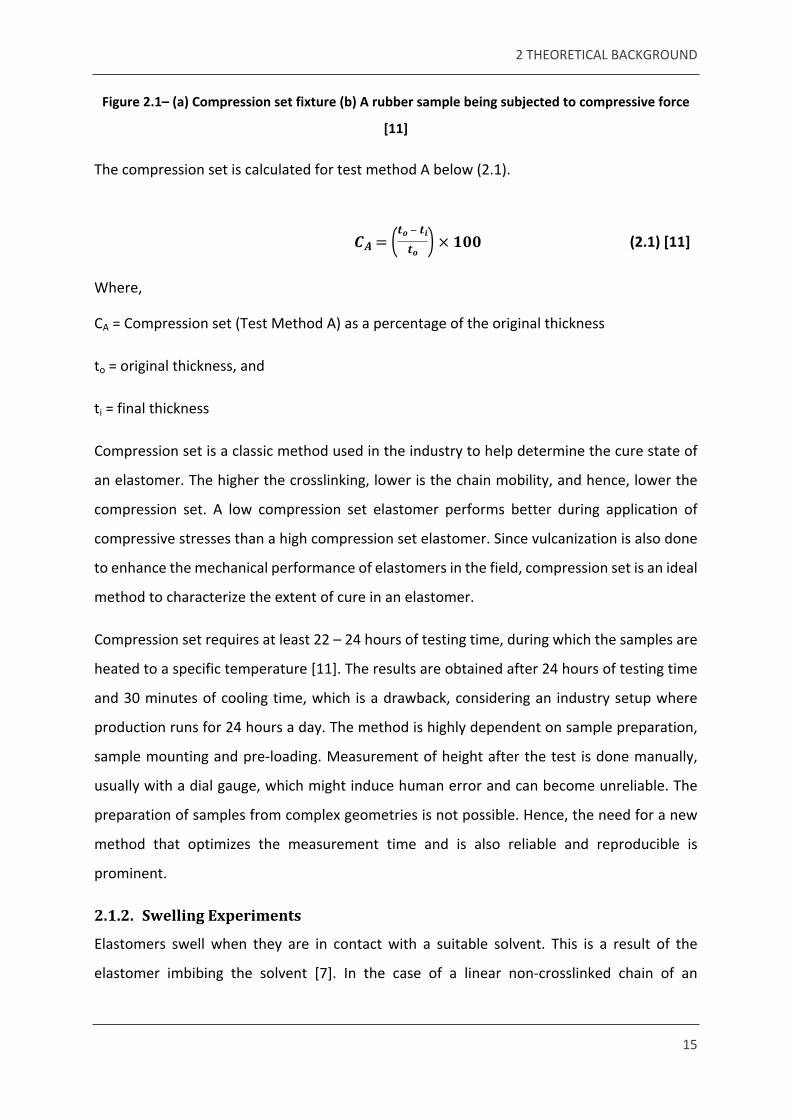
The elastomer sample cures in the cavity of the rheometer under high temperature and
pressure, and the values of torque start to vary. The Moving Die Rheometer (MDR) employs a
set of dies between which the uncured sample is mounted. The torque is measured and
plotted against time for which the sample is cured between the die. Figure 2.2 is a typical
schematic obtained from a Rheometer for a natural rubber sample.
Figure 2.2 – Rheometer curve [13]
2 THEORETICAL BACKGROUND
18
There are three stages represented in a vulcanization curve. In the first stage, there is a slow
chemical reaction between the rubber and additives, this is the induction phase. During this
phase, the rubber is not scorched, and starts to flow. This is also called scorch safety. During
the second stage, curing proceeds in the elastomer and networks start forming. The rate of
vulcanization can be calculated from this stage. The optimum cure of the sample is observed
at t90, which is defined as the time necessary for the torque to attain 90% of the maximum
achievable torque. In the final stage, there is a chance of over curing to occur, based on the
rubber type, temperature and curing agent [13].
2.1.4. Other Methods in Literature
Literature study gives an insight into the methods that have been developed before to solve
the problem of characterizing the exact cure time. Methods like Nuclear Magnetic Resonance
(NMR) Spectroscopy and Porosity tests have been long used in the industry to solve this
problem. Some of their disadvantages were outlined in Table 2.1.
Kirchhoff et al have explored into ultrasound techniques to determine the cure state in their
work [14]. The method uses ultrasound waves that are passed through the isolated sample
and the reflected waves are measured by a detector. Speed of sound in the sample and
attenuation coefficient are correlated to the mechanical properties of the elastomer. The
attenuation coefficient and phase velocity were used to calculate complex moduli and
dynamic loss factors. Frequencies between 0.5 to 10 MHz were used to test elastomer
samples. The tests were also done on samples with fabric layers to check the applicability of
the technique. The main advantage of this method is that the results are immediately available
and the waiting time is short. It can be highly reproducible and is non-destructive to the
sample. Some of the disadvantages outlined in the paper include that it requires high
resolution and cannot be used at elevated temperatures due to the dependency of
attenuation coefficient on temperature. The reproducibility of the measurement of
attenuation for thin samples with fabric layers is very low. The resolution of the technique is
dependent on temperature [14].
Liebers et al have researched further into the ultrasonic methods of cure testing [15]. In a
conference for the German Aerospace Centre (DLR), they presented that the most innovative,
time saving and advantageous way of measuring cure state of composites would be by the use
2 THEORETICAL BACKGROUND
19
of in situ sensors that measure the cure time during production. The role of process integrated
sensors in quality assurance, process optimization and automation was explained. One of the
methods include the adaptation of an ultrasonic transducer into the mould using a vacuum
bag. This would require access from both sides of the mould for detection of the cure state
using ultrasonic waves. The installation of transducers requires preparation as they have to be
placed in an adapter and sealed into the vacuum bag which might also be a leakage risk [15].
Zaimova et al studied the use of Differential Scanning Calorimeters (DSC) in cure time
characterization [4]. The standard DSC is used to study phase transitions and measure the
glass transition temperature. DSC measurements were done on molded test sheets of natural
rubber to study the cure state. The results showed 20 % error due to the low sensitivity of the
method. Three levels of state of cure were detected using this method. The precision of this
method was low, and reversion could not be detected [4].
Pickering et al used the Dynamic Mechanical Analyser (DMA) to understand the vulcanization
state of elastomers, and then compared it to standard rheometer (MDR) measurements [13].
The DMA is used to analyse the elastomer’s response to sinusoidal deformation. The glass
transition temperature, loss and storage moduli, and viscosity can be determined by using the
DMA. An isothermal time sweep was done on natural rubber samples with different ratios of
compounding ingredients. The results from DMA were compared to standard rheometer tests
and the three major stages of vulcanization as understood from the rheometer curve (Figure
2.2) were observed [13].
From literature study, it became evident that there is need for a new method that helps in
characterizing the cure time with the following advantages
Small sample – the advantage of testing parts with complex geometries
Short time – a method that can be incorporated in the production line and does not
consume a high amount of time
Reliable and precise measurement of cure state
A method with the above mentioned advantages is an essential step to solving the problem
of cure state characterization.
2 THEORETICAL BACKGROUND
20
2.2. MICRO CANTILEVER SENSOR (MCS) TECHNOLOGY
Micromechanical cantilever sensors are made from Silicon wafers with dimensions in the
order of approximately 750 μm or above. These cantilevers have applications in several
sectors such as telecommunications, consumer electronics, transportation, building
automation and healthcare [16]. Their initial important application was as force probes in
atomic force microscopy (AFM). The silicon probes in AFM are extremely sensitive to various
factors like acoustic noise, temperature, humidity, and ambient pressure, which may be an
interference during measurement with an AFM. Later research led to the observation that the
same mechanisms that caused unwanted interference in an AFM can be converted into a
platform for a new family of sensors. The new family of sensors relies on measuring the shifts
in resonance frequencies of the micro cantilevers. They are mass sensitive devices that can be
used in place of conventional piezoelectric sensors due to their high sensitivity, and small size
[17].
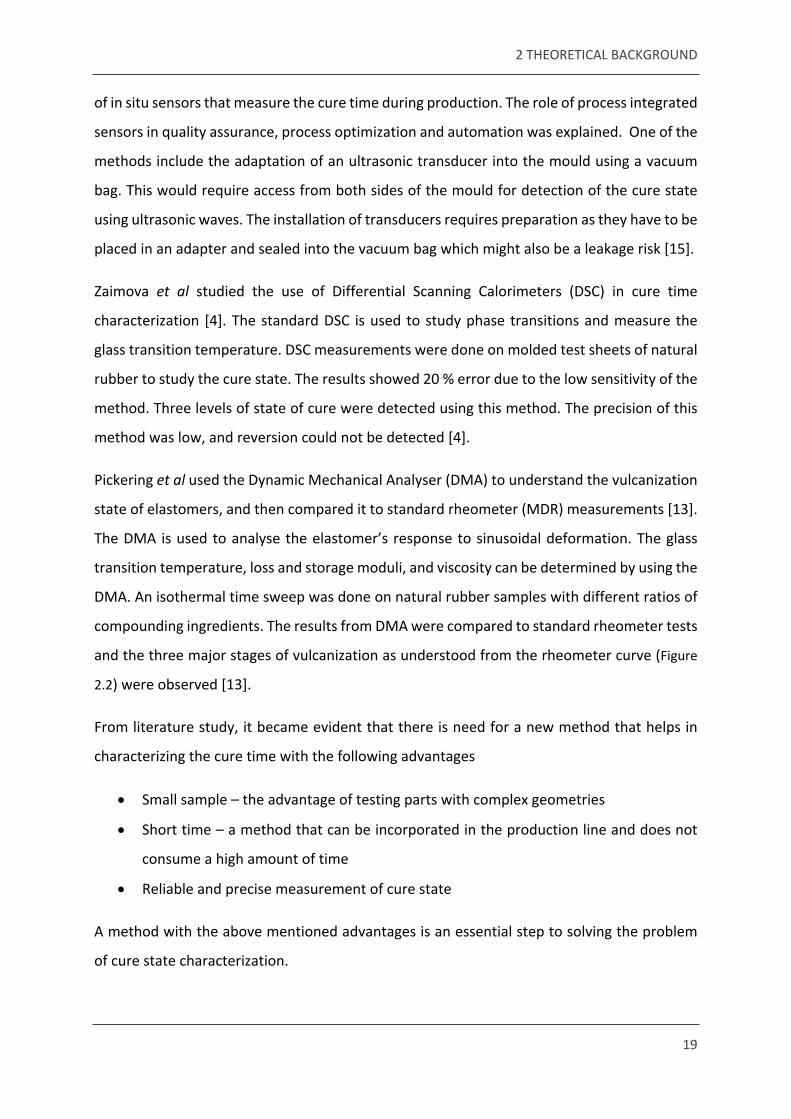
Figure 2.3– Micro cantilever sensor [17]
The mass sensitivity of micro cantilevers can be very well exploited by the rubber industry in
the area of cure time characterization. A simple and standard experiment used in the industry
to measure the optimum cure time is the swelling experiment. As explained in section 2.1.2,
a small sample of elastomer (macro scale) is immersed in solvent solution for 24 hours. The
sample is weighted before and after immersion. The swelling ratio is calculated from the
difference in weight of the elastomer before and after immersion. The swelling ratio is
inversely proportional to the cure state. This same concept can be applied to the micro
cantilevers and the mass sensitive resonance frequency can be a measure of the cure state.
The main advantage of such a technique is the sample size of about 50 μm, and a weight of
10-11 g. A highly magnified sample is a benefit while studying cure states of products with
2 THEORETICAL BACKGROUND
21
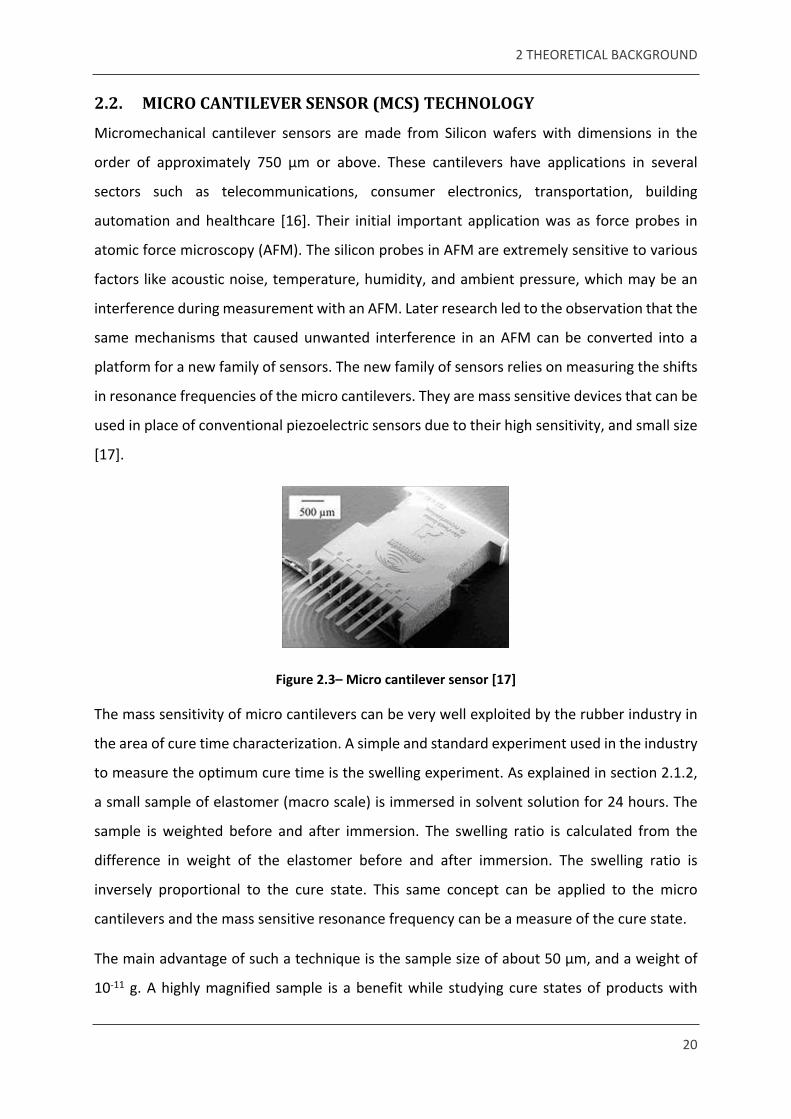
complex geometries, as there is only need for a smaller area of the sample. The micro sample
is carefully mounted on the cantilever and exposed to solvent vapor. The resonance
frequencies during exposure to solvent are measured. A steady decrease in resonance
frequency is expected as the mass increases due to absorption of solvent by the elastomer.
The resonance frequency difference corresponds to the mass difference and helps in
measuring cure state of the sample.
(a)
(b)
Figure 2.4 – (a) A 50 μm particle is mounted on the cantilever before testing. The change in mass occurs due to solvent swelling. (b) The shift in resonance frequency occurs as a result of change in
mass of swollen elastomer.
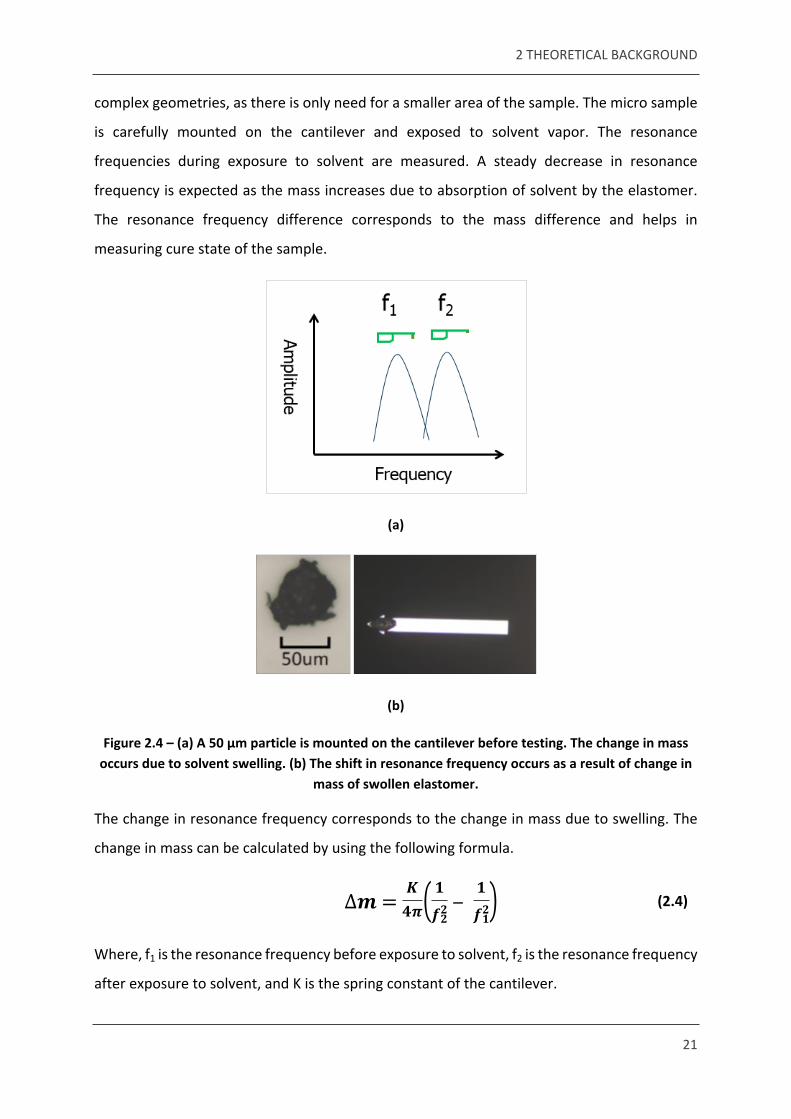
The change in resonance frequency corresponds to the change in mass due to swelling. The
change in mass can be calculated by using the following formula.
(2.4)∆𝒎 =𝑲
𝟒𝝅( 𝟏
𝒇𝟐𝟐
‒ 𝟏
𝒇𝟐𝟏)
Where, f1 is the resonance frequency before exposure to solvent, f2 is the resonance frequency
after exposure to solvent, and K is the spring constant of the cantilever.
2 THEORETICAL BACKGROUND
22
The huge advantage is that of obtaining results in a relatively short period of approx. 30
minutes, as opposed to 24 hours for classical swelling experiment. This is feasible due to the
small size of the sample that takes less time to swell when exposed to solvent. The mass
resolution of the sample is a boon to test cure states throughout the thickness of the
elastomer product. In addition to determining the vulcanization extent, this method can also
be used to understand the swelling – de-swelling behavior of the elastomer.
2.3. PIEZORHEOLOGY
2.3.1. Flory – Rehner theory
Elastomers with crosslinks in their chains can assume various configurations depending on the
free rotation about the carbon-carbon bonds in their main chain. In November 1943, Flory and
Rehner [7] developed a statistical mechanical theory of chain configuration. This theory aids
in explaining the elasticity of rubbers and other long chained macromolecules. According to
this theory, the rubber chains in the non-deformed state assume configurations close to their
most probable state. Deformation displaces the configuration and decreases entropy of the
chain. This explains the elastic nature of rubber. Various theories of chain configuration
propose the relation between elastic properties and the structure of a crosslinked system.
Swelling of crosslinked networks can be understood as the osmotic dilution opposed by the
elastic response of the swollen network. The Flory–Rehner equation describes the equilibrium
swelling of a crosslinked polymer in terms of crosslink density. The theory considers forces
arising from three sources – the change in entropy due to mixing, the change in entropy due
to swelling (reduction in number of possible chain conformations), and the heat of mixing [7].
The equation is given as,
(2.5) [7]‒ [𝐥𝐧 (𝟏 ‒ 𝒗𝟐) + 𝒗𝟐 + 𝝌𝟏𝒗𝟐𝟐] = 𝑽𝟏𝒏 (𝒗
𝟏𝟑𝟐 ‒
𝒗𝟐
𝟐 )Where, v2 is the volume fraction of polymer in the swollen mass, V1 is the molar volume of the
solvent, n is the number of network chain segments bounded on both ends by crosslinks,
and 𝜒1 is the Flory solvent-polymer interaction term [7].
2 THEORETICAL BACKGROUND
23
2.3.2. Piezorheology
The rheological behavior of a complex network system possesses many unanswered questions
[18]. In this thesis, the focus is on the mechanical properties as a function of frequency. For
this, a homemade piezorheometer is used [19].
Piezorheometers follow the set up and principles of classic oscillatory rheometers. Here, the
excitation of piezoactuators is achieved by the principles of piezoelectric and inverse
piezoelectric effect, contrary to the use of electro motors and capacitive transducers in
conventional rheometers [18]. The strain amplitudes for conventional rheometers are in the
range of 10-2 or higher, while the minimum strain amplitudes of piezorheometers are about
10-4 [19]. The applied strain on the sample is very small, owing to the mechanical excitation
by piezoelectric actuators. At these small strains yielding is avoided for fragile materials, which
makes piezorheometers suitable for measurements in the linear regime. The low
deformations can contribute to the device being reproducible [18]. The frequency dependent
shear moduli can be measured from 0.1 to 1000 Hz. Moreover, compact design can be
achieved by the use of piezoelectric actuators [19]. The upper frequency limit is shifted to 1
kHz due to the reduced inertia moments [18]. Beyond 1 kHz, resonance effects prevent an
accurate determination of the shear modulus [18].
Durand et al brought together a piezorheometer for the first time, to study smectic liquid
crystalline phases [20]. In the first piezorheometer, small strains were crucial as the
deformation energies required were low. Yamamoto et al and others made further
developments in the piezorheometer, but kept the original design intact (13). The master
thesis also uses similar design as made by M. Roth et al in the analysis of colloid liquid crystal
composites [18].
2 THEORETICAL BACKGROUND
24
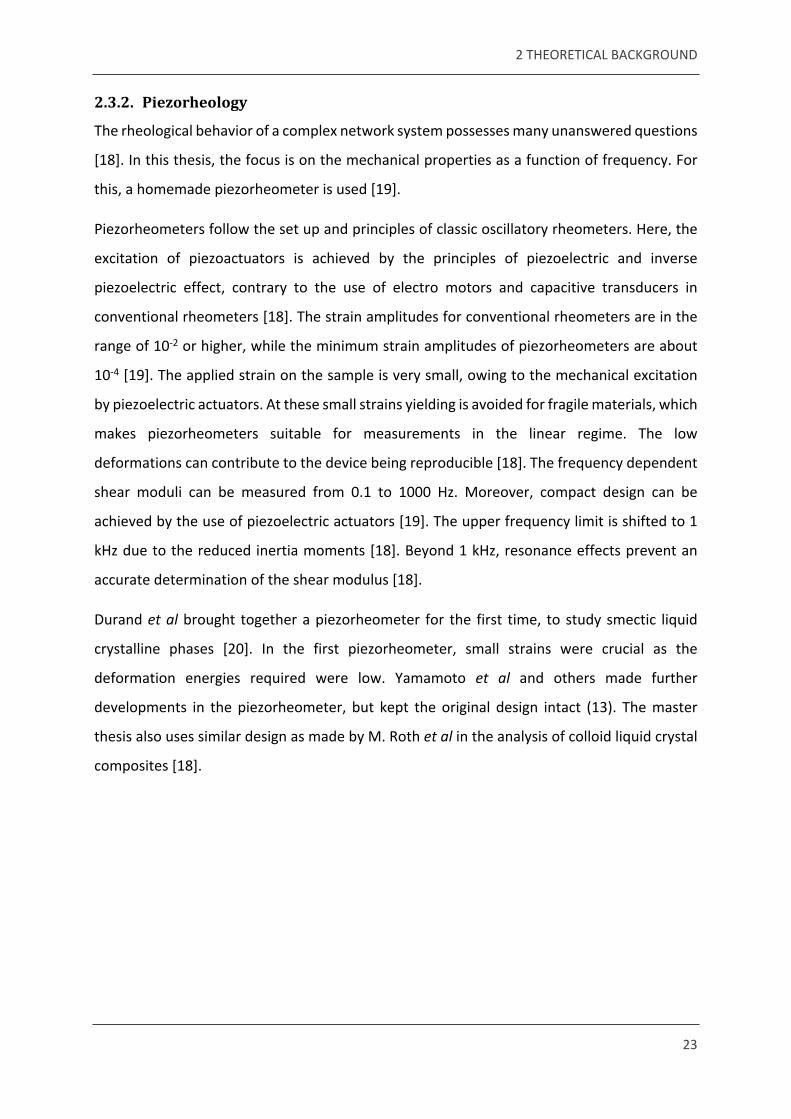
Figure 2.5 – Schematic of Piezorheometer. Scale bar indicates dimensions [18].
The piezorheometer operates in shear mode, and follows the principles of construction, as
mentioned by Durand et al [20]. Figure 2.5 illustrates the important elements of the set up.
There are two piezoceramic stacks (PICA™ Shear Piezo Actuators; PICeramic, Lederhose,
Germany), both the stacks are glued on to a glass substrate on one end and a glass holder on
the other end [18]. The gap between the two glass holders is between 10 μm and 5 mm, where
the sample is placed [18]. This gap is confined by three fine thread screws that have an
accuracy of 3 μm [19]. The dimensions of the glass substrates were (12 20 2) mm3, and × ×
that of the whole cell were (55 58 100) mm3 [19]. × ×
The piezoelectric stack was excited electronically by using a frequency generator (33220A;
Agilent), that applied a sinusoidal voltage VE (t) [18].
(2.6) [18]𝑽𝑬(𝒕) = 𝑽𝑬𝒐𝐬𝐢𝐧 (𝝎𝒕)
In this experiment, the frequency was varied between 0.1 to 1000 Hz, and the amplitude VEo
was in the range of 0.5 to 10 Vpp. From the understanding of inverse piezoelectric effect and
specific polarization of ceramics, it can be said that this voltage is transferred to shear
deformation s(t) of the sample [18].
(2.7) [18]𝒔(𝒕) = 𝒅𝟏𝟓𝑽𝑬(𝒕)
2 THEORETICAL BACKGROUND
25
The proportionality constant in this case is d15 = (3.4 ± 0.1) 10-18 m/V, with absolute ×
deformations in the range, smin = 7 nm, and smax = 600 nm. In this range, the proportionality is
preserved [18]. The deformation is transmitted into the sample through the complex shear
modulus G*(ω). Free charges QD (t) are generated by piezoelectric effect on the
piezoactuators, as a result of the stress σ (t) in the upper glass substrate [19].
(2.8) [18]𝑸𝑫(𝒕) = 𝒅𝟏𝟓 . 𝝈(𝒕) = 𝒅𝟏𝟓 . 𝑮 ∗ (𝝎) . 𝒔(𝒕)
𝑫
A charge sensitive amplifier (Type 2635; Brühl and Kjaer) is used to collect these generated
charges and convert them into a voltage VD (t). An oscilloscope (DSO6044; Agilent) records VD
(t) at the same time with the excitation voltage. Since the stress is directly proportional to VD
(t), the ratio of amplitude and the phase difference of VE (t) and VD (t) give a direct measure
of the complex shear modulus [19].
At low levels of signal the detection of deformation by the piezo could be approximately 0.2
pm. The charges generated are in the order of 0.1 pC, which is equal to a stress of σmin = 1 Pa
[19]. The minimum shear modulus, with respect to the thickness D, can be calculated by
Equation 8, below.
(2.9) [19]|𝑮 ∗𝒎𝒊𝒏| =
𝝈𝒎𝒊𝒏
𝒔𝒎𝒊𝒏 . 𝑫 ≈ 𝟓𝐏𝐚/𝛍𝐦. 𝑫 . 𝑨
Where, A is the empirical scaling factor, whose value depends on the recorded data [18]. The
data set was processed by Fourier transformation to obtain averaged values for the shear
moduli. The piezoceramic stacks were comprised of single sheets arranged in the order of
alternating crystal orientations and electric contacts. This cancelled ell effective long
wavelength electromagnetic radiation. Hence, electromagnetic isolation was achieved as an
intrinsic feature of the piezoceramic stack [19]. All the cable connections to the actuators were
shielded using metal, which is not shown in Figure 2.5 [18].
M. Roth et al made gauging measurements as part of calibration of the device [19].
Measurements were made for absolute values of complex shear modulus, with the help of
two calibration fluids that behaved as pure Newtonian liquids over a broad frequency range
[19]. The frequency dependence of loss modulus G’’ was measured at different temperatures.

2 THEORETICAL BACKGROUND
26
The viscosity was derived from fitting. The overall error of viscosity data amounted to less
than 3% [18].
27
3. EXPERIMENT
3.1. SAMPLES
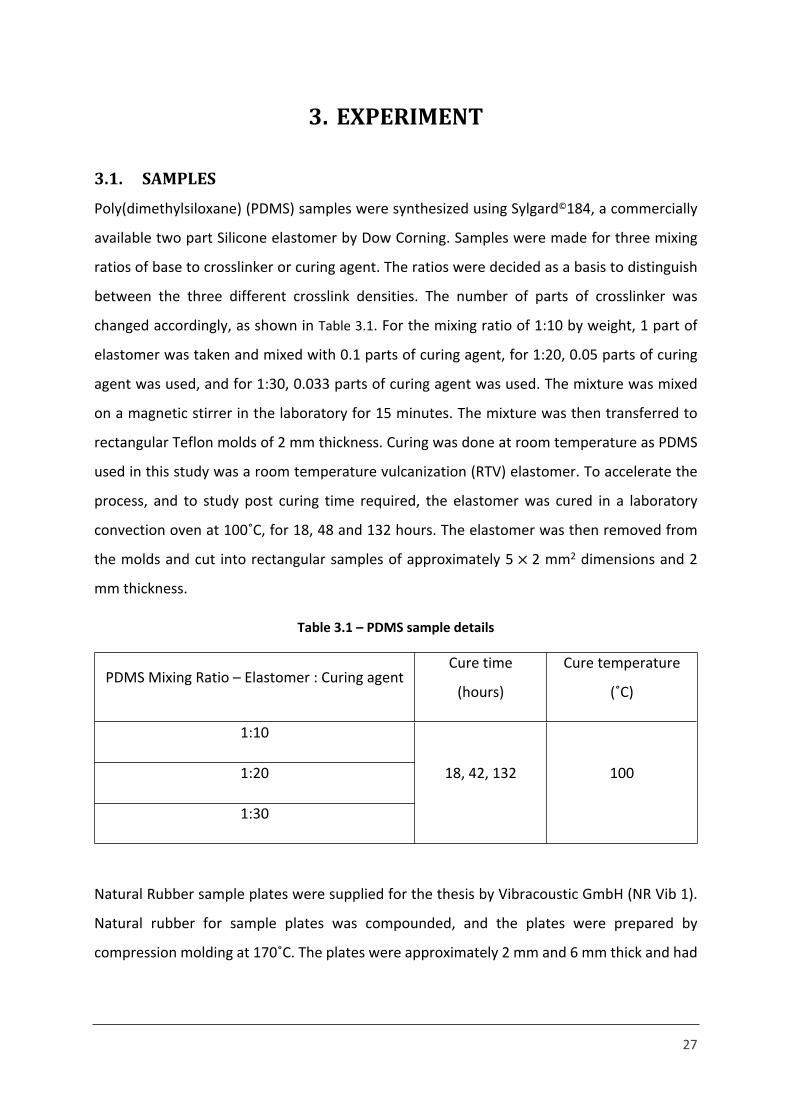
Poly(dimethylsiloxane) (PDMS) samples were synthesized using Sylgard©184, a commercially
available two part Silicone elastomer by Dow Corning. Samples were made for three mixing
ratios of base to crosslinker or curing agent. The ratios were decided as a basis to distinguish
between the three different crosslink densities. The number of parts of crosslinker was
changed accordingly, as shown in Table 3.1. For the mixing ratio of 1:10 by weight, 1 part of
elastomer was taken and mixed with 0.1 parts of curing agent, for 1:20, 0.05 parts of curing
agent was used, and for 1:30, 0.033 parts of curing agent was used. The mixture was mixed
on a magnetic stirrer in the laboratory for 15 minutes. The mixture was then transferred to
rectangular Teflon molds of 2 mm thickness. Curing was done at room temperature as PDMS
used in this study was a room temperature vulcanization (RTV) elastomer. To accelerate the
process, and to study post curing time required, the elastomer was cured in a laboratory
convection oven at 100˚C, for 18, 48 and 132 hours. The elastomer was then removed from
the molds and cut into rectangular samples of approximately 5 2 mm2 dimensions and 2 ×
mm thickness.
Table 3.1 – PDMS sample details
PDMS Mixing Ratio – Elastomer : Curing agentCure time
(hours)
Cure temperature
(˚C)
1:10
1:20
1:30
18, 42, 132 100
Natural Rubber sample plates were supplied for the thesis by Vibracoustic GmbH (NR Vib 1).
Natural rubber for sample plates was compounded, and the plates were prepared by
compression molding at 170˚C. The plates were approximately 2 mm and 6 mm thick and had
3 EXPERIMENT
28
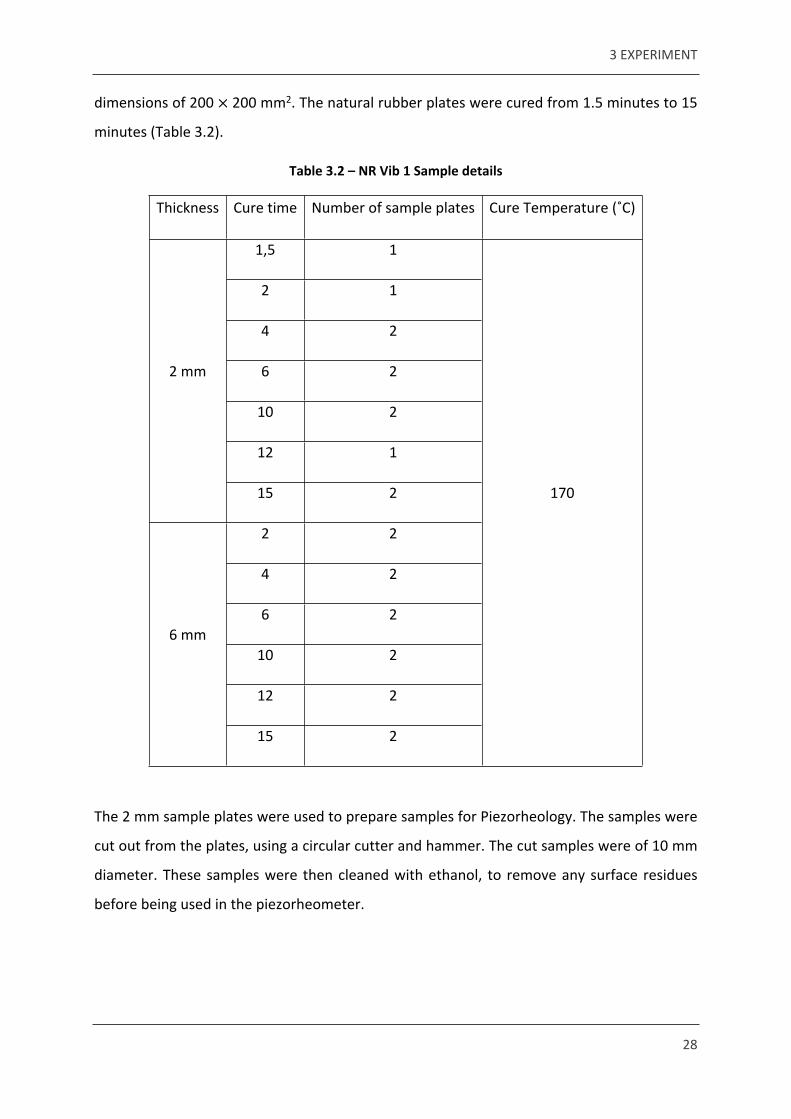
dimensions of 200 200 mm2. The natural rubber plates were cured from 1.5 minutes to 15 ×
minutes (Table 3.2).
Table 3.2 – NR Vib 1 Sample details
Thickness Cure time Number of sample plates Cure Temperature (˚C)
1,5 1
2 1
4 2
6 2
10 2
12 1
2 mm
15 2
2 2
4 2
6 2
10 2
12 2
6 mm
15 2
170
The 2 mm sample plates were used to prepare samples for Piezorheology. The samples were
cut out from the plates, using a circular cutter and hammer. The cut samples were of 10 mm
diameter. These samples were then cleaned with ethanol, to remove any surface residues
before being used in the piezorheometer.
3 EXPERIMENT
29
3.2. PIEZORHEOLOGY
Poly(dimethylsiloxane) samples were tested in the piezorheometer to obtain values of loss
modulus G’’, and storage modulus G’. The device was first aligned in such a way that the glass
substrates touched each other. The gap size was completely reduced for this, with the help of
fine thread screws, as in Figure 2.5. Plate parallelism was checked by Newton rings due to
multiple reflections from the interface of air and the glass substrates [18]. Then, all three fine
thread screws were adjusted in order to increase the gap between the glass substrates. M.
Roth et al estimated the quality of parallelism to be better than 0.1˚ [18]. The difference
between total distance of the glass holders at the centre and the distance when the glass
substrates touch each other gives the absolute gap size [19]. The thickness of the PDMS
samples was measured using a screw gauge, and the gap size was set equal to the measured
thickness. The PDMS samples (5 2 mm2) were placed in such a way that they had a plain, ×
flat and clean surface in contact with the glass plates of the piezorheometer. The set up was
then screwed tight using three fixation screws (Figure 2.5), by hand. After every measurement,
the surface of the glass substrates was cleaned with ethanol in the laboratory.
Natural rubber (NR Vib 1) samples were tested in the piezorheometer in a similar way. The
samples were round, and of 10 mm diameter. They were cut from the centre of the sample
plate initially, and later from other places for extensive analysis. The samples were placed on
the glass substrates using the method detailed above. The thickness of the samples was
measured with the same screw gauge. The surface of the natural rubber samples was cleaned
with ethanol solution, in order to remove all the contaminants from blooming. Blooming of
rubber is caused by the migration of compounding chemicals like antioxidants, wax and anti-
degradants to the surface, due to their poor solubility in the rubber matrix [1]. It was essential
to remove the “bloom” in order to avoid variations caused due to bad contact between the
sample and the glass substrates.
The dynamic measurements were made for each sample for typically ten periods, and 20000
points per period. The data was measured from 0.1 Hz to 1000 Hz, at an input voltage of 2 V
(Vpp). Measurements were made to analyze the effect of the input voltage, by varying the
input voltage to 0.5,2, 5, and 10 V. All the measurements were made for at least 3 consecutive
3 EXPERIMENT
30
times on the same sample, to help calculate the error due to noise in the setup. The
measurements were saved and the values of G’ and G’’ are then post processed.
3.3. SWELLING EXPERIMENTS
Classical swelling experiments were done on the reference (PDMS) and on natural rubber to
be compared to the results from piezorheology. The samples were cut out from sheets and
immersed in liquid toluene for 72 hours. The weight of the samples was calculated before and
after immersion. The swelling ratio was then calculated from the weights (equation 2.2).
31
4. RESULTS AND DISCUSSION
4.1. POLY(DIMETHYLSILOXANE) (PDMS)
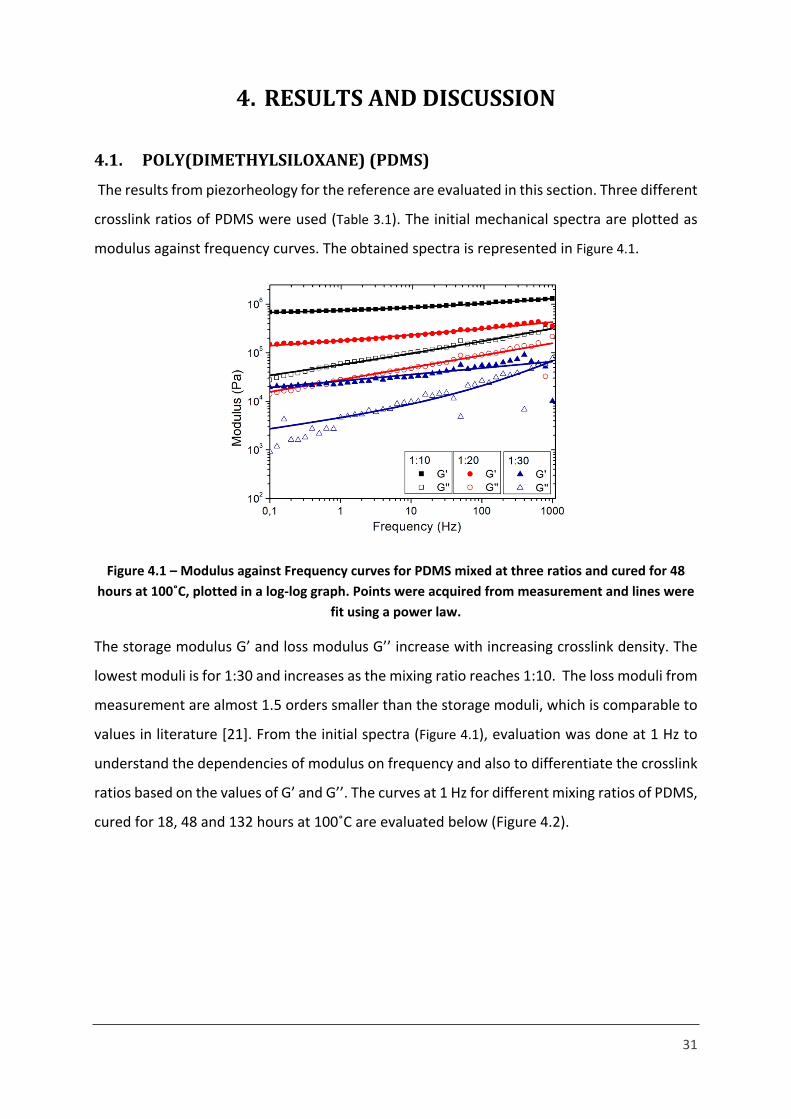
The results from piezorheology for the reference are evaluated in this section. Three different
crosslink ratios of PDMS were used (Table 3.1). The initial mechanical spectra are plotted as
modulus against frequency curves. The obtained spectra is represented in Figure 4.1.
Figure 4.1 – Modulus against Frequency curves for PDMS mixed at three ratios and cured for 48 hours at 100˚C, plotted in a log-log graph. Points were acquired from measurement and lines were
fit using a power law.
The storage modulus G’ and loss modulus G’’ increase with increasing crosslink density. The
lowest moduli is for 1:30 and increases as the mixing ratio reaches 1:10. The loss moduli from
measurement are almost 1.5 orders smaller than the storage moduli, which is comparable to
values in literature [21]. From the initial spectra (Figure 4.1), evaluation was done at 1 Hz to
understand the dependencies of modulus on frequency and also to differentiate the crosslink
ratios based on the values of G’ and G’’. The curves at 1 Hz for different mixing ratios of PDMS,
cured for 18, 48 and 132 hours at 100˚C are evaluated below (Figure 4.2).
4 RESULTS AND EVALUATION
32
(a)
(b)
4 RESULTS AND EVALUATION
33
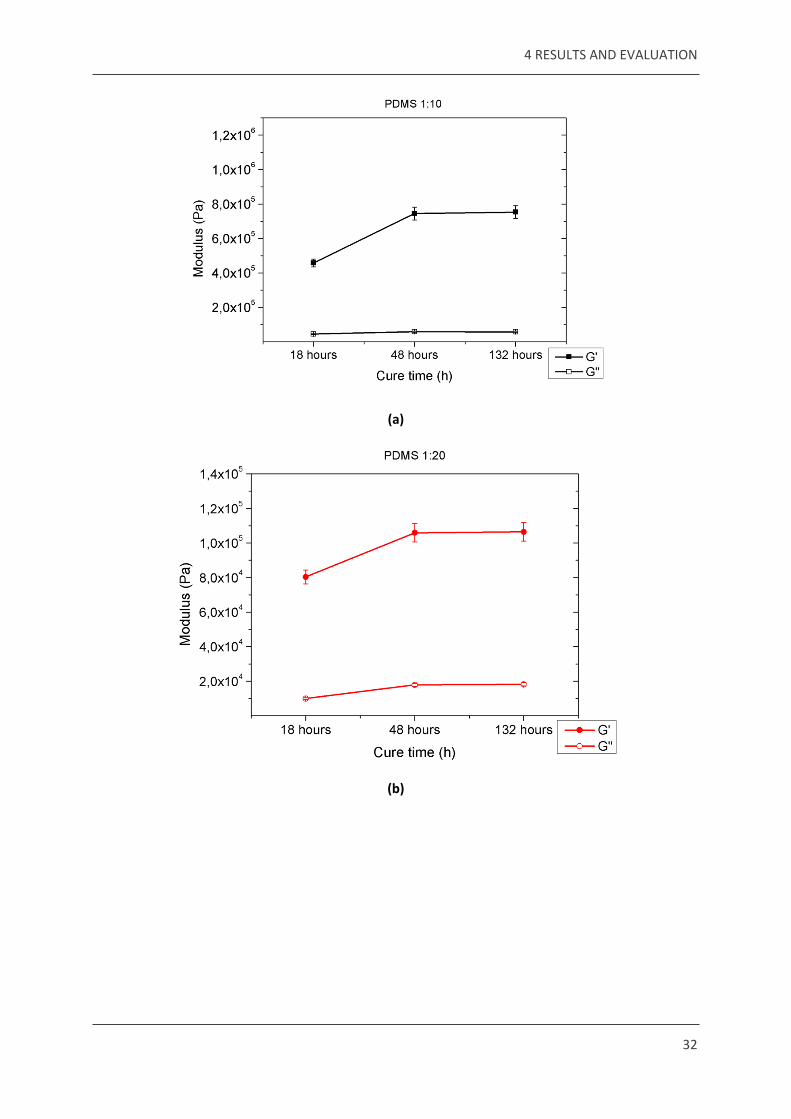
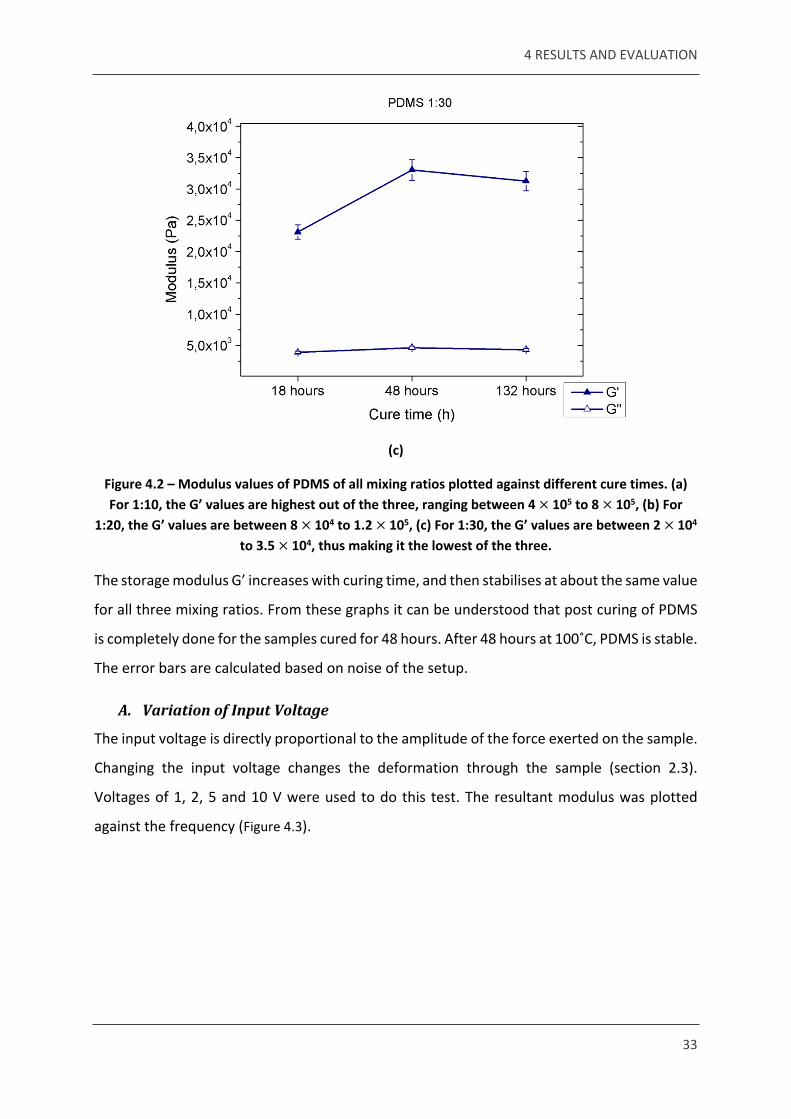
(c)
Figure 4.2 – Modulus values of PDMS of all mixing ratios plotted against different cure times. (a) For 1:10, the G’ values are highest out of the three, ranging between 4 105 to 8 105, (b) For × ×
1:20, the G’ values are between 8 104 to 1.2 105, (c) For 1:30, the G’ values are between 2 104 × × ×to 3.5 104, thus making it the lowest of the three.×
The storage modulus G’ increases with curing time, and then stabilises at about the same value
for all three mixing ratios. From these graphs it can be understood that post curing of PDMS
is completely done for the samples cured for 48 hours. After 48 hours at 100˚C, PDMS is stable.
The error bars are calculated based on noise of the setup.
A. Variation of Input Voltage
The input voltage is directly proportional to the amplitude of the force exerted on the sample.
Changing the input voltage changes the deformation through the sample (section 2.3).
Voltages of 1, 2, 5 and 10 V were used to do this test. The resultant modulus was plotted
against the frequency (Figure 4.3).
4 RESULTS AND EVALUATION
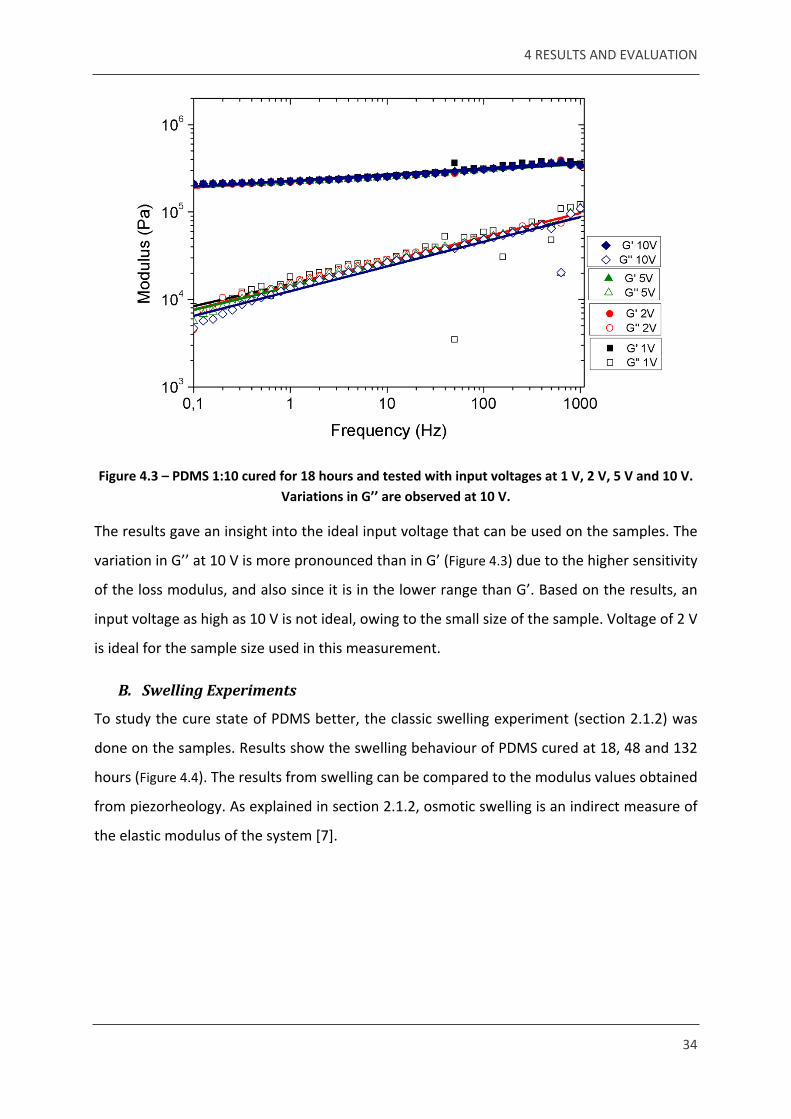
34
Figure 4.3 – PDMS 1:10 cured for 18 hours and tested with input voltages at 1 V, 2 V, 5 V and 10 V. Variations in G’’ are observed at 10 V.
The results gave an insight into the ideal input voltage that can be used on the samples. The
variation in G’’ at 10 V is more pronounced than in G’ (Figure 4.3) due to the higher sensitivity
of the loss modulus, and also since it is in the lower range than G’. Based on the results, an
input voltage as high as 10 V is not ideal, owing to the small size of the sample. Voltage of 2 V
is ideal for the sample size used in this measurement.
B. Swelling Experiments
To study the cure state of PDMS better, the classic swelling experiment (section 2.1.2) was
done on the samples. Results show the swelling behaviour of PDMS cured at 18, 48 and 132
hours (Figure 4.4). The results from swelling can be compared to the modulus values obtained
from piezorheology. As explained in section 2.1.2, osmotic swelling is an indirect measure of
the elastic modulus of the system [7].
4 RESULTS AND EVALUATION
35
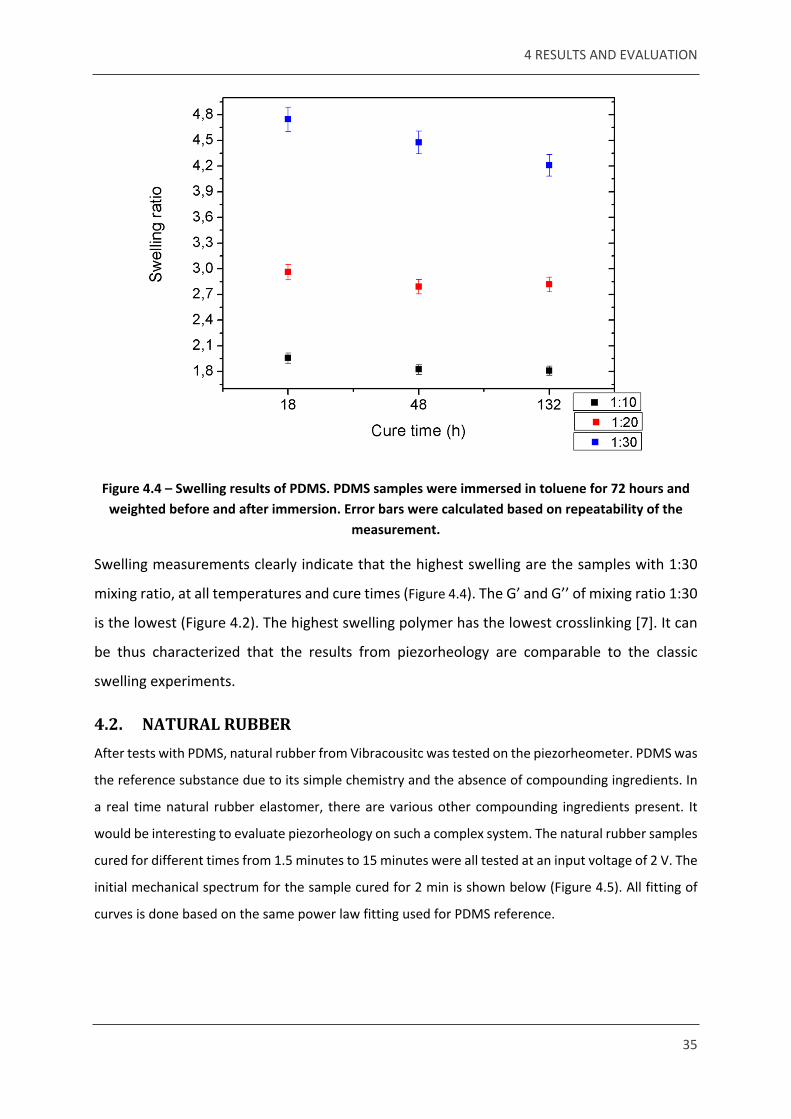
Figure 4.4 – Swelling results of PDMS. PDMS samples were immersed in toluene for 72 hours and weighted before and after immersion. Error bars were calculated based on repeatability of the
measurement.
Swelling measurements clearly indicate that the highest swelling are the samples with 1:30
mixing ratio, at all temperatures and cure times (Figure 4.4). The G’ and G’’ of mixing ratio 1:30
is the lowest (Figure 4.2). The highest swelling polymer has the lowest crosslinking [7]. It can
be thus characterized that the results from piezorheology are comparable to the classic
swelling experiments.
4.2. NATURAL RUBBERAfter tests with PDMS, natural rubber from Vibracousitc was tested on the piezorheometer. PDMS was
the reference substance due to its simple chemistry and the absence of compounding ingredients. In
a real time natural rubber elastomer, there are various other compounding ingredients present. It
would be interesting to evaluate piezorheology on such a complex system. The natural rubber samples
cured for different times from 1.5 minutes to 15 minutes were all tested at an input voltage of 2 V. The
initial mechanical spectrum for the sample cured for 2 min is shown below (Figure 4.5). All fitting of
curves is done based on the same power law fitting used for PDMS reference.
4 RESULTS AND EVALUATION
36
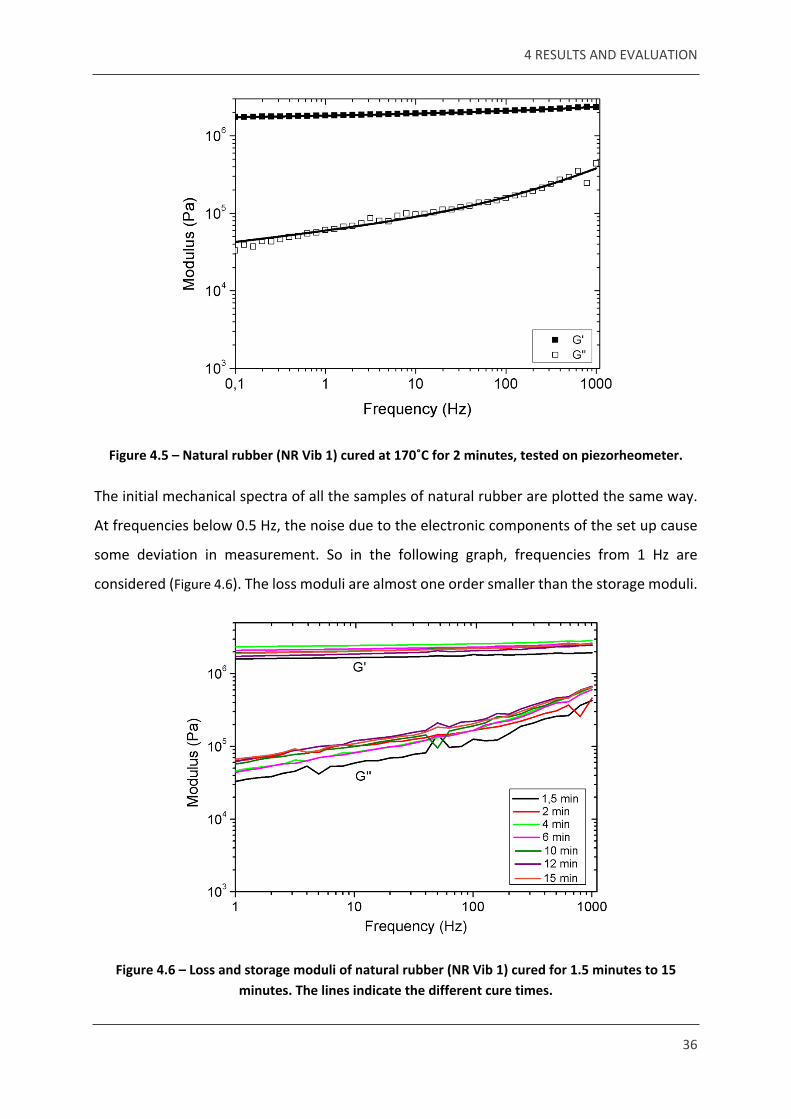
Figure 4.5 – Natural rubber (NR Vib 1) cured at 170˚C for 2 minutes, tested on piezorheometer.
The initial mechanical spectra of all the samples of natural rubber are plotted the same way.
At frequencies below 0.5 Hz, the noise due to the electronic components of the set up cause
some deviation in measurement. So in the following graph, frequencies from 1 Hz are
considered (Figure 4.6). The loss moduli are almost one order smaller than the storage moduli.
Figure 4.6 – Loss and storage moduli of natural rubber (NR Vib 1) cured for 1.5 minutes to 15 minutes. The lines indicate the different cure times.
4 RESULTS AND EVALUATION
37
The measurements show that there is a variation in modulus values for samples cured at
different times. This is further analysed in the coming sections (Figure 4.6).
After the first measurements, the following variations were tested in order to assess the
reproducibility, ease of use, error dependencies and the possible industrialization of the
method. The dependency of moduli on
Effect of different input voltages
Effect of screw tightening of device
Sample mounting variations
Variations due to samples from same sample plates
Variations due to samples from different sample plates
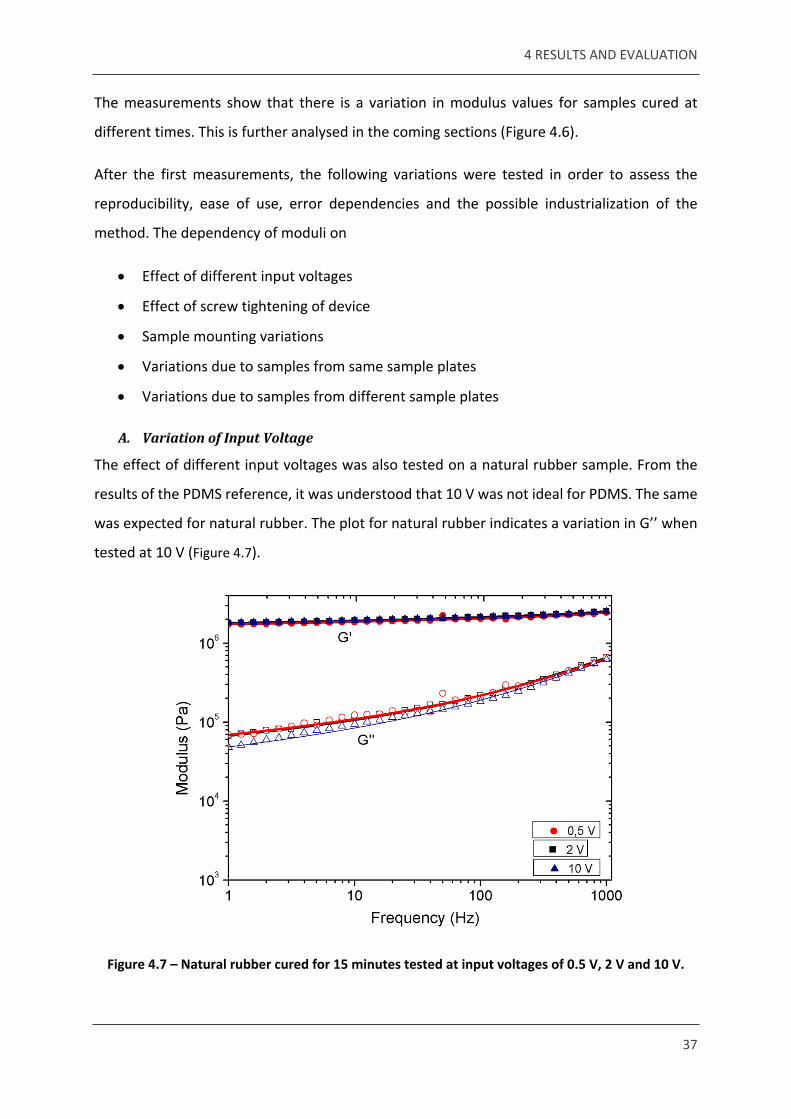
A. Variation of Input Voltage
The effect of different input voltages was also tested on a natural rubber sample. From the
results of the PDMS reference, it was understood that 10 V was not ideal for PDMS. The same
was expected for natural rubber. The plot for natural rubber indicates a variation in G’’ when
tested at 10 V (Figure 4.7).
Figure 4.7 – Natural rubber cured for 15 minutes tested at input voltages of 0.5 V, 2 V and 10 V.
4 RESULTS AND EVALUATION
38
The loss modulus at 10 V indicates a clear variation from 0.5 V and 2 V. This reiterates that the input voltage of 10 V could be high for an elastomer, and 2 V is an ideal voltage to test the samples.
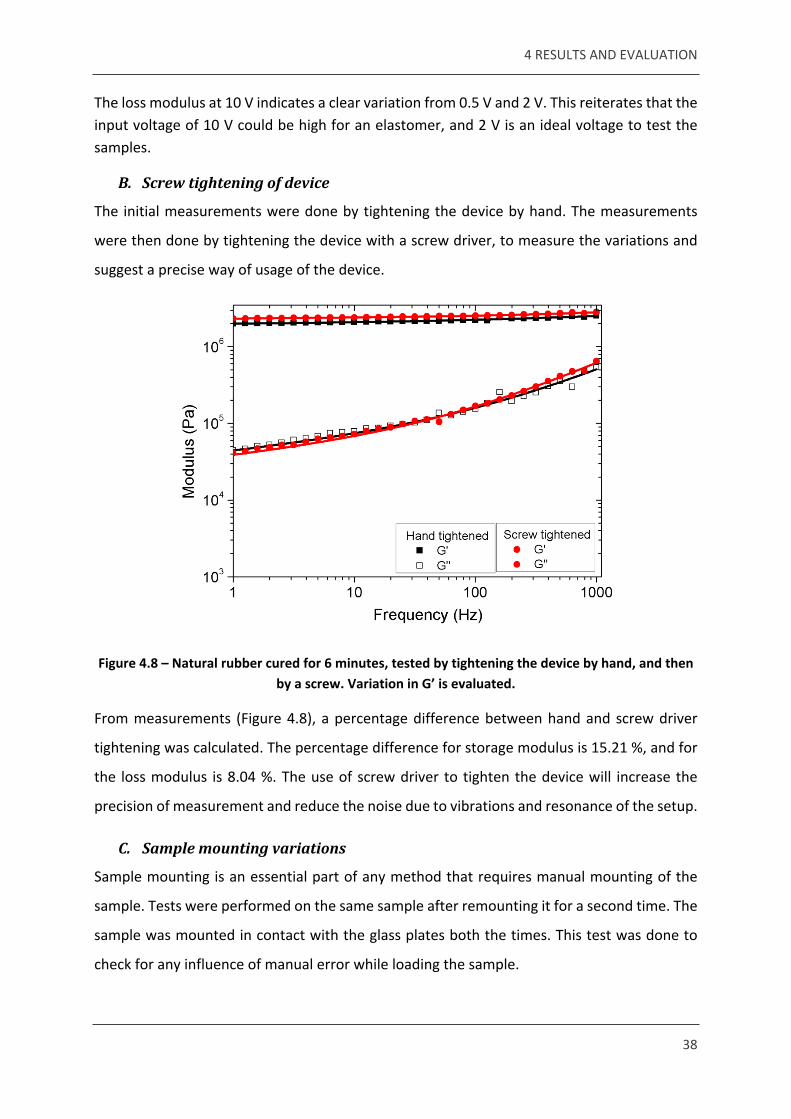
B. Screw tightening of device
The initial measurements were done by tightening the device by hand. The measurements
were then done by tightening the device with a screw driver, to measure the variations and
suggest a precise way of usage of the device.
Figure 4.8 – Natural rubber cured for 6 minutes, tested by tightening the device by hand, and then by a screw. Variation in G’ is evaluated.
From measurements (Figure 4.8), a percentage difference between hand and screw driver
tightening was calculated. The percentage difference for storage modulus is 15.21 %, and for
the loss modulus is 8.04 %. The use of screw driver to tighten the device will increase the
precision of measurement and reduce the noise due to vibrations and resonance of the setup.
C. Sample mounting variations
Sample mounting is an essential part of any method that requires manual mounting of the
sample. Tests were performed on the same sample after remounting it for a second time. The
sample was mounted in contact with the glass plates both the times. This test was done to
check for any influence of manual error while loading the sample.
4 RESULTS AND EVALUATION
39
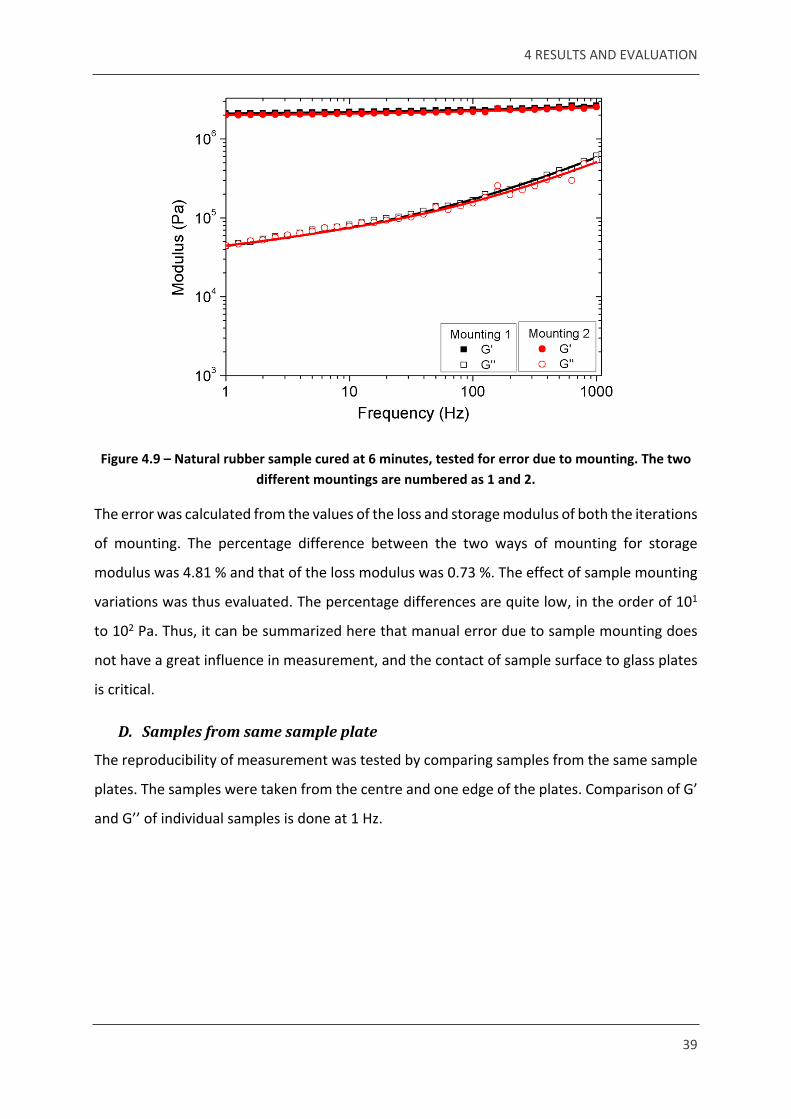
Figure 4.9 – Natural rubber sample cured at 6 minutes, tested for error due to mounting. The two different mountings are numbered as 1 and 2.
The error was calculated from the values of the loss and storage modulus of both the iterations
of mounting. The percentage difference between the two ways of mounting for storage
modulus was 4.81 % and that of the loss modulus was 0.73 %. The effect of sample mounting
variations was thus evaluated. The percentage differences are quite low, in the order of 101
to 102 Pa. Thus, it can be summarized here that manual error due to sample mounting does
not have a great influence in measurement, and the contact of sample surface to glass plates
is critical.
D. Samples from same sample plate
The reproducibility of measurement was tested by comparing samples from the same sample
plates. The samples were taken from the centre and one edge of the plates. Comparison of G’
and G’’ of individual samples is done at 1 Hz.
4 RESULTS AND EVALUATION
40
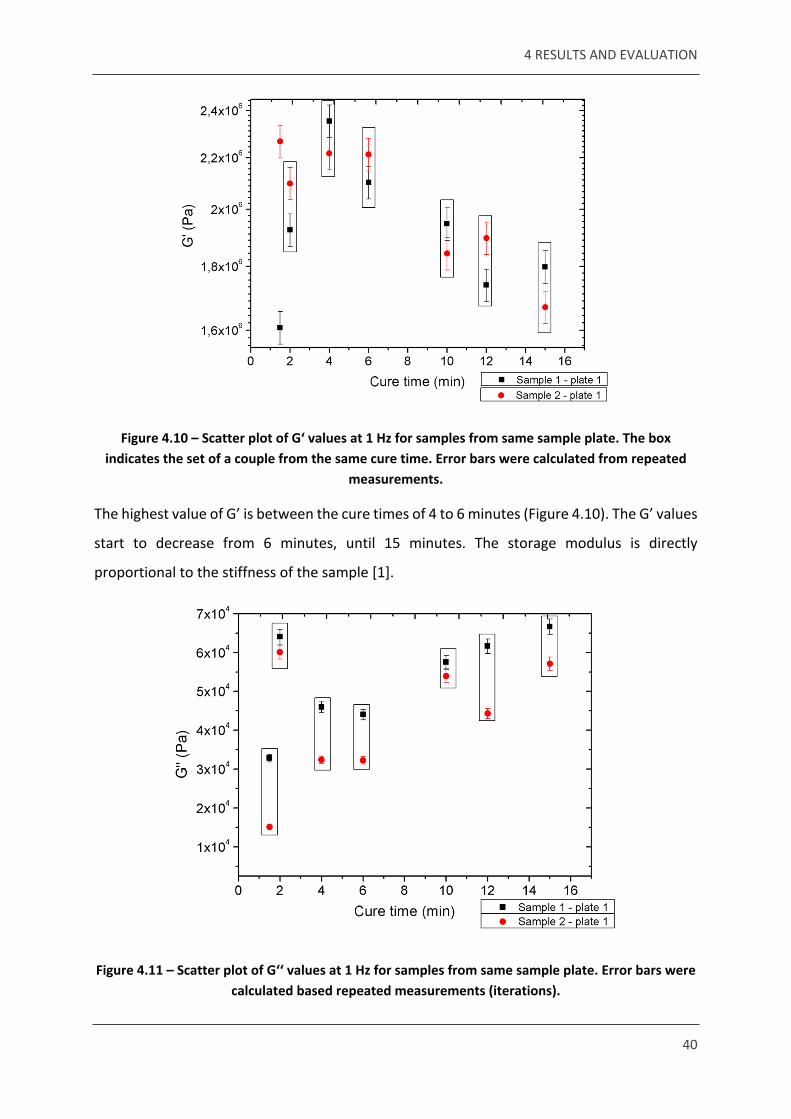
Figure 4.10 – Scatter plot of G‘ values at 1 Hz for samples from same sample plate. The box indicates the set of a couple from the same cure time. Error bars were calculated from repeated
measurements.
The highest value of G’ is between the cure times of 4 to 6 minutes (Figure 4.10). The G’ values
start to decrease from 6 minutes, until 15 minutes. The storage modulus is directly
proportional to the stiffness of the sample [1].
Figure 4.11 – Scatter plot of G‘‘ values at 1 Hz for samples from same sample plate. Error bars were calculated based repeated measurements (iterations).
4 RESULTS AND EVALUATION
41
The loss modulus corresponds to the viscous element of the sample. The lowest G’’ is at 4 and
6 minutes (Figure 4.11). The points at 1.5 minutes are neglected as a deviation, since the cure
time of 1.5 minutes would be just enough to heat the sample and trigger the initial steps of
vulcanization. The variations in the loss and storage moduli of samples from the same plate
are higher than the previously discussed variations. This can be attributed to variations in
mixing or non-uniform heat transfer from the compression mould surface to the plate, while
fabrication of sample plates.
E. Samples from different sample plates
As previously mentioned, the natural rubber plates were provided by Vibracoustic for
evaluation. There were two sample plates each for cure times 4 minutes, 6 minutes, 10
minutes and 15 minutes (Table 3.2). A comparison of data from samples of two different plates
was done. The storage and loss moduli are plotted against the cure time.
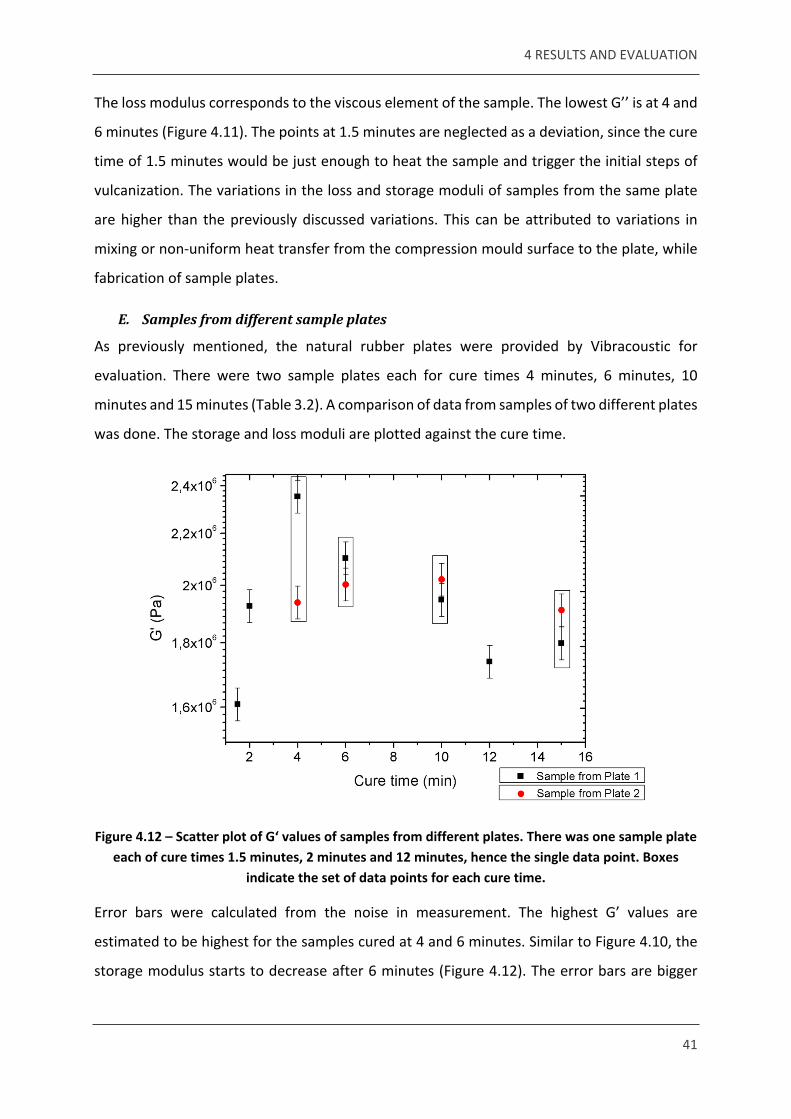
Figure 4.12 – Scatter plot of G‘ values of samples from different plates. There was one sample plate each of cure times 1.5 minutes, 2 minutes and 12 minutes, hence the single data point. Boxes
indicate the set of data points for each cure time.
Error bars were calculated from the noise in measurement. The highest G’ values are
estimated to be highest for the samples cured at 4 and 6 minutes. Similar to Figure 4.10, the
storage modulus starts to decrease after 6 minutes (Figure 4.12). The error bars are bigger
4 RESULTS AND EVALUATION
42
than that of the previously seen variations. The difference in G’ values between the two plates
could be as a result of inhomogeneity in the compounding, or variations during fabrication of
the plates.
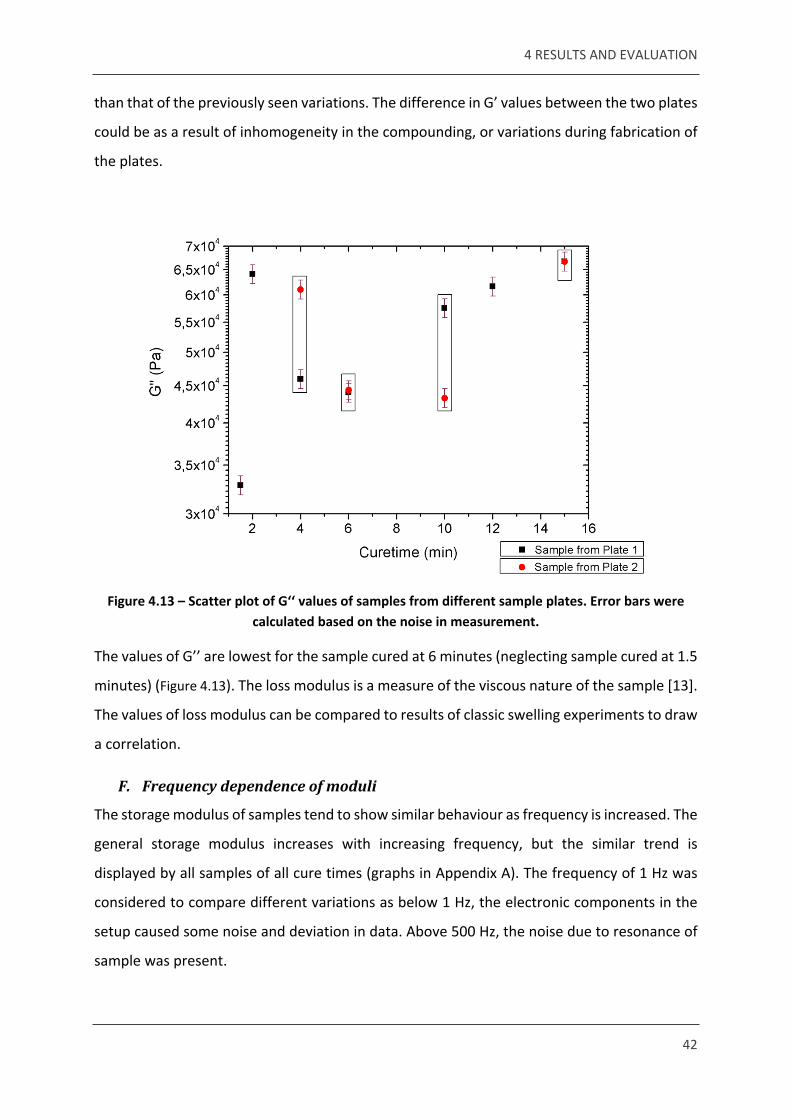
Figure 4.13 – Scatter plot of G‘‘ values of samples from different sample plates. Error bars were calculated based on the noise in measurement.
The values of G’’ are lowest for the sample cured at 6 minutes (neglecting sample cured at 1.5
minutes) (Figure 4.13). The loss modulus is a measure of the viscous nature of the sample [13].
The values of loss modulus can be compared to results of classic swelling experiments to draw
a correlation.
F. Frequency dependence of moduli
The storage modulus of samples tend to show similar behaviour as frequency is increased. The
general storage modulus increases with increasing frequency, but the similar trend is
displayed by all samples of all cure times (graphs in Appendix A). The frequency of 1 Hz was
considered to compare different variations as below 1 Hz, the electronic components in the
setup caused some noise and deviation in data. Above 500 Hz, the noise due to resonance of
sample was present.
4 RESULTS AND EVALUATION
43
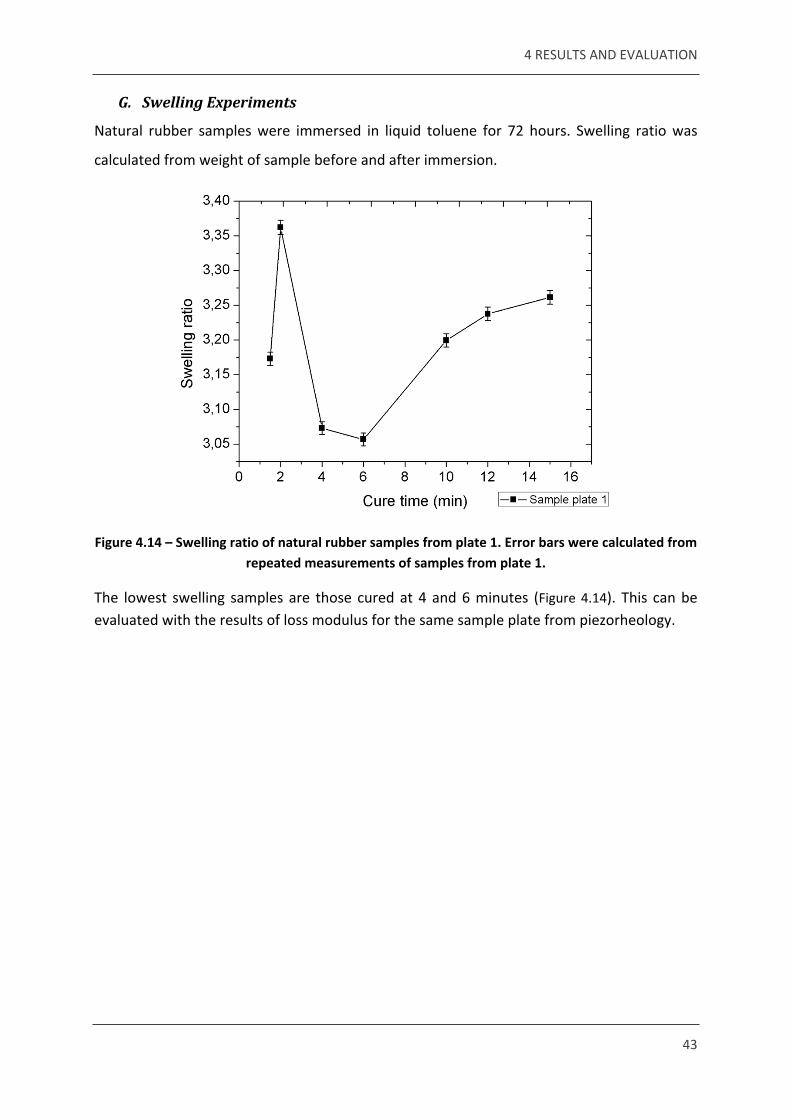
G. Swelling Experiments
Natural rubber samples were immersed in liquid toluene for 72 hours. Swelling ratio was
calculated from weight of sample before and after immersion.
Figure 4.14 – Swelling ratio of natural rubber samples from plate 1. Error bars were calculated from repeated measurements of samples from plate 1.
The lowest swelling samples are those cured at 4 and 6 minutes (Figure 4.14). This can be evaluated with the results of loss modulus for the same sample plate from piezorheology.
4 RESULTS AND EVALUATION
44
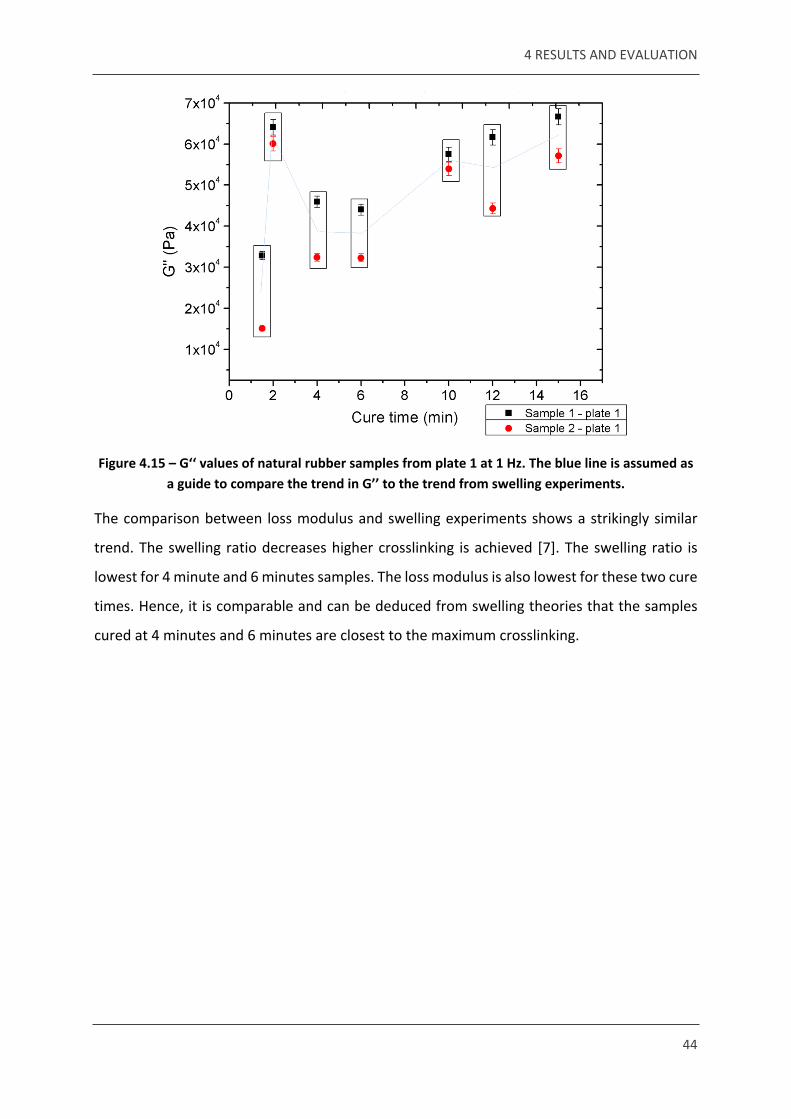
Figure 4.15 – G‘‘ values of natural rubber samples from plate 1 at 1 Hz. The blue line is assumed as a guide to compare the trend in G’’ to the trend from swelling experiments.
The comparison between loss modulus and swelling experiments shows a strikingly similar
trend. The swelling ratio decreases higher crosslinking is achieved [7]. The swelling ratio is
lowest for 4 minute and 6 minutes samples. The loss modulus is also lowest for these two cure
times. Hence, it is comparable and can be deduced from swelling theories that the samples
cured at 4 minutes and 6 minutes are closest to the maximum crosslinking.
45
5. CONCLUSION
The optimum cure state of rubber is an important parameter in rubber processing. Rheology,
compression set, and classic swelling experiments are some of the techniques used in the
industry to measure the optimum cure state. These techniques have many disadvantages
(section 2.1), and are not used as standards in the industry. The importance of optimum curing
reflects in the performance of the elastomer product, and thus, is an essential parameter that
requires standard testing methods. This thesis evaluated a new technique, Piezorheology, to
help in cure state characterization. From the tests made and the results obtained, the
following conclusions can be derived.
A. Reproducibility and Repeatability
The results of PDMS from piezorheology are comparable to classical swelling experiments. The
results of loss and storage moduli of natural rubber samples taken from the same plate
indicate that the method is reproducible (Figure 4.10 and Figure 4.11). The difference in
moduli of certain samples are attributed to the processing conditions. The sample plates were
prepared by using a compression press, and the heat transfer from press surface to sample is
not necessarily constant. This might have affected the crosslinking in the corners of sample
plates. Piezorheology is repeatable since the values obtained by testing the same sample twice
produced a negligible difference of 4.81 % for storage modulus and 0.73 % for loss modulus.
B. Reliability
The comparison of results from swelling experiments to the loss modulus at 1 Hz of natural
rubber samples from same plates showed similar trends (Figure 4.14 and Figure 4.15). Classical
swelling experiments have been a standard way of measuring the cure state of elastomers in
industries. The results from piezorheology agreed with the classical theory of osmotic swelling
[7]. Piezorheology is a reliable method even when the input voltage is altered, and clearly
depicted artefacts when the voltage was too high for the used sample size.
C. Ease of use
Piezorheology is a simple technique that does not require highly skilled labour. The variations
that arise due to mounting were studied, and results show that the difference is as small as
5 CONCLUSION
46
4.81 % for storage modulus and 0.73 % for loss modulus (Figure 4.9). The technique does not
depend on the difference in sample mounting, although it is essential that the sample is in
contact with the glass plates of the device. The device also produces best results when it is
tightened by a screw. The error between hand tightening and screw tightening for loss
modulus was ± 0.46 Pa, and that of loss modulus was ± 0.95 Pa.
As a conclusion, piezorheology is a technique that can be used in industries to help
characterize the optimum cure of elastomers. The evaluation of piezorheology was done and
it can be industrialized as a standard method to characterize the optimum cure of elastomers.
Apart from being repeatable, precise, reliable and easy to use, the method also used small
samples of at least 50 μm thickness and an area of at least 5 mm2. Thus, it can be used to
understand the cure state of products with complex geometries.
47
6. FUTURE SCOPE
Industrialization of piezorheology, and standardizing the technique for application is an
important scope of this work. The piezorheometer can be used in the industry setup for quick
and precise measurement and comparison of cure states.
Microcantilever sensor technology is a novel method that can be used in cure time
characterization. Micromechanical sensors provide an advantage of using a sample with a
mass resolution of 10-11 μm. The test provides results in approximately 30 minutes, and since
it uses gaseous solvent, the swelling and de-swelling behaviour of the elastomer can be
studied. The advantages and theory of the method were outlined in section 2.2. It is a precise
method that can be experimented with, and industrialized.
Dynamic mechanical analysis (DMA) is another promising technique from literature, to help in
cure time characterization. The values of tan 90 from the rheometer are studied and
compared to the values of tan δ from DMA. The DMA was tested in shear mode and isothermal
tests were done to monitor changes that occur in the elastomer during vulcanization [13]. The
DMA is a widely used method for analysis of glass transitions and moduli under temperature
and stress. The measurement of cure time by DMA, if achievable, will be a great aid in
industries.
48
REFERENCES
[1] J. S. Dick, Rubber technology - Compounding and Testing for performance, Hanser Publications, 2009.
[2] J. E. Mark , B. Erman and F. R. Eirich, Science and Technology of rubber, Elsevier Academic Press, 2005.
[3] L. E. Nielsen, “Cross-Linking–Effect on Physical Properties of Polymers,” vol. 3, no. 1, 1969.
[4] D. Zaimova, E. Bayraktar and N. Dishovsky, “State of cure evaluation by different experimental methods in thick rubber parts,” vol. 44, no. 2, 2011.
[5] B. Stritzke, Custom Molding of Thermoset Elastomers: A Comprehensive Approach to Materials, Mold Design, and Processing, Carl Hanser Verlag GmbH Co KG, 2012.
[6] S. Mani, “FUNDAMENTALS ASPECTS OF CROSSLINKING CONTROL OF PDMS RUBBER AT HIGH TEMPERATURES USING,” UNIVERSITY CLAUDE BERNARD LYON, FRANCE.
[7] P. J. Flory and J. Rehner Jr., “Statistical theory of chain configuration and physical properties of High polymers,” vol. 11, no. 11, November 1943.
[8] A. Muzafarov, Silicon Polymers, Springer, 2011.
[9] S. Katare, P. Patkar and J. M. Caruthers, “Sulfur Vulcanization of Natural Rubber for Benzothiazole accelerated formulations: From reaction mechanisms to a rational kinetic model,” School of Chemical Engineering, Purdue University.
[10] Vibracoustic GmbH.
[11] ASTM, ASTM D 395-03 Standard test methods for rubber property - Compression test, ASTM.
[12] C. p. g. INC., “Swelling measurements of crosslinked polymers,” Cambridgr Polymer group, Boston.
[13] S. Raa Khimi and K. L. Pickering, “A New Method to Predict Optimum Cure Time of Rubber Compound Using Dynamic Mechanical Analysis”.
[14] J. Kirchhoff and D. Mewes, “Measuring the state of cure of elastomers by using an ultrasonic technique,” KGK. Kautschuk, Gummi, Kunststoffe, vol. 55, 2002.
[15] N. Liebers, F. Raddatz and F. Schadow, “Effective and flexible ultrasound sensors for cure monitoring for industrial composite production,” in Deutscher Luft- und Raumfahrtkongress (DGLR), 2013.
REFERENCES
49
[16] M. Sepaniak, Panos Datskos and Nickolay Lavrik, “Microcantilever Transducers:A New Approach in Sensor Technology,” A N A LY T I C A L C H E M I STRY, 2 0 0 2.
[17] M. Sepaniak, Panos Datskos and Nickolay Lavrik, “Microcantilever Transducers:A New Approach in Sensor Technology,” A N A LY T I C A L C H E M I STRY, vol. 74, no. 21, 2002.
[18] M. Roth, M. D'Acunzi, D. Vollmer and A. Auernhammer, “Viscoelastic rheology of colloid-liquid crystal composites,” vol. 132, no. 12, 2010.
[19] “Rheology of arrested colloids: a parameter study using novel experimental methods,” Mainz: University Library Mainz, 2011.
[20] R. Bartolino and G. Durand, “Plasticity in a Smectic- A Liquid Crystal,” vol. 39, no. 21, 1977.
[21] J. F. Rabek, Experimental Methods in Polymer Chemistry, Wiley-Interscience, 1983.
[22] H. M. Eugen Guth, “Zur innermolekularen, Statistik, insbesondere bei Kettenmolekiilen I,” vol. 65, no. 1, 1934.
50
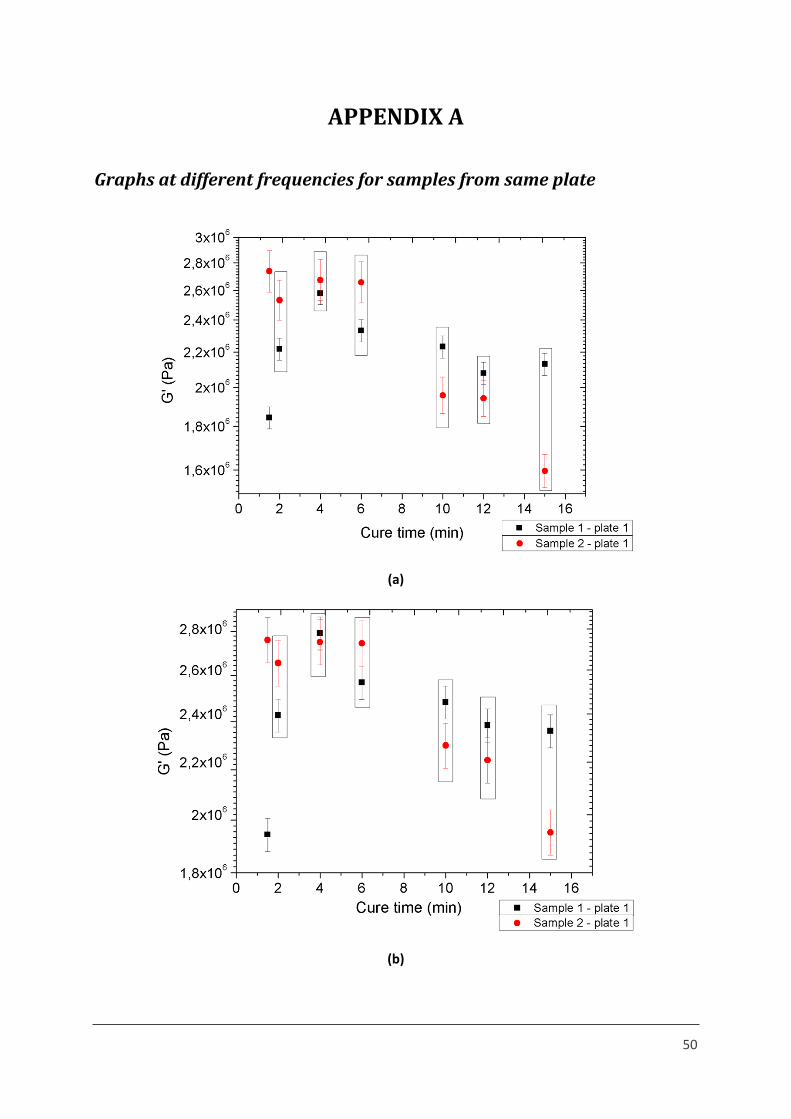
APPENDIX A
Graphs at different frequencies for samples from same plate
(a)
(b)
APPENDIX A
51
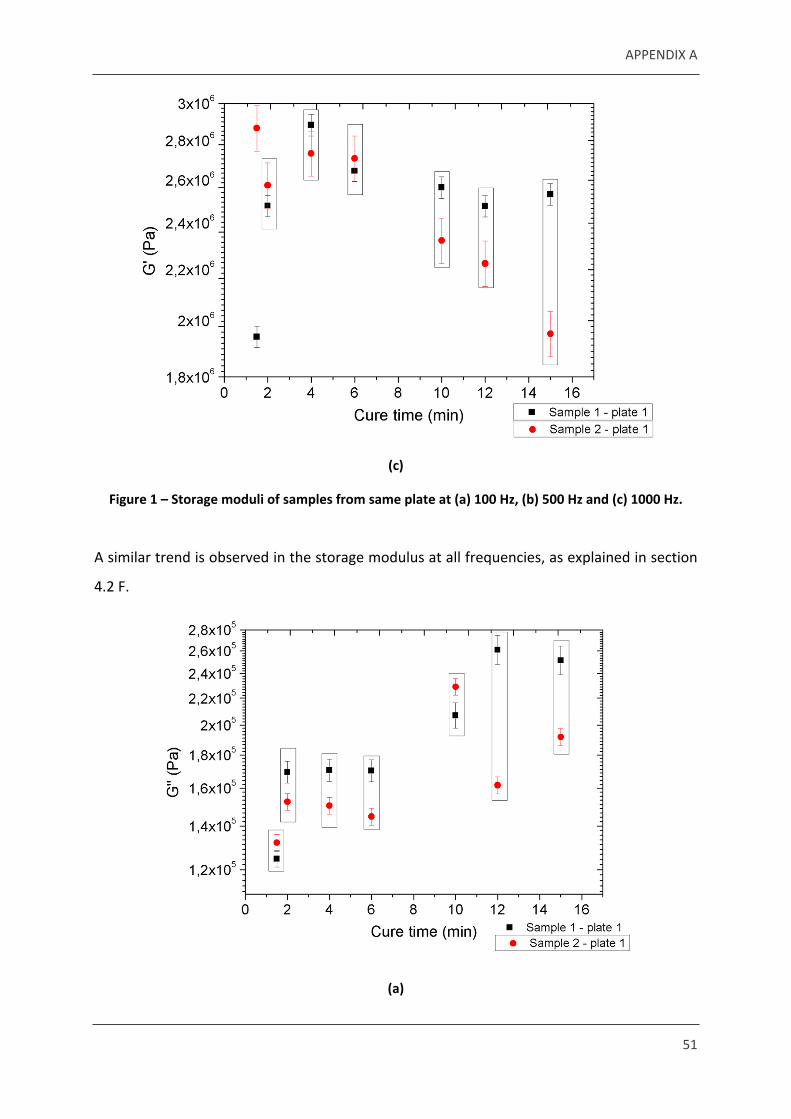
(c)
Figure 1 – Storage moduli of samples from same plate at (a) 100 Hz, (b) 500 Hz and (c) 1000 Hz.
A similar trend is observed in the storage modulus at all frequencies, as explained in section
4.2 F.
(a)
APPENDIX A
52
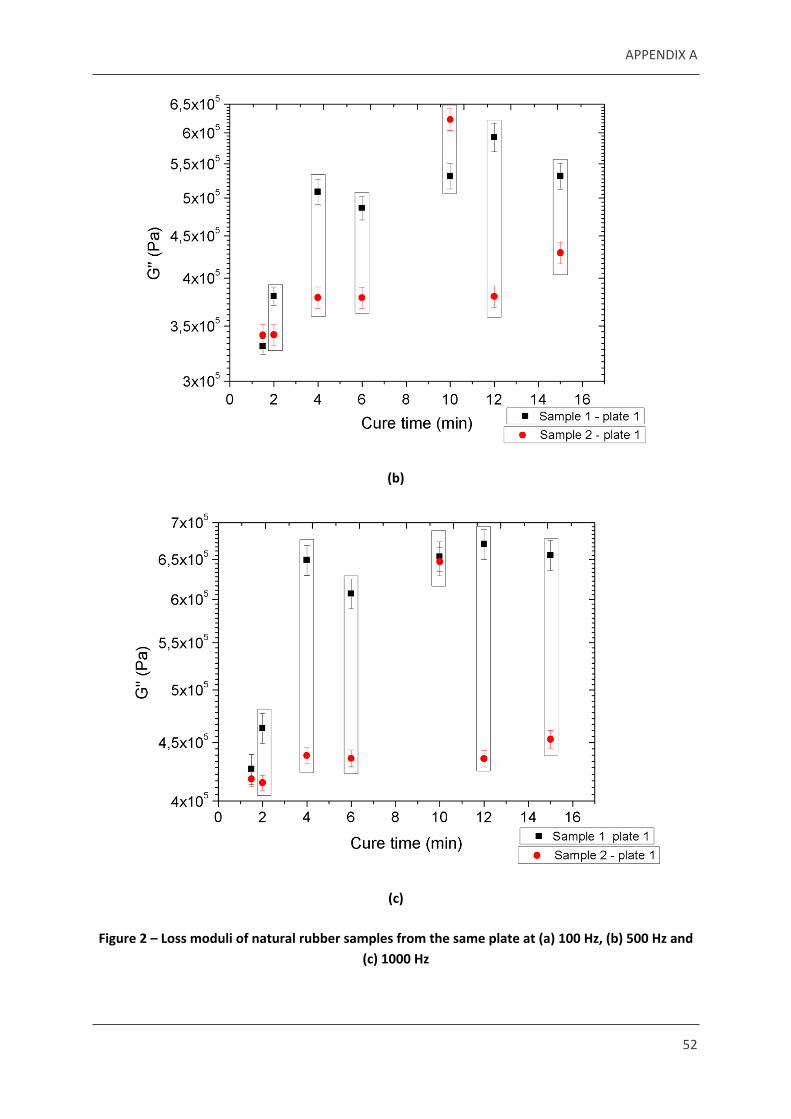
(b)
(c)
Figure 2 – Loss moduli of natural rubber samples from the same plate at (a) 100 Hz, (b) 500 Hz and (c) 1000 Hz