Embed Size (px)
Citation preview
Identify, Prevent, and Manage Substance Use Disorders
Informed decision making for early intervention and improved outcomes
Statewide Opioid Assessment: Michigan
1
March 29, 2018
Michigan Collaborates with Appriss Health with New Tool in the Fight Against the Opioid Crisis
The Michigan Department of Licensing and Regulatory Affairs (LARA) is one of the first state
government agencies in the nation to utilize this new tool recently developed by Appriss Health
in the fight against the opioid crisis; Appriss Health’s Statewide Opioid Assessment.
The Methods
• To apply this tool, Michigan provided three years of well-documented cases of unintentional
overdose deaths, which Appriss Health linked to five years of prescription records in the
state’s prescription drug monitoring program (PDMP), the Michigan Automated Prescription
System (MAPS). More than 7.5 million patients receiving 103.2 million prescriptions over the
five years of PDMP history were linked to 5,261 overdose deaths.
The Value
• Using Appriss Health’s Statewide Opioid Assessment, lawmakers and local community
leaders can tailor laws, target resources, and design innovative programs to best address the
opioid crisis in Michigan. This solution, along with other extensive collaborations underway
between Michigan and Appriss Health, demonstrate the aggressive commitment of both
entities to impact the opioid crisis in the state.
Michigan Collaborates with Appriss Health with New Tool in the Fight Against the Opioid Crisis
Statewide Opioid Assessment
• Appriss Health’s Statewide Opioid Assessment provides state PDMP administrators valuable
information on trends and patterns on a state’s opioid usage. The Assessment examines
patient-level and aggregate trends of controlled-substance prescriptions and overdose
deaths within the state. Together, these statistics provide powerful insights into specific
prescribing trends and risk factors for overdose death and helps identify communities most
affected by the opioid epidemic.
• Michigan was one of the first states in the country to provide all PDMP users in the state
access to NarxCare. NarxCare is a substance use disorder prevention and management
platform developed by Appriss Health that includes an Overdose Risk Score, which predicts
overdose death. The combination of the Statewide Opioid Assessment and the Overdose
Risk Score contained in NarxCare both enables state administrators, policy makers, and
public health officials to understand trends and over 150,000 providers to quickly assess a
patient’s PDMP history and risk of overdose death at a glance.
0
500
1,000
1,500
2,000
2,500
0
5,000,000
10,000,000
15,000,000
20,000,000
25,000,000
2013 2014 2015 2016
Nu
mb
er o
f D
eath
s
Nu
mb
er o
f P
atie
nts
/Dis
pen
sati
on
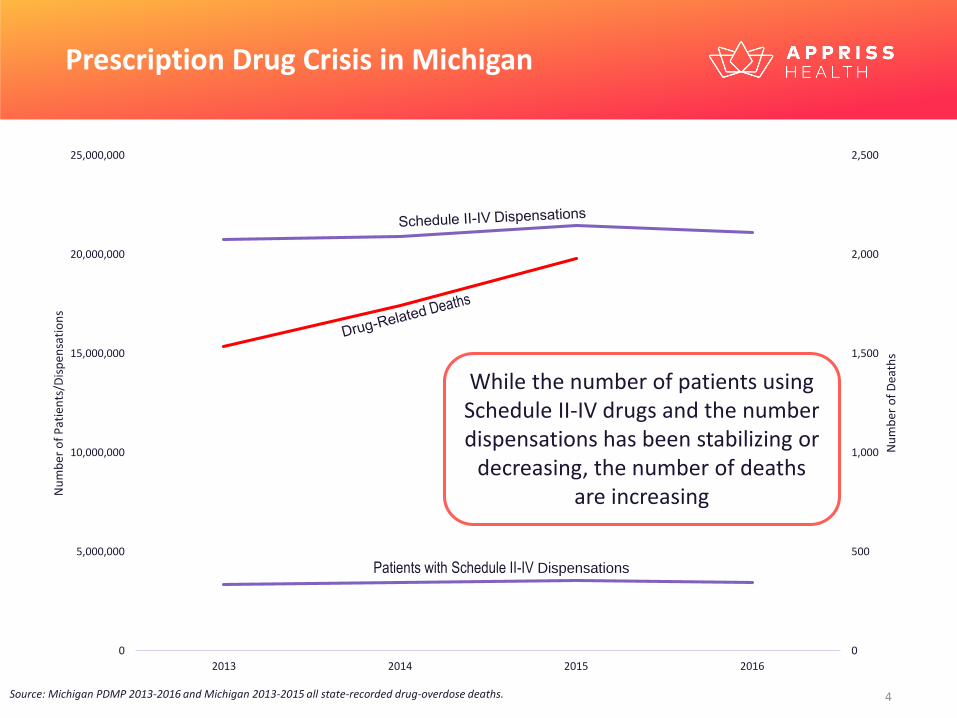
sPrescription Drug Crisis in Michigan
While the number of patients using Schedule II-IV drugs and the number dispensations has been stabilizing or
decreasing, the number of deaths are increasing
Source: Michigan PDMP 2013-2016 and Michigan 2013-2015 all state-recorded drug-overdose deaths.
Patients with Schedule II-IV Dispensations
Michigan
P D M P O c t o b e r 2 3 , 2 0 1 2 - O c t o b e r 2 3 , 2 0 1 7
a n d
D r u g - R e l a t e d D e a t h s 2 0 1 3 - 2 0 1 5
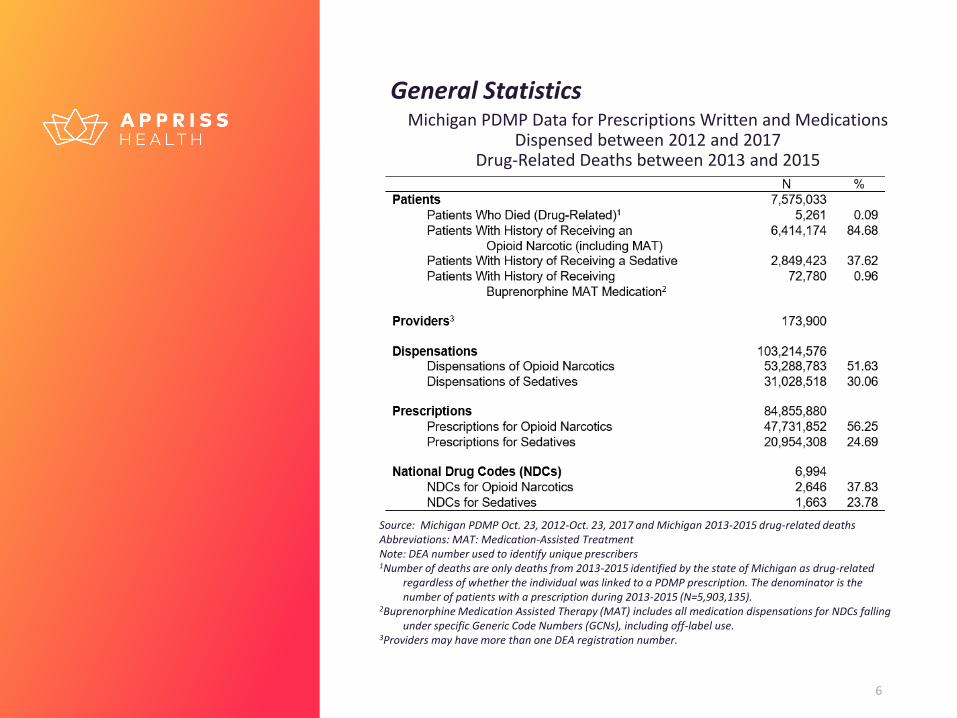
General StatisticsMichigan PDMP Data for Prescriptions Written and Medications
Dispensed between 2012 and 2017Drug-Related Deaths between 2013 and 2015
6
Source: Michigan PDMP Oct. 23, 2012-Oct. 23, 2017 and Michigan 2013-2015 drug-related deaths Abbreviations: MAT: Medication-Assisted TreatmentNote: DEA number used to identify unique prescribers 1Number of deaths are only deaths from 2013-2015 identified by the state of Michigan as drug-related
regardless of whether the individual was linked to a PDMP prescription. The denominator is the number of patients with a prescription during 2013-2015 (N=5,903,135).
2Buprenorphine Medication Assisted Therapy (MAT) includes all medication dispensations for NDCs falling under specific Generic Code Numbers (GCNs), including off-label use.
3Providers may have more than one DEA registration number.
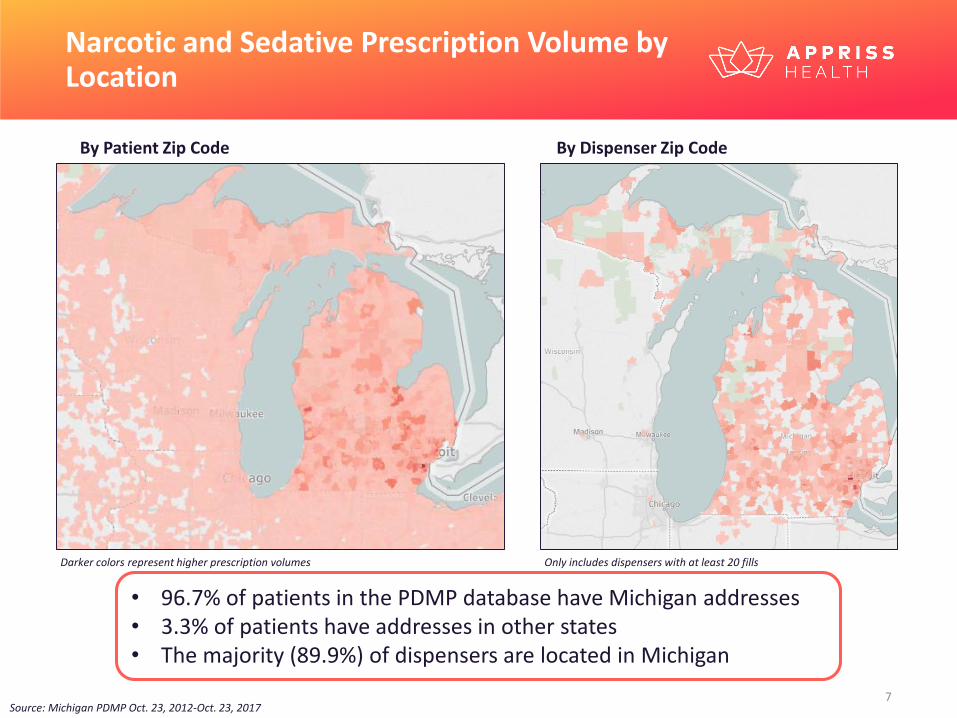
Narcotic and Sedative Prescription Volume by Location
By Patient Zip Code By Dispenser Zip Code
• 96.7% of patients in the PDMP database have Michigan addresses• 3.3% of patients have addresses in other states• The majority (89.9%) of dispensers are located in Michigan
Darker colors represent higher prescription volumes Only includes dispensers with at least 20 fills
Source: Michigan PDMP Oct. 23, 2012-Oct. 23, 2017

P a t i e n t C h a r a c t e r i s t i c s
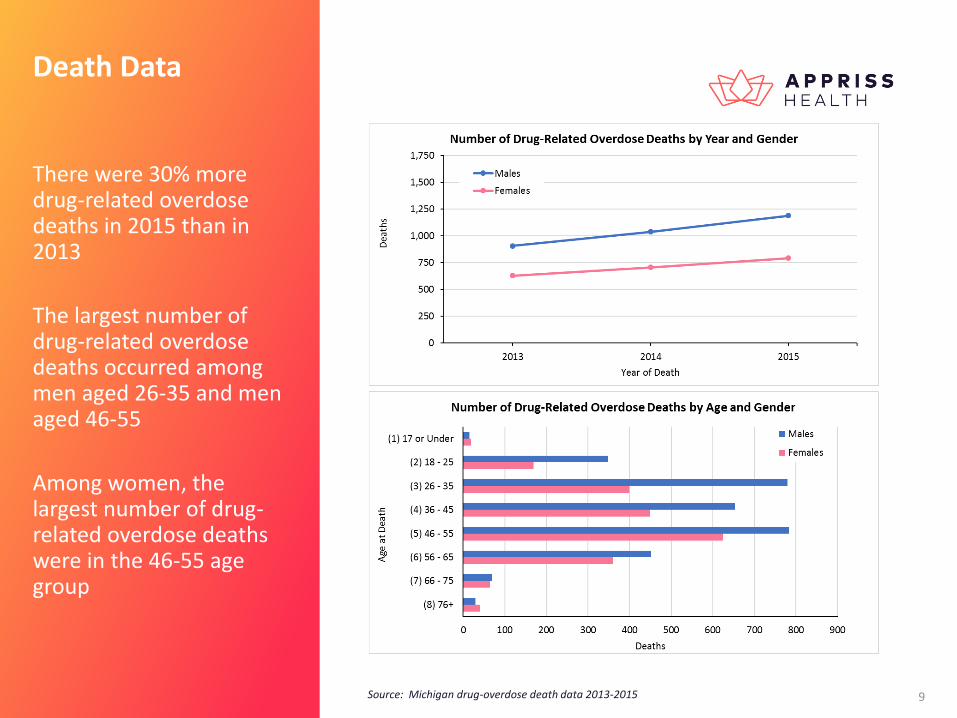
Death Data
There were 30% more drug-related overdose deaths in 2015 than in 2013
The largest number of drug-related overdose deaths occurred among men aged 26-35 and men aged 46-55
Among women, the largest number of drug-related overdose deaths were in the 46-55 age group
Source: Michigan drug-overdose death data 2013-2015
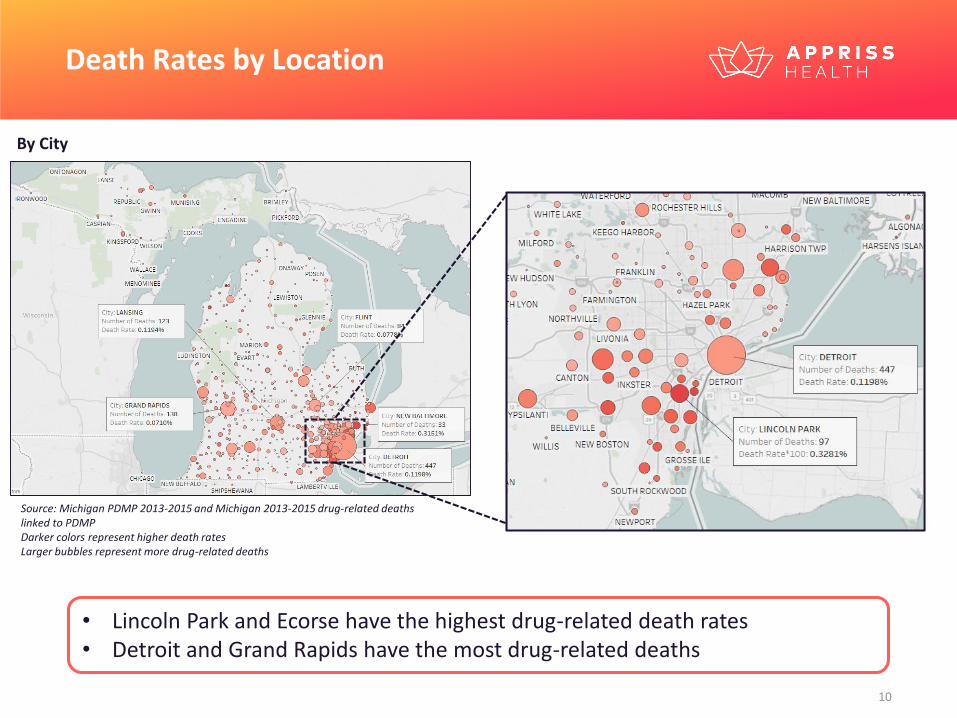
Death Rates by Location
By City
• Lincoln Park and Ecorse have the highest drug-related death rates• Detroit and Grand Rapids have the most drug-related deaths
Source: Michigan PDMP 2013-2015 and Michigan 2013-2015 drug-related deaths linked to PDMP Darker colors represent higher death ratesLarger bubbles represent more drug-related deaths
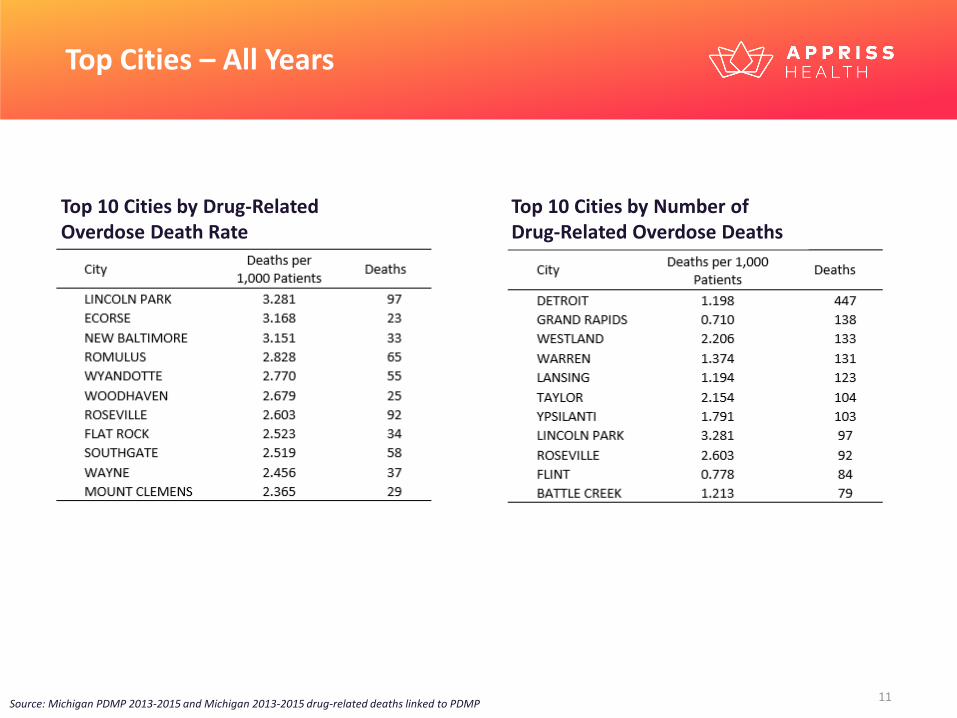
Top Cities – All Years
Top 10 Cities by Drug-Related Overdose Death Rate
Top 10 Cities by Number of Drug-Related Overdose Deaths
Source: Michigan PDMP 2013-2015 and Michigan 2013-2015 drug-related deaths linked to PDMP
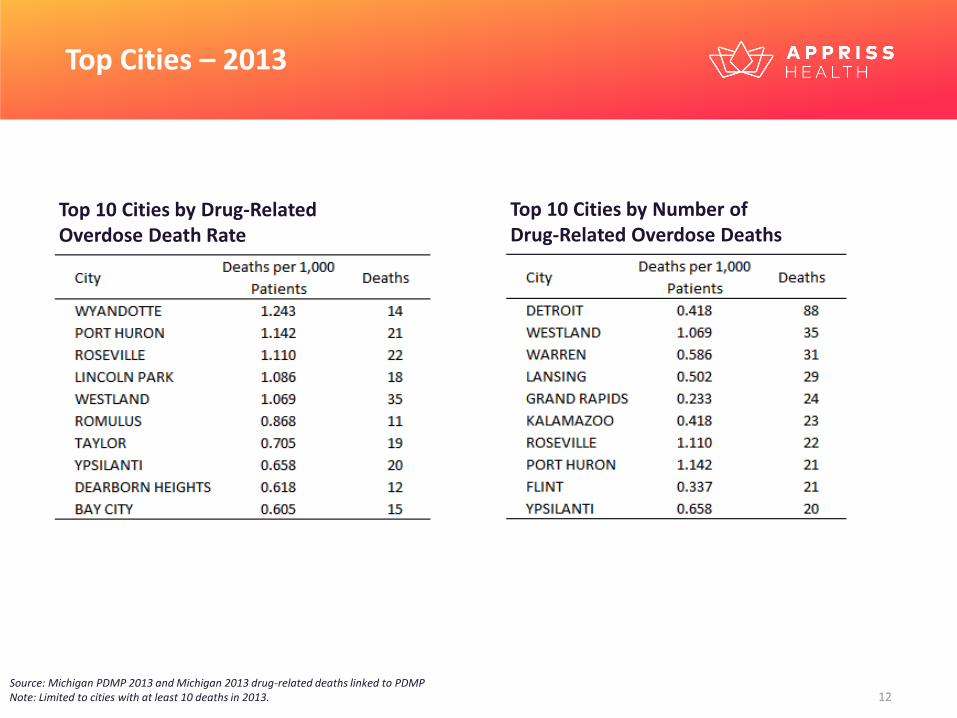
Top Cities – 2013
Top 10 Cities by Drug-Related Overdose Death Rate
Top 10 Cities by Number of Drug-Related Overdose Deaths
Source: Michigan PDMP 2013 and Michigan 2013 drug-related deaths linked to PDMPNote: Limited to cities with at least 10 deaths in 2013.
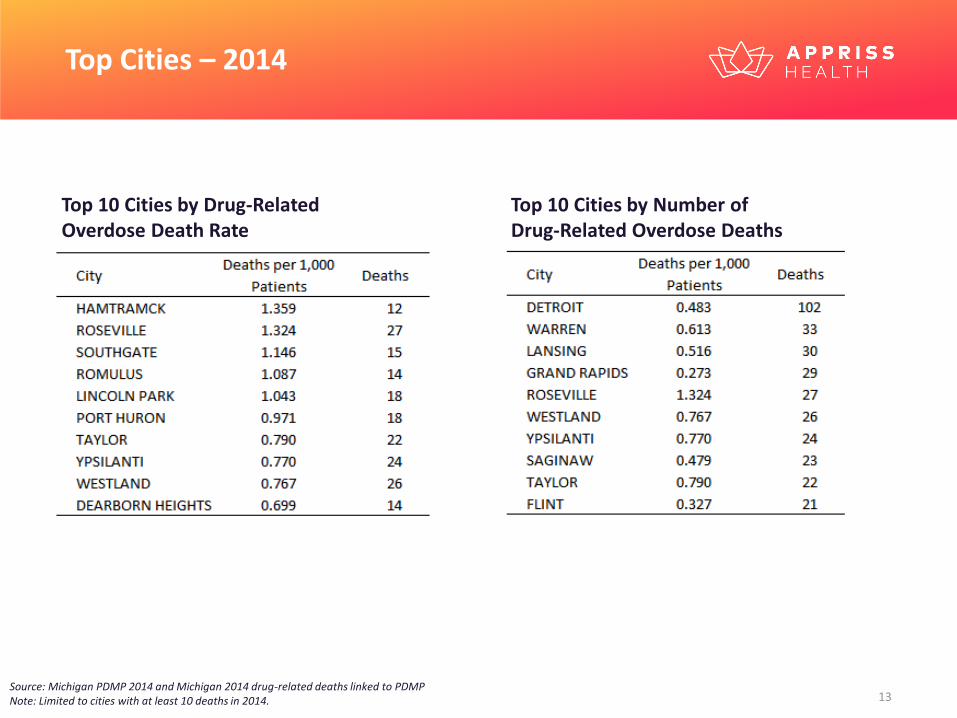
Top Cities – 2014
Top 10 Cities by Drug-Related Overdose Death Rate
Top 10 Cities by Number of Drug-Related Overdose Deaths
Source: Michigan PDMP 2014 and Michigan 2014 drug-related deaths linked to PDMPNote: Limited to cities with at least 10 deaths in 2014.
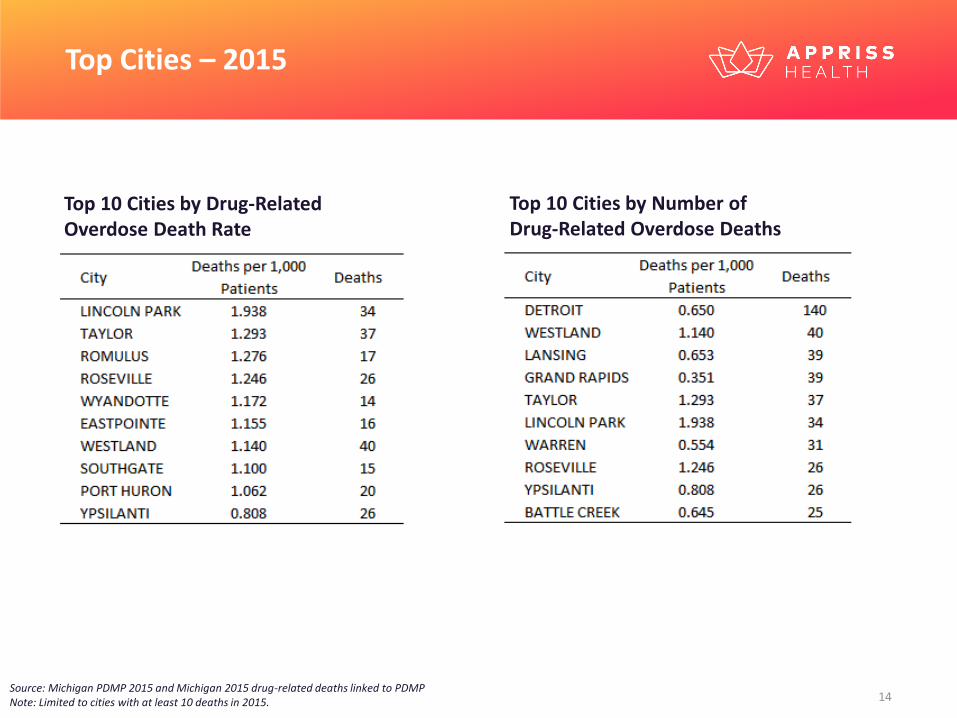
Top Cities – 2015
Top 10 Cities by Drug-Related Overdose Death Rate
Top 10 Cities by Number of Drug-Related Overdose Deaths
Source: Michigan PDMP 2015 and Michigan 2015 drug-related deaths linked to PDMPNote: Limited to cities with at least 10 deaths in 2015.
0
0.1
0.2
0.3
0.4
0.5
0.6
Dea
th R
ate
per
10
0 P
atie
nts
Average LME per Patient
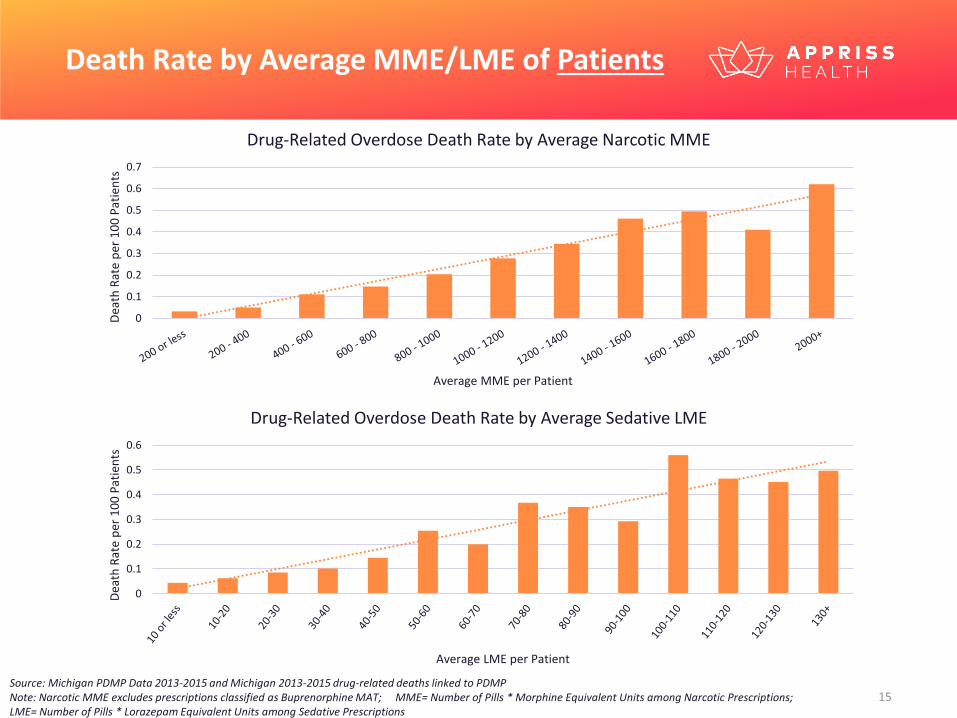
Drug-Related Overdose Death Rate by Average Sedative LME
Death Rate by Average MME/LME of Patients
Source: Michigan PDMP Data 2013-2015 and Michigan 2013-2015 drug-related deaths linked to PDMP Note: Narcotic MME excludes prescriptions classified as Buprenorphine MAT; MME= Number of Pills * Morphine Equivalent Units among Narcotic Prescriptions; LME= Number of Pills * Lorazepam Equivalent Units among Sedative Prescriptions
0
0.1
0.2
0.3
0.4
0.5
0.6
0.7
Dea
th R
ate
per
10
0 P
atie
nts
Average MME per Patient
Drug-Related Overdose Death Rate by Average Narcotic MME
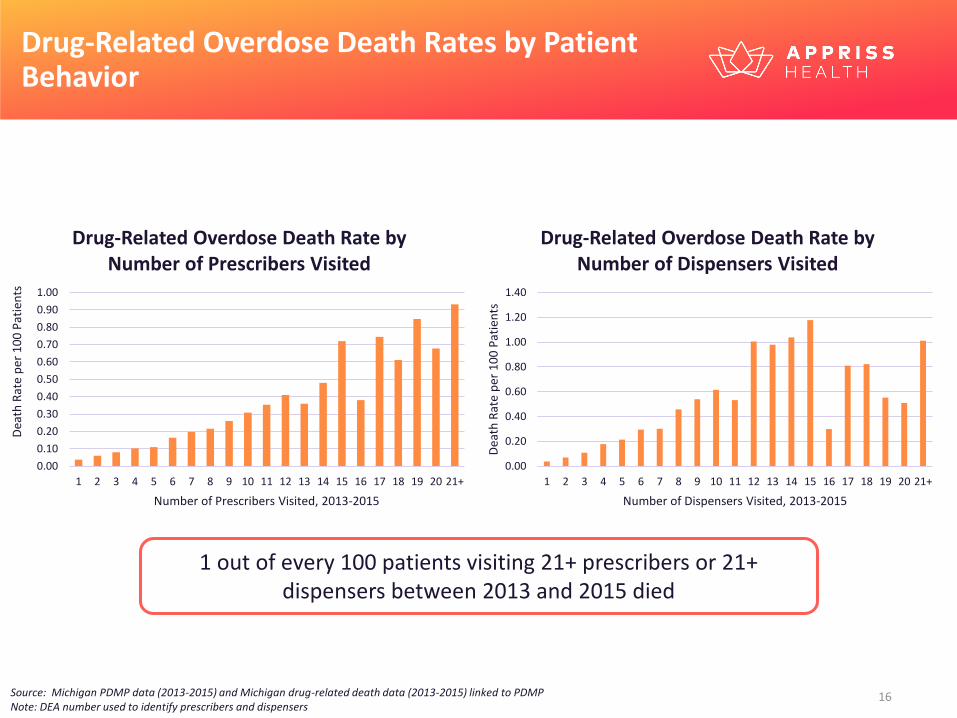
Drug-Related Overdose Death Rates by Patient Behavior
1 out of every 100 patients visiting 21+ prescribers or 21+ dispensers between 2013 and 2015 died
Source: Michigan PDMP data (2013-2015) and Michigan drug-related death data (2013-2015) linked to PDMP Note: DEA number used to identify prescribers and dispensers
0.00
0.10
0.20
0.30
0.40
0.50
0.60
0.70
0.80
0.90
1.00
1 2 3 4 5 6 7 8 9 10 11 12 13 14 15 16 17 18 19 20 21+
Dea
th R
ate
per
10
0 P
atie
nts
Number of Prescribers Visited, 2013-2015
Drug-Related Overdose Death Rate by Number of Prescribers Visited
0.00
0.20
0.40
0.60
0.80
1.00
1.20
1.40
1 2 3 4 5 6 7 8 9 10 11 12 13 14 15 16 17 18 19 20 21+D
eath
Rat
e p
er 1
00
Pat
ien
tsNumber of Dispensers Visited, 2013-2015
Drug-Related Overdose Death Rate by Number of Dispensers Visited
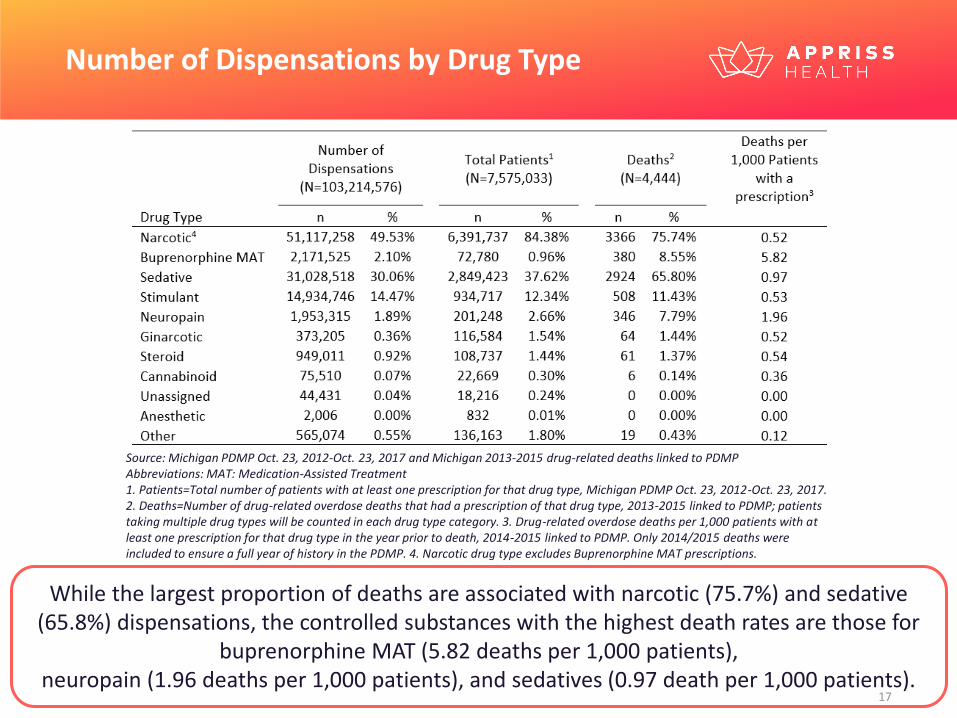
Number of Dispensations by Drug Type
Source: Michigan PDMP Oct. 23, 2012-Oct. 23, 2017 and Michigan 2013-2015 drug-related deaths linked to PDMPAbbreviations: MAT: Medication-Assisted Treatment1. Patients=Total number of patients with at least one prescription for that drug type, Michigan PDMP Oct. 23, 2012-Oct. 23, 2017. 2. Deaths=Number of drug-related overdose deaths that had a prescription of that drug type, 2013-2015 linked to PDMP; patients taking multiple drug types will be counted in each drug type category. 3. Drug-related overdose deaths per 1,000 patients with at least one prescription for that drug type in the year prior to death, 2014-2015 linked to PDMP. Only 2014/2015 deaths were included to ensure a full year of history in the PDMP. 4. Narcotic drug type excludes Buprenorphine MAT prescriptions.
While the largest proportion of deaths are associated with narcotic (75.7%) and sedative (65.8%) dispensations, the controlled substances with the highest death rates are those for
buprenorphine MAT (5.82 deaths per 1,000 patients), neuropain (1.96 deaths per 1,000 patients), and sedatives (0.97 death per 1,000 patients).
Hydrocodone
Codeine
Tramadol
Oxycodone
Morphine
Fentanyl
Hydromorphone
Buprenorphine for Narcotic Withdrawal Therapy
Methadone
Buprenorphine for Pain Management
Oxymorphone
Tapentadol
Butorphanol
MeperidineOpium
Pentazocine
1
10
100
1,000
10,000
1 10 100 1,000 10,000 100,000 1,000,000 10,000,000
Nu
mb
er o
f D
eath
s (L
og
Scal
e)
Number of Patients (Log Scale)
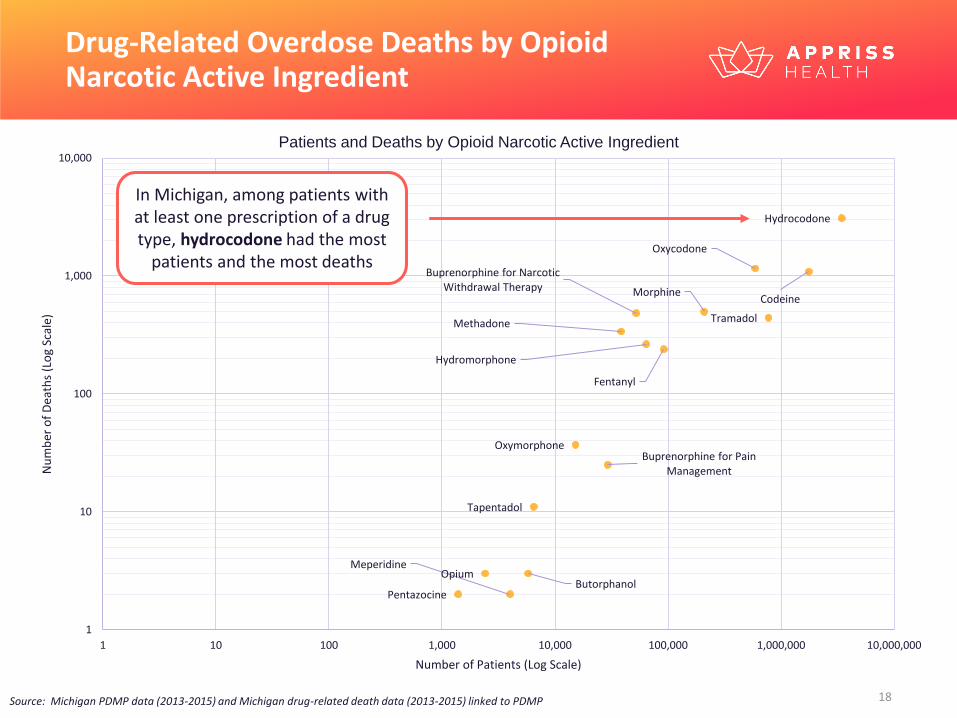
Drug-Related Overdose Deaths by Opioid Narcotic Active Ingredient
Source: Michigan PDMP data (2013-2015) and Michigan drug-related death data (2013-2015) linked to PDMP
Patients and Deaths by Opioid Narcotic Active Ingredient
In Michigan, among patients with at least one prescription of a drug type, hydrocodone had the most
patients and the most deaths
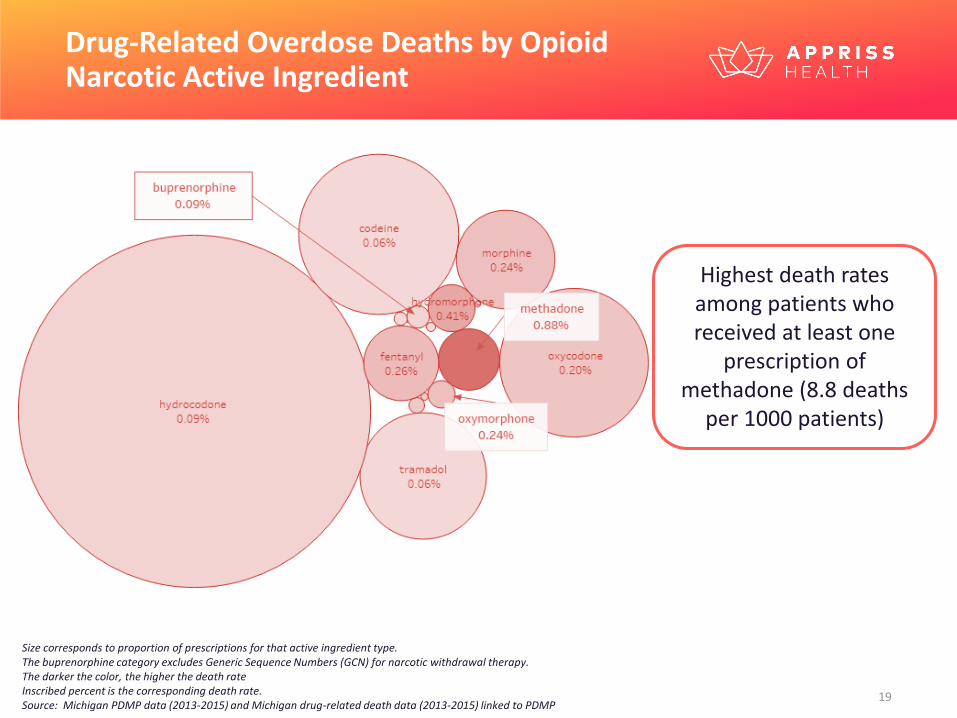
Drug-Related Overdose Deaths by Opioid Narcotic Active Ingredient
Size corresponds to proportion of prescriptions for that active ingredient type.The buprenorphine category excludes Generic Sequence Numbers (GCN) for narcotic withdrawal therapy.The darker the color, the higher the death rateInscribed percent is the corresponding death rate.Source: Michigan PDMP data (2013-2015) and Michigan drug-related death data (2013-2015) linked to PDMP
Highest death rates among patients who received at least one
prescription of methadone (8.8 deaths
per 1000 patients)
0.90.6 0.6
2.0
2.42.6
4.1
9.3
8.8
0.9
2.4
1.7
0.5 0.5
1.21.4
0.0
1.0
2.0
3.0
4.0
5.0
6.0
7.0
8.0
9.0
10.0
0
500,000
1,000,000
1,500,000
2,000,000
2,500,000
3,000,000
3,500,000
4,000,000
Dru
g-R
elat
ed O
verd
ose
Dea
th R
ate
per
1,0
00
Pat
ien
ts
Nu
mb
er o
f P
atie
nts
Number of Patients Death Rate
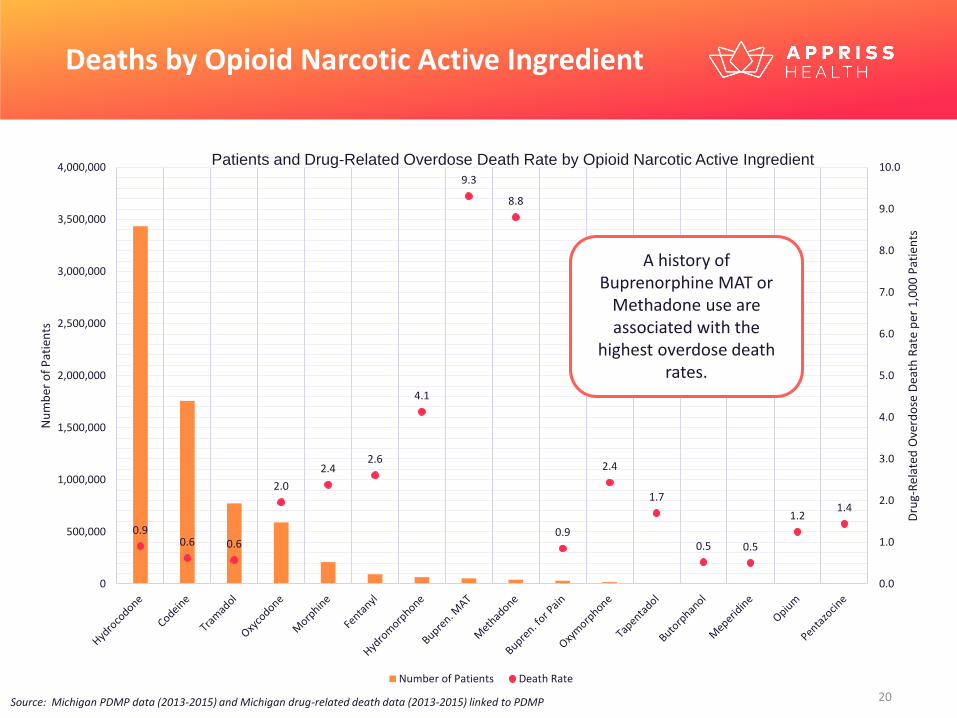
Deaths by Opioid Narcotic Active Ingredient
A history of Buprenorphine MAT or
Methadone use are associated with the
highest overdose death rates.
Patients and Drug-Related Overdose Death Rate by Opioid Narcotic Active Ingredient
Source: Michigan PDMP data (2013-2015) and Michigan drug-related death data (2013-2015) linked to PDMP

P r e s c r i b e r C h a r a c t e r i s t i c s
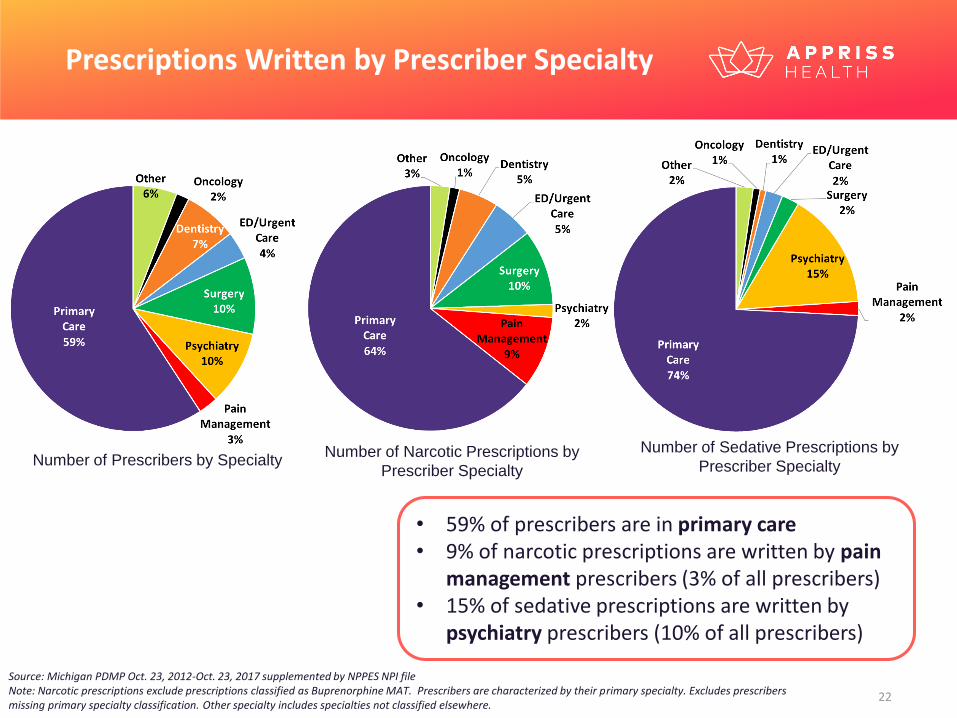
Prescriptions Written by Prescriber Specialty
Source: Michigan PDMP Oct. 23, 2012-Oct. 23, 2017 supplemented by NPPES NPI fileNote: Narcotic prescriptions exclude prescriptions classified as Buprenorphine MAT. Prescribers are characterized by their primary specialty. Excludes prescribers missing primary specialty classification. Other specialty includes specialties not classified elsewhere.
• 59% of prescribers are in primary care• 9% of narcotic prescriptions are written by pain
management prescribers (3% of all prescribers)• 15% of sedative prescriptions are written by
psychiatry prescribers (10% of all prescribers)
Number of Prescribers by SpecialtyNumber of Narcotic Prescriptions by
Prescriber Specialty
Number of Sedative Prescriptions by
Prescriber Specialty
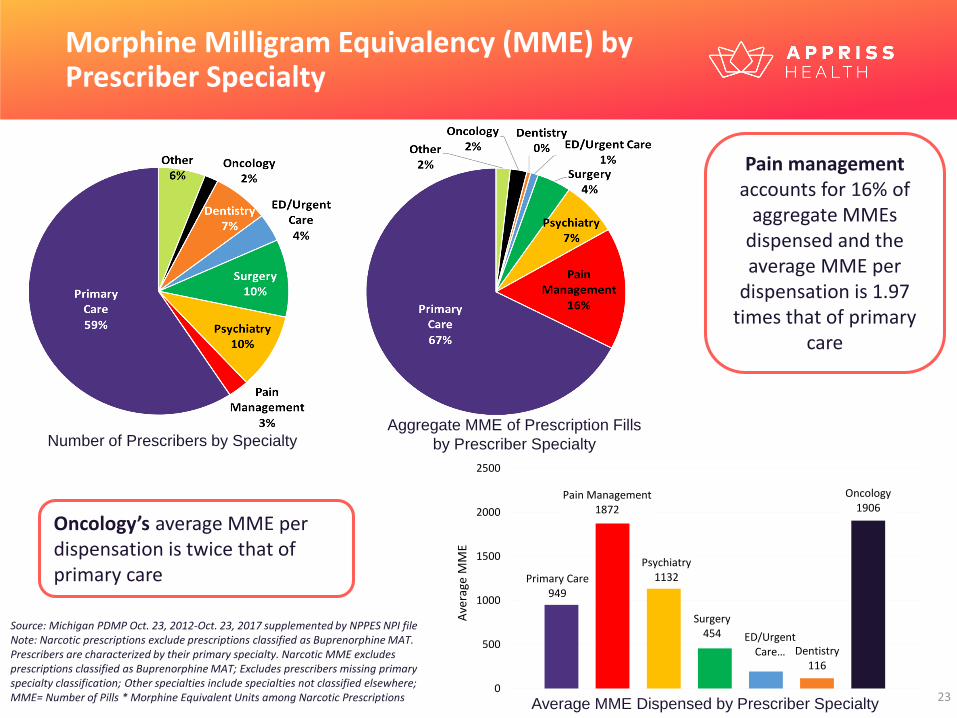
Morphine Milligram Equivalency (MME) by Prescriber Specialty
Source: Michigan PDMP Oct. 23, 2012-Oct. 23, 2017 supplemented by NPPES NPI fileNote: Narcotic prescriptions exclude prescriptions classified as Buprenorphine MAT. Prescribers are characterized by their primary specialty. Narcotic MME excludes prescriptions classified as Buprenorphine MAT; Excludes prescribers missing primary specialty classification; Other specialties include specialties not classified elsewhere; MME= Number of Pills * Morphine Equivalent Units among Narcotic Prescriptions
Oncology’s average MME per dispensation is twice that of primary care
Pain managementaccounts for 16% of
aggregate MMEs dispensed and the average MME per
dispensation is 1.97 times that of primary
care
Aggregate MME of Prescription Fills
by Prescriber Specialty
Primary Care949
Pain Management1872
Psychiatry1132
Surgery454 ED/Urgent
Care… Dentistry116
Oncology1906
0
500
1000
1500
2000
2500A
vera
ge M
ME
Average MME Dispensed by Prescriber Specialty
Number of Prescribers by Specialty
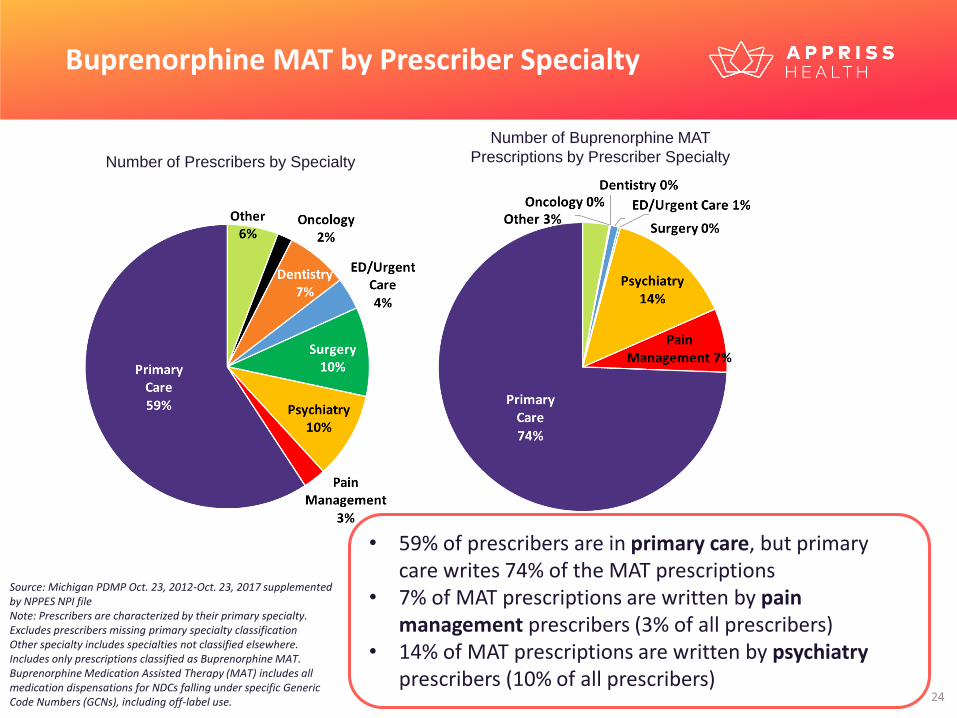
Buprenorphine MAT by Prescriber Specialty
Source: Michigan PDMP Oct. 23, 2012-Oct. 23, 2017 supplemented by NPPES NPI fileNote: Prescribers are characterized by their primary specialty. Excludes prescribers missing primary specialty classificationOther specialty includes specialties not classified elsewhere. Includes only prescriptions classified as Buprenorphine MAT. Buprenorphine Medication Assisted Therapy (MAT) includes all medication dispensations for NDCs falling under specific Generic Code Numbers (GCNs), including off-label use.
Number of Prescribers by Specialty
Number of Buprenorphine MAT
Prescriptions by Prescriber Specialty
• 59% of prescribers are in primary care, but primary care writes 74% of the MAT prescriptions
• 7% of MAT prescriptions are written by pain management prescribers (3% of all prescribers)
• 14% of MAT prescriptions are written by psychiatryprescribers (10% of all prescribers)
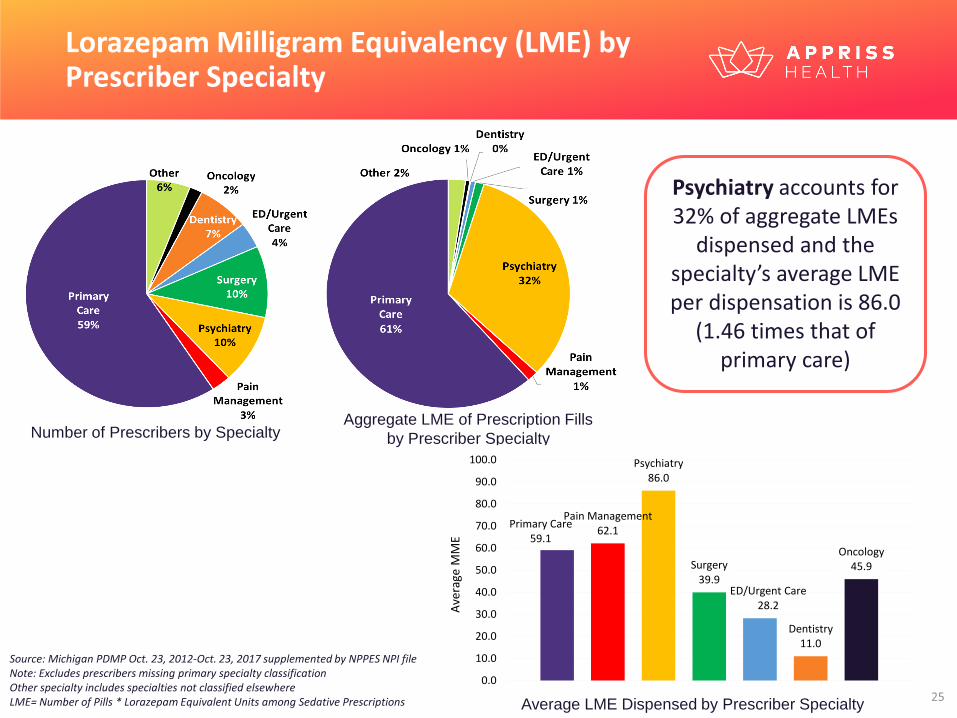
Lorazepam Milligram Equivalency (LME) by Prescriber Specialty
Source: Michigan PDMP Oct. 23, 2012-Oct. 23, 2017 supplemented by NPPES NPI fileNote: Excludes prescribers missing primary specialty classificationOther specialty includes specialties not classified elsewhereLME= Number of Pills * Lorazepam Equivalent Units among Sedative Prescriptions
Psychiatry accounts for 32% of aggregate LMEs
dispensed and the specialty’s average LME per dispensation is 86.0
(1.46 times that of primary care)
Number of Prescribers by SpecialtyAggregate LME of Prescription Fills
by Prescriber Specialty
Average LME Dispensed by Prescriber Specialty
Primary Care59.1
Pain Management62.1
Psychiatry86.0
Surgery39.9
ED/Urgent Care28.2
Dentistry11.0
Oncology45.9
0.0
10.0
20.0
30.0
40.0
50.0
60.0
70.0
80.0
90.0
100.0A
vera
ge M
ME
0.0%
5.0%
10.0%
15.0%
20.0%
25.0%
Per
cen
t o
f P
resc
rib
ers
Average LME Prescribed per Dispensation
Distribution of Prescribers by Average Sedative LME Prescribed
0.0%
5.0%
10.0%
15.0%
20.0%
25.0%
30.0%
35.0%
40.0%
45.0%
Per
cen
t o
f P
resc
rib
ers
Average MME Prescribed per Dispensation
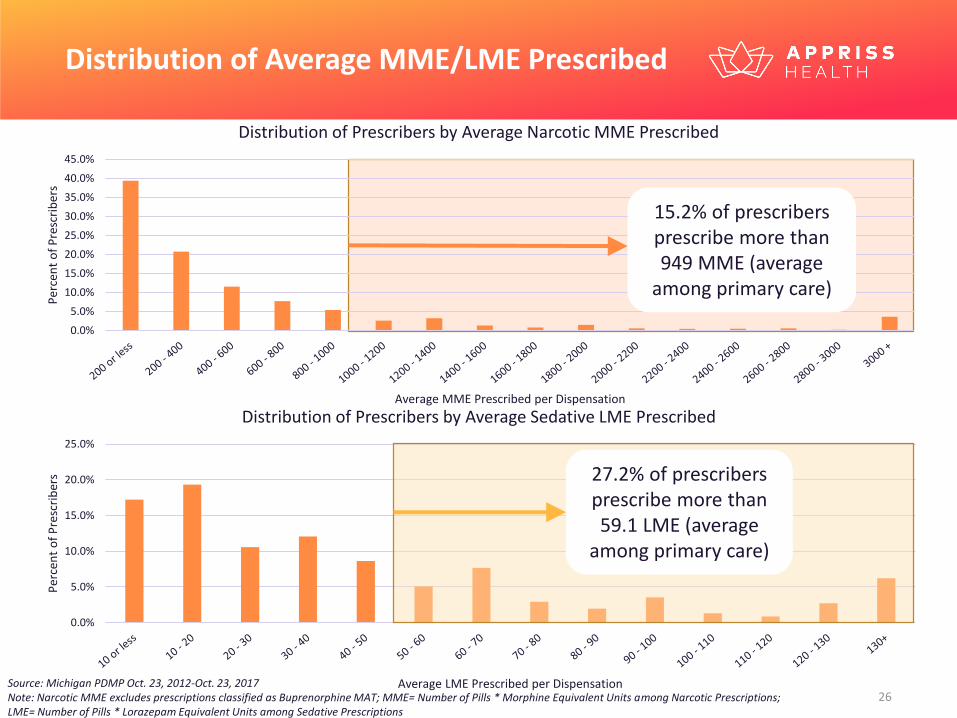
Distribution of Prescribers by Average Narcotic MME Prescribed
Source: Michigan PDMP Oct. 23, 2012-Oct. 23, 2017 Note: Narcotic MME excludes prescriptions classified as Buprenorphine MAT; MME= Number of Pills * Morphine Equivalent Units among Narcotic Prescriptions; LME= Number of Pills * Lorazepam Equivalent Units among Sedative Prescriptions
Distribution of Average MME/LME Prescribed
27.2% of prescribers prescribe more than 59.1 LME (average
among primary care)
15.2% of prescribers prescribe more than 949 MME (average
among primary care)
-
0.05
0.10
0.15
0.20
0.25
0.30
0.35
0.40
0.45
0.50
Dea
th R
ate
per
10
0 P
atie
nts
Average LME Prescribed
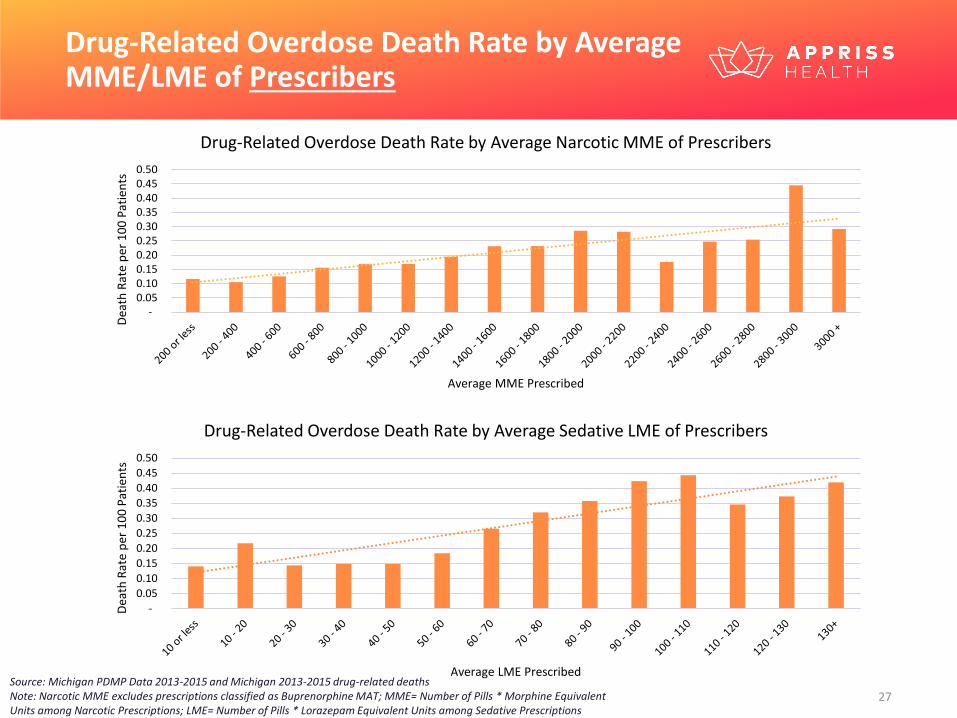
Drug-Related Overdose Death Rate by Average Sedative LME of Prescribers
Drug-Related Overdose Death Rate by Average MME/LME of Prescribers
- 0.05 0.10 0.15 0.20 0.25 0.30 0.35 0.40 0.45 0.50
Dea
th R
ate
per
10
0 P
atie
nts
Average MME Prescribed
Drug-Related Overdose Death Rate by Average Narcotic MME of Prescribers
Source: Michigan PDMP Data 2013-2015 and Michigan 2013-2015 drug-related deaths Note: Narcotic MME excludes prescriptions classified as Buprenorphine MAT; MME= Number of Pills * Morphine Equivalent Units among Narcotic Prescriptions; LME= Number of Pills * Lorazepam Equivalent Units among Sedative Prescriptions

V u l n e r a b l e S u b p o p u l a t i o n s
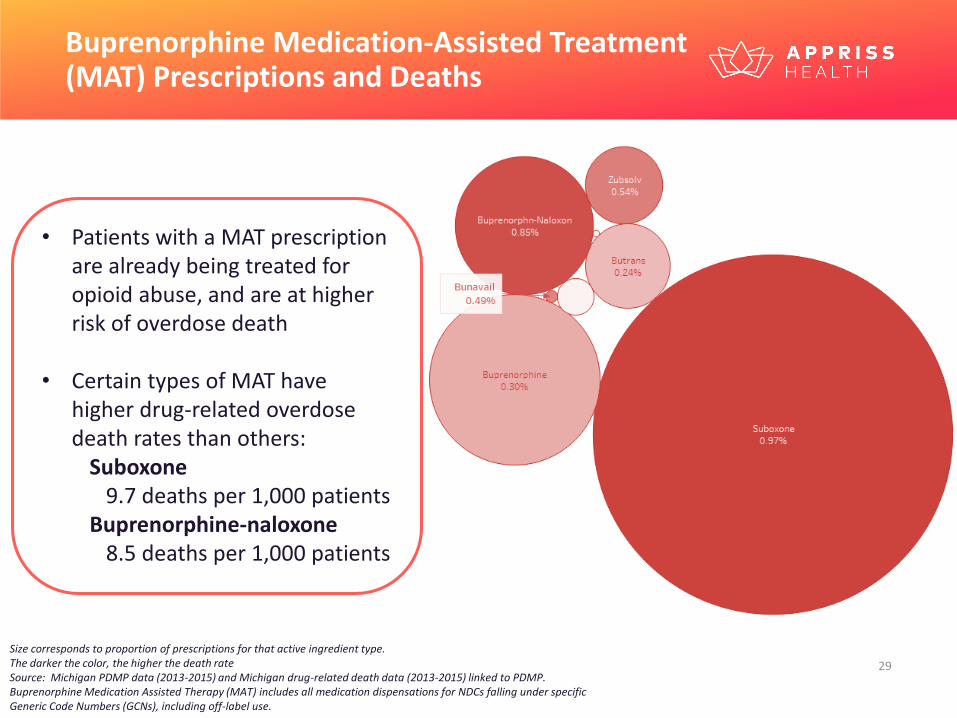
Buprenorphine Medication-Assisted Treatment (MAT) Prescriptions and Deaths
Size corresponds to proportion of prescriptions for that active ingredient type.The darker the color, the higher the death rateSource: Michigan PDMP data (2013-2015) and Michigan drug-related death data (2013-2015) linked to PDMP. Buprenorphine Medication Assisted Therapy (MAT) includes all medication dispensations for NDCs falling under specific Generic Code Numbers (GCNs), including off-label use.
• Patients with a MAT prescription are already being treated for opioid abuse, and are at higher risk of overdose death
• Certain types of MAT have higher drug-related overdose death rates than others:
Suboxone9.7 deaths per 1,000 patients
Buprenorphine-naloxone8.5 deaths per 1,000 patients
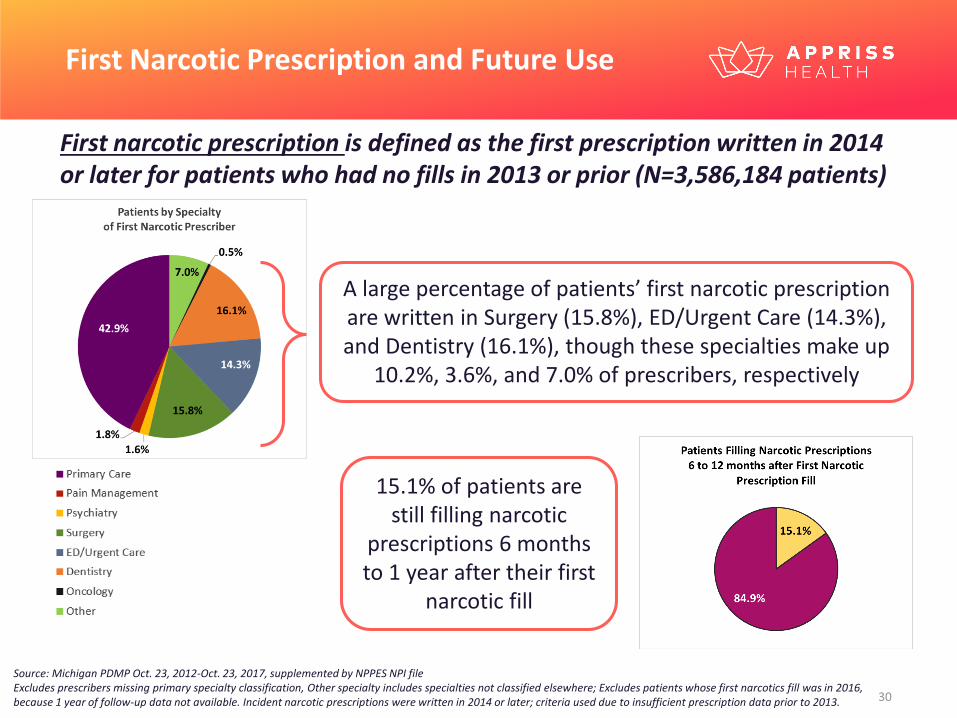
First Narcotic Prescription and Future Use
Source: Michigan PDMP Oct. 23, 2012-Oct. 23, 2017, supplemented by NPPES NPI fileExcludes prescribers missing primary specialty classification, Other specialty includes specialties not classified elsewhere; Excludes patients whose first narcotics fill was in 2016, because 1 year of follow-up data not available. Incident narcotic prescriptions were written in 2014 or later; criteria used due to insufficient prescription data prior to 2013.
First narcotic prescription is defined as the first prescription written in 2014 or later for patients who had no fills in 2013 or prior (N=3,586,184 patients)
15.1% of patients are still filling narcotic
prescriptions 6 months to 1 year after their first
narcotic fill
A large percentage of patients’ first narcotic prescription are written in Surgery (15.8%), ED/Urgent Care (14.3%), and Dentistry (16.1%), though these specialties make up
10.2%, 3.6%, and 7.0% of prescribers, respectively
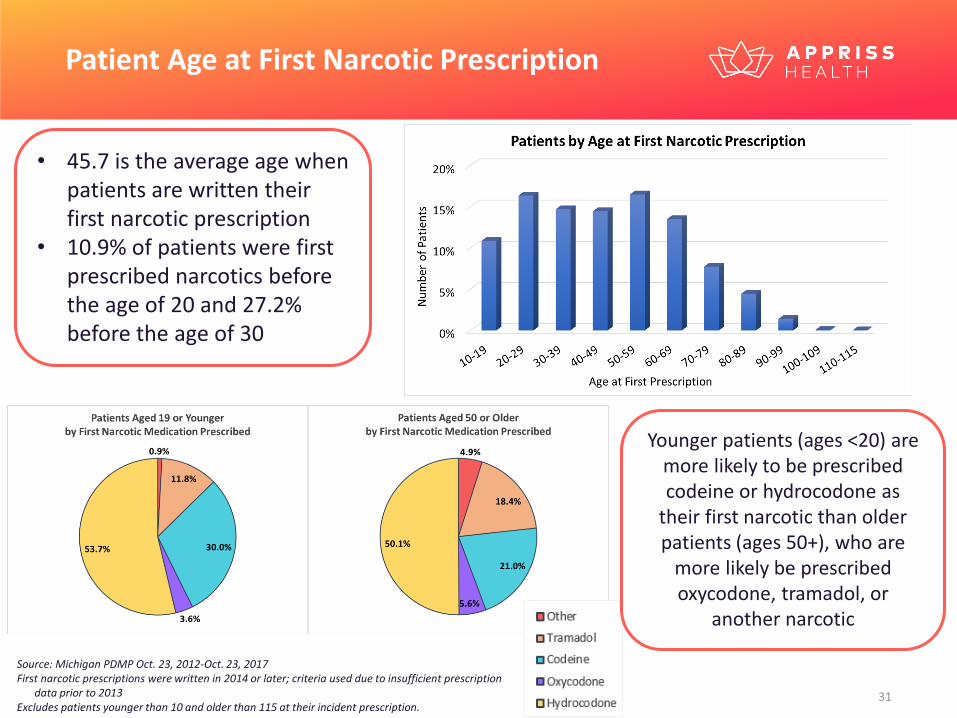
Patient Age at First Narcotic Prescription
• 45.7 is the average age when patients are written their first narcotic prescription
• 10.9% of patients were first prescribed narcotics before the age of 20 and 27.2% before the age of 30
Source: Michigan PDMP Oct. 23, 2012-Oct. 23, 2017 First narcotic prescriptions were written in 2014 or later; criteria used due to insufficient prescription
data prior to 2013Excludes patients younger than 10 and older than 115 at their incident prescription.
Younger patients (ages <20) are more likely to be prescribed codeine or hydrocodone as
their first narcotic than older patients (ages 50+), who are
more likely be prescribed oxycodone, tramadol, or
another narcotic
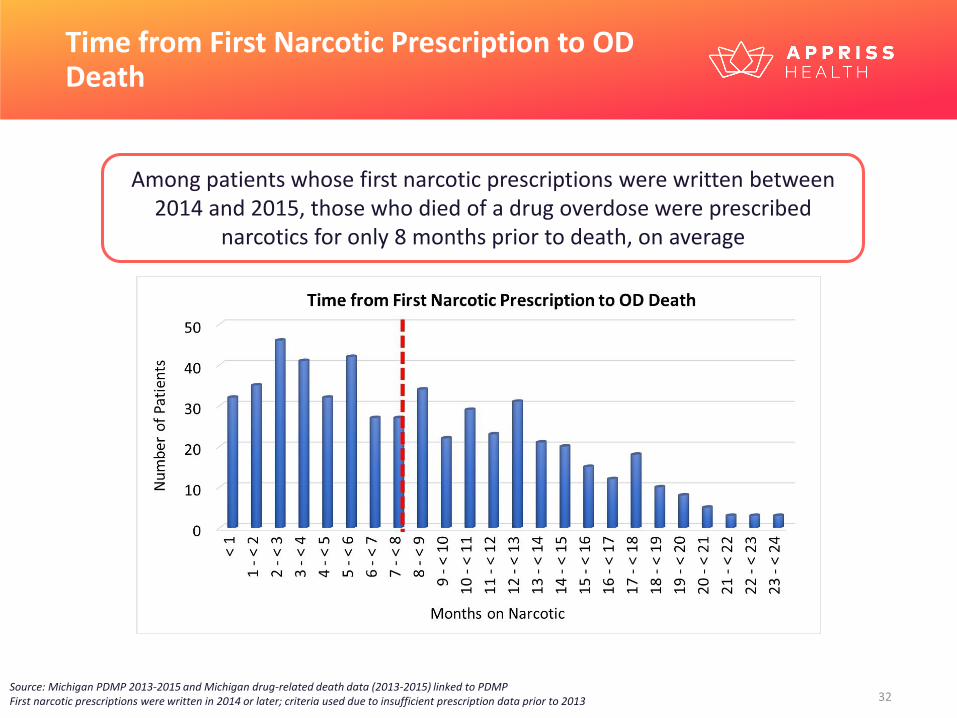
Time from First Narcotic Prescription to OD Death
Source: Michigan PDMP 2013-2015 and Michigan drug-related death data (2013-2015) linked to PDMPFirst narcotic prescriptions were written in 2014 or later; criteria used due to insufficient prescription data prior to 2013
Among patients whose first narcotic prescriptions were written between 2014 and 2015, those who died of a drug overdose were prescribed
narcotics for only 8 months prior to death, on average
T h e O v e r d o s e R i s k S c o r e ( O R S )
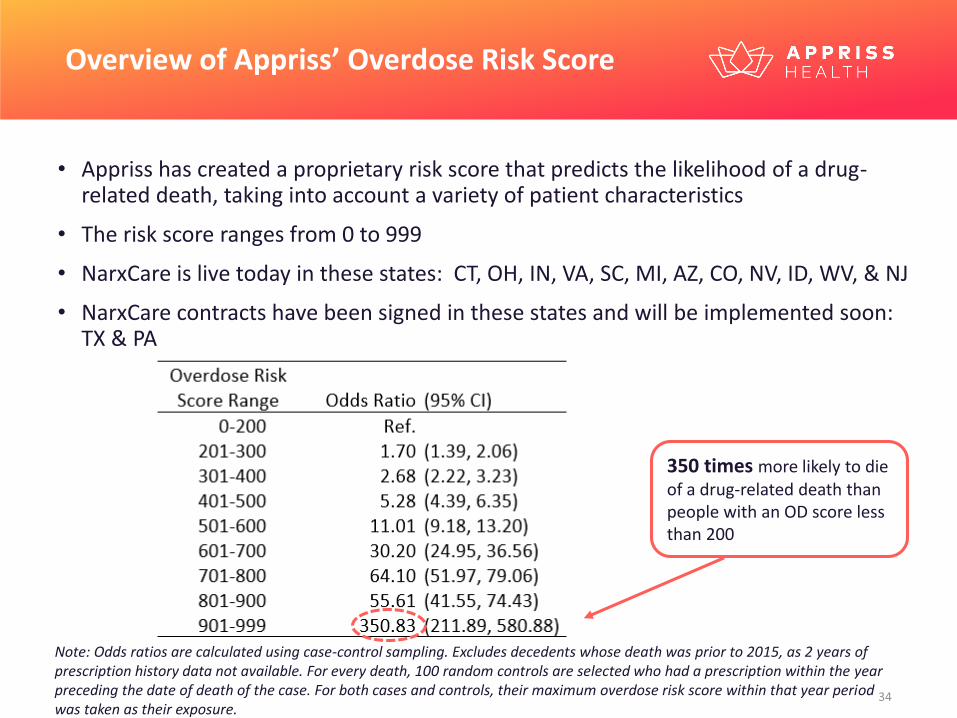
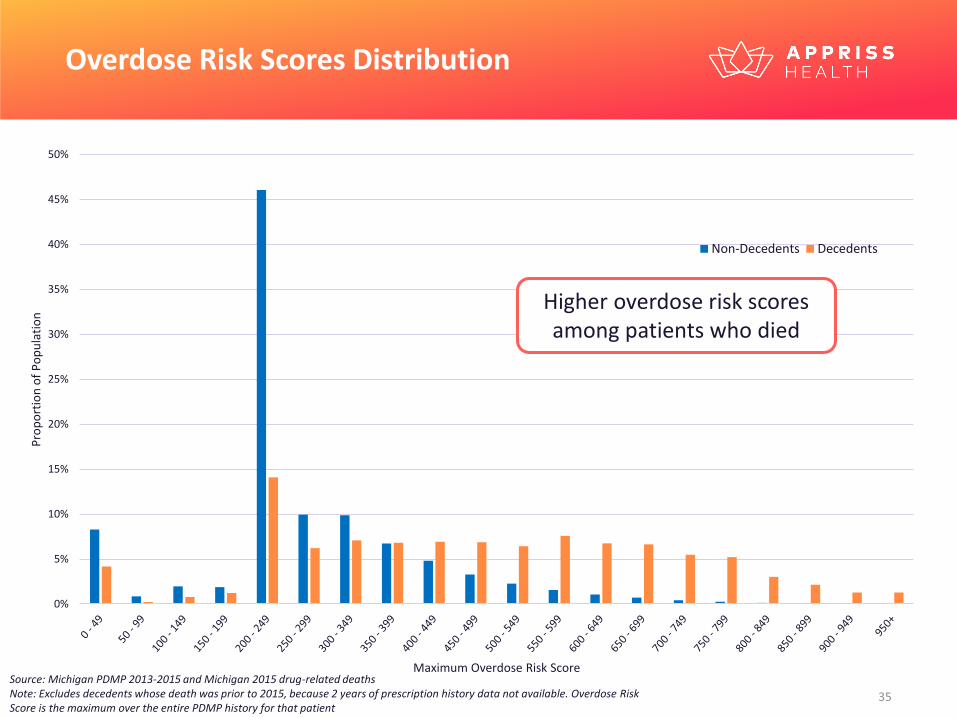
• Appriss has created a proprietary risk score that predicts the likelihood of a drug-related death, taking into account a variety of patient characteristics
• The risk score ranges from 0 to 999
• NarxCare is live today in these states: CT, OH, IN, VA, SC, MI, AZ, CO, NV, ID, WV, & NJ
• NarxCare contracts have been signed in these states and will be implemented soon: TX & PA
Overview of Appriss’ Overdose Risk Score
350 times more likely to die of a drug-related death than people with an OD score less than 200
Note: Odds ratios are calculated using case-control sampling. Excludes decedents whose death was prior to 2015, as 2 years of prescription history data not available. For every death, 100 random controls are selected who had a prescription within the year preceding the date of death of the case. For both cases and controls, their maximum overdose risk score within that year period was taken as their exposure.
0%
5%
10%
15%
20%
25%
30%
35%
40%
45%
50%
Pro
po
rtio
n o
f P
op
ula
tio
n
Maximum Overdose Risk Score
Non-Decedents Decedents
Higher overdose risk scores among patients who died
Overdose Risk Scores Distribution
Source: Michigan PDMP 2013-2015 and Michigan 2015 drug-related deathsNote: Excludes decedents whose death was prior to 2015, because 2 years of prescription history data not available. Overdose Risk Score is the maximum over the entire PDMP history for that patient
0.0
0.5
1.0
1.5
2.0
2.5
3.0
Dea
th R
ate
per
10
0 P
atie
nts
Maximum Overdose Risk Score
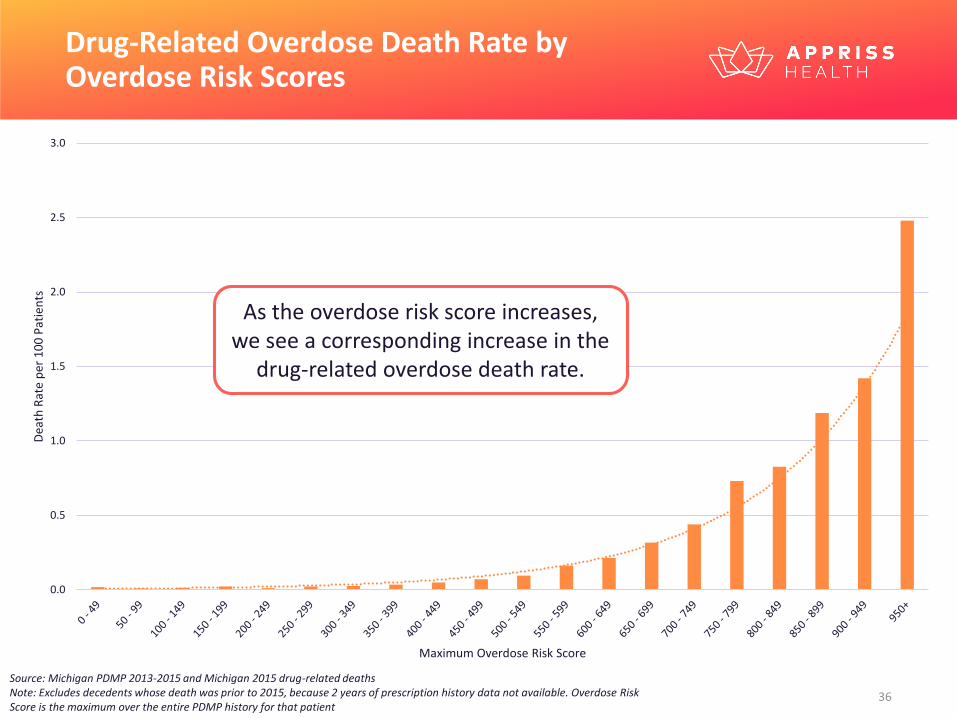
Drug-Related Overdose Death Rate by Overdose Risk Scores
As the overdose risk score increases, we see a corresponding increase in the
drug-related overdose death rate.
Source: Michigan PDMP 2013-2015 and Michigan 2015 drug-related deathsNote: Excludes decedents whose death was prior to 2015, because 2 years of prescription history data not available. Overdose Risk Score is the maximum over the entire PDMP history for that patient
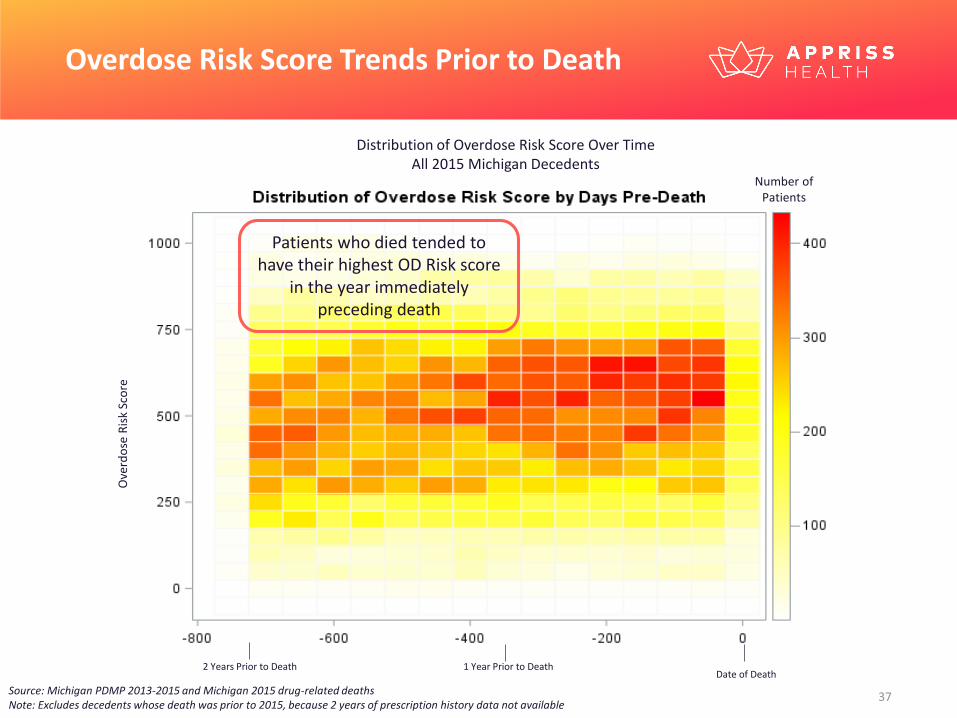
Overdose Risk Score Trends Prior to Death
Date of Death2 Years Prior to Death 1 Year Prior to Death
Ove
rdo
se R
isk
Sco
re
Distribution of Overdose Risk Score Over TimeAll 2015 Michigan Decedents
Source: Michigan PDMP 2013-2015 and Michigan 2015 drug-related deathsNote: Excludes decedents whose death was prior to 2015, because 2 years of prescription history data not available
Patients who died tended to have their highest OD Risk score
in the year immediately preceding death
Number of Patients
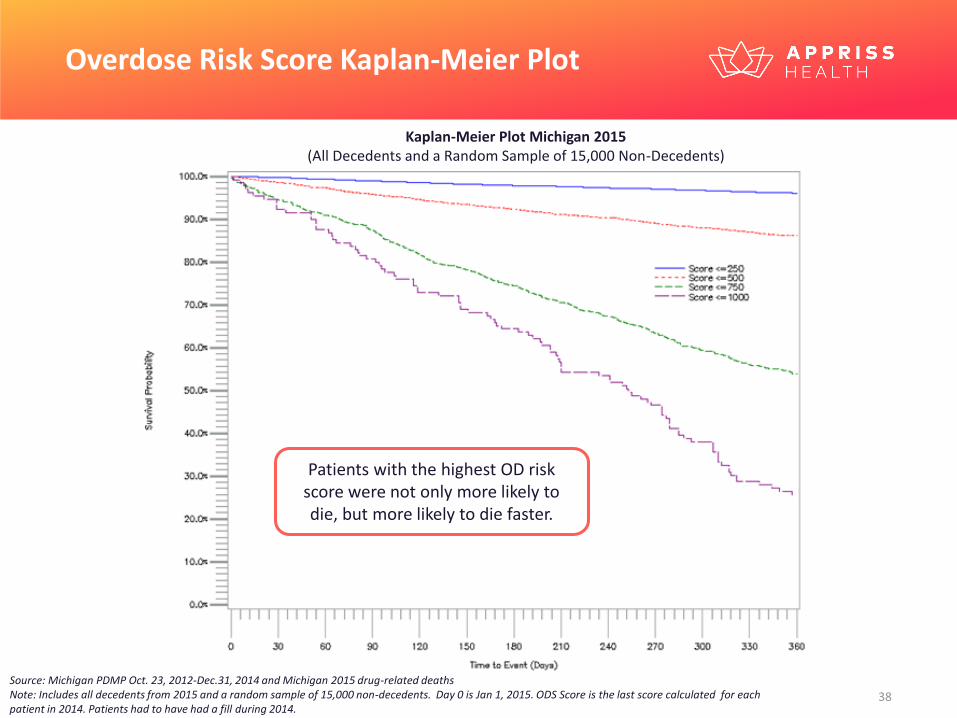
Overdose Risk Score Kaplan-Meier Plot
Source: Michigan PDMP Oct. 23, 2012-Dec.31, 2014 and Michigan 2015 drug-related deathsNote: Includes all decedents from 2015 and a random sample of 15,000 non-decedents. Day 0 is Jan 1, 2015. ODS Score is the last score calculated for each patient in 2014. Patients had to have had a fill during 2014.
Kaplan-Meier Plot Michigan 2015 (All Decedents and a Random Sample of 15,000 Non-Decedents)
Patients with the highest OD risk score were not only more likely to die, but more likely to die faster.
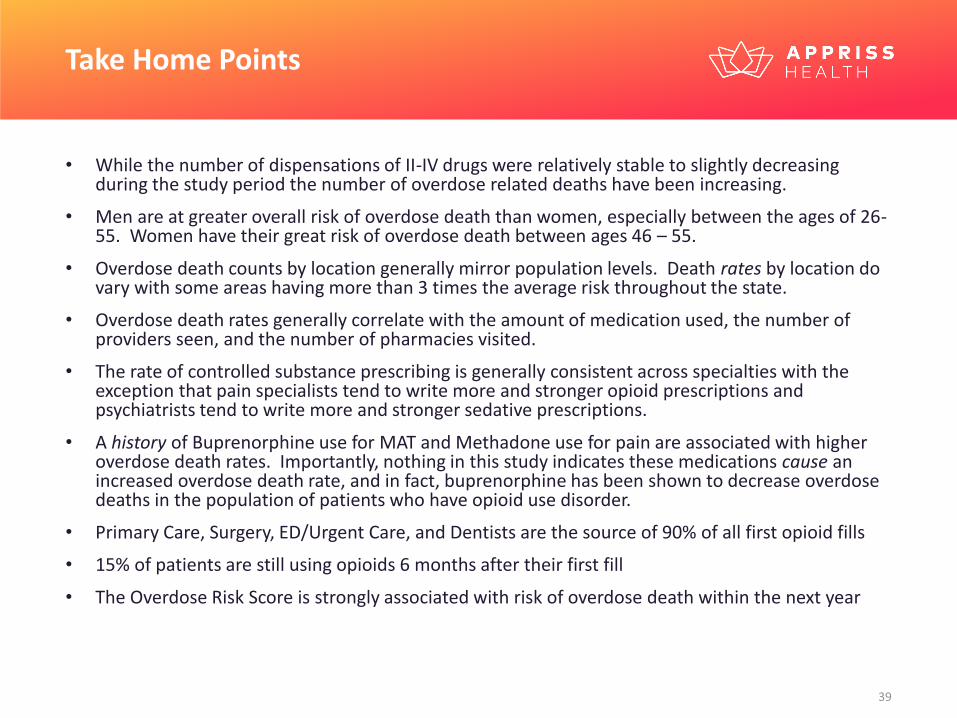
• While the number of dispensations of II-IV drugs were relatively stable to slightly decreasing during the study period the number of overdose related deaths have been increasing.
• Men are at greater overall risk of overdose death than women, especially between the ages of 26-55. Women have their great risk of overdose death between ages 46 – 55.
• Overdose death counts by location generally mirror population levels. Death rates by location do vary with some areas having more than 3 times the average risk throughout the state.
• Overdose death rates generally correlate with the amount of medication used, the number of providers seen, and the number of pharmacies visited.
• The rate of controlled substance prescribing is generally consistent across specialties with the exception that pain specialists tend to write more and stronger opioid prescriptions and psychiatrists tend to write more and stronger sedative prescriptions.
• A history of Buprenorphine use for MAT and Methadone use for pain are associated with higher overdose death rates. Importantly, nothing in this study indicates these medications cause an increased overdose death rate, and in fact, buprenorphine has been shown to decrease overdose deaths in the population of patients who have opioid use disorder.
• Primary Care, Surgery, ED/Urgent Care, and Dentists are the source of 90% of all first opioid fills
• 15% of patients are still using opioids 6 months after their first fill
• The Overdose Risk Score is strongly associated with risk of overdose death within the next year
Take Home Points

A p p e n d i x
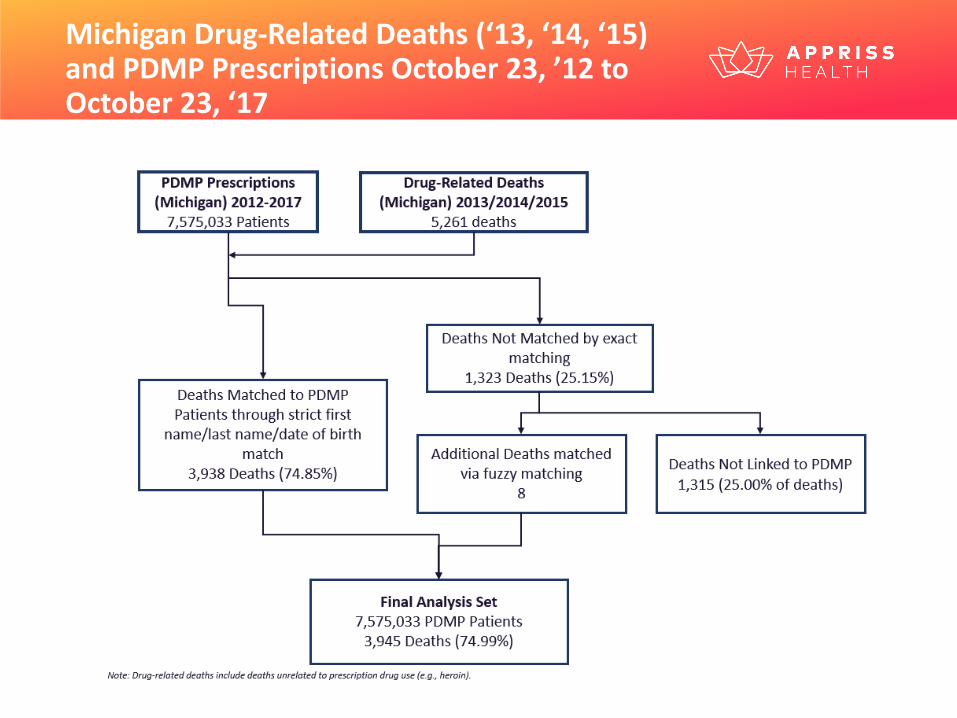
Michigan Drug-Related Deaths (‘13, ‘14, ‘15) and PDMP Prescriptions October 23, ’12 to October 23, ‘17


![Non-opioid & Opioid IV Anesthetics Copy [Compatibility Mode]](https://img.pdfslide.net/doc/110x75/55cf8c8a5503462b138d78d4/non-opioid-opioid-iv-anesthetics-copy-compatibility-mode.jpg)