Embed Size (px)
Citation preview
This article was downloaded by: [Hacettepe University]On: 19 December 2014, At: 19:31Publisher: Taylor & FrancisInforma Ltd Registered in England and Wales Registered Number: 1072954 Registered office: Mortimer House,37-41 Mortimer Street, London W1T 3JH, UK
Click for updates
International Journal of Pavement EngineeringPublication details, including instructions for authors and subscription information:http://www.tandfonline.com/loi/gpav20
Static and cyclic properties of clay subgrade stabilisedwith rice husk ash and Portland slag cementArgaw Asha Ashangoa & Nihar Ranjan Patraa
a Geotechnical Engineering Division, Department of Civil Engineering, IIT Kanpur, Kanpur208016, IndiaPublished online: 07 Mar 2014.
To cite this article: Argaw Asha Ashango & Nihar Ranjan Patra (2014) Static and cyclic properties of clay subgradestabilised with rice husk ash and Portland slag cement, International Journal of Pavement Engineering, 15:10, 906-916, DOI:10.1080/10298436.2014.893323
To link to this article: http://dx.doi.org/10.1080/10298436.2014.893323
PLEASE SCROLL DOWN FOR ARTICLE
Taylor & Francis makes every effort to ensure the accuracy of all the information (the “Content”) containedin the publications on our platform. However, Taylor & Francis, our agents, and our licensors make norepresentations or warranties whatsoever as to the accuracy, completeness, or suitability for any purpose of theContent. Any opinions and views expressed in this publication are the opinions and views of the authors, andare not the views of or endorsed by Taylor & Francis. The accuracy of the Content should not be relied upon andshould be independently verified with primary sources of information. Taylor and Francis shall not be liable forany losses, actions, claims, proceedings, demands, costs, expenses, damages, and other liabilities whatsoeveror howsoever caused arising directly or indirectly in connection with, in relation to or arising out of the use ofthe Content.
This article may be used for research, teaching, and private study purposes. Any substantial or systematicreproduction, redistribution, reselling, loan, sub-licensing, systematic supply, or distribution in anyform to anyone is expressly forbidden. Terms & Conditions of access and use can be found at http://www.tandfonline.com/page/terms-and-conditions
Static and cyclic properties of clay subgrade stabilised with rice husk ashand Portland slag cement
Argaw Asha Ashango1 and Nihar Ranjan Patra*
Geotechnical Engineering Division, Department of Civil Engineering, IIT Kanpur, Kanpur 208016, India
(Received 3 July 2013; accepted 19 January 2014)
In the present study, clay soil collected from new Banda, Uttar Pradesh, India has been treated with rice husk ash (RHA)and Portland slag cement (PSC). Based on unconfined compressive strength test results, the optimum mix obtained is of82.5%Soil þ 7.5%PSC þ 10%RHA. The increase in strength of the optimum mix is about 29.8%, 37.2% and 48.55%for a curing period of 7, 14 and 30 days, respectively. The soaked California bearing ratio (CBR) test gives about91.75% higher values as compared to unsoaked CBR test for a curing period of 30 days. Strain-controlled cyclictriaxial tests were conducted to study the variation of degradation index, shear modulus and damping ratio of theoptimum mix with number of cycles for strain amplitudes of 0.4%, 0.6%, 0.8% and 1% and for frequencies of 0.2 and1Hz at an effective confining pressure of 100 kPa. It is observed that the degradation index decreases at a fast rate forthe first 25–50 cycles. From the study, it is concluded that the aforementioned mix may be suitable for pavementsubgrade material.
Keywords: clay subgrade; rice husk ash; Portland slag cement; California bearing ratio; cyclic tests; degradation index
List of notations
AASHTO: American Association of State Highway and
Transportation Officials
ASTM: American Society for Testing and Materials
ASTM D: American Society for Testing and Materials
Designation
CAH: calcium aluminates hydrate
CBR: California bearing ratio
CH: highly expansive clay soil
CSH: calcium silicate hydrate
D: damping ratio
G: shear modulus
Hz: Hertz
IS: Indian Standard
JCPDs: Joint Committee on Powder Diffraction
Standards
MDD: maximum dry density
OMC: optimum moisture content
PSC: Portland slag cement
RHA: rice husk ash
UCS: unconfined compressive strength
UCSC: Unified Soil Classification System
XRD: X-ray diffraction
XRF: X-ray fluorescence
d: degradation index
g: strain amplitude
1. Introduction
Expansive soils are found in the arid and semi-arid regions
and formed due to poor drainage and hot climatic
condition, and its colour varies from grey to deep black
and rarely reddish or yellowish and the thickness also
varies from 30 cm to 15m (Rao 2000). Twenty percent of
the total land in India is covered by expansive soils and
generally it is called black cotton soil (Rao 2000). In
addition to India, this black cotton soil is available in many
parts of the world such as Africa, Australia, Ethiopia,
Israel, Jordan, the USA, and so on (Rao 2000). The annual
damage to civil engineering structure due to this soil are
estimated to be around billion dollars in the world and
particularly 1 billion dollars in the USA and 150 million
dollars in the UK (Gourley et al. 1993, Sabat and
Nanda 2011).
Rice husk ash (RHA) is a waste material obtained from
controlled burning of rice husks at a temperature of 6008C(Della et al. 2002) and 20% of rice husk are ash. RHA is
classified as a pozzolanic material [American Society for
Testing Materials (ASTM) C618 2012a], which is
siliceous and aluminous by composition. This material is
in bulk amount in major rice producing countries such as
India and China (Ramakrishna and Pradeep 2008) and its
fineness and low density make it to fly over the air, which
contributes to environmental issues and in addition to that
storage has claimed for land proclamation (Rahman 1987).
q 2014 Taylor & Francis
*Corresponding author. Email: [email protected]
International Journal of Pavement Engineering, 2014
Vol. 15, No. 10, 906–916, http://dx.doi.org/10.1080/10298436.2014.893323
Dow
nloa
ded
by [
Hac
ette
pe U
nive
rsity
] at
19:
31 1
9 D
ecem
ber
2014
Portland slag cement (PSC) is made by inter-grinding
of high quality of clinker, slag and gypsum. Clinker used
for the production of slag cement contains highly reactive
tri-calcium silicates (3CaO·SiO2) that facilitate good
reactivity and strength development in the cement.
Granulated blast furnace slag containing high glass
content (more than 90%) is obtained by rapid quenching
or chilling of molten slag generated from blast furnace
during steel making. Gypsum (CaSO4·H2O) is added to the
clinker and slag to manufacture PSC and it should be in
amounts such that the sulphur trioxide (SO3) in the cement
produced does not exceed the limit of 3%. It is a
cementitious material consisting of lime (CaO), silicon
dioxide (SiO2), aluminum oxide (Al2O3) and magnesium
oxide (MgO). The high amount of lime(CaO), 50.85%,
present in PSC makes it a suitable binding material for
mixing it with silicon dioxide (SiO2) that exist in RHA.
The PSC does not contain carbon and it does not cause
instability in the entrained air content.
Aubert et al. (2006) have reported that reusing thewaste
material in environmentally friendly and economically
sustainable ways are important topics on which authorities
and researchers are working on. Apart from this, the
demand of construction material and its cost increases day
by day and this leads to scarcity of raw materials and
increase in price of energy. The improvement in strength of
the clay soil is due to the presence of cementitiousmaterials
in soil–cement matrix (Stavridakis 2005, Kamruzzamn
et al. 2006). The cementitious materials are formed by the
reaction between hydrated lime from cement and the silica
and alumina from RHA and clay minerals and that leads to
formation of calcium silicate hydrate and calcium
aluminates hydrate (Rahman et al. 2010).
The heavy traffic loading, railway, earthquake, etc. can
affect the dynamic property of soils (Thammathiwat and
Chim-oye 2004). This dynamic property of soils such as
shear modulus and damping ratio depends on the cyclic
frequency and strain amplitude (Zhou and Gong 2001,
Jiang et al. 2010). The cyclic loading affects the
chemically mixed soils (Hoyos et al. 2004, Shafiee et al.
2004). Few cyclic triaxial test results of stabilised clay soil
have been reported by Ashango and Patra (2013). Clay soil
stabilised with RHA and PSC in terms of strength,
durability and California bearing ratio (CBR) are limited.
In the present study, black cotton clay soil collected
from new Banda, Uttar Pradesh, India has been mixed with
RHA and PSC to determine the optimum mix. The
unconfined compressive strength (UCS) of the optimum
mix has been carried out for different curing periods. The
unsoaked and soaked CBR tests have been carried out for
the mixture for different curing periods. The durability test
is carried out for the optimummix. Strain-controlled cyclic
triaxial tests have been conducted to study the variation of
degradation index, d, shear modulus, G and damping ratio,
D of the optimum mix of soil with number of cycles for
different strain amplitudes of 0.4%, 0.6%, 0.8% and 1%and
effective confining pressure of 100 kPa at a frequency of 0.2
and 1Hz. Based on static and cyclic test results on stabilised
clay, conclusions have been drawn for the material mix and
its applicability for pavement subgrade.
2. Experimental programme
The experimental programme was divided into four parts.
In the first part, the geotechnical properties of the soil, RHA
and PSC were determined. In the second part, the optimum
mix for stabilisation of the soil sample was determined. In
the third part, unsoaked and soaked CBR tests, unconfined
compression test and durability testswere carried out. In the
fourth part, cyclic tests have been conducted to determine
degradation index, shear modulus and damping ratio of the
optimummix. The detailed experimental programme of the
present study is given in Table 1.
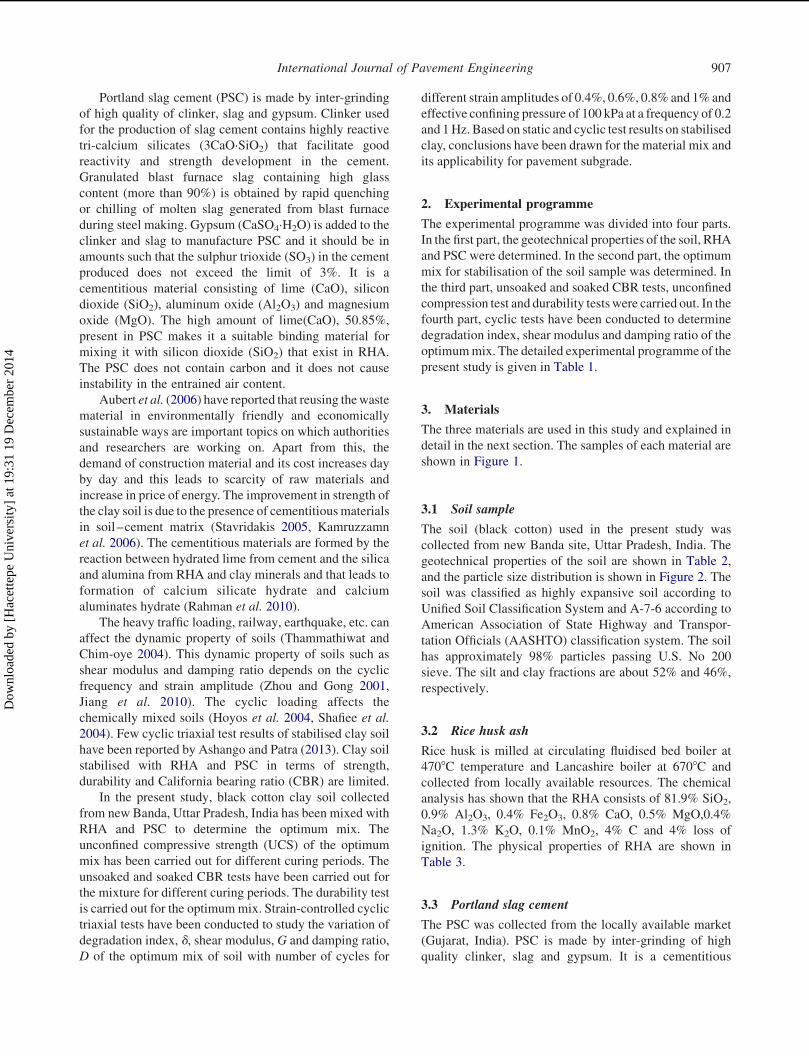
3. Materials
The three materials are used in this study and explained in
detail in the next section. The samples of each material are
shown in Figure 1.
3.1 Soil sample
The soil (black cotton) used in the present study was
collected from new Banda site, Uttar Pradesh, India. The
geotechnical properties of the soil are shown in Table 2,
and the particle size distribution is shown in Figure 2. The
soil was classified as highly expansive soil according to
Unified Soil Classification System and A-7-6 according to
American Association of State Highway and Transpor-
tation Officials (AASHTO) classification system. The soil
has approximately 98% particles passing U.S. No 200
sieve. The silt and clay fractions are about 52% and 46%,
respectively.
3.2 Rice husk ash
Rice husk is milled at circulating fluidised bed boiler at
4708C temperature and Lancashire boiler at 6708C and
collected from locally available resources. The chemical
analysis has shown that the RHA consists of 81.9% SiO2,
0.9% Al2O3, 0.4% Fe2O3, 0.8% CaO, 0.5% MgO,0.4%
Na2O, 1.3% K2O, 0.1% MnO2, 4% C and 4% loss of
ignition. The physical properties of RHA are shown in
Table 3.
3.3 Portland slag cement
The PSC was collected from the locally available market
(Gujarat, India). PSC is made by inter-grinding of high
quality clinker, slag and gypsum. It is a cementitious
International Journal of Pavement Engineering 907
Dow
nloa
ded
by [
Hac
ette
pe U
nive
rsity
] at
19:
31 1
9 D
ecem
ber
2014
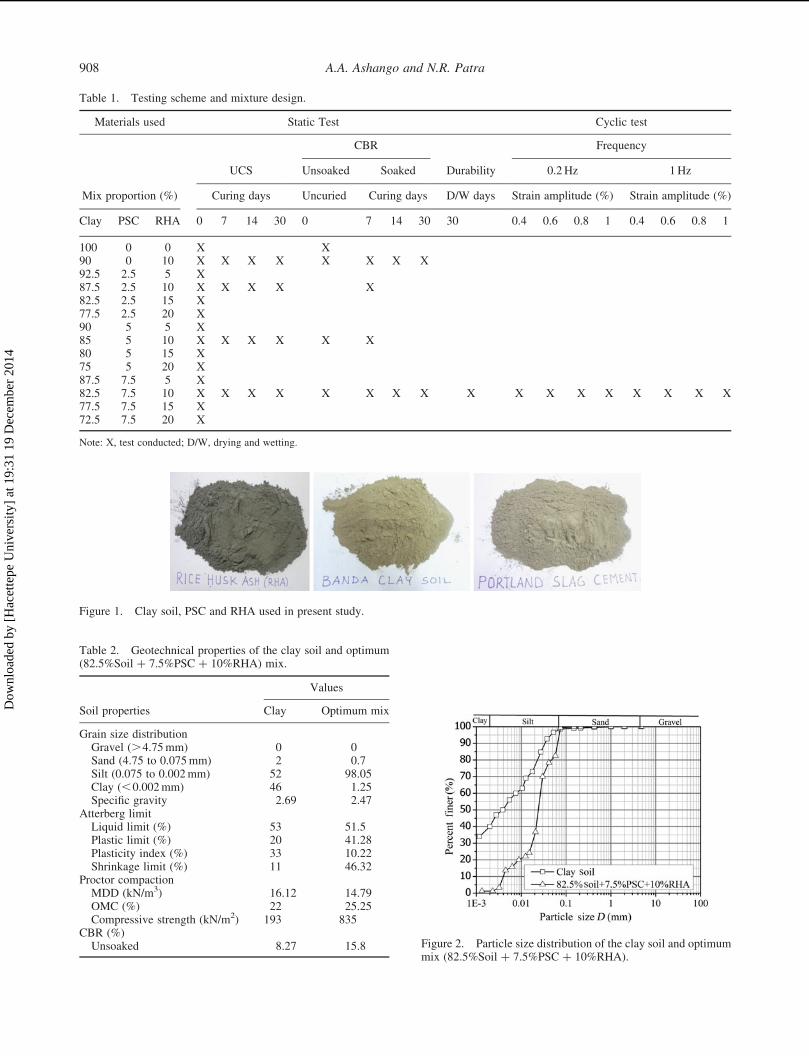
Figure 1. Clay soil, PSC and RHA used in present study.
Table 2. Geotechnical properties of the clay soil and optimum(82.5%Soil þ 7.5%PSC þ 10%RHA) mix.
Values
Soil properties Clay Optimum mix
Grain size distributionGravel (.4.75mm) 0 0Sand (4.75 to 0.075mm) 2 0.7Silt (0.075 to 0.002mm) 52 98.05Clay (,0.002mm) 46 1.25Specific gravity 2.69 2.47
Atterberg limitLiquid limit (%) 53 51.5Plastic limit (%) 20 41.28Plasticity index (%) 33 10.22Shrinkage limit (%) 11 46.32
Proctor compactionMDD (kN/m3) 16.12 14.79OMC (%) 22 25.25Compressive strength (kN/m2) 193 835
CBR (%)Unsoaked 8.27 15.8 Figure 2. Particle size distribution of the clay soil and optimum
mix (82.5%Soil þ 7.5%PSC þ 10%RHA).
Table 1. Testing scheme and mixture design.
Materials used Static Test Cyclic test
CBR Frequency
UCS Unsoaked Soaked Durability 0.2Hz 1Hz
Mix proportion (%) Curing days Uncuried Curing days D/W days Strain amplitude (%) Strain amplitude (%)
Clay PSC RHA 0 7 14 30 0 7 14 30 30 0.4 0.6 0.8 1 0.4 0.6 0.8 1
100 0 0 X X90 0 10 X X X X X X X X92.5 2.5 5 X87.5 2.5 10 X X X X X82.5 2.5 15 X77.5 2.5 20 X90 5 5 X85 5 10 X X X X X X80 5 15 X75 5 20 X87.5 7.5 5 X82.5 7.5 10 X X X X X X X X X X X X X X X X X77.5 7.5 15 X72.5 7.5 20 X
Note: X, test conducted; D/W, drying and wetting.
A.A. Ashango and N.R. Patra908
Dow
nloa
ded
by [
Hac
ette
pe U
nive
rsity
] at
19:
31 1
9 D
ecem
ber
2014
material that consists of lime (CaO), silicon dioxide
(SiO2), aluminum oxide (Al2O3) and magnesium oxide
(MgO). X-ray fluorescence was carried out by ZFX Primus
II RIGAKU machine with 36.58C internal temperature and
3 kV power for the PSC to find the oxide contents. The
chemical analysis shows that the PSC consists of 50.8%
CaO, 27.7% SiO2, 11.2% Al2O3, 2.9% Fe2O3, 2.8% SO3,
2.5% MgO, 0.6% Na2O and 0.5% K2O. The high amount
of lime (CaO) in PSC reflects it as a binder material.
4. Testing procedures
4.1 Static tests
The geotechnical laboratory tests were carried out on clay
soil for the classification of the expansive soil. The RHA
varies from 5% to 20% with increment of 5% and the PSC
varies from 2.5% to 7.5% with increment of 2.5% of dry
unit soil which were mixed thoroughly and kept for
10min. The maximum dry density (MDD) and the
optimum moisture content (OMC) for various mixtures
were determined by standard proctor method in accord-
ance with ASTM 698. UCS test was conducted on sample
having a dimension of 38mm diameter and 76mm height
prepared with their respective mix of MDD and OMC in
accordance with ASTM 2166 for three samples. The
average of them was taken as the UCS value. This sample
was tested after 0, 7, 14 and 30 days of curing in a room
maintained at 90–100% relative humidity and temperature
of 32–358C with a strain rate 0.625mm/min.
Test specimens were prepared at OMC with their
respective mix for CBR test in accordance with ASTM
1883. The CBR tests were conducted for unsoaked and
soaked conditions. The sample was soaked for 4 days after
cured in a room maintained at 90–100% relative humidity
and temperature of 32–358C for 0, 7, 14 and 30 days.
Then, the sample was tested at a strain rate of 1.25mm/
min. The durability test was conducted for three samples
prepared for UCS tests in two steps: wetting and drying.
In the wetting case, the samples after 7 days of curing were
immersed in water for 5 h. Then, their weight and height
were recorded. In the drying case, the samples were dried
after 5 h of immersion in water. Then, their weight and
height were measured. These samples were oven-dried for
42 h at a temperature of 808C and were cooled for 1 h.
Then their weight and height were measured. This
completes the wetting and drying for one cycle. The
same procedure was repeated for 12 cycles. The sample
that existed for 12 cycles was tested for UCS test in
accordance with ASTM 559.
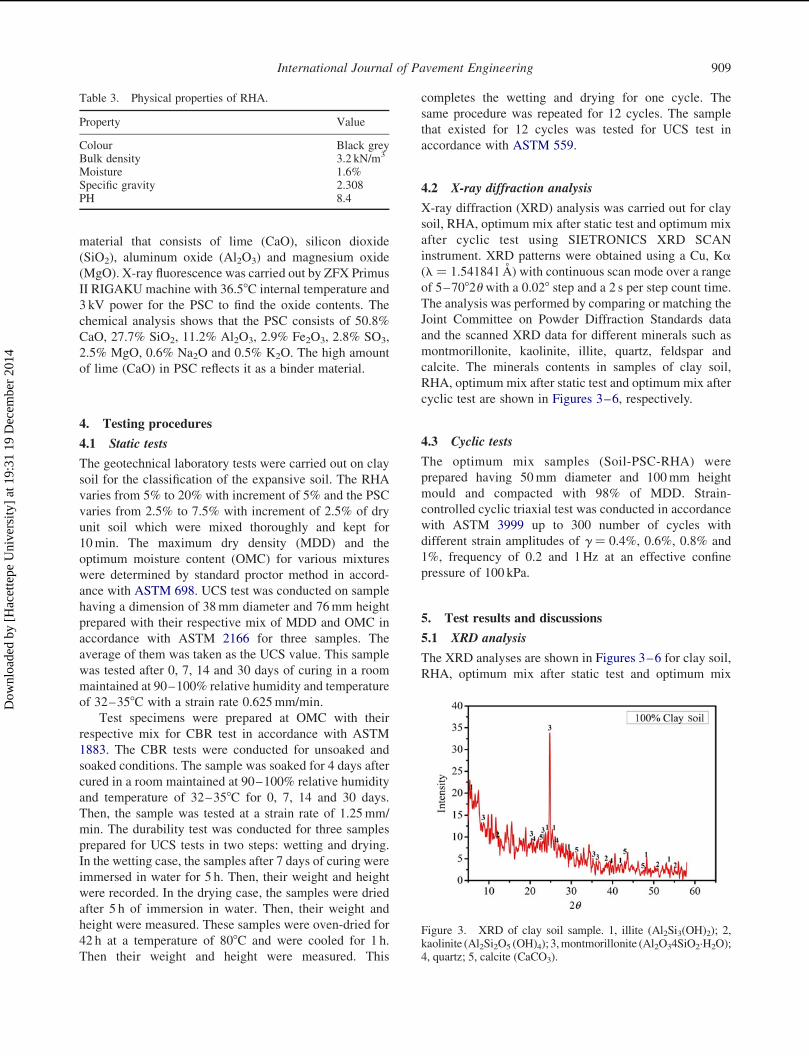
4.2 X-ray diffraction analysis
X-ray diffraction (XRD) analysis was carried out for clay
soil, RHA, optimum mix after static test and optimum mix
after cyclic test using SIETRONICS XRD SCAN
instrument. XRD patterns were obtained using a Cu, Ka(l ¼ 1.541841 A) with continuous scan mode over a range
of 5–7082u with a 0.028 step and a 2 s per step count time.
The analysis was performed by comparing or matching the
Joint Committee on Powder Diffraction Standards data
and the scanned XRD data for different minerals such as
montmorillonite, kaolinite, illite, quartz, feldspar and
calcite. The minerals contents in samples of clay soil,
RHA, optimum mix after static test and optimum mix after
cyclic test are shown in Figures 3–6, respectively.
4.3 Cyclic tests
The optimum mix samples (Soil-PSC-RHA) were
prepared having 50mm diameter and 100mm height
mould and compacted with 98% of MDD. Strain-
controlled cyclic triaxial test was conducted in accordance
with ASTM 3999 up to 300 number of cycles with
different strain amplitudes of g ¼ 0.4%, 0.6%, 0.8% and
1%, frequency of 0.2 and 1Hz at an effective confine
pressure of 100 kPa.
5. Test results and discussions
5.1 XRD analysis
The XRD analyses are shown in Figures 3–6 for clay soil,
RHA, optimum mix after static test and optimum mix
Table 3. Physical properties of RHA.
Property Value
Colour Black greyBulk density 3.2 kN/m3
Moisture 1.6%Specific gravity 2.308PH 8.4
Figure 3. XRD of clay soil sample. 1, illite (Al2Si3(OH)2); 2,kaolinite (Al2Si2O5 (OH)4); 3,montmorillonite (Al2O34SiO2·H2O);4, quartz; 5, calcite (CaCO3).
International Journal of Pavement Engineering 909
Dow
nloa
ded
by [
Hac
ette
pe U
nive
rsity
] at
19:
31 1
9 D
ecem
ber
2014
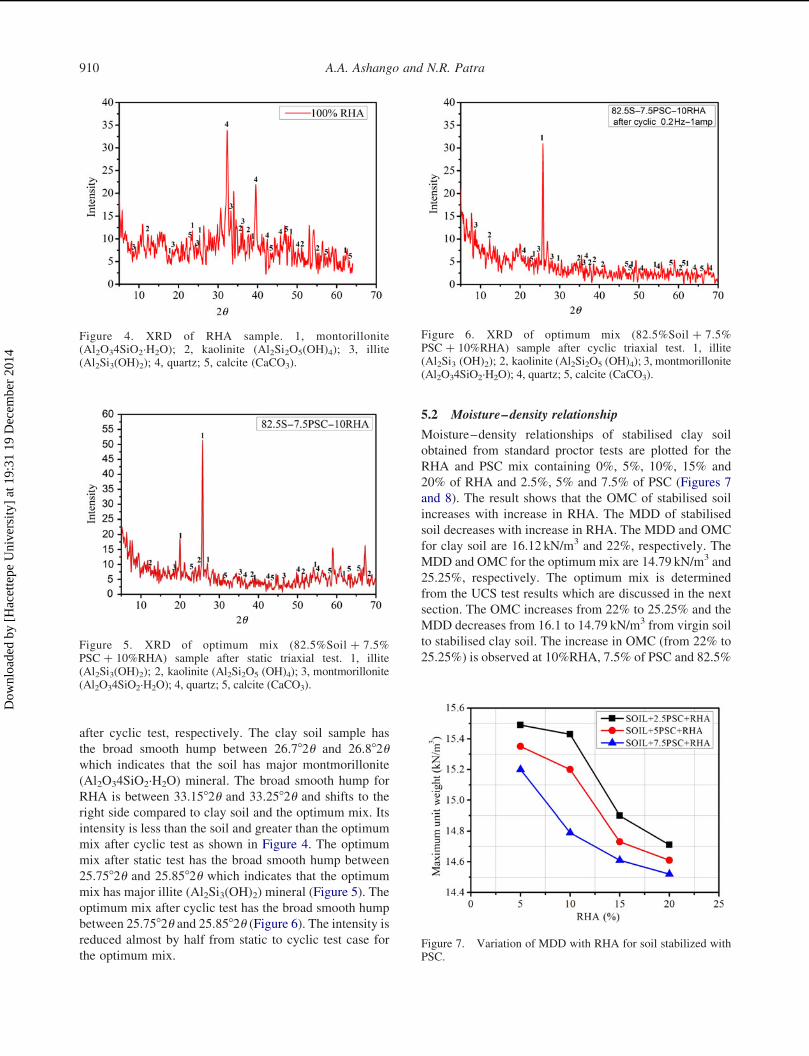
after cyclic test, respectively. The clay soil sample has
the broad smooth hump between 26.782u and 26.882uwhich indicates that the soil has major montmorillonite
(Al2O34SiO2·H2O) mineral. The broad smooth hump for
RHA is between 33.1582u and 33.2582u and shifts to the
right side compared to clay soil and the optimum mix. Its
intensity is less than the soil and greater than the optimum
mix after cyclic test as shown in Figure 4. The optimum
mix after static test has the broad smooth hump between
25.7582u and 25.8582u which indicates that the optimum
mix has major illite (Al2Si3(OH)2) mineral (Figure 5). The
optimum mix after cyclic test has the broad smooth hump
between 25.7582u and 25.8582u (Figure 6). The intensity isreduced almost by half from static to cyclic test case for
the optimum mix.
5.2 Moisture–density relationship
Moisture–density relationships of stabilised clay soil
obtained from standard proctor tests are plotted for the
RHA and PSC mix containing 0%, 5%, 10%, 15% and
20% of RHA and 2.5%, 5% and 7.5% of PSC (Figures 7
and 8). The result shows that the OMC of stabilised soil
increases with increase in RHA. The MDD of stabilised
soil decreases with increase in RHA. The MDD and OMC
for clay soil are 16.12 kN/m3 and 22%, respectively. The
MDD and OMC for the optimum mix are 14.79 kN/m3 and
25.25%, respectively. The optimum mix is determined
from the UCS test results which are discussed in the next
section. The OMC increases from 22% to 25.25% and the
MDD decreases from 16.1 to 14.79 kN/m3 from virgin soil
to stabilised clay soil. The increase in OMC (from 22% to
25.25%) is observed at 10%RHA, 7.5% of PSC and 82.5%Figure 5. XRD of optimum mix (82.5%Soil þ 7.5%PSC þ 10%RHA) sample after static triaxial test. 1, illite(Al2Si3(OH)2); 2, kaolinite (Al2Si2O5 (OH)4); 3, montmorillonite(Al2O34SiO2·H2O); 4, quartz; 5, calcite (CaCO3).
Figure 7. Variation of MDD with RHA for soil stabilized withPSC.
Figure 4. XRD of RHA sample. 1, montorillonite(Al2O34SiO2·H2O); 2, kaolinite (Al2Si2O5(OH)4); 3, illite(Al2Si3(OH)2); 4, quartz; 5, calcite (CaCO3).
Figure 6. XRD of optimum mix (82.5%Soil þ 7.5%PSC þ 10%RHA) sample after cyclic triaxial test. 1, illite(Al2Si3 (OH)2); 2, kaolinite (Al2Si2O5 (OH)4); 3, montmorillonite(Al2O34SiO2·H2O); 4, quartz; 5, calcite (CaCO3).
A.A. Ashango and N.R. Patra910
Dow
nloa
ded
by [
Hac
ette
pe U
nive
rsity
] at
19:
31 1
9 D
ecem
ber
2014
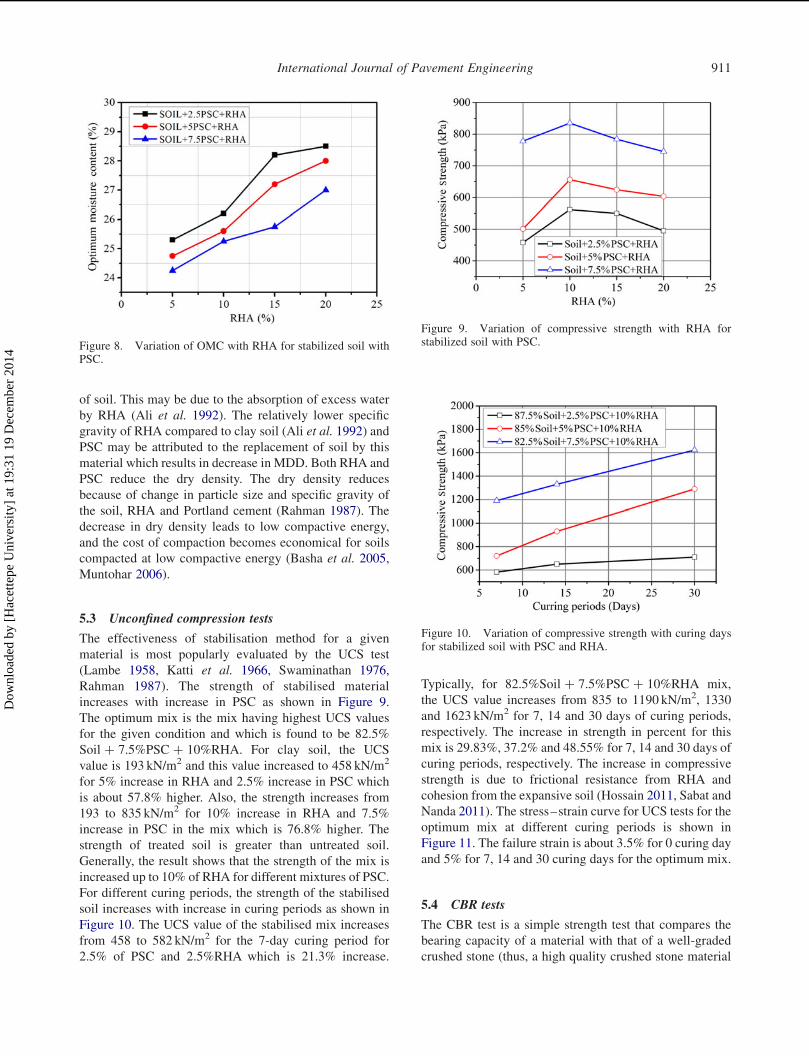
of soil. This may be due to the absorption of excess water
by RHA (Ali et al. 1992). The relatively lower specific
gravity of RHA compared to clay soil (Ali et al. 1992) and
PSC may be attributed to the replacement of soil by this
material which results in decrease in MDD. Both RHA and
PSC reduce the dry density. The dry density reduces
because of change in particle size and specific gravity of
the soil, RHA and Portland cement (Rahman 1987). The
decrease in dry density leads to low compactive energy,
and the cost of compaction becomes economical for soils
compacted at low compactive energy (Basha et al. 2005,
Muntohar 2006).
5.3 Unconfined compression tests
The effectiveness of stabilisation method for a given
material is most popularly evaluated by the UCS test
(Lambe 1958, Katti et al. 1966, Swaminathan 1976,
Rahman 1987). The strength of stabilised material
increases with increase in PSC as shown in Figure 9.
The optimum mix is the mix having highest UCS values
for the given condition and which is found to be 82.5%
Soil þ 7.5%PSC þ 10%RHA. For clay soil, the UCS
value is 193 kN/m2 and this value increased to 458 kN/m2
for 5% increase in RHA and 2.5% increase in PSC which
is about 57.8% higher. Also, the strength increases from
193 to 835 kN/m2 for 10% increase in RHA and 7.5%
increase in PSC in the mix which is 76.8% higher. The
strength of treated soil is greater than untreated soil.
Generally, the result shows that the strength of the mix is
increased up to 10% of RHA for different mixtures of PSC.
For different curing periods, the strength of the stabilised
soil increases with increase in curing periods as shown in
Figure 10. The UCS value of the stabilised mix increases
from 458 to 582 kN/m2 for the 7-day curing period for
2.5% of PSC and 2.5%RHA which is 21.3% increase.
Typically, for 82.5%Soil þ 7.5%PSC þ 10%RHA mix,
the UCS value increases from 835 to 1190 kN/m2, 1330
and 1623 kN/m2 for 7, 14 and 30 days of curing periods,
respectively. The increase in strength in percent for this
mix is 29.83%, 37.2% and 48.55% for 7, 14 and 30 days of
curing periods, respectively. The increase in compressive
strength is due to frictional resistance from RHA and
cohesion from the expansive soil (Hossain 2011, Sabat and
Nanda 2011). The stress–strain curve for UCS tests for the
optimum mix at different curing periods is shown in
Figure 11. The failure strain is about 3.5% for 0 curing day
and 5% for 7, 14 and 30 curing days for the optimum mix.
5.4 CBR tests
The CBR test is a simple strength test that compares the
bearing capacity of a material with that of a well-graded
crushed stone (thus, a high quality crushed stone material
Figure 8. Variation of OMC with RHA for stabilized soil withPSC.
Figure 9. Variation of compressive strength with RHA forstabilized soil with PSC.
Figure 10. Variation of compressive strength with curing daysfor stabilized soil with PSC and RHA.
International Journal of Pavement Engineering 911
Dow
nloa
ded
by [
Hac
ette
pe U
nive
rsity
] at
19:
31 1
9 D
ecem
ber
2014
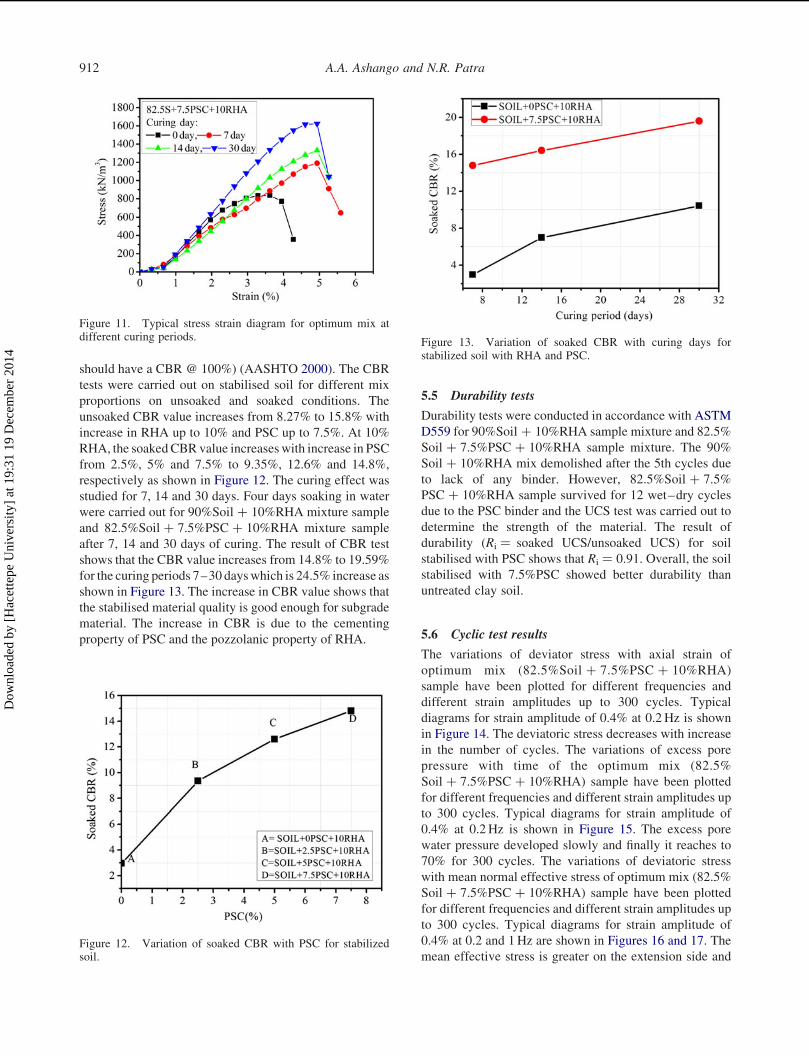
should have a CBR @ 100%) (AASHTO 2000). The CBR
tests were carried out on stabilised soil for different mix
proportions on unsoaked and soaked conditions. The
unsoaked CBR value increases from 8.27% to 15.8% with
increase in RHA up to 10% and PSC up to 7.5%. At 10%
RHA, the soakedCBR value increases with increase in PSC
from 2.5%, 5% and 7.5% to 9.35%, 12.6% and 14.8%,
respectively as shown in Figure 12. The curing effect was
studied for 7, 14 and 30 days. Four days soaking in water
were carried out for 90%Soil þ 10%RHA mixture sample
and 82.5%Soil þ 7.5%PSC þ 10%RHA mixture sample
after 7, 14 and 30 days of curing. The result of CBR test
shows that the CBR value increases from 14.8% to 19.59%
for the curing periods 7–30 dayswhich is 24.5% increase as
shown in Figure 13. The increase in CBR value shows that
the stabilised material quality is good enough for subgrade
material. The increase in CBR is due to the cementing
property of PSC and the pozzolanic property of RHA.
5.5 Durability tests
Durability tests were conducted in accordance with ASTM
D559 for 90%Soil þ 10%RHA sample mixture and 82.5%
Soil þ 7.5%PSC þ 10%RHA sample mixture. The 90%
Soil þ 10%RHA mix demolished after the 5th cycles due
to lack of any binder. However, 82.5%Soil þ 7.5%
PSC þ 10%RHA sample survived for 12 wet–dry cycles
due to the PSC binder and the UCS test was carried out to
determine the strength of the material. The result of
durability (Ri ¼ soaked UCS/unsoaked UCS) for soil
stabilised with PSC shows that Ri ¼ 0.91. Overall, the soil
stabilised with 7.5%PSC showed better durability than
untreated clay soil.
5.6 Cyclic test results
The variations of deviator stress with axial strain of
optimum mix (82.5%Soil þ 7.5%PSC þ 10%RHA)
sample have been plotted for different frequencies and
different strain amplitudes up to 300 cycles. Typical
diagrams for strain amplitude of 0.4% at 0.2 Hz is shown
in Figure 14. The deviatoric stress decreases with increase
in the number of cycles. The variations of excess pore
pressure with time of the optimum mix (82.5%
Soil þ 7.5%PSC þ 10%RHA) sample have been plotted
for different frequencies and different strain amplitudes up
to 300 cycles. Typical diagrams for strain amplitude of
0.4% at 0.2Hz is shown in Figure 15. The excess pore
water pressure developed slowly and finally it reaches to
70% for 300 cycles. The variations of deviatoric stress
with mean normal effective stress of optimum mix (82.5%
Soil þ 7.5%PSC þ 10%RHA) sample have been plotted
for different frequencies and different strain amplitudes up
to 300 cycles. Typical diagrams for strain amplitude of
0.4% at 0.2 and 1Hz are shown in Figures 16 and 17. The
mean effective stress is greater on the extension side and
Figure 11. Typical stress strain diagram for optimum mix atdifferent curing periods.
Figure 12. Variation of soaked CBR with PSC for stabilizedsoil.
Figure 13. Variation of soaked CBR with curing days forstabilized soil with RHA and PSC.
A.A. Ashango and N.R. Patra912
Dow
nloa
ded
by [
Hac
ette
pe U
nive
rsity
] at
19:
31 1
9 D
ecem
ber
2014
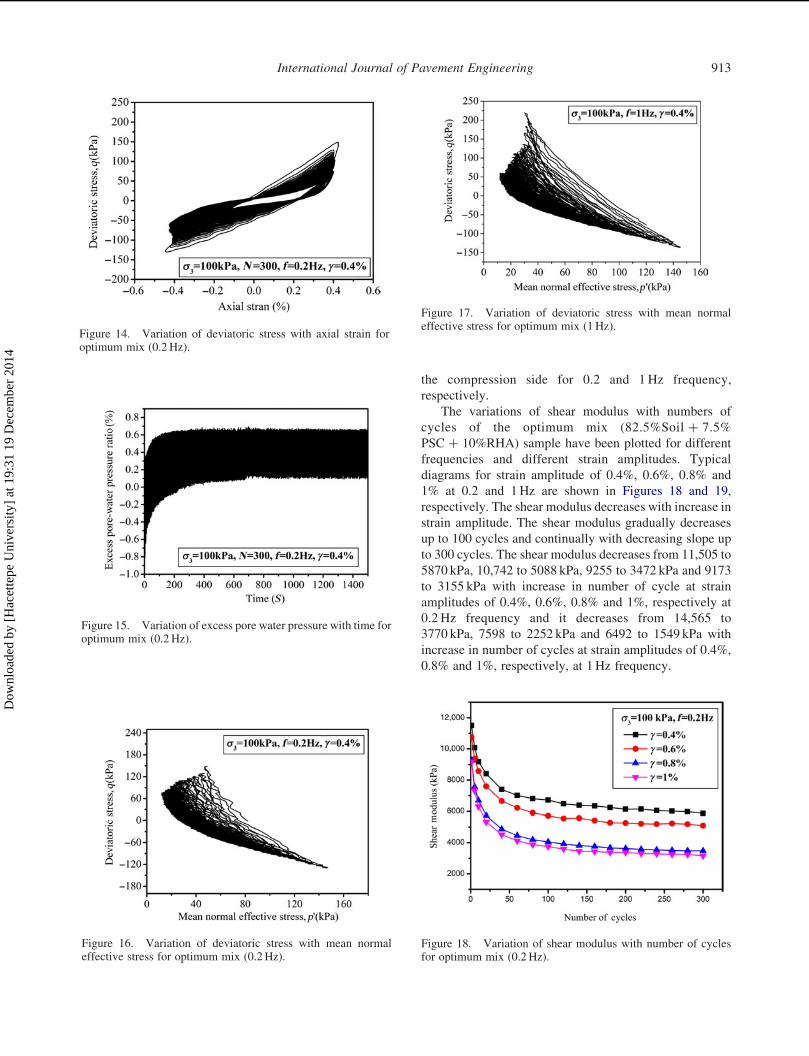
the compression side for 0.2 and 1 Hz frequency,
respectively.
The variations of shear modulus with numbers of
cycles of the optimum mix (82.5%Soil þ 7.5%
PSC þ 10%RHA) sample have been plotted for different
frequencies and different strain amplitudes. Typical
diagrams for strain amplitude of 0.4%, 0.6%, 0.8% and
1% at 0.2 and 1Hz are shown in Figures 18 and 19,
respectively. The shear modulus decreases with increase in
strain amplitude. The shear modulus gradually decreases
up to 100 cycles and continually with decreasing slope up
to 300 cycles. The shear modulus decreases from 11,505 to
5870 kPa, 10,742 to 5088 kPa, 9255 to 3472 kPa and 9173
to 3155 kPa with increase in number of cycle at strain
amplitudes of 0.4%, 0.6%, 0.8% and 1%, respectively at
0.2 Hz frequency and it decreases from 14,565 to
3770 kPa, 7598 to 2252 kPa and 6492 to 1549 kPa with
increase in number of cycles at strain amplitudes of 0.4%,
0.8% and 1%, respectively, at 1Hz frequency.
Figure 14. Variation of deviatoric stress with axial strain foroptimum mix (0.2Hz).
Figure 15. Variation of excess pore water pressure with time foroptimum mix (0.2Hz).
Figure 16. Variation of deviatoric stress with mean normaleffective stress for optimum mix (0.2Hz).
Figure 17. Variation of deviatoric stress with mean normaleffective stress for optimum mix (1Hz).
Figure 18. Variation of shear modulus with number of cyclesfor optimum mix (0.2Hz).
International Journal of Pavement Engineering 913
Dow
nloa
ded
by [
Hac
ette
pe U
nive
rsity
] at
19:
31 1
9 D
ecem
ber
2014
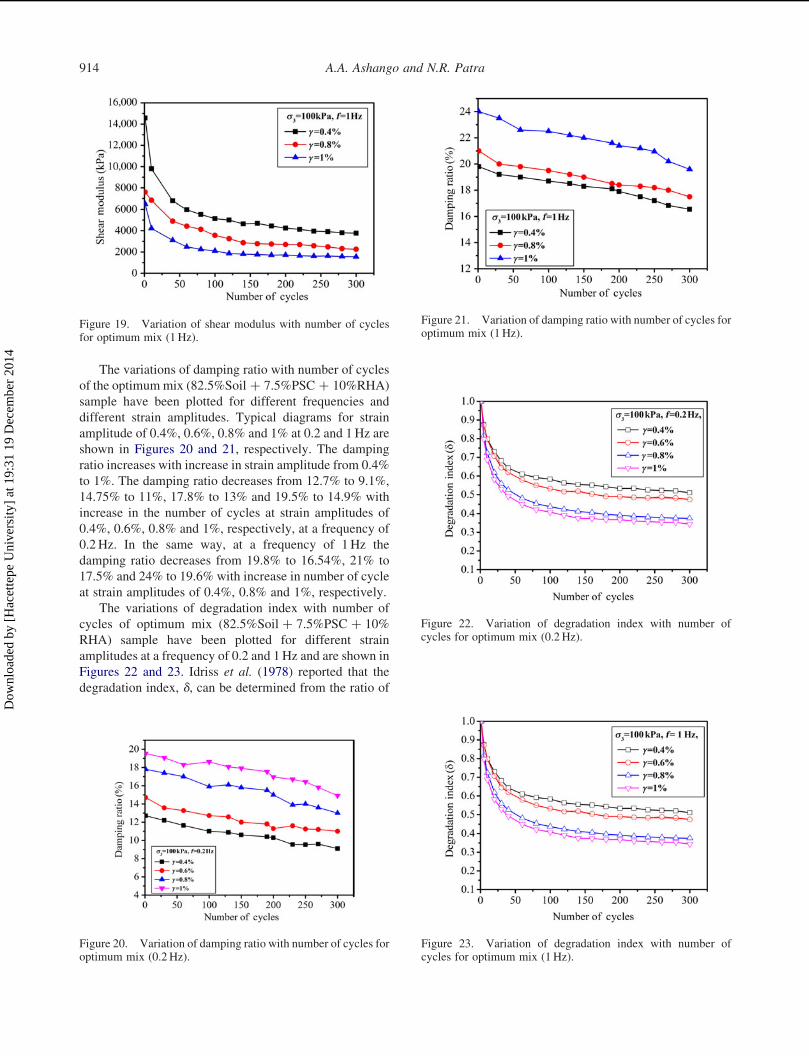
The variations of damping ratio with number of cycles
of the optimummix (82.5%Soil þ 7.5%PSC þ 10%RHA)
sample have been plotted for different frequencies and
different strain amplitudes. Typical diagrams for strain
amplitude of 0.4%, 0.6%, 0.8% and 1% at 0.2 and 1Hz are
shown in Figures 20 and 21, respectively. The damping
ratio increases with increase in strain amplitude from 0.4%
to 1%. The damping ratio decreases from 12.7% to 9.1%,
14.75% to 11%, 17.8% to 13% and 19.5% to 14.9% with
increase in the number of cycles at strain amplitudes of
0.4%, 0.6%, 0.8% and 1%, respectively, at a frequency of
0.2Hz. In the same way, at a frequency of 1Hz the
damping ratio decreases from 19.8% to 16.54%, 21% to
17.5% and 24% to 19.6% with increase in number of cycle
at strain amplitudes of 0.4%, 0.8% and 1%, respectively.
The variations of degradation index with number of
cycles of optimum mix (82.5%Soil þ 7.5%PSC þ 10%
RHA) sample have been plotted for different strain
amplitudes at a frequency of 0.2 and 1Hz and are shown in
Figures 22 and 23. Idriss et al. (1978) reported that the
degradation index, d, can be determined from the ratio of
Figure 19. Variation of shear modulus with number of cyclesfor optimum mix (1Hz).
Figure 21. Variation of damping ratio with number of cycles foroptimum mix (1Hz).
Figure 20. Variation of damping ratio with number of cycles foroptimum mix (0.2Hz).
Figure 22. Variation of degradation index with number ofcycles for optimum mix (0.2Hz).
Figure 23. Variation of degradation index with number ofcycles for optimum mix (1Hz).
A.A. Ashango and N.R. Patra914
Dow
nloa
ded
by [
Hac
ette
pe U
nive
rsity
] at
19:
31 1
9 D
ecem
ber
2014
secant modulus in the Nth cycle to secant modulus in the
first cycle.
The degradation index decreases at a fast rate for first
25–50 cycles and then it is almost constant or the decrease
is negligible. The degradation index decreases from 1% to
0.51%, 1% to 0.47%, 1% to 0.37% and 1% to 0.34% with
increase in the number of cycle at strain amplitudes of
0.4%, 0.6%, 0.8% and 1%, respectively, at a frequency of
0.2Hz. In the same way, the degradation index decreases
from 1% to 0.26%, 1% to 0.25% and 1% to 0.24% with
increase in the number of cycles at strain amplitudes of
0.4%, 0.8% and 1%, respectively, at a frequency of 1Hz.
The percentage decrease in degradation index is about
33% and 7.7% for strain amplitude varying from 0.4% to
1% at a frequency of 0.2 and 1Hz, respectively.
6. Conclusions
Based on the study, the following conclusions are drawn:
(1) The clay soil collected from new Banda, Uttar
Pradesh, India has been stabilised with RHA and
PSC. The percentage of soil, PSC and RHA that
gives the optimum mix is 82.5%, 7.5% and 10%,
respectively. The MDD decreases with increase in
PSC and RHA. However, the OMC increases with
increase in PSC and RHA in soil mixture. As a
general rule, the higher the compressive strength,
the better the quality of the stabilised material. The
compressive strength increases from 193 to
835 kN/m2 for the optimum mix and the percen-
tage increase is about 76.8%. For the optimum
mix, the increase in strength is about 29.83%,
37.2% and 48.55% for 7, 14 and 30 days of curing,
respectively. The failure strain is about 3.5%, for 0
curing day and 5% for 7, 14 and 30 curing days for
the optimum mix.
(2) The soaked CBR test results show that the CBR
value increases with increase in PSC and RHA for
the mix. About 91.75% increase in soaked CBR is
recorded for the optimum mix from virgin soil
which has 1.22% of CBR. After 12 wet–dry
cycles, the optimum mix survived and the
durability of the material is 0.91 to that of
unsoaked strength of the optimum mix.
(3) Strain-controlled cyclic triaxial tests have been
conducted to study the variation of degradation
index, d, shear modulus, G and damping ratio,
D of the optimum mix of soil with number of
cycles for different strain amplitudes of 0.4%,
0.6%, 0.8% and 1% and effective confining
pressure of 100 kPa at a frequency of 0.2 and
1Hz. The shear modulus decreases with increase
in the number of cycles and the damping ratio also
decreases with increase in the number of cycles.
The degradation index decreases at a fast rate for
first 25–50 cycles and then it is almost constant or
the decrease is negligible. The percentage
decrease in degradation index is about 33% for
strain amplitude varying from 0.4% to 1% at
0.2Hz frequency.
(4) Based on dry density, strength, durability and CBR
values, the stabilised subgrade material is suitable
for subgrade of flexible pavement.
Note
1. Email: [email protected]
References
AASHTO (2000). Standard Specifications for TransportationMaterials and Methods of Sampling and Testing, Twentiethedition, American Association of State Highway andTransportation Officials, Washington, D.C.
Ali, F.H., Adnan, A., and Choy, C.K., 1992. Geotechnicalproperties of chemically stabilised soil from Malaysia withrice husk ash as an additive. Geotechnical and GeologicalEngineering, 10, 117–134.
American Society for Testing Materials D559, 2003. Standardtest method for wetting and drying compacted soil-cementmixtures. West Conshohocken, PA: Annual book of ASTMstandards, ASTM International.
American Society for Testing Materials D2166, 2006. Standardtest method for unconfined compressive strength for cohesivesoil. West Conshohocken, PA: Annual book of ASTMstandards, ASTM International.
American Society for Testing Materials D1883, 2007. Standardtest method for CBR (California bearing ratio) of laboratory-compacted soils. West Conshohocken, PA: Annual book ofASTM standards, ASTM International.
American Society for Testing Materials D3999, 2011. Standardtest method for the determination of modulus and dampingproperties of soils using the cyclic triaxial apparatus. WestConshohocken, PA: Annual book of ASTM standards,ASTM International.
American Society for Testing Materials C618, 2012a. Standardspecification for coal fly ash and raw or calcined naturalpozzolana for use in concrete. West Conshohocken, PA:Annual book of ASTM standards, ASTM International.
American Society for Testing Materials D698, 2012b. Standardtest methods for laboratory compaction characteristics ofsoil using standard effort. West Conshohocken, PA: Annualbook of ASTM standards, ASTM International.
Ashango, A.A. and Patra, N.R., 2013. Dynamic properties ofstabilized subgrade clay soil. The 7th internationalconference on case histories in geotechnical engineering(7ICCHGE), 29 April–4 May 2013, Chicago, IL, USA.No 6.16a.
Aubert, J.E., Husson, B., and Sarramone, N., 2006. Utilization ofmunicipal solid waste incineration (MSWI) fly ash inblended cement. Part1: processing and characterizationof MSWI fly ash. Journal of Hazardous Materials, 136 (3),624–631.
International Journal of Pavement Engineering 915
Dow
nloa
ded
by [
Hac
ette
pe U
nive
rsity
] at
19:
31 1
9 D
ecem
ber
2014
Basha, E.A., et al., 2005. Stabilization of residual soil with ricehusk ash and cement. Construction and Building Materials,19 (6), 448–453.
Della, V.P., Kuhn, I., and Hotza, D., 2002. Rice husk ash as analternative source for active silica production. MaterialsLetters, 57, 818–821.
Gourley, C.S., Newill, D., and Schreiner, H.D., 1993. Expansivesoils: TRI’s research strategy. Proceedings of the 1stinternational symposium on engineering characteristics ofarid soils, London.
Hossain, K.M.A., 2011. Stabilized soils incorporating combi-nations of rice-husk ash and cement kiln dust. Journal ofMaterials in Civil Engineering, ASCE, 23 (9), 1320–1327.
Hoyos, L.R., Puppala, A.J., and Chainuwat, P., 2004. Dynamicproperties of chemically stabilized sulphate rich clay.Journal of Geotechnical and Geoenvironmental Engineer-ing, ASCE, 130 (2), 153–162.
Idriss, I.M., Dobry, R., and Singh, R.D., 1978. Nonlinearbehavior of soft clay during cyclic loading. Journal ofGeotechnical Engineering Division, 104 (12), 1427–1447.
Jiang, M., et al., 2010. Effect of cyclic loading frequency ondynamic properties of marine clay, Shanghai, China. In:GeoShangi international conference, Shanghai, China.ASCE 201, 240–245.
Kamruzzamn, A.H.M., Chew, S.H., and Lee, F.H., 2006.Microstructure of cement treated Singapore marine clay.Ground Improvement, 10 (3), 113–123.
Katti, R.K., Kulkarni, K.R., and Radhakrishnan, N., 1966.Research on black cotton soils without and with inorganicadditives. Road Research Bulletin, 10, 1–97.
Lambe, T.W., 1958. The structure of compacted clay. Journal ofSoil Mechanics and Foundation Division, ASCE, 84 (SM2),1654-1–1654-33.
Muntohar, A.S., 2006. Swelling characteristics and improvementof expansive soil with rice husk ash. London: Taylor &Francis Group, 436–451.
Rahman, M.A., 1987. Effect of cement-rice husk ash mixtures ongeotechnical properties of lateritic soil. Soil and Foundation,Japanese Geotechnical Society, 27 (2), 61–65.
Rahman, M.M., Siddique, A., and Uddin, M.K., 2010.Microstructure and chemical properties of cement treatedsoft Bangladesh clays. Soil and Foundation, JapaneseGeotechnical Society, 50 (1), 1–7.
Ramakrishna, A.N. and Pradeep, K.A.N., 2008. Effect ofmoisture content on strength behavior of BC soil-rice husk– lime mixes. Indian Highways, 36 (1), 49–58.
Rao, K.S., 2000. Swell–shrink behavior of expansive soils –geotechnical challenges. Indian Geotechnical Journal, 30(1), 1–69.
Sabat, A.K. and Nanda, R.P., 2011. Effect of marble dust onstrength and durability of rice-husk ash stabilized expansivesoil. International Journal of Civil and Structural Engineer-ing, 1 (4), 939–948.
Shafiee, A., Fafari, M.K., and Jalali, N., 2004. Cyclic behavior ofcomposite clays. 13th world conference on earthquakeengineering, Vancouver, B.B, Canada, 2004, Paper No. 462.
Stavridakis, E.I., 2005. Evaluation of engineering and cement-stabilization parameters of clayey-sand mixtures undersoaked conditions. Geotechnical and Geological Engineering,23, 633–635.
Swaminathan, R., 1976.Mineralogical changes and developmentof strength during stabilization of an expansive soil with limeand rice-husk ash. Thesis (PhD), Indian Institute ofTechnology Kanpur, India.
Thammathiwat, A. and Chim-oye, W., 2004. Behavior ofstrength and pore pressure of soft Bangkok clay under cyclicloading. Thammasat International Journal of Science andTechnology, 9 (4), 21–28.
Zhou, J. and Gong, X.N., 2001. Strain degradation of saturatedclay under cyclic loading. Canadian Geotechnical Journal,38 (2), 208–212.
A.A. Ashango and N.R. Patra916
Dow
nloa
ded
by [
Hac
ette
pe U
nive
rsity
] at
19:
31 1
9 D
ecem
ber
2014