Embed Size (px)
Citation preview
Statistical Analysis of Comparative Field Trials of Acute RodenticidesAuthor(s): L. W. HusonSource: The Journal of Hygiene, Vol. 84, No. 3 (Jun., 1980), pp. 341-346Published by: Cambridge University PressStable URL: http://www.jstor.org/stable/3862182 .
Accessed: 21/12/2014 08:17
Your use of the JSTOR archive indicates your acceptance of the Terms & Conditions of Use, available at .http://www.jstor.org/page/info/about/policies/terms.jsp
.JSTOR is a not-for-profit service that helps scholars, researchers, and students discover, use, and build upon a wide range ofcontent in a trusted digital archive. We use information technology and tools to increase productivity and facilitate new formsof scholarship. For more information about JSTOR, please contact [email protected].
.
Cambridge University Press is collaborating with JSTOR to digitize, preserve and extend access to TheJournal of Hygiene.
http://www.jstor.org
This content downloaded from 128.235.251.160 on Sun, 21 Dec 2014 08:17:02 AMAll use subject to JSTOR Terms and Conditions
J. Hyg., Camb. (1980), 84, 341 Prtnted in Great Brotain
Statistical analysis of comparative field trials of acute rodenticides
BY L. W. HUSON Ministry of Ayriculture, Fisheries and Food, Ayricultural Science Service,
Tolworth Laboratory, Hook Rise South, Tolworth, Surbiton, Surrey
(Received 10 May t 979)
SUMMARY
The present method of analysis of data from comparative field trials of acute rodenticides was compared with two alternative methods of analysis, using com- puter simulation techniques. One of the proposed alternative analyses, the use of post-treattnent census takes as a percentage of pre-trea,tment census takes in an analysis of variance, was found to be more accurate, to avoid & theoretical diffi- culty associated with the present method, and is computationally much simpler.
INTRODUCTION
Since the development of resistance to the anticoagulant rodenticide warfarin, considerable effort has been devoted to finding other compounds which will be effective in rodent control. Field trials of candida.te rodenticides are an essential part of the screening procedure and many such field trials are comparative in nature, i.e. involve the comparison of a candidate rodenticide with a standard, or the testing of a rodenticide in different bait formuIations (Rennison, 1976; Dubock & Rennison, 1977).
The methodology of rodenticide field trials is well established. If the rodenticide can be expected to give 100 °O control of an infestation, and generally does so, and if lack of complete success can generally be ascribed to bait acceptability or physiological resistance to the poison, the methods described by Drummond & Rennison (1973) and Rennison (1977) are appropriate. In the case of single dose acute poisons, field tria.ls are less straightforward because the degree of control that can be obtained varies, and is generally less than 100°O (Rennison, 1977). In these circumstances, the degree of control achieved must be estimated from the population sizes before and after treatment. To measure the effect of single- dose poison treatments, Chitty (1954) found that the maximum weight of bait eaten in a day by rodents can be used as an index of population size, and recom- mended that the relative sizes of rat infestations before and after poison baiting should be obtained by census baiting. Chitty (1954) estimated the success of the poison treatment by expressing the mean post-treatment census takes as a per- centage of the pre-treatment census takes. This procedure is now widely adopted. Rennison (1976) showed that the use of pre-bait takes is an acceptable alternative to the use of pre-treatment census takes. The recorded weights of bait takes from
0022-1724/80/0044-1979 $01.00 t Crown copyright 1980
This content downloaded from 128.235.251.160 on Sun, 21 Dec 2014 08:17:02 AMAll use subject to JSTOR Terms and Conditions
342 L_ .
. W. t LUSON
such procedures will be referred to in the present paper as the pre-treatment census takes and the post-treatment census takes.
In a typical rodenticide trial several farms are used each forming a single experimental unit, and a particular treatment replicated on several farms. After a ?re-treatment census of the population, a ra"ndornly assigned control regime is implemented, at the conclusion of which a post-treatinent census is carried out. The data collected from such trials are suitable for processing using simple tech-
* * a
mques ot anaZ ysls ot varlance. The particular feature of such analyses as presently used (Rennison, 1975, 1976;
Dubock & Rennison, 1977) is to treat the post-treatment census takes as the response variable in the analysis, and to correct for differing initial infestation sizes using the pre-treatment census takes as a covariate (referred to as method A in this paper). However, at least two variations of this analysis seem reasonable. The first (referred to as method B in this paper) is to express the post-treatment census takes as percentages of the pre-treatment census takes, and to use these as the response variable in an analysis of variance. The second (referred to as method C in this paper), it to use the difEerence between the pre- and post-treatment census takes as the response variable. In both Methods B and C pre-treatment census takes may additionally be used as a covariate, but in the case of method B it seems intuitively unlikely that covariance ana.lysis will have much efFect, since the act of taking percentages will do much to correct for differing initial infestation sizes. Transformation of the percentages in method B is considered unnecessary.
Accurate assessments of the effectiveness of rodenticides are clearly of great importance, and the accuracy of analytical methods should be as great as possible. The purpose of the present study was to compare the accuracy of the above three methods of analysis of field trial data, using computer simulation techniques.
METHODS
It is reasonable to suppose that pre-treatment census bait takes, which represent the sizes of infestations on farms, have a distribution that is adequately modelled by the Normal or Gaussian curve. Furthermore? a rodenticide that will kill a
percentage oc of a rodent population results in post-treatment census takes that bear a simple relationship to pre-treatment census takes:
post-treatment census = ( 10O )pre-treatment census + error,
where the error term represents random fluctuations in the proportion of the population killed, due to uncontrolled factors in the field. The orror term is assumed in the present paper to be a Normally distributed random variable with zero mean and standard deviation (Je.
Large infestations on farms are more difficult to bait adequately, and this results in the apparent degree of control being reduced. The exact nature of the relation- ship is unknown and will in any case vary, but in the present study this factor was accounted for by modifying the above relationship when simulated pre-
This content downloaded from 128.235.251.160 on Sun, 21 Dec 2014 08:17:02 AMAll use subject to JSTOR Terms and Conditions
Statistical analysis of rodenticide trials 343
treatment census takes were higher than 2500 g. This was done by using the term ((100-0 9 a)/100) instead of (( 100-oc)/100) in the model generating post-treatment census takes. Since in practice most infestations are not too largen this modification is not of great importance.
Using the above model, data sets were generated by computer to represent field trial data. In e&ch simulated data set, two sets of pre-tre&tment and two sets of post-treatment census data were generated, to model a field trial in which two rodenticides are being compared.
Because of the generality of simpIe analysis of variance methods the con- clusions drawn from such data are extendable to cases involving the comparison of several different treatments.
In practice, because considerable time and eSort is required to tre&t a rodent infestation efficiently, the number of replicates selected for each treatment is quite small; thus sample sizes of 5, 10 and 20 were generated in the present model.
In each of the analyses described above, the percentage of the population killed (cc) can be estimated by comparing post-treatment census takes with pre-treatment census takes (using the corrected means of the former when covariance analysis has been used). S;nce a has a known value in the model generating the data, the criterion by which the three methods of aUnalysis were compared was the accuracy with rllich this value was estimated by the analysis.
Three series of simulations were performed totalling 180 data sets in all. The Normally distributed random variables specified in the model (i.e. the pre- treatment census takes and the error term) were generated using the method of Box & Muller (1958).
RESULTS AND DISCUSSION
Ftrst series of simulatzons Eighty-four simulations were performed using a wide range of parameter values
in the model. The mean of the pre-treatment census distribution varied between 1000 g and 2500 g, with standard deviations of 250 g and 500 g. The error standard deviation was specified as 250, 200, 100 and 50 g in successive simulations, and in a11 c&ses the difference in oc values of the two simulated treatments was 10 °O.
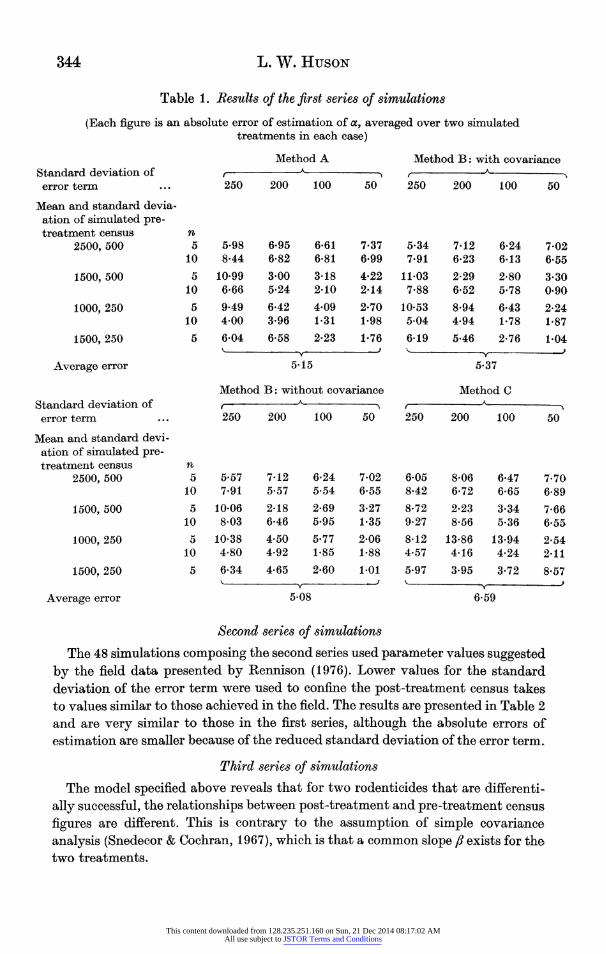
The results of these simulations are presented in Table 1. Each figure is an abso- lute error of estimation of oc averaged for the two simulated treatments in each case.
The relative accuracy of the methods is more important than the absolute accuracy in the present context, since the latter is very dependent on the para- meter values used in the model.
All methods showed broadly similar accuracy overallS Method B without co- variance correction being the most accurate, and WIethod C the least accurate. The use of pre-treatment census takes as a covariate in Method B resulted in no improvement in accuracy, the errors of estimation, in fact, were slightly greater.
This content downloaded from 128.235.251.160 on Sun, 21 Dec 2014 08:17:02 AMAll use subject to JSTOR Terms and Conditions
Method A r A 250 200 100 50
250 200 100 50
344 L. W. HUSON
Table 1. Res?lts of the first series of simulatzons
(Each Sgure is an absolute error of estimation of > averaged over two simulated treatments in each case)
Method B: with covariance A
f A
250 200 100 50 Standard deviation of error term ...
Mean and standard devia- ation of simulated pre- treatment census
2500, 500
1500, 500
tO00} 260
1500> 250
Average error
n 5 5 98 6>95 6*61 7*37 5-34 7^12 6 24 7*02
10 8*44 682 6*81 6@99 7@91 6*23 6 13 6*55
5 10*99 3e00 3*18 4-22 11*03 2 29 2*80 3*30 10 6-66 5B24 2BI0 2-14 7*88 6-52 b*78 Ow90
5 9-49 6$42 4-09 2*70 10@53 8*94 6*43 2*24 1 0 4-00 3*96 1*31 1*98 5-04 4*94 1*78 1-87
5 6*04 6*58 2*23 1 76 6*19 5146 2*76 1X04 t _8r- J t _ J
5J15 5*37
Method iE3: without covariance Method C , +
250 200 100 50 Standard deviation of error term ...
Mean and standard devi- ation of simulated pre- treatment cerLsus
2500, 500
1500, 500
1000 250
1500, 250
Average error
n 5 5vS7 7¢ 12 6-24 7¢02 6¢05 8*06 6*47 7-76
10 7*91 5*57 5*54 6*55 8*42 6*72 6*65 6*89 5 10-06 2 18 2*69 3*27 8*72 2*23 3*34 7*66
10 8*03 6 4B 5 95 t35 9*27 8*56 5*36 6s55 5 10t38 4 50 5t77 2*06 8+12 13+86 13*94 2*54
10 4*80 4*92 1 85 1-88 4*57 4*16 4*24 2*11 5 6*34 465 2*60 1 01 5*97 3*95 3*72 8-57
t J t )
5*08 6*59
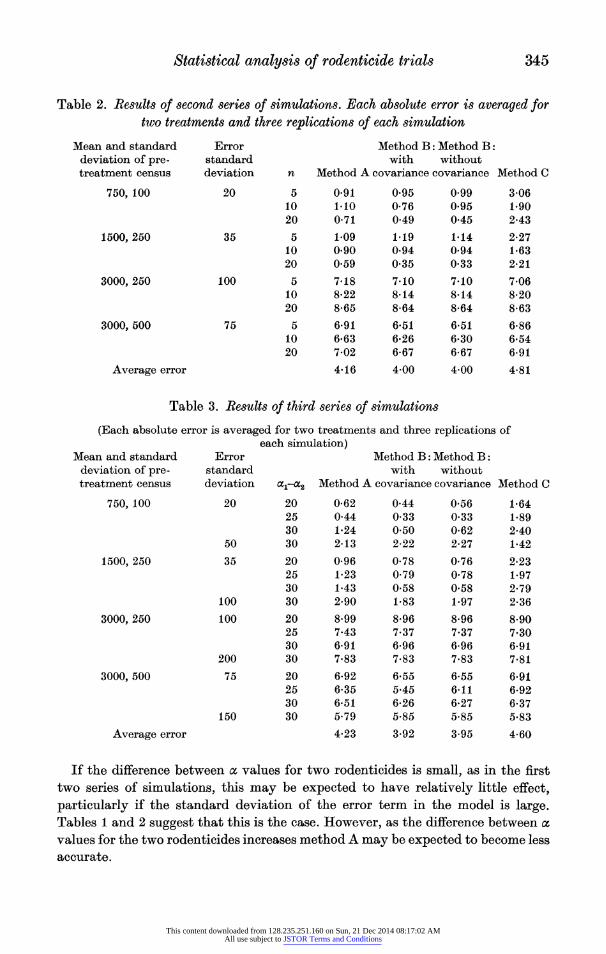
Second series of smutations The 48 simulations composing the second series used parameter values suggested
by the field data presented by Rennison (1976). Lower values for the standard denation of the error term were used to confine the post-treatment census takes to values simil&r to those achieved in the field. The results are presented in Table 2 and are very similar to those in the first series although the absolute errors of estimation are smaller because of the reduced standard deviation of the error term
Third sertes of ssmulattons The model spec;fied above reveals that for two rodenticides that are different;-
ally successful, the relationships between post-treatment and pre-treatment census figures are different. This is contrary to the assumption of simple covariance analysis (Snedecor & Cothran, 1967), which is that a common slope ,B exists for the two treatments.
This content downloaded from 128.235.251.160 on Sun, 21 Dec 2014 08:17:02 AMAll use subject to JSTOR Terms and Conditions
Statistical analysis of rodenticide trials 345
Table 2. Results of second series of simulations. Each absolute error is averaged for two treatments and three replications of each simulation
Mean and standard Error deviation of pre- standard treatment census deviation
Method B: Method B: with without
n Method Acovariance covariance Method C
750, 100
1500, 250
3000, 250
3000, 500
20
35
100
75
5 0-91 0195 0-99 10 1*10 0-76 0-95 20 0*71 0*49 0*45
5 1*09 1*19 1*14 10 0*90 0*94 0*94 20 0v59 0*35 0@33
5 7*18 7*10 7*10 10 8t22 8t14 8*14 20 8*65 8-64 8*64
5 6*91 6@51 6@51 10 6*63 6@26 6@30 20 7*02 6*67 6-67
4*16 4-00 4-00
3*06 1v90 2*43
2@27 1 63 2@21
7@06 8@20 8*63
6*86 6*54 6-91
4481 Average error
Table 3. Results of third series of sim?lations
(Each absolute error is averaged for two treatments and three replications of each simulation)
Mean and standard Error deviation of pre- standard treatment census deviation
750, 100 20
50
1500, 250 35
Method B: AIethod B: with without
1-°C2 MethodA covariancecovariance Method C
20 0-62 0 44 0-56 1@64 25 0 44 0 33 0 33 1@89 30 1@24 0 50 0*62 2-40 30 2-13 2-22 2-27 1-42
20 0-96 0-78 0*76 2*23 25 1s23 079 0-78 1*97 30 1-43 0-58 0*58 2-79 30 2e90 1@83 1@97 2-36
20 8*99 8@96 8@96 8*90 25 7*43 7*37 7v37 7 30 30 6*91 6v96 6-96 6-91 30 7*83 7*83 7v83 7v81
20 6-92 6v55 6-55 6v91 25 6t35 5t45 6- 11 6t92 30 6-51 6-26 6-27 6*37 30 5*79 5v85 5-85 5v83
4v23 3*92 3-95 4-60
100
too
200
75
3000, 250
3000, 500
150
Average error
If the difference between oc values for two rodenticides is small, as in the first two series of simulations, this may be expected to have relatively little effect, particularly if the staJndard deviation of the error term in the model is large. Tables 1 and 2 suggest that this is the case. However, as the difference between oc values for the two rodenticides increases method A may be expected to become less accurate.
This content downloaded from 128.235.251.160 on Sun, 21 Dec 2014 08:17:02 AMAll use subject to JSTOR Terms and Conditions
346 L. W. HUSON
The 48 simulations in the third series used a values differing by 20 °O 25 °OX and 3Q °/O in different simulations. The results are presented in Table 3. Particularly for lower pre-treatment census valuesn Method A in f&ct decreased in accuracy com- pared with Method B. The overall pattern of results remains the same) with Method B proving to be the most accurate methodn and improving little when covariance analysis was employed.
CONCLUSIONS
The method currently used for the analysis of comparative rodenticide field trial data does not satisfy the assumptions of covariance theory if the above model is correct. Th;s does not seem to be important when the diiVerence between control rates for rodenticides is sm&ll but results in less accurate estimations of control rates for greater differences in aG vswlues.
Method B described in this paper a ?pears to be generally more accuratel avoids the problems of theory associated with method A when used without a covariance correction, and is computationally much simpler. (;iven a Normal distribution of pre-treatment census bait takes, Method B will provide efficient estimates and multiple comparisons of rodenticide control rate3, although it should be noted that under the above modeln for widely diSering z values variances will not be hetero- geneous.
It is concluded that a swtable method of analysis of field tri&l data of the type described in this paper is to use the post-treatment census takes, expressed as percentages of the pre-treatment census takesS as a response variable in analysis of variance calculations. This method does not seem to have any bias (in the statistical sense), judging from the results of the model used, and it is not con- sidared necessary to transform the percentage values, since not enough is known of the form of the distribution of real data to suppose that a transformation is necessary ln practlce.
REFERENCES
BOX, G. E. P. & MULLER, M. E. (1958). A note on the generation of Random Nortnal Deviates. Annals of Mathematical SStistses 24, 610.
DUBOCE, A. C. & RENNISON, B. D. (1977). Field eraluation of baits for poison treatments against Norway rats. Proceedinys of the Brittsh Grop Protectton Conference (1977) - Pests and Diseases.
CHITTY D. (1954). Chapter 4 m D. CHITTY & II. N. SOUTHERN. Control of Rats and SIice. 3 vols. Oxford: Clarendon Press.
DRUMMOND D. C. & RENNISON, B. D. (1973). The detection of rodent resistance to anti coagulants. B7l11etin of the World Health Oryanizatzon 48, 239-42.
RENNISON, B. :1:). (1975). An example of the use of analysis of covariance for evaluating the results of field trials of rodenticides. In: Guidelines for the Development and Biological eraluation of Rodenticides. E.P.P.O. BuMettn 5 (1), 37-49.
RENNISON, B. D. [197B). A comparative field trial, conductad without pre-treatment census baiting, of the rodenticides sinc phosphide, thallium sulphate? and gophacide, against Rsbttus norvegicus. Journal of Hygtene 77, 55-62.
RENNISON, BRIAN D. ( 1977). Methods of testing rodenticides in the field against rats. Pesttctde Science 8, 405-13.
SNEDECOR, G. W. & COCHRANA W. G. (1967). Statisttcal Method;s, 6th ed Atnes, Iowa: Iowa State University Press.
This content downloaded from 128.235.251.160 on Sun, 21 Dec 2014 08:17:02 AMAll use subject to JSTOR Terms and Conditions