Embed Size (px)
Citation preview

Statistics
Course Redesigns at NCSU
Roger Woodard
Statistics
Two course redesigns
• Ohio State– Under original N.C.A.T model.– Funded through Pew grant.– Buffet approach
• NCSU– Under the radar– No special funding

Statistics
A question for you.
Statistics
Statistics
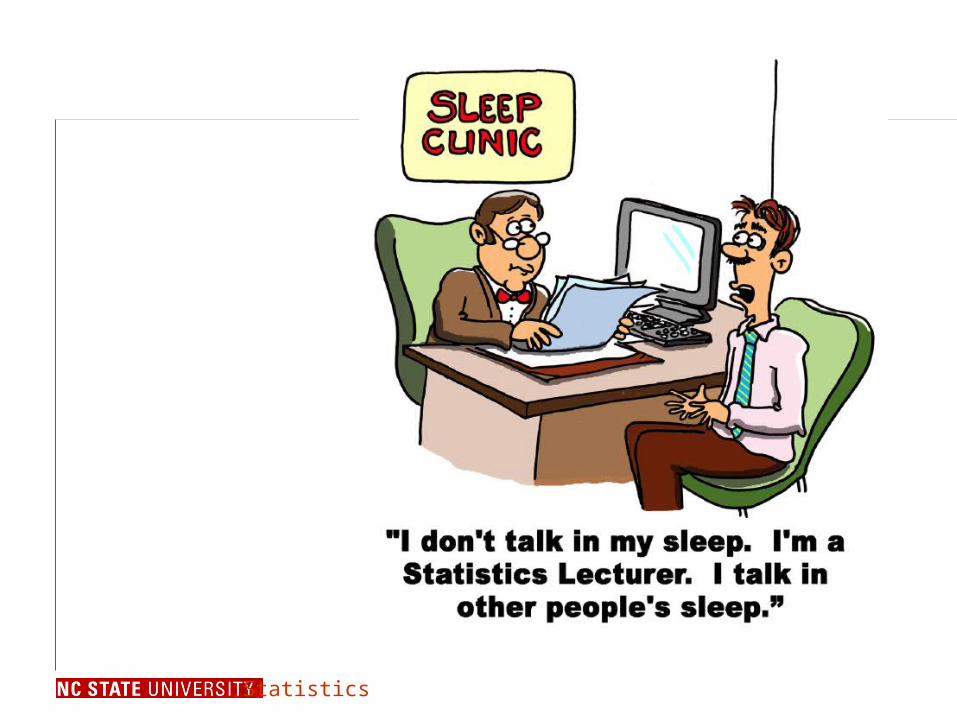
ST311
• Introductory Statistics– 700 students per semester– Majors from social and biological sciences– Not for business or engineering
• Sections– Taught by graduate students– 10 to 12 per semester– 65 students per section
Statistics
Previous structure
• No formal training– Mentored by course coordinator in informal way
• Common text but syllabus only loosely coordinated– Time on topics varied greatly
Statistics
Problems
• Instructors did not know what to emphasize– Concepts of the material not clear.– Amount of content varied greatly.
• Amount of work varied greatly– Students– Instructors
• Grade distributions varied
• Complaints were heavy
Statistics
Redesign
• Goals– Improve consistency of the course grading and
experience.– Improve the experience of graduate instructors
teaching the course.
Statistics
Improved Experience
• Reduce the amount of time graduate instructors spend on teaching the course, especially those elements that are primarily administrative.
• Provide a support network to deal with teaching and administrative issues.
Statistics
Learning Experience
• Teaching should be a learning experience– Graduate students should be equipped to teach
their own class – Substantial experience teaching the course
• Time commitment should not be excessive– Keep workload comparable to other assignments– Instructors concentrate on the big issues of how to
teach the material
Statistics
Learning Experience
• Instructors should make their own lectures– Not just teach from preset notes or slides– Let them think more deeply about the material– Let them find the way to present the material that
works best for them.
• Instructors make up their own midterm exams– Get the experience of making exams
Statistics
Minimize Time for Grad Instructors
• Remove mundane tasks that take a lot of time
• Homework– Common across sections with same due dates– WebAssign, online homework system:
Automatically graded, immediate feedback– Well tested
• Coordinated administrative paperwork– Equalize size of sections: coordinated add/drop– Coordinate completion of incompletes
Statistics
Minimize Time for Grad Instructors
• Common makeup exams– Reduction of instructor time– Online form
• Common final exam– Reduce time during final exams– Uniform grading

Statistics
How do we know what to teach?
• “What should I teach about _____?”
• “How do I know what is going to be on the final?”
Statistics
Key components
• Detailed learning objectives– Over 100 task level items– Spell out exact content for instructors and students.
• Faculty to faculty communication
Statistics
Key components
• Coordinated office hours– 35 hours per week: maximum service for students– Each instructor and grader does only 3 hours
• Detailed Study guides for students– Based on learning objectives– Readings, activities, practice problems
Statistics
Training Program
• Initial workshop– Two days prior to the beginning of the semester– Intensive training– Presentation skills– Course/classroom technology– Overview of the course content– Administrative issues (FERPA, ADA, etc)
Statistics
Ongoing training
• Weekly meetings– Administrative issues (upcoming events,
clarification of policies, etc).– Just-in-time discussion of upcoming topics– Content, activities, data sets
• Observation– Videotaped observation– Self reflection
Statistics
Results
• Overall improvement in evaluations– Still varies based on instructor talent
• Defendable grade distributions– Fair!
• Self reported time on task– Comparable but still varied based on instructor
Statistics
Advice
• Address the big problems
• Take small steps
• Communicate – with the team– with the students
Statistics
Statistics
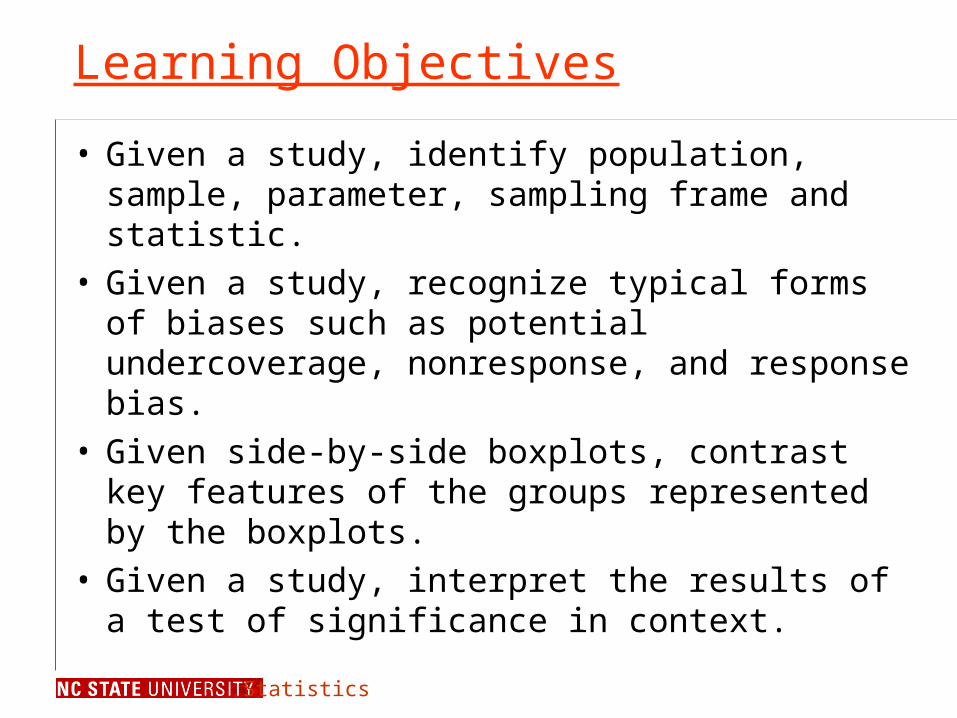
Learning Objectives
• Given a study, identify population, sample, parameter, sampling frame and statistic.
• Given a study, recognize typical forms of biases such as potential undercoverage, nonresponse, and response bias.
• Given side-by-side boxplots, contrast key features of the groups represented by the boxplots.
• Given a study, interpret the results of a test of significance in context.