Embed Size (px)
Citation preview
2-1
Copyright © 2013 Pearson Education, Inc. publishing as Prentice Hall
Statistics, Data Analysis, and Decision Modeling, 5e (Evans)
Chapter 2 Descriptive Statistics and Data Analysis
1) ________ refers to a collection of quantitative measures and ways of describing data.
A) Statistical inference
B) Descriptive statistics
C) Frequency distribution
D) Categorical data
Answer: B
Diff: 1
Blooms: Remember
Topic: Descriptive Statistics for Categorical Data
Learning Outcome: Compare and contrast methods of summarizing and describing data
2) All of the following are examples of measures of central tendency except ________.
A) mean
B) median
C) standard deviation
D) mode
Answer: C
Diff: 1
Blooms: Remember
Topic: Descriptive Statistics
Learning Outcome: Compare and contrast methods of summarizing and describing data
3) All of the following are examples of measures of dispersion except ________.
A) range
B) variance
C) standard deviation
D) mode
Answer: D
Diff: 1
Blooms: Remember
Topic: Descriptive Statistics
Learning Outcome: Compare and contrast methods of summarizing and describing data
4) In Microsoft Excel 2010, the function that computes the standard deviation of a set of data,
assumed to be a sample, is ________.
A) STDEV.P(data range)
B) MODE.SNGL(data range)
C) STAND.MULT(data range)
D) STDEV.S(data range)
Answer: D
Diff: 1
Blooms: Remember
Topic: Descriptive Statistics
Learning Outcome: Compare and contrast methods of summarizing and describing data
2-2
Copyright © 2013 Pearson Education, Inc. publishing as Prentice Hall
5) In Microsoft Excel 2010, the function that computes the standard deviation of a set of data,
assumed to be a population, is ________.
A) STDEV.S(data range)
B) STAND.SNGL(data range)
C) STDEV.P(data range)
D) STAND.MULT(data range)
Answer: C
Diff: 1
Blooms: Remember
Topic: Descriptive Statistics
Learning Outcome: Compare and contrast methods of summarizing and describing data
6) In Microsoft Excel 2010, the function that computes the single most frequently occurring
value in a set of data is ________.
A) MEDIAN(data range)
B) MODE.SNGL(data range)
C) STDEV.P(data range)
D) SKEW(data range)
Answer: B
Diff: 1
Blooms: Remember
Topic: Descriptive Statistics
Learning Outcome: Compare and contrast methods of summarizing and describing data
7) Using Microsoft Excel 2010, the function that computes the most frequently occurring values
of a set of data is ________.
A) MODE.SNGL(data range)
B) MEDIAN(data range)
C) STDEV.P(data range)
D) MODE.MULT(data range)
Answer: D
Diff: 1
Blooms: Remember
Topic: Descriptive Statistics
Learning Outcome: Compare and contrast methods of summarizing and describing data
8) A table that shows the number of observations in each of several nonoverlapping groups is
called a ________.
A) frequency distribution
B) scatter plot
C) histogram
D) chart
Answer: A
Diff: 1
Blooms: Remember
Topic: Frequency Distributions, Histograms, and Data Profiles
Learning Outcome: Compare and contrast methods of summarizing and describing data
2-3
Copyright © 2013 Pearson Education, Inc. publishing as Prentice Hall
9) The sum of relative frequencies will always equal ________.
A) 100
B) 1.0
C) 10
D) 0.01
Answer: B
Diff: 1
Blooms: Remember
Topic: Frequency Distributions, Histograms, and Data Profiles
Learning Outcome: Compare and contrast methods of summarizing and describing data
10) A graphical depiction of a frequency distribution for numerical data in the form of a column
chart is called a ________.
A) scatter plot
B) box-and-whisker plot
C) pie chart
D) histogram
Answer: D
Diff: 1
Blooms: Remember
Topic: Frequency Distributions, Histograms, and Data Profiles
Learning Outcome: Compare and contrast methods of summarizing and describing data
11) The proportion of the total sample that falls at or below the upper limit value is represented
by ________.
A) dispersion
B) cumulative relative frequency
C) median
D) standard deviation
Answer: B
Diff: 1
Blooms: Remember
Topic: Frequency Distributions, Histograms, and Data Profiles
Learning Outcome: Compare and contrast methods of summarizing and describing data
12) The ________ is a value at or below which at least k percent of the observations lie.
A) kth percentile
B) kth ratio
C) kth quartile
D) kth mean
Answer: A
Diff: 1
Blooms: Remember
Topic: Frequency Distributions, Histograms, and Data Profiles
Learning Outcome: Compare and contrast methods of summarizing and describing data
2-4
Copyright © 2013 Pearson Education, Inc. publishing as Prentice Hall
13) The formula to calculate kth percentile is given by ________.
A) 100/Nk + 0.05
B) 100/Nk - 0.05
C) Nk/100 + 0.05
D) Nk/100 - 0.05
Answer: C
Diff: 1
Blooms: Remember
Topic: Frequency Distributions, Histograms, and Data Profiles
Learning Outcome: Compare and contrast methods of summarizing and describing data
14) ________ is the quartile representing the 25th percentile.
A) Q1
B) Q2
C) Q3
D) Q4
Answer: A
Diff: 1
Blooms: Remember
Topic: Frequency Distributions, Histograms, and Data Profiles
Learning Outcome: Compare and contrast methods of summarizing and describing data
15) ________ is the quartile representing the 50th percentile.
A) Q1
B) Q2
C) Q3
D) Q4
Answer: B
Diff: 1
Blooms: Remember
Topic: Frequency Distributions, Histograms, and Data Profiles
Learning Outcome: Compare and contrast methods of summarizing and describing data
16) ________ is the quartile representing the 75th percentile.
A) Q1
B) Q2
C) Q3
D) Q4
Answer: C
Diff: 1
Blooms: Remember
Topic: Frequency Distributions, Histograms, and Data Profiles
Learning Outcome: Compare and contrast methods of summarizing and describing data
2-5
Copyright © 2013 Pearson Education, Inc. publishing as Prentice Hall
17) ________ is the quartile representing the 100th percentile.
A) Q1
B) Q2
C) Q3
D) Q4
Answer: D
Diff: 1
Blooms: Remember
Topic: Frequency Distributions, Histograms, and Data Profiles
Learning Outcome: Compare and contrast methods of summarizing and describing data
18) One-fourth of the data falls below the ________ quartile.
A) fourth
B) second
C) first
D) third
Answer: C
Diff: 1
Blooms: Remember
Topic: Frequency Distributions, Histograms, and Data Profiles
Learning Outcome: Compare and contrast methods of summarizing and describing data
19) Three-fourths of the data fall below the ________ quartile.
A) fourth
B) second
C) first
D) third
Answer: D
Diff: 1
Blooms: Remember
Topic: Frequency Distributions, Histograms, and Data Profiles
Learning Outcome: Compare and contrast methods of summarizing and describing data
20) The ________ is the sum of all observations divided by the number of observations.
A) arithmetic mean
B) median
C) mode
D) midrange
Answer: A
Diff: 1
Blooms: Remember
Topic: Descriptive Statistics for Numerical Data
Learning Outcome: Compare and contrast methods of summarizing and describing data
2-6
Copyright © 2013 Pearson Education, Inc. publishing as Prentice Hall
21) The ________ is the middle value when the data are arranged from smallest to largest.
A) mode
B) median
C) midrange
D) arithmetic mean
Answer: B
Diff: 1
Blooms: Remember
Topic: Descriptive Statistics for Numerical Data
Learning Outcome: Compare and contrast methods of summarizing and describing data
22) The ________ is the observation that occurs the most frequently in the data set.
A) arithmetic mean
B) median
C) mode
D) midrange
Answer: C
Diff: 1
Blooms: Remember
Topic: Descriptive Statistics for Numerical Data
Learning Outcome: Compare and contrast methods of summarizing and describing data
23) The ________ is the average of the largest and smallest values in the data set.
A) arithmetic mean
B) median
C) mode
D) midrange
Answer: D
Diff: 1
Blooms: Remember
Topic: Descriptive Statistics for Numerical Data
Learning Outcome: Compare and contrast methods of summarizing and describing data
24) An observation that is radically different from the rest is called ________.
A) the median
B) the mean
C) an outlier
D) the mode
Answer: C
Diff: 1
Blooms: Remember
Topic: Descriptive Statistics for Numerical Data
Learning Outcome: Compare and contrast methods of summarizing and describing data
2-7
Copyright © 2013 Pearson Education, Inc. publishing as Prentice Hall
25) The population mean is represented by ________.
A) α
B) μ
C) λ
D) π
Answer: B
Diff: 1
Blooms: Remember
Topic: Descriptive Statistics for Numerical Data
Learning Outcome: Compare and contrast methods of summarizing and describing data
26) The sample mean is represented by ________.
A) x
B) α
C) μ
D) η
Answer: A
Diff: 1
Blooms: Remember
Topic: Descriptive Statistics for Numerical Data
Learning Outcome: Compare and contrast methods of summarizing and describing data
27) The midrange for a data set containing all the values between 50 and 67 is ________.
A) 67
B) 58.5
C) 50
D) -17
Answer: B
Diff: 2
Blooms: Apply
AACSB: Analytic Skills
Topic: Descriptive Statistics for Numerical Data
Learning Outcome: Compare and contrast methods of summarizing and describing data
28) The degree of variation in or the numerical spread of the data is known as ________.
A) quartile
B) median
C) dispersion
D) mean
Answer: C
Diff: 1
Blooms: Remember
Topic: Descriptive Statistics for Numerical Data
Learning Outcome: Compare and contrast methods of summarizing and describing data
2-8
Copyright © 2013 Pearson Education, Inc. publishing as Prentice Hall
29) Which of the following can be used to represent dispersion in a data set?
A) proportion
B) range
C) mode
D) median
Answer: B
Diff: 1
Blooms: Remember
Topic: Descriptive Statistics for Numerical Data
Learning Outcome: Compare and contrast methods of summarizing and describing data
30) Which of the following provides an estimate that represents "centering" of the entire set of
data?
A) range
B) variance
C) midrange
D) standard deviation
Answer: C
Diff: 1
Blooms: Remember
Topic: Descriptive Statistics for Numerical Data
Learning Outcome: Compare and contrast methods of summarizing and describing data
31) Computing the difference between the maximum value and the minimum value gives the
________ of the data set.
A) variance
B) standard deviation
C) range
D) median
Answer: C
Diff: 1
Blooms: Remember
Topic: Descriptive Statistics for Numerical Data
Learning Outcome: Compare and contrast methods of summarizing and describing data
32) The range of the middle 50% of the data is called the ________.
A) midrange
B) interquartile range
C) variance
D) mode
Answer: B
Diff: 1
Blooms: Remember
Topic: Descriptive Statistics for Numerical Data
Learning Outcome: Compare and contrast methods of summarizing and describing data
2-9
Copyright © 2013 Pearson Education, Inc. publishing as Prentice Hall
33) The sample variance is denoted as ________.
A) s2
B) v2
C) σ2
D) α2
Answer: A
Diff: 1
Blooms: Remember
Topic: Descriptive Statistics for Numerical Data
Learning Outcome: Compare and contrast methods of summarizing and describing data
34) The population variance is denoted as ________.
A) s2
B) v2
C) σ2
D) α2
Answer: C
Diff: 1
Blooms: Remember
Topic: Descriptive Statistics for Numerical Data
Learning Outcome: Compare and contrast methods of summarizing and describing data
35) The square root of the variance is called the ________.
A) mean
B) standard deviation
C) median
D) interquartile range
Answer: B
Diff: 1
Blooms: Remember
Topic: Descriptive Statistics for Numerical Data
Learning Outcome: Compare and contrast methods of summarizing and describing data
36) The standard deviation for the population is denoted as ________.
A) μ
B) Ω
C) s
D) σ
Answer: D
Diff: 1
Blooms: Remember
Topic: Descriptive Statistics for Numerical Data
Learning Outcome: Compare and contrast methods of summarizing and describing data
2-10
Copyright © 2013 Pearson Education, Inc. publishing as Prentice Hall
37) The standard deviation for a sample is denoted as ________.
A) μ
B) Ω
C) s
D) σ
Answer: C
Diff: 1
Blooms: Remember
Topic: Descriptive Statistics for Numerical Data
Learning Outcome: Compare and contrast methods of summarizing and describing data
38) Which of the following state(s) that for any set of data, the proportion of values that lie
within k standard deviations (k>1) of the mean is at least 1 - 1/k2?
A) empirical rules
B) interquartile range
C) Chebyshev's theorem
D) standard deviation
Answer: C
Diff: 1
Blooms: Remember
Topic: Descriptive Statistics for Numerical Data
Learning Outcome: Compare and contrast methods of summarizing and describing data
39) Using Chebyshev's theorem, k = 2 would mean that ________.
A) at least two-thirds of the data lie within two standard deviations of the mean
B) at least 89% of the data lie within two standard deviations of the mean
C) less than three-fourths of the data lie within three standard deviations of the mean
D) at least three-fourths of the data lie within two standard deviations of the mean
Answer: D
Diff: 1
Blooms: Understand
Topic: Descriptive Statistics for Numerical Data
Learning Outcome: Compare and contrast methods of summarizing and describing data
40) Using Chebyshev's theorem, k = 3 means that ________.
A) at least two-thirds of the data lie within three standard deviations of the mean
B) at least 89% of the data lie within three standard deviations of the mean
C) less than 29% of the data lie within three standard deviations of the mean
D) at least three-fourths of the data lie within two standard deviations of the mean
Answer: B
Diff: 1
Blooms: Understand
Topic: Descriptive Statistics for Numerical Data
Learning Outcome: Compare and contrast methods of summarizing and describing data
2-11
Copyright © 2013 Pearson Education, Inc. publishing as Prentice Hall
41) Which of the following is included in the empirical rules?
A) Approximately 59% of the observations will fall within two standard deviations of the mean,
or within x ± 2s.
B) Approximately 68% of the observations will fall within one standard deviation of the mean,
or between x - s and x + s.
C) Approximately 89% of the observations will fall within three standard deviations of the mean,
or within x ± 3s.
D) Approximately 28% of the observations will fall within three standard deviations of the mean,
or within x ± 3s.
Answer: B
Diff: 1
Blooms: Remember
Topic: Descriptive Statistics for Numerical Data
Learning Outcome: Compare and contrast methods of summarizing and describing data
42) According to the empirical rules, approximately 99.7% of the observations will fall within
________.
A) one standard deviation of the mean
B) two standard deviations of the mean
C) three standard deviations of the mean
D) four standard deviations of the mean
Answer: C
Diff: 1
Blooms: Remember
Topic: Descriptive Statistics for Numerical Data
Learning Outcome: Compare and contrast methods of summarizing and describing data
43) According to the empirical rules, approximately 95% of the observations will fall within
________.
A) one standard deviation of the mean
B) two standard deviations of the mean
C) three standard deviations of the mean
D) four standard deviations of the mean
Answer: B
Diff: 1
Blooms: Remember
Topic: Descriptive Statistics for Numerical Data
Learning Outcome: Compare and contrast methods of summarizing and describing data
2-12
Copyright © 2013 Pearson Education, Inc. publishing as Prentice Hall
44) The ________ is used to compare the variability of two or more data sets with different
scales.
A) coefficient of variation
B) variance
C) median
D) coefficient of skewness
Answer: A
Diff: 1
Blooms: Remember
Topic: Descriptive Statistics for Numerical Data
Learning Outcome: Compare and contrast methods of summarizing and describing data
45) The coefficient of variation (CV) is calculated as ________.
A) mode/standard deviation
B) standard deviation/mean
C) standard deviation/variance
D) range/standard deviation
Answer: B
Diff: 1
Blooms: Remember
Topic: Descriptive Statistics for Numerical Data
Learning Outcome: Compare and contrast methods of summarizing and describing data
46) Given that the standard deviation is equal to 0.568, the median equals 5, and the mean value
is 3.5, what is the value of the coefficient of variation?
A) 0.1136
B) 0.162
C) 6.16
D) 0.7
Answer: B
Diff: 2
Blooms: Apply
AACSB: Analytic Skills
Topic: Descriptive Statistics for Numerical Data
Learning Outcome: Compare and contrast methods of summarizing and describing data
47) When more of the mass of the data is concentrated on one side and the distribution of values
tails off to the other side, the histogram is said to be ________.
A) symmetric
B) skewed
C) curved
D) positively sloped
Answer: B
Diff: 1
Blooms: Remember
Topic: Descriptive Statistics for Numerical Data
Learning Outcome: Compare and contrast methods of summarizing and describing data
2-13
Copyright © 2013 Pearson Education, Inc. publishing as Prentice Hall
48) When a histogram is positively skewed, it ________.
A) tails off to the right
B) is symmetrical
C) tails off to the left
D) has a slope greater than one
Answer: A
Diff: 1
Blooms: Remember
Topic: Descriptive Statistics for Numerical Data
Learning Outcome: Compare and contrast methods of summarizing and describing data
49) When a histogram is negatively skewed, it ________.
A) is symmetrical
B) tails off to the left
C) has a slope lesser than one
D) tails off to the right
Answer: B
Diff: 1
Blooms: Remember
Topic: Descriptive Statistics for Numerical Data
Learning Outcome: Compare and contrast methods of summarizing and describing data
50) The degree of asymmetry of observations around the mean is measured by the ________.
A) coefficient of correlation
B) coefficient of symmetry
C) coefficient of skewness
D) coefficient of deviation
Answer: C
Diff: 1
Blooms: Remember
Topic: Descriptive Statistics for Numerical Data
Learning Outcome: Compare and contrast methods of summarizing and describing data
51) Which of the following coefficients of skewness values has the lowest degree of skewness?
A) 1
B) 1.1
C) 0.5
D) 0.05
Answer: D
Diff: 1
Blooms: Understand
Topic: Descriptive Statistics for Numerical Data
Learning Outcome: Compare and contrast methods of summarizing and describing data
2-14
Copyright © 2013 Pearson Education, Inc. publishing as Prentice Hall
52) A coefficient of skewness that indicates relative symmetry would lie between ________.
A) 0.5 and -0.5
B) 5 and -5
C) 1 and -1
D) 0.95 and 1
Answer: A
Diff: 1
Blooms: Remember
Topic: Descriptive Statistics for Numerical Data
Learning Outcome: Compare and contrast methods of summarizing and describing data
53) A coefficient of skewness that indicates moderate skewness would lie between ________.
A) 1 and 2
B) 0.5 and 1
C) 0 and 1
D) 0.5 and -0.5
Answer: B
Diff: 1
Blooms: Remember
Topic: Descriptive Statistics for Numerical Data
Learning Outcome: Compare and contrast methods of summarizing and describing data
54) A histogram with only one peak ________.
A) does not have a mode value
B) is unimodal
C) is bimodal
D) has a high degree of kurtosis
Answer: B
Diff: 1
Blooms: Remember
Topic: Descriptive Statistics for Numerical Data
Learning Outcome: Compare and contrast methods of summarizing and describing data
55) A histogram with exactly two peaks ________.
A) is unimodal
B) has a low degree of kurtosis
C) has the same values for mean and mode
D) is bimodal
Answer: D
Diff: 1
Blooms: Remember
Topic: Descriptive Statistics for Numerical Data
Learning Outcome: Compare and contrast methods of summarizing and describing data
2-15
Copyright © 2013 Pearson Education, Inc. publishing as Prentice Hall
56) If the distribution of observations were perfectly symmetrical and unimodal, ________.
A) the mean would be greater than the mode
B) the mean, median, and mode would be the same
C) the mode would be lesser than the median
D) the median would be greater than the mean
Answer: B
Diff: 1
Blooms: Remember
Topic: Descriptive Statistics for Numerical Data
Learning Outcome: Compare and contrast methods of summarizing and describing data
57) The degree of flatness or peakedness of a population is measured by the ________.
A) coefficient of kurtosis
B) coefficient of skewness
C) coefficient of variation
D) coefficient of deviation
Answer: A
Diff: 1
Blooms: Remember
Topic: Descriptive Statistics for Numerical Data
Learning Outcome: Compare and contrast methods of summarizing and describing data
58) A distribution that is relatively flat with a wide degree of dispersion has a coefficient of
kurtosis that is ________.
A) more than 3
B) less than 3
C) less than 6
D) more than 6
Answer: B
Diff: 1
Blooms: Remember
Topic: Descriptive Statistics for Numerical Data
Learning Outcome: Compare and contrast methods of summarizing and describing data
59) A distribution that is relatively peaked with a low degree of dispersion has a coefficient of
kurtosis that is ________.
A) equal to 0
B) less than 0
C) more than 3
D) equal to 3
Answer: C
Diff: 1
Blooms: Remember
Topic: Descriptive Statistics for Numerical Data
Learning Outcome: Compare and contrast methods of summarizing and describing data
2-16
Copyright © 2013 Pearson Education, Inc. publishing as Prentice Hall
60) ________ is a measure of a linear relationship between two variables.
A) Variance
B) Proportion
C) Correlation
D) Kurtosis
Answer: C
Diff: 1
Blooms: Remember
Topic: Descriptive Statistics for Numerical Data
Learning Outcome: Compare and contrast methods of summarizing and describing data
61) The correlation coefficient is a number between ________.
A) 0 and +1
B) -1 and 0
C) -1 and +1
D) -2 and +2
Answer: A
Diff: 1
Blooms: Remember
Topic: Descriptive Statistics for Numerical Data
Learning Outcome: Compare and contrast methods of summarizing and describing data
62) The correlation coefficient for two variables that are not linearly related will be equal to
________.
A) 1
B) 2
C) 0
D) 3
Answer: C
Diff: 1
Blooms: Remember
Topic: Descriptive Statistics for Numerical Data
Learning Outcome: Compare and contrast methods of summarizing and describing data
63) What does a positive correlation coefficient indicate?
A) When one variable increases, the other variable decreases.
B) When one variable increases, the other variable also increases.
C) When one variable decreases, the other variable remains constant.
D) Both the variables are not linearly related.
Answer: B
Diff: 1
Blooms: Remember
Topic: Descriptive Statistics for Numerical Data
Learning Outcome: Compare and contrast methods of summarizing and describing data
2-17
Copyright © 2013 Pearson Education, Inc. publishing as Prentice Hall
64) What does a negative correlation coefficient indicate?
A) When one variable increases, the other variable decreases.
B) There is a nonlinear relationship between the two variables.
C) When one variable increases, the other variable increases by a smaller proportion.
D) A change in one variable does not lead to a change in the other variable.
Answer: A
Diff: 1
Blooms: Remember
Topic: Descriptive Statistics for Numerical Data
Learning Outcome: Compare and contrast methods of summarizing and describing data
65) The formal statistical measure for categorical data is called the ________.
A) sample mean
B) sample median
C) sample mode
D) sample proportion
Answer: D
Diff: 1
Blooms: Remember
Topic: Descriptive Statistics for Categorical Data
Learning Outcome: Compare and contrast methods of summarizing and describing data
66) Sample proportion is usually denoted as ________.
A) sp
B) p
C) p2
D) s
Answer: B
Diff: 1
Blooms: Remember
Topic: Descriptive Statistics for Categorical Data
Learning Outcome: Compare and contrast methods of summarizing and describing data
67) The subcategories of the variables in a contingency table must ________.
A) be mutually exclusive
B) sum up to a total of 1
C) be arranged in ascending order
D) lie between 0 and 1
Answer: A
Diff: 1
Blooms: Remember
Topic: Descriptive Statistics for Categorical Data
Learning Outcome: Compare and contrast methods of summarizing and describing data
2-18
Copyright © 2013 Pearson Education, Inc. publishing as Prentice Hall
68) A ________ displays the minimum, first quartile, median, third quartile, and maximum of a
data set.
A) scatter plot
B) contingency table
C) box plot
D) stacked column chart
Answer: C
Diff: 1
Blooms: Remember
Topic: Visual Display of Statistical Measures
Learning Outcome: Compare and contrast methods of summarizing and describing data
69) In a box-and-whisker plot, the whiskers represent the ________.
A) Q1 and Q3
B) minimum and maximum values
C) median and mode
D) cumulative frequencies
Answer: B
Diff: 1
Blooms: Remember
Topic: Visual Display of Statistical Measures
Learning Outcome: Compare and contrast methods of summarizing and describing data
70) In a box plot, the outer boundaries of the box represent the ________.
A) interquartile range
B) median and mode
C) minimum and maximum
D) outlier values
Answer: A
Diff: 1
Blooms: Remember
Topic: Visual Display of Statistical Measures
Learning Outcome: Compare and contrast methods of summarizing and describing data
71) In a box plot, the line inside the box represents the ________.
A) mean
B) median
C) mode
D) range
Answer: B
Diff: 1
Blooms: Remember
Topic: Visual Display of Statistical Measures
Learning Outcome: Compare and contrast methods of summarizing and describing data
2-19
Copyright © 2013 Pearson Education, Inc. publishing as Prentice Hall
72) Outliers defined as being between 1.5*IQR and 3*IQR to the left of Q1 or to the right of Q3
are considered ________.
A) weak
B) extreme
C) mild
D) statistically significant
Answer: C
Diff: 1
Blooms: Remember
Topic: Visual Display of Statistical Measures
Learning Outcome: Compare and contrast methods of summarizing and describing data
73) Outliers defined as being more than 3*IQR away from Q1 and Q3 are considered ________.
A) mild
B) extreme
C) weak
D) irrelevant
Answer: B
Diff: 1
Blooms: Remember
Topic: Visual Display of Statistical Measures
Learning Outcome: Compare and contrast methods of summarizing and describing data
74) Which of the following is true of outliers in a data set?
A) All outliers should be eliminated in order to portray accurate information.
B) Outliers that are within 1 standard deviation of the mean must be eliminated.
C) The mean and range are sensitive to outliers in the data.
D) Outliers do not make any difference in the results obtained from statistical analyses.
Answer: C
Diff: 1
Blooms: Remember
Topic: Visual Display of Statistical Measures
Learning Outcome: Compare and contrast methods of summarizing and describing data
75) Pivot tables can be used to create ________.
A) dot-scale diagrams.
B) box-and-whisker plots.
C) cross-tabulations for categorical data.
D) scatter plots.
Answer: C
Diff: 1
Blooms: Remember
Topic: Data Analysis Using Pivot tables
Learning Outcome: Compare and contrast methods of summarizing and describing data
2-20
Copyright © 2013 Pearson Education, Inc. publishing as Prentice Hall
76) Frequency distributions can only be constructed for numerical data.
Answer: FALSE
Diff: 1
Blooms: Remember
Topic: Frequency Distributions, Histograms, and Data Profiles
Learning Outcome: Compare and contrast methods of summarizing and describing data
77) The sum of relative frequencies must equal 100.
Answer: FALSE
Diff: 1
Blooms: Remember
Topic: Frequency Distributions, Histograms, and Data Profiles
Learning Outcome: Compare and contrast methods of summarizing and describing data
78) The cumulative relative frequency represents the proportion of the total sample that falls at
or below the upper limit value.
Answer: TRUE
Diff: 1
Blooms: Remember
Topic: Frequency Distributions, Histograms, and Data Profiles
Learning Outcome: Compare and contrast methods of summarizing and describing data
79) Point estimates that accurately represent population parameters are called outliers.
Answer: FALSE
Diff: 1
Blooms: Remember
Topic: Descriptive Statistics for Numerical Data
Learning Outcome: Compare and contrast methods of summarizing and describing data
80) The standard deviation is the square root of the variance.
Answer: TRUE
Diff: 1
Blooms: Remember
Topic: Descriptive Statistics for Numerical Data
Learning Outcome: Compare and contrast methods of summarizing and describing data
81) The formula used for calculating the variance of a population is different from that used for
calculating the variance of a sample.
Answer: TRUE
Diff: 1
Blooms: Remember
Topic: Descriptive Statistics for Numerical Data
Learning Outcome: Compare and contrast methods of summarizing and describing data
2-21
Copyright © 2013 Pearson Education, Inc. publishing as Prentice Hall
82) A negative correlation coefficient indicates a linear relationship between variables where one
variable increases as the other increases.
Answer: FALSE
Diff: 1
Blooms: Remember
Topic: Descriptive Statistics for Numerical Data
Learning Outcome: Compare and contrast methods of summarizing and describing data
83) Statistics such as means and variances are not appropriate for categorical data.
Answer: TRUE
Diff: 1
Blooms: Remember
Topic: Descriptive Statistics for Categorical Data
Learning Outcome: Compare and contrast methods of summarizing and describing data
84) Box-and-whisker plots graphically display five key statistics of a data set: the minimum, first
quartile, mean, third quartile, and maximum.
Answer: FALSE
Diff: 1
Blooms: Remember
Topic: Visual Display of Statistical Measures
Learning Outcome: Compare and contrast methods of summarizing and describing data
85) Box plots and dot-scale diagrams can help identify possible outliers visually.
Answer: TRUE
Diff: 1
Blooms: Remember
Topic: Visual Display of Statistical Measures
Learning Outcome: Compare and contrast methods of summarizing and describing data
86) For a stock that displays a large standard deviation, the returns may be high but risk is high
too.
Answer: TRUE
Diff: 1
Blooms: Remember
Topic: Descriptive Statistics for Numerical Data
Learning Outcome: Compare and contrast methods of summarizing and describing data
87) According to the empirical rules, approximately 38% of the observations will fall within two
standard deviations of the mean.
Answer: FALSE
Diff: 1
Blooms: Remember
Topic: Descriptive Statistics for Numerical Data
Learning Outcome: Compare and contrast methods of summarizing and describing data
2-22
Copyright © 2013 Pearson Education, Inc. publishing as Prentice Hall
88) The coefficient of variation (CV) provides a relative measure of the dispersion in data
relative to the mean.
Answer: TRUE
Diff: 1
Blooms: Remember
Topic: Descriptive Statistics for Numerical Data
Learning Outcome: Compare and contrast methods of summarizing and describing data
89) For a negatively skewed distribution, the mode is greater than the median, which is greater
than the mean.
Answer: TRUE
Diff: 1
Blooms: Remember
Topic: Descriptive Statistics for Numerical Data
Learning Outcome: Compare and contrast methods of summarizing and describing data
90) The higher the kurtosis, the more area the histogram has in the middle rather than in the tails.
Answer: FALSE
Diff: 1
Blooms: Remember
Topic: Descriptive Statistics for Numerical Data
Learning Outcome: Compare and contrast methods of summarizing and describing data
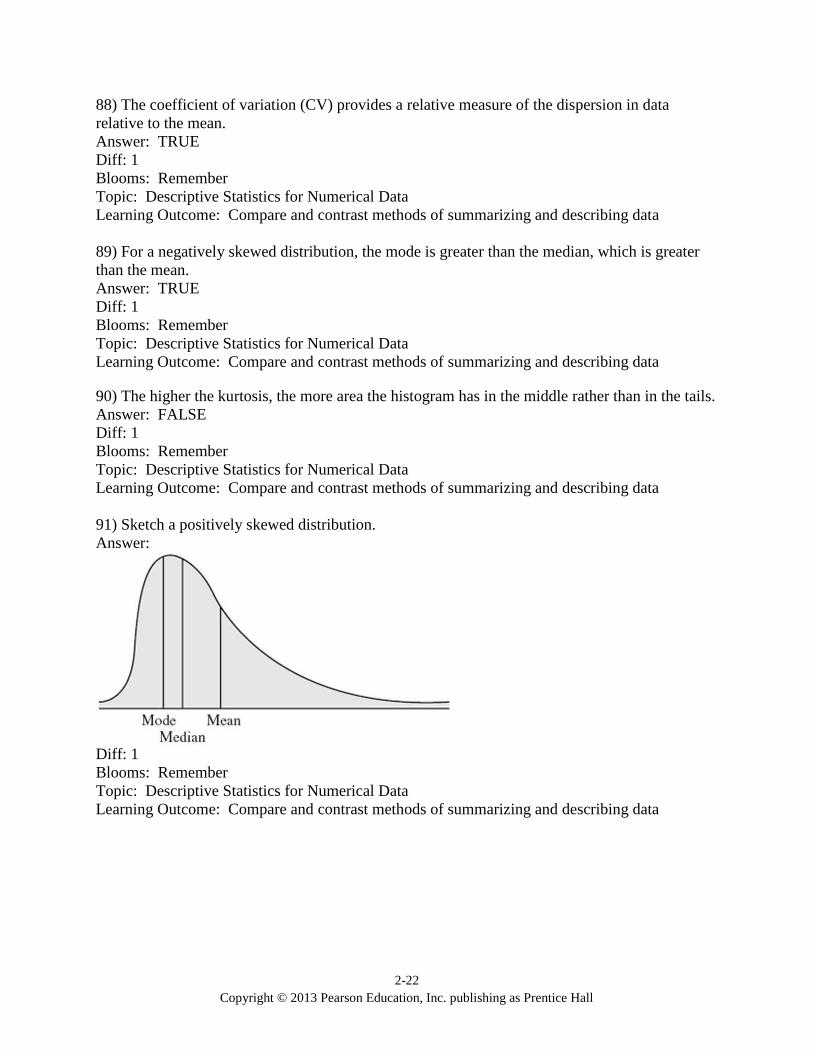
91) Sketch a positively skewed distribution.
Answer:
Diff: 1
Blooms: Remember
Topic: Descriptive Statistics for Numerical Data
Learning Outcome: Compare and contrast methods of summarizing and describing data
2-23
Copyright © 2013 Pearson Education, Inc. publishing as Prentice Hall
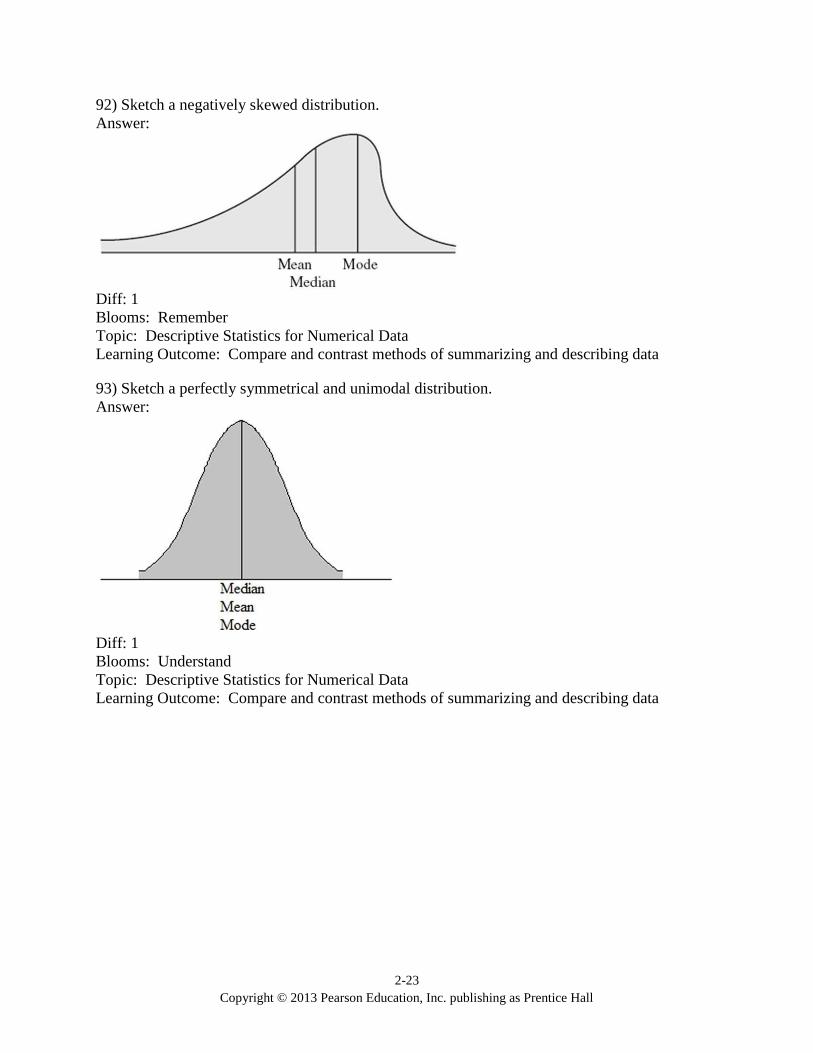
92) Sketch a negatively skewed distribution.
Answer:
Diff: 1
Blooms: Remember
Topic: Descriptive Statistics for Numerical Data
Learning Outcome: Compare and contrast methods of summarizing and describing data
93) Sketch a perfectly symmetrical and unimodal distribution.
Answer:
Diff: 1
Blooms: Understand
Topic: Descriptive Statistics for Numerical Data
Learning Outcome: Compare and contrast methods of summarizing and describing data
2-24
Copyright © 2013 Pearson Education, Inc. publishing as Prentice Hall
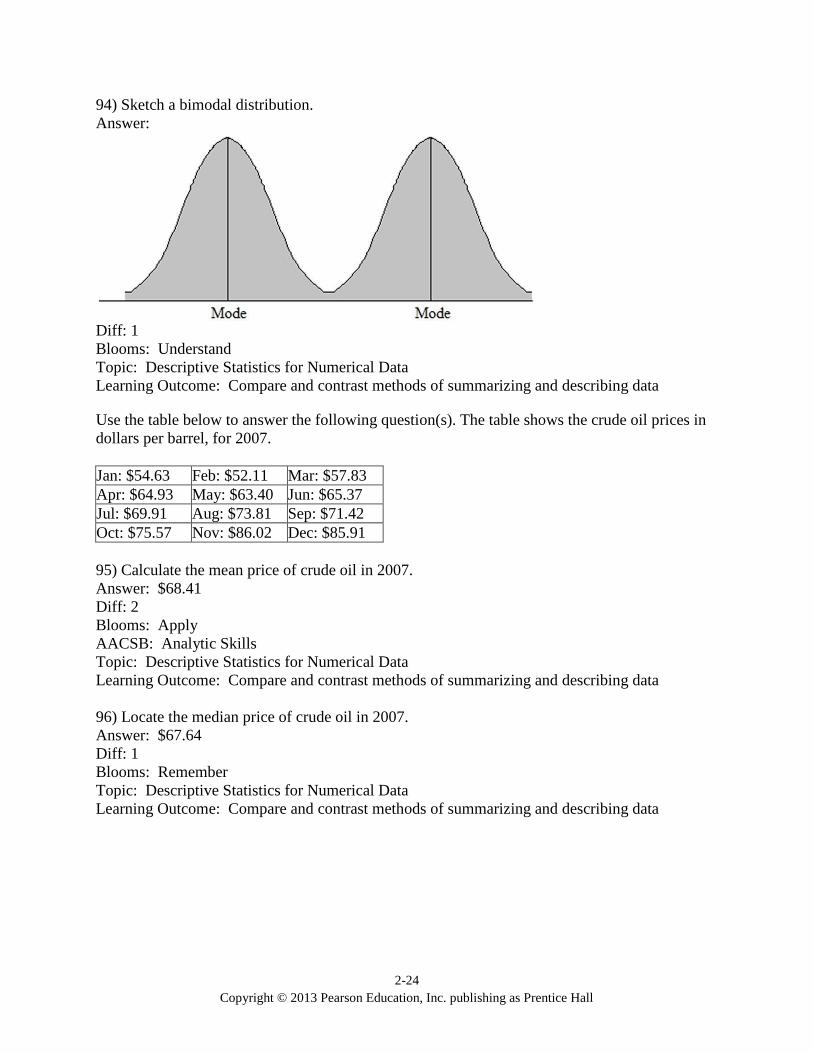
94) Sketch a bimodal distribution.
Answer:
Diff: 1
Blooms: Understand
Topic: Descriptive Statistics for Numerical Data
Learning Outcome: Compare and contrast methods of summarizing and describing data
Use the table below to answer the following question(s). The table shows the crude oil prices in
dollars per barrel, for 2007.
Jan: $54.63 Feb: $52.11 Mar: $57.83
Apr: $64.93 May: $63.40 Jun: $65.37
Jul: $69.91 Aug: $73.81 Sep: $71.42
Oct: $75.57 Nov: $86.02 Dec: $85.91
95) Calculate the mean price of crude oil in 2007.
Answer: $68.41
Diff: 2
Blooms: Apply
AACSB: Analytic Skills
Topic: Descriptive Statistics for Numerical Data
Learning Outcome: Compare and contrast methods of summarizing and describing data
96) Locate the median price of crude oil in 2007.
Answer: $67.64
Diff: 1
Blooms: Remember
Topic: Descriptive Statistics for Numerical Data
Learning Outcome: Compare and contrast methods of summarizing and describing data
2-25
Copyright © 2013 Pearson Education, Inc. publishing as Prentice Hall
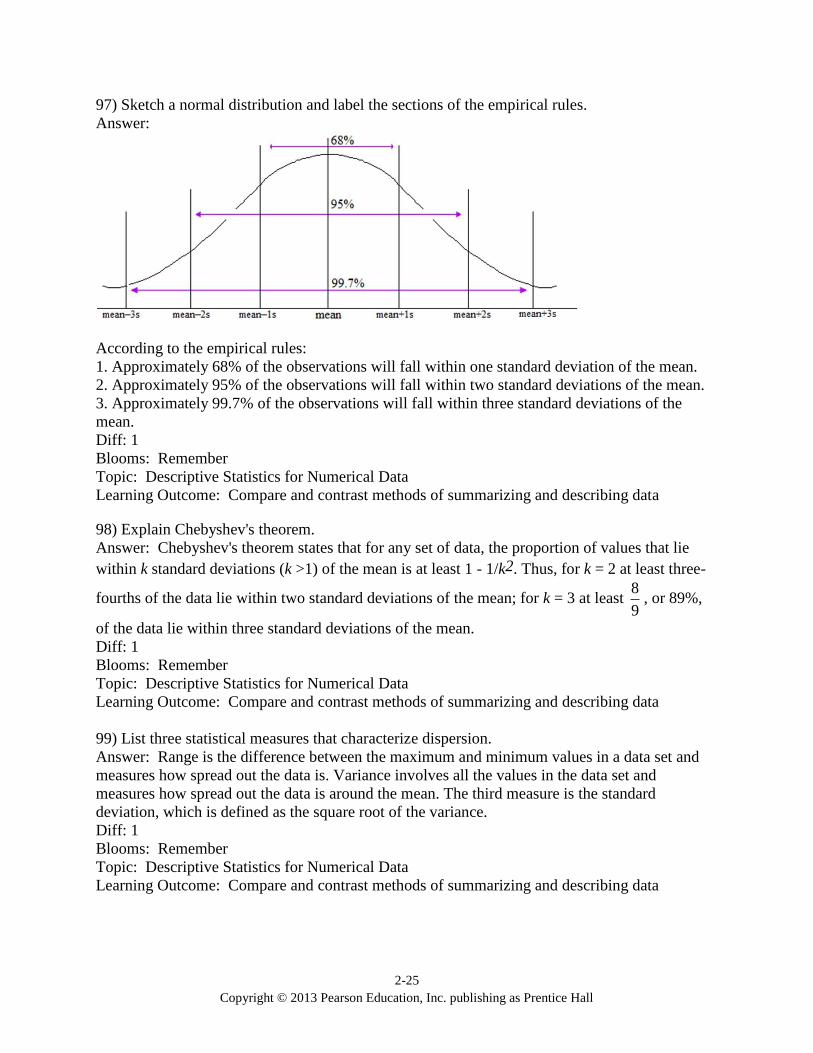
97) Sketch a normal distribution and label the sections of the empirical rules.
Answer:
According to the empirical rules:
1. Approximately 68% of the observations will fall within one standard deviation of the mean.
2. Approximately 95% of the observations will fall within two standard deviations of the mean.
3. Approximately 99.7% of the observations will fall within three standard deviations of the
mean.
Diff: 1
Blooms: Remember
Topic: Descriptive Statistics for Numerical Data
Learning Outcome: Compare and contrast methods of summarizing and describing data
98) Explain Chebyshev's theorem.
Answer: Chebyshev's theorem states that for any set of data, the proportion of values that lie
within k standard deviations (k >1) of the mean is at least 1 - 1/k2. Thus, for k = 2 at least three-
fourths of the data lie within two standard deviations of the mean; for k = 3 at least 9
8, or 89%,
of the data lie within three standard deviations of the mean.
Diff: 1
Blooms: Remember
Topic: Descriptive Statistics for Numerical Data
Learning Outcome: Compare and contrast methods of summarizing and describing data
99) List three statistical measures that characterize dispersion.
Answer: Range is the difference between the maximum and minimum values in a data set and
measures how spread out the data is. Variance involves all the values in the data set and
measures how spread out the data is around the mean. The third measure is the standard
deviation, which is defined as the square root of the variance.
Diff: 1
Blooms: Remember
Topic: Descriptive Statistics for Numerical Data
Learning Outcome: Compare and contrast methods of summarizing and describing data


![[KA] Vogel's Qualitative Inorganic Analysis 5e](https://img.pdfslide.net/doc/110x75/577c827d1a28abe054b0feb7/ka-vogels-qualitative-inorganic-analysis-5e.jpg)