Embed Size (px)
Citation preview
Statistics Education Research Journal
Volume 7 Number 1 May 2008
Editors
Peter Petocz Tom Short
Assistant Editor
Beth Chance
Associate Editors
Andrej Blejec Carol Joyce Blumberg Nick J. Broers Joan B. Garfield John Harraway Flavia Jolliffe M. Gabriella Ottaviani Lionel Pereira-Mendoza Peter Petocz Maxine Pfannkuch Dave Pratt Chris Reading Ernesto Sanchez Richard L. Scheaffer Gilberte Schuyten Jane Watson
International Association for Statistical Education http://www.stat.auckland.ac.nz/~iase International Statistical Institute http://isi.cbs.nl/
STATISTICS EDUCATION RESEARCH JOURNAL The Statistics Education Research Journal (SERJ) is a peer-reviewed electronic journal of the International Association for Statistical Education (IASE) and the International Statistical Institute (ISI). SERJ is published twice a year and is free. SERJ aims to advance research-based knowledge that can help to improve the teaching, learning, and understanding of statistics or probability at all educational levels and in both formal (classroom-based) and informal (out-of-classroom) contexts. Such research may examine, for example, cognitive, motivational, attitudinal, curricular, teaching-related, technology-related, organizational, or societal factors and processes that are related to the development and understanding of stochastic knowledge. In addition, research may focus on how people use or apply statistical and probabilistic information and ideas, broadly viewed. The Journal encourages the submission of quality papers related to the above goals, such as reports of original research (both quantitative and qualitative), integrative and critical reviews of research literature, analyses of research-based theoretical and methodological models, and other types of papers described in full in the Guidelines for Authors. All papers are reviewed internally by an Associate Editor or Editor, and are blind-reviewed by at least two external referees. Contributions in English are recommended. Contributions in French and Spanish will also be considered. A submitted paper must not have been published before or be under consideration for publication elsewhere. Further information and guidelines for authors are available at: http://www.stat.auckland.ac.nz/serj Submissions Manuscripts must be submitted by email, as an attached Word document, to co-editor Tom Short <[email protected]>. Submitted manuscripts should be produced using the Template file and in accordance with details in the Guidelines for Authors on the Journal’s Web page: http://www.stat.auckland.ac.nz/serj © International Association for Statistical Education (IASE/ISI), May 2008 Publication: IASE/ISI, Voorburg, The Netherlands Technical Production: California Polytechnic State University, San Luis Obispo, California, United States of America Web hosting and technical support: Department of Statistics, University of Auckland, New Zealand ISSN: 1570-1824 International Association for Statistical Education President: Allan Rossman (United States of America) President-Elect: Helen MacGillivray (Australia) Past- President: Gilberte Schuyten (Belgium) Vice-Presidents: Andrej Blejec (Slovenia), John Harraway (New Zealand), James Nicholson
(Ireland), Delia North (South Africa), Enriqueta Reston (Phillipines)
SERJ EDITORIAL BOARD Editors Peter Petocz, Macquarie University, Sydney, North Ryde, New South Wales 2109, Australia
Email: [email protected] Tom Short, Mathematics Department, Indiana University of Pennsylvania, 210 South 10th St.,
Indiana, Pennsylvania 15705, USA. Email: [email protected] Assistant Editor Beth Chance, Department of Statistics, California Polytechnic State University, San Luis Obispo,
California, 93407, USA. Email: [email protected] Associate Editors Andrej Blejec, National Institute of Biology, Vecna pot 111 POB 141, SI-1000 Ljubljana,
Slovenia. Email: [email protected] Carol Joyce Blumberg, Energy Information Administration, US Department of Energy, 1000
Independence Avenue SW, EI-42, Washington DC 20585, USA. Email: [email protected]
Nick J. Broers, Department of Methodology and Statistics, Maastricht University, P.O. Box 616, 6200 MD, Maastricht, The Netherlands. Email: [email protected]
Joan B. Garfield, Educational Psychology, University of Minnesota, 315 Burton Hall, 178 Pillsbury Drive, S.E., Minneapolis, MN 55455, USA. Email: [email protected]
John Harraway, Department of Mathematics and Statistics, University of Otago, P.O.Box 56, Dunedin, New Zealand. Email: [email protected]
Flavia Jolliffe, Institute of Mathematics, Statistics and Actuarial Science, University of Kent, Canterbury, Kent, CT2 7NF, United Kingdom. Email: [email protected]
M. Gabriella Ottaviani, Dipartimento di Statistica Probabilitá e Statistiche Applicate, Universitá degli Studi di Roma “La Sapienza”, P.le Aldo Moro, 5, 00185, Rome, Italy. Email: [email protected]
Lionel Pereira-Mendoza, 3366 Drew Henry Drive, Osgoode, Ottawa K0A 2W0 Ontario Canada K0A 2W0. Email: [email protected]
Maxine Pfannkuch, Mathematics Education Unit, Department of Mathematics, The University of Auckland, Private Bag 92019, Auckland, New Zealand. Email: [email protected]
Dave Pratt, Institute of Education, University of London, 20 Bedford Way, London WC1H 0AL. [email protected]
Christine Reading, SiMERR National Centre, Faculty of Education, Health and Professional Studies, University of New England, Armidale, NSW 2351, Australia. Email: [email protected]
Ernesto Sánchez, Departamento de Matematica Educativa, CINVESTAV-IPN, Av. Instituto Politecnico Nacional 2508, Col. San Pedro Zacatenco, 07360, Mexico D. F., Mexico. Email: [email protected]
Richard L. Scheaffer, Department of Statistics, University of Florida, 907 NW 21 Terrace, Gainesville, FL 32603, USA. Email: [email protected]
Gilberte Schuyten, Faculty of Psychology and Educational Sciences, Ghent University, H. Dunantlaan 1, B-9000 Gent, Belgium. Email: [email protected]
Jane Watson, University of Tasmania, Private Bag 66, Hobart, Tasmania 7001, Australia. Email: [email protected]
1
TABLE OF CONTENTS
Editorial
2
Jared Keeley, Ryan Zayac, and Christopher Correia Curvilinear Relationships Between Statistics Anxiety and Performance Among Undergraduate Students: Evidence for Optimal Anxiety
4
Randall Groth
Assessing Teachers’ Discourse about the Pre-K–12 Guidelines for Assessment and Instruction in Statistics Education (GAISE)
16
Jackie Reid and Chris Reading
Measuring the Development of Students’ Consideration of Variation 40 Forthcoming IASE Conferences
60
Other Forthcoming Conferences
66
2
EDITORIAL1 Welcome to SERJ Volume 7 Number 1! In this issue Jared Keeley, Ryan Zayac, and
Christopher Correia conjecture that an optimal anxiety level exists in undergraduate students to maximize performance in statistics courses. Randy Groth assesses teacher awareness of, perceptions about, and preparation for the American Statistical Association-endorsed “Pre-K-12 Guidelines for Assessment and Instruction in Statistics Education” (GAISE) document. Jackie Reid and Chris Reading present research on “Measuring the Development of Students’ Consideration of Variation,” a sequel to their 2006 SERJ article.
Iddo Gal’s term as SERJ Co-editor ended in December 2008. Iddo’s energy, enthusiasm, and high standards will be missed. His influence on SERJ is so pervasive that it is only now, nearly six months after his term has ended, that we are catching all of the references to his name and contact information on the SERJ Web site and making appropriate revisions. Thank you, Iddo, for your inspiration.
Peter Petocz joins me as the new SERJ Co-editor, for a four-year term from 2008 through 2011. Peter is an Associate Professor of Statistics in the Department of Statistics at Macquarie University in Sydney, Australia. Peter’s statistics education research experience emphasizes student conceptions of the importance of statistics in their future careers, and assessments of the importance of statistics and mathematics in the adult work force. He has also published collaborative articles in orthodontics and nutrition. Welcome, Peter!
Work for SERJ became less of a priority for Peter in early April 2008, when he had a brain tumor surgically removed. Thankfully, he seems to be experiencing a full recovery. Best wishes for future good health, Peter! SERJ thanks Mokaeane Victor Polaki from the National University of Lesotho for service as an Associate Editor, and we welcome Nick Broers from the Department of Methodology and Statistics at Maastricht University in the Netherlands to the Editorial Board.
In November 2008 SERJ will publish a special issue on reasoning about informal statistical inference. Dave Pratt and Janet Ainley are serving as guest editors for the special issue, and they are working with Peter Petocz to guide manuscripts through the review and revision process. Beginning in 2009 we propose to publish two regular issues of SERJ in May and November, regardless of the publication schedule for special issues. Our manuscript load has enough to support two regular issues each year.
Happily, the statistics education research community as a whole is supporting more publication across a variety of forums. The “Teacher’s Corner” in The American Statistician is now publishing regularly again, and the December 2007 issue of the International Statistical Review was entirely devoted to statistics education. SERJ continues to receive more manuscripts than can be easily handled, suggesting a profound increase in the awareness and scholarly activity associated with statistics education research.
Two other exciting initiatives are getting started in 2008. The “Variety in Statistics Assessment” (ViSA) project (http://www.rsscse.org.uk/activities/visa) is being hosted by the Royal Statistical Society Centre for Statistical Education and currently has a “Call for Contributions” posted on its Web site. In addition, Joan Garfield and Dennis Pearl received a small grant through the American Statistical Association’s Member Initiative
Statistics Education Research Journal, 7(1), 2-3, http://www.stat.auckland.ac.nz/serj © International Association for Statistical Education (IASE/ISI), May, 2008

3
program to host a workshop on key components of graduate programs in statistics education.
Thank you for reading SERJ. We welcome manuscripts, suggestions, and feedback!
TOM SHORT, for PETER PETOCZ
4
CURVILINEAR RELATIONSHIPS BETWEEN STATISTICS ANXIETY AND PERFORMANCE AMONG
UNDERGRADUATE STUDENTS: EVIDENCE FOR OPTIMAL ANXIETY2
JARED KEELEY Auburn University
RYAN ZAYAC Auburn University
CHRISTOPHER CORREIA Auburn University
ABSTRACT This study examined the possibility of a curvilinear relationship between statistics anxiety and performance in a statistics course. Eighty-three undergraduate students enrolled in an introductory course completed measures of statistics anxiety and need for achievement at seven points during the semester in conjunction with six tests. Statistics anxiety scores were reliable internally and across time. Statistics anxiety decreased during the term yet paradoxically became more strongly related to performance. Curvilinear models were better predictors of test performance than linear, suggesting a mid-range optimal level of statistics anxiety. However, students’ need for achievement proved not to mediate the relationship between anxiety and performance. The authors suggest ways these findings may influence future research in statistics anxiety and classroom management of anxiety. Keywords: Statistics education research; Statistics anxiety; Yerkes-Dodson law
1. INTRODUCTION Most students in the social sciences are required to take a statistics course as part of
their program of study. However, anecdotally many of these students choose their particular majors in an attempt to avoid having to take “more math.” As a result, students often dread their statistics course and may put it off until the end of their academic careers (Onwuegbuzie & Wilson, 2003; Roberts & Bilderback, 1980; Zeidner, 1991). Numerous authors have noted the presence of statistics anxiety among their students and its effects (Fitzgerald, Jurs, & Hudson, 1996; Onwuegbuzie & Seaman, 1995; Zanakis & Valenzi, 1997; Zeidner, 1991). There is a general consensus in the literature that statistics anxiety has an inverse relationship to performance in statistics classes (Fitzgerald et al., 1996; Onwuegbuzie & Seaman, 1995; Zanakis & Valenzi, 1997; Zeidner, 1991). For instance, Onwuegbuzie and Seaman (1995) found a negative correlation between statistics test
Statistics Education Research Journal, 7(1), 4-15, http://www.stat.auckland.ac.nz/serj © International Association for Statistical Education (IASE/ISI), May, 2008
5
anxiety and students’ final exam scores. Further, they found that there was an interactional effect with high anxiety students performing worse in timed conditions than in untimed conditions. This finding is consistent with research suggesting that the relationship between test anxiety and performance can be moderated by the complexity or difficulty of the exam, with high-anxious students performing best on easy or moderately difficult exams, and low-anxious students faring better on more difficult exams that enhance arousal and motivation (Zeidner, 1998).
The studies cited above have all examined linear relationships between anxiety and statistics performance. However, there is good theoretical reason to suggest that the relationship between anxiety and performance in the context of statistics may follow a curvilinear relationship. The well-known Yerkes-Dodson law (first described in Yerkes & Dodson, 1908) states that there is an optimal level of arousal for maximum performance. At both extremes of low and high levels of arousal, performance is poor. As arousal moves away from those extremes, performance gradually improves. Therefore, there is an optimal mid-range level of arousal. Thus, this relationship is curvilinear (more specifically, quadratic). The Yerkes-Dodson law has since been empirically validated in a variety of areas including trauma (McNally, 2003), sports performance (Kais & Raudsepp, 2004; Norton, Hope, & Weeks, 2004), stress on the job (Bhuian, Menguc, & Borsboom, 2005), artificial intelligence (Raudys & Justickis, 2003), animal research (Maes & de Groot, 2003), and most importantly for our purposes, in academic settings (Sarid, Anson, Yaari, & Margalith, 2004) and in relation to anxiety (Bodas & Ollendick, 2005; Hopko et al., 2003). Specifically, anxiety follows the same pattern as general arousal, in that low and high levels of anxiety are detrimental to performance in mental tasks (Hopko et al., 2003). In an academic setting, stress produced the same curvilinear relationship in performance as measured by students’ grades (Sarid et al., 2004). Finally, anxiety seems to have the same effect on test performance (Bodas & Ollendick, 2005). Therefore, we expect that statistics anxiety will follow a curvilinear relationship with performance on statistics exams. This notion has been expressed before (Onwuegbuzie & Wilson, 2003) but has yet to be empirically tested.
Further, we expected that the possible curvilinear relationship between anxiety and performance may be moderated by other situational and dispositional factors. In the current study, we chose to focus on the potential effects of need for achievement. Research has generally shown that students with low academic motivation have lower grade-point averages (Cokley, Bernard, Cunningham, & Motoike, 2001; Vallerand et al., 1992). We hypothesized that a student’s level of need for achievement (also known as achievement motivation) would moderate the relationship found between statistics anxiety and performance. We predicted that a student with a high level of achievement motivation would demonstrate the curvilinear relationship between anxiety and performance, whereas a student with a low level of achievement motivation would demonstrate no relationship. In the case of the highly motivated student, anxiety will be “fuel” for the student to perform, and so a moderate level of anxiety will produce the highest levels of performance on the test. However, we expect that students with a low need for achievement will be unaffected by their level of anxiety, as the anxiety will not be directed towards behaviors related to improving school performance (e.g., increased studying, asking for help, etc.).
The current study addressed three aims. First, the study examined the reliability of the Statistics Anxiety Ratings Scale (STARS) scores (Cruise & Wilkins, 1980), a commonly used measure of statistics anxiety (Onwuegbuzie & Wilson, 2003), with a sample of undergraduates taking an introductory level statistics course. Second, the study examined students’ statistics anxiety across the term, specifically looking for a curvilinear
6
relationship between anxiety levels and performance on statistics tests. Third, the study attempted to determine if students’ level of achievement motivation was a moderating factor on the relationship between students’ anxiety and performance.
2. METHOD
2.1. PARTICIPANTS
Participants were drawn from 83 students enrolled in a single introductory statistics
course for the social sciences during the spring of 2005 at a large university located in the southeastern United States. The course was taught by one of the coauthors (CC), and the remaining coauthors (JK and RZ) served as the graduate teaching assistants. Students were required to take a basic level mathematics course as a prerequisite for enrollment in the course. Thus, the sample was one of convenience. Most students (73.5%) were female. The majority of students were seniors (71.1%), with some juniors (26.5%), two sophomores (2.4%), and no freshmen. Nineteen majors were represented, with the most frequent being psychology (24.1%), criminology (19.3%), and human development/ family studies (14.5%). 2.2. MEASURES
We administered two scales over the course of the study: the STARS (Cruise &
Wilkins, 1980) and a modified version of the Work Value Survey’s Achievement scale (Schwartz, 1994). The STARS consists of 51 items across six scales. The scales are designed to measure a student’s (a) estimation of the worth of statistics (16 items), (b) anxiety regarding interpreting statistics (11 items), (c) test and class anxiety (8 items), (d) computational self-concept (7 items), (e) fear of asking for help (4 items), and (f) fear of the statistics teacher (5 items). Items are rated on two Likert scales ranging from 1 to 5 anchored as either “no anxiety” to “very much anxiety” or “strongly disagree” to “strongly agree.” Higher scores on each scale are indicative of relatively higher levels of anxiety. Cruise, Cash, and Bolton (1985) reported internal reliability coefficients ranging from .68 to .94 for the subscale scores with re-test reliability ranging from .67 to .84. Of all the various measures of statistics anxiety that exist in the literature, the STARS is the most frequently used and most empirically investigated (Onwuegbuzie & Wilson, 2003).
We used the Achievement scale of the Work Value Survey (Schwartz, 1994) as a measure of students’ need for achievement. The scale consists of six items rated on a 7 point Likert-format scale ranging from “opposed to my values” to “of supreme importance.” Feather, Norman, and Worsley (1998) reported a reliability coefficient of .76 for the scale scores, and Schwartz (1994) presented some evidence of construct-related validity.
We also recorded students’ performance on each of six non-cumulative tests across the semester. Each test consisted of 20 multiple-choice items and 2 to 4 open-ended problems requiring students to compute and interpret a statistical analysis. The multiple-choice portion of the test accounted for 60% of the students’ test scores, and the remaining 40% was accounted for by their performance on the open-ended items. Each exam was worth 100 points, and the percentage of points earned on each exam was used in all analyses to standardize comparison across exams.
7
2.3. PROCEDURE On the first day of class, students were introduced to the topic of statistics anxiety and
informed that the experimenters (who were the teacher of record and the two TAs for the class) would be conducting a study on statistics anxiety throughout the course. The experimenters stated that students would be asked to complete a short questionnaire during the first lab meeting and after every test. In compensation, students would be given extra course credit for every time they participated. It was made clear that participation was optional and voluntary, that their decision to participate would in no way affect their status in the course, and that other opportunities for extra credit would be available over the course of the semester. To ensure confidentiality, students identified themselves on the questionnaires through use of a code name known only to them and the TAs. After all was explained, students were asked to sign a consent sheet indicating their permission for the experimenters to use their data as given on the surveys and their corresponding test scores. Therefore, there were seven administrations of the measures, once at the beginning of the course and directly after each of the six tests. At the first administration, 90% of students completed the surveys. Participation ranged from 82% to 76% for the following six administrations after every test. Due to missing data, differing numbers of students completed a particular measure at every assessment time.
3. RESULTS
3.1. STATISTICS ANXIETY RELIABILITY
The internal consistency of scores on the six scales of the STARS was good, with Cronbach’s alpha ranging from .83 to .94 (see Table 1). We examined the test-retest reliability of the scale scores during the term. Students’ level of statistics anxiety generally decreased during the term (see below for a discussion of this finding). We used standard Pearson correlations between scales at each time as the measure of reliability, as Pearson correlations are not affected by a score’s value but rather its relative position in relation to other scores at the same time. We assessed test-retest reliability in two ways. We examined the reliability between consecutive administrations, separated by approximately two weeks apiece, and we examined the reliability over the term between the first administration and the last. These values are presented in Table 1 for each of the scales. All the scale scores have good test-retest reliability across a two-week period, with average values around .8. The reliability coefficients drop when we consider the reliability over the term, but are still acceptably high given the time span of four months. All correlation coefficients were statistically significant at the .001 level.
Table 1. Internal and test-retest reliability coefficients for scores on the STARS scales
Scale Cronbach’s α
Mean (Range) of correlations of
consecutive pairs
Correlation of first and last
administration Worth of Statistics .94 .82 (.71-.91) .41 Interpretation Anxiety .92 .87 (.83-.91) .69 Test and Class Anxiety .88 .84 (.79-.91) .74 Computational Self-Concept .88 .82 (.70-.90) .64 Fear of Asking for Help .83 .86 (.79-.92) .69 Fear of Statistics Teachers .85 .76 (.58-.89) .61
8
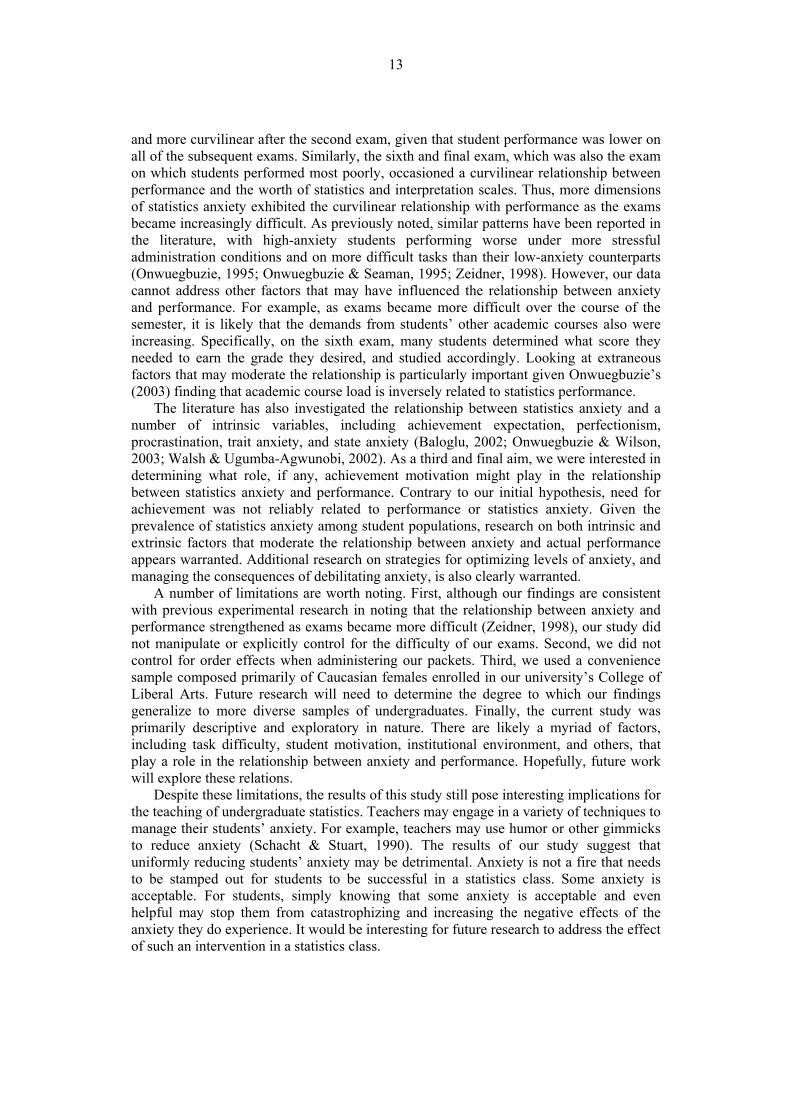
3.2. STATISTICS ANXIETY AND TEST SCORES Students’ reported statistics anxiety followed a few interesting patterns over the
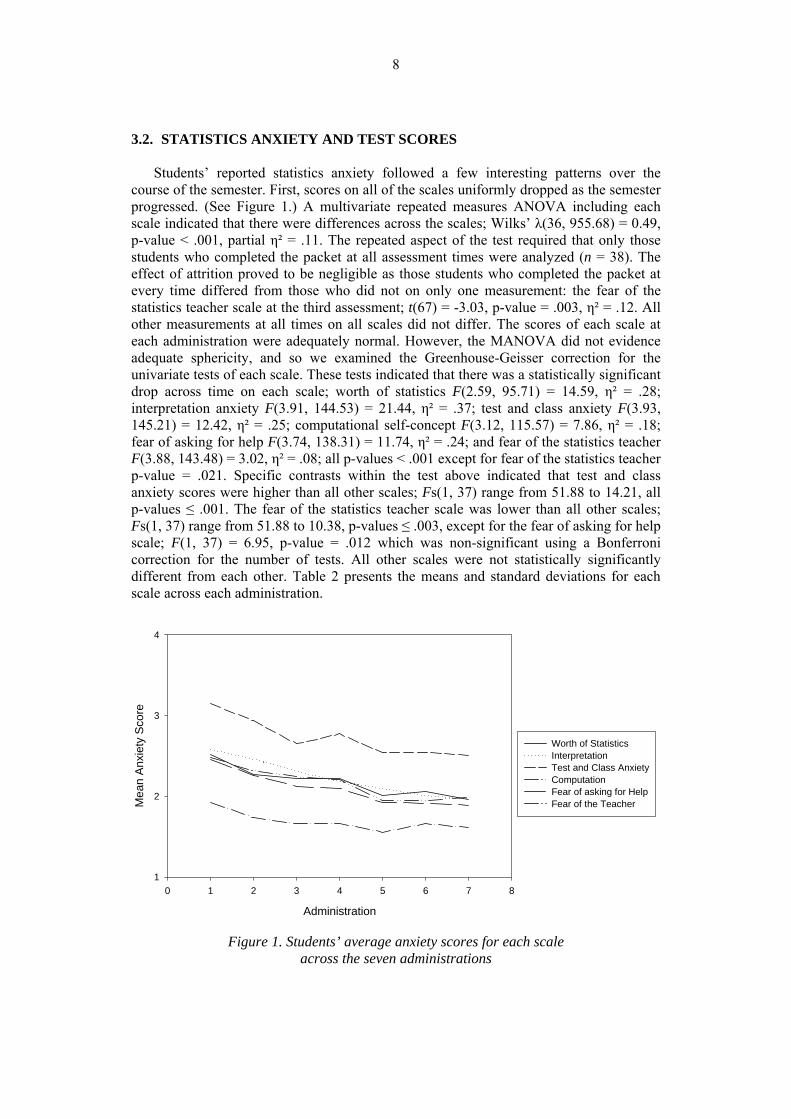
course of the semester. First, scores on all of the scales uniformly dropped as the semester progressed. (See Figure 1.) A multivariate repeated measures ANOVA including each scale indicated that there were differences across the scales; Wilks’ λ(36, 955.68) = 0.49, p-value < .001, partial η² = .11. The repeated aspect of the test required that only those students who completed the packet at all assessment times were analyzed (n = 38). The effect of attrition proved to be negligible as those students who completed the packet at every time differed from those who did not on only one measurement: the fear of the statistics teacher scale at the third assessment; t(67) = -3.03, p-value = .003, η² = .12. All other measurements at all times on all scales did not differ. The scores of each scale at each administration were adequately normal. However, the MANOVA did not evidence adequate sphericity, and so we examined the Greenhouse-Geisser correction for the univariate tests of each scale. These tests indicated that there was a statistically significant drop across time on each scale; worth of statistics F(2.59, 95.71) = 14.59, η² = .28; interpretation anxiety F(3.91, 144.53) = 21.44, η² = .37; test and class anxiety F(3.93, 145.21) = 12.42, η² = .25; computational self-concept F(3.12, 115.57) = 7.86, η² = .18; fear of asking for help F(3.74, 138.31) = 11.74, η² = .24; and fear of the statistics teacher F(3.88, 143.48) = 3.02, η² = .08; all p-values < .001 except for fear of the statistics teacher p-value = .021. Specific contrasts within the test above indicated that test and class anxiety scores were higher than all other scales; Fs(1, 37) range from 51.88 to 14.21, all p-values ≤ .001. The fear of the statistics teacher scale was lower than all other scales; Fs(1, 37) range from 51.88 to 10.38, p-values ≤ .003, except for the fear of asking for help scale; F(1, 37) = 6.95, p-value = .012 which was non-significant using a Bonferroni correction for the number of tests. All other scales were not statistically significantly different from each other. Table 2 presents the means and standard deviations for each scale across each administration.
Administration
0 1 2 3 4 5 6 7 8
Mea
n An
xiet
y Sc
ore
1
2
3
4
Figure 1. Students’ average anxiety scores for each scale across the seven administrations
Worth of StatisticsInterpretationTest and Class AnxietyComputationFear of asking for HelpFear of the Teacher
9
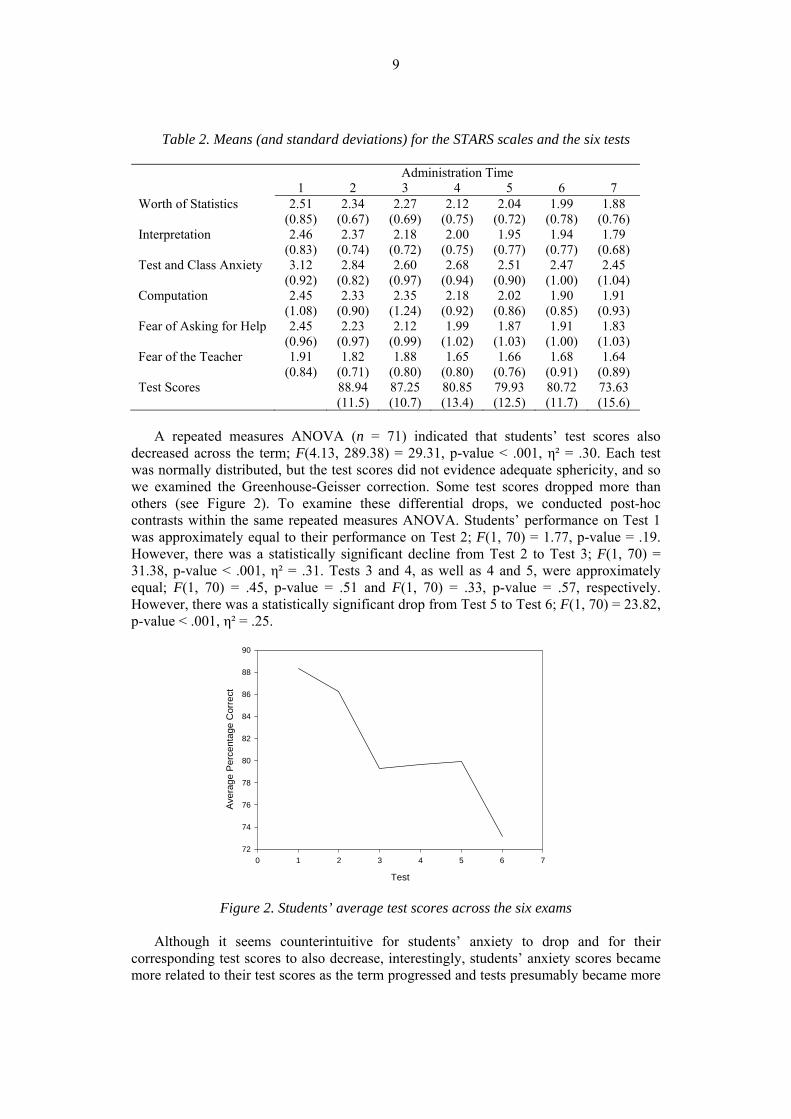
Table 2. Means (and standard deviations) for the STARS scales and the six tests
Administration Time 1 2 3 4 5 6 7
Worth of Statistics 2.51 (0.85)
2.34 (0.67)
2.27 (0.69)
2.12 (0.75)
2.04 (0.72)
1.99 (0.78)
1.88 (0.76)
Interpretation 2.46 (0.83)
2.37 (0.74)
2.18 (0.72)
2.00 (0.75)
1.95 (0.77)
1.94 (0.77)
1.79 (0.68)
Test and Class Anxiety 3.12 (0.92)
2.84 (0.82)
2.60 (0.97)
2.68 (0.94)
2.51 (0.90)
2.47 (1.00)
2.45 (1.04)
Computation 2.45 (1.08)
2.33 (0.90)
2.35 (1.24)
2.18 (0.92)
2.02 (0.86)
1.90 (0.85)
1.91 (0.93)
Fear of Asking for Help 2.45 (0.96)
2.23 (0.97)
2.12 (0.99)
1.99 (1.02)
1.87 (1.03)
1.91 (1.00)
1.83 (1.03)
Fear of the Teacher 1.91 (0.84)
1.82 (0.71)
1.88 (0.80)
1.65 (0.80)
1.66 (0.76)
1.68 (0.91)
1.64 (0.89)
Test Scores 88.94 (11.5)
87.25 (10.7)
80.85 (13.4)
79.93 (12.5)
80.72 (11.7)
73.63 (15.6)
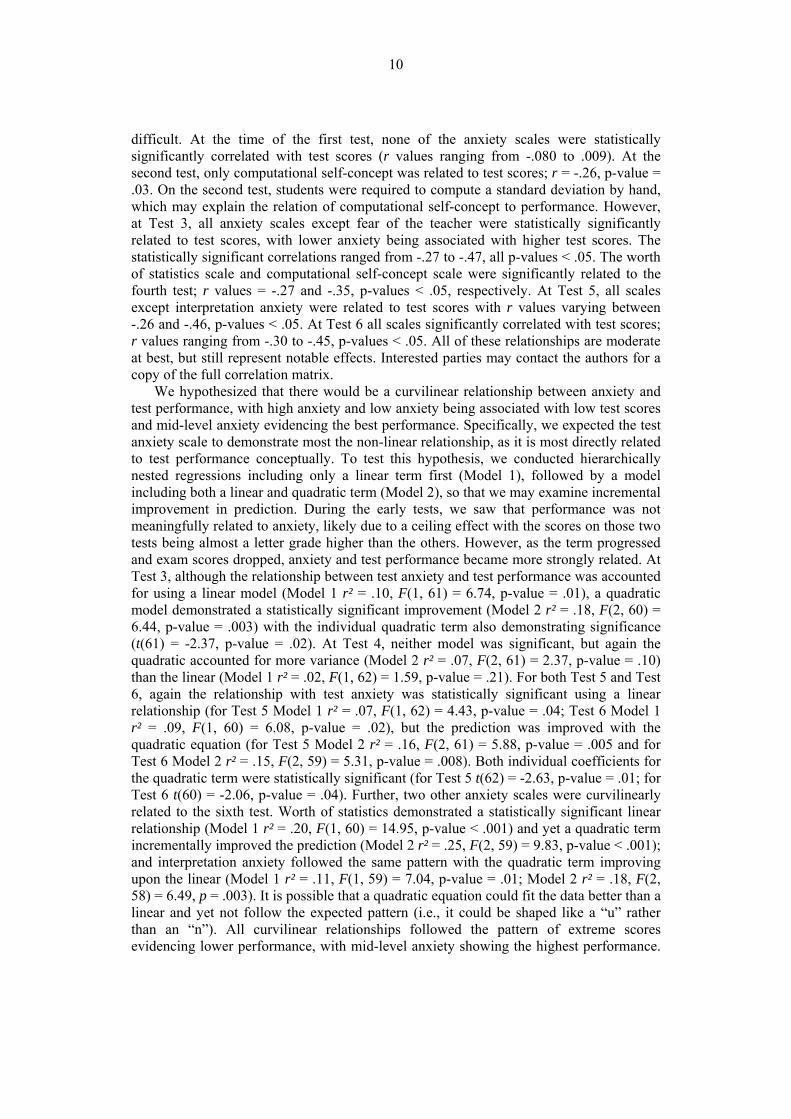
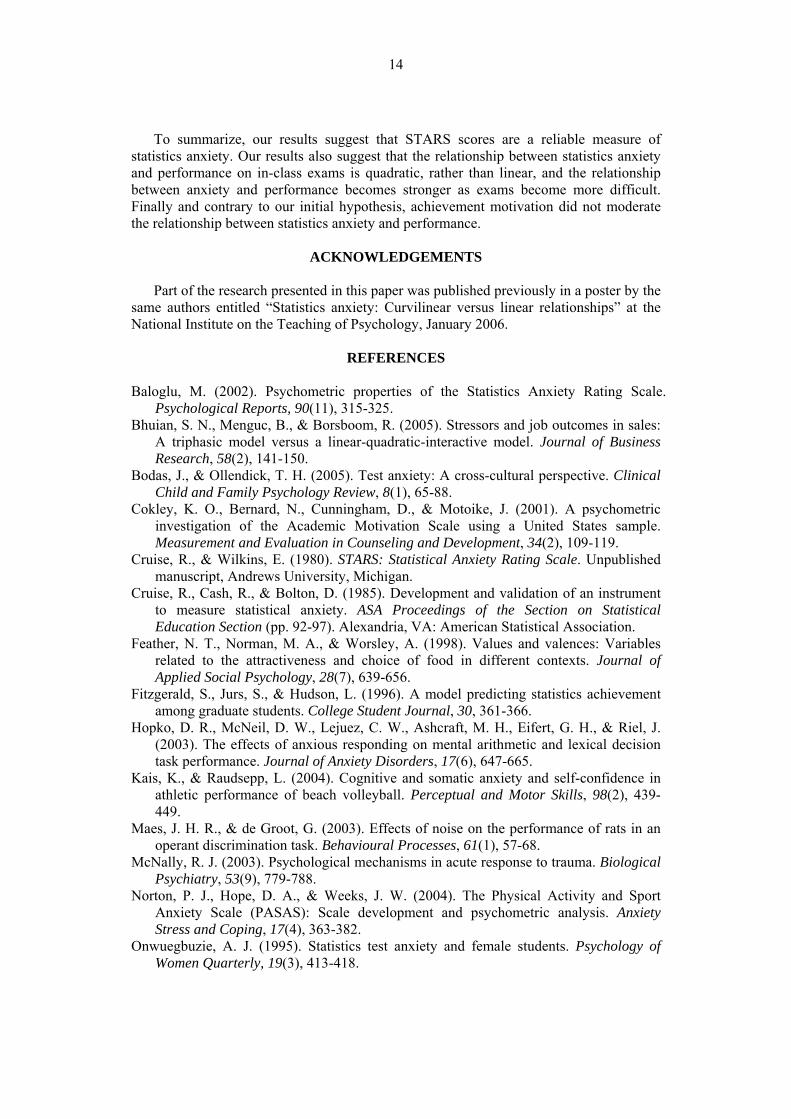
A repeated measures ANOVA (n = 71) indicated that students’ test scores also
decreased across the term; F(4.13, 289.38) = 29.31, p-value < .001, η² = .30. Each test was normally distributed, but the test scores did not evidence adequate sphericity, and so we examined the Greenhouse-Geisser correction. Some test scores dropped more than others (see Figure 2). To examine these differential drops, we conducted post-hoc contrasts within the same repeated measures ANOVA. Students’ performance on Test 1 was approximately equal to their performance on Test 2; F(1, 70) = 1.77, p-value = .19. However, there was a statistically significant decline from Test 2 to Test 3; F(1, 70) = 31.38, p-value < .001, η² = .31. Tests 3 and 4, as well as 4 and 5, were approximately equal; F(1, 70) = .45, p-value = .51 and F(1, 70) = .33, p-value = .57, respectively. However, there was a statistically significant drop from Test 5 to Test 6; F(1, 70) = 23.82, p-value < .001, η² = .25.
Test
0 1 2 3 4 5 6 7
Ave
rage
Per
cent
age
Cor
rect
72
74
76
78
80
82
84
86
88
90
Figure 2. Students’ average test scores across the six exams
Although it seems counterintuitive for students’ anxiety to drop and for their corresponding test scores to also decrease, interestingly, students’ anxiety scores became more related to their test scores as the term progressed and tests presumably became more
10
difficult. At the time of the first test, none of the anxiety scales were statistically significantly correlated with test scores (r values ranging from -.080 to .009). At the second test, only computational self-concept was related to test scores; r = -.26, p-value = .03. On the second test, students were required to compute a standard deviation by hand, which may explain the relation of computational self-concept to performance. However, at Test 3, all anxiety scales except fear of the teacher were statistically significantly related to test scores, with lower anxiety being associated with higher test scores. The statistically significant correlations ranged from -.27 to -.47, all p-values < .05. The worth of statistics scale and computational self-concept scale were significantly related to the fourth test; r values = -.27 and -.35, p-values < .05, respectively. At Test 5, all scales except interpretation anxiety were related to test scores with r values varying between -.26 and -.46, p-values < .05. At Test 6 all scales significantly correlated with test scores; r values ranging from -.30 to -.45, p-values < .05. All of these relationships are moderate at best, but still represent notable effects. Interested parties may contact the authors for a copy of the full correlation matrix.
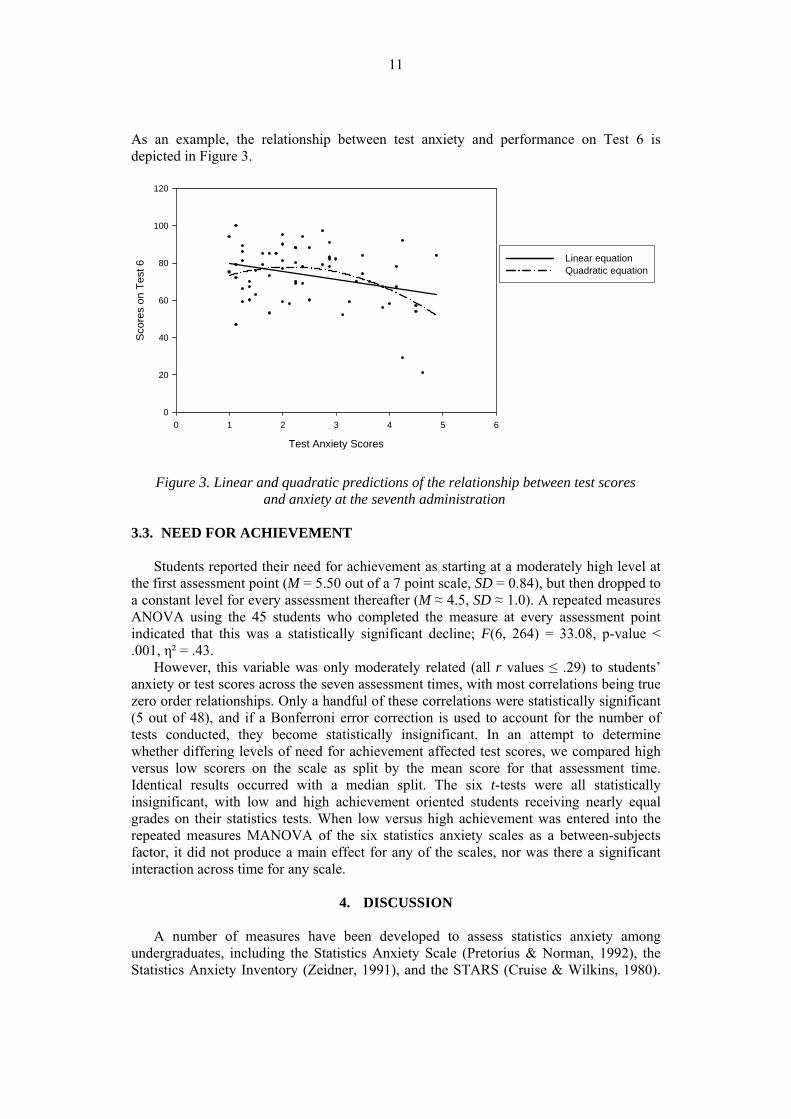
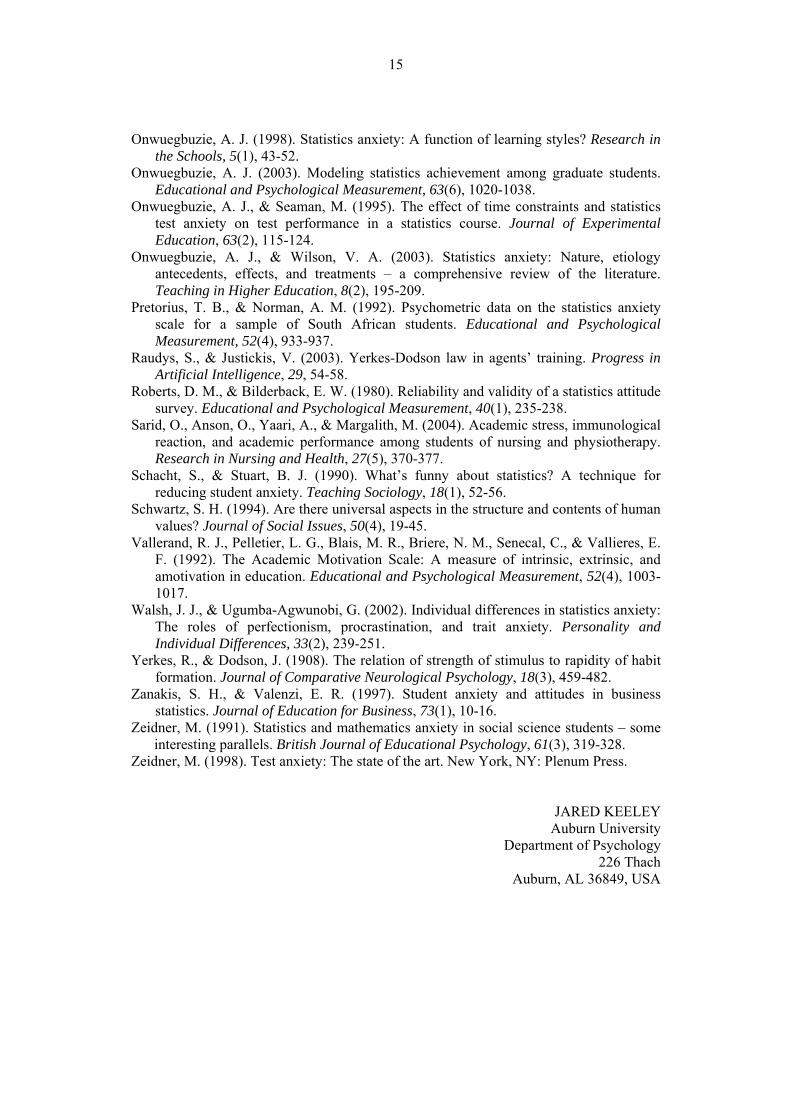
We hypothesized that there would be a curvilinear relationship between anxiety and test performance, with high anxiety and low anxiety being associated with low test scores and mid-level anxiety evidencing the best performance. Specifically, we expected the test anxiety scale to demonstrate most the non-linear relationship, as it is most directly related to test performance conceptually. To test this hypothesis, we conducted hierarchically nested regressions including only a linear term first (Model 1), followed by a model including both a linear and quadratic term (Model 2), so that we may examine incremental improvement in prediction. During the early tests, we saw that performance was not meaningfully related to anxiety, likely due to a ceiling effect with the scores on those two tests being almost a letter grade higher than the others. However, as the term progressed and exam scores dropped, anxiety and test performance became more strongly related. At Test 3, although the relationship between test anxiety and test performance was accounted for using a linear model (Model 1 r² = .10, F(1, 61) = 6.74, p-value = .01), a quadratic model demonstrated a statistically significant improvement (Model 2 r² = .18, F(2, 60) = 6.44, p-value = .003) with the individual quadratic term also demonstrating significance (t(61) = -2.37, p-value = .02). At Test 4, neither model was significant, but again the quadratic accounted for more variance (Model 2 r² = .07, F(2, 61) = 2.37, p-value = .10) than the linear (Model 1 r² = .02, F(1, 62) = 1.59, p-value = .21). For both Test 5 and Test 6, again the relationship with test anxiety was statistically significant using a linear relationship (for Test 5 Model 1 r² = .07, F(1, 62) = 4.43, p-value = .04; Test 6 Model 1 r² = .09, F(1, 60) = 6.08, p-value = .02), but the prediction was improved with the quadratic equation (for Test 5 Model 2 r² = .16, F(2, 61) = 5.88, p-value = .005 and for Test 6 Model 2 r² = .15, F(2, 59) = 5.31, p-value = .008). Both individual coefficients for the quadratic term were statistically significant (for Test 5 t(62) = -2.63, p-value = .01; for Test 6 t(60) = -2.06, p-value = .04). Further, two other anxiety scales were curvilinearly related to the sixth test. Worth of statistics demonstrated a statistically significant linear relationship (Model 1 r² = .20, F(1, 60) = 14.95, p-value < .001) and yet a quadratic term incrementally improved the prediction (Model 2 r² = .25, F(2, 59) = 9.83, p-value < .001); and interpretation anxiety followed the same pattern with the quadratic term improving upon the linear (Model 1 r² = .11, F(1, 59) = 7.04, p-value = .01; Model 2 r² = .18, F(2, 58) = 6.49, p = .003). It is possible that a quadratic equation could fit the data better than a linear and yet not follow the expected pattern (i.e., it could be shaped like a “u” rather than an “n”). All curvilinear relationships followed the pattern of extreme scores evidencing lower performance, with mid-level anxiety showing the highest performance.
11
As an example, the relationship between test anxiety and performance on Test 6 is depicted in Figure 3.
Test Anxiety Scores
0 1 2 3 4 5 6
Scor
es o
n Te
st 6
0
20
40
60
80
100
120
Figure 3. Linear and quadratic predictions of the relationship between test scores and anxiety at the seventh administration
3.3. NEED FOR ACHIEVEMENT
Students reported their need for achievement as starting at a moderately high level at
the first assessment point (M = 5.50 out of a 7 point scale, SD = 0.84), but then dropped to a constant level for every assessment thereafter (M ≈ 4.5, SD ≈ 1.0). A repeated measures ANOVA using the 45 students who completed the measure at every assessment point indicated that this was a statistically significant decline; F(6, 264) = 33.08, p-value < .001, η² = .43.
However, this variable was only moderately related (all r values ≤ .29) to students’ anxiety or test scores across the seven assessment times, with most correlations being true zero order relationships. Only a handful of these correlations were statistically significant (5 out of 48), and if a Bonferroni error correction is used to account for the number of tests conducted, they become statistically insignificant. In an attempt to determine whether differing levels of need for achievement affected test scores, we compared high versus low scorers on the scale as split by the mean score for that assessment time. Identical results occurred with a median split. The six t-tests were all statistically insignificant, with low and high achievement oriented students receiving nearly equal grades on their statistics tests. When low versus high achievement was entered into the repeated measures MANOVA of the six statistics anxiety scales as a between-subjects factor, it did not produce a main effect for any of the scales, nor was there a significant interaction across time for any scale.
4. DISCUSSION
A number of measures have been developed to assess statistics anxiety among
undergraduates, including the Statistics Anxiety Scale (Pretorius & Norman, 1992), the Statistics Anxiety Inventory (Zeidner, 1991), and the STARS (Cruise & Wilkins, 1980).
Linear equationQuadratic equation
12
In their review of available measures, Onwuegbuzie and Wilson (2003) noted that the STARS was the most extensively used and the only one subjected to concurrent validity testing (e.g., Baloglu, 2002; Onwuegbuzie, 2003; Walsh & Ugumba-Agwunobi, 2002), and that the reliability of scores on these measures had not been consistently reported. The current study was designed to evaluate the STARS further with a sample of undergraduates enrolled in a statistics course and addressed three aims. First, the study assessed reliability of STARS scores. Second, it examined the nature and strength of the relationship between statistics anxiety and performance over the course of a semester. Third, the study investigated the potential role of achievement motivation as a moderating factor on the relationship between statistics anxiety and performance.
As in previous studies (Baloglu, 2002; Cruise et al., 1985; Onwuegbuzie, 1998), all six of the original STARS scales displayed scores with good internal reliability. Our data also suggest that scores on each of the six STARS scales are reasonably reliable across seven administrations over the course of the semester, and our results are consistent with previously reported test-retest coefficients (Cruise et al., 1985). When taken as a whole, the existing literature supports the reliability and concurrent validity of the six commonly derived factor scores of the STARS.
A second aim of the study was to examine the relationship between statistics anxiety and performance over the course of the semester. Scores on all six of the statistics anxiety scales decreased statistically significantly over the course of the semester, suggesting that students became less anxious about the perceived value of learning statistics and their own abilities. Zanakis and Valenzi (1997) reported that business students enrolled in a second statistics course reported a decrease in anxiety related to understanding statistics and seeking help. However, the business students actually increased their reported lack of interest and devalued their perceived worth of statistics. They also reported some differences in end-of-semester anxiety ratings across four instructors with different teaching styles and philosophies. More research is needed to determine the degree to which various aspects of statistics anxiety change over time. Because neither our study nor the Zanakis and Velenzi study included a control group, it will be important for future research to determine if changes in anxiety levels are specifically due to enrollment in a statistics course and exposure to material. Other variables that might influence changes in anxiety levels, including prior experience, the structure of the course, the style of the instructor, and the career interests of the students, also should be considered systematically.
In addition to studying changes in anxiety levels over the semester, we assessed the relationship between statistics anxiety and performance over the course of the semester. Several studies have reported a negative relationship between statistics anxiety and course performance (Fitzgerald et al., 1996; Onwuegbuzie & Seaman, 1995; Zanakis & Valenzi, 1997; Zeidner, 1991). Onwuegbuzie and Wilson (2003) hypothesized that statistics anxiety may impair performance by interfering with students’ ability to receive, concentrate on, and encode the terms and concepts presented in class. However, the authors also noted that a certain level of statistics anxiety may actually be beneficial if it motivates adequate preparation. Our results offer some support for this nonlinear relationship between statistics anxiety and performance. As hypothesized, a quadratic equation best captured the relationship between the test anxiety scale of the STARS and performance on the last four exams of the semester, with high and low statistics anxiety corresponding to lower test scores and mid-level anxiety corresponding to the best performance. The worth of statistics and interpretation anxiety scales also showed a curvilinear relationship with performance on the final exam of the semester. It is interesting that the relationship between test anxiety and performance became stronger
13
and more curvilinear after the second exam, given that student performance was lower on all of the subsequent exams. Similarly, the sixth and final exam, which was also the exam on which students performed most poorly, occasioned a curvilinear relationship between performance and the worth of statistics and interpretation scales. Thus, more dimensions of statistics anxiety exhibited the curvilinear relationship with performance as the exams became increasingly difficult. As previously noted, similar patterns have been reported in the literature, with high-anxiety students performing worse under more stressful administration conditions and on more difficult tasks than their low-anxiety counterparts (Onwuegbuzie, 1995; Onwuegbuzie & Seaman, 1995; Zeidner, 1998). However, our data cannot address other factors that may have influenced the relationship between anxiety and performance. For example, as exams became more difficult over the course of the semester, it is likely that the demands from students’ other academic courses also were increasing. Specifically, on the sixth exam, many students determined what score they needed to earn the grade they desired, and studied accordingly. Looking at extraneous factors that may moderate the relationship is particularly important given Onwuegbuzie’s (2003) finding that academic course load is inversely related to statistics performance.
The literature has also investigated the relationship between statistics anxiety and a number of intrinsic variables, including achievement expectation, perfectionism, procrastination, trait anxiety, and state anxiety (Baloglu, 2002; Onwuegbuzie & Wilson, 2003; Walsh & Ugumba-Agwunobi, 2002). As a third and final aim, we were interested in determining what role, if any, achievement motivation might play in the relationship between statistics anxiety and performance. Contrary to our initial hypothesis, need for achievement was not reliably related to performance or statistics anxiety. Given the prevalence of statistics anxiety among student populations, research on both intrinsic and extrinsic factors that moderate the relationship between anxiety and actual performance appears warranted. Additional research on strategies for optimizing levels of anxiety, and managing the consequences of debilitating anxiety, is also clearly warranted.
A number of limitations are worth noting. First, although our findings are consistent with previous experimental research in noting that the relationship between anxiety and performance strengthened as exams became more difficult (Zeidner, 1998), our study did not manipulate or explicitly control for the difficulty of our exams. Second, we did not control for order effects when administering our packets. Third, we used a convenience sample composed primarily of Caucasian females enrolled in our university’s College of Liberal Arts. Future research will need to determine the degree to which our findings generalize to more diverse samples of undergraduates. Finally, the current study was primarily descriptive and exploratory in nature. There are likely a myriad of factors, including task difficulty, student motivation, institutional environment, and others, that play a role in the relationship between anxiety and performance. Hopefully, future work will explore these relations.
Despite these limitations, the results of this study still pose interesting implications for the teaching of undergraduate statistics. Teachers may engage in a variety of techniques to manage their students’ anxiety. For example, teachers may use humor or other gimmicks to reduce anxiety (Schacht & Stuart, 1990). The results of our study suggest that uniformly reducing students’ anxiety may be detrimental. Anxiety is not a fire that needs to be stamped out for students to be successful in a statistics class. Some anxiety is acceptable. For students, simply knowing that some anxiety is acceptable and even helpful may stop them from catastrophizing and increasing the negative effects of the anxiety they do experience. It would be interesting for future research to address the effect of such an intervention in a statistics class.
14
To summarize, our results suggest that STARS scores are a reliable measure of statistics anxiety. Our results also suggest that the relationship between statistics anxiety and performance on in-class exams is quadratic, rather than linear, and the relationship between anxiety and performance becomes stronger as exams become more difficult. Finally and contrary to our initial hypothesis, achievement motivation did not moderate the relationship between statistics anxiety and performance.
ACKNOWLEDGEMENTS
Part of the research presented in this paper was published previously in a poster by the
same authors entitled “Statistics anxiety: Curvilinear versus linear relationships” at the National Institute on the Teaching of Psychology, January 2006.
REFERENCES
Baloglu, M. (2002). Psychometric properties of the Statistics Anxiety Rating Scale.
Psychological Reports, 90(11), 315-325. Bhuian, S. N., Menguc, B., & Borsboom, R. (2005). Stressors and job outcomes in sales:
A triphasic model versus a linear-quadratic-interactive model. Journal of Business Research, 58(2), 141-150.
Bodas, J., & Ollendick, T. H. (2005). Test anxiety: A cross-cultural perspective. Clinical Child and Family Psychology Review, 8(1), 65-88.
Cokley, K. O., Bernard, N., Cunningham, D., & Motoike, J. (2001). A psychometric investigation of the Academic Motivation Scale using a United States sample. Measurement and Evaluation in Counseling and Development, 34(2), 109-119.
Cruise, R., & Wilkins, E. (1980). STARS: Statistical Anxiety Rating Scale. Unpublished manuscript, Andrews University, Michigan.
Cruise, R., Cash, R., & Bolton, D. (1985). Development and validation of an instrument to measure statistical anxiety. ASA Proceedings of the Section on Statistical Education Section (pp. 92-97). Alexandria, VA: American Statistical Association.
Feather, N. T., Norman, M. A., & Worsley, A. (1998). Values and valences: Variables related to the attractiveness and choice of food in different contexts. Journal of Applied Social Psychology, 28(7), 639-656.
Fitzgerald, S., Jurs, S., & Hudson, L. (1996). A model predicting statistics achievement among graduate students. College Student Journal, 30, 361-366.
Hopko, D. R., McNeil, D. W., Lejuez, C. W., Ashcraft, M. H., Eifert, G. H., & Riel, J. (2003). The effects of anxious responding on mental arithmetic and lexical decision task performance. Journal of Anxiety Disorders, 17(6), 647-665.
Kais, K., & Raudsepp, L. (2004). Cognitive and somatic anxiety and self-confidence in athletic performance of beach volleyball. Perceptual and Motor Skills, 98(2), 439-449.
Maes, J. H. R., & de Groot, G. (2003). Effects of noise on the performance of rats in an operant discrimination task. Behavioural Processes, 61(1), 57-68.
McNally, R. J. (2003). Psychological mechanisms in acute response to trauma. Biological Psychiatry, 53(9), 779-788.
Norton, P. J., Hope, D. A., & Weeks, J. W. (2004). The Physical Activity and Sport Anxiety Scale (PASAS): Scale development and psychometric analysis. Anxiety Stress and Coping, 17(4), 363-382.
Onwuegbuzie, A. J. (1995). Statistics test anxiety and female students. Psychology of Women Quarterly, 19(3), 413-418.
15
Onwuegbuzie, A. J. (1998). Statistics anxiety: A function of learning styles? Research in the Schools, 5(1), 43-52.
Onwuegbuzie, A. J. (2003). Modeling statistics achievement among graduate students. Educational and Psychological Measurement, 63(6), 1020-1038.
Onwuegbuzie, A. J., & Seaman, M. (1995). The effect of time constraints and statistics test anxiety on test performance in a statistics course. Journal of Experimental Education, 63(2), 115-124.
Onwuegbuzie, A. J., & Wilson, V. A. (2003). Statistics anxiety: Nature, etiology antecedents, effects, and treatments – a comprehensive review of the literature. Teaching in Higher Education, 8(2), 195-209.
Pretorius, T. B., & Norman, A. M. (1992). Psychometric data on the statistics anxiety scale for a sample of South African students. Educational and Psychological Measurement, 52(4), 933-937.
Raudys, S., & Justickis, V. (2003). Yerkes-Dodson law in agents’ training. Progress in Artificial Intelligence, 29, 54-58.
Roberts, D. M., & Bilderback, E. W. (1980). Reliability and validity of a statistics attitude survey. Educational and Psychological Measurement, 40(1), 235-238.
Sarid, O., Anson, O., Yaari, A., & Margalith, M. (2004). Academic stress, immunological reaction, and academic performance among students of nursing and physiotherapy. Research in Nursing and Health, 27(5), 370-377.
Schacht, S., & Stuart, B. J. (1990). What’s funny about statistics? A technique for reducing student anxiety. Teaching Sociology, 18(1), 52-56.
Schwartz, S. H. (1994). Are there universal aspects in the structure and contents of human values? Journal of Social Issues, 50(4), 19-45.
Vallerand, R. J., Pelletier, L. G., Blais, M. R., Briere, N. M., Senecal, C., & Vallieres, E. F. (1992). The Academic Motivation Scale: A measure of intrinsic, extrinsic, and amotivation in education. Educational and Psychological Measurement, 52(4), 1003-1017.
Walsh, J. J., & Ugumba-Agwunobi, G. (2002). Individual differences in statistics anxiety: The roles of perfectionism, procrastination, and trait anxiety. Personality and Individual Differences, 33(2), 239-251.
Yerkes, R., & Dodson, J. (1908). The relation of strength of stimulus to rapidity of habit formation. Journal of Comparative Neurological Psychology, 18(3), 459-482.
Zanakis, S. H., & Valenzi, E. R. (1997). Student anxiety and attitudes in business statistics. Journal of Education for Business, 73(1), 10-16.
Zeidner, M. (1991). Statistics and mathematics anxiety in social science students – some interesting parallels. British Journal of Educational Psychology, 61(3), 319-328.
Zeidner, M. (1998). Test anxiety: The state of the art. New York, NY: Plenum Press.
JARED KEELEY
Auburn University Department of Psychology
226 Thach Auburn, AL 36849, USA
16
ASSESSING TEACHERS’ DISCOURSE ABOUT THE PRE-K–12 GUIDELINES FOR ASSESSMENT AND
INSTRUCTION IN STATISTICS EDUCATION (GAISE)3
RANDALL E. GROTH Salisbury University
ABSTRACT This paper starts from the premise that teachers’ discourse communities influence how ideas for reform are implemented. In order to understand some of the discourse surrounding the reforms proposed by GAISE, an online focus group activity was conducted. The focus group consisted of pre-service and practicing teachers responsible for teaching statistics at various grade levels. Focus group discourse was used to formulate a set of working hypotheses about actions that need to be taken to facilitate the implementation of GAISE. Working hypotheses emphasized that statistics educators need to play roles in developing teachers’ content knowledge, helping teachers understand the differences between mathematics and statistics, deepening teachers’ pedagogical knowledge, building teachers’ curricular knowledge, and influencing the writing of state-level standards. Keywords: Statistics education research; Educational standards; Teachers’ perceptions; Qualitative research; Focus groups
1. BACKGROUND The past two decades have seen a proliferation of educational standards documents.
Among the first of these was Curriculum and Evaluation Standards for School Mathematics (NCTM, 1989). It was followed by companion standards documents for teaching (NCTM, 1991) and assessment (NCTM, 1995). These three NCTM Standards documents were used as the basis for Principles and Standards for School Mathematics (NCTM, 2000). NCTM then attempted to provide further focus and coherence for school mathematics curricula with the release of Curriculum Focal Points (NCTM, 2006). Although recommendations for statistics curricula were included in each of the NCTM Standards documents, the statistics education community has recently provided a more detailed vision for the substance of Pre-K-12 statistics with the release of the Guidelines for Assessment and Instruction in Statistics Education (GAISE) report (Franklin et al., 2007).
The Pre-K-12 GAISE report describes three developmental levels (A, B, and C) through which students should progress as they study statistics in school. As they move through the levels, they study progressively more sophisticated ideas about concepts like experimental design, variability, and descriptive statistics. The three level descriptions essentially help flesh out the NCTM (2000) recommendations for data analysis concepts that should be learned in the Pre-K-2, 3-5, 6-8, and 9-12 grade bands. The GAISE document also elaborates upon pedagogical principles for teaching statistics by offering a framework for statistical problem solving. The framework consists of four interrelated Statistics Education Research Journal, 7(1), 16-39, http://www.stat.auckland.ac.nz/serj © International Association for Statistical Education (IASE/ISI), May, 2008
17
processes: formulating questions, collecting data, analyzing data, and interpreting results. These four processes are to be employed at each of the three developmental levels. The GAISE pedagogical recommendations are built upon current discourse themes within the statistics education community, including:
• Statistical literacy should be a prominent curricular goal because of the central role it plays in democratic citizenship, personal choices, careers, and evaluating scientific findings.
• Statistics and mathematics differ as disciplines. Statistics utilizes mathematics but should not be mistaken for a branch of mathematics.
• The study of variability should have a central role in school statistics. Students should understand a variety of types of variability, including measurement, natural, induced, and sampling variability.
• Statistical problem-solving is heavily reliant upon context. It is not possible to give plausible interpretations of data without some knowledge of the context that generated them.
• Pre-college experiences with statistics require an intuitive grasp of probability. Probability is an important tool in statistical analysis, but doing mathematical probability problems should not be mistaken for doing data analysis.
Many of the themes in the list above are more pronounced in the GAISE document than they are in previous curricular recommendations for teaching statistics, such as the NCTM Standards and Curriculum Focal Points.
As statistics educators become more involved in writing curriculum standards like GAISE, an important lesson learned by mathematics educators during the writing and release of the NCTM Standards documents should be kept in mind: The audience for a curriculum standards document often interprets the document in ways its writers may not expect. For example, the Curriculum and Evaluation Standards for School Mathematics sparked the “math wars” of the past two decades because its writers saw the document as an endorsement of a richer view of mathematics than what was provided by conventional curricula, but critics saw it as a retreat from rigorous mathematics (Schoen, Fey, Hirsch, & Coxford, 1999; Schoenfeld, 2004). This controversy continued through the release of Principles and Standards for School Mathematics. When NCTM released Curriculum Focal Points, some readers interpreted it to be a reversal of the positions taken in the previous NCTM Standards documents, whereas its writers saw it as providing guidance for organizing curricula to attain those very standards (Fennell, 2007). Those who write and revise curriculum standards documents must grapple with the reality that their work will be interpreted in different ways by readers.
Of all the audiences to which a standards document must speak, the teacher audience is perhaps the most vital. Tyack and Cuban (1995) argued, “If the aims of reform seem vague, contradictory, or unattainable, educators often respond by turning reforms into something they already know how to do” (p. 64). Tyack and Cuban’s argument is supported by empirical data from the field of mathematics education. For example, in one study, Remillard and Bryans (2004) described the case of a teacher who was asked to implement a reform-oriented mathematics curriculum. The teacher responded by continuing to use a more traditional textbook as his guiding instructional framework and using the reform-oriented text as an occasional supplement. In another study, Lloyd and Behm (2005) found that pre-service teachers tended to seek out familiar, traditional instruction components when asked to analyze both reform-oriented and traditional texts. The Remillard and Bryans (2004) and Lloyd and Behm (2005) studies are not isolated or unusual instances. Several other studies have shown that teachers often perceive reform recommendations as small supplements or revisions to their existing pedagogical thinking
18
frameworks rather than recommendations for larger-scale changes in thinking (Groth, 2007; Lambdin & Preston, 1995; Spillane & Zeulli, 1999). The result is that there has been a persistent gap between the mathematics curriculum intended by reform and the curriculum actually implemented by teachers (Usiskin & Dossey, 2004).
In order to minimize the gap between the “intended curriculum” in Pre-K-12 statistics (i.e., the GAISE report) and the “implemented curriculum,” it is important to attend to teachers’ perceptions of the “intended curriculum.” Because the degree of implementation of a reform depends heavily upon how teachers perceive it, gauging teachers’ perceptions of GAISE is a vital step in the eventual large-scale implementation of its recommendations. Listening to teachers’ perceptions can help reveal both barriers and inroads to the implementation of GAISE recommendations. Therefore, this article will focus upon the exploration of teachers’ interpretations of the Pre-K-12 GAISE report in order to help move Pre-K-12 statistics education toward attaining the curricular vision set forth in the document.
2. THE ROLE OF PROFESSIONAL DISCOURSE COMMUNITIES
IN THE PERCEPTION OF REFORM RECOMMENDATIONS It is common to speak of “dissemination” of standards and educational reform
recommendations as a one-way process: Reformers write recommendations and then send them to teachers for implementation. Lesh and Lovitts (2000) argued that this is not an accurate depiction of communication between researchers and teachers:
In mathematics and science education, the flow of information between researchers and practitioners is not the kind of one-way process that is suggested by such terms as information dissemination. Instead, to be effective, the flow of information usually must be cyclic, iterative, and interactive. (p. 53)
This viewpoint suggests that researchers have at least as much to learn from teachers as teachers have to learn from researchers. Researchers and teachers both have a hand in shaping reform. Researchers may have the primary responsibility for drafting curriculum and reform recommendations, but teachers have the primary responsibility for translating those ideas to the classroom. Therefore, the ultimate impact of a document such as GAISE depends upon how its recommendations are perceived by teachers. In order to fully understand teachers’ perceptions and interpretations of a document like GAISE, it is not sufficient to study teachers in isolation from one another. As Lesh and Lovitts (2000) argued,
All of these individuals [e.g., teachers] involve systems that are more like complex and continually adapting biological systems than they are like simple machines. In each case, the system as a whole is more than the sum of its parts; the parts interact in complex and recursive ways, and, when actions are applied to these systems, the systems react. (p. 54)
From this perspective, teachers’ discourse with one another provides a powerful lens for examining perceptions of reform proposals like GAISE because their perceptions can be studied in the context of interaction with other practitioners. Lesh and Lovitts’ (2000) view acknowledges that such perceptions do not develop in a vacuum, but are shaped within the context of the discourse communities that teachers inhabit. Perception, interpretation, and practice can be understood as having collective aspects rather than being understood as strictly individual processes. Literature on teacher education bears out the idea that teachers’ discourse communities exert influence and shape beliefs and practices. At times, these discourse communities have been spoken of in a positive vein, as when Davis and Simmt (2003)
19
described how interactions among teachers led to the solution of a problem that none of them would have been likely to solve individually. Also, the idea of a “community of practice” (Lave & Wenger, 1991) is often (although not always) invoked to emphasize the idea that teachers can begin to more successfully navigate the task of teaching by learning from one another’s experiences. On the other hand, teachers’ discourse communities have also, at times, been viewed in a more negative light. For example, Putnam and Borko (2000) argued, “patterns of classroom teaching and learning have historically been resistant to fundamental change, in part because schools have served as powerful discourse communities that enculturate participants (students, teachers, administrators) into traditional school activities and ways of thinking” (p. 8). Stigler and Hiebert (1999) expressed a similar sentiment in portraying mathematics teaching in the United States as a cultural system that is highly resistant to change. These examples help to illustrate, for better or for worse, teachers’ pedagogical thinking is situated within collective discourse systems. Given that discourse among practitioners plays a fundamental role in shaping beliefs and practices, for the present study it is important to consider the types of conversations that may provide insight about teachers’ perceptions of the GAISE document. Greeno (2003) suggested that it may be helpful to examine how teachers use standards documents when designing curriculum and when carrying on reflective conversations with one another. He hypothesized a set of questions that may come up during reflective discourse about educational reform recommendations:
• What are we accomplishing now? • What could we accomplish that we would value if we changed our practices? • Why would that accomplishment be valuable? • What would our changed practices look like? • What resources would we need to accomplish these changes? • In the process, what would be lost that we would regret? (p. 305).
The above set of questions goes beyond simply discussing the content of reform recommendations to forming a collective vision of the implications of a proposed reform. In turn, teachers’ discourse around this set of questions is likely to provide insight about how they perceive reform proposed by standards documents.
3. METHODOLOGY 3.1. STUDY DESIGN
Given that teachers’ perceptions of GAISE as situated within professional discourse
communities were of interest in the present study, a focus group interview involving teachers was used as the primary means for collecting data. Morgan (1997) defined a focus group as “a research technique that collects data through group interaction on a topic determined by the researcher…it is the researcher’s interest that provides the focus, whereas the data themselves come from group interaction” (p. 6). Focus group interviewing has been utilized frequently in business and marketing (Greenbaum, 1993), but has recently been employed widely for qualitative research in social sciences such as education and psychology (Vaughn, Schumm, & Sinagub, 1996). Focus groups are not intended to produce statistically generalizable conclusions, although some researchers recommend using focus group findings to produce questions for surveys administered to a sample of a population of interest (Fuller, Edwards, Vorakitphokatorn, & Sermsri, 1993; Rossi, Wright, & Anderson, 1993). Instead, the primary value of focus groups is that they provide the opportunity to observe complex group interactions about a topic of interest at
20
a level of detail and degree of efficiency not afforded by other methods like individual clinical interviews or even classroom observations (Morgan, 1997).
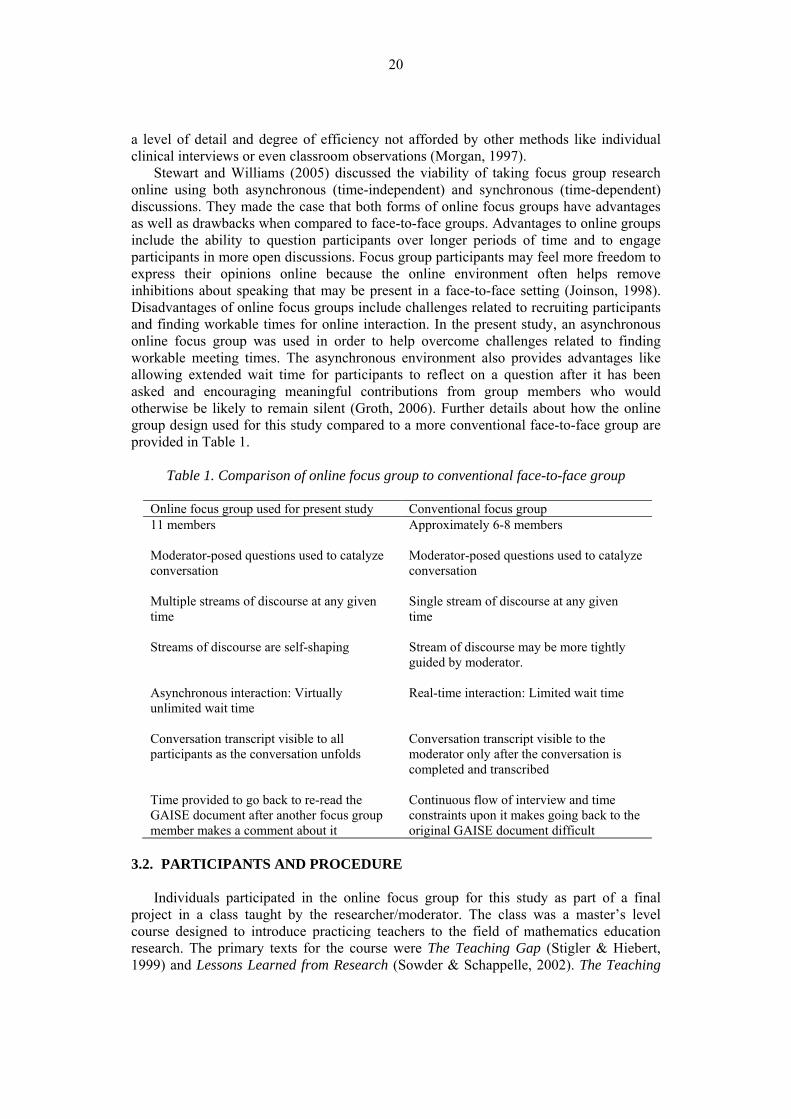
Stewart and Williams (2005) discussed the viability of taking focus group research online using both asynchronous (time-independent) and synchronous (time-dependent) discussions. They made the case that both forms of online focus groups have advantages as well as drawbacks when compared to face-to-face groups. Advantages to online groups include the ability to question participants over longer periods of time and to engage participants in more open discussions. Focus group participants may feel more freedom to express their opinions online because the online environment often helps remove inhibitions about speaking that may be present in a face-to-face setting (Joinson, 1998). Disadvantages of online focus groups include challenges related to recruiting participants and finding workable times for online interaction. In the present study, an asynchronous online focus group was used in order to help overcome challenges related to finding workable meeting times. The asynchronous environment also provides advantages like allowing extended wait time for participants to reflect on a question after it has been asked and encouraging meaningful contributions from group members who would otherwise be likely to remain silent (Groth, 2006). Further details about how the online group design used for this study compared to a more conventional face-to-face group are provided in Table 1.
Table 1. Comparison of online focus group to conventional face-to-face group
Online focus group used for present study Conventional focus group 11 members Approximately 6-8 members Moderator-posed questions used to catalyze conversation
Moderator-posed questions used to catalyze conversation
Multiple streams of discourse at any given time
Single stream of discourse at any given time
Streams of discourse are self-shaping Stream of discourse may be more tightly guided by moderator.
Asynchronous interaction: Virtually unlimited wait time
Real-time interaction: Limited wait time
Conversation transcript visible to all participants as the conversation unfolds
Conversation transcript visible to the moderator only after the conversation is completed and transcribed
Time provided to go back to re-read the GAISE document after another focus group member makes a comment about it
Continuous flow of interview and time constraints upon it makes going back to the original GAISE document difficult
3.2. PARTICIPANTS AND PROCEDURE
Individuals participated in the online focus group for this study as part of a final project in a class taught by the researcher/moderator. The class was a master’s level course designed to introduce practicing teachers to the field of mathematics education research. The primary texts for the course were The Teaching Gap (Stigler & Hiebert, 1999) and Lessons Learned from Research (Sowder & Schappelle, 2002). The Teaching

21
Gap describes, in detail, how mathematics teaching practices in the United States differ from those in other countries, especially Japan. Lessons Learned from Research is a compilation of condensed articles from the Journal for Research in Mathematics Education. All participants were given the option to have their comments excluded from the study without harming their semester grade, but all of them provided consent for their comments to be used for the purpose of the research.
The focus group activity to be described in this paper represented participants’ most prolonged and substantive contact with recent ideas from statistics education. Up to this point, they had done just two brief activities directly related to statistics education: evaluating the quality of several different statistics items appearing on standardized tests and discussing a condensed version of the Watson and Moritz (2000) study on students’ understanding of statistical sampling.
Participants’ career responsibilities outside the class represented a variety of different grade levels relevant to the Pre-K-12 GAISE guidelines. Each participant was asked to read the introduction and framework for the Pre-K-12 GAISE report before participating in the online focus group. They were also asked to read the developmental level description from the report (level A, B, or C) most relevant to their career interests. A summary of participants’ grade-level responsibilities and the GAISE levels they selected to read is provided in Table 2. Table 2 also shows that all teachers participating in the study had seven or fewer years of teaching experience. Hence, the study can be understood as representing the perceptions of a group of relatively new teachers.
Table 2. Summary of characteristics of focus group participants
Pseudonym Grade levels taught Number of years teaching GAISE level of
interest Andrea Elementary resource teacher 1 A Alex 1, 5 One semester of student
teaching A
Amanda 2, 3, 4 7 A Amy 5 4 A Becky Pre-service secondary teacher 0 B Brenda 6 2 B Brandon 6 5 B Cecil 8 1 C Candice Pre-service secondary teacher 0 C Chad 10 1 C Cindy Community College 1 C
In order to engage teachers in conversation that would elicit their perceptions of the
GAISE document, the online focus group was set up to foster participation in curriculum design and reflective discourse (Greeno, 2003) centered on GAISE recommendations. Toward this end, two types of asynchronous online interaction were set up for the activity: the collaborative construction of a wiki (an online document that can be easily revised by any participant in the group) and contribution of comments to a discussion board. On the wiki, participants were to write criteria that they would use to ensure that textbooks or curriculum materials were aligned with GAISE recommendations. On the discussion board, participants were to carry on reflective discourse about the recommendations given in the document. The researcher/moderator provided a set of questions, adapted from Greeno (2003), to catalyze this conversation. The manner in which Greeno’s questions were adapted to the present study is shown in the fourth bullet point in Appendix A, along with the full set of instructions that were given to participants for the activity.
22
3.3. DATA GATHERING AND ANALYSIS As noted in the assignment description in Appendix A, the wiki and discussion board portions of the website for the online focus group were open for a period of two weeks. All contributions to the wiki and the discussion board made during the two week time frame were retained for analysis. The finished wiki consisted of a series of questions that participants would use to evaluate whether or not a text or set of curriculum materials was aligned with GAISE recommendations, and the discussion board contained responses to the questions for reflective discourse posed in the assignment description. At the end of the two weeks, the finished wiki and the discussion board transcript were loaded into the software program ATLAS.ti (Muhr, 2004) to facilitate qualitative data analysis and coding. The completed wiki was analyzed in order to discern how participants would use GAISE for a curriculum design task, and the discussion board was analyzed to provide insight about the types of reflective discourse catalyzed by GAISE. Qualitative data analysis was done first on the finished wiki from the focus group website. The data analysis process for the wiki can best be described as consisting of open coding followed by axial coding (Strauss & Corbin, 1990). During open coding, the researcher began by reading the criteria for evaluating statistics curriculum materials that participants had posted to the wiki and then assigned a conceptual label to each criterion posted. For example, one participant posted the criterion, “Does the text incorporate cooperative learning activities and areas for open discussion about students’ individual thinking?” This criterion was given the conceptual label, “student-to-student discourse.” Another participant posted the criterion, “Does the textbook include activities that utilize technology such as a graphing utility or computer program?” This criterion was given the conceptual label “technology usage.” After all criteria posted to the wiki had been assigned conceptual labels during the open coding process, the researcher looked for similarities among codes assigned during open coding and clustered conceptually-similar codes into categories (i.e., axial coding). For example, segments of text given the label “student-to-student discourse” during the open coding process were clustered together with those given the label “technology usage” because both pertained to how GAISE-aligned teaching should be carried out. This larger cluster of codes was given the label “learning process-related concerns,” partially to distinguish it from a different large cluster that pertained to what content should be included in a GAISE-aligned curriculum. The larger axial clusters were not mutually exclusive (e.g., some criterion posted to the wiki contained statements about what should be taught as well as how it should be taught). The wiki coding process produced five large clusters summarizing and characterizing teachers’ use of GAISE for a statistics curriculum design task, and the nature of each cluster is described in the results section of this paper. The discussion board portion of the focus group website was analyzed after qualitative data analysis on the wiki had been completed. To facilitate coding of the discussion board dialogue, a set of start codes (Miles & Huberman, 1994) was created. The start codes were based on the six questions for reflective discussion that were posed in the assignment description shown in Appendix A. Each discussion board post was labeled according to which of the moderator-posed questions it addressed. For example, one participant commented, “As of right now, there is an intro to statistics that is incorporated in Algebra I. Otherwise usually only a handful of juniors or seniors in high school end up coming close to getting Level C.” This comment was labeled as addressing the moderator-posed question that asked participants to compare GAISE recommendations to present practices. Each post was also assigned a more descriptive conceptual code in order to distinguish among different areas of focus that were pursued
23
in responding to the moderator-posed questions. For example, the participant comment mentioned earlier in this paragraph was given the label “how GAISE recommendations could fit within existing mathematics curricula” to distinguish it from other categories of comments comparing GAISE to present practice (e.g., “how GAISE recommendations could fit within non-mathematics curricula” and “how GAISE recommendations could fit within existing standardized testing constraints”). In some cases, individual discussion posts were assigned a number of different codes because they contained thoughts that addressed different moderator-posed questions or discussed different aspects of a single moderator-posed question. Collectively, the categories of response formed through data analysis helped shed light on the type of reflective discourse about GAISE recommendations occurring within the focus group.
4. RESULTS
The results reported in this section are divided into two sub-sections. The first
subsection presents results from the wiki portion of the online focus group activity, which concentrated upon using GAISE to design a document that could be used to evaluate statistics curriculum materials and textbooks. The second subsection presents results from the discussion board portion of the online focus group activity, which was intended to spark reflective discourse about the GAISE recommendations. Collectively, the results reported in the two sub-sections help reveal prominent features of teachers’ conceptions of the GAISE document. Spelling and punctuation mistakes in posts participants made online have been corrected in this section.
4.1. USING GAISE AS THE BASIS FOR A DESIGN TASK: WIKI ANALYSIS At the end of the focus group activity, participants had posted a set of 38 criteria that could be used to determine the extent to which a curriculum or text is aligned with the vision set forth in GAISE. Five main categories were apparent in the criteria:
• Content-related concerns (pertaining to what is to be taught) • Process-related concerns (pertaining to how content is to be taught) • Teacher support (resources that should be available to support curriculum
implementation) • Accessibility of the materials (dealing with clarity and understandability) • Credibility of the materials (pertaining to authors’ credentials and correctness of
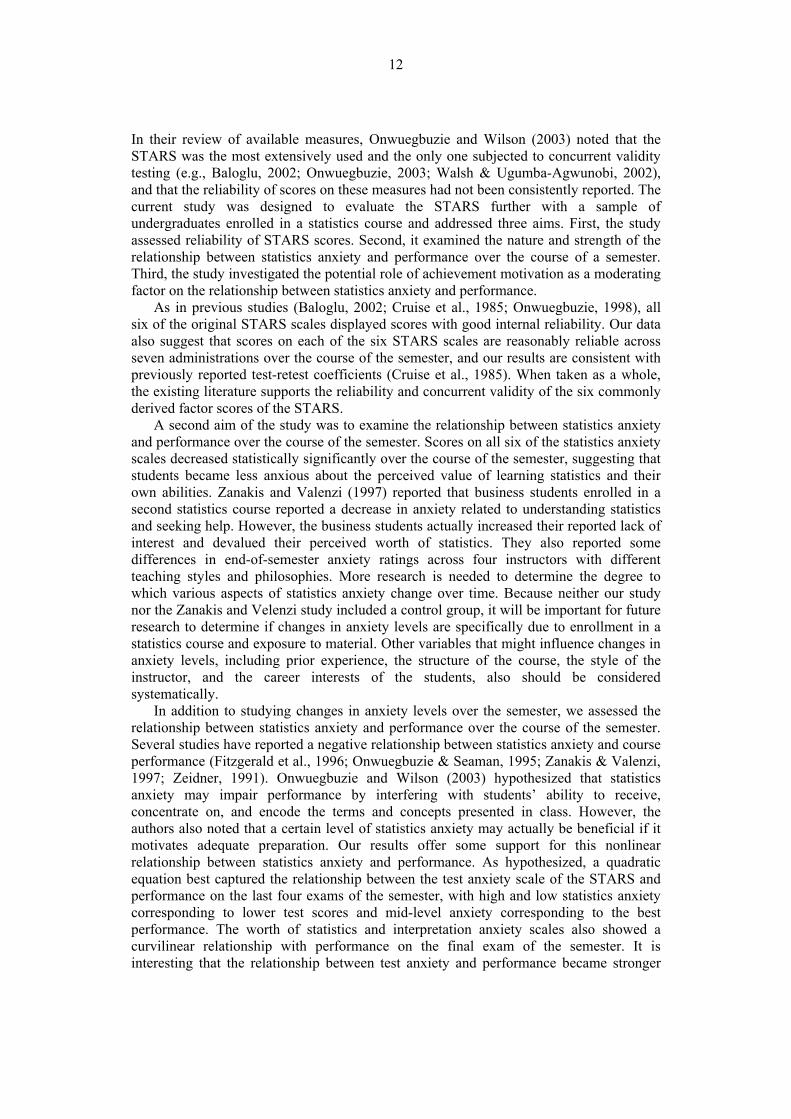
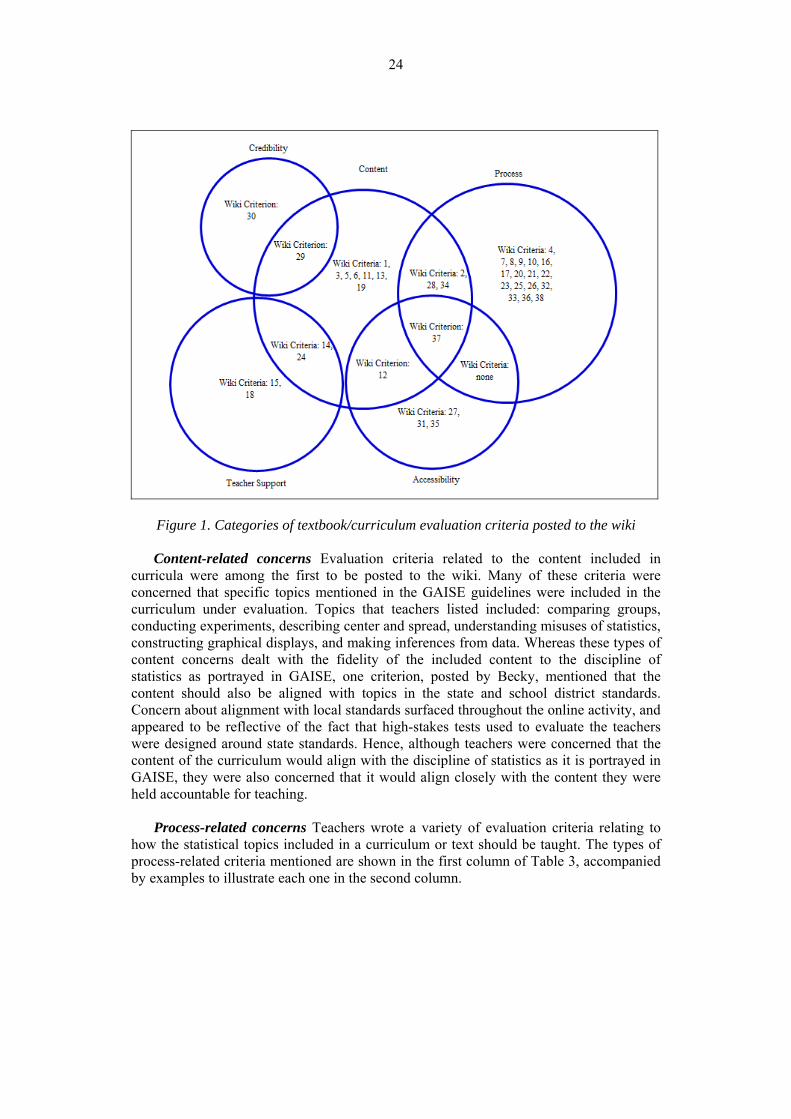
content presentation). Some of the criteria that participants posted fit into more than one of the five categories. The Venn Diagram shown in Figure 1 illustrates the manner in which categories of criteria related to one another. Each number inside the Venn Diagram represents one of the criterion posted to the wiki and shows its order of occurrence in the discussion. The text following Figure 1 further describes the characteristics of the criteria fitting within each of the regions in the Venn Diagram.
24
Figure 1. Categories of textbook/curriculum evaluation criteria posted to the wiki Content-related concerns Evaluation criteria related to the content included in
curricula were among the first to be posted to the wiki. Many of these criteria were concerned that specific topics mentioned in the GAISE guidelines were included in the curriculum under evaluation. Topics that teachers listed included: comparing groups, conducting experiments, describing center and spread, understanding misuses of statistics, constructing graphical displays, and making inferences from data. Whereas these types of content concerns dealt with the fidelity of the included content to the discipline of statistics as portrayed in GAISE, one criterion, posted by Becky, mentioned that the content should also be aligned with topics in the state and school district standards. Concern about alignment with local standards surfaced throughout the online activity, and appeared to be reflective of the fact that high-stakes tests used to evaluate the teachers were designed around state standards. Hence, although teachers were concerned that the content of the curriculum would align with the discipline of statistics as it is portrayed in GAISE, they were also concerned that it would align closely with the content they were held accountable for teaching.
Process-related concerns Teachers wrote a variety of evaluation criteria relating to
how the statistical topics included in a curriculum or text should be taught. The types of process-related criteria mentioned are shown in the first column of Table 3, accompanied by examples to illustrate each one in the second column.
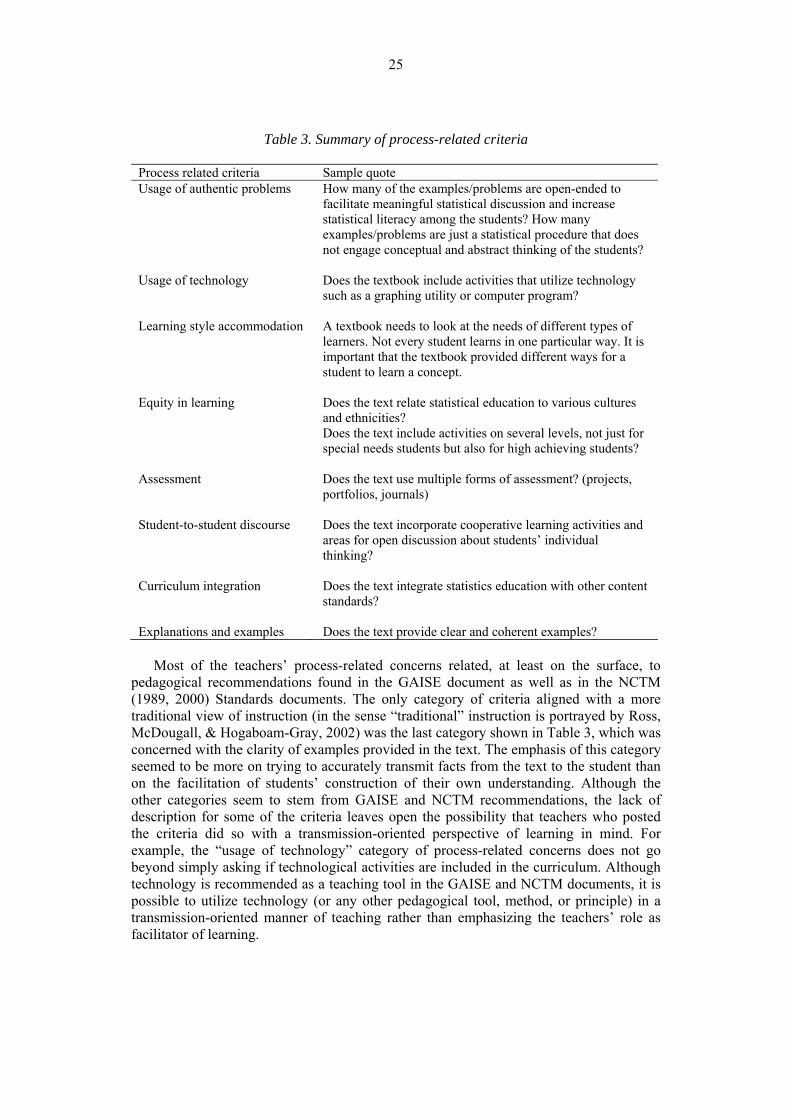
25
Table 3. Summary of process-related criteria
Process related criteria Sample quote Usage of authentic problems How many of the examples/problems are open-ended to
facilitate meaningful statistical discussion and increase statistical literacy among the students? How many examples/problems are just a statistical procedure that does not engage conceptual and abstract thinking of the students?
Usage of technology Does the textbook include activities that utilize technology such as a graphing utility or computer program?
Learning style accommodation A textbook needs to look at the needs of different types of learners. Not every student learns in one particular way. It is important that the textbook provided different ways for a student to learn a concept.
Equity in learning Does the text relate statistical education to various cultures and ethnicities? Does the text include activities on several levels, not just for special needs students but also for high achieving students?
Assessment Does the text use multiple forms of assessment? (projects, portfolios, journals)
Student-to-student discourse Does the text incorporate cooperative learning activities and areas for open discussion about students’ individual thinking?
Curriculum integration Does the text integrate statistics education with other content standards?
Explanations and examples Does the text provide clear and coherent examples?
Most of the teachers’ process-related concerns related, at least on the surface, to pedagogical recommendations found in the GAISE document as well as in the NCTM (1989, 2000) Standards documents. The only category of criteria aligned with a more traditional view of instruction (in the sense “traditional” instruction is portrayed by Ross, McDougall, & Hogaboam-Gray, 2002) was the last category shown in Table 3, which was concerned with the clarity of examples provided in the text. The emphasis of this category seemed to be more on trying to accurately transmit facts from the text to the student than on the facilitation of students’ construction of their own understanding. Although the other categories seem to stem from GAISE and NCTM recommendations, the lack of description for some of the criteria leaves open the possibility that teachers who posted the criteria did so with a transmission-oriented perspective of learning in mind. For example, the “usage of technology” category of process-related concerns does not go beyond simply asking if technological activities are included in the curriculum. Although technology is recommended as a teaching tool in the GAISE and NCTM documents, it is possible to utilize technology (or any other pedagogical tool, method, or principle) in a transmission-oriented manner of teaching rather than emphasizing the teachers’ role as facilitator of learning.
26
Overlap between content and process The GAISE document’s “statistical problem solving framework” and its idea of developmental levels helped stimulate some teachers’ thinking in the intersection of content and process. One criterion posted to the wiki by Alex stated that a text should include opportunities not only to study specific content, but to do so in a way that aligns with the investigative process of formulating a question, collecting data to answer a question, analyzing the data, and interpreting the results. Other criteria posted to the wiki stated that teaching strategies suggested by a curriculum should be arranged to develop students’ understanding of certain content using the progression suggested by the document. For example, Cecil wrote, “Does the text make clear what material is appropriate at what level, e.g., dotplot/stem and leaf plots introduced at level A and bar graphs (histograms) at level B?” This particular comment reflected some attention to the GAISE recommendation that individual data values should be visible to students when they first learn to construct statistical displays. In general, criteria in the intersection between content and process considered what should be taught simultaneously with how it should be taught. Therefore, such criteria more fully reflected the sort of thinking that teachers need to do everyday in considering what to teach along with how to teach it. An examination of Figure 1 reveals, however, that there were relatively few criteria posted lying in the intersection between content and process when compared to those concerned with just content or just process.
Teacher support Some criteria posted to the wiki reflected the belief that textbooks
should come with materials to help teachers carry out the recommended curriculum. One such criterion posted by Cindy simply stated, “Does the textbook have supplementary materials for the students and/or instructors?” A criterion posted by Becky was more specific in what teachers might wish to gain from supplementary materials, stating “Do the text materials provide opportunities for the instructor or teacher to increase their own understanding of the mathematics ideas that students are studying?” The latter criterion reflects a desire for supplementary materials to play a role in developing teachers’ content knowledge along with students’ content knowledge. In so doing, it resonated with the observation of the Conference Board of the Mathematical Sciences (2001) that teachers often need substantial content knowledge development in order to be able to teach statistics effectively.
Overlap between teacher support and content Two of the criteria posted to the wiki
mentioned specific content considerations that teachers would expect to find in teacher support materials. In the first of the two, Cindy wrote, “Is there an opportunity for students to perform experiments (empirical data) in collecting and analyzing data? Are the experiments contained in the textbook or supplementary materials?” In the second of the two, Brenda wrote, “Is a scope and sequence included to show where other mathematical topics can be included in relation to the statistics material?” Whereas the first of the two criteria in this overlap area seeks to remove some burden from the teacher in regard to incorporating content into specific lessons, the second seeks to help the teacher understand where all of the content to be included may fit within the broader context of the entire course.
Accessibility Concerns about the accessibility of a text or curriculum series were
posted to the wiki. These concerns appeared to stem from teachers’ own experiences rather than anything mentioned specifically in the GAISE guidelines. Abby, for example, wrote a criterion related to the reading level of the text: “Is the reading level appropriate for all students?” Another accessibility criterion posted by Abby related to organization:
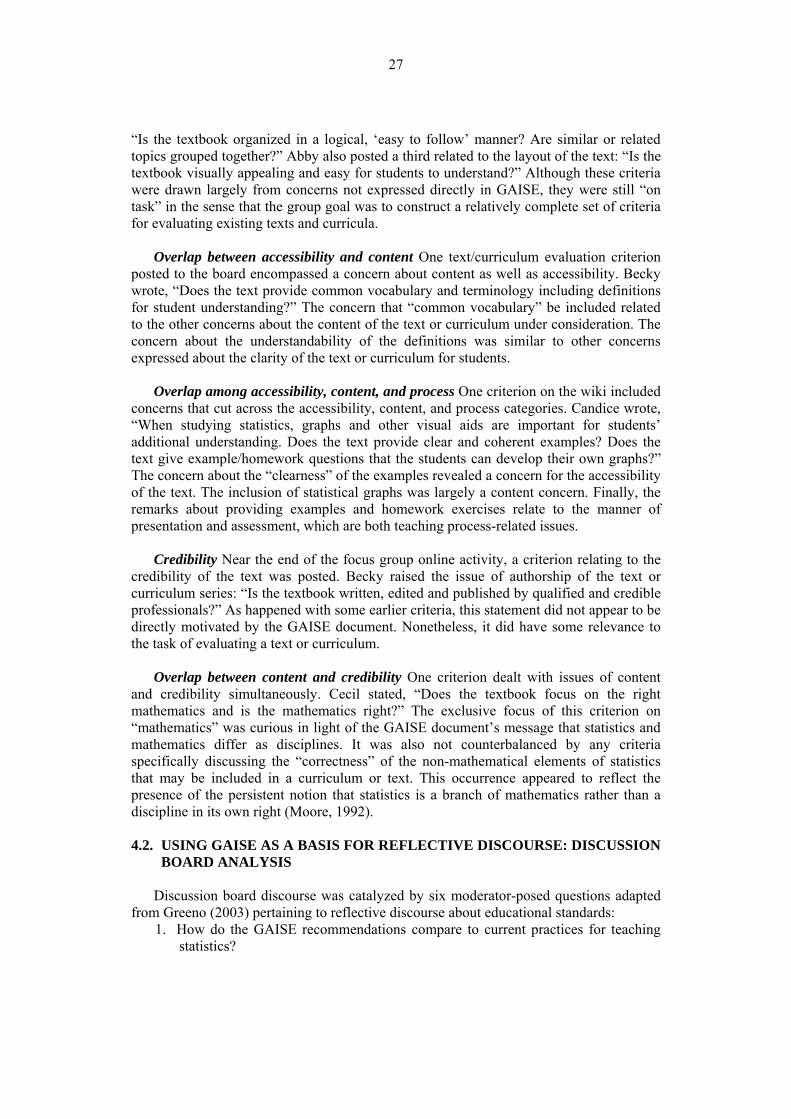
27
“Is the textbook organized in a logical, ‘easy to follow’ manner? Are similar or related topics grouped together?” Abby also posted a third related to the layout of the text: “Is the textbook visually appealing and easy for students to understand?” Although these criteria were drawn largely from concerns not expressed directly in GAISE, they were still “on task” in the sense that the group goal was to construct a relatively complete set of criteria for evaluating existing texts and curricula.
Overlap between accessibility and content One text/curriculum evaluation criterion
posted to the board encompassed a concern about content as well as accessibility. Becky wrote, “Does the text provide common vocabulary and terminology including definitions for student understanding?” The concern that “common vocabulary” be included related to the other concerns about the content of the text or curriculum under consideration. The concern about the understandability of the definitions was similar to other concerns expressed about the clarity of the text or curriculum for students.
Overlap among accessibility, content, and process One criterion on the wiki included
concerns that cut across the accessibility, content, and process categories. Candice wrote, “When studying statistics, graphs and other visual aids are important for students’ additional understanding. Does the text provide clear and coherent examples? Does the text give example/homework questions that the students can develop their own graphs?” The concern about the “clearness” of the examples revealed a concern for the accessibility of the text. The inclusion of statistical graphs was largely a content concern. Finally, the remarks about providing examples and homework exercises relate to the manner of presentation and assessment, which are both teaching process-related issues.
Credibility Near the end of the focus group online activity, a criterion relating to the
credibility of the text was posted. Becky raised the issue of authorship of the text or curriculum series: “Is the textbook written, edited and published by qualified and credible professionals?” As happened with some earlier criteria, this statement did not appear to be directly motivated by the GAISE document. Nonetheless, it did have some relevance to the task of evaluating a text or curriculum.
Overlap between content and credibility One criterion dealt with issues of content
and credibility simultaneously. Cecil stated, “Does the textbook focus on the right mathematics and is the mathematics right?” The exclusive focus of this criterion on “mathematics” was curious in light of the GAISE document’s message that statistics and mathematics differ as disciplines. It was also not counterbalanced by any criteria specifically discussing the “correctness” of the non-mathematical elements of statistics that may be included in a curriculum or text. This occurrence appeared to reflect the presence of the persistent notion that statistics is a branch of mathematics rather than a discipline in its own right (Moore, 1992). 4.2. USING GAISE AS A BASIS FOR REFLECTIVE DISCOURSE: DISCUSSION
BOARD ANALYSIS
Discussion board discourse was catalyzed by six moderator-posed questions adapted from Greeno (2003) pertaining to reflective discourse about educational standards:
1. How do the GAISE recommendations compare to current practices for teaching statistics?
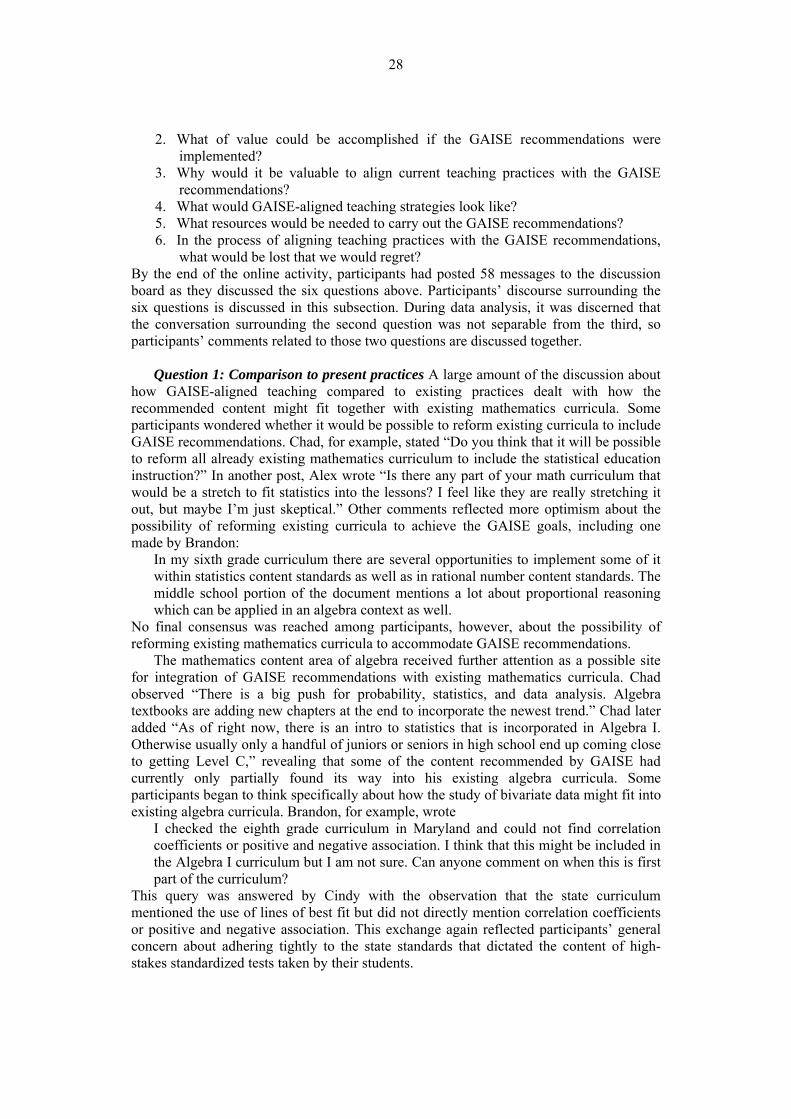
28
2. What of value could be accomplished if the GAISE recommendations were implemented?
3. Why would it be valuable to align current teaching practices with the GAISE recommendations?
4. What would GAISE-aligned teaching strategies look like? 5. What resources would be needed to carry out the GAISE recommendations? 6. In the process of aligning teaching practices with the GAISE recommendations,
what would be lost that we would regret? By the end of the online activity, participants had posted 58 messages to the discussion board as they discussed the six questions above. Participants’ discourse surrounding the six questions is discussed in this subsection. During data analysis, it was discerned that the conversation surrounding the second question was not separable from the third, so participants’ comments related to those two questions are discussed together.
Question 1: Comparison to present practices A large amount of the discussion about how GAISE-aligned teaching compared to existing practices dealt with how the recommended content might fit together with existing mathematics curricula. Some participants wondered whether it would be possible to reform existing curricula to include GAISE recommendations. Chad, for example, stated “Do you think that it will be possible to reform all already existing mathematics curriculum to include the statistical education instruction?” In another post, Alex wrote “Is there any part of your math curriculum that would be a stretch to fit statistics into the lessons? I feel like they are really stretching it out, but maybe I’m just skeptical.” Other comments reflected more optimism about the possibility of reforming existing curricula to achieve the GAISE goals, including one made by Brandon:
In my sixth grade curriculum there are several opportunities to implement some of it within statistics content standards as well as in rational number content standards. The middle school portion of the document mentions a lot about proportional reasoning which can be applied in an algebra context as well.
No final consensus was reached among participants, however, about the possibility of reforming existing mathematics curricula to accommodate GAISE recommendations.
The mathematics content area of algebra received further attention as a possible site for integration of GAISE recommendations with existing mathematics curricula. Chad observed “There is a big push for probability, statistics, and data analysis. Algebra textbooks are adding new chapters at the end to incorporate the newest trend.” Chad later added “As of right now, there is an intro to statistics that is incorporated in Algebra I. Otherwise usually only a handful of juniors or seniors in high school end up coming close to getting Level C,” revealing that some of the content recommended by GAISE had currently only partially found its way into his existing algebra curricula. Some participants began to think specifically about how the study of bivariate data might fit into existing algebra curricula. Brandon, for example, wrote
I checked the eighth grade curriculum in Maryland and could not find correlation coefficients or positive and negative association. I think that this might be included in the Algebra I curriculum but I am not sure. Can anyone comment on when this is first part of the curriculum?
This query was answered by Cindy with the observation that the state curriculum mentioned the use of lines of best fit but did not directly mention correlation coefficients or positive and negative association. This exchange again reflected participants’ general concern about adhering tightly to the state standards that dictated the content of high-stakes standardized tests taken by their students.
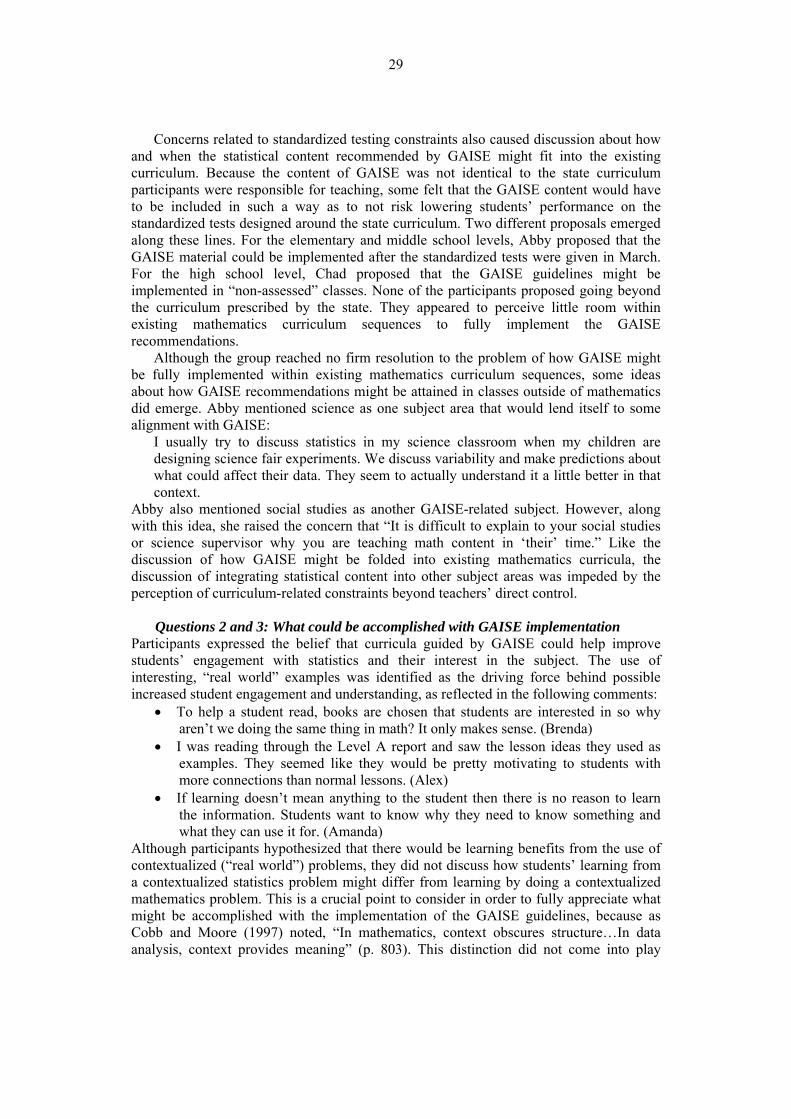
29
Concerns related to standardized testing constraints also caused discussion about how and when the statistical content recommended by GAISE might fit into the existing curriculum. Because the content of GAISE was not identical to the state curriculum participants were responsible for teaching, some felt that the GAISE content would have to be included in such a way as to not risk lowering students’ performance on the standardized tests designed around the state curriculum. Two different proposals emerged along these lines. For the elementary and middle school levels, Abby proposed that the GAISE material could be implemented after the standardized tests were given in March. For the high school level, Chad proposed that the GAISE guidelines might be implemented in “non-assessed” classes. None of the participants proposed going beyond the curriculum prescribed by the state. They appeared to perceive little room within existing mathematics curriculum sequences to fully implement the GAISE recommendations. Although the group reached no firm resolution to the problem of how GAISE might be fully implemented within existing mathematics curriculum sequences, some ideas about how GAISE recommendations might be attained in classes outside of mathematics did emerge. Abby mentioned science as one subject area that would lend itself to some alignment with GAISE:
I usually try to discuss statistics in my science classroom when my children are designing science fair experiments. We discuss variability and make predictions about what could affect their data. They seem to actually understand it a little better in that context.
Abby also mentioned social studies as another GAISE-related subject. However, along with this idea, she raised the concern that “It is difficult to explain to your social studies or science supervisor why you are teaching math content in ‘their’ time.” Like the discussion of how GAISE might be folded into existing mathematics curricula, the discussion of integrating statistical content into other subject areas was impeded by the perception of curriculum-related constraints beyond teachers’ direct control.
Questions 2 and 3: What could be accomplished with GAISE implementation
Participants expressed the belief that curricula guided by GAISE could help improve students’ engagement with statistics and their interest in the subject. The use of interesting, “real world” examples was identified as the driving force behind possible increased student engagement and understanding, as reflected in the following comments:
• To help a student read, books are chosen that students are interested in so why aren’t we doing the same thing in math? It only makes sense. (Brenda)
• I was reading through the Level A report and saw the lesson ideas they used as examples. They seemed like they would be pretty motivating to students with more connections than normal lessons. (Alex)
• If learning doesn’t mean anything to the student then there is no reason to learn the information. Students want to know why they need to know something and what they can use it for. (Amanda)
Although participants hypothesized that there would be learning benefits from the use of contextualized (“real world”) problems, they did not discuss how students’ learning from a contextualized statistics problem might differ from learning by doing a contextualized mathematics problem. This is a crucial point to consider in order to fully appreciate what might be accomplished with the implementation of the GAISE guidelines, because as Cobb and Moore (1997) noted, “In mathematics, context obscures structure…In data analysis, context provides meaning” (p. 803). This distinction did not come into play
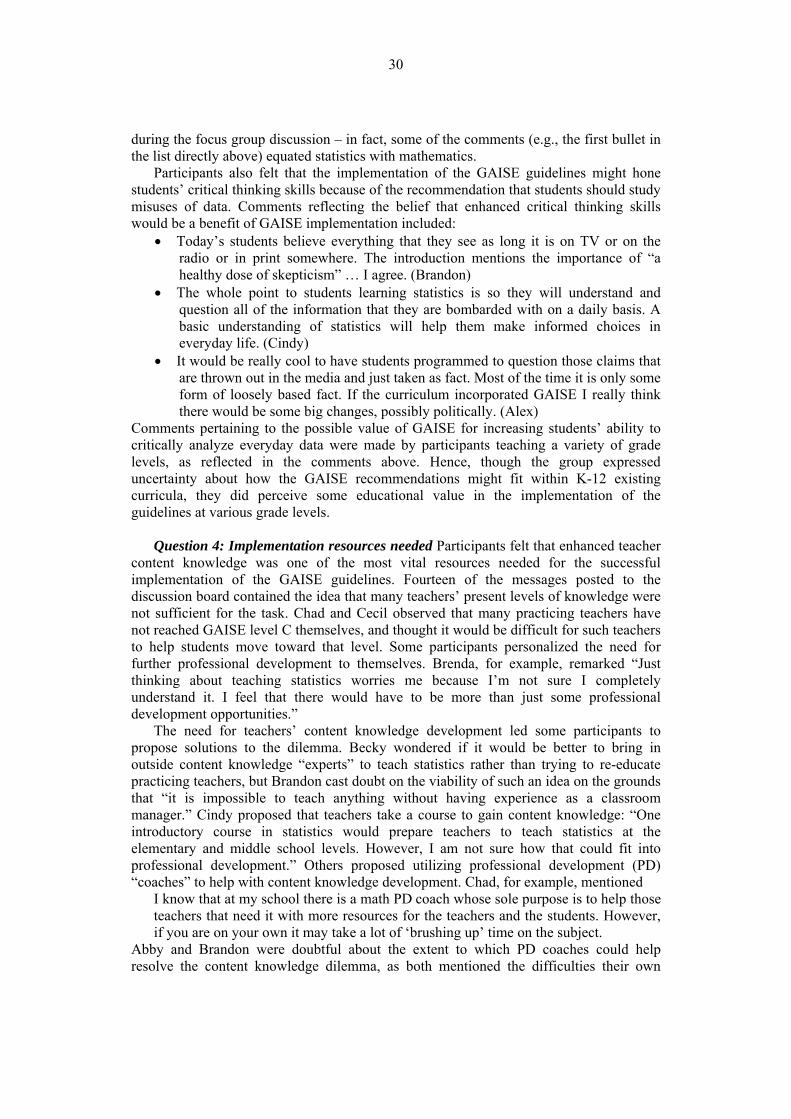
30
during the focus group discussion – in fact, some of the comments (e.g., the first bullet in the list directly above) equated statistics with mathematics. Participants also felt that the implementation of the GAISE guidelines might hone students’ critical thinking skills because of the recommendation that students should study misuses of data. Comments reflecting the belief that enhanced critical thinking skills would be a benefit of GAISE implementation included:
• Today’s students believe everything that they see as long it is on TV or on the radio or in print somewhere. The introduction mentions the importance of “a healthy dose of skepticism” … I agree. (Brandon)
• The whole point to students learning statistics is so they will understand and question all of the information that they are bombarded with on a daily basis. A basic understanding of statistics will help them make informed choices in everyday life. (Cindy)
• It would be really cool to have students programmed to question those claims that are thrown out in the media and just taken as fact. Most of the time it is only some form of loosely based fact. If the curriculum incorporated GAISE I really think there would be some big changes, possibly politically. (Alex)
Comments pertaining to the possible value of GAISE for increasing students’ ability to critically analyze everyday data were made by participants teaching a variety of grade levels, as reflected in the comments above. Hence, though the group expressed uncertainty about how the GAISE recommendations might fit within K-12 existing curricula, they did perceive some educational value in the implementation of the guidelines at various grade levels. Question 4: Implementation resources needed Participants felt that enhanced teacher content knowledge was one of the most vital resources needed for the successful implementation of the GAISE guidelines. Fourteen of the messages posted to the discussion board contained the idea that many teachers’ present levels of knowledge were not sufficient for the task. Chad and Cecil observed that many practicing teachers have not reached GAISE level C themselves, and thought it would be difficult for such teachers to help students move toward that level. Some participants personalized the need for further professional development to themselves. Brenda, for example, remarked “Just thinking about teaching statistics worries me because I’m not sure I completely understand it. I feel that there would have to be more than just some professional development opportunities.”
The need for teachers’ content knowledge development led some participants to propose solutions to the dilemma. Becky wondered if it would be better to bring in outside content knowledge “experts” to teach statistics rather than trying to re-educate practicing teachers, but Brandon cast doubt on the viability of such an idea on the grounds that “it is impossible to teach anything without having experience as a classroom manager.” Cindy proposed that teachers take a course to gain content knowledge: “One introductory course in statistics would prepare teachers to teach statistics at the elementary and middle school levels. However, I am not sure how that could fit into professional development.” Others proposed utilizing professional development (PD) “coaches” to help with content knowledge development. Chad, for example, mentioned
I know that at my school there is a math PD coach whose sole purpose is to help those teachers that need it with more resources for the teachers and the students. However, if you are on your own it may take a lot of ‘brushing up’ time on the subject.
Abby and Brandon were doubtful about the extent to which PD coaches could help resolve the content knowledge dilemma, as both mentioned the difficulties their own
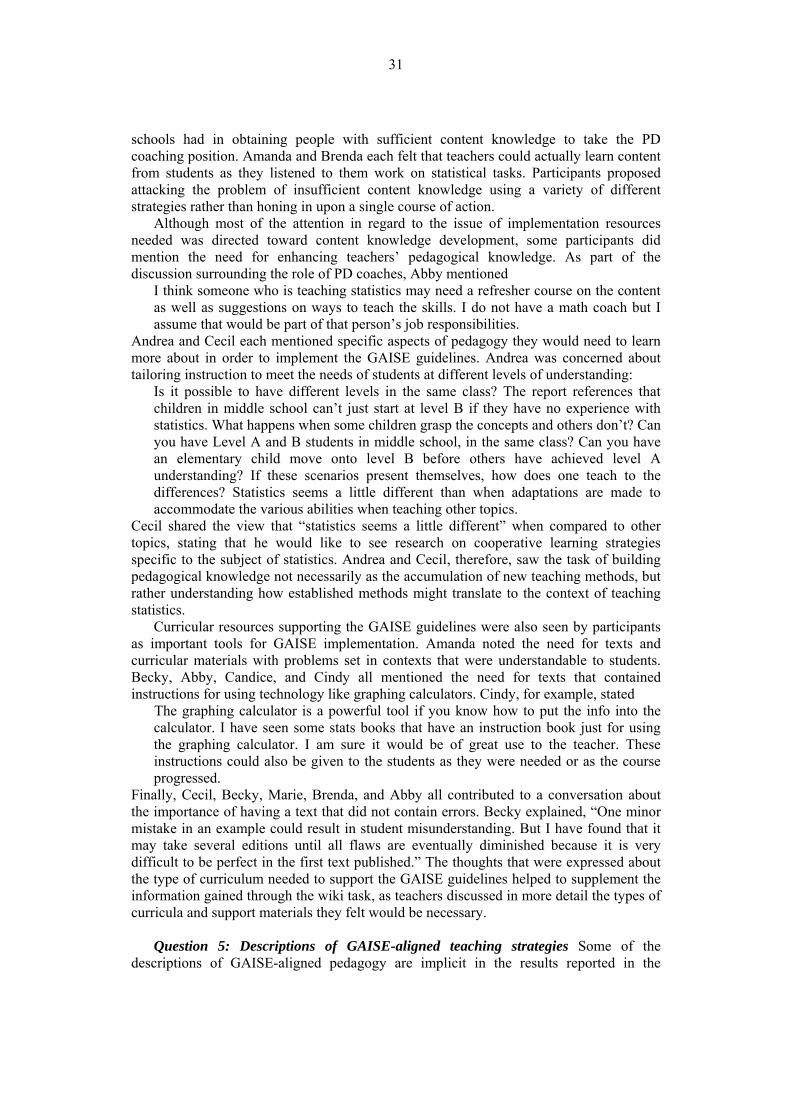
31
schools had in obtaining people with sufficient content knowledge to take the PD coaching position. Amanda and Brenda each felt that teachers could actually learn content from students as they listened to them work on statistical tasks. Participants proposed attacking the problem of insufficient content knowledge using a variety of different strategies rather than honing in upon a single course of action. Although most of the attention in regard to the issue of implementation resources needed was directed toward content knowledge development, some participants did mention the need for enhancing teachers’ pedagogical knowledge. As part of the discussion surrounding the role of PD coaches, Abby mentioned
I think someone who is teaching statistics may need a refresher course on the content as well as suggestions on ways to teach the skills. I do not have a math coach but I assume that would be part of that person’s job responsibilities.
Andrea and Cecil each mentioned specific aspects of pedagogy they would need to learn more about in order to implement the GAISE guidelines. Andrea was concerned about tailoring instruction to meet the needs of students at different levels of understanding:
Is it possible to have different levels in the same class? The report references that children in middle school can’t just start at level B if they have no experience with statistics. What happens when some children grasp the concepts and others don’t? Can you have Level A and B students in middle school, in the same class? Can you have an elementary child move onto level B before others have achieved level A understanding? If these scenarios present themselves, how does one teach to the differences? Statistics seems a little different than when adaptations are made to accommodate the various abilities when teaching other topics.
Cecil shared the view that “statistics seems a little different” when compared to other topics, stating that he would like to see research on cooperative learning strategies specific to the subject of statistics. Andrea and Cecil, therefore, saw the task of building pedagogical knowledge not necessarily as the accumulation of new teaching methods, but rather understanding how established methods might translate to the context of teaching statistics. Curricular resources supporting the GAISE guidelines were also seen by participants as important tools for GAISE implementation. Amanda noted the need for texts and curricular materials with problems set in contexts that were understandable to students. Becky, Abby, Candice, and Cindy all mentioned the need for texts that contained instructions for using technology like graphing calculators. Cindy, for example, stated
The graphing calculator is a powerful tool if you know how to put the info into the calculator. I have seen some stats books that have an instruction book just for using the graphing calculator. I am sure it would be of great use to the teacher. These instructions could also be given to the students as they were needed or as the course progressed.
Finally, Cecil, Becky, Marie, Brenda, and Abby all contributed to a conversation about the importance of having a text that did not contain errors. Becky explained, “One minor mistake in an example could result in student misunderstanding. But I have found that it may take several editions until all flaws are eventually diminished because it is very difficult to be perfect in the first text published.” The thoughts that were expressed about the type of curriculum needed to support the GAISE guidelines helped to supplement the information gained through the wiki task, as teachers discussed in more detail the types of curricula and support materials they felt would be necessary. Question 5: Descriptions of GAISE-aligned teaching strategies Some of the descriptions of GAISE-aligned pedagogy are implicit in the results reported in the
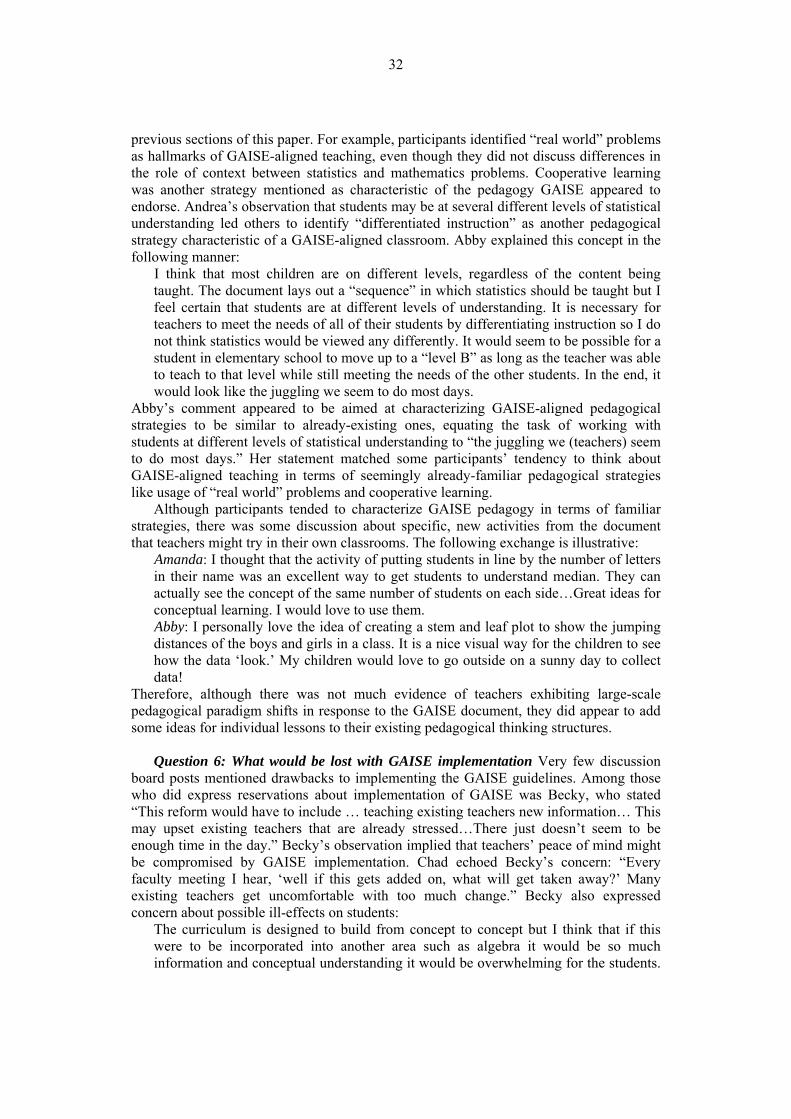
32
previous sections of this paper. For example, participants identified “real world” problems as hallmarks of GAISE-aligned teaching, even though they did not discuss differences in the role of context between statistics and mathematics problems. Cooperative learning was another strategy mentioned as characteristic of the pedagogy GAISE appeared to endorse. Andrea’s observation that students may be at several different levels of statistical understanding led others to identify “differentiated instruction” as another pedagogical strategy characteristic of a GAISE-aligned classroom. Abby explained this concept in the following manner:
I think that most children are on different levels, regardless of the content being taught. The document lays out a “sequence” in which statistics should be taught but I feel certain that students are at different levels of understanding. It is necessary for teachers to meet the needs of all of their students by differentiating instruction so I do not think statistics would be viewed any differently. It would seem to be possible for a student in elementary school to move up to a “level B” as long as the teacher was able to teach to that level while still meeting the needs of the other students. In the end, it would look like the juggling we seem to do most days.
Abby’s comment appeared to be aimed at characterizing GAISE-aligned pedagogical strategies to be similar to already-existing ones, equating the task of working with students at different levels of statistical understanding to “the juggling we (teachers) seem to do most days.” Her statement matched some participants’ tendency to think about GAISE-aligned teaching in terms of seemingly already-familiar pedagogical strategies like usage of “real world” problems and cooperative learning. Although participants tended to characterize GAISE pedagogy in terms of familiar strategies, there was some discussion about specific, new activities from the document that teachers might try in their own classrooms. The following exchange is illustrative:
Amanda: I thought that the activity of putting students in line by the number of letters in their name was an excellent way to get students to understand median. They can actually see the concept of the same number of students on each side…Great ideas for conceptual learning. I would love to use them. Abby: I personally love the idea of creating a stem and leaf plot to show the jumping distances of the boys and girls in a class. It is a nice visual way for the children to see how the data ‘look.’ My children would love to go outside on a sunny day to collect data!
Therefore, although there was not much evidence of teachers exhibiting large-scale pedagogical paradigm shifts in response to the GAISE document, they did appear to add some ideas for individual lessons to their existing pedagogical thinking structures. Question 6: What would be lost with GAISE implementation Very few discussion board posts mentioned drawbacks to implementing the GAISE guidelines. Among those who did express reservations about implementation of GAISE was Becky, who stated “This reform would have to include … teaching existing teachers new information… This may upset existing teachers that are already stressed…There just doesn’t seem to be enough time in the day.” Becky’s observation implied that teachers’ peace of mind might be compromised by GAISE implementation. Chad echoed Becky’s concern: “Every faculty meeting I hear, ‘well if this gets added on, what will get taken away?’ Many existing teachers get uncomfortable with too much change.” Becky also expressed concern about possible ill-effects on students:
The curriculum is designed to build from concept to concept but I think that if this were to be incorporated into another area such as algebra it would be so much information and conceptual understanding it would be overwhelming for the students.
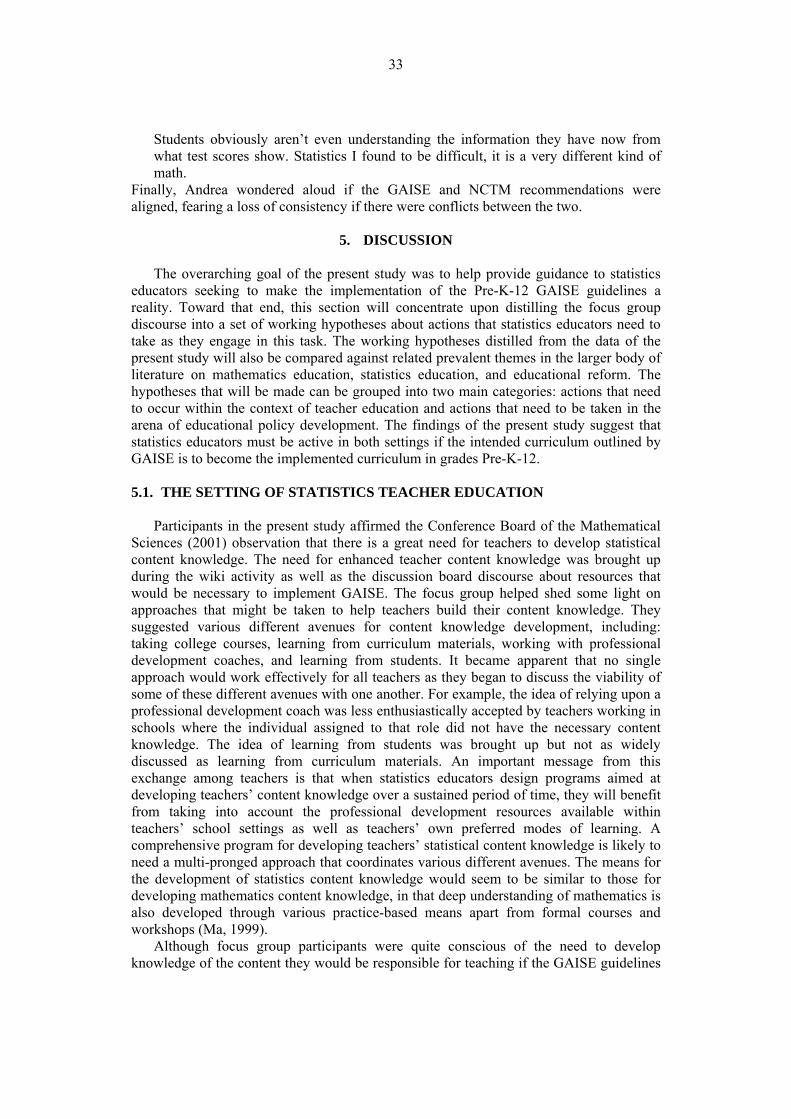
33
Students obviously aren’t even understanding the information they have now from what test scores show. Statistics I found to be difficult, it is a very different kind of math.
Finally, Andrea wondered aloud if the GAISE and NCTM recommendations were aligned, fearing a loss of consistency if there were conflicts between the two.
5. DISCUSSION The overarching goal of the present study was to help provide guidance to statistics
educators seeking to make the implementation of the Pre-K-12 GAISE guidelines a reality. Toward that end, this section will concentrate upon distilling the focus group discourse into a set of working hypotheses about actions that statistics educators need to take as they engage in this task. The working hypotheses distilled from the data of the present study will also be compared against related prevalent themes in the larger body of literature on mathematics education, statistics education, and educational reform. The hypotheses that will be made can be grouped into two main categories: actions that need to occur within the context of teacher education and actions that need to be taken in the arena of educational policy development. The findings of the present study suggest that statistics educators must be active in both settings if the intended curriculum outlined by GAISE is to become the implemented curriculum in grades Pre-K-12. 5.1. THE SETTING OF STATISTICS TEACHER EDUCATION Participants in the present study affirmed the Conference Board of the Mathematical Sciences (2001) observation that there is a great need for teachers to develop statistical content knowledge. The need for enhanced teacher content knowledge was brought up during the wiki activity as well as the discussion board discourse about resources that would be necessary to implement GAISE. The focus group helped shed some light on approaches that might be taken to help teachers build their content knowledge. They suggested various different avenues for content knowledge development, including: taking college courses, learning from curriculum materials, working with professional development coaches, and learning from students. It became apparent that no single approach would work effectively for all teachers as they began to discuss the viability of some of these different avenues with one another. For example, the idea of relying upon a professional development coach was less enthusiastically accepted by teachers working in schools where the individual assigned to that role did not have the necessary content knowledge. The idea of learning from students was brought up but not as widely discussed as learning from curriculum materials. An important message from this exchange among teachers is that when statistics educators design programs aimed at developing teachers’ content knowledge over a sustained period of time, they will benefit from taking into account the professional development resources available within teachers’ school settings as well as teachers’ own preferred modes of learning. A comprehensive program for developing teachers’ statistical content knowledge is likely to need a multi-pronged approach that coordinates various different avenues. The means for the development of statistics content knowledge would seem to be similar to those for developing mathematics content knowledge, in that deep understanding of mathematics is also developed through various practice-based means apart from formal courses and workshops (Ma, 1999). Although focus group participants were quite conscious of the need to develop knowledge of the content they would be responsible for teaching if the GAISE guidelines
34
were implemented, they were seemingly not as conscious of the need to develop knowledge of how statistics differs from mathematics. In fact, during the wiki and discussion activities, participants often spoke of statistics as if it were a branch of mathematics. Even though the GAISE document explicitly discusses how statistics differs from mathematics, an in-depth conversation of this issue did not occur during the focus group discourse. The lack of this element from the conversation meant that teachers missed opportunities to consider issues like how the role of context differs in statistics and mathematics problems. An implication is that statistics educators may need to be especially aware of drawing teachers’ attention toward this content-related issue as they design and implement teacher education programs. As Rossman, Chance, and Medina (2006) noted, knowledge of the differences between mathematics and statistics is necessary if teachers are to anticipate how students’ statistical reasoning differs from mathematical reasoning, and if teachers are to design lessons that accurately represent the discipline. Statistics educators involved in teacher education should also be particularly aware of the need to help teachers delve beneath the surface of the pedagogical practices that are recommended in GAISE. For instance, the wiki activity showed that participants were conscious of the fact that the GAISE document recommended the usage of technology, but participants did not discuss how the technology might be used for teaching specific statistical content. As Franklin and Garfield (2006) noted, there is a danger that teachers may use technology just for the sake of using technology if they don’t understand the particular pedagogical roles that software and graphing calculators can serve. The same danger seems to exist for other GAISE-recommended pedagogical strategies (e.g., using cooperative learning for the sake of using cooperative learning). One strategy for helping teachers think in depth about the substance of pedagogical recommendations would be to guide them in the direction of discussing the overlap between pedagogical process and statistical content. When participants began to think about the overlap between these two areas during the wiki and discussion board activities, they moved toward matching pedagogy to the specific developmental levels described in GAISE. The wiki material that fell exclusively in the process category was more vague and general in its discussion of pedagogy for carrying out GAISE-aligned lessons. Statistics educators can serve a valuable role in pushing teachers to articulate in detail how specific teaching strategies might be used in order to teach specific content, and then in turn challenging the efficacy of their proposed pedagogical practices when necessary. Doing so can help ensure that teachers do not interpret GAISE recommendations as slight revisions to their existing pedagogical thinking frameworks in cases where there is actually a larger disparity between the teacher’s thinking and what is actually recommended in GAISE. Statistics teacher educators should also attend to helping teachers develop curricular knowledge beyond the pedagogical knowledge needed to carry out individual lessons. When teachers began to discuss how they might fit GAISE recommendations within existing curriculum sequences, there was a fair amount of anxiety coupled with a general lack of ideas about how this might be accomplished. Some of the ideas that were floated tended to compartmentalize or confine statistical material to being taught “after the standardized test,” in a “non-assessed course,” or as the last chapter in an algebra textbook. Teachers need to understand how these approaches to teaching statistics would be likely to lead to a lack of overall curricular coherence and to develop more viable approaches to curriculum development. Involving teachers in the construction of the scope and sequence of a GAISE-aligned curriculum may help provide a vision of how the GAISE recommendations might be carried out within their schools. Teachers in the focus
35
group expressed a desire to understand such a viable scope and sequence on the wiki as well as on the discussion board. 5.2. THE ARENA OF EDUCATIONAL POLICY DEVELOPMENT Given the current political climate of high-stakes testing and accountability, the GAISE guidelines are not likely to influence the attained curriculum in the United States unless statistics educators are involved in helping to shape the curriculum standards documents that teachers are held accountable for implementing. Even if the goal of developing teachers’ knowledge to the point that they could map out viable curricular sequences was met, it is likely that the sequences they designed would be overruled by state-level curricula and accompanying standardized tests reflecting different sets of priorities (Darling-Hammond, 2006; Thomas, 2005). The power and control exerted by the state-level curriculum was apparent in various facets of the focus group discourse. In one such instance in the present study, teachers were even hesitant to introduce the ideas of positive and negative association within the context of teaching lines of best fit because lines of best fit were mentioned in the state standards document, but positive and negative association were not. In another instance, the idea of integrating statistics with science and social studies was put in doubt for fear that teaching statistics in another subject area would impinge on the standards for that subject. Such extreme adherence to state standards seems to reflect a perception of state standards documents as highly prescriptive laundry lists of discrete topics that need to be learned in a specific order. Statistics educators who are involved in the formulation of state standards documents can advocate for the richer representation of statistics provided in GAISE so that teachers are given license to construct lessons that more authentically represent the discipline of statistics. Such collaborations between statistics educators and state-level authorities have taken place in some cases (Franklin & Mewborn, 2006), but need to become the norm in all states if GAISE is to substantially impact U.S. curricula.
6. CONCLUSION
There is a real danger that the GAISE guidelines could become lost among the proliferation of standards documents that lay out expectations for the teaching of statistics and ask for teachers’ attention. Such a scenario can be avoided if statistics educators are successful at working on several fronts simultaneously: developing teachers’ content, pedagogical, and curricular knowledge, while also working (in the United States) to influence state-level curriculum documents. As these tasks are carried out, teacher educators should remain conscious of attending to individuals’ perceptions of the GAISE reform recommendations. Although the present study has provided a set of working hypotheses about actions that need to be taken to move toward making GAISE the implemented curriculum in the United States, additional useful hypotheses are likely to emerge as teachers and policy makers are further engaged in discourse about teaching statistics. The ultimate success or failure in making the vision of the GAISE guidelines a reality will depend, in large part, upon carefully attending to those discourses and taking actions that are informed by their substance.
36
REFERENCES
Cobb, G. W., & Moore, D. S. (1997). Mathematics, statistics, and teaching. American Mathematical Monthly, 104(9), 801-823. Conference Board of the Mathematical Sciences. (2001). The mathematical education of teachers. Providence, RI: American Mathematical Society. Darling-Hammond, L. (2006). No Child Left Behind and high school reform. Harvard Educational Review, 76, 642-667. Davis, B., & Simmt, E. (2003). Understanding learning systems: Mathematics education
and complexity science. Journal for Research in Mathematics Education, 34(2), 137- 167.
Fennell, F. (2007). Focal points – where we are, and what’s next? NCTM News Bulletin, 43(7), 3.
Franklin, C. A., & Garfield, J. B. (2006). The GAISE project: Developing statistics education guidelines for grades Pre-K-12 and college courses. In G. F. Burrill (Ed.), Thinking and reasoning with data and chance: Sixty-eighth annual yearbook of the National Council of Teachers of Mathematics (pp. 345-375). Reston, VA: National Council of Teachers of Mathematics.
Franklin, C. A., Kader, G., Mewborn, D., Moreno, J., Peck, R., Perry, M., & Scheaffer, R. (2007). Guidelines for assessment and instruction in statistics education (GAISE) report: A pre-K–12 curriculum framework. Alexandria, VA: American Statistical Association. [Online: http://www.amstat.org/education/gaise/]
Franklin, C. A., & Mewborn, D. S. (2006). The statistical education of grades Pre-K-12 teachers: A shared responsibility. In G. F. Burrill (Ed.), Thinking and reasoning with data and chance: Sixty-eighth annual yearbook of the National Council of Teachers of Mathematics (pp. 335-344). Reston, VA: National Council of Teachers of Mathematics.
Fuller, T. D., Edwards, J. N., Vorakitphokatorn, S., & Sermsri, S. (1993). Using focus groups to adapt survey instruments to new populations: Experience from a developing country. In D. L. Morgan (Ed.), Successful focus groups: Advancing the state of the art (pp. 89-104). Newbury Park, CA: Sage.
Greenbaum, T. L. (1993). The handbook for focus group research. New York: Lexington Books.
Greeno, J. G. (2003). Situative research relevant to standards for school mathematics. In J. Kilpatrick, W. G. Martin, & D. Schifter (Eds.), A research companion to Principles and Standards for School Mathematics (pp. 304-332). Reston, VA: NCTM.
Groth, R. E. (2006). Analysis of an online case discussion about teaching stochastics. Mathematics Teacher Education and Development, 7, 53-71. Groth, R. E. (2007). Case studies of mathematics teachers’ learning in an online study group. Contemporary Issues in Technology and Teacher Education, 7(1).
[Online: http://www.citejournal.org/vol7/iss1/mathematics/article1.cfm] Joinson, A. N. (1998). Causes and effects of disinhibition on the Internet. In J.
Gackenbach (Ed.), The psychology of the Internet (pp. 43-60). New York: Academic Press.
Lambdin, D. V., & Preston, R. V. (1995). Caricatures in innovation: Teacher adaptation to an investigation-oriented middle school mathematics curriculum. Journal of Teacher Education, 46(2), 130-140.
Lave, J., & Wenger, E. (1991). Situated learning: Legitimate peripheral participation. Cambridge: Cambridge University Press.
37
Lesh, R., & Lovitts, B. (2000). Research agendas: Identifying priority problems and developing useful theoretical perspectives. In A. E. Kelly & R. A. Lesh (Eds.), Handbook of research design in mathematics and science education (pp. 45-72). Mahwah, NJ: Erlbaum.
Lloyd, G. M., & Behm, S. L. (2005). Preservice elementary teachers’ analysis of mathematics instructional materials. Action in Teacher Education, 26(4), 48-62.
Ma, L. (1999). Knowing and teaching elementary mathematics: Teachers’ understanding of fundamental mathematics in China and the United States. Mahwah, NJ: Erlbaum.
Miles, M. B., & Huberman, A. M. (1994). Qualitative data analysis (2nd ed.). Thousand Oaks, CA: Sage.
Moore, D. (1992). Teaching statistics as a respectable subject. In F. Gordon & S. Gordon (Eds.), Statistics for the twenty-first century (pp. 14-25). Washington, D.C.: Mathematical Association of America.
Morgan, D. L. (1997). Focus groups as qualitative research (2nd ed.). Newbury Park, CA: Sage.
Muhr, T. (2004). User’s Manual for ATLAS.ti 5.0. Berlin: ATLAS.ti Scientific Software Development. National Council of Teachers of Mathematics (1989). Curriculum and evaluation
standards for school mathematics. Reston, VA: Author. National Council of Teachers of Mathematics (1991). Professional standards for teaching
mathematics. Reston, VA: Author. National Council of Teachers of Mathematics (1995). Assessment standards for school
mathematics. Reston, VA: Author. National Council of Teachers of Mathematics (2000). Principles and standards for school
mathematics. Reston, VA: Author. National Council of Teachers of Mathematics (2006). Curriculum focal points for
prekindergarten through grade 8 mathematics. Reston, VA: Author. Putnam, R. T., & Borko, H. (2000). What do new views of knowledge and thinking have
to say about research on teacher learning? Educational Researcher, 29(1), 4-15. Remillard, J. T., & Bryans, M. B. (2004). Teachers’ orientations toward mathematics
curriculum materials: Implications for teacher learning. Journal for Research in Mathematics Education, 35(5), 352-388.
Ross, J. A., McDougall, D., & Hogaboam-Gray, A. (2002). Research on reform in mathematics education, 1993-2000. Alberta Journal of Educational Research, 48(2), 122-138.
Rossi, P. H., Wright, J. D., & Anderson, A. B. (Eds.). (1983). Handbook of survey research. New York: Academic Press.
Rossman, A., Chance, B., & Medina, E. (2006). Some important comparisons between statistics and mathematics, and why teachers should care. In G. F. Burrill (Ed.), Thinking and reasoning with data and chance: Sixty-eighth annual yearbook of the National Council of Teachers of Mathematics (pp. 323-333). Reston, VA: National Council of Teachers of Mathematics.
Schoen, H. L., Fey, J. T., Hirsch, C. R., & Coxford, A. F. (1999). Issues and options in the math wars. Phi Delta Kappan, 80, 444-453.
Schoenfeld, A. H. (2004). The math wars. Educational Policy, 18(1), 253-286. Sowder, J. T., & Schappelle, B. (Eds.). (2002). Lessons learned from research. Reston,
VA: National Council of Teachers of Mathematics. Spillane, J. P., & Zeulli, J. S. (1999). Reform and teaching: Exploring patterns of practice
in the context of national and state mathematics reforms. Educational Evaluation and Policy Analysis, 21(1), 1-27.
38
Stewart, K., & Williams, M. (2005). Researching online populations: The use of online focus groups for social research. Qualitative Research, 5(4), 395-416.
Stigler, J. W. & Hiebert, J. (1999). The teaching gap: Best ideas from the world’s teachers for improving education in the classroom. New York: Free Press.
Strauss, A., & Corbin, J. (1990). Basics of qualitative research: Grounded theory procedures and techniques. London: Sage.
Thomas, R. M. (2005). High-stakes testing: Coping with collateral damage. Mahwah, NJ: Erlbaum.
Tyack, D., & Cuban, L. (1995). Tinkering toward Utopia: A century of public school reform. Cambridge: Harvard University Press.
Usiskin, Z., & Dossey, J. (2004). Mathematics education in the United States 2004: A capsule summary fact book. Reston, VA: National Council of Teachers of Mathematics.
Vaughn, S., Schumm, J. S., & Sinagub, J. (1996). Focus groups in education and psychology. Thousand Oaks, CA: Sage.
Watson, J. M., & Moritz, J. B. (2000). Developing concepts of sampling. Journal for Research in Mathematics Education, 31(1), 44-70.
RANDALL E. GROTH Salisbury University
Seidel School of Education and Professional Studies 1101 Camden Ave.
Salisbury, MD 21801 USA
39
APPENDIX A: INSTRUCTIONS FOR PARTICIPATING IN THE ONLINE FOCUS GROUP ACTIVITY
• The activity will take place from May 10-23. To prepare to participate, read the
introduction and framework of the Pre-K-12 GAISE report online (pp. 1-21): http://www.amstat.org/education/gaise/. Then choose one of the following three sections of the report to read in detail: level A (pp. 22-35), level B (pp. 36-59), or level C (pp. 60-88) (your choice of level will depend on your teaching interests).
• You will engage in two different types of online interaction during the activity: (i) The collaborative construction of a wiki; (ii) Discussion board conversation. The webpage for both activities is: [address for accessing the assignment inserted here]. The wiki appears on the top portion of the page, and the discussion board on the bottom portion.
• For the wiki portion of the website, you will collaboratively design a document that can be used to evaluate statistics textbooks and curriculum materials. The finished document should contain questions that will help teachers at all levels, Pre-K-12, select textbooks and curriculum materials that support the GAISE recommendations. Your class experiences of working in groups to evaluate textbooks and evaluating data analysis test items may be helpful as you construct this evaluation document. You should make contributions to the wiki on at least two different days during the activity. Each time you revise the wiki, a pop-up box will appear to ask you to explain the reasons for the revision. You should fill in the pop-up box each time you make an edit to explain the reasons for it.
• The discussion board portion of the website should be used for a reflective discussion about the content of the GAISE document. Some questions you might choose to discuss include (but are not limited to): (i) How do the GAISE recommendations compare to current practices for teaching statistics?; (ii) What of value could be accomplished if the GAISE recommendations were implemented?; (iii) Why would it be valuable to align current teaching practices with the GAISE recommendations?; (iv) What would GAISE-aligned teaching strategies look like?; (v) What resources would be needed to carry out the GAISE recommendations?; (vi) In the process of aligning teaching practices with the GAISE recommendations, what would be lost that we would regret? You should make posts to the discussion board on at least four different days during the activity. Feel free to make as many posts as you wish. There is no limit to how many posts you may make. Some of your posts should be replies to other discussion board participants.
If you experience any difficulty completing the activity, email me immediately at [author’s email address inserted here]
40
MEASURING THE DEVELOPMENT OF STUDENTS’ CONSIDERATION OF VARIATION4
JACKIE REID
School of Science and Technology, University of New England, Australia [email protected]
CHRIS READING
The National Centre of Science, Information and Communication Technology and Mathematics Education for Rural and Regional Australia, University of New England,
Australia [email protected]
ABSTRACT
Research investigating how students begin to consider and reason about variation will help educators identify stages of this development. This can provide direction for learning activities to help students develop a strong consideration of variation that can be applied in a variety of contexts. In the present study, tertiary student responses to a class test and an assignment question are analysed, resulting in a description of levels of consideration of variation relevant to these tasks. This and other hierarchies previously developed are used to formulate a Consideration of Variation Hierarchy applicable to a variety of tasks. Implications for research and teaching are discussed.
Keywords: Statistics education research; Consideration of Variation Hierarchy; Statistics education; Tertiary education
1. INTRODUCTION An important issue in statistics education, and related research, is how to help
students develop statistical thinking, reasoning and literacy. Literature in this area is extensive (e.g., Garfield & Ben-Zvi, 2004; Chance, 2002; Garfield, 2002; Rumsey, 2002). The importance of variation was flagged when consideration of variation was proposed as one of the fundamental types of statistical thinking (Wild & Pfannkuch, 1999). Also understanding of variation has been reported as contributing to the development of students’ statistical thinking (e.g., Meletiou-Mavrotheris & Lee, 2002; Reading & Reid, 2005; Reading & Shaugnessy, 2004; Torok & Watson, 2000). Many researchers have reinforced this view. Most importantly, variation is taken to be a foundation concept for statistics. Statistics has been described as the “science of variation” (e.g., MacGillivray, 2004) and Bakker (2003) explained that students who did not expect variability would lack “intuition of why one would take a sample or look at a distribution.” Finally, there is increasing interest in describing and measuring the development of understanding of variation and an interest in finding ways to help students use their intuitive notions of variability to move towards a more sophisticated notion of reasoning about variation (Garfield, delMas, & Chance, 2007; Reading & Shaughnessy, 2004). Challenging questions for researchers and educators such as: “What does correct reasoning about
Statistics Education Research Journal, 7(1), 40-59, http://www.stat.auckland.ac.nz/serj © International Association for Statistical Education (IASE/ISI), May, 2008
41
variability look like? What are ways to assess understandi ng of variability? . . . What are useful methodologies for studying the understanding of variability?” were posed by Ben-Zvi and Garfield (2004a, p. 4) for the Reasoning about Variation focus at the Third International Research Forum on Statistical, Reasoning and Thinking, reported in the Forum Proceedings (Lee, 2004) and two special issues of this journal (Ben-Zvi & Garfield, 2004b; Garfield & Ben-Zvi, 2005).
This paper addresses fundamental questions concerning students’ reasoning about variation by developing a hierarchy of consideration of variation. In earlier work (Reading & Reid, 2005; Reid & Reading, 2004, 2006), hierarchies of levels of consideration of variation were developed, based on tertiary students’ responses to minute papers and a questionnaire. In the present study, student responses to a class test and an assignment question are analysed, resulting in a description of levels of consideration of variation relevant to those tasks. This and the other hierarchies previously developed are used to formulate a Consideration of Variation Hierarchy applicable to a variety of tasks. Implications for research and teaching are discussed.
2. RESEARCH BACKGROUND
The following provides a review of current research into the development of students’
consideration of variation at the tertiary level and in particular, focuses on recently proposed hierarchies that assess and investigate this development.
2.1. CONSIDERATION OF VARIATION IN THE TEACHING AND LEARNING
OF STATISTICS Much of the research to date on the role of variation in statistical reasoning in
education has been at the pre-tertiary level. This research has expressed concern that educators have placed too little emphasis on the notion of variation (e.g., Meletiou-Mavrotheris & Lee, 2002; Torok & Watson, 2000). For example, measures of location have been emphasized to the detriment of consideration of variability (Reading & Shaughnessy, 2004), and there is the potential for the deterministic approach of the mathematics curriculum to have a negative impact on statistics instruction (Meletiou-Mavrotheris & Lee, 2002). Lack of stochastic awareness may leave students embarking on their tertiary statistics education ill-prepared to consider the more advanced notions of the statistical model as a combination of both systematic and random effects. Lack of an appreciation of the complete statistical model will contribute to students viewing statistics as a list of techniques to be learned in isolation (Reading & Reid, 2005). A sound understanding of variation could help promote a more comprehensive approach to learning statistics. The four components of Wild and Pfannkuch’s (1999) consideration of variation provide a suitable basis for expanding on the notion of understanding of variation. These components are:
1. noticing and acknowledging variation – recognizing the omnipresence of variation and the need to record this variation in discussions;
2. measuring and modeling variation for the purposes of prediction, explanation, or control – creating summaries (numerical or graphical) to represent the variation in the data and using these summaries to represent the impact of variation;
3. explaining and dealing with variation – looking for the causes of variation and considering the impact on design and sampling; and
4. using investigative strategies in relation to variation – formal procedures for looking at the properties of the variation itself.
42
A thorough assessment of as many as possible of these components of consideration of variation should help clarify the development of students’ understanding of variation. This approach was taken by Torok and Watson (2000) when developing their categories of the appreciation of variation, and by Reading and Reid (2005) when developing a hierarchy of levels of consideration of variation.
Historically, there has been little research that explores the development of students’ understanding of variation at the tertiary level. More recently, delMas and Liu (2003) focused their research on tertiary students’ interpretations of the standard deviation, and Lann & Falk (2003) found that when students in a first year service course were explicitly asked to consider variation, although their intuitive notions varied, a greater proportion of students chose the range than any other single measure of spread to summarise the variability in a data set. In a broader study of college students’ consideration of variation Meletiou-Mavrotheris and Lee (2002) found that students took a more deterministic approach to exploratory data analysis but, although students struggled with concepts of variation in most contexts, by the end of the course, many had an increased awareness of the need for information regarding the spread of a distribution.
Recent trends indicate the use of less traditional strategies for both teaching and assessment in statistics (Garfield & Gal, 1999). Importantly, assessment should be aligned with learning goals, and then the type of instruction and activities required to achieve these goals should be chosen (Garfield & Ben-Zvi, 2004). New tools are required to assess deeper understandings being articulated in these goals. For example, interviews are valuable to gain a better idea of students’ understanding (Reading & Reid, 2006a). Information on deeper understandings of variation, such as those based on statistical reasoning and thinking, is crucial for the development and refinement of new curriculum and assessment approaches. It is important to use a range of assessment tasks to examine students’ understanding of variation because “… assessment of thinking about variation is heavily reliant upon both the types of assessment tasks employed and the context in which the tasks are situated” (Meletiou-Mavrotheris & Lee, 2002, p. 33). Furthermore, a variety of assessment tasks addressed in different settings would allow educators to better determine further development of instruction and assessment (Reading & Shaugnessy, 2004).
2.2. ASSESSING TERTIARY STUDENTS’ CONSIDERATION OF VARIATION
The research project, Understanding of Variation, explored the development of tertiary students’ consideration of variation as they engaged in the various learning activities and assessment tasks in an introductory service statistics course with ‘consideration of variation’ as a core for the curriculum. The project aimed to develop and refine hierarchies being developed to assess students’ understanding of variation and to investigate this understanding. The project included analysis of student responses to a range of tasks; pre-study and post-study questionnaires, follow-up interviews of selected students, four separate minute papers, one question from a class test, and one question from an assignment. It is important for students to be able to understand and apply the concept of variation in a variety of contexts. The tasks were not designed specifically to focus on variation but rather they were tasks that formed part of the course assessment. The researchers looked for any consideration of variation, that is, the expressions of variation and how these were used, in students’ written or verbal responses.
Details are now provided of two hierarchies that evolved from student responses to minute papers and a questionnaire, respectively. Reading and Reid (2005) described levels of consideration of variation (Table 1) based on responses given to the minute
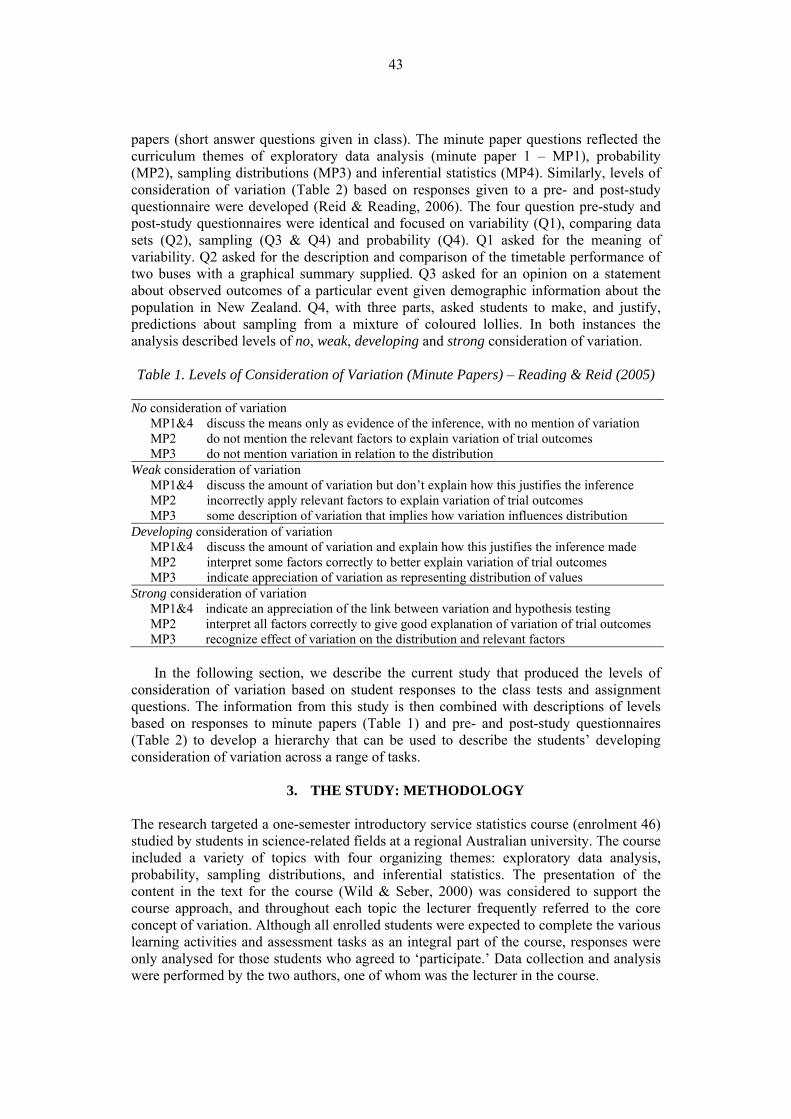
43
papers (short answer questions given in class). The minute paper questions reflected the curriculum themes of exploratory data analysis (minute paper 1 – MP1), probability (MP2), sampling distributions (MP3) and inferential statistics (MP4). Similarly, levels of consideration of variation (Table 2) based on responses given to a pre- and post-study questionnaire were developed (Reid & Reading, 2006). The four question pre-study and post-study questionnaires were identical and focused on variability (Q1), comparing data sets (Q2), sampling (Q3 & Q4) and probability (Q4). Q1 asked for the meaning of variability. Q2 asked for the description and comparison of the timetable performance of two buses with a graphical summary supplied. Q3 asked for an opinion on a statement about observed outcomes of a particular event given demographic information about the population in New Zealand. Q4, with three parts, asked students to make, and justify, predictions about sampling from a mixture of coloured lollies. In both instances the analysis described levels of no, weak, developing and strong consideration of variation.
Table 1. Levels of Consideration of Variation (Minute Papers) – Reading & Reid (2005)
No consideration of variation
MP1&4 discuss the means only as evidence of the inference, with no mention of variation MP2 do not mention the relevant factors to explain variation of trial outcomes MP3 do not mention variation in relation to the distribution
Weak consideration of variation MP1&4 discuss the amount of variation but don’t explain how this justifies the inference MP2 incorrectly apply relevant factors to explain variation of trial outcomes MP3 some description of variation that implies how variation influences distribution
Developing consideration of variation MP1&4 discuss the amount of variation and explain how this justifies the inference made MP2 interpret some factors correctly to better explain variation of trial outcomes MP3 indicate appreciation of variation as representing distribution of values
Strong consideration of variation MP1&4 indicate an appreciation of the link between variation and hypothesis testing MP2 interpret all factors correctly to give good explanation of variation of trial outcomes MP3 recognize effect of variation on the distribution and relevant factors
In the following section, we describe the current study that produced the levels of
consideration of variation based on student responses to the class tests and assignment questions. The information from this study is then combined with descriptions of levels based on responses to minute papers (Table 1) and pre- and post-study questionnaires (Table 2) to develop a hierarchy that can be used to describe the students’ developing consideration of variation across a range of tasks.
3. THE STUDY: METHODOLOGY
The research targeted a one-semester introductory service statistics course (enrolment 46) studied by students in science-related fields at a regional Australian university. The course included a variety of topics with four organizing themes: exploratory data analysis, probability, sampling distributions, and inferential statistics. The presentation of the content in the text for the course (Wild & Seber, 2000) was considered to support the course approach, and throughout each topic the lecturer frequently referred to the core concept of variation. Although all enrolled students were expected to complete the various learning activities and assessment tasks as an integral part of the course, responses were only analysed for those students who agreed to ‘participate.’ Data collection and analysis were performed by the two authors, one of whom was the lecturer in the course.
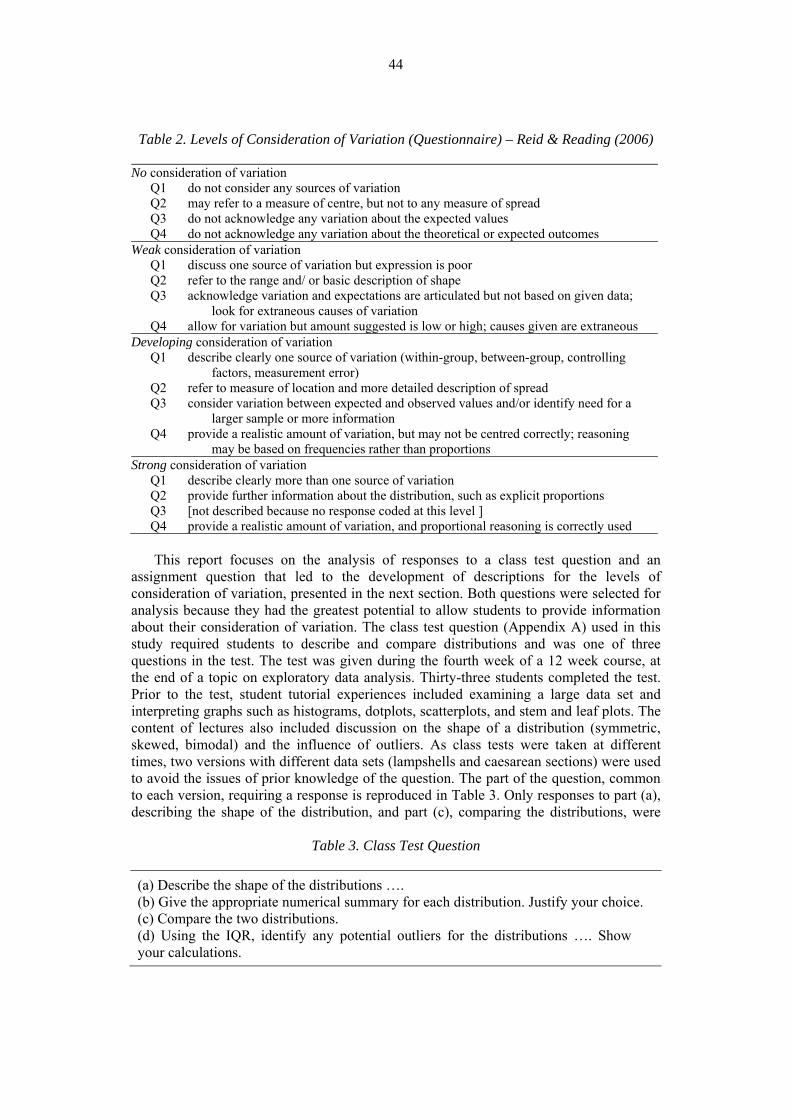
44
Table 2. Levels of Consideration of Variation (Questionnaire) – Reid & Reading (2006)
No consideration of variation Q1 do not consider any sources of variation Q2 may refer to a measure of centre, but not to any measure of spread Q3 do not acknowledge any variation about the expected values Q4 do not acknowledge any variation about the theoretical or expected outcomes
Weak consideration of variation Q1 discuss one source of variation but expression is poor Q2 refer to the range and/ or basic description of shape Q3 acknowledge variation and expectations are articulated but not based on given data;
look for extraneous causes of variation Q4 allow for variation but amount suggested is low or high; causes given are extraneous
Developing consideration of variation Q1 describe clearly one source of variation (within-group, between-group, controlling
factors, measurement error) Q2 refer to measure of location and more detailed description of spread Q3 consider variation between expected and observed values and/or identify need for a
larger sample or more information Q4 provide a realistic amount of variation, but may not be centred correctly; reasoning
may be based on frequencies rather than proportions
Strong consideration of variation Q1 describe clearly more than one source of variation Q2 provide further information about the distribution, such as explicit proportions Q3 [not described because no response coded at this level ] Q4 provide a realistic amount of variation, and proportional reasoning is correctly used
This report focuses on the analysis of responses to a class test question and an
assignment question that led to the development of descriptions for the levels of consideration of variation, presented in the next section. Both questions were selected for analysis because they had the greatest potential to allow students to provide information about their consideration of variation. The class test question (Appendix A) used in this study required students to describe and compare distributions and was one of three questions in the test. The test was given during the fourth week of a 12 week course, at the end of a topic on exploratory data analysis. Thirty-three students completed the test. Prior to the test, student tutorial experiences included examining a large data set and interpreting graphs such as histograms, dotplots, scatterplots, and stem and leaf plots. The content of lectures also included discussion on the shape of a distribution (symmetric, skewed, bimodal) and the influence of outliers. As class tests were taken at different times, two versions with different data sets (lampshells and caesarean sections) were used to avoid the issues of prior knowledge of the question. The part of the question, common to each version, requiring a response is reproduced in Table 3. Only responses to part (a), describing the shape of the distribution, and part (c), comparing the distributions, were
Table 3. Class Test Question
(a) Describe the shape of the distributions …. (b) Give the appropriate numerical summary for each distribution. Justify your choice. (c) Compare the two distributions. (d) Using the IQR, identify any potential outliers for the distributions …. Show your calculations.
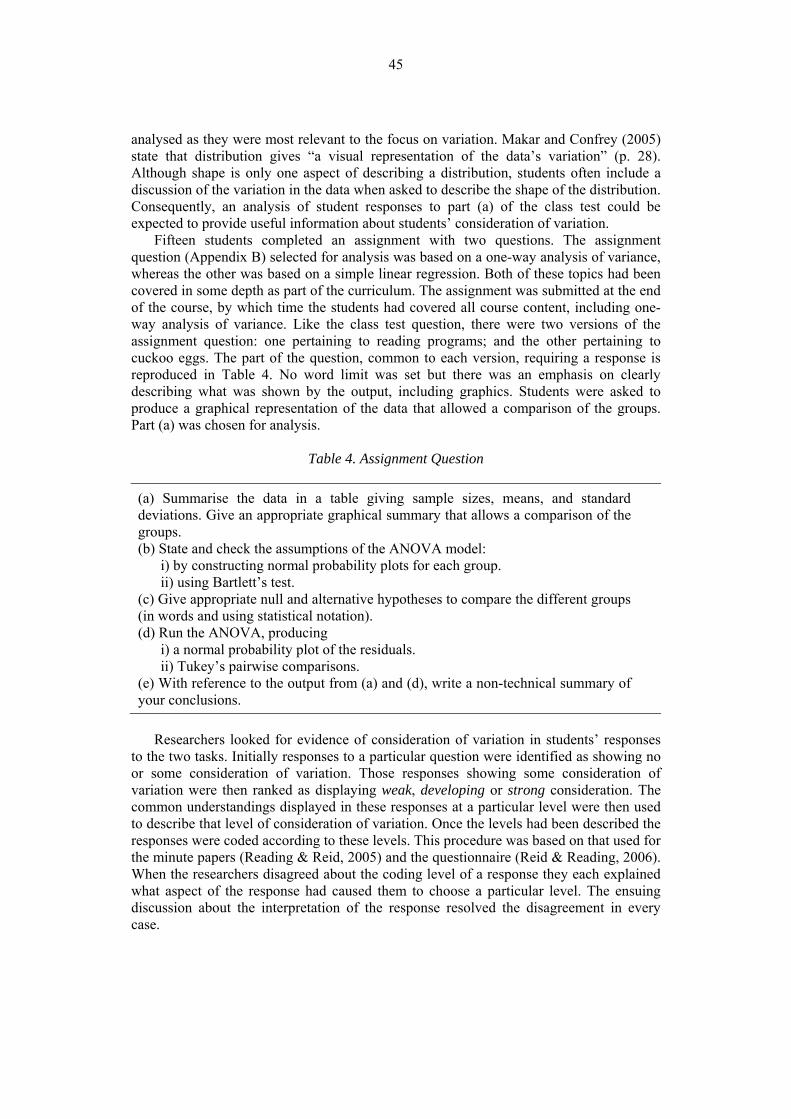
45
analysed as they were most relevant to the focus on variation. Makar and Confrey (2005) state that distribution gives “a visual representation of the data’s variation” (p. 28). Although shape is only one aspect of describing a distribution, students often include a discussion of the variation in the data when asked to describe the shape of the distribution. Consequently, an analysis of student responses to part (a) of the class test could be expected to provide useful information about students’ consideration of variation.
Fifteen students completed an assignment with two questions. The assignment question (Appendix B) selected for analysis was based on a one-way analysis of variance, whereas the other was based on a simple linear regression. Both of these topics had been covered in some depth as part of the curriculum. The assignment was submitted at the end of the course, by which time the students had covered all course content, including one-way analysis of variance. Like the class test question, there were two versions of the assignment question: one pertaining to reading programs; and the other pertaining to cuckoo eggs. The part of the question, common to each version, requiring a response is reproduced in Table 4. No word limit was set but there was an emphasis on clearly describing what was shown by the output, including graphics. Students were asked to produce a graphical representation of the data that allowed a comparison of the groups. Part (a) was chosen for analysis.
Table 4. Assignment Question
(a) Summarise the data in a table giving sample sizes, means, and standard deviations. Give an appropriate graphical summary that allows a comparison of the groups. (b) State and check the assumptions of the ANOVA model:
i) by constructing normal probability plots for each group. ii) using Bartlett’s test.
(c) Give appropriate null and alternative hypotheses to compare the different groups (in words and using statistical notation). (d) Run the ANOVA, producing
i) a normal probability plot of the residuals. ii) Tukey’s pairwise comparisons.
(e) With reference to the output from (a) and (d), write a non-technical summary of your conclusions.
Researchers looked for evidence of consideration of variation in students’ responses
to the two tasks. Initially responses to a particular question were identified as showing no or some consideration of variation. Those responses showing some consideration of variation were then ranked as displaying weak, developing or strong consideration. The common understandings displayed in these responses at a particular level were then used to describe that level of consideration of variation. Once the levels had been described the responses were coded according to these levels. This procedure was based on that used for the minute papers (Reading & Reid, 2005) and the questionnaire (Reid & Reading, 2006). When the researchers disagreed about the coding level of a response they each explained what aspect of the response had caused them to choose a particular level. The ensuing discussion about the interpretation of the response resolved the disagreement in every case.
46
4. THE STUDY: RESULTS AND DISCUSSION
4.1. RESPONSE CODING Analysis of the responses to the class test question showed that there was a variety of
features of within-group and between-group variation given. Because comparisons of distributions and one-way analysis of variance are both core topics in the curriculum it is not unreasonable to expect some students to be able to describe and use the concepts of within-group and between-group variation both informally and formally. It was not necessary for students to refer to these terms explicitly but rather be able to describe them, and/or refer to their features and ultimately link them.
When referring to the within-group variation some features identified were extremes, outliers, range, skewness, large distribution, majority between certain limits, spread, and symmetry. When referring to the between-group variation some features identified by students were differences between medians, between averages, and between means. The descriptors resulting from the coding of the class test responses and the assignment question responses were similar. This was not unexpected because both questions required students to compare distributions. Those responses that demonstrated some consideration of variation were coded as either weak or developing (Table 5). No response was coded as strong.
Table 5. Levels of Consideration of Variation (Class Test and Assignment Questions)
No consideration of variation
general statements which do not display any meaningful consideration of variation Weak consideration of variation
identify features of either within-group variation or between-group variation; expression used may be poor; terms used may be incorrect or confused
Developing consideration of variation discuss both within-group variation and between-group variation without linking them; refer to variation to support inference but do not link within-group and between-group variation
Strong consideration of variation [not described because no response coded at this level]
As the class tests were completed during non-compulsory class time not all students
completed them and consequently only thirty-three responses were analysed. There were only fifteen assignment question responses analysed because, although most students produced the required numerical and graphical summaries, many did not make the comparison, which was the focus of the coding of responses. On the assumption that this might have been a misinterpretation of the question (the wording “allows a comparison” may have been ambiguous) these nil responses were not coded at all rather than coding them as no consideration of variation. The majority of responses (more than 95%) show some evidence of consideration of variation; however, no response demonstrated what could be considered a strong consideration of variation.
Following are examples of weak and developing responses for part (a) and part (c) of the class test, and for the assignment question. Examples have been selected to demonstrate what might be expected of responses at each level. Each response has an identification tag that begins with R, and then an identification code. The identification code for a test question response is followed by “a” or “c” to indicate whether it was a response to part (a) or (c) of the question, and the data set used is indicated by
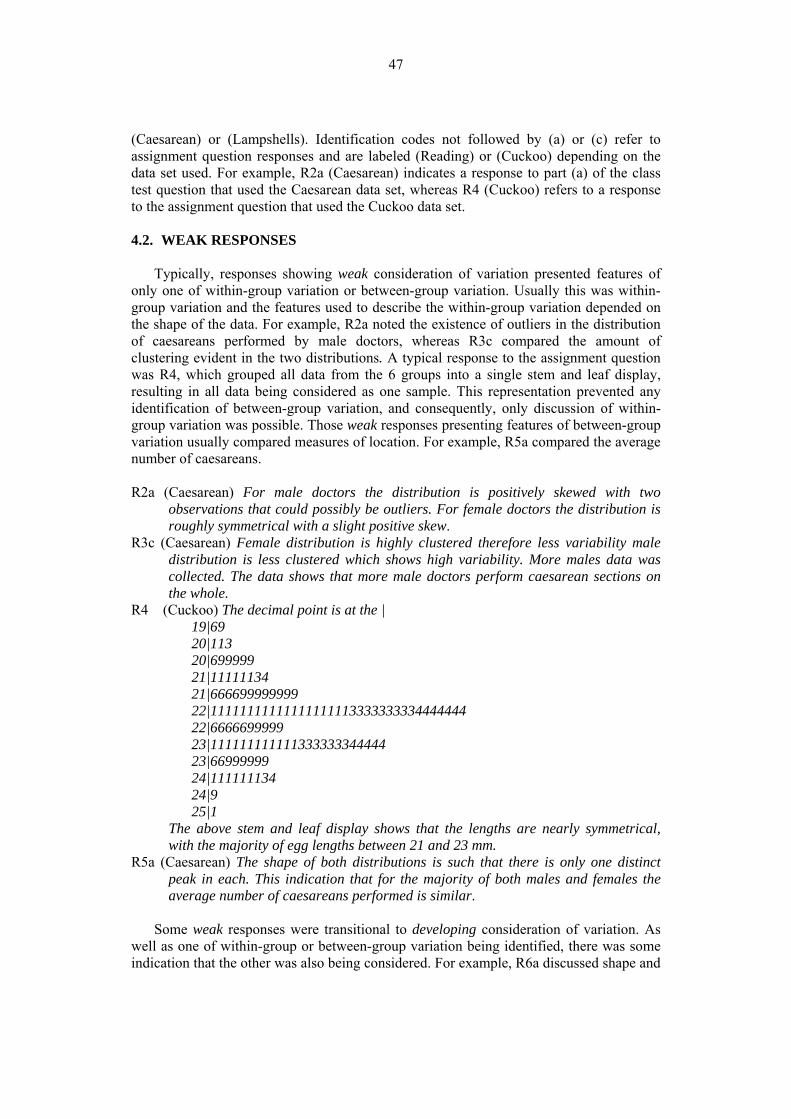
47
(Caesarean) or (Lampshells). Identification codes not followed by (a) or (c) refer to assignment question responses and are labeled (Reading) or (Cuckoo) depending on the data set used. For example, R2a (Caesarean) indicates a response to part (a) of the class test question that used the Caesarean data set, whereas R4 (Cuckoo) refers to a response to the assignment question that used the Cuckoo data set.
4.2. WEAK RESPONSES
Typically, responses showing weak consideration of variation presented features of
only one of within-group variation or between-group variation. Usually this was within-group variation and the features used to describe the within-group variation depended on the shape of the data. For example, R2a noted the existence of outliers in the distribution of caesareans performed by male doctors, whereas R3c compared the amount of clustering evident in the two distributions. A typical response to the assignment question was R4, which grouped all data from the 6 groups into a single stem and leaf display, resulting in all data being considered as one sample. This representation prevented any identification of between-group variation, and consequently, only discussion of within-group variation was possible. Those weak responses presenting features of between-group variation usually compared measures of location. For example, R5a compared the average number of caesareans.
R2a (Caesarean) For male doctors the distribution is positively skewed with two
observations that could possibly be outliers. For female doctors the distribution is roughly symmetrical with a slight positive skew.
R3c (Caesarean) Female distribution is highly clustered therefore less variability male distribution is less clustered which shows high variability. More males data was collected. The data shows that more male doctors perform caesarean sections on the whole.
R4 (Cuckoo) The decimal point is at the | 19|69 20|113 20|699999 21|11111134 21|666699999999 22|11111111111111111113333333334444444 22|6666699999 23|111111111111333333344444 23|66999999 24|111111134 24|9 25|1
The above stem and leaf display shows that the lengths are nearly symmetrical, with the majority of egg lengths between 21 and 23 mm.
R5a (Caesarean) The shape of both distributions is such that there is only one distinct peak in each. This indication that for the majority of both males and females the average number of caesareans performed is similar.
Some weak responses were transitional to developing consideration of variation. As
well as one of within-group or between-group variation being identified, there was some indication that the other was also being considered. For example, R6a discussed shape and
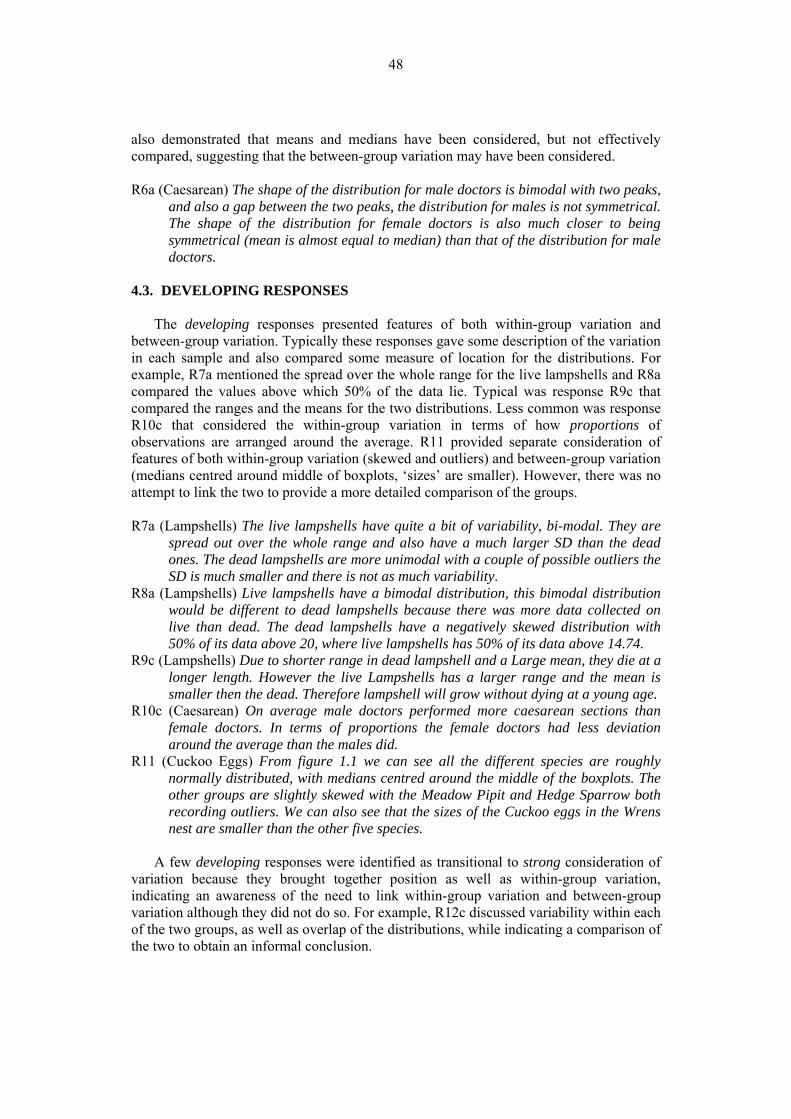
48
also demonstrated that means and medians have been considered, but not effectively compared, suggesting that the between-group variation may have been considered.
R6a (Caesarean) The shape of the distribution for male doctors is bimodal with two peaks,
and also a gap between the two peaks, the distribution for males is not symmetrical. The shape of the distribution for female doctors is also much closer to being symmetrical (mean is almost equal to median) than that of the distribution for male doctors.
4.3. DEVELOPING RESPONSES
The developing responses presented features of both within-group variation and
between-group variation. Typically these responses gave some description of the variation in each sample and also compared some measure of location for the distributions. For example, R7a mentioned the spread over the whole range for the live lampshells and R8a compared the values above which 50% of the data lie. Typical was response R9c that compared the ranges and the means for the two distributions. Less common was response R10c that considered the within-group variation in terms of how proportions of observations are arranged around the average. R11 provided separate consideration of features of both within-group variation (skewed and outliers) and between-group variation (medians centred around middle of boxplots, ‘sizes’ are smaller). However, there was no attempt to link the two to provide a more detailed comparison of the groups.
R7a (Lampshells) The live lampshells have quite a bit of variability, bi-modal. They are
spread out over the whole range and also have a much larger SD than the dead ones. The dead lampshells are more unimodal with a couple of possible outliers the SD is much smaller and there is not as much variability.
R8a (Lampshells) Live lampshells have a bimodal distribution, this bimodal distribution would be different to dead lampshells because there was more data collected on live than dead. The dead lampshells have a negatively skewed distribution with 50% of its data above 20, where live lampshells has 50% of its data above 14.74.
R9c (Lampshells) Due to shorter range in dead lampshell and a Large mean, they die at a longer length. However the live Lampshells has a larger range and the mean is smaller then the dead. Therefore lampshell will grow without dying at a young age.
R10c (Caesarean) On average male doctors performed more caesarean sections than female doctors. In terms of proportions the female doctors had less deviation around the average than the males did.
R11 (Cuckoo Eggs) From figure 1.1 we can see all the different species are roughly normally distributed, with medians centred around the middle of the boxplots. The other groups are slightly skewed with the Meadow Pipit and Hedge Sparrow both recording outliers. We can also see that the sizes of the Cuckoo eggs in the Wrens nest are smaller than the other five species.
A few developing responses were identified as transitional to strong consideration of
variation because they brought together position as well as within-group variation, indicating an awareness of the need to link within-group variation and between-group variation although they did not do so. For example, R12c discussed variability within each of the two groups, as well as overlap of the distributions, while indicating a comparison of the two to obtain an informal conclusion.
49
R12c (Lampshells) The live lampshells have a greater variability than that of the dead lampshells. It cannot clearly be said that dead lampshells are larger than live ones as there is too much overlap in the data. It can be seen that you will find smaller live lampshells than dead ones, probably because they will usually reach a reasonable age and length before they die. The smaller live lampshells are most likely the younger ones.
4.4. DISCUSSION
Students need to develop a sound consideration of variation and be able to apply it in
a variety of contexts. The proposed levels of consideration of variation (Table 5) arose from coding responses to two assessment tasks, according to the consideration of variation exhibited. This analysis has shown that different levels of consideration of variation exist and that these levels represent cognitive development of the concept. The progression from weaker to stronger consideration of variation is marked by improved use of terminology, reference to more than one type of variation, recognition of the need for taking variation into account when making inferences, and the linking of different forms of variation.
Both part (c) of the class test and part (a) of the assignment question required students to compare two distributions, a precursor to a more formal analysis of variance. Although no response was coded as strong, a strong response would be expected to link within-group and between-group variation, moving towards an intuitive analysis of variance. The wording of the tasks had an impact on the quality of responses and has implications for the results.
In their responses to part (a) of the class test, many students provided a single-word descriptor for the shape of the distribution (e.g., skewed, symmetric, bimodal). Given the wording of the question (“Describe the shape of the distributions”) it is not surprising that many students did not discuss variation in any detail. Furthermore, because part (c) of the same question asked for a comparison, it is unlikely that students would elaborate on links between within-group and between-group variation in part (a). In other words, the form of part (a) of the class test question did not encourage students to demonstrate a more developed consideration of variation. This was also true of the assignment question. Students may not have felt it necessary to include a comparison of within-group and between-group variation in their responses to part (a) of the assignment question because part (d) asked for a formal test (analysis of variance) to compare the groups. The impact of question structure on the amount of information about consideration of variation that student responses can exhibit has also been discussed in Reid and Reading (2004).
5. REFINING LEVEL DESCRIPTORS TO FORM A HIERARCHY OF
CONSIDERATION OF VARIATION
This paper has presented research that explored the development of tertiary students’ consideration of variation as they engaged in various learning activities and assessment tasks. First, the levels of consideration of variation that evolved from the analysis, in earlier studies, of student responses to minute papers (Table 1) and a questionnaire (Table 2) were presented. Next, the evolution of level descriptors based on responses to class test and assignment questions that asked students to compare distributions (Table 5) was described. These three descriptions of levels evolved from different tasks set in a variety of contexts. Previously, a hierarchy applicable across tasks was proposed by Reid and Reading (2005). Now, more detailed analysis of responses to the class test and assignment
50
questions, as well as closer interrogation of the levels developed from other tasks, has allowed refinement of the level descriptors resulting in a combined hierarchy. The level descriptors of this hierarchy are justified in the following section. 5.1. JUSTIFYING THE LEVEL DESCRIPTORS
To define each level of this combined hierarchy, the descriptors for the corresponding
level in each of the three earlier hierarchies (Tables 1, 2 & 5) were compared. In the following, the elements common to the three hierarchies (Tables 1, 2 & 5) are described, and differences highlighted for each level. In light of this comparison, the process of refinement of the level descriptors is then discussed.
No consideration of variation. All descriptors for this level were very similar, in that
responses failed to acknowledge any variation. Weak consideration of variation. All responses coded at this level, regardless of the
task, acknowledged the existence of variation but discussion was generally limited to a basic description of variation (e.g., range), or the description was incorrectly or poorly expressed. These responses indicated awareness that variation exists but suggested a lack of the language and tools necessary to be able to describe or use variation appropriately. It is acknowledged that some ‘incorrect’ descriptions may be due to lack of expertise with the English language rather than weak consideration. Those educators responsible for students who have English as a second language should take care when coding responses and also interview students to affirm the assessed level of consideration.
Developing consideration of variation. At this level, responses to all tasks provided a
more detailed and accurate description of at least one of the two sources of variation, that is, within-group and between-group variation. This was recognized as a minimum requirement for a response to be coded as exhibiting a developing consideration of variation in Tables 1 and 2. However, both the class test and the assignment questions required a comparison of distributions. Consequently, in the analysis of the responses to these tasks, it was deemed necessary for a response to include clear references to both within-group and between-group variation for a response to be coded as developing (Table 5).
Strong consideration of variation. At this level, the differences among the descriptors
used for the various tasks were more pronounced. Using the descriptors presented in Tables 1 and 2, if responses clearly referred to more than one source of variation they would be coded as strong responses. There was no descriptor that evolved from the responses to the class test and assignment questions (Table 5) because no responses were coded higher than developing. It was anticipated, however, that a strong response would link within-group and between-group variation, moving towards an intuitive analysis of variance.
Refining the level descriptors. The preceding comparison makes clear the elements
common to the level descriptors across the three hierarchies, but also highlights a number of differences. It was these differences that necessitated a refinement of the descriptors resulting in the Consideration of Variation Hierarchy (Table 6). For examples of responses to a variety of tasks at different levels refer to section 4 in this paper, Reading and Reid (2005), and Reid and Reading (2006).
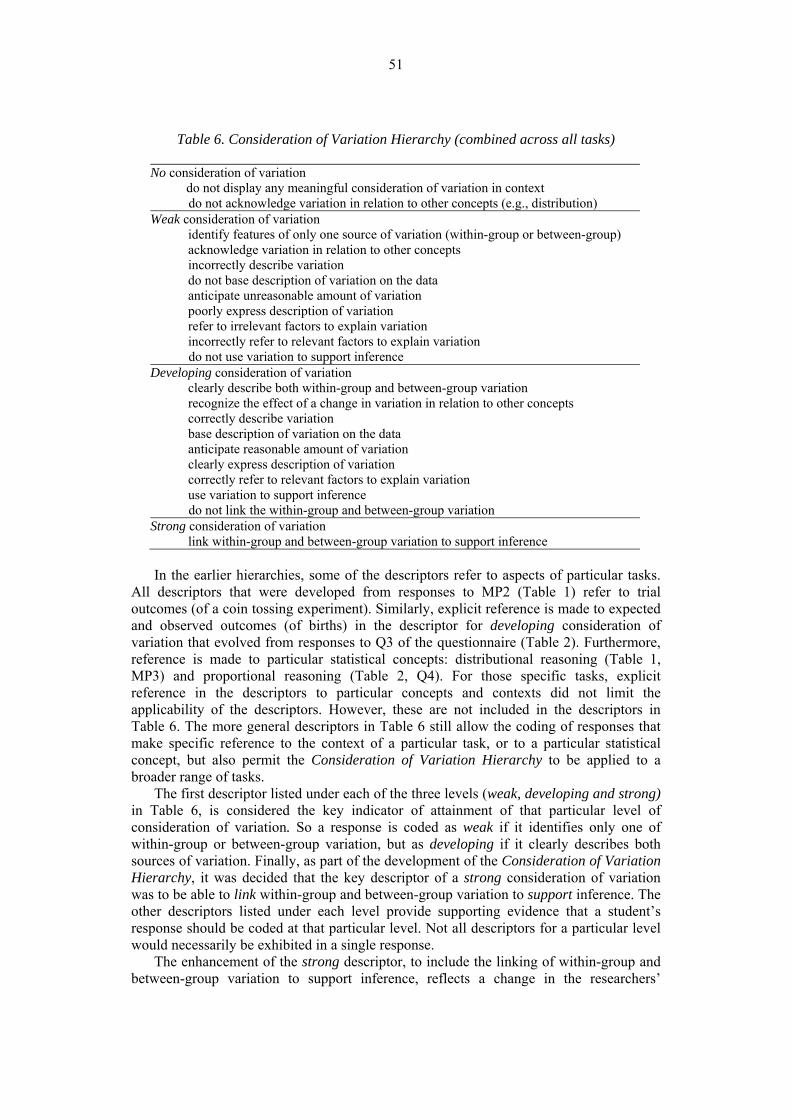
51
Table 6. Consideration of Variation Hierarchy (combined across all tasks)
No consideration of variation do not display any meaningful consideration of variation in context do not acknowledge variation in relation to other concepts (e.g., distribution)
Weak consideration of variation identify features of only one source of variation (within-group or between-group) acknowledge variation in relation to other concepts incorrectly describe variation do not base description of variation on the data anticipate unreasonable amount of variation poorly express description of variation refer to irrelevant factors to explain variation incorrectly refer to relevant factors to explain variation do not use variation to support inference
Developing consideration of variation clearly describe both within-group and between-group variation recognize the effect of a change in variation in relation to other concepts correctly describe variation base description of variation on the data anticipate reasonable amount of variation clearly express description of variation correctly refer to relevant factors to explain variation use variation to support inference do not link the within-group and between-group variation
Strong consideration of variation link within-group and between-group variation to support inference
In the earlier hierarchies, some of the descriptors refer to aspects of particular tasks.
All descriptors that were developed from responses to MP2 (Table 1) refer to trial outcomes (of a coin tossing experiment). Similarly, explicit reference is made to expected and observed outcomes (of births) in the descriptor for developing consideration of variation that evolved from responses to Q3 of the questionnaire (Table 2). Furthermore, reference is made to particular statistical concepts: distributional reasoning (Table 1, MP3) and proportional reasoning (Table 2, Q4). For those specific tasks, explicit reference in the descriptors to particular concepts and contexts did not limit the applicability of the descriptors. However, these are not included in the descriptors in Table 6. The more general descriptors in Table 6 still allow the coding of responses that make specific reference to the context of a particular task, or to a particular statistical concept, but also permit the Consideration of Variation Hierarchy to be applied to a broader range of tasks.
The first descriptor listed under each of the three levels (weak, developing and strong) in Table 6, is considered the key indicator of attainment of that particular level of consideration of variation. So a response is coded as weak if it identifies only one of within-group or between-group variation, but as developing if it clearly describes both sources of variation. Finally, as part of the development of the Consideration of Variation Hierarchy, it was decided that the key descriptor of a strong consideration of variation was to be able to link within-group and between-group variation to support inference. The other descriptors listed under each level provide supporting evidence that a student’s response should be coded at that particular level. Not all descriptors for a particular level would necessarily be exhibited in a single response.
The enhancement of the strong descriptor, to include the linking of within-group and between-group variation to support inference, reflects a change in the researchers’
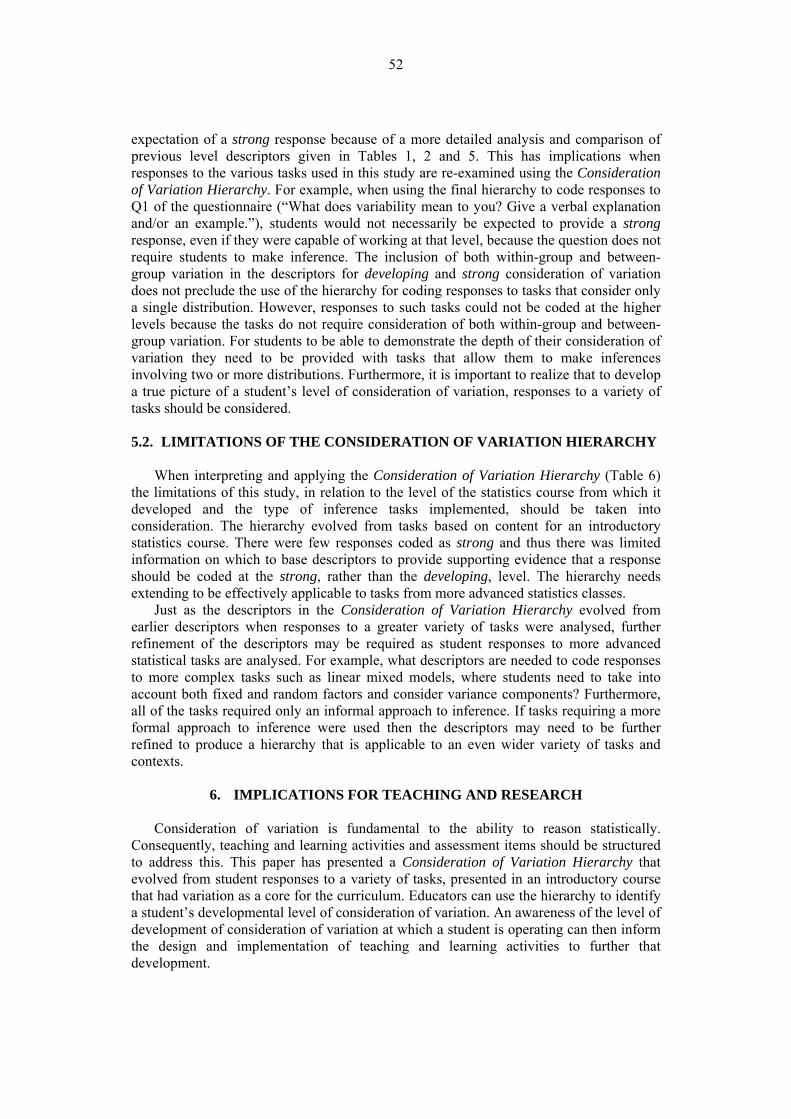
52
expectation of a strong response because of a more detailed analysis and comparison of previous level descriptors given in Tables 1, 2 and 5. This has implications when responses to the various tasks used in this study are re-examined using the Consideration of Variation Hierarchy. For example, when using the final hierarchy to code responses to Q1 of the questionnaire (“What does variability mean to you? Give a verbal explanation and/or an example.”), students would not necessarily be expected to provide a strong response, even if they were capable of working at that level, because the question does not require students to make inference. The inclusion of both within-group and between-group variation in the descriptors for developing and strong consideration of variation does not preclude the use of the hierarchy for coding responses to tasks that consider only a single distribution. However, responses to such tasks could not be coded at the higher levels because the tasks do not require consideration of both within-group and between-group variation. For students to be able to demonstrate the depth of their consideration of variation they need to be provided with tasks that allow them to make inferences involving two or more distributions. Furthermore, it is important to realize that to develop a true picture of a student’s level of consideration of variation, responses to a variety of tasks should be considered.
5.2. LIMITATIONS OF THE CONSIDERATION OF VARIATION HIERARCHY
When interpreting and applying the Consideration of Variation Hierarchy (Table 6)
the limitations of this study, in relation to the level of the statistics course from which it developed and the type of inference tasks implemented, should be taken into consideration. The hierarchy evolved from tasks based on content for an introductory statistics course. There were few responses coded as strong and thus there was limited information on which to base descriptors to provide supporting evidence that a response should be coded at the strong, rather than the developing, level. The hierarchy needs extending to be effectively applicable to tasks from more advanced statistics classes.
Just as the descriptors in the Consideration of Variation Hierarchy evolved from earlier descriptors when responses to a greater variety of tasks were analysed, further refinement of the descriptors may be required as student responses to more advanced statistical tasks are analysed. For example, what descriptors are needed to code responses to more complex tasks such as linear mixed models, where students need to take into account both fixed and random factors and consider variance components? Furthermore, all of the tasks required only an informal approach to inference. If tasks requiring a more formal approach to inference were used then the descriptors may need to be further refined to produce a hierarchy that is applicable to an even wider variety of tasks and contexts.
6. IMPLICATIONS FOR TEACHING AND RESEARCH
Consideration of variation is fundamental to the ability to reason statistically.
Consequently, teaching and learning activities and assessment items should be structured to address this. This paper has presented a Consideration of Variation Hierarchy that evolved from student responses to a variety of tasks, presented in an introductory course that had variation as a core for the curriculum. Educators can use the hierarchy to identify a student’s developmental level of consideration of variation. An awareness of the level of development of consideration of variation at which a student is operating can then inform the design and implementation of teaching and learning activities to further that development.
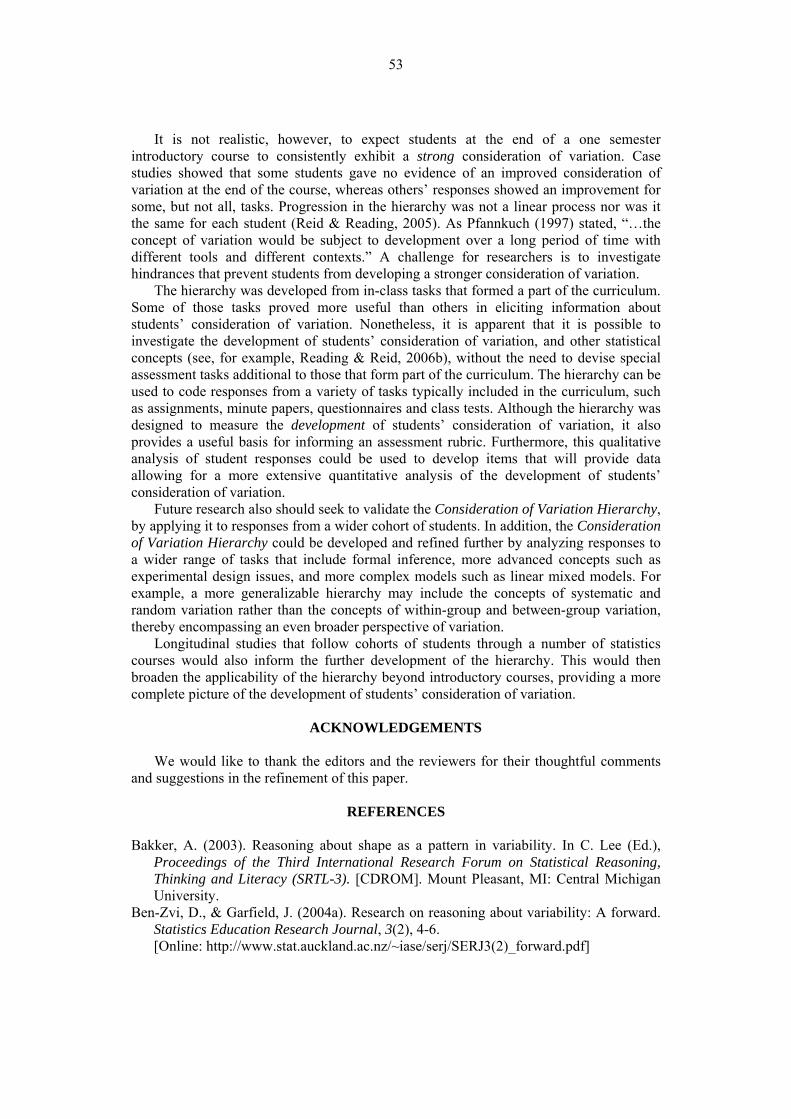
53
It is not realistic, however, to expect students at the end of a one semester introductory course to consistently exhibit a strong consideration of variation. Case studies showed that some students gave no evidence of an improved consideration of variation at the end of the course, whereas others’ responses showed an improvement for some, but not all, tasks. Progression in the hierarchy was not a linear process nor was it the same for each student (Reid & Reading, 2005). As Pfannkuch (1997) stated, “…the concept of variation would be subject to development over a long period of time with different tools and different contexts.” A challenge for researchers is to investigate hindrances that prevent students from developing a stronger consideration of variation.
The hierarchy was developed from in-class tasks that formed a part of the curriculum. Some of those tasks proved more useful than others in eliciting information about students’ consideration of variation. Nonetheless, it is apparent that it is possible to investigate the development of students’ consideration of variation, and other statistical concepts (see, for example, Reading & Reid, 2006b), without the need to devise special assessment tasks additional to those that form part of the curriculum. The hierarchy can be used to code responses from a variety of tasks typically included in the curriculum, such as assignments, minute papers, questionnaires and class tests. Although the hierarchy was designed to measure the development of students’ consideration of variation, it also provides a useful basis for informing an assessment rubric. Furthermore, this qualitative analysis of student responses could be used to develop items that will provide data allowing for a more extensive quantitative analysis of the development of students’ consideration of variation.
Future research also should seek to validate the Consideration of Variation Hierarchy, by applying it to responses from a wider cohort of students. In addition, the Consideration of Variation Hierarchy could be developed and refined further by analyzing responses to a wider range of tasks that include formal inference, more advanced concepts such as experimental design issues, and more complex models such as linear mixed models. For example, a more generalizable hierarchy may include the concepts of systematic and random variation rather than the concepts of within-group and between-group variation, thereby encompassing an even broader perspective of variation.
Longitudinal studies that follow cohorts of students through a number of statistics courses would also inform the further development of the hierarchy. This would then broaden the applicability of the hierarchy beyond introductory courses, providing a more complete picture of the development of students’ consideration of variation.
ACKNOWLEDGEMENTS
We would like to thank the editors and the reviewers for their thoughtful comments
and suggestions in the refinement of this paper.
REFERENCES
Bakker, A. (2003). Reasoning about shape as a pattern in variability. In C. Lee (Ed.), Proceedings of the Third International Research Forum on Statistical Reasoning, Thinking and Literacy (SRTL-3). [CDROM]. Mount Pleasant, MI: Central Michigan University.
Ben-Zvi, D., & Garfield, J. (2004a). Research on reasoning about variability: A forward. Statistics Education Research Journal, 3(2), 4-6. [Online: http://www.stat.auckland.ac.nz/~iase/serj/SERJ3(2)_forward.pdf]
54
Ben-Zvi, D., & Garfield, J. B. (Eds.) (2004b). Research on reasoning about variability [Special issue]. Statistics Education Research Journal, 3(2).
[Online: http://www.stat.auckland.ac.nz/~iase/serj/SERJ3(2).pdf] Chance, B. L. (2002). Components of statistical thinking and implications for instruction
and assessment. Journal of Statistics Education, 10(3). [Online: www.amstat.org/publications/jse/v10n3/chance.html]
delMas, R. C., & Liu, Y. (2003). In C. Lee (Ed.), Proceedings of the Third International Research Forum on Statistical Reasoning, Thinking and Literacy (SRTL-3). [CDROM] Mount Pleasant, MI: Central Michigan University.
Garfield, J. (2002). The challenge of developing statistical reasoning. Journal of Statistics Education, 10(3). [Online: www.amstat.org/publications/jse/v10n3/garfield.html]
Garfield, J., & Ben-Zvi, D. (2004). Research on statistical literacy, reasoning and thinking: Issues, challenges, and implications. In D. Ben-Zvi & J. Garfield (Eds.), The Challenge of Developing Statistical Literacy, Reasoning and Thinking (pp. 397- 409). Dordrecht, The Netherlands: Kluwer Academic Publishers.
Garfield, J. B., & Ben-Zvi, D. (Eds.) (2005). Reasoning about variation [Special section]. Statistics Education Research Journal, 4(1).
[Online: http://www.stat.auckland.ac.nz/~iase/serj/SERJ4(1).pdf] Garfield, J., delMas, R., & Chance, B. (2007). Using students’ informal notions of
variability to develop an understanding of formal measures of variability. In M. C. Lovett & P. Shah (Eds.), Thinking with Data (pp. 117-148). Mahwah, NJ: Earlbaum.
Garfield, J., & Gal, I. (1999). Assessment and statistics education: Current challenges and directions. International Statistical Review, 67(1), 1-12.
Garfield, J., Hogg, B., Schau, C., & Whittinghill, D. (2002). First courses in statistical science: The status of educational reform efforts. Journal of Statistics Education, 10(2). [Online: www.amstat.org/publications/jse/v10n2/garfield.html]
Lann, A., & Falk, R. (2003). What are the Clues for Intuitive Assessment of Variability? In C. Lee (Ed.), Proceedings of the Third International Research Forum on Statistical Reasoning, Thinking and Literacy (SRTL-3). [CDROM] Mount Pleasant, MI: Central Michigan University.
Lee, C. (Ed.) (2004). Proceedings of the Third International Research Forum on Statistical Reasoning, Thinking and Literacy (SRTL-3). [CDROM] Mount Pleasant, MI: Central Michigan University.
MacGillivray, H. (2004). Coherent and purposeful development in statistics across the education spectrum. In G. Burrill, & M. Camden (Eds.), Curricular Development in Statistics Education: International Association for Statistical Education 2004 Roundtable. Voorburg, The Netherlands: International Statistical Institute.
Makar, K., & Confrey, J. (2005). “Variation talk”: Articulating meaning in statistics. Statistics Education Research Journal, 4(1), 27-54. [Online: http://www.stat.auckland.ac.nz/~iase/serj/SERJ4(1)_Makar_Confrey.pdf]
Meletiou-Mavrotheris, M., & Lee, C. (2002). Teaching students the stochastic nature of statistical concepts in an introductory statistics course, Statistics Education Research Journal, 1(2), 22-37. [Online: www.stat.auckland.ac.nz/serj/SERJ1(2).pdf]
Moore, D. S., & McCabe, G. P. (1999). Introduction to the Practice of Statistics, (3rd ed.), New York: Freeman.
Pfannkuch, M. (1997). Statistical thinking: One statistician’s perspective. In F. Biddulph & K. Carr (Eds.), People in Mathematics Education. Proceedings of the Twentieth Annual Conference of the Mathematics Education Research Group of Australasia Incorporated, (Vol. 1, pp. 192-199). Hamilton: Mathematics Education Research Group of Australasia Incorporated.
55
Reading, C., & Reid, J. (2005). Consideration of variation: A model for curriculum development. In G. Burrill & M. Camden (Eds.), Curricular Development in Statistics Education: International Association for Statistical Education 2004 Roundtable (pp. 36-53). Voorburg, The Netherlands: International Statistical Institute.
Reading, C., & Reid, J. (2006a). Listen to the students: Understanding and supporting students’ reasoning about variation. In A. Rossman & B. Chance (Eds.), Working Cooperatively in Statistics Education. Proceedings of the Seventh International Conference on Teaching Statistics, [CDROM]. Salvador, Brazil. Voorburg, The Netherlands: International Statistical Institute.
[Online: http://www.stat.auckland.ac.nz/~iase/publications/17/6A1_READ.pdf] Reading, C., & Reid, J. (2006b). An emerging hierarchy of reasoning about distribution:
From a variation perspective. Statistics Education Research Journal, 5(2), 46-68. [Online: http://www.stat.auckland.ac.nz/~iase/serj/SERJ5(2)_Reading_Reid.pdf]
Reading, C., & Shaughnessy, M. (2004). Reasoning about variation. In D. Ben-Zvi & J. Garfield (Eds.), The Challenge of Developing Statistical Literacy, Reasoning and Thinking (pp. 201-226). Dordrecht, The Netherlands: Kluwer Academic Publishers.
Reid, J., & Reading, C. (2004). Just a minute? The use of minute papers to investigate statistical thinking in research, teaching and learning. Adults Learning Maths Newsletter (21), 1-4.
[Online: http://www.alm-online.org/Newsletters/News21.pdf] Reid, J., & Reading, C. (2005). Developing consideration of variation: Case studies from
a tertiary introductory service statistics course. Proceedings of the 55th Session of the International Statistical Institute, Sydney, Australia. Voorburg, The Netherlands: International Statistical Institute.
[Online: http://www.stat.auckland.ac.nz/~iase/publications/13/Reid-Reading.pdf] Reid, J., & Reading, C. (2006). A hierarchy of tertiary students’ consideration of
variation, in A. Rossman & B. Chance (Eds.), Working Cooperatively in Statistics Education. Proceedings of the Seventh International Conference on Teaching Statistics, Salvador, Brazil. Voorburg, The Netherlands: International Statistical Institute.
[Online: http://www.stat.auckland.ac.nz/~iase/publications/17/C122.pdf] Rumsey, D. J. (2002). Statistical literacy as a goal for introductory statistics courses.
Journal of Statistics Education, 10(3). [Online: www.amstat.org/publications/jse/v10n3/rumsey2.html]
Tippett, L. H. C. (1952). The Methods of Statistics (4th ed.). New York: John Wiley and Sons.
Torok, R., & Watson, J. (2000). Development of the concept of statistical variation: An exploratory study. Mathematics Education Research Journal, 12(2), 147-169.
Wild, C., & Pfannkuch, M. (1999). Statistical thinking in empirical enquiry. International Statistical Review, 67(3), 223-265. [Online: www.stat.auckland.ac.nz/~iase/publications/isr/99.Wild.Pfannkuch.pdf]
Wild, C. J., & Seber, C. A. (2000). Chance encounters: A first course in data analysis and inference. New York: John Wiley and Sons.
JACKIE REID School of Science and Technology
University of New England Armidale, NSW, AUSTRALIA, 2351
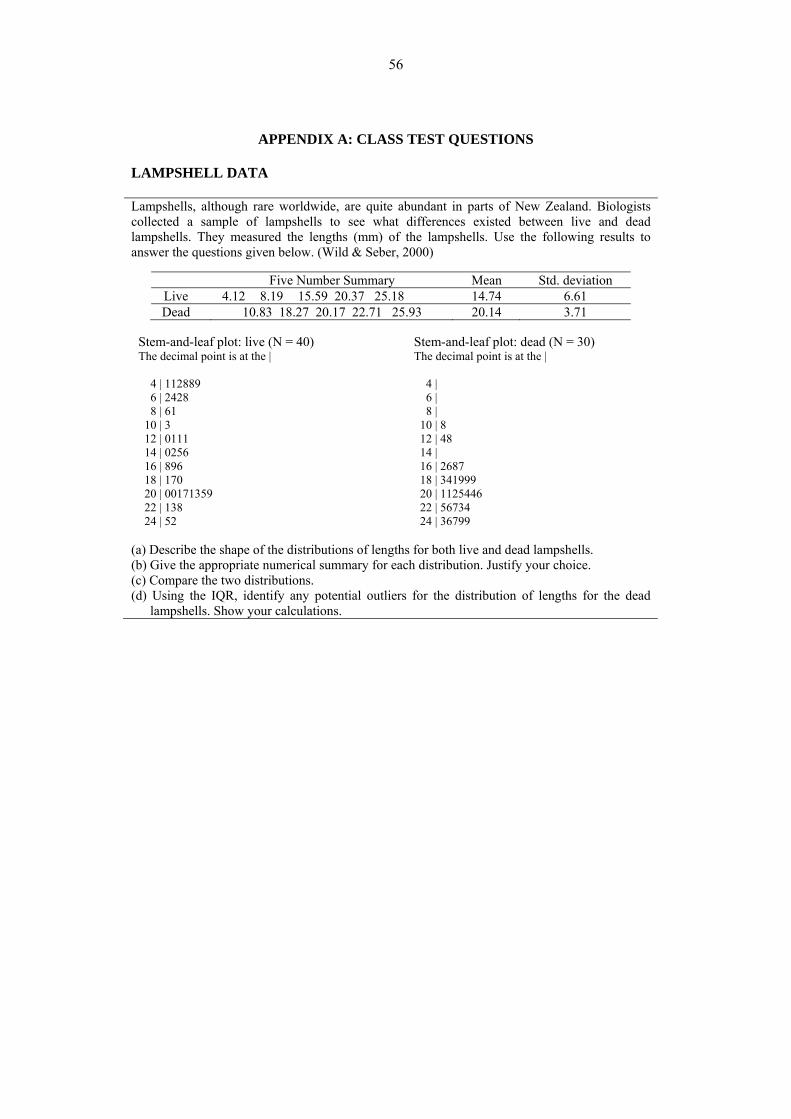
56
APPENDIX A: CLASS TEST QUESTIONS LAMPSHELL DATA
Lampshells, although rare worldwide, are quite abundant in parts of New Zealand. Biologists collected a sample of lampshells to see what differences existed between live and dead lampshells. They measured the lengths (mm) of the lampshells. Use the following results to answer the questions given below. (Wild & Seber, 2000)
Five Number Summary Mean Std. deviation Live 4.12 8.19 15.59 20.37 25.18 14.74 6.61 Dead 10.83 18.27 20.17 22.71 25.93 20.14 3.71
Stem-and-leaf plot: live (N = 40) The decimal point is at the | 4 | 112889 6 | 2428 8 | 61 10 | 3 12 | 0111 14 | 0256 16 | 896 18 | 170 20 | 00171359 22 | 138 24 | 52
Stem-and-leaf plot: dead (N = 30) The decimal point is at the | 4 | 6 | 8 | 10 | 8 12 | 48 14 | 16 | 2687 18 | 341999 20 | 1125446 22 | 56734 24 | 36799
(a) Describe the shape of the distributions of lengths for both live and dead lampshells. (b) Give the appropriate numerical summary for each distribution. Justify your choice. (c) Compare the two distributions. (d) Using the IQR, identify any potential outliers for the distribution of lengths for the dead
lampshells. Show your calculations.
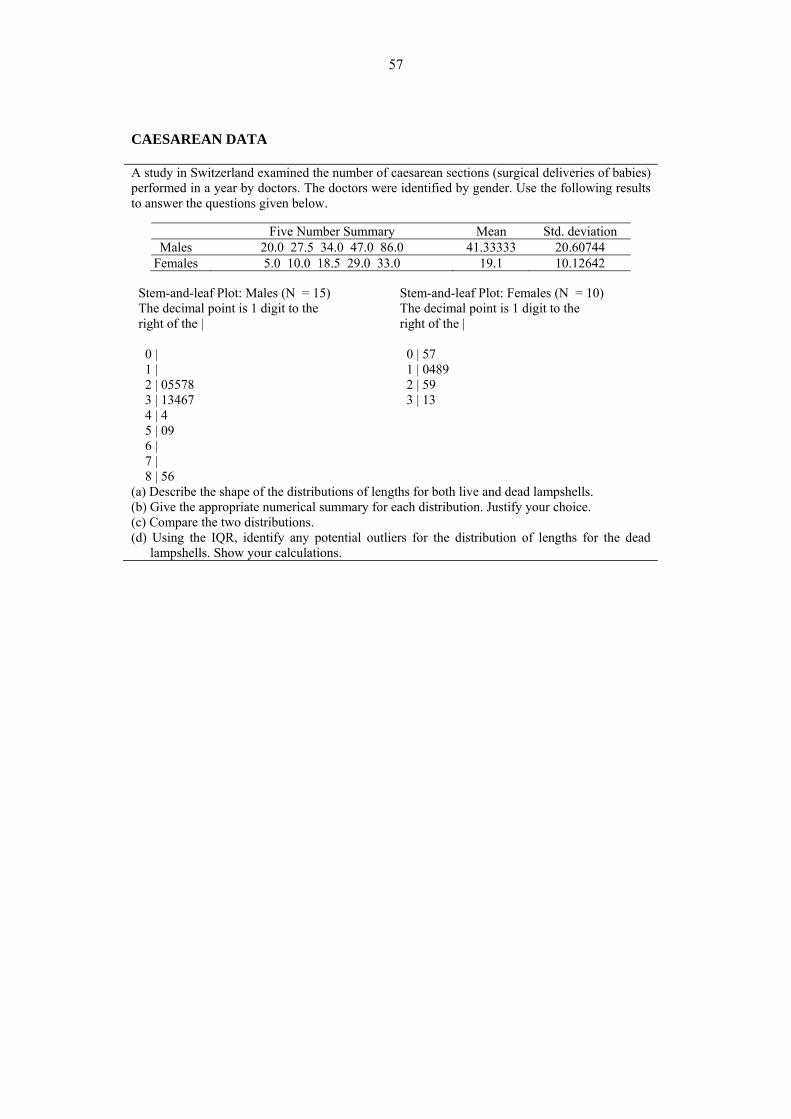
57
CAESAREAN DATA
A study in Switzerland examined the number of caesarean sections (surgical deliveries of babies) performed in a year by doctors. The doctors were identified by gender. Use the following results to answer the questions given below.
Five Number Summary Mean Std. deviation Males 20.0 27.5 34.0 47.0 86.0 41.33333 20.60744
Females 5.0 10.0 18.5 29.0 33.0 19.1 10.12642
Stem-and-leaf Plot: Males (N = 15) The decimal point is 1 digit to the right of the | 0 | 1 | 2 | 05578 3 | 13467 4 | 4 5 | 09 6 | 7 | 8 | 56
Stem-and-leaf Plot: Females (N = 10) The decimal point is 1 digit to the right of the | 0 | 57 1 | 0489 2 | 59 3 | 13
(a) Describe the shape of the distributions of lengths for both live and dead lampshells. (b) Give the appropriate numerical summary for each distribution. Justify your choice. (c) Compare the two distributions. (d) Using the IQR, identify any potential outliers for the distribution of lengths for the dead
lampshells. Show your calculations.
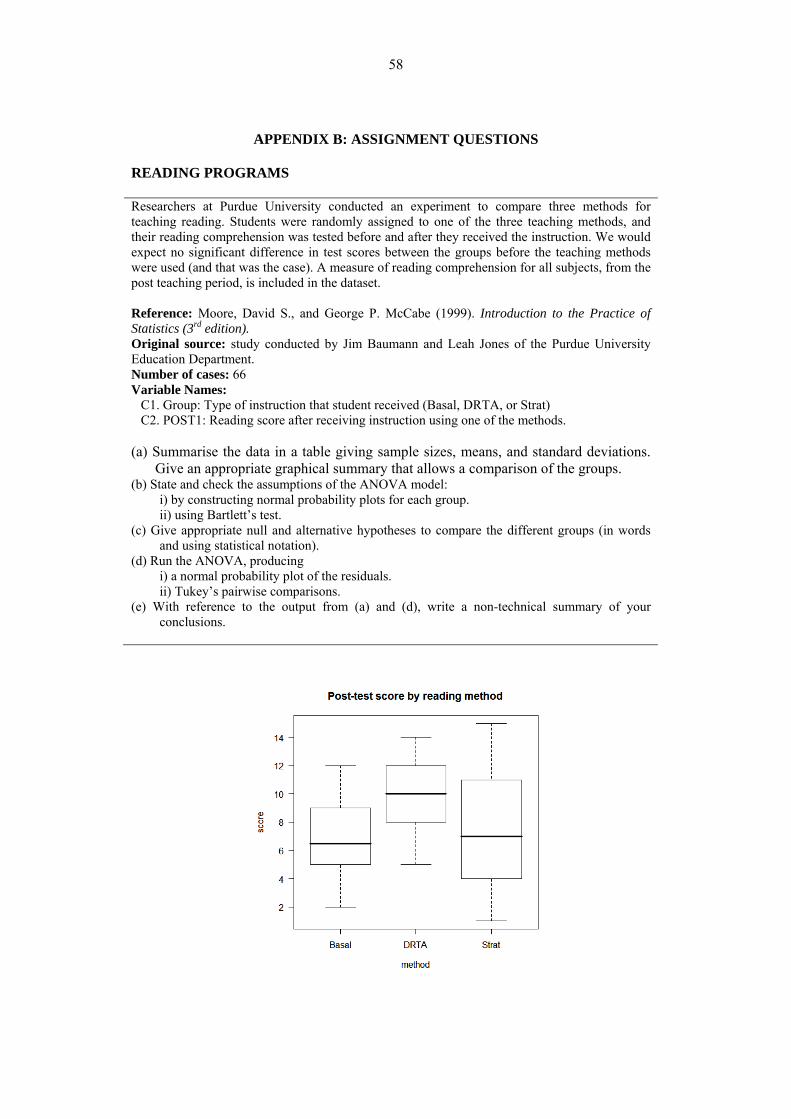
58
APPENDIX B: ASSIGNMENT QUESTIONS READING PROGRAMS
Researchers at Purdue University conducted an experiment to compare three methods for teaching reading. Students were randomly assigned to one of the three teaching methods, and their reading comprehension was tested before and after they received the instruction. We would expect no significant difference in test scores between the groups before the teaching methods were used (and that was the case). A measure of reading comprehension for all subjects, from the post teaching period, is included in the dataset. Reference: Moore, David S., and George P. McCabe (1999). Introduction to the Practice of Statistics (3rd edition). Original source: study conducted by Jim Baumann and Leah Jones of the Purdue University Education Department. Number of cases: 66 Variable Names:
C1. Group: Type of instruction that student received (Basal, DRTA, or Strat) C2. POST1: Reading score after receiving instruction using one of the methods.
(a) Summarise the data in a table giving sample sizes, means, and standard deviations.
Give an appropriate graphical summary that allows a comparison of the groups. (b) State and check the assumptions of the ANOVA model:
i) by constructing normal probability plots for each group. ii) using Bartlett’s test.
(c) Give appropriate null and alternative hypotheses to compare the different groups (in words and using statistical notation).
(d) Run the ANOVA, producing i) a normal probability plot of the residuals. ii) Tukey’s pairwise comparisons.
(e) With reference to the output from (a) and (d), write a non-technical summary of your conclusions.
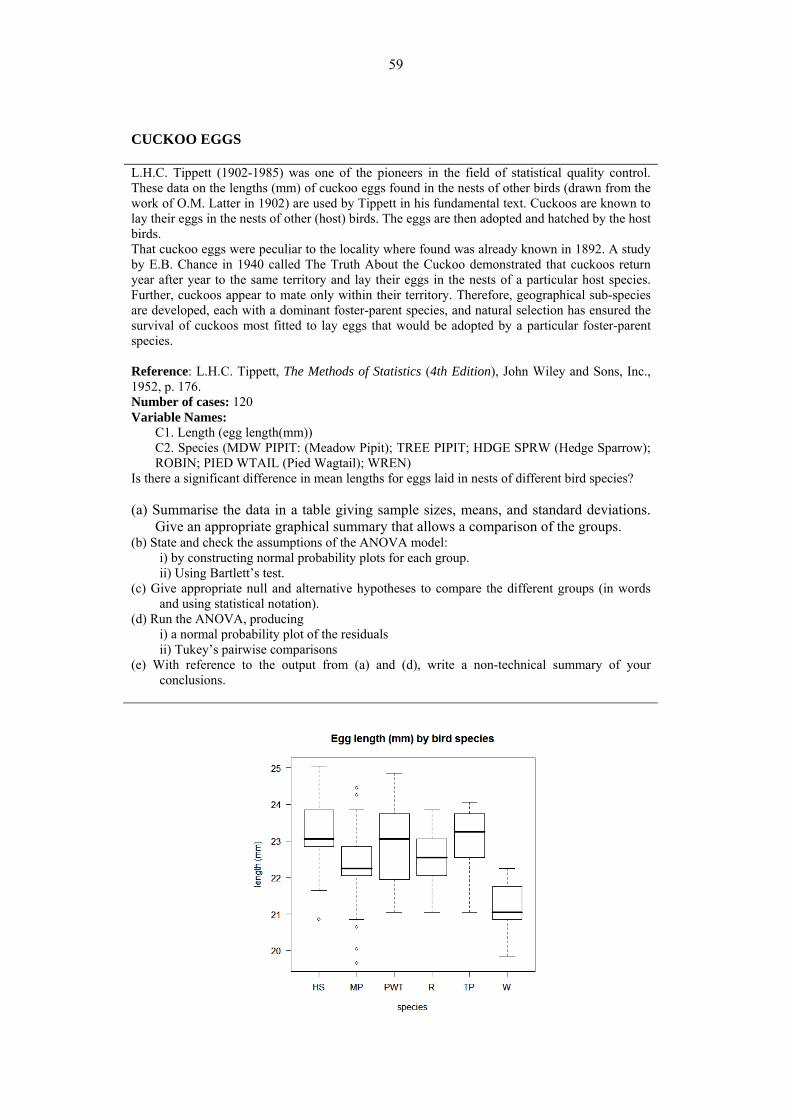
59
CUCKOO EGGS
L.H.C. Tippett (1902-1985) was one of the pioneers in the field of statistical quality control. These data on the lengths (mm) of cuckoo eggs found in the nests of other birds (drawn from the work of O.M. Latter in 1902) are used by Tippett in his fundamental text. Cuckoos are known to lay their eggs in the nests of other (host) birds. The eggs are then adopted and hatched by the host birds. That cuckoo eggs were peculiar to the locality where found was already known in 1892. A study by E.B. Chance in 1940 called The Truth About the Cuckoo demonstrated that cuckoos return year after year to the same territory and lay their eggs in the nests of a particular host species. Further, cuckoos appear to mate only within their territory. Therefore, geographical sub-species are developed, each with a dominant foster-parent species, and natural selection has ensured the survival of cuckoos most fitted to lay eggs that would be adopted by a particular foster-parent species. Reference: L.H.C. Tippett, The Methods of Statistics (4th Edition), John Wiley and Sons, Inc., 1952, p. 176. Number of cases: 120 Variable Names:
C1. Length (egg length(mm)) C2. Species (MDW PIPIT: (Meadow Pipit); TREE PIPIT; HDGE SPRW (Hedge Sparrow); ROBIN; PIED WTAIL (Pied Wagtail); WREN)
Is there a significant difference in mean lengths for eggs laid in nests of different bird species? (a) Summarise the data in a table giving sample sizes, means, and standard deviations.
Give an appropriate graphical summary that allows a comparison of the groups. (b) State and check the assumptions of the ANOVA model:
i) by constructing normal probability plots for each group. ii) Using Bartlett’s test.
(c) Give appropriate null and alternative hypotheses to compare the different groups (in words and using statistical notation).
(d) Run the ANOVA, producing i) a normal probability plot of the residuals ii) Tukey’s pairwise comparisons
(e) With reference to the output from (a) and (d), write a non-technical summary of your conclusions.
60
FORTHCOMING IASE CONFERENCES5
JOINT ICMI /IASE STUDY STATISTICS EDUCATION IN SCHOOL MATHEMATICS:
CHALLENGES FOR TEACHING AND TEACHER EDUCATION Monterrey, Mexico, June 30 - July 4, 2008
The International Commission on Mathematical
Instruction (ICMI, http://www.mathunion.org/ICMI/) and the International Association for Statistical Education (IASE, http://www.stat.auckland.ac.nz/~iase/) are pleased to announce the Joint ICMI /IASE Study Statistics Education in School Mathematics: Challenges for Teaching and Teacher Education.
Following the tradition of ICMI Studies, this Study will comprise two parts: the Joint Study Conference and the production of the Joint Study book. The Joint Study Conference will be merged with the IASE 2008 Round Table Conference.
The Joint Study Conference (ICMI Study and IASE Round Table Conference) will take place at the Instituto Tecnológico y de Estudios Superiores. Monterrey, Mexico (http://www.mty.itesm.mx/), from June 30 to July 4, 2008. Participation in the Conference is only by invitation, based on a submitted contribution and a refereeing process. Accepted papers will be presented in the Conference and will appear in the Proceedings that will be published by ICMI and IASE as a CD-ROM and on the Internet.
The second part of the Joint Study – the Joint Study book – will be produced after the conference and will be published in the ICMI Study Series. Participation in the Joint Study Conference does not automatically assure participation in the book, because a second selection and rewriting of selected papers will be made after the conference.
More information: Carmen Batanero, [email protected] Website: http://www.stat.auckland.ac.nz/~iase/temp/RoundTable2008Announce.htm
ICME 11 INTERNATIONAL CONGRESS ON MATHEMATICAL EDUCATION
TOPIC STUDY GROUP # 13 RESEARCH AND DEVELOPMENT IN THE TEACHING AND LEARNING OF
PROBABILITY Monterrey, Mexico, July 6 - 13, 2008
Probability and statistics education are relatively new disciplines. Both have only
recently been introduced into main stream school curricula in many countries. Although application-oriented statistics is undisputed in its relevance, discussion about probability is more ambivalent. When probability is reduced to its classical conception, mainly based on combinatorics or its formal treatment in higher mathematics, it can be seen as irrelevant, and may be abandoned to leave only the statistical element of the stochastics discipline. However, we believe that there are some powerful arguments in favour of a strong role for probability within stochastics curricula.
We invite submissions related to the following topics:
Statistics Education Research Journal, 7(1), 60-67, http://www.stat.auckland.ac.nz/serj © International Association for Statistical Education (IASE/ISI), May, 2008
61
Individuals’ corner • Students’ understanding and misunderstanding of fundamental probabilistic
concepts • Ideas of probability in young children
Impact of technology • The use of technology for students’ learning of probability • Using specific software to study probability and sampling distributions • Special issues in e-learning
Teacher’s corner • Teacher education on the topic of probability • Teachers’ conceptions about teaching probability
Fundamental ideas • The probabilistic idea of random variable; distribution, expectation • The central limit theorem; convergence • Bayes’ theorem and conditional probability; independence; exchangeability • Probabilistic modelling – a probabilistic look at distributions
TEAM CHAIRS
Manfred Borovcnik (Austria), [email protected] Dave Pratt (U.K.), [email protected] Silvia Alatorre Frenk (Mexico), [email protected]
TEAM MEMBERS
Carmen Batanero (Spain), [email protected] Wu Yingkang (China), [email protected]
Website: http://tsg.icme11.org/tsg/show/14
ICME 11 INTERNATIONAL CONGRESS ON MATHEMATICAL EDUCATION
TOPIC STUDY GROUP # 14 RESEARCH AND DEVELOPMENT IN THE TEACHING AND LEARNING OF
STATISTICS Monterrey, Mexico, July 6 - 13, 2008
Statistics education is a growing field of research and development at school and
university level. The topic group will focus on presenting and discussing recent research. Statistics at school level is usually taught in the mathematics classroom in connection
with learning probability. Inferential statistics is based on basic understandings of probability. Our topic includes probabilistic aspects in learning statistics, whereas research with a specific focus on learning probability is being discussed TSG 13 of ICME.
We are open to all kinds of relevant research papers, but our specific focus will be on the following topics:
• Students’ thinking and reasoning about distributions (including variability, comparing distributions)
• Students’ making inferences from data (from informal inference to more formal inference, inference from sample to population or process, from data to context, role of models and probability)
• Statistical literacy
62
• Role of technology (tools, applets, internet) • Research on teachers and teaching of statistics
TEAM CHAIRS:
Rolf Biehler (Germany), [email protected] Mike Shaughnessy (USA), [email protected]
TEAM MEMBERS
Omar Rouan (Morocco), [email protected] Ernesto Sánchez (Mexico), [email protected] Jane Watson (Australia), [email protected]
Website: http://tsg.icme11.org/tsg/show/15
SRTL-6 THE SIXTH INTERNATIONAL RESEARCH FORUM ON STATISTICAL
REASONING, THINKING, AND LITERACY The Role of Context and Evidence in Informal Inferential Reasoning
Brisbane, Australia, July 10-16, 2009
The sixth in a series of International Research Forums on Statistical Reasoning,
Thinking and Literacy (SRTL-6) is to be held in Brisbane, Australia from July 10 to July 16, 2009. The School of Education at The University of Queensland, will host the Forum. The Forum’s focus will build on the work presented and discussed at SRTL-5 (August, 2007, Coventry, UK, http://srtl.stat.auckland.ac.nz/srtl5/research_forums) on informal ideas of statistical inference. Recent research suggests an important role for developing ideas of informal types of statistical inference even at early educational levels. Researchers have developed instructional activities that encourage students to infer beyond samples of data and use technological tools to support these informal inferences.
The findings of these studies reveal that the context of the data and the use of evidence may be important factors to study further. The role of context is of particular interest because in drawing (informal) inferences from data, “students must learn to walk two fine lines. First, they must maintain a view of data as ‘numbers with a context’” (Moore, 1992). At the same time, “they must learn to see the data as separate in many ways from the real-world event they observed” (Konold & Higgins, 2003, p. 195). That is, they must abstract the data from that context. The role of evidence is also of particular interest because in learning how to make data-based claims (argumentation), students must consider the evidence used to support the claim, the quality and justification of the evidence, limitations of the evidence and finally, an indication of how convincing the argument is (Ben-Zvi, Gil, & Apel, 2007).
Based on SRTL-5, we characterize Informal Inferential Reasoning (IIR) as the cognitive activities involved in drawing conclusions with some degree of uncertainty that go beyond the data and having empirical evidence for them. Three principles appear to be essential to informal inference: (1) generalizations (including predictions, parameter estimates, and conclusions) that go beyond describing the given data; (2) the use of data as evidence for those generalizations; and (3) conclusions that express a degree of uncertainty, whether or not quantified, accounting for the variability or uncertainty that is
63
unavoidable when generalizing beyond the immediate data to a population or a process (Makar & Rubin, 2007).
An interesting range of diverse research presentations and discussions have been planned and we look forward to a stimulating and enriching gathering. These papers will address the role of context and evidence when reasoning about informal inference at all levels of education including the professional development of elementary and secondary teachers.
The structure of the scientific program will be a mixture of formal and informal sessions, small group and whole group discussions, and the opportunity for extensive analysis of video-taped research data. There will also be a poster session for exhibiting current research of participants on additional topics related to statistics education. The Forum is co-chaired by Dani Ben-Zvi (University of Haifa, Israel) and Joan Garfield (University of Minnesota, USA), locally organized by Katie Makar and Michael Bulmer (The University of Queensland), and planned by a prestigious international advisory committee. Conference attendance is by invitation only. For more information, visit the SRTL website at: http://srtl.stat.auckland.ac.nz/ or email [email protected].
ISI-57 THE 2009 SESSION OF THE INTERNATIONAL STATISTICAL INSTITUTE
Durban, South Africa, August 16 - 22, 2009
IASE sponsored Invited Paper Meetings for 57th Session in Durban are being organised by Helen MacGillivray (Australia, [email protected]). The IASE Programme Committee for ISI-57 has chosen the theme - Statistics Education for the Future.
IASE has nine IPM (Invited Paper Meeting) sessions, two of which include issues raised by the local organisers, and has two joint sessions with IAOS. These sessions are currently being finalised and details will be
available in the next issue. The website http://www.statssa.gov.za/isi2009/ has information on all matters relating to ISI 2009, including important dates, and will be regularly updated as new information develops.
ICOTS-8
DATA AND CONTEXT IN STATISTICS EDUCATION: TOWARDS AN EVIDENCE-BASED SOCIETY
Ljubljana, Slovenia, July 11 - 16, 2010
The 2010 International Conference on Teaching Statistics will be held in the city of Ljubljana, Slovenia, July 11-16. It is being organised by the IASE and the Slovenian Statistical Association. The venue will be the Ljubljana Cultural and Congress Centre.
Statistics educators, statisticians, teachers and educators at large are invited to contribute to the scientific programme. Types of contribution include invited papers, contributed papers and posters. No
64
person may author more than one Invited Paper at the conference, although the same person can be co-author of more than one paper, provided each paper is presented by a different person.
Voluntary refereeing procedures will be implemented for ICOTS8. Details of how to prepare manuscripts, the refereeing process and final submission arrangements will be announced later. INVITED PAPERS
Invited Paper Sessions are organized within 10 Conference Topics as follows. Topics and Topic Convenors 1. Data and Context in Statistics Education: Towards an Evidence-based Society. Brian Phillips (Australia) [email protected] Irena Ograjensek (Slovenia) [email protected] 2. Statistics Education at the School Level. Mike Shaughnessy (USA) [email protected] Doreen Connor (UK) [email protected] 3. Learning to Teach Statistics. Katie Makar (Australia) [email protected] Joachim Engel (Germany) [email protected] 4. Statistics Education at the Post Secondary Level. Elisabeth Svensson (Sweden) [email protected] Larry Weldon (Canada) [email protected] 5. Assessment in Statistics Education. Beth Chance (USA) [email protected] Iddo Gal (Israel) [email protected] 6. Statistics Education, Training and the Workplace. Gabriella Belli (USA) [email protected] Peter Petocz (Australia) [email protected] 7. Statistics Education and the Wider Society. Richard Gadsden (UK) [email protected] Oded Meyer (USA) [email protected] 8. Research in Statistics Education. Arthur Bakker (The Netherlands) [email protected] Tim Burgess (New Zealand) [email protected] 9. Technology in Statistics Education. Deborah Nolan (USA) [email protected] Paul Darius (Belgium) [email protected] 10. An International Perspective on Statistics Education. Delia North (South Africa) [email protected] Enriqueta Reston (Phillipines) [email protected]
Session themes within each Topic are currently being discussed. The themes and
Session organizers with email contact will be available on the ICOTS-8 web site http://icots8.org/, under “Scientific Programme” by June 2008. Those interested in submitting an invited paper should contact the appropriate Session Organiser before December 1, 2008.

65
CONTRIBUTED PAPERS Contributed paper sessions will be arranged in a variety of areas. Those interested in
submitting a contributed paper should contact Gilberte Schuyten ([email protected]), John McKenzie ([email protected]), or Flavia Jolliffe ([email protected]) before September 1, 2009. POSTERS
Those interested in submitting a poster should contact Mojca Bavdaz ([email protected]) or Alesa Lotric Dolinar ([email protected]) before January 15, 2010. GENERAL ISSUES
More information is available from the ICOTS-8 web site at http://icots8.org/ which will continue to be updated over the next three years, or from the ICOTS IPC Chair, John Harraway ([email protected]), the Programme Chair, Roxy Peck ([email protected]), and the Scientific Secretary, Helen MacGillivray ([email protected]).
66
OTHER FORTHCOMING CONFERENCES
6TH AUSTRALIAN CONFERENCE ON TEACHING STATISTICS Melbourne, Australia, July 3 - 4, 2008
The 6th OZCOTS will be held as a satellite to the Australian Statistical Conference.
Invited and contributed papers and forums on topics across the tertiary statistical education spectrum will be of interest to statisticians, statistical educators and the statistical profession. OZCOTS 2008 and its invited speakers are associated with a National Senior Teaching Fellowship on the teaching and assessment of statistical thinking within and across disciplines.
More information: http://silmaril.math.sci.qut.edu.au/ozcots2008/
CensusAtSchool: 2ND INTERNATIONAL WORKSHOP Los Angeles CA, USA, July 28 - 29, 2008
The International CensusAtSchool project encourages the use of real data, from and
about school children, and promotes the teaching and learning of statistical thinking skills in the classroom. This gives children increased understanding of data, wherever it originates, and encourages them to develop a healthy skepticism towards statistics that are constantly presented to them by the media and the society they live in.
Teachers, public servants, statistics education researchers and all those interested in learning about the project are welcome to attend the workshop.
More information: Juana Sanchez ([email protected]) Website: http://censusatschool-california.stat.ucla.edu
2008 JOINT STATISTICAL MEETINGS
Denver CO, USA, August 3 - 7, 2008 JSM (the Joint Statistical Meetings) is the largest gathering of statisticians held in
North America. It is held jointly with the American Statistical Association, the International Biometric Society (ENAR and WNAR), the Institute of Mathematical Statistics, and the Statistical Society of Canada. Attended by over 5000 people, activities of the meeting include oral presentations, panel sessions, poster presentations, continuing education courses, exhibit hall (with state-of-the-art statistical products and opportunities), career placement service, society and section business meetings, committee meetings, social activities, and networking opportunities. Denver, the host city for JSM 2008, offers a wide range of possibilities for sharing time with friends and colleagues.
More information: [email protected] Website: http://www.amstat.org/meetings/jsm/2008/
USCOTS 2009
UNITED STATES CONFERENCE ON TEACHING STATISTICS June 25 - 27, 2009
The third biennial United States Conference on Teaching Statistics (USCOTS 09) is
scheduled for June 2009. Details will be available at USCOTS page: http://www.causeweb.org/uscots/program/
67
10TH INTERNATIONAL CONFERENCE OF THE MATHEMATICS EDUCATION INTO THE 21ST CENTURY PROJECT
MODELS IN DEVELOPING MATHEMATICS EDUCATION Dresden, Saxony, Germany, September 11 – 17, 2009
The Mathematics Education into the 21st Century Project was
founded in 1986 and is dedicated to the planning, writing and disseminating of innovative ideas and materials in Mathematics
and Statistics Education. You are invited to attend our 10th anniversary project conference to be held in the historic city of Dresden, Germany. The chairman of the Local Organising Committee will be Prof. Dr. Ludwig Paditz of the Dresden University of Applied Sciences.
More information: Alan Rogerson, [email protected] Website: http://math.unipa.it/~grim/21_project/21_project_Dresden_2009.pdf