Embed Size (px)
Citation preview

17.02.2009
1
Some Results from the Survey on Turkish Some Results from the Survey on Turkish
Statistics EducationStatistics Education
Assist. Prof. Dr. Doğan Yildiz Assist. Prof. Dr. Doğan Yildiz
Assist. Prof. Dr. Atif EvrenAssist. Prof. Dr. Atif Evren
Yildiz Technical University , The Faculty of Sciences and Yildiz Technical University , The Faculty of Sciences and
Literature , The Department of StatisticsLiterature , The Department of Statistics
DavutpaşaDavutpaşa--Esenler, 34210 ISTANBUL TURKEYEsenler, 34210 ISTANBUL TURKEY
[email protected]@yildiz.edu.tr [email protected]@yildiz.edu.tr
“Statistical thinking “Statistical thinking will one day be as will one day be as necessary for necessary for efficient citizenship efficient citizenship as the ability to read as the ability to read and write. ” and write. ”
H.G. WellsH.G. Wells
17.02.2009
2
IntroductionIntroduction
The discussions on statistics education were The discussions on statistics education were intensified especially at the end of nineties in United intensified especially at the end of nineties in United States of America. In this respect, some means were States of America. In this respect, some means were taken into consideration to develop statistics education taken into consideration to develop statistics education both in undergraduate and graduate levels. Some both in undergraduate and graduate levels. Some debates were realized to evaluate the quality of debates were realized to evaluate the quality of statistics courses both offered in statistics departments statistics courses both offered in statistics departments and in other departments demanding statistics as and in other departments demanding statistics as service courses. In these debates, the skills that service courses. In these debates, the skills that graduates of statistics should acquire were also under graduates of statistics should acquire were also under investigationinvestigation
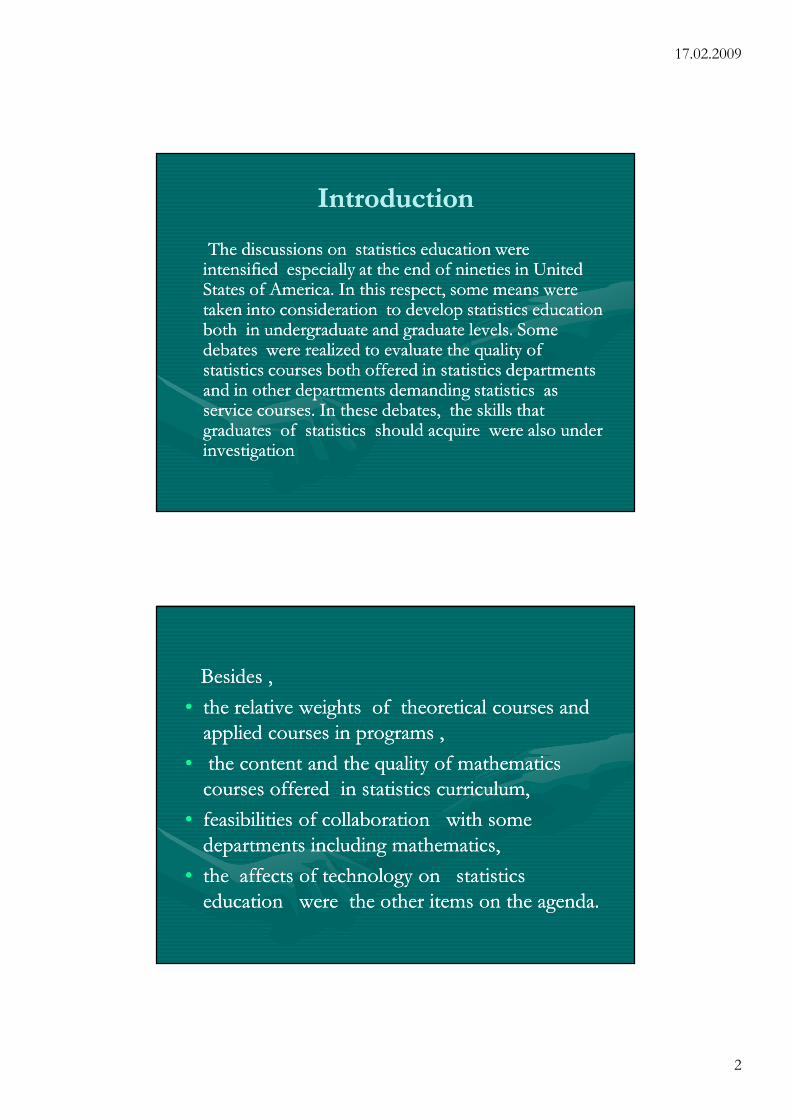
Besides , Besides ,
•• the relative weights of theoretical courses and the relative weights of theoretical courses and applied courses in programs , applied courses in programs ,
•• the content and the quality of mathematics the content and the quality of mathematics courses offered in statistics curriculum, courses offered in statistics curriculum,
•• feasibilities of collaboration with some feasibilities of collaboration with some departments including mathematics, departments including mathematics,
•• the affects of technology on statistics the affects of technology on statistics education were the other items on the agenda. education were the other items on the agenda.
17.02.2009
3
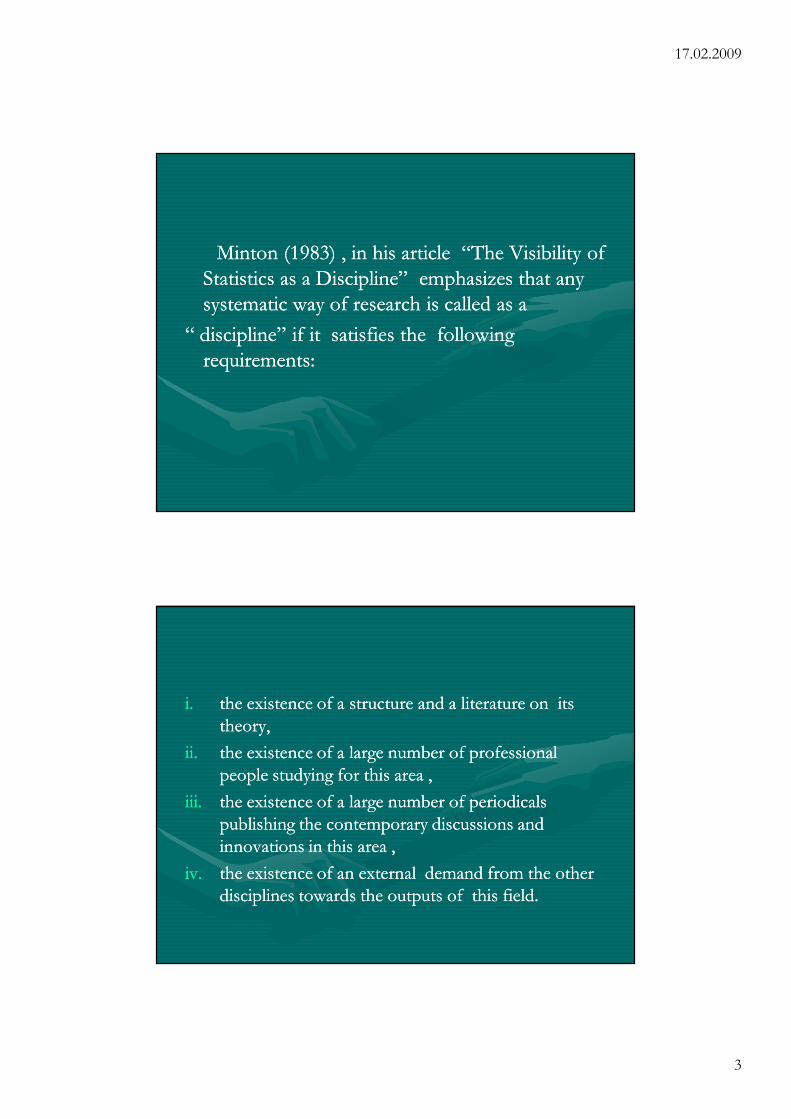
Minton (1983) , in his article “The Visibility of Minton (1983) , in his article “The Visibility of Statistics as a Discipline” emphasizes that any Statistics as a Discipline” emphasizes that any systematic way of research is called as a systematic way of research is called as a
“ discipline” if it satisfies the following “ discipline” if it satisfies the following requirements: requirements:
i.i. the existence of a structure and a literature on its the existence of a structure and a literature on its theory, theory,
ii.ii. the existence of a large number of professional the existence of a large number of professional people studying for this area ,people studying for this area ,
iii.iii. the existence of a large number of periodicals the existence of a large number of periodicals publishing the contemporary discussions and publishing the contemporary discussions and innovations in this area ,innovations in this area ,
iv.iv. the existence of an external demand from the other the existence of an external demand from the other disciplines towards the outputs of this field.disciplines towards the outputs of this field.
17.02.2009
4
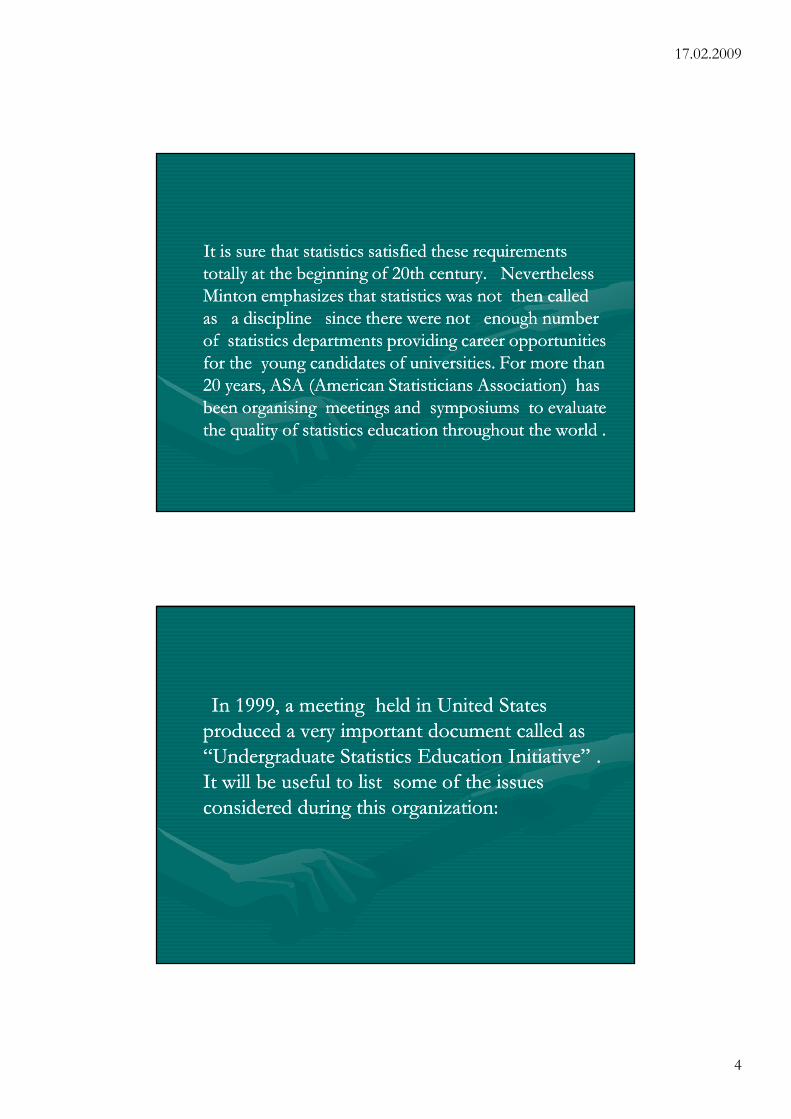
It is sure that statistics satisfied these requirements It is sure that statistics satisfied these requirements totally at the beginning of 20th century. Nevertheless totally at the beginning of 20th century. Nevertheless Minton emphasizes that statistics was not then called Minton emphasizes that statistics was not then called as a discipline since there were not enough number as a discipline since there were not enough number of statistics departments providing career opportunities of statistics departments providing career opportunities for the young candidates of universities. For more than for the young candidates of universities. For more than 20 years, ASA (American Statisticians Association) has 20 years, ASA (American Statisticians Association) has been organising meetings and symposiums to evaluate been organising meetings and symposiums to evaluate the quality of statistics education throughout the world . the quality of statistics education throughout the world .
In 1999, a meeting held in United States In 1999, a meeting held in United States produced a very important document called as produced a very important document called as “Undergraduate Statistics Education Initiative” . “Undergraduate Statistics Education Initiative” . It will be useful to list some of the issues It will be useful to list some of the issues considered during this organization: considered during this organization:
17.02.2009
5
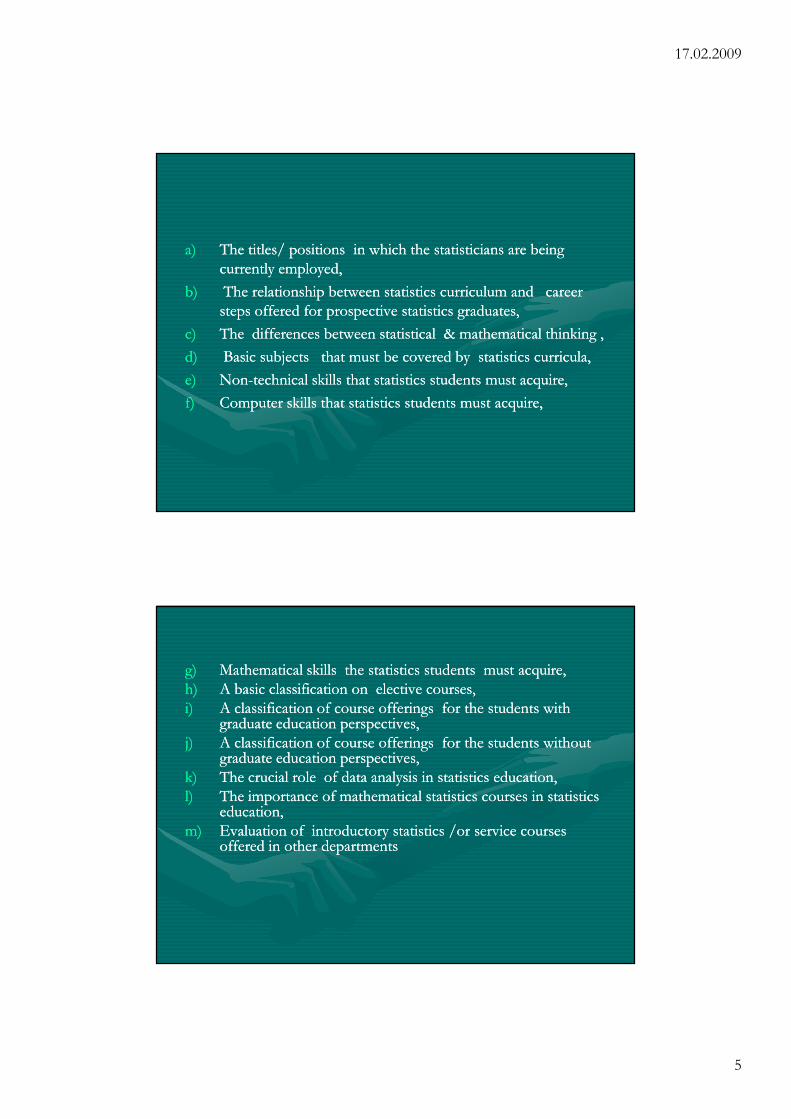
a)a) The titles/ positions in which the statisticians are being The titles/ positions in which the statisticians are being currently employed,currently employed,
b)b) The relationship between statistics curriculum and career The relationship between statistics curriculum and career steps offered for prospective statistics graduates,steps offered for prospective statistics graduates,
c)c) The differences between statistical & mathematical thinking ,The differences between statistical & mathematical thinking ,
d)d) Basic subjects that must be covered by statistics curricula,Basic subjects that must be covered by statistics curricula,
e)e) NonNon--technical skills that statistics students must acquire,technical skills that statistics students must acquire,
f)f) Computer skills that statistics students must acquire,Computer skills that statistics students must acquire,
g)g) Mathematical skills the statistics students must acquire,Mathematical skills the statistics students must acquire,h)h) A basic classification on elective courses,A basic classification on elective courses,i)i) A classification of course offerings for the students with A classification of course offerings for the students with
graduate education perspectives,graduate education perspectives,j)j) A classification of course offerings for the students without A classification of course offerings for the students without
graduate education perspectives, graduate education perspectives, k)k) The crucial role of data analysis in statistics education,The crucial role of data analysis in statistics education,l)l) The importance of mathematical statistics courses in statistics The importance of mathematical statistics courses in statistics
education,education,m)m) Evaluation of introductory statistics /or service courses Evaluation of introductory statistics /or service courses
offered in other departmentsoffered in other departments
17.02.2009
6
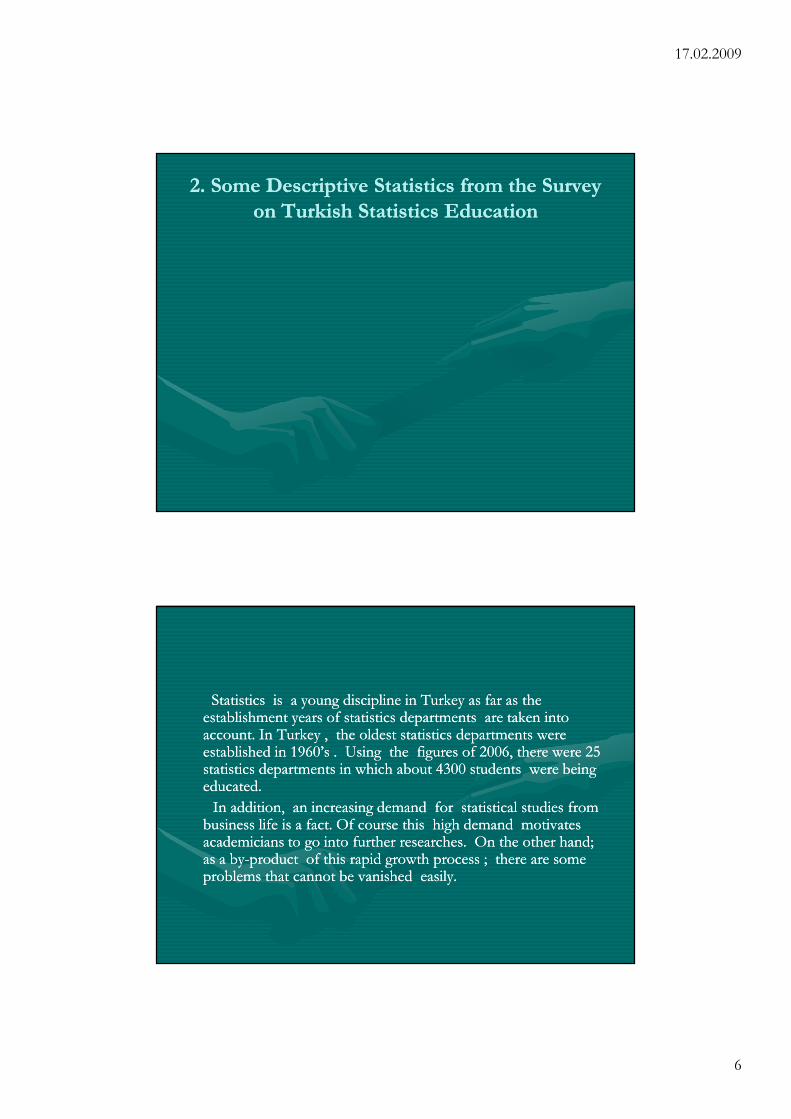
2. Some Descriptive Statistics from the Survey 2. Some Descriptive Statistics from the Survey
on Turkish Statistics Education on Turkish Statistics Education
Statistics is a young discipline in Turkey as far as the Statistics is a young discipline in Turkey as far as the establishment years of statistics departments are taken into establishment years of statistics departments are taken into account. In Turkey , the oldest statistics departments were account. In Turkey , the oldest statistics departments were established in 1960’s . Using the figures of 2006, there were 25 established in 1960’s . Using the figures of 2006, there were 25 statistics departments in which about 4300 students were being statistics departments in which about 4300 students were being educated. educated.
In addition, an increasing demand for statistical studies from In addition, an increasing demand for statistical studies from business life is a fact. Of course this high demand motivates business life is a fact. Of course this high demand motivates academicians to go into further researches. On the other hand; academicians to go into further researches. On the other hand; as a byas a by--product of this rapid growth process ; there are some product of this rapid growth process ; there are some problems that cannot be vanished easily. problems that cannot be vanished easily.
17.02.2009
7
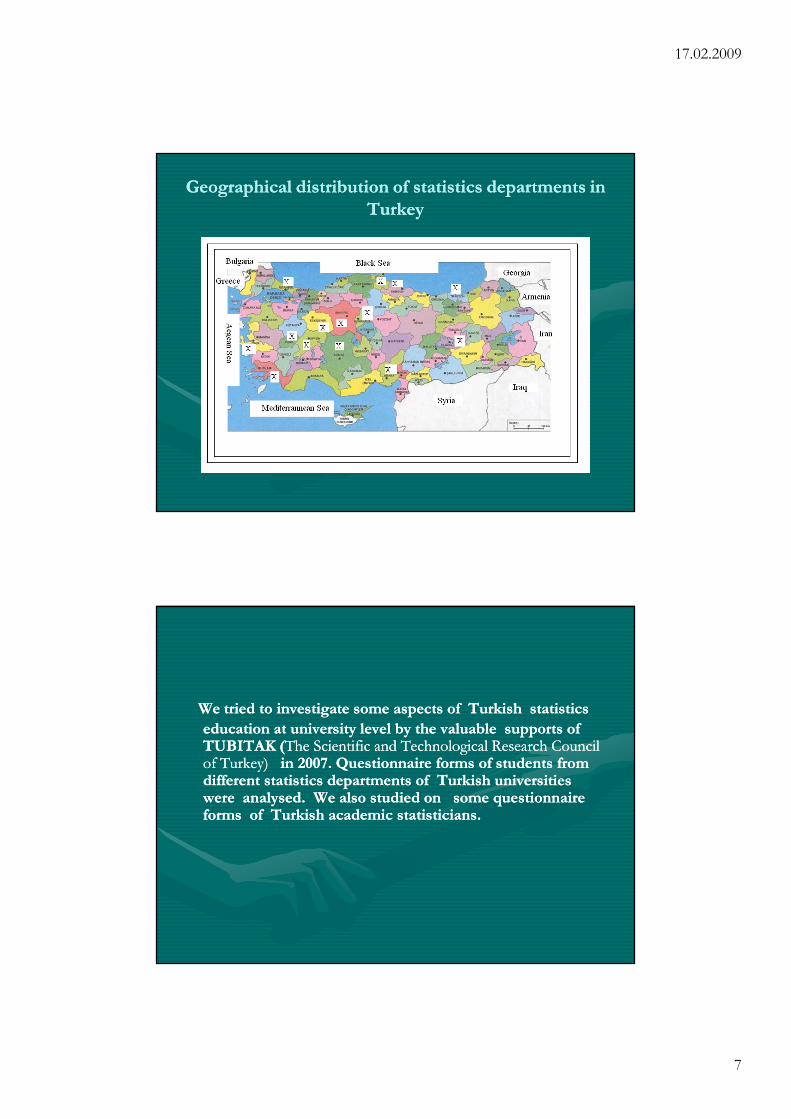
Geographical distribution of statistics departments in Geographical distribution of statistics departments in
TurkeyTurkey
We tried to investigate some aspects of Turkish statistics We tried to investigate some aspects of Turkish statistics
education at university level by the valuable supports of education at university level by the valuable supports of TUBITAK (TUBITAK (The Scientific and Technological Research Council The Scientific and Technological Research Council of Turkey) of Turkey) in 2007. Questionnaire forms of students from in 2007. Questionnaire forms of students from different statistics departments of Turkish universities different statistics departments of Turkish universities were analysed. We also studied on some questionnaire were analysed. We also studied on some questionnaire forms of Turkish academic statisticians. forms of Turkish academic statisticians.
17.02.2009
8
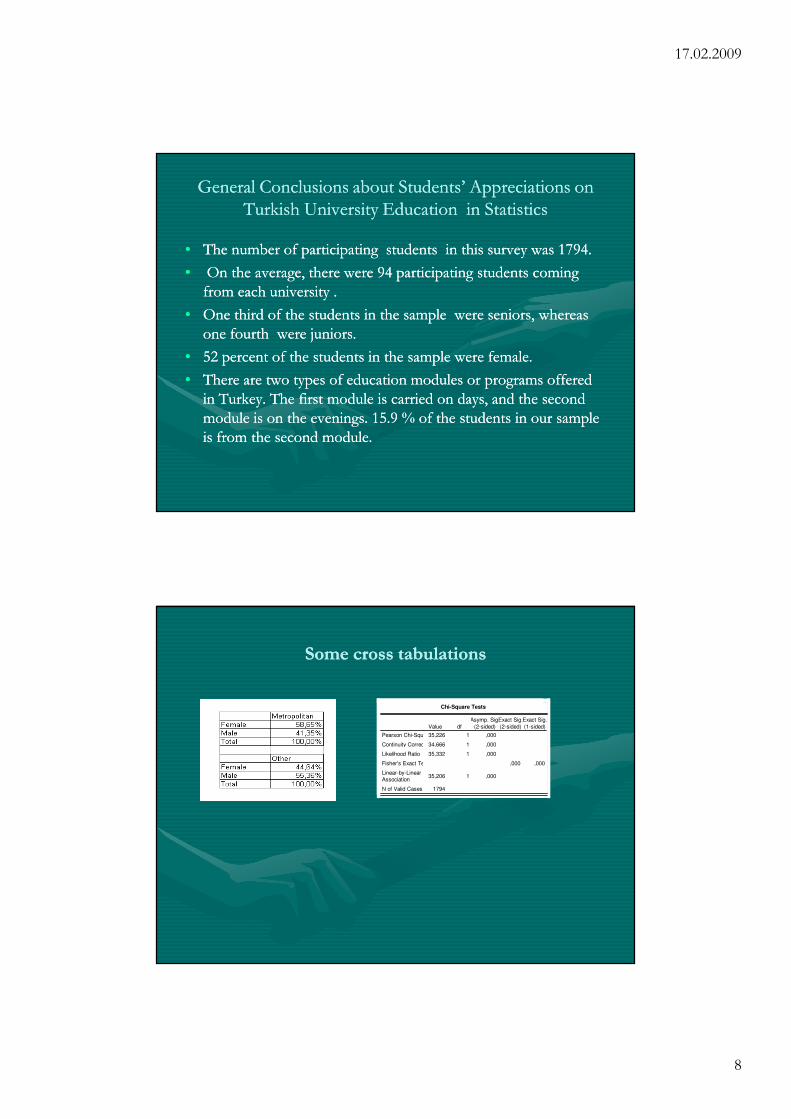
General Conclusions about Students’ Appreciations on General Conclusions about Students’ Appreciations on Turkish University Education in StatisticsTurkish University Education in Statistics
•• The number of participating students in this survey was 1794.The number of participating students in this survey was 1794.
•• On the average, there were 94 participating students coming On the average, there were 94 participating students coming from each university . from each university .
•• One third of the students in the sample were seniors, whereas One third of the students in the sample were seniors, whereas one fourth were juniors. one fourth were juniors.
•• 52 percent of the students in the sample were female. 52 percent of the students in the sample were female.
•• There are two types of education modules or programs offered There are two types of education modules or programs offered in Turkey. The first module is carried on days, and the second in Turkey. The first module is carried on days, and the second module is on the evenings. 15.9 % of the students in our sample module is on the evenings. 15.9 % of the students in our sample is from the second module. is from the second module.
Some cross tabulations Some cross tabulations
Chi-Square Tests
35,226 1 ,000
34,666 1 ,000
35,332 1 ,000
,000 ,000
35,206 1 ,000
1794
Pearson Chi-Square
Continuity Correction
Likelihood Ratio
Fisher's Exact Test
Linear-by-Linear
Association
N of Valid Cases
Value df
Asymp. Sig.
(2-sided)
Exact Sig.
(2-sided)
Exact Sig.
(1-sided)
17.02.2009
9
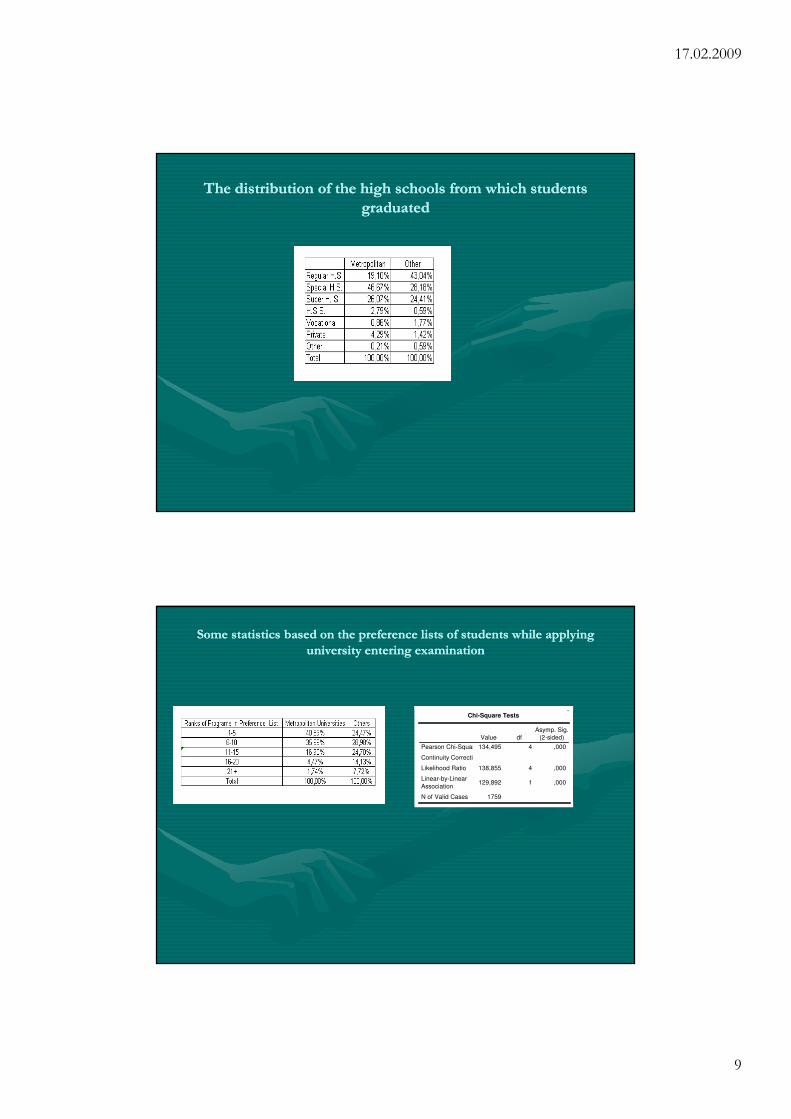
The distribution of the high schools from which students The distribution of the high schools from which students
graduated graduated
Some statistics based on the preference lists of students while applying Some statistics based on the preference lists of students while applying
university entering examinationuniversity entering examination
Chi-Square Tests
134,495 4 ,000
138,855 4 ,000
129,892 1 ,000
1759
Pearson Chi-Square
Continuity Correction
Likelihood Ratio
Linear-by-Linear
Association
N of Valid Cases
Value df
Asymp. Sig.
(2-sided)
17.02.2009
10
•• Some figures on socioeconomic Some figures on socioeconomic status (SES) scores of studentsstatus (SES) scores of students
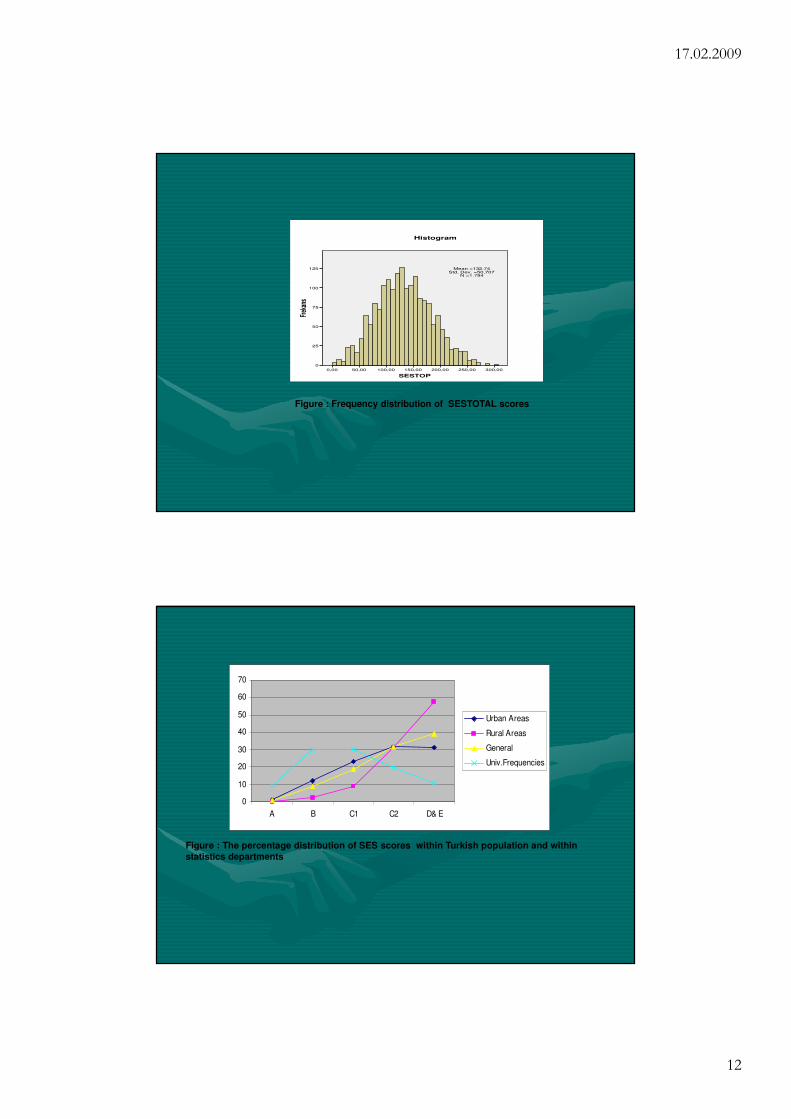
•• The socioeconomic status (SES) scores of the students were The socioeconomic status (SES) scores of the students were calculated and it was observed that 9% of the students came calculated and it was observed that 9% of the students came from the group with the highest income and wealth, 30 % of the from the group with the highest income and wealth, 30 % of the students came from the second highest group, and 50 % came students came from the second highest group, and 50 % came from the two middling groups. Of course, these are average from the two middling groups. Of course, these are average figures and SES scores change considerably from one unversity figures and SES scores change considerably from one unversity to the other. Nevertheless, it can be concluded that university to the other. Nevertheless, it can be concluded that university education is still a problem for poorer classes!education is still a problem for poorer classes!
17.02.2009
11
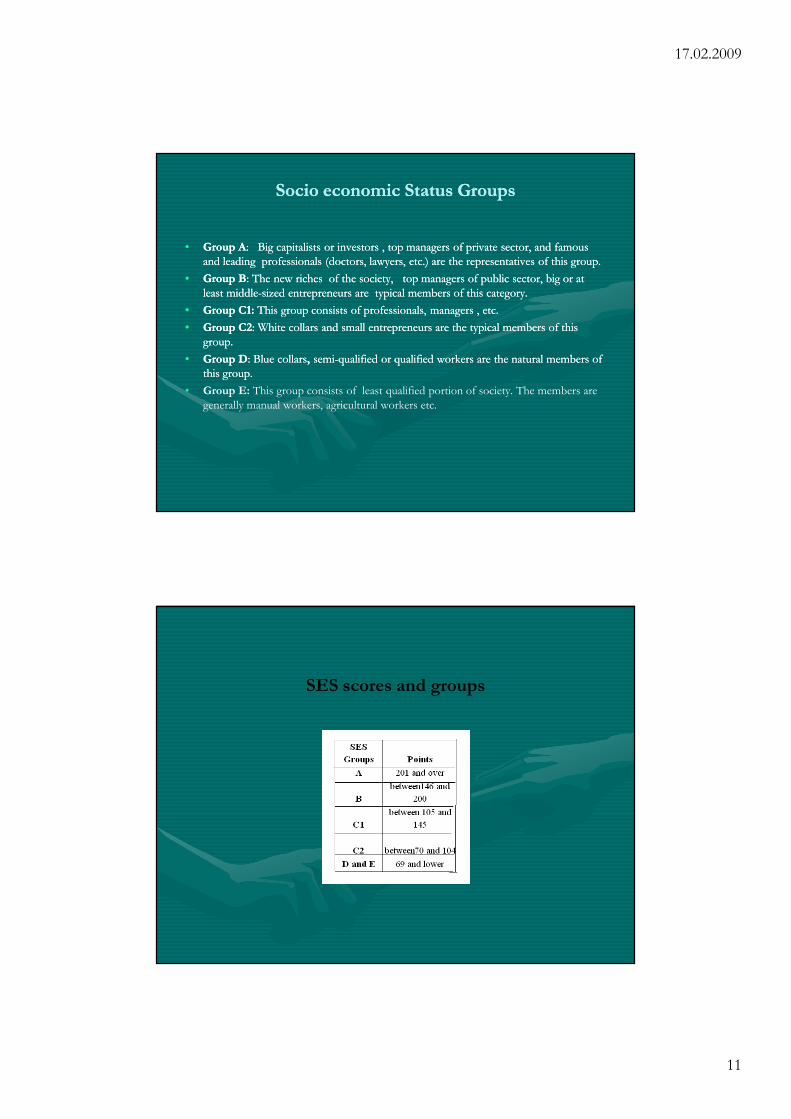
Socio economic Status GroupsSocio economic Status Groups
•• Group AGroup A: Big capitalists or investors , top managers of private sector, and famous : Big capitalists or investors , top managers of private sector, and famous and leading professionals (doctors, lawyers, etc.) are the representatives of this group. and leading professionals (doctors, lawyers, etc.) are the representatives of this group.
•• Group BGroup B: The new riches of the society, top managers of public sector, big or at : The new riches of the society, top managers of public sector, big or at least middleleast middle--sized entrepreneurs are typical members of this category. sized entrepreneurs are typical members of this category.
•• Group C1:Group C1: This group consists of professionals, managers , etc. This group consists of professionals, managers , etc.
•• Group C2Group C2: White collars and small entrepreneurs are the typical members of this : White collars and small entrepreneurs are the typical members of this group.group.
•• Group DGroup D: Blue collars: Blue collars, , semisemi--qualified or qualified workers are the natural members of qualified or qualified workers are the natural members of this group.this group.
• Group E: This group consists of least qualified portion of society. The members are generally manual workers, agricultural workers etc.
SES scores and groups
17.02.2009
12
SESTOP
300,00250,00200,00150,00100,0050,000,00
Frek
ans
125
100
75
50
25
0
Histogram
Mean =132,74 Std. Dev. =50,707
N =1.794
Figure : Frequency distribution of SESTOTAL scores
0
10
20
30
40
50
60
70
A B C1 C2 D& E
Urban Areas
Rural Areas
General
Univ.Frequencies
Figure : The percentage distribution of SES scores within Turkish population and within
statistics departments
17.02.2009
13
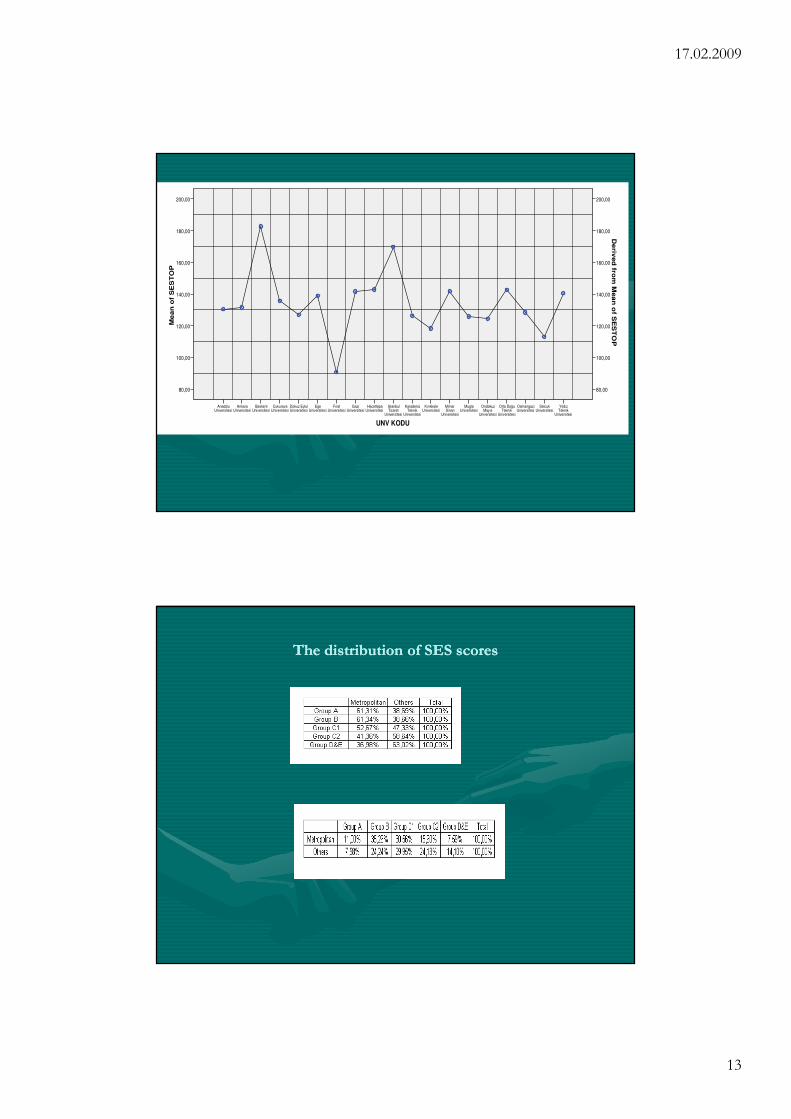
UNV KODU
Yıldız Teknik
Universitesi
Selcuk Universitesi
Osmangazi Universitesi
Orta Doğu Teknik
Universitesi
Ondokuz Mayıs
Universitesi
Mugla Universitesi
Mimar Sinan
Universitesi
Kırıkkale Universitesi
Karadeniz Teknik
Universitesi
İstanbul Ticaret
Universitesi
Hacettepa Universitesi
Gazi Universitesi
Fırat Universitesi
Ege Universitesi
Dokuz Eylul Universitesi
Cukurova Universitesi
Baskent Universitesi
Ankara Universitesi
Anadolu Universitesi
Me
an
of
SE
ST
OP
200,00
180,00
160,00
140,00
120,00
100,00
80,00
De
rived
from
Mea
n o
f SE
ST
OP
200,00
180,00
160,00
140,00
120,00
100,00
80,00
The distribution of SES scores The distribution of SES scores
17.02.2009
14
Attitude Changes Towards Attitude Changes Towards Statistics DepartmentsStatistics Departments
•• 54.3 percent of the participants stated that they had 54.3 percent of the participants stated that they had got some prior information about the opportunities got some prior information about the opportunities that statistics departments provided its students before that statistics departments provided its students before they took the university entering examination.they took the university entering examination.
17.02.2009
15
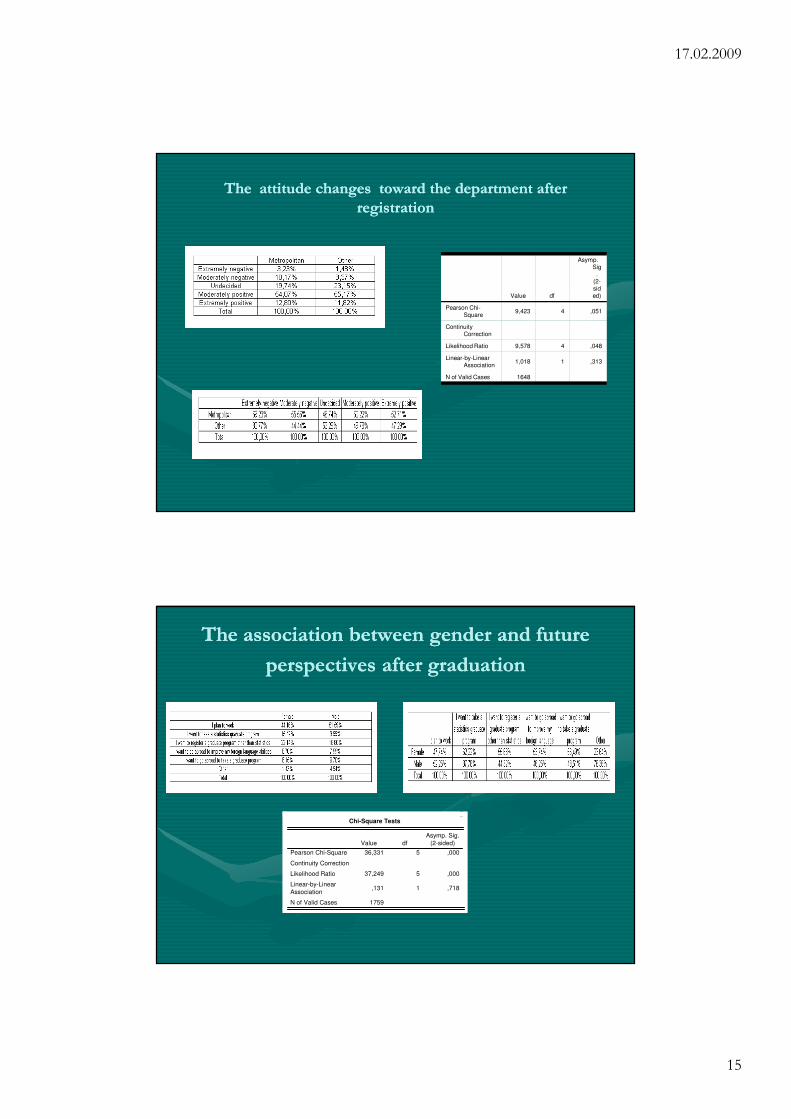
The attitude changes toward the department after The attitude changes toward the department after
registrationregistration
Value df
Asymp. Sig
. (2-sided)
Pearson Chi-Square
9,423 4 ,051
Continuity Correction
Likelihood Ratio 9,578 4 ,048
Linear-by-Linear Association
1,018 1 ,313
N of Valid Cases 1648
The association between gender and future The association between gender and future
perspectives after graduationperspectives after graduation
Chi-Square Tests
36,331 5 ,000
37,249 5 ,000
,131 1 ,718
1759
Pearson Chi-Square
Continuity Correction
Likelihood Ratio
Linear-by-Linear
Association
N of Valid Cases
Value df
Asymp. Sig.
(2-sided)
17.02.2009
16
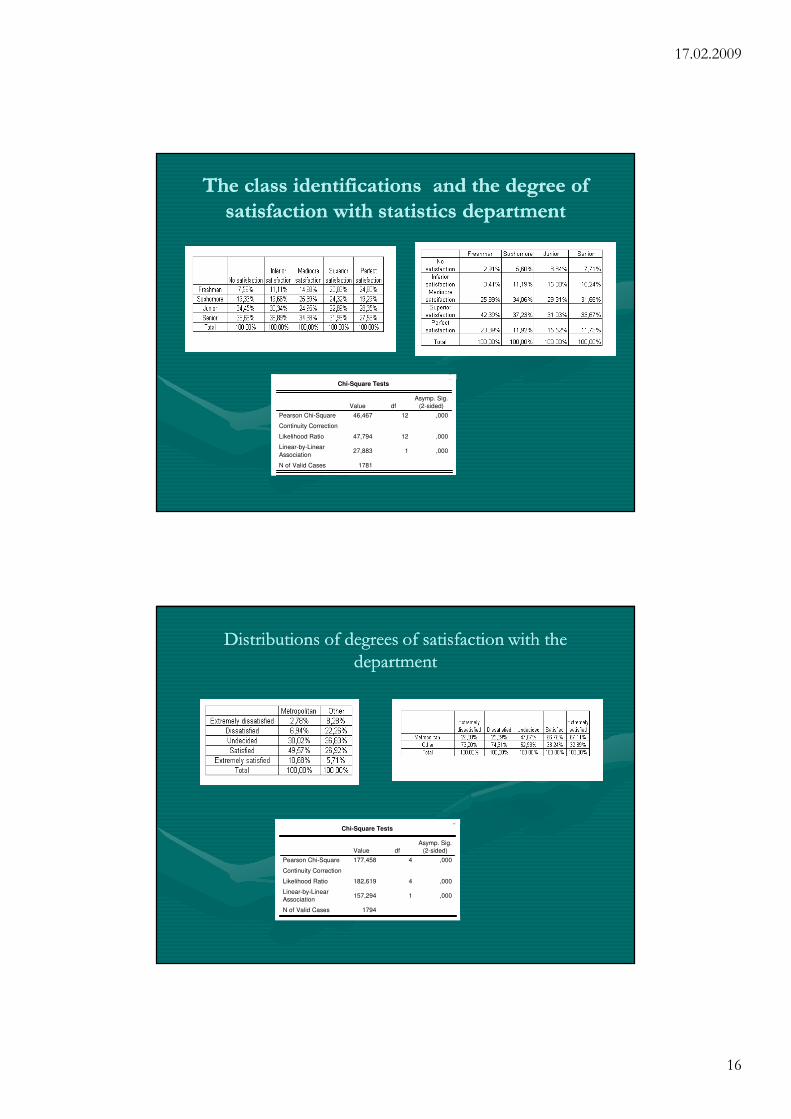
The class identifications and the degree of The class identifications and the degree of
satisfaction with statistics departmentsatisfaction with statistics department
Chi-Square Tests
46,467 12 ,000
47,794 12 ,000
27,883 1 ,000
1781
Pearson Chi-Square
Continuity Correction
Likelihood Ratio
Linear-by-Linear
Association
N of Valid Cases
Value df
Asymp. Sig.
(2-sided)
Distributions of degrees of satisfaction with the Distributions of degrees of satisfaction with the departmentdepartment
Chi-Square Tests
177,458 4 ,000
182,619 4 ,000
157,294 1 ,000
1794
Pearson Chi-Square
Continuity Correction
Likelihood Ratio
Linear-by-Linear
Association
N of Valid Cases
Value df
Asymp. Sig.
(2-sided)
17.02.2009
17
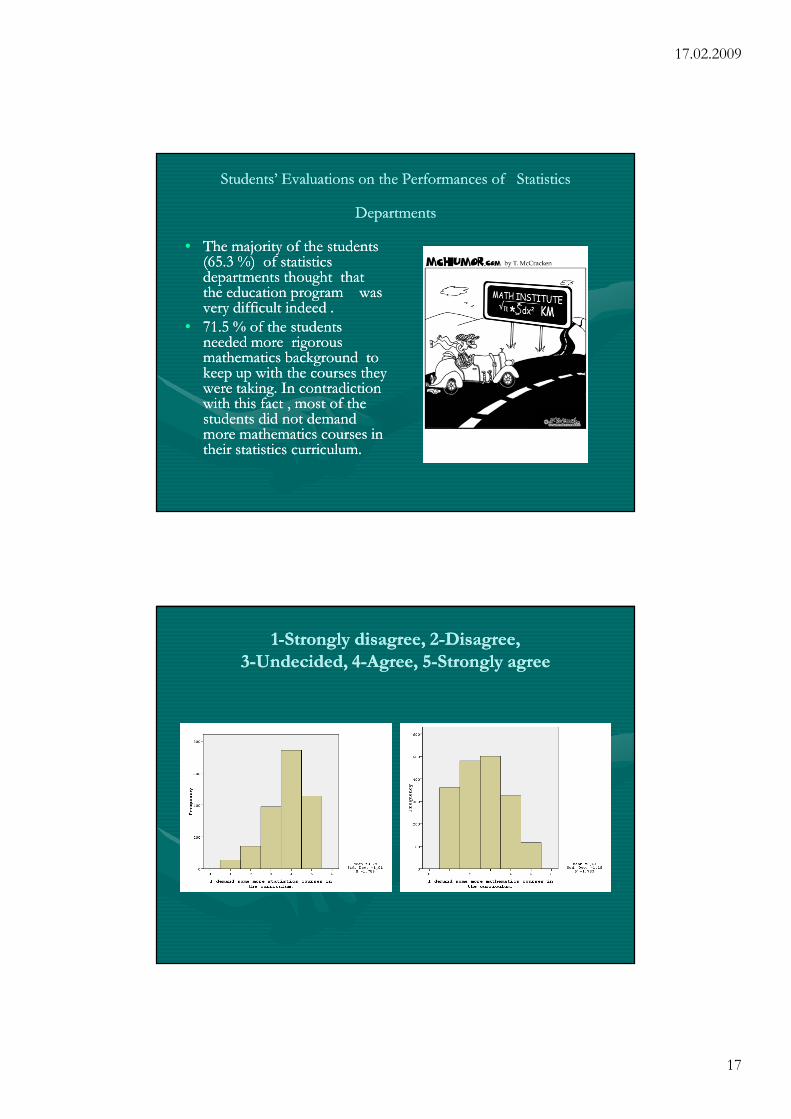
Students’ Evaluations on the Performances of Statistics Students’ Evaluations on the Performances of Statistics
DepartmentsDepartments
•• The majority of the students The majority of the students (65.3 %) of statistics (65.3 %) of statistics departments thought that departments thought that the education program was the education program was very difficult indeed .very difficult indeed .
•• 71.5 % of the students 71.5 % of the students needed more rigorous needed more rigorous mathematics background to mathematics background to keep up with the courses they keep up with the courses they were taking. In contradiction were taking. In contradiction with this fact , most of the with this fact , most of the students did not demand students did not demand more mathematics courses in more mathematics courses in their statistics curriculum.their statistics curriculum.
11--Strongly disagree, 2Strongly disagree, 2--Disagree, Disagree,
33--Undecided, 4Undecided, 4--Agree, 5Agree, 5--Strongly agreeStrongly agree
17.02.2009
18
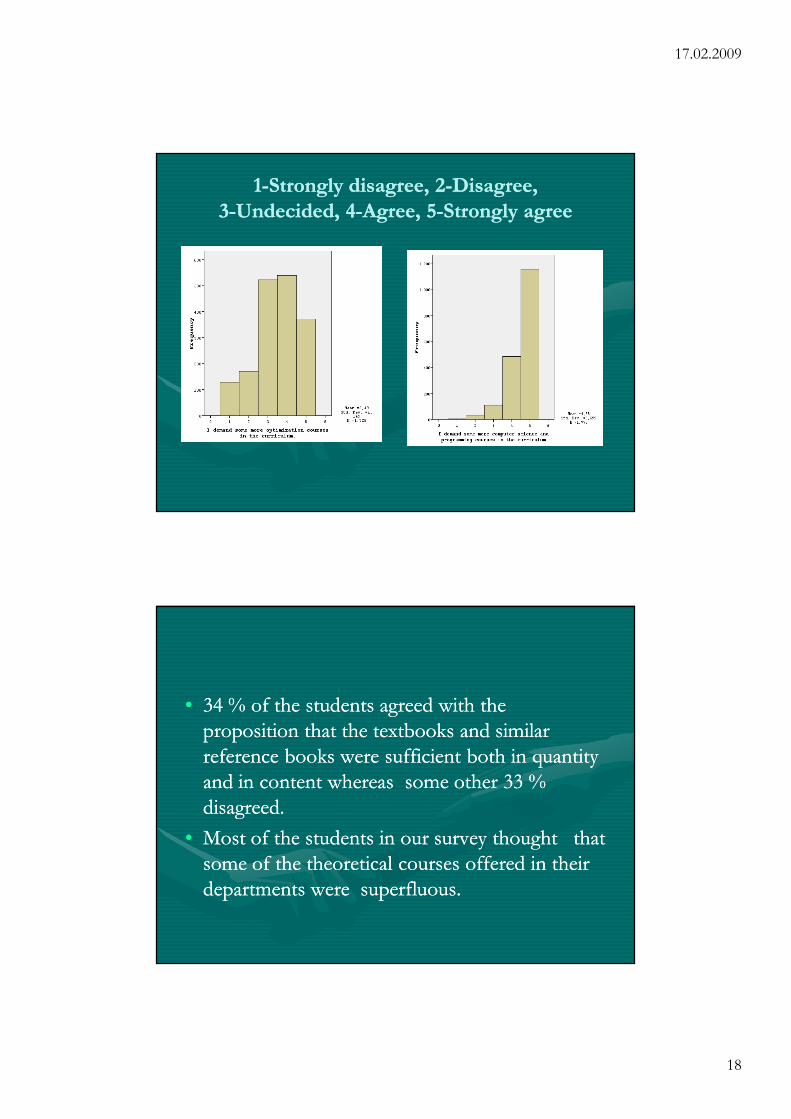
11--Strongly disagree, 2Strongly disagree, 2--Disagree, Disagree,
33--Undecided, 4Undecided, 4--Agree, 5Agree, 5--Strongly agreeStrongly agree
•• 34 % of the students agreed with the 34 % of the students agreed with the proposition that the textbooks and similar proposition that the textbooks and similar reference books were sufficient both in quantity reference books were sufficient both in quantity and in content whereas some other 33 % and in content whereas some other 33 % disagreed.disagreed.
•• Most of the students in our survey thought that Most of the students in our survey thought that some of the theoretical courses offered in their some of the theoretical courses offered in their departments were superfluous.departments were superfluous.
17.02.2009
19
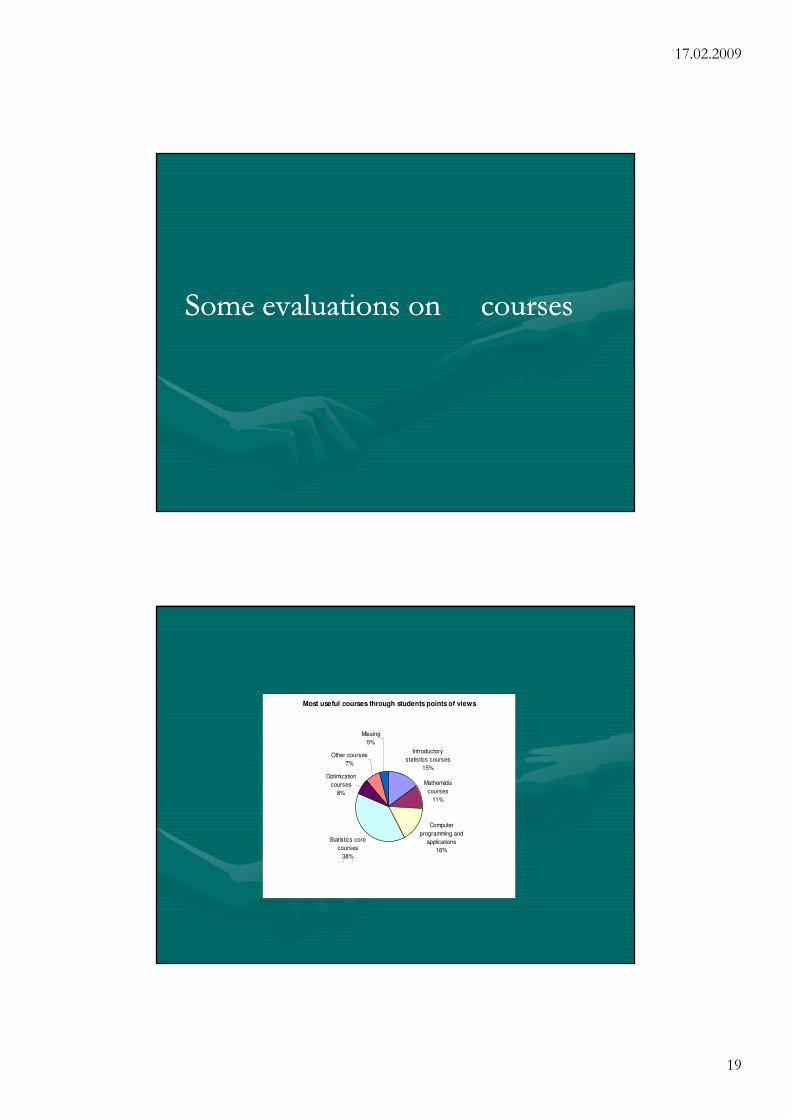
Some evaluations on courses Some evaluations on courses
Most useful courses through students points of views
Introductory
statistics courses
15%
Mathematis
courses
11%
Computer
programming and
applications
16%
Statistics core
courses
38%
Optimization
courses
8%
Other courses
7%
Missing
5%
17.02.2009
20
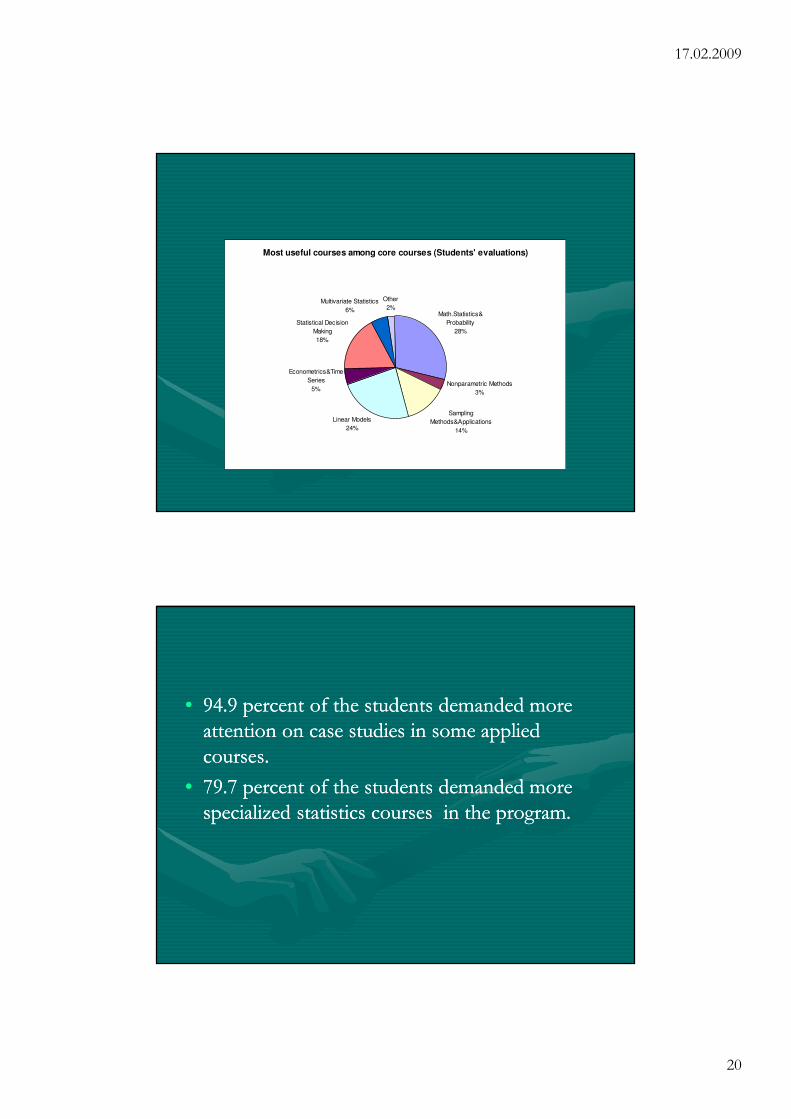
Most useful courses among core courses (Students' evaluations)
Math.Statistics&
Probability
28%
Nonparametric Methods
3%
Linear Models
24%
Econometrics&Time
Series
5%
Statistical Decision
Making
18%
Multivariate Statistics
6%
Other
2%
Sampling
Methods&Applications
14%
•• 94.9 percent of the students demanded more 94.9 percent of the students demanded more attention on case studies in some applied attention on case studies in some applied courses.courses.
•• 79.7 percent of the students demanded more 79.7 percent of the students demanded more specialized statistics courses in the program.specialized statistics courses in the program.
17.02.2009
21
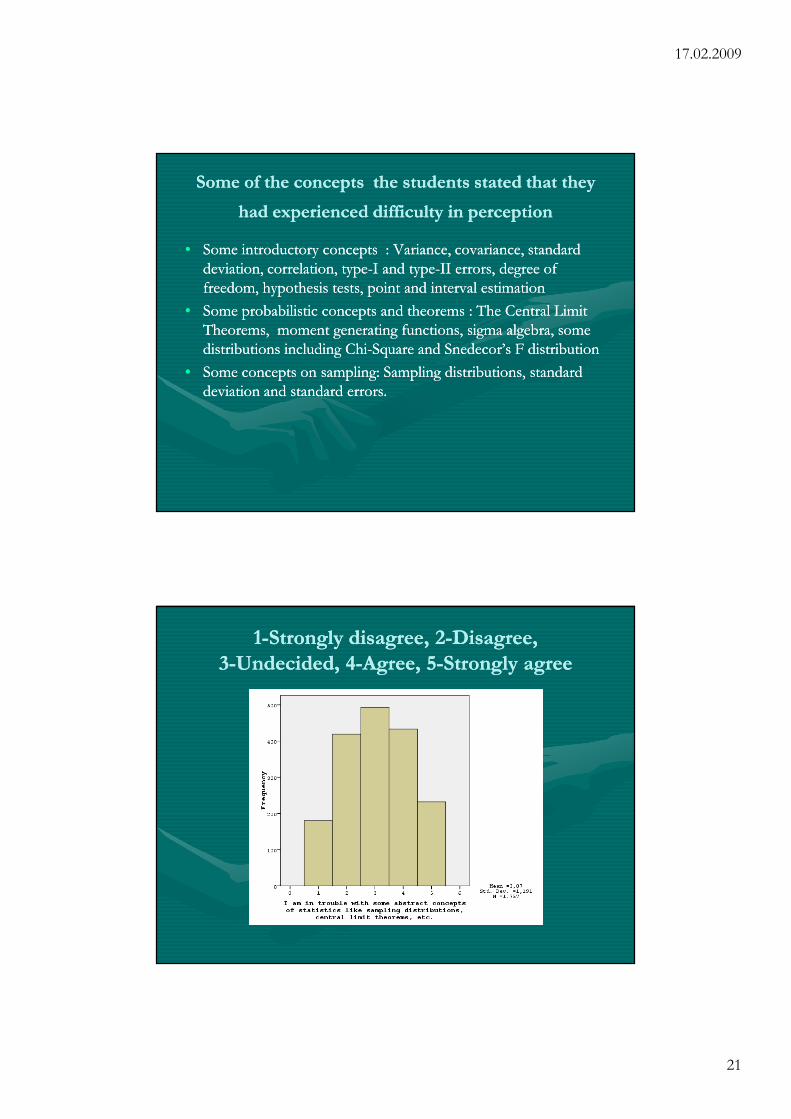
Some of the concepts the students stated that they Some of the concepts the students stated that they
had experienced difficulty in perceptionhad experienced difficulty in perception
•• Some introductory concepts : Variance, covariance, standard Some introductory concepts : Variance, covariance, standard deviation, correlation, typedeviation, correlation, type--I and typeI and type--II errors, degree of II errors, degree of freedom, hypothesis tests, point and interval estimationfreedom, hypothesis tests, point and interval estimation
•• Some probabilistic concepts and theorems : The Central Limit Some probabilistic concepts and theorems : The Central Limit Theorems, moment generating functions, sigma algebra, some Theorems, moment generating functions, sigma algebra, some distributions including Chidistributions including Chi--Square and Snedecor’s F distribution Square and Snedecor’s F distribution
•• Some concepts on sampling: Sampling distributions, standard Some concepts on sampling: Sampling distributions, standard deviation and standard errors. deviation and standard errors.
11--Strongly disagree, 2Strongly disagree, 2--Disagree, Disagree,
33--Undecided, 4Undecided, 4--Agree, 5Agree, 5--Strongly agreeStrongly agree
17.02.2009
22
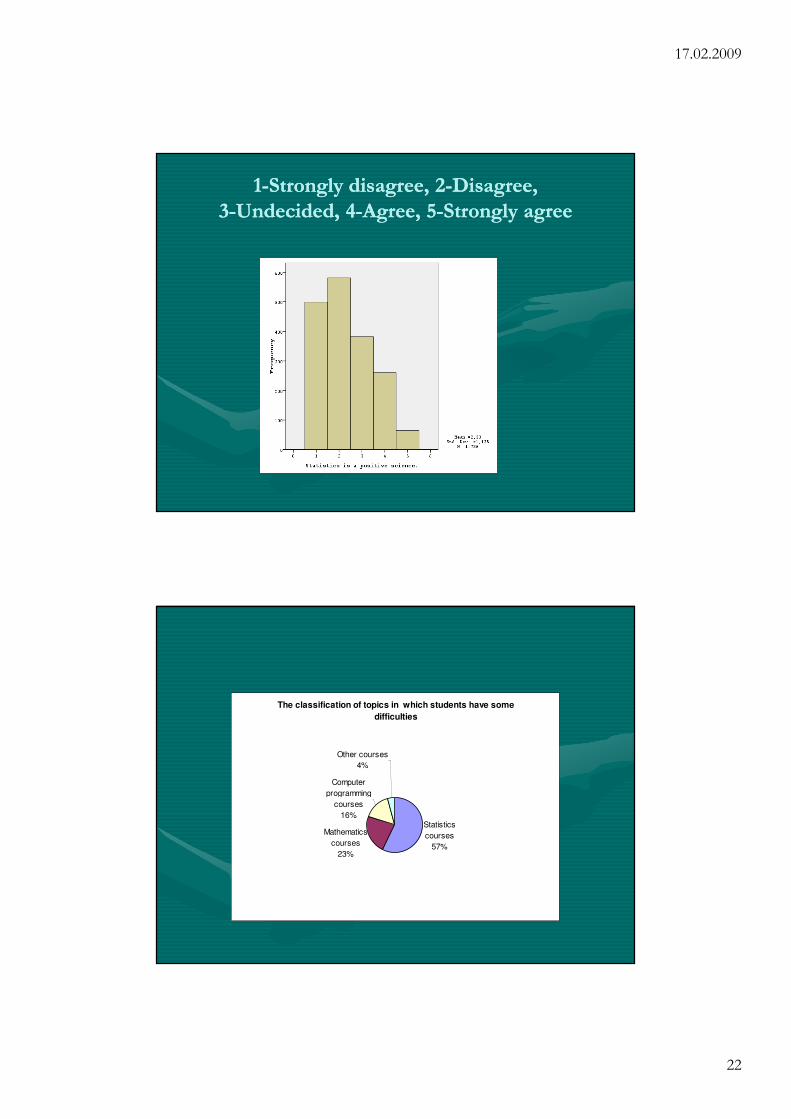
11--Strongly disagree, 2Strongly disagree, 2--Disagree, Disagree,
33--Undecided, 4Undecided, 4--Agree, 5Agree, 5--Strongly agreeStrongly agree
The classification of topics in which students have some
difficulties
Statistics
courses
57%
Mathematics
courses
23%
Computer
programming
courses
16%
Other courses
4%
17.02.2009
23
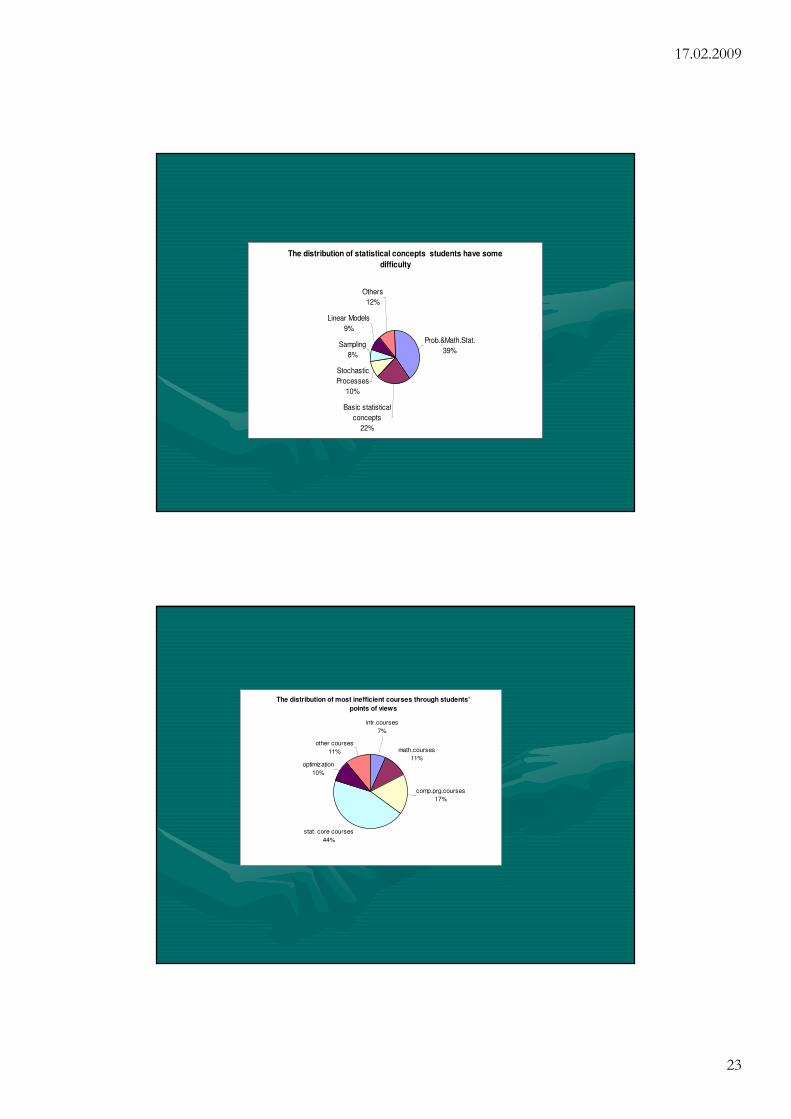
The distribution of statistical concepts students have some
difficulty
Basic statistical
concepts
22%
Stochastic
Processes
10%
Sampling
8%
Linear Models
9%
Others
12%
Prob.&Math.Stat.
39%
The distribution of most inefficient courses through students'
points of views
math.courses
11%
stat. core courses
44%
optimization
10%
other courses
11%
intr.courses
7%
comp.prg.courses
17%
17.02.2009
24
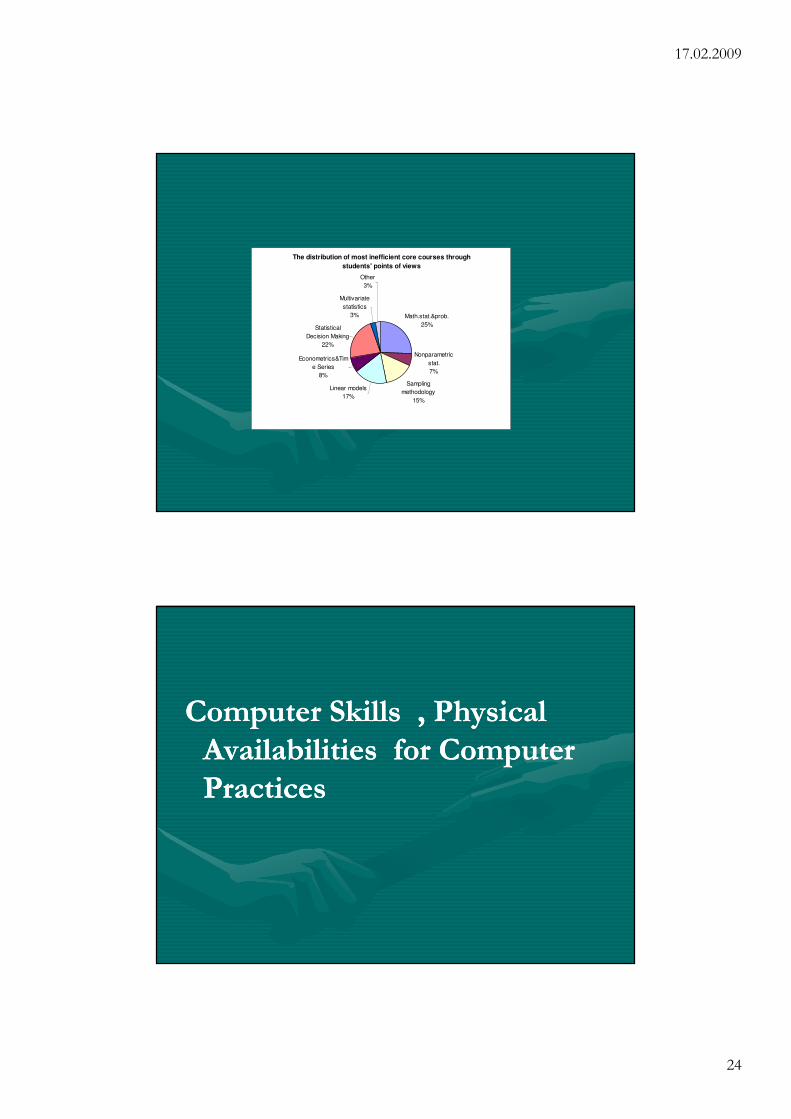
The distribution of most inefficient core courses through
students' points of views
Math.stat.&prob.
25%
Nonparametric
stat.
7%
Sampling
methodology
15%
Linear models
17%
Econometrics&Tim
e Series
8%
Statistical
Decision Making
22%
Multivariate
statistics
3%
Other
3%
Computer Skills , Physical Computer Skills , Physical
Availabilities for Computer Availabilities for Computer
PracticesPractices
17.02.2009
25
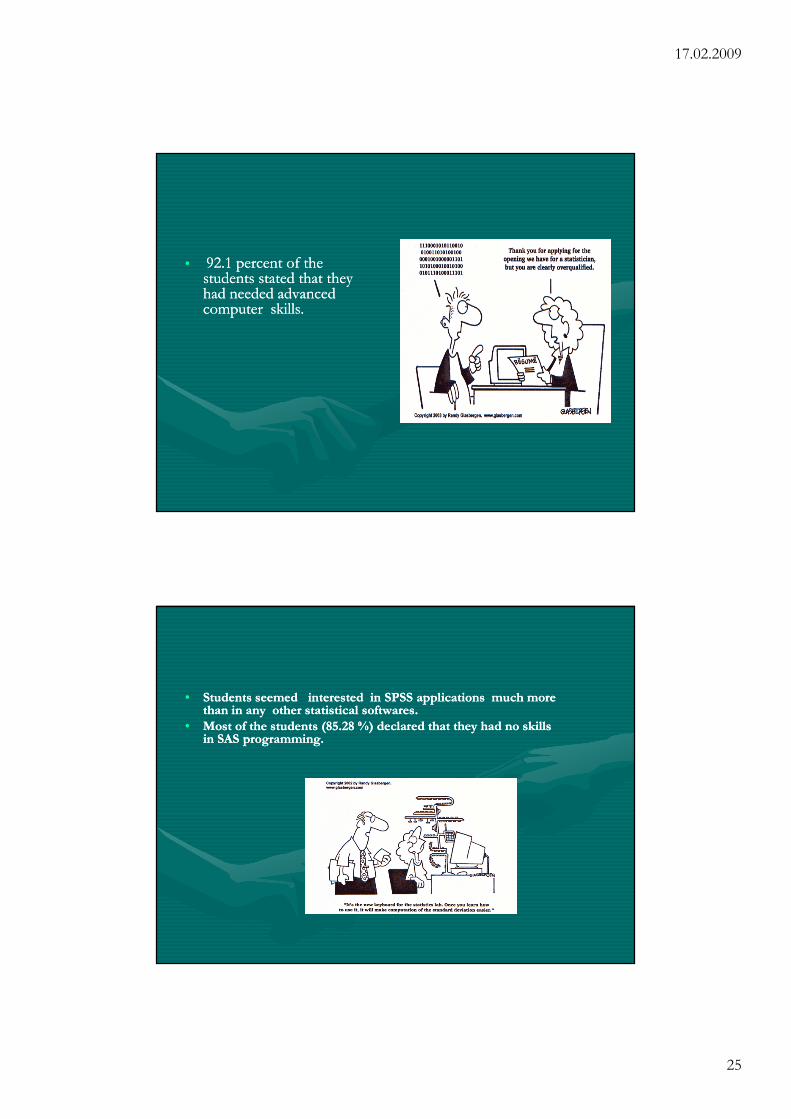
•• 92.1 percent of the 92.1 percent of the students stated that they students stated that they had needed advanced had needed advanced computer skills. computer skills.
•• Students seemed interested in SPSS applications much more Students seemed interested in SPSS applications much more than in any other statistical softwares. than in any other statistical softwares.
•• Most of the students (85.28 %) declared that they had no skills Most of the students (85.28 %) declared that they had no skills in SAS programming. in SAS programming.
17.02.2009
26
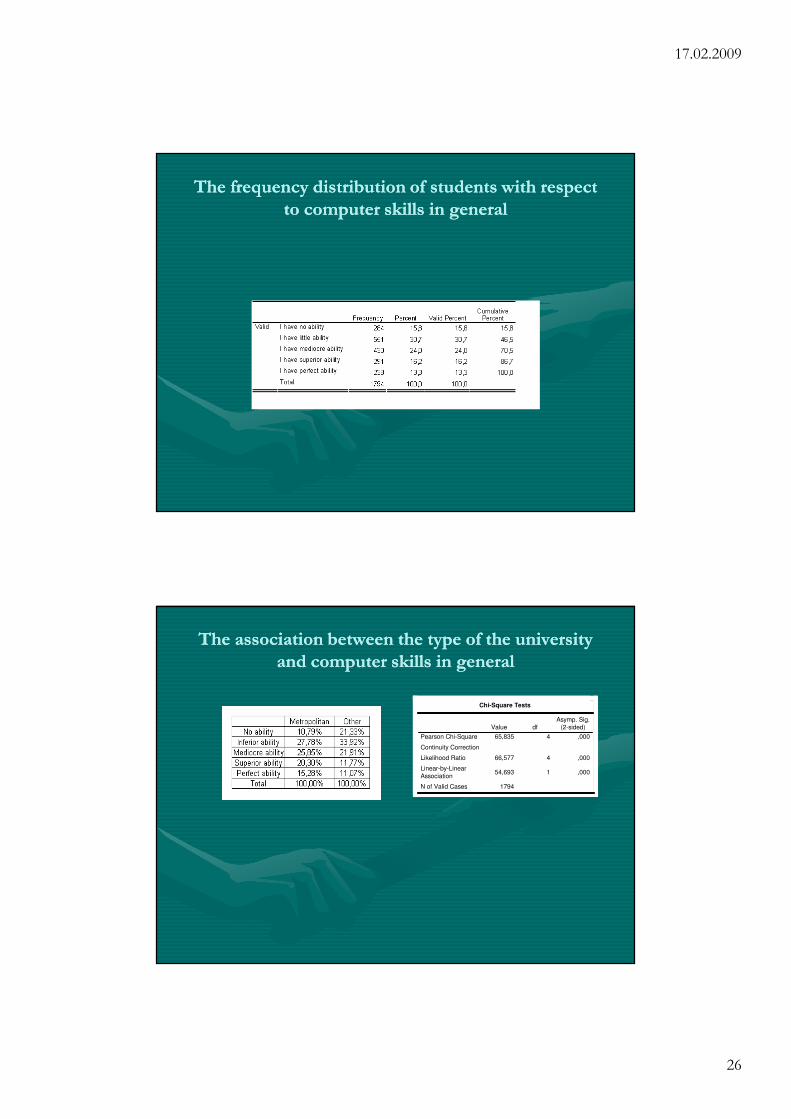
The frequency distribution of students with respect The frequency distribution of students with respect
to computer skills in generalto computer skills in general
The association between the type of the university The association between the type of the university
and computer skills in generaland computer skills in general
Chi-Square Tests
65,835 4 ,000
66,577 4 ,000
54,693 1 ,000
1794
Pearson Chi-Square
Continuity Correction
Likelihood Ratio
Linear-by-Linear
Association
N of Valid Cases
Value df
Asymp. Sig.
(2-sided)
17.02.2009
27
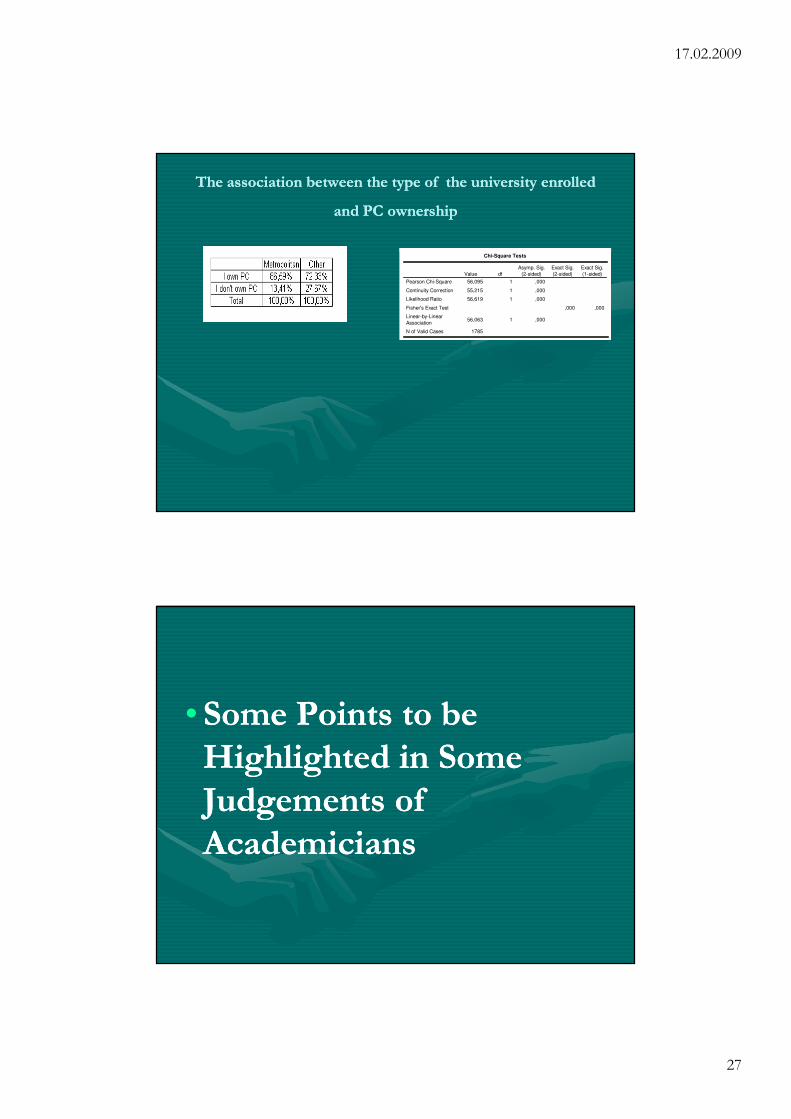
The association between the type of the university enrolled The association between the type of the university enrolled
and PC ownershipand PC ownership
Chi-Square Tests
56,095 1 ,000
55,215 1 ,000
56,619 1 ,000
,000 ,000
56,063 1 ,000
1785
Pearson Chi-Square
Continuity Correction
Likelihood Ratio
Fisher's Exact Test
Linear-by-Linear
Association
N of Valid Cases
Value df
Asymp. Sig.
(2-sided)
Exact Sig.
(2-sided)
Exact Sig.
(1-sided)
•• Some Points to be Some Points to be
Highlighted in Some Highlighted in Some
Judgements of Judgements of
AcademiciansAcademicians
17.02.2009
28
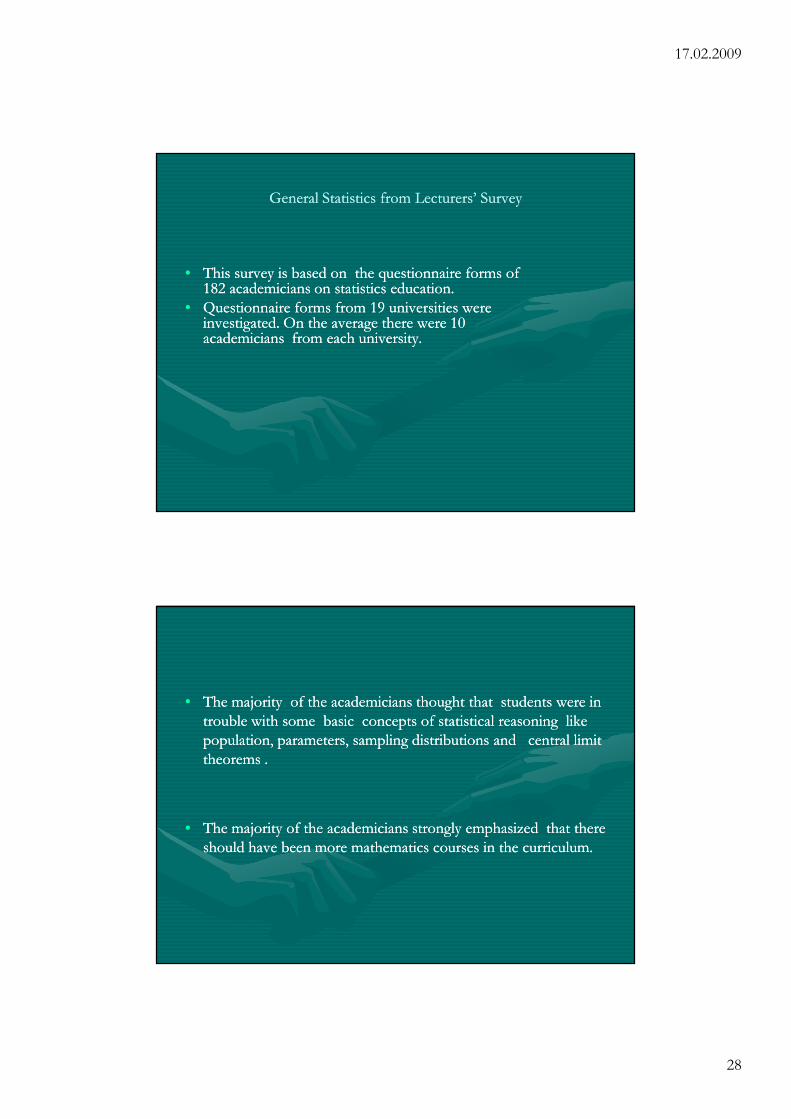
General Statistics from Lecturers’ SurveyGeneral Statistics from Lecturers’ Survey
•• This survey is based on the questionnaire forms of This survey is based on the questionnaire forms of 182 academicians on statistics education.182 academicians on statistics education.
•• Questionnaire forms from 19 universities were Questionnaire forms from 19 universities were investigated. On the average there were 10 investigated. On the average there were 10 academicians from each university. academicians from each university.
•• The majority of the academicians thought that students were in The majority of the academicians thought that students were in trouble with some basic concepts of statistical reasoning like trouble with some basic concepts of statistical reasoning like population, parameters, sampling distributions and central limit population, parameters, sampling distributions and central limit theorems . theorems .
•• The majority of the academicians strongly emphasized that there The majority of the academicians strongly emphasized that there should have been more mathematics courses in the curriculum.should have been more mathematics courses in the curriculum.
17.02.2009
29
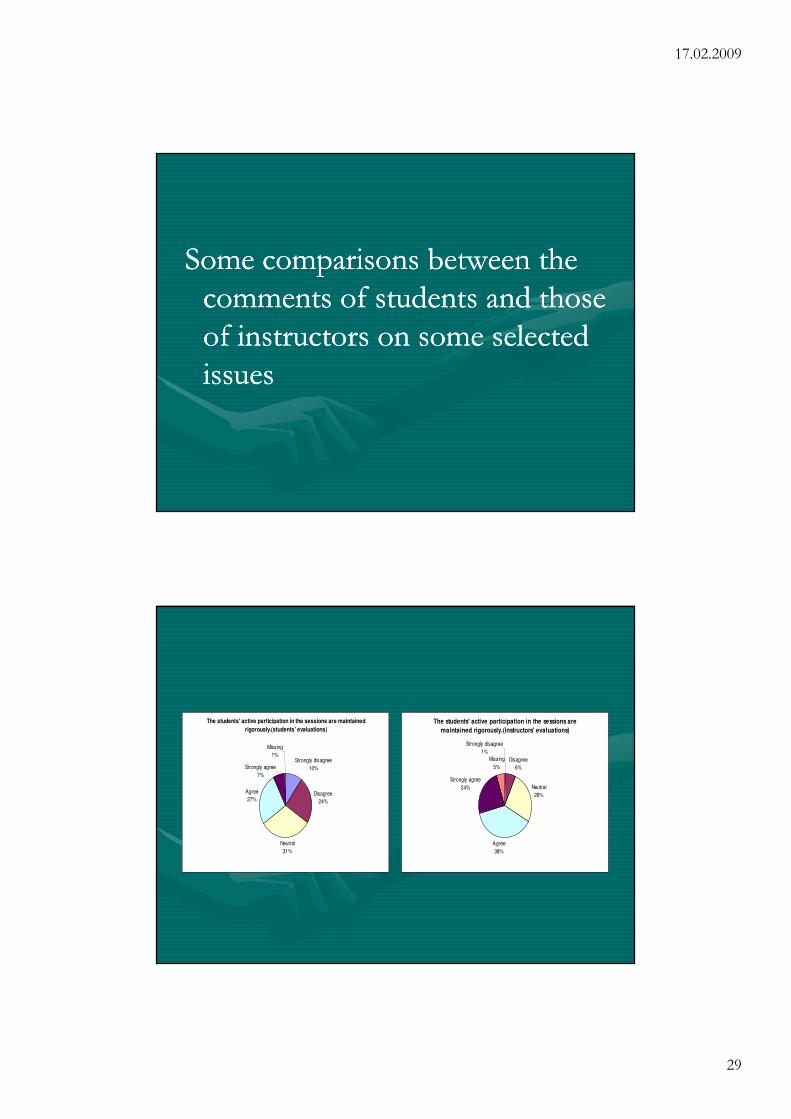
Some comparisons between the Some comparisons between the comments of students and those comments of students and those of instructors on some selected of instructors on some selected issuesissues
The students' active participation in the sessions are maintained
rigorously.(students' evaluations)
Strongly disagree
10%
Disagree
24%
Neutral
31%
Agree
27%
Strongly agree
7%
Missing
1%
The students' active participation in the sessions are
maintained rigorously.(instructors' evaluations)
Disagree
6%
Neutral
26%
Agree
38%
Strongly agree
24%
Missing
5%
Strongly disagree
1%
17.02.2009
30
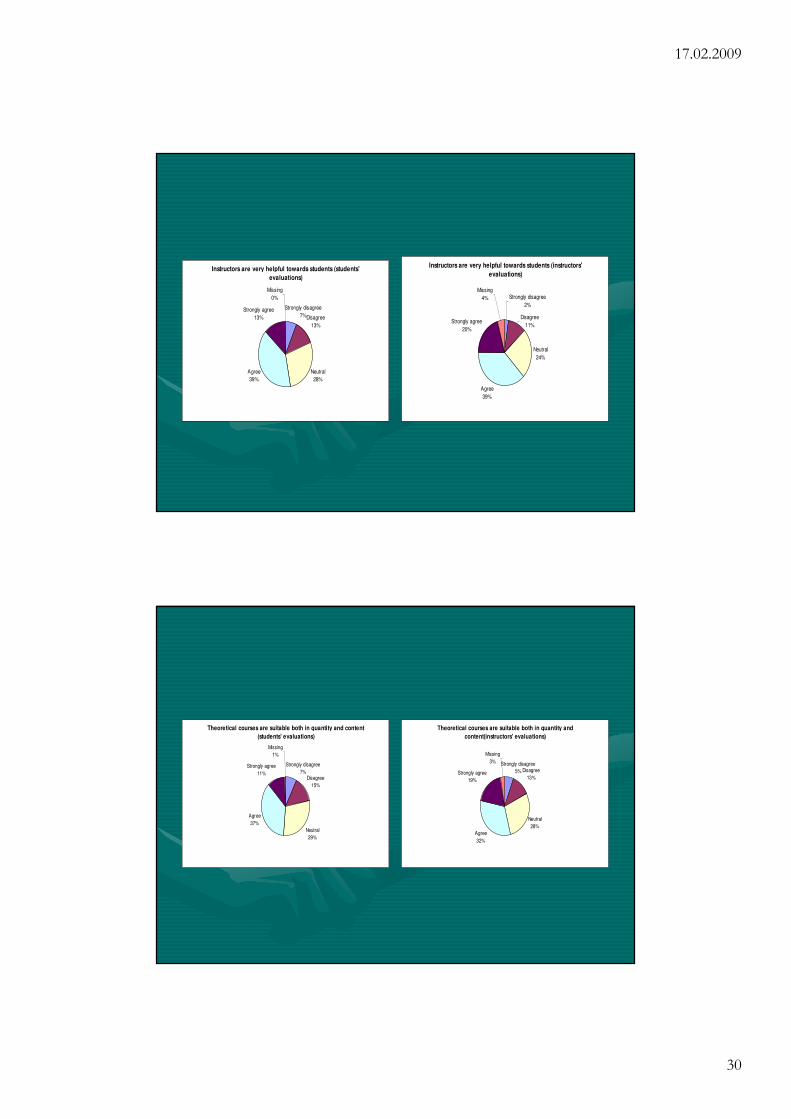
Instructors are very helpful towards students (students'
evaluations)
Strongly disagree
7%Disagree
13%
Neutral
28%
Agree
39%
Strongly agree
13%
Missing
0%
Instructors are very helpful towards students (instructors'
evaluations)
Strongly disagree
2%
Disagree
11%
Neutral
24%
Agree
39%
Strongly agree
20%
Missing
4%
Theoretical courses are suitable both in quantity and content
(students' evaluations)
Strongly disagree
7%Disagree
15%
Neutral
29%
Agree
37%
Strongly agree
11%
Missing
1%
Theoretical courses are suitable both in quantity and
content(instructors' evaluations)
Strongly disagree
5% Disagree
13%
Neutral
28%
Agree
32%
Strongly agree
19%
Missing
3%
17.02.2009
31
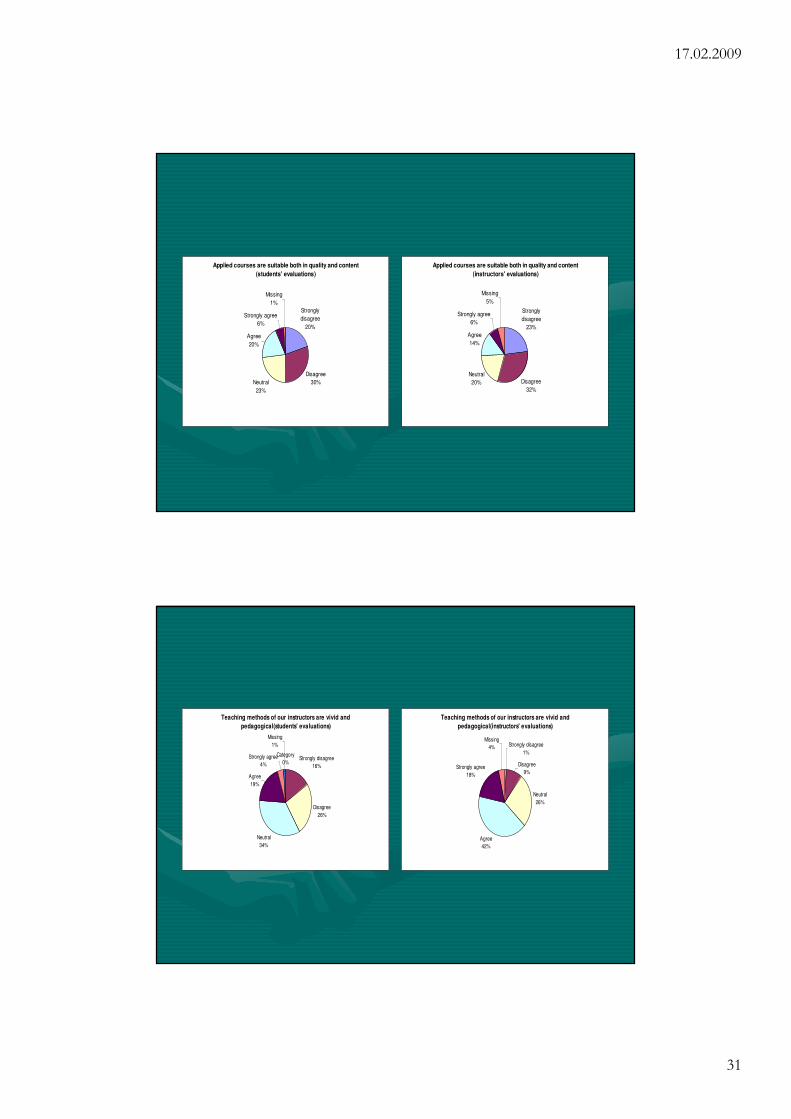
Applied courses are suitable both in quality and content
(students' evaluations)
Strongly
disagree
20%
Disagree
30%Neutral
23%
Agree
20%
Strongly agree
6%
Missing
1%
Applied courses are suitable both in quality and content
(instructors' evaluations)
Strongly
disagree
23%
Disagree
32%
Neutral
20%
Agree
14%
Strongly agree
6%
Missing
5%
Teaching methods of our instructors are vivid and
pedagogical(students' evaluations)
Category
0%Strongly disagree
16%
Disagree
26%
Neutral
34%
Agree
19%
Strongly agree
4%
Missing
1%
Teaching methods of our instructors are vivid and
pedagogical(instructors' evaluations)
Strongly disagree
1%
Disagree
9%
Neutral
26%
Agree
42%
Strongly agree
18%
Missing
4%
17.02.2009
32
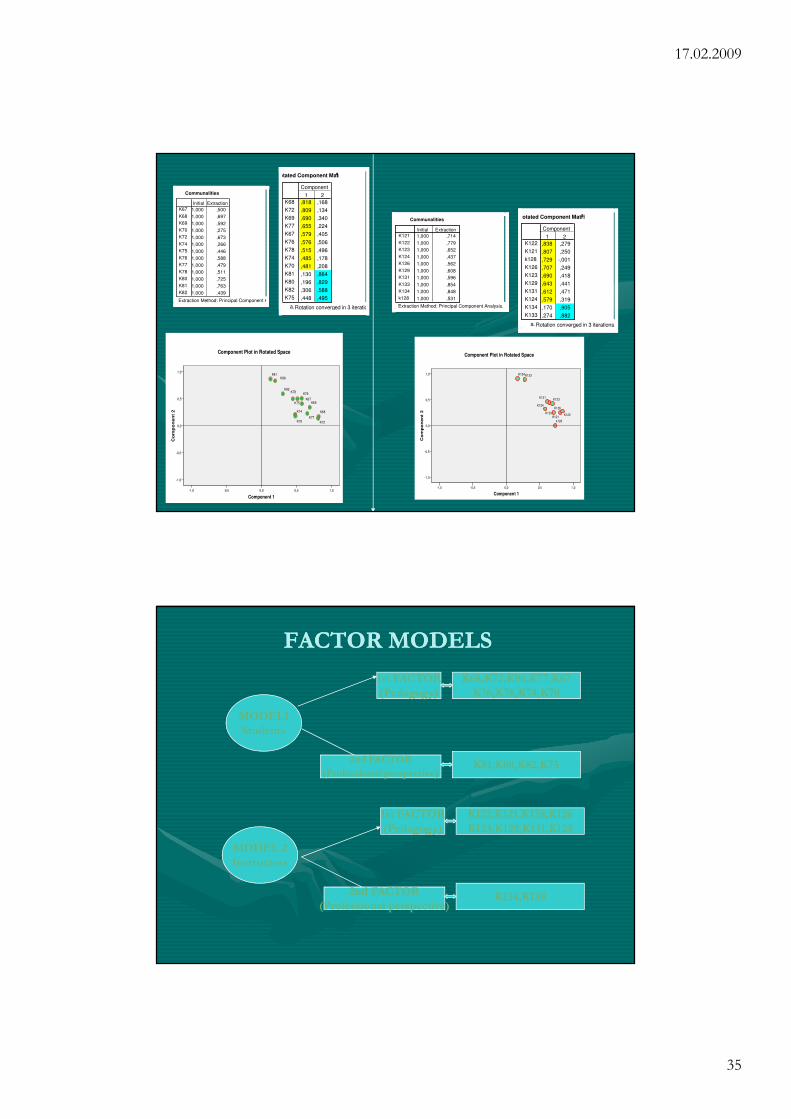
A Factor Analysis ModelA Factor Analysis Model
In this part, we intended to form a statistical In this part, we intended to form a statistical model on the satisfaction scores of both the model on the satisfaction scores of both the students and instructors with the departments students and instructors with the departments by some factorby some factor--regression models. First of all regression models. First of all among 30 questions, we picked 13 questions among 30 questions, we picked 13 questions (variables) related to students’ satisfaction levels, (variables) related to students’ satisfaction levels, and 10 questions related to instructors’ and 10 questions related to instructors’ satisfaction levels.satisfaction levels.
17.02.2009
33
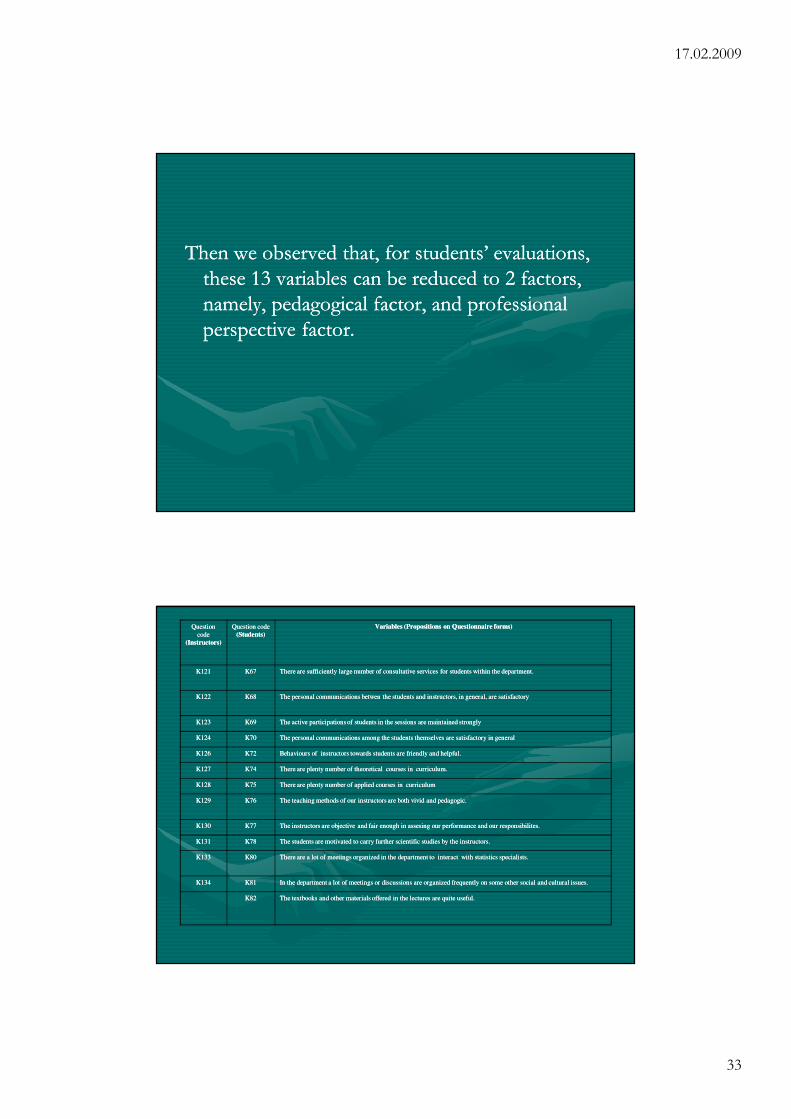
Then we observed that, for students’ evaluations, Then we observed that, for students’ evaluations, these 13 variables can be reduced to 2 factors, these 13 variables can be reduced to 2 factors, namely, pedagogical factor, and professional namely, pedagogical factor, and professional perspective factor. perspective factor.
Question Question
codecode
(Instructors)(Instructors)
Question codeQuestion code
(Students)(Students)
Variables (Propositions on Questionnaire forms)Variables (Propositions on Questionnaire forms)
K121K121 K67K67 ThereThere areare sufficientlysufficiently largelarge numbernumber ofof consultativeconsultative servicesservices forfor studentsstudents withinwithin thethe departmentdepartment..
K122K122 K68K68 TheThe personalpersonal communicationscommunications betwenbetwen thethe studentsstudents andand instructors,instructors, inin general,general, areare satisfactorysatisfactory
K123K123 K69K69 TheThe activeactive participationsparticipations ofof studentsstudents inin thethe sessionssessions areare maintainedmaintained stronglystrongly
K124K124 K70K70 TheThe personalpersonal communicationscommunications amongamong thethe studentsstudents themselvesthemselves areare satisfactorysatisfactory inin generalgeneral
K126K126 K72K72 BehavioursBehaviours ofof instructorsinstructors towardstowards studentsstudents areare friendlyfriendly andand helpfulhelpful..
K127K127 K74K74 ThereThere areare plentyplenty numbernumber ofof theoreticaltheoretical coursescourses inin curriculumcurriculum..
K128K128 K75K75 ThereThere areare plentyplenty numbernumber ofof appliedapplied coursescourses inin curriculumcurriculum
K129K129 K76K76 TheThe teachingteaching methodsmethods ofof ourour instructorsinstructors areare bothboth vividvivid andand pedagogicpedagogic..
K130K130 K77K77 TheThe instructorsinstructors areare objectiveobjective andand fairfair enoughenough inin assesingassesing ourour performanceperformance andand ourour responsibilitesresponsibilites..
K131K131 K78K78 TheThe studentsstudents areare motivatedmotivated toto carrycarry furtherfurther scientificscientific studiesstudies byby thethe instructorsinstructors..
K133K133 K80K80 ThereThere areare aa lotlot ofof meetingsmeetings organizedorganized inin thethe departmentdepartment toto interactinteract withwith statisticsstatistics specialistsspecialists..
K134K134 K81K81 InIn thethe departmentdepartment aa lotlot ofof meetingsmeetings oror discussionsdiscussions areare organizedorganized frequentlyfrequently onon somesome otherother socialsocial andand culturalcultural issuesissues..
K82K82 TheThe textbookstextbooks andand otherother materialsmaterials offeredoffered inin thethe lectureslectures areare quitequite usefuluseful..
17.02.2009
34
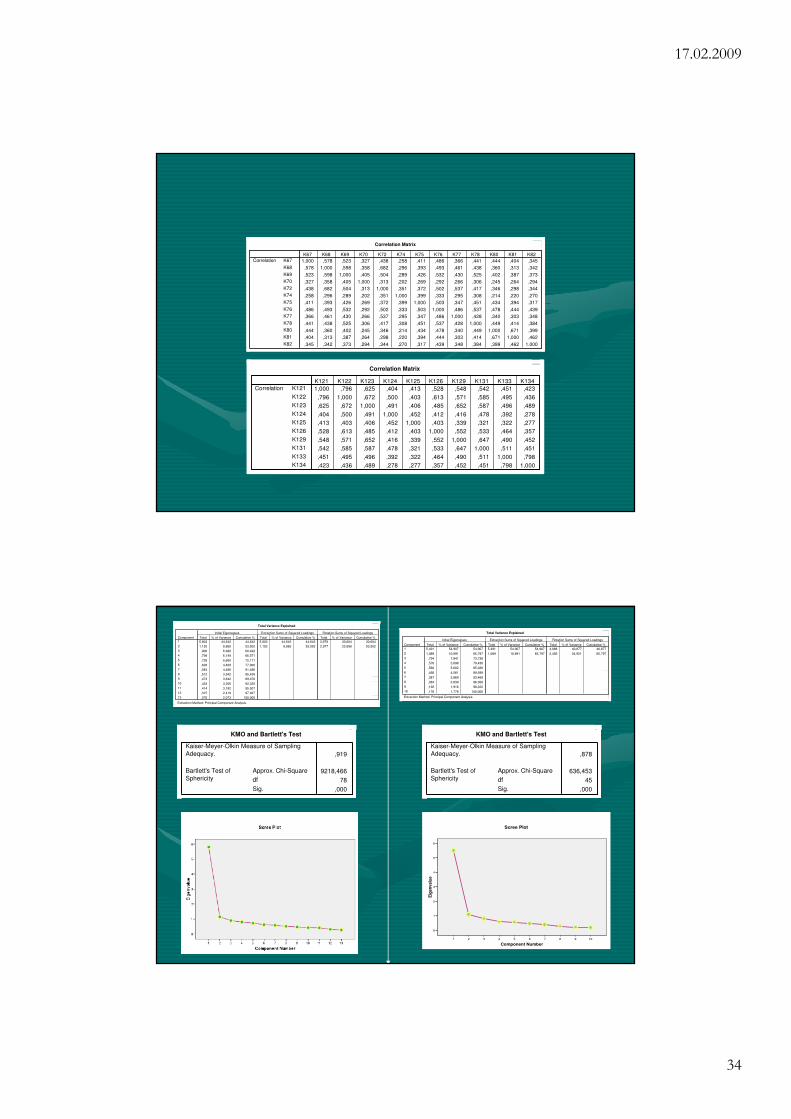
Correlation Matrix
1,000 ,578 ,523 ,327 ,438 ,258 ,411 ,486 ,366 ,441 ,444 ,404 ,345
,578 1,000 ,598 ,358 ,682 ,296 ,393 ,493 ,461 ,438 ,360 ,313 ,342
,523 ,598 1,000 ,405 ,504 ,289 ,426 ,532 ,430 ,525 ,402 ,387 ,373
,327 ,358 ,405 1,000 ,313 ,202 ,269 ,292 ,266 ,306 ,245 ,264 ,294
,438 ,682 ,504 ,313 1,000 ,351 ,372 ,502 ,537 ,417 ,346 ,298 ,344
,258 ,296 ,289 ,202 ,351 1,000 ,399 ,333 ,295 ,308 ,214 ,220 ,270
,411 ,393 ,426 ,269 ,372 ,399 1,000 ,503 ,347 ,451 ,434 ,394 ,317
,486 ,493 ,532 ,292 ,502 ,333 ,503 1,000 ,486 ,537 ,478 ,444 ,439
,366 ,461 ,430 ,266 ,537 ,295 ,347 ,486 1,000 ,428 ,340 ,303 ,348
,441 ,438 ,525 ,306 ,417 ,308 ,451 ,537 ,428 1,000 ,449 ,414 ,384
,444 ,360 ,402 ,245 ,346 ,214 ,434 ,478 ,340 ,449 1,000 ,671 ,399
,404 ,313 ,387 ,264 ,298 ,220 ,394 ,444 ,303 ,414 ,671 1,000 ,462
,345 ,342 ,373 ,294 ,344 ,270 ,317 ,439 ,348 ,384 ,399 ,462 1,000
K67
K68
K69
K70
K72
K74
K75
K76
K77
K78
K80
K81
K82
Correlation
K67 K68 K69 K70 K72 K74 K75 K76 K77 K78 K80 K81 K82
Correlation Matrix
1,000 ,796 ,625 ,404 ,413 ,528 ,548 ,542 ,451 ,423
,796 1,000 ,672 ,500 ,403 ,613 ,571 ,585 ,495 ,436
,625 ,672 1,000 ,491 ,406 ,485 ,652 ,587 ,496 ,489
,404 ,500 ,491 1,000 ,452 ,412 ,416 ,478 ,392 ,278
,413 ,403 ,406 ,452 1,000 ,403 ,339 ,321 ,322 ,277
,528 ,613 ,485 ,412 ,403 1,000 ,552 ,533 ,464 ,357
,548 ,571 ,652 ,416 ,339 ,552 1,000 ,647 ,490 ,452
,542 ,585 ,587 ,478 ,321 ,533 ,647 1,000 ,511 ,451
,451 ,495 ,496 ,392 ,322 ,464 ,490 ,511 1,000 ,798
,423 ,436 ,489 ,278 ,277 ,357 ,452 ,451 ,798 1,000
K121
K122
K123
K124
K125
K126
K129
K131
K133
K134
Correlation
K121 K122 K123 K124 K125 K126 K129 K131 K133 K134
KMO and Bartlett's Test
,919
9218,466
78
,000
Kaiser-Meyer-Olkin Measure of Sampling
Adequacy.
Approx. Chi-Square
df
Sig.
Bartlett's Test of
Sphericity
KMO and Bartlett's Test
,878
636,453
45
,000
Kaiser-Meyer-Olkin Measure of Sampling
Adequacy.
Approx. Chi-Square
df
Sig.
Bartlett's Test of
Sphericity
Total Variance Explained
5,803 44,642 44,642 5,803 44,642 44,642 3,979 30,604 30,604
1,152 8,860 53,502 1,152 8,860 53,502 2,977 22,898 53,502
,900 6,920 60,422
,799 6,149 66,571
,728 5,600 72,171
,628 4,829 77,000
,583 4,486 81,486
,512 3,942 85,428
,473 3,642 89,070
,423 3,256 92,325
,414 3,182 95,507
,315 2,419 97,927
,270 2,073 100,000
Component
1
2
3
4
5
6
7
8
9
10
11
12
13
Total % of Variance Cumulative % Total % of Variance Cumulative % Total % of Variance Cumulative %
Initial Eigenvalues Extraction Sums of Squared Loadings Rotation Sums of Squared Loadings
Extraction Method: Principal Component Analysis.
Total Variance Explained
5,491 54,907 54,907 5,491 54,907 54,907 4,088 40,877 40,877
1,089 10,891 65,797 1,089 10,891 65,797 2,492 24,921 65,797
,794 7,941 73,738
,570 5,698 79,436
,560 5,602 85,038
,456 4,561 89,599
,387 3,869 93,468
,284 2,839 96,306
,192 1,916 98,222
,178 1,778 100,000
Component
1
2
3
4
5
6
7
8
9
10
Total % of Variance Cumulative % Total % of Variance Cumulative % Total % of Variance Cumulative %
Initial Eigenvalues Extraction Sums of Squared Loadings Rotation Sums of Squared Loadings
Extraction Method: Principal Component Analysis.
Component Number
10987654321
Eig
en
va
lue
6
5
4
3
2
1
0
Scree Plot
17.02.2009
35
Communalities
1,000 ,500
1,000 ,697
1,000 ,592
1,000 ,275
1,000 ,673
1,000 ,266
1,000 ,446
1,000 ,588
1,000 ,479
1,000 ,511
1,000 ,725
1,000 ,763
1,000 ,439
K67
K68
K69
K70
K72
K74
K75
K76
K77
K78
K80
K81
K82
Initial Extraction
Extraction Method: Principal Component Analysis.
Rotated Component Matrixa
,818 ,168
,809 ,134
,690 ,340
,655 ,224
,579 ,405
,576 ,506
,515 ,496
,485 ,178
,481 ,208
,130 ,864
,196 ,829
,306 ,588
,448 ,495
K68
K72
K69
K77
K67
K76
K78
K74
K70
K81
K80
K82
K75
1 2
Component
Rotation converged in 3 iterations.a.
Communalities
1,000 ,714
1,000 ,779
1,000 ,652
1,000 ,437
1,000 ,562
1,000 ,608
1,000 ,596
1,000 ,854
1,000 ,848
1,000 ,531
K121
K122
K123
K124
K126
K129
K131
K133
K134
k128
Initial Extraction
Extraction Method: Principal Component Analysis.
Rotated Component Matrixa
,838 ,279
,807 ,250
,729 -,001
,707 ,249
,690 ,418
,643 ,441
,612 ,471
,579 ,319
,170 ,905
,274 ,882
K122
K121
k128
K126
K123
K129
K131
K124
K134
K133
1 2
Component
Rotation converged in 3 iterations.a.
Component 1
1,00,50,0-0,5-1,0
Co
mp
on
en
t 2
1,0
0,5
0,0
-0,5
-1,0
K82
K81K80
K78
K77
K76
K75
K74
K72K70
K69
K68
K67
Component Plot in Rotated Space
Component 1
1,00,50,0-0,5-1,0
Co
mp
on
en
t 2
1,0
0,5
0,0
-0,5
-1,0
k128
K134K133
K131
K129
K126K124
K123
K122K121
Component Plot in Rotated Space
FACTOR MODELSFACTOR MODELS
MODEL 2
Instructors
1st FACTOR
(Pedagogy)
2nd FACTOR
(Professional perspective)
MODEL1
Students
1st FACTOR
(Pedagogy)
2nd FACTOR
(Professional perspective)
K68,K72,K96,K77,K67
K76,K78,K74,K70
K81,K80,K82,K75
K122,K121,K128,K126
K123,K129,K131,K124
K134,K138
17.02.2009
36
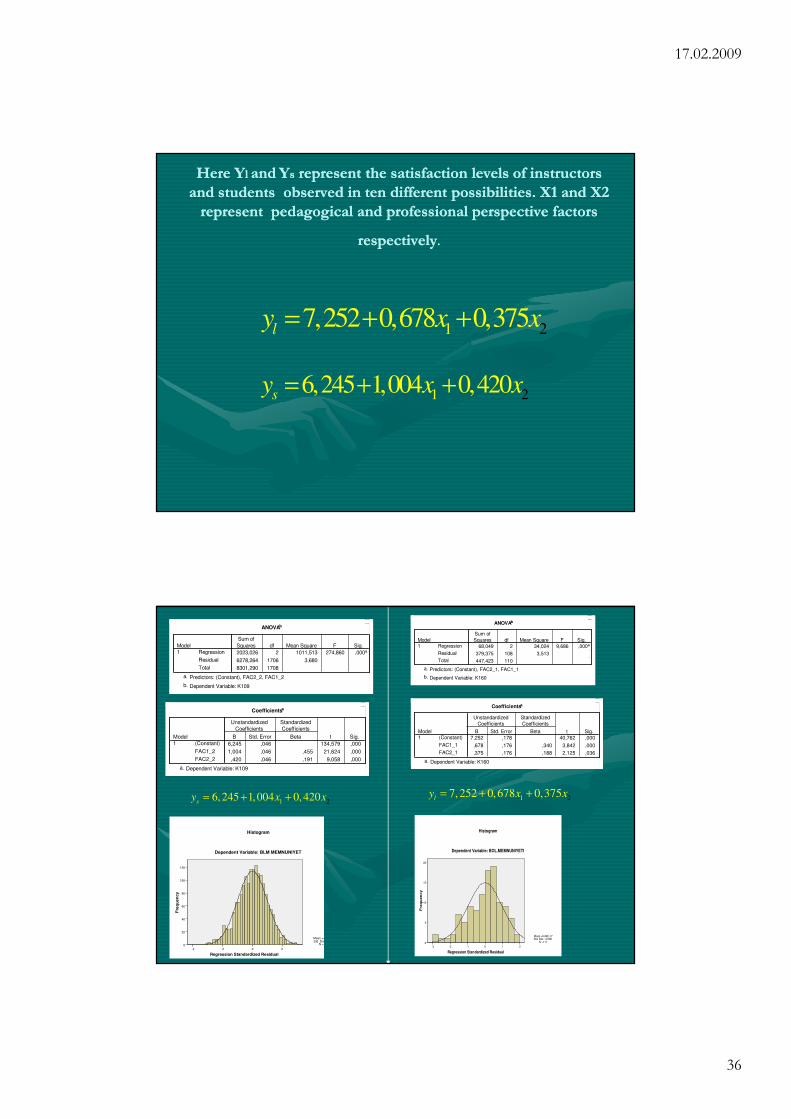
Here YHere Yl l andand YYss represent the satisfaction levels of instructors represent the satisfaction levels of instructors
and students observed in ten different possibilities. X1 and X2 and students observed in ten different possibilities. X1 and X2
represent pedagogical and professional perspective factors represent pedagogical and professional perspective factors
respectivelyrespectively..
1 26,245 1,004 0,420sy x x= + +
1 27,252 0,678 0,375l
y x x= + +
ANOVAb
2023,026 2 1011,513 274,860 ,000a
6278,264 1706 3,680
8301,290 1708
Regression
Residual
Total
Model1
Sum of
Squares df Mean Square F Sig.
Predictors: (Constant), FAC2_2, FAC1_2a.
Dependent Variable: K109b.
Coefficientsa
6,245 ,046 134,579 ,000
1,004 ,046 ,455 21,624 ,000
,420 ,046 ,191 9,058 ,000
(Constant)
FAC1_2
FAC2_2
Model
1
B Std. Error
Unstandardized
Coefficients
Beta
Standardized
Coefficients
t Sig.
Dependent Variable: K109a.
Regression Standardized Residual
20-2-4
Fre
qu
en
cy
120
100
80
60
40
20
0
Histogram
Dependent Variable: BLM MEMNUNIYET
Mean =-1,63E-16Std. Dev. =0,999
N =1.709
1 26, 245 1,004 0, 420
sy x x= + +
ANOVAb
68,049 2 34,024 9,686 ,000a
379,375 108 3,513
447,423 110
Regression
Residual
Total
Model1
Sum of
Squares df Mean Square F Sig.
Predictors: (Constant), FAC2_1, FAC1_1a.
Dependent Variable: K160b.
Coefficientsa
7,252 ,178 40,762 ,000
,678 ,176 ,340 3,842 ,000
,375 ,176 ,188 2,125 ,036
(Constant)
FAC1_1
FAC2_1
Model1
B Std. Error
Unstandardized
Coefficients
Beta
Standardized
Coefficients
t Sig.
Dependent Variable: K160a.
1 27, 252 0,678 0,375ly x x= + +
Regression Standardized Residual
210-1-2-3
Freq
uen
cy
20
15
10
5
0
Histogram
Dependent Variable: BOL.MEMNUNIYETI
Mean =6,94E-17 Std. Dev. =0,991
N =111

17.02.2009
37
PROPOSALSPROPOSALS•• There should be more statistics courses in the There should be more statistics courses in the
curricula in order to increase the level of curricula in order to increase the level of specialization in statistics undergraduate specialization in statistics undergraduate education.education.
•• It will be wiser to support curricula with more It will be wiser to support curricula with more qualified computer science lectures.qualified computer science lectures.
•• Mathematics and statistics need each other . Mathematics and statistics need each other . Collaborative studies with mathematics Collaborative studies with mathematics departments should be on the agenda. As a departments should be on the agenda. As a starting point of this collaboration; some starting point of this collaboration; some meetings must be organized to discuss the meetings must be organized to discuss the common problems of both mathematics and common problems of both mathematics and statistics education. statistics education.
17.02.2009
38
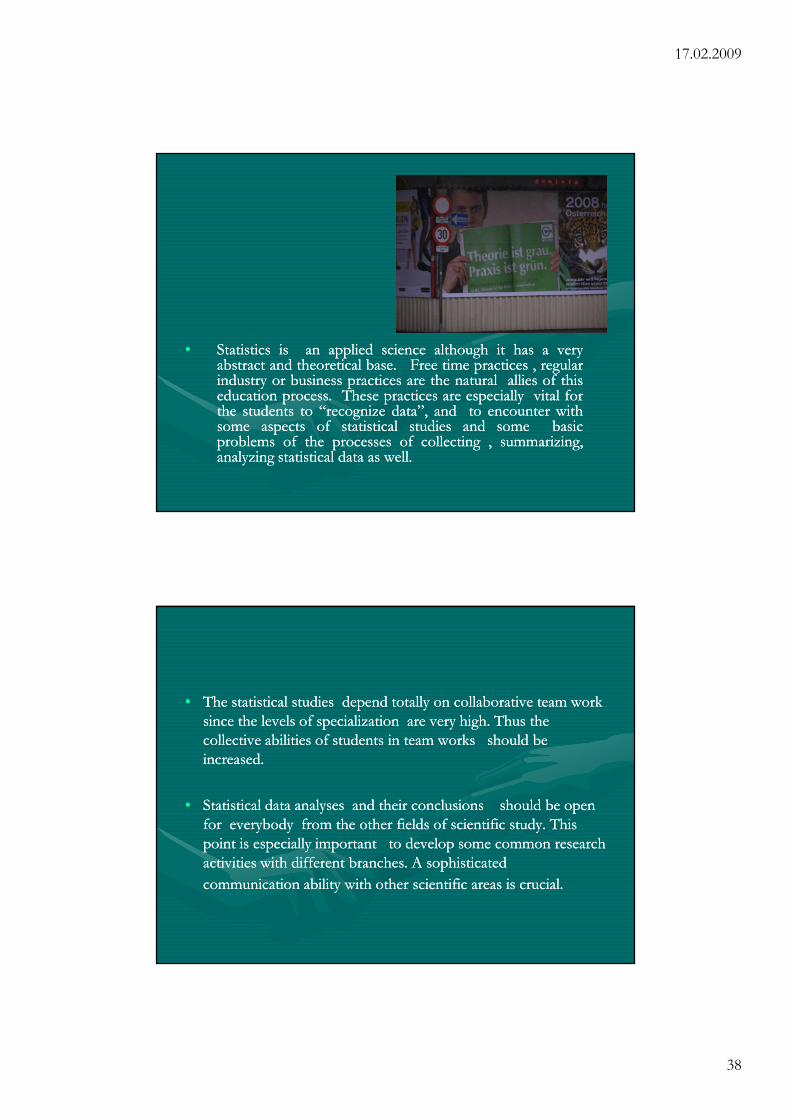
•• StatisticsStatistics isis anan appliedapplied sciencescience althoughalthough itit hashas aa veryveryabstractabstract andand theoreticaltheoretical basebase.. FreeFree timetime practicespractices ,, regularregularindustryindustry oror businessbusiness practicespractices areare thethe naturalnatural alliesallies ofof thisthiseducationeducation processprocess.. TheseThese practicespractices areare especiallyespecially vitalvital forforthethe studentsstudents toto “recognize“recognize data”,data”, andand toto encounterencounter withwithsomesome aspectsaspects ofof statisticalstatistical studiesstudies andand somesome basicbasicproblemsproblems ofof thethe processesprocesses ofof collectingcollecting ,, summarizing,summarizing,analyzinganalyzing statisticalstatistical datadata asas wellwell..
•• The statistical studies depend totally on collaborative team work The statistical studies depend totally on collaborative team work since the levels of specialization are very high. Thus the since the levels of specialization are very high. Thus the collective abilities of students in team works should be collective abilities of students in team works should be increased.increased.
•• Statistical data analyses and their conclusions should be open Statistical data analyses and their conclusions should be open for everybody from the other fields of scientific study. This for everybody from the other fields of scientific study. This point is especially important to develop some common research point is especially important to develop some common research activities with different branches. A sophisticated activities with different branches. A sophisticated
communication ability with other scientific areas is crucial.communication ability with other scientific areas is crucial.
17.02.2009
39
•• The students of statistics should have some abilities in data The students of statistics should have some abilities in data collecting methodologies and related technologies. Statistics collecting methodologies and related technologies. Statistics curricula should serve this purpose. curricula should serve this purpose.
•• The graphical presentations are very important in business The graphical presentations are very important in business life’s communications. Students should develop ways of life’s communications. Students should develop ways of thinking by the help of histograms, charts, graphics and thinking by the help of histograms, charts, graphics and develop some abilities to make explanations on the data for develop some abilities to make explanations on the data for the people who don’t have any sufficient background in the people who don’t have any sufficient background in statistical reasoning. statistical reasoning.
•• There should be some surveys on the pedagogical values of There should be some surveys on the pedagogical values of the textbooks offered during statistics education. the textbooks offered during statistics education.
•• Specifically, the performances of math courses offered in Specifically, the performances of math courses offered in statistics departments should be reviewed. statistics departments should be reviewed.
17.02.2009
40
•• “Teachers should consider computing as a tool “Teachers should consider computing as a tool for learning statistics, not simply for doing for learning statistics, not simply for doing statistics. Because graphics and manipulations statistics. Because graphics and manipulations aid learning, we should encourage students to aid learning, we should encourage students to use software to explore , visualize, and interact use software to explore , visualize, and interact with data and simulations, not simply to with data and simulations, not simply to automate calculations.” (Moore, 1997, p. 131) automate calculations.” (Moore, 1997, p. 131)
•• “Time spent on teaching is often viewed as time taken “Time spent on teaching is often viewed as time taken away from research, and research is what leads away from research, and research is what leads promotion and tenure. Faculty should also be promotion and tenure. Faculty should also be encouraged to collaborate in educational research encouraged to collaborate in educational research related to their teaching, adressing issues such as those related to their teaching, adressing issues such as those raised relating to the use of technology. Publication of raised relating to the use of technology. Publication of this “educational “ research should be counted the same this “educational “ research should be counted the same as published statistical research.”( Garfield, (1997, pp. as published statistical research.”( Garfield, (1997, pp. 140140--141)141)
17.02.2009
41
•• ThereThere isis currentlycurrently littlelittle tangibletangible incentive,incentive, andand inin factfactsignificantsignificant disincentivedisincentive ,, forfor statisticiansstatisticians inin academiaacademia totospendspend timetime onon improvingimproving introductoryintroductory coursescourses.. CouldCould wewehonestlyhonestly encourageencourage youngyoung professors,professors, seekingseeking tenure,tenure, totospendspend thethe timetime requiredrequired toto fundamentallyfundamentally improveimprove theirtheirintroductoryintroductory coursescourses atat thethe expenseexpense ofof publications?publications? ThisThisisis aa problemproblem withwith thethe system,system, andand cannotcannot bebe resolvedresolvedeasilyeasily byby individualsindividuals workingworking inin isolationisolation..(( Hoerl,Hoerl, etet alal..,,19971997,, pp.. 152152))
•• Before observing the maturity of Before observing the maturity of currently existing statistics programs it currently existing statistics programs it will be useless to open some more will be useless to open some more departments. The extensive growth of departments. The extensive growth of statistics departments will inevitably statistics departments will inevitably result in an inflationary process of result in an inflationary process of having departments lacking quality. having departments lacking quality. Both the students and the graduates are Both the students and the graduates are very sensitive on this issue. very sensitive on this issue.
17.02.2009
42
•• At least an introductory statistics course should be offered for At least an introductory statistics course should be offered for the final classes of high schools to make statistics popular and the final classes of high schools to make statistics popular and wellwell--known among prospective university students. This known among prospective university students. This proposal will serve the purpose of maintaining the position of proposal will serve the purpose of maintaining the position of statistics “culturally healthy” in society.statistics “culturally healthy” in society.
•• Some surveys on the working conditions of the graduates of Some surveys on the working conditions of the graduates of statistics departments should be realized.statistics departments should be realized.
•• The “ data specialist” or “data analyst” titles should be given to The “ data specialist” or “data analyst” titles should be given to young graduates. At least a discussion on this legal issue should young graduates. At least a discussion on this legal issue should be realized in the public. be realized in the public.
•• Because of the interdisciplinary characteristic of statistics, the Because of the interdisciplinary characteristic of statistics, the applicability opportunities of statistical methods in other areas applicability opportunities of statistical methods in other areas such as engineering or social sciences should be increased.such as engineering or social sciences should be increased.
17.02.2009
43
REFERENCESREFERENCES
1)1) Aliaga, M. (1998), “ReAliaga, M. (1998), “Re--thinking Stat 101.” Paper presented at the Fifth thinking Stat 101.” Paper presented at the Fifth International Conference on Teaching Statistics, Singapore. International Conference on Teaching Statistics, Singapore.
2)2) Bryce, G.R.,Gould, R., Notz,W.I., Peck, R.I., “Curriculum Guidelines for Bryce, G.R.,Gould, R., Notz,W.I., Peck, R.I., “Curriculum Guidelines for Bachelor of Science degrees in Statistical Science”Bachelor of Science degrees in Statistical Science”
3)3) Bureau of Labor Statistics (2000), Occupational Outlook Handbook, 2000Bureau of Labor Statistics (2000), Occupational Outlook Handbook, 2000--01. 01. Bulletin 2520.Bulletin 2520.
4) Butler, R.S. (1998), “On the failure of the widespread use of statistics”, 4) Butler, R.S. (1998), “On the failure of the widespread use of statistics”, Amstat News, March,84.Amstat News, March,84.
5)5) Cobb, G. (1992), “Teaching Statistics, in Heeding the Call for Change”, MAA Cobb, G. (1992), “Teaching Statistics, in Heeding the Call for Change”, MAA Notes, Notes,
33--43.43.6)6) Ewing, J., ed. (1999), “Towards Excellence: Leading a Mathematics Ewing, J., ed. (1999), “Towards Excellence: Leading a Mathematics
Department in the 21st Century”, Providence,RI: American Mathematical Department in the 21st Century”, Providence,RI: American Mathematical SocietySociety
7)7) Garfield, J.(1995), “How students learn statistics” International Statistical Garfield, J.(1995), “How students learn statistics” International Statistical Review, 63,Review, 63,
2525--34. 34. 8)8) Garfield, J.,Hogg, B., Schau, C.,Whittinghill, D.(2000), “Best Practices in Garfield, J.,Hogg, B., Schau, C.,Whittinghill, D.(2000), “Best Practices in
Introductory Statistics”, Draft 2000.06.19Introductory Statistics”, Draft 2000.06.199)9) Garfield, J. (2000), “An Evaluation of the Impact of Statistics Reform”. Final Garfield, J. (2000), “An Evaluation of the Impact of Statistics Reform”. Final
Report for NSF Project RECReport for NSF Project REC--9732404.9732404.10)10) Hahn, G., and Hoerl, R. (1998), “Key Challenges for statisticians in business Hahn, G., and Hoerl, R. (1998), “Key Challenges for statisticians in business
and industry”, Technometrics, 40, 195and industry”, Technometrics, 40, 195--200. 200. 11)11) Higgins, J.J. (1999), “Nonmathematical Statistics: A New Direction for the Higgins, J.J. (1999), “Nonmathematical Statistics: A New Direction for the
Undergraduate Discipline”, The American Statistician, 53, 1Undergraduate Discipline”, The American Statistician, 53, 1--6.6.12)12) Hoaglin, D.C.,Moore, D.S.,(Eds) (1992) “Perspectives on Contemporary Hoaglin, D.C.,Moore, D.S.,(Eds) (1992) “Perspectives on Contemporary
Statistics”, Mathematical Association of America, MAA Notes, Number 21.Statistics”, Mathematical Association of America, MAA Notes, Number 21.
17.02.2009
44
13)13) Hogg, R.(1992), Report on Workshop on Statistics Education, in Heeding the Hogg, R.(1992), Report on Workshop on Statistics Education, in Heeding the Call for Change, MAA Notes, 34Call for Change, MAA Notes, 34--43.43.
14)14)Hogg ,R.V., Ritter, M.A.;Starbuck, R.(2000), “Advice from Prospective Hogg ,R.V., Ritter, M.A.;Starbuck, R.(2000), “Advice from Prospective Employers on Training BS Statisticians” , A paper prepared as part of the Employers on Training BS Statisticians” , A paper prepared as part of the Undergraduate Statistics Education Initiative of the American Statistical Undergraduate Statistics Education Initiative of the American Statistical Association, June 30 2000.Association, June 30 2000.
15)15) Loftsgaarden, D.O.,Watkins,A.E. (1998), “Statistics teaching in colleges and Loftsgaarden, D.O.,Watkins,A.E. (1998), “Statistics teaching in colleges and universities:Courses,instructors,and degrees in fall 1995.”, The American universities:Courses,instructors,and degrees in fall 1995.”, The American Statistician, 4,308Statistician, 4,308--314.314.
16)16) Marquardt, D.W. (1987), “The Importance of Statisticians”, The Journal of Marquardt, D.W. (1987), “The Importance of Statisticians”, The Journal of American Statistical Association, 82, 1American Statistical Association, 82, 1--7. 7.
17)17) Minton, P.D.(1983), “The Visibility of Statistics as a Discipline”, The Minton, P.D.(1983), “The Visibility of Statistics as a Discipline”, The American Statistician,37, 284American Statistician,37, 284--289.289.
18)18) Moore, D.S. (1997a), “New Pedagogy and new content: the case of statistics”, Moore, D.S. (1997a), “New Pedagogy and new content: the case of statistics”, International Statistical Review, 65, 123International Statistical Review, 65, 123--137137
19)19)Moore, D.S. (1997b), Response, International Statistical Review, 65,162Moore, D.S. (1997b), Response, International Statistical Review, 65,162--165.165.20)20) Moore, D.S.(2000), “Undergraduate Programs and the Future of Academic Statistics”, Moore, D.S.(2000), “Undergraduate Programs and the Future of Academic Statistics”,
An Adaptation of the keynote talk at a Symposium on Undergraduate Education held An Adaptation of the keynote talk at a Symposium on Undergraduate Education held prior to the 2000 Joint Statistical Meetings in Indianapolis.prior to the 2000 Joint Statistical Meetings in Indianapolis.
21)21) Moore, D.S., and Cobb, G.W. (2000), “Statistics and mathematics tension and Moore, D.S., and Cobb, G.W. (2000), “Statistics and mathematics tension and cooperation”, American Mathematical Monthly, 107, 615cooperation”, American Mathematical Monthly, 107, 615--630.630.
22)22) Niss, M. (1999), “Aspects of the nature and state of research in mathematics Niss, M. (1999), “Aspects of the nature and state of research in mathematics education”, Educational studies in Mathematics, 40,1education”, Educational studies in Mathematics, 40,1--24. 24.
23)23)Schau, C. (2000), Personal communication.Schau, C. (2000), Personal communication.24)24) Snee, R. (1999), “Discussion:development and use of statistical thinking : a new era. Snee, R. (1999), “Discussion:development and use of statistical thinking : a new era.
(Response to Wild and Pfannkuch. International Statistical Review, 67,255(Response to Wild and Pfannkuch. International Statistical Review, 67,255--258. 258. 25)25) Wild, C.J., Pfannkuch, M. (1999), “Statistical thinking in empirical enquiry. Wild, C.J., Pfannkuch, M. (1999), “Statistical thinking in empirical enquiry.
International Statistical Review, 67, 221International Statistical Review, 67, 221--248. 248. 2626) Yildiz D. et all (2007). Türkiye’deki Đstatistik Bölümleri Bazında Đstatistik Eğitiminin ) Yildiz D. et all (2007). Türkiye’deki Đstatistik Bölümleri Bazında Đstatistik Eğitiminin
Öğrenci ve Öğretim Üyesi Gözüyle Değerlendirilmesi. TUBĐTAK proje no: Öğrenci ve Öğretim Üyesi Gözüyle Değerlendirilmesi. TUBĐTAK proje no:
105K171105K171..27)27) Zahn, D.A., Davis, N.A. (1996), “Toward creating a learning community in Zahn, D.A., Davis, N.A. (1996), “Toward creating a learning community in largelarge--sections, introductory statistics courses.” Session 186 (poster) at the Joint Statistical sections, introductory statistics courses.” Session 186 (poster) at the Joint Statistical
Meetings, Chicago Meetings, Chicago

17.02.2009
45
•• Danke Danke schön für schön für alles!alles!